1. Introduction
Yttrium oxide is an excellent ceramic material with properties that include chemical stability, high melting point, high thermal stability, low thermal expansion, high thermal conductivity and good transparency to infrared radiation [
1,
2]. Applications of yttrium oxide include chemically stable substrates, crucible materials for melting reactive metals, cutting tools, IR windows, thermal barrier coatings, solid-state laser host material, and catalyst support [
2,
3,
4,
5]. Yttrium oxide is also considered to be one of the most important rare-earth materials for biological applications [
6]. Since yttrium oxide has gained such popularity due to its unique properties, there is great interest in obtaining the oxide with parameters required for specific applications.
Thermal decomposition of a precursor is one of the traditional methods used to synthesize yttrium oxide, and yttrium oxalate decahydrate Y
2(C
2O
4)
3·10H
2O is usually used in this capacity. Many studies have been devoted to yttrium oxalate decahydrate thermal decomposition [
7,
8,
9,
10,
11,
12,
13], which was shown to be a multistage process, and the main reaction stages have been determined. Two main stages of decomposition can be distinguished: dehydration and oxalate thermolysis. According to the results of several studies [
7,
10,
13], dehydration starts at 40 °C. There are contradicting data on dehydration intermediates: the existence of hexahydrate and tetrahydrate was reported in [
7], while only tetrahydrate was observed in [
8]. Trihydrate was mentioned in [
10,
13] and no intermediate hydrates were found in [
9]. Dihydrate stability was reported in the temperature range 180–260 °C [
9] or 200–350 °C [
7,
10,
13], and the powder diffraction pattern of dihydrate was presented in [
14]. Upon further heating, the dihydrate was shown to dehydrate to anhydrous oxalate, which immediately decomposed [
8,
9,
10]. Reference [
7] reported on the formation of monohydrate, which loses its last water molecule simultaneously with decomposition. The authors of [
12,
13] suggested that complete dehydration was not achieved and decomposition proceeds in parallel with the elimination of the last two water molecules. Active decomposition of yttrium oxalate was observed at 390–460 °C [
8,
10,
12], where intermediate oxycarbonates were formed, followed by yttrium oxide.
Disagreement between the studies of the intermediate hydrates is due to the decomposition being studied exclusively in a dynamic mode, which means that the possibility of identifying an intermediate compound and correctly determining its composition depends on the conditions of the experiment, such as the initial composition of the hydrate, the heating rate, the sample weights and the sensitivity of the experimental technique.
In ceramic technology, the morphology of the raw powder is one of the crucial factors in obtaining high-quality ceramics [
15]. It should be noted that there are very few works devoted to the study of morphology evolution during the thermal decomposition of yttrium oxalate. It is worth noting reference [
16], in which the specific surface area of the decomposition products was measured at different stages of the reaction and in different temperature regimes. An anomalous increase in the specific surface area was found during oxalate decomposition at 400 °C; however, the reasons for this behavior were not discussed. The authors showed that the resulting oxide retains the shape of the initial hydrated oxalate crystals, which the authors referred to as “skeleton particles”.
Crystal form retention during the thermal decomposition of precursors is well known. Since the shape of the precursor particles remains unchanged, the macrostructure of the reaction product is called a pseudomorph. Nanometer particles (crystallites) in the pseudomorph are associated with each other and separated by pores to form a porous three-dimensional framework. The formation of a pseudomorph during thermal decomposition reactions was noted as early as the beginning of the last century in classical works devoted to topochemical reactions, and in the last ten years there has been an active growth of publications about this subject. Several scientific groups have formulated approaches to obtain porous oxides with controlled morphology by thermal decomposition of various precursors. In the works of Shi’s group [
17,
18,
19,
20], a template-free strategy to prepare mesoporous metal oxides from metal sulfates or metal oxalates using thermal decomposition has been proposed. In the works of Sidelnikov’s group [
21,
22,
23,
24], factors determining the size of crystallite and the pore structure of various metal oxides obtained by the thermal decomposition of precursors have been identified. The pore volume in the pseudomorph is close to the volume change caused by the thermal decomposition of a precursor, i.e., the pore volume is determined by volume shrinkage. If the reaction occurs through the formation of intermediates (in several stages), then shrinkage occurs stepwise. The microstructure of the pseudomorph can change at each stage of the reaction, and the crystallite size of reaction products is determined by the largest shrinkage at various stages of the reaction. The morphology and microstructure of reaction products have been shown to be affected by the mechanism of structural transformation, crystal habit, decomposition conditions (vapor pressure of the gaseous product, temperature) and phase composition of intermediate reaction products.
In our previous work [
25], a number of experiments were carried out to study the sequence of transformations during the thermal decomposition of yttrium oxalate decahydrate. Based on the results of thermal analysis and in situ X-ray powder diffraction, the following decomposition stages were identified: Y
2(C
2O
4)
3∙10H
2O → Y
2(C
2O
4)
3∙6H
2O → Y
2(C
2O
4)
3∙4H
2O → Y
2(C
2O
4)
3∙2H
2O → (YO)
2CO
3 →Y
2O
3. All intermediates were obtained as individual phases. The results of the study of morphological changes during decomposition were briefly described, and two polymorphs of yttrium oxalate hexahydrate were found. The factor determining the formation of a certain hexahydrate phase was found to be the relative humidity during the dehydration of the decahydrate. The structures of hexahydrates were described on the basis of data on isostructural hydrates of lanthanide oxalates, and a scheme of structural transformation during the formation of hexahydrates was proposed.
The morphology of the oxide has been found to be strongly influenced by the dehydration conditions of the precursor crystal Ce
2(C
2O
4)
3∙10H
2O [
26,
27]. During dehydration of the hydrated oxalate under different conditions, two variants of topotaxial structural transformations are observed. These transformations are characterized by different deformations and, consequently, different types of fracture. It was shown that the dehydration conditions influence the morphology and properties of the final cerium oxide. Importantly, differences in morphology obtained at dehydration further led to differences in the microstructure, relative densities, and conductivities of the ceramic samples of cerium oxide. Taking these data into account, we can say with certainty that the possible variation in the phase composition of intermediates is an important aspect that should be considered when creating materials of the best quality.
The purpose of this work is to examine the evolution of sample morphology at each reaction stage, to identify the stages and factors having the greatest impact on particle size and specific surface area and to obtain nanocrystalline yttrium oxide.
2. Materials and Methods
Crystals of Y2(C2O4)3·10H2O were produced by slow mixing of 1% solutions of yttrium nitrate (reagent grade) and oxalic acid (reagent grade) at 70 °C. A white precipitate formed within the hot solution and was filtered, washed thoroughly with distilled water and then with alcohol and dried at room temperature. Crystals for optical microscopy were grown by recrystallization from yttrium oxalate solution in 0.4 M HCl. The solution was saturated at 70 °C and then cooled and kept either at 40 °C or at room temperature. The precipitated crystals were filtered, washed and dried at room temperature.
The triclinic phase of yttrium oxalate hexahydrate was synthesized by heating the precursor at 40–50 °C in air. Depending on the sample mass and temperature, the duration of the process varied from 10 to 300 min.
The monoclinic phase of yttrium oxalate hexahydrate was synthesized by dehydration of decahydrate in quasi-equilibrium conditions. The precursor was placed into a container with a narrow gap to implement slow removal of water at 85 °C. The initial value of the water vapor pressure in the container was close to the saturated water vapor pressure at 85 °C and gradually decreased as water was removed from the sample. The process lasted 3–7 days depending on the mass of the sample.
To obtain yttrium oxycarbonate (YO)2CO3 the precursor was decomposed at 320, 330, 350, 380, 400, and 420 °C in air.
Yttrium oxide was obtained by decomposition of (YO)2CO3 at 450 °C and decomposition of Y2(C2O4)3·10H2O at 550 °C.
The conversion fraction in all decomposition experiments was controlled by the mass change and the results of powder X-ray diffraction.
The morphology of the initial crystals and reaction products was investigated with a Polam L-213 optical microscope (LOMO, USSR) and a TM-1000 scanning electron microscope (Hitachi, Tokyo, Japan). A Canon EOS 400D (Canon Inc., Tokyo, Japan) camera was used for photography.
Transmission electron microscopy (TEM) investigations were carried out using a JEM 2010 microscope (Jeol, Tokyo, Japan).
The specific surface area of the as-prepared materials was determined from nitrogen adsorption–desorption isotherms collected at −196 °C using a Termosorb TPD 1200 device (Catakon, Novosibirsk, Russia). The specific surface area values were calculated from the adsorption isotherm, applying the Brunauer–Emmett–Teller (BET) equation for the N2 relative pressures 0.1 < p/p0 < 0.3.
Synchronous TG-DSC analysis with mass spectrometry was carried out with an NETZSCH STA-449F1 instrument with heating rates of 3 K/min in an argon–oxygen mixture (80% Ar + 20% O2). Evolved gas analysis was performed with a QMS 403C Aёolos quadrupole mass spectrometer in multi-ion detection mode.
Powder X-ray diffraction patterns (PXRD) were recorded with the D8 Advance diffractometer (Bruker, Bremen, Germany) using CuKα radiation and a Lynx-Eye one-dimensional detector with a nickel filter. In situ diffraction studies under heating in air were carried out in an HTK 1200 N high temperature chamber (where the temperature stability was ±0.1 °C, and the sample holder was a cuvette of Al2O3). Sample heating was carried out from room temperature to 700 °C at a rate of 5°/min with isothermal exposures for the diffractograms. Unit cell parameters and the average size of the crystallites were calculated from the PXRD patterns using the Rietveld method with the software Topas 4.2 (Bruker AXS, Karlsruhe, Germany).
3. Results and Discussion
Study of Y
2(C
2O
4)
3·10H
2O thermal decomposition reveals that the hydrate begins to slowly lose water at 40 °C and atmospheric humidity (15–20 torr H
2O). The first intermediate decomposition product is the hexahydrate. In our previous work [
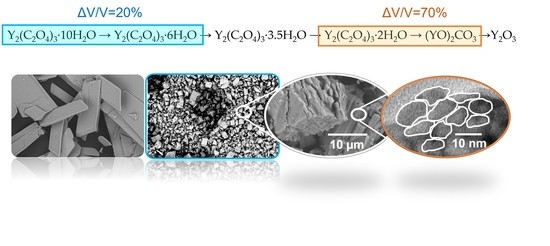
25], two polymorphic modifications of the hexahydrate—triclinic (6T) and monoclinic (6M)—were reported and their structures were briefly described, and it was shown that the formation of the hexahydrate structure depends on humidity. At this stage, the decahydrate crystals fracture into particles of different sizes with a volume shrinkage of ~20% (
Table 1), where the unit cell volumes were calculated from previously obtained data [
25,
28].
Figure 1 shows the characteristic destruction of the decahydrate crystals during the formation of various hexahydrates. The 6T polymorph is predominantly formed by larger blocks and plates with a size of the order of a hundred microns, while when 6M is formed, more isometric particles with a size of tens of microns are obtained. In [
25], the scheme of structural transformation during the formation of the two hexahydrates was presented. According to this scheme, the deformation of the metal–oxalate framework during transformation is different, and consequently different stresses and cracking can be expected, which is shown using optical microscopy (
Figure 2). The 6M powder is also denser than the 6T powder, which may be due to differences in the stacking of the hexahydrate particles. The formation of larger plate-like particles in the case of 6T leads to a relative friability of the powder in comparison with the case of 6M, the particles of which are packed more densely.
The hexahydrates were investigated to understand the influence of the intermediate phase composition on the course of further decomposition using simultaneous thermal analysis with mass-spectrometry and in situ XRD. The experiments were carried out under similar conditions in order to compare the results using these two different methods.
From the thermogravimetry (TG) data (
Figure 3), it can be seen that 6T begins to decompose at 60–70 °C, with the maximum dehydration rate being observed at about 90 °C, in accordance with DSC and mass-spectrometry data (
Figure S1). At this stage, a product is formed corresponding in weight loss to the 3,5-hydrate. With further dehydration, the 3,5-hydrate transforms to the dihydrate, and the maximum dehydration rate is observed at about 150 °C. The dihydrate is stable over a wide temperature range from about 160 °C to 280 °C. The 6M is stable over a wider temperature range than 6T (
Figure 3), and 6M does not lose weight up to about 120–130 °C (where the initial slight decrease in weight and release of water at about 65 °C refers to the dehydration of the remains of the original decahydrate). During the dehydration of 6M, it is not possible to strictly distinguish any intermediate compounds, because above 130 °C the mass gradually decreases, and no clear plateaus are observed. The curves of DSC and the ion current of water show one peak with a maximum at about 170 °C (
Figure S2). A kink at about 190 °C approximately corresponds to the formation of the dihydrate, which continues to slowly lose weight up to 300 °C. The expected weight change values for the formation of the different reaction products are represented in
Figure 3 and
Figure S3 and
Table S1.
The results obtained with the in situ X-ray powder diffraction method are consistent with thermal analysis data. In situ X-ray powder diffraction patterns of 6T heated at different temperatures in air are presented in
Figure 4 and
Figure S4. The triclinic phase (6T) is isostructural with the hexahydrate of the oxalates of scandium and some lanthanides [
31]. Structural data of the phase obtained in this work are presented in
Table 1. The 6T reflections disappear when heating to 80 °C. At the same time, reflections of a new phase appear, which according to the results of thermal analysis (
Figure 3) should correspond to the 3,5-hydrate. The process of 3,5-hydrate formation ends below 100 °C. The diffraction pattern continues to change with increasing temperature, and a new phase is formed near 200 °C. According to the data from thermal analysis (
Figure 3) this phase corresponds to the dihydrate (
Figure 4 and
Figure S4). The similarity of the diffraction patterns of the 3,5-hydrate and dihydrate indicates the similarity of the structures of these phases. The structure of the 3,5-hydrate is unknown, and for the dihydrate, only indexing of the PXRD pattern was performed in [
14]. It should be noted that the powder diffraction pattern of the dihydrate obtained in this work is close to that presented in [
14].
Figure 4 shows that the reflections of the 6M phase, which is present in a small amount in the sample, are preserved up to 100 °C. The 6T is completely converted to the 3,5-hydrate at a lower temperature. This confirms the results from thermal analysis (
Figure 3) that show that 6M is more stable than 6T.
The monoclinic phase (6M) is isostructural with the samarium oxalate hexahydrate [
32]. The structural data of the phase obtained in this work are presented in
Table 1, and in situ PXRD data obtained for 6M heating are shown in
Figure 5 and
Figure S5. The 6M begins to decompose only above 100 °C. At 130 °C, the intensity of the 6M reflections is reduced, and reflections of a new phase appear. Although there is no clarity in the formation of lower hydrates from the 6M TG curve, the diffraction patterns during heating of 6M show reflections of phases identical to the 6T dehydration products, which correspond to 3,5-hydrate and dihydrate phases. The 3,5-hydrate reflections begin to appear at 130 °C, and by 170 °C this process is complete. The dihydrate appears at higher temperatures, and in both cases a dihydrate is observed at 300 °C.
The results of powder diffractometry studies have shown that the products of dehydration of different hexahydrates have similar diffraction patterns, which indicates that the same products are obtained as a result of the reaction. In addition, they also confirmed that 6M has higher thermal stability than 6T. The structure of yttrium oxalate 3,5-hydrate is unknown, but its formation scheme can be hypothesized. The hydrate may be formed by simply removing water molecules from the 6T structure while maintaining (or slightly deforming) the yttrium–oxalate structure. This structure would be close to that of 6T but significantly different from 6M. The hypothetical similarity of the 6T and 3,5-hydrate structures can presumably explain the lower thermal stability of 6T compared to 6M, because in this case the crystal lattice for nucleation and growth overcomes a lower energy barrier. A future article will be devoted to a detailed study of this issue.
Above 300 °C, according to thermogravimetry, mass spectrometry and diffractometry for both hexahydrates, the loss of the last water molecules begins with slow decomposition of oxalate and, at 400 °C, oxalate decomposition proceeds intensively (
Figure 3 and
Figure S1–S3). The diffraction patterns show no diffraction reflections at 400 °C (
Figures S4 and S5), suggesting that an amorphous product, an intermediate oxycarbonate, is formed.
The question of the nature of a thermolysis intermediate was previously discussed. In [
7,
9] no intermediate compounds were found. However, most researchers agree that the thermal decomposition of yttrium oxalate, like most REE oxalates, produces oxycarbonates. In [
8,
10,
12], the existence of an intermediate oxycarbonate was confirmed by IR spectroscopy. The possibility of formation and the composition of the resulting oxycarbonates were studied in most detail in [
12], where it was found that in vacuum oxycarbonate (Y
2CO
3)
2O is stable for a day at 360–420 °C. Keeping oxalate in a CO
2 atmosphere for a day at 390 °C leads to the production of yttrium oxycarbonate with the composition (YCO
3)
2O. In a nitrogen, oxygen or air environment, such a composition can be obtained at 360 °C, while at 390 °C (YO)
2CO
3 is already obtained. Increasing the temperature to 420 °C in CO
2 also leads to (YO)
2CO
3 formation. However, yttrium oxide is formed at this temperature in an atmosphere of nitrogen, oxygen or air.
By 440 °C, the rate of weight loss decreases. As the temperature increases, the TG curve becomes flatter, and no plateaus or kinks are observed (
Figures S1–S3). Weight loss following oxalate thermolysis is associated with the decomposition of oxycarbonate and carbon burnout. At 500 °C, the diffraction pattern shows no signs of any crystalline phase, and at 600 °C reflections of yttrium oxide appear (
Figures S4 and S5).
Qualitative differences in the decomposition of oxalates formed from different hexahydrates have been observed. In the case of oxalate formed by the dehydration of 6T, the decomposition reaction occurs with the release of heat (exothermic effect) (
Figure S1). This is because the carbon monoxide released during the reaction is able to oxidize to carbon dioxide in the presence of oxygen, and the heat released during oxidation covers the heat spent on the decomposition of oxalate. In the case of oxalate formed by dehydration of 6M, heat is absorbed (endothermic effect) (
Figure S2). Judging by the rate of mass loss, decomposition proceeds at very similar rates in both cases. This apparently means that, in the case of oxalate obtained from 6M, the released CO interacts with oxygen to a lesser extent than in the case of the decomposition of oxalate obtained from 6T. This effect can be explained by the different bulk densities of the powders. With the active release of gaseous decomposition products, there are difficulties in oxygen penetration to the reaction zone. Since the CO oxidation reaction not only requires the presence of oxygen, but the oxidation rate also depends on the oxygen concentration, it would be logical to assume that the sign and magnitude of the thermal effect depend on the rate of oxygen penetration into the decomposing substance. Since the powder obtained from 6T is more friable, oxygen more easily penetrates into the substance than in the case of more densely packed particles obtained from 6M. It follows that, in these two cases, the ratio of the amount of CO and CO
2 in the evolved gas mixture should differ. In the case of oxalate obtained from 6T, the fraction of CO
2 should be greater than in the case of oxalate obtained from 6M. This has been qualitatively confirmed by mass spectrometric analysis (
Figures S1 and S2). Interestingly, the influence of the mechanism of structural transformation during the dehydration of the precursor is observed even at the stage of oxalate decomposition, although before this stage the substance has undergone transformation sequences during the formation of intermediates.
At the stage of oxalate thermolysis with the formation of yttrium oxycarbonate, maximum destruction and increase in the specific surface area have been found to occur. This is consistent with the data obtained in [
16]. The specific surface area of the dihydrate (last stable compound before oxalate thermolysis) is 3–5 m
2/g. The specific surface area increases to 60–90 m
2/g during the oxycarbonate formation. This is due to the maximum volume shrinkage during the reaction, which is ~70% (
Table 1). Although structures of the pre-thermolysis intermediate and the oxycarbonate intermediate are unknown, volume shrinkage has been estimated from the structures of the dihydrate [
14] and oxycarbonate (YO)
2CO
3 [
31]. Despite the large shrinkage, no change in morphology is observed (
Figure 6). Fine particles of oxycarbonate are packed into agglomerates (
Figure S6), which retain the shape and size from the hexahydrate stage. Thus, during the oxalate thermolysis, the pseudomorph is obtained. The change in volume during thermolysis is realized in the appearance of pores inside the pseudomorph.
During the initial stages of this work, oxycarbonate samples were obtained at temperatures of 380–420 °C. At such temperatures, on the one hand, the reaction proceeds relatively quickly (the duration of the synthesis was less than a day at 420 °C), and on the other hand, intensive sintering is not expected. According to [
12], oxycarbonate (YO)
2CO
3 is formed under these conditions. In our experiments, the weight loss corresponded to the production of a compound of this composition. The samples obtained at 380–420 °C always had a dark color (gray, brown, black). The color can be explained by the presence of carbon. In this temperature range, CO is thermodynamically unstable and is able to disproportionately form CO
2 and carbon. Some researchers have suggested the formation of carbon-oxygen polymers of the composition C
4O
3, C
8O
3, C
12O
9 [
13], which can be obtained as a result of reactions of carbon–oxygen radicals formed during the oxalate decomposition. Other authors [
12] suggested the formation of C
nO
n−m polycarbonates, which can be obtained by the interaction of the resulting carbon with carbonates. The formation of carbon and/or carbon–oxygen compounds during the reaction was confirmed visually (the samples were black, gray or brown) [
12,
33,
34] and by exothermic peaks on the DSC curves corresponding to burnout in the presence of oxygen, mainly in the range of 500–650 °C [
8,
10,
35].
The values of the specific surface area of the samples obtained at temperatures of 380–420 °C had a wide range from 5 to 50 m2/g. It was assumed that the resulting carbon either occupies a large part of the internal volume of the pseudomorph or plugs the pores of the pseudomorph, which reduces the measured specific surface area. To reduce the formation of carbon, it is necessary to reduce the partial pressure of CO in the reaction zone (in the pores of the pseudomorph). To achieve this, the synthesis was carried out at a low temperature in a stream of air or pure oxygen. Lowering the temperature should lead to a decrease in the rate of thermolysis and, consequently, the rate of CO evolution, while airflow increases the oxygen concentration, which leads to the intensification of CO combustion. During the experiments, thermolysis has been found to proceed at 320–330 °C at acceptable rates (oxycarbonate (YO)2CO3 is obtained in about a week). Under these conditions a light beige sample was obtained. The resulting sample has the maximum specific surface area of 60–90 m2/g. At lower temperatures, thermolysis is extremely slow. Thus, to obtain yttrium oxycarbonate with a maximum specific surface, it is necessary to conduct thermal decomposition of yttrium oxalate at 320–330 °C in an air or oxygen flow.
The further conversion of oxycarbonate to yttrium oxide was carried out at 450 °C within 24 h (62–63% experimental weight loss (from decahydrate), 63.7% calculated weight loss). The measurements showed that, at this stage of the reaction, there is no increase in the specific surface area of the sample, and even a slight decrease to 50–60 m
2/g is observed. This can be explained by both an increase in oxide density compared to the density of oxycarbonate and a slight sintering of the particles. Thus, the transformation of oxycarbonate to yttrium oxide does not lead to the destruction of particles. Apparently, this is because the shrinkage during the formation of oxide is about 23%, which is much less than the shrinkage during the formation of oxycarbonate, which was about 70%. Volume shrinkage determines the excess energy that leads to the destruction and decrease in particle size [
21,
22,
26]. Destruction can only occur if the volume shrinkage in the current stage of the reaction is greater than in the previous stages. The oxide particle size calculated from the specific surface data, assuming isometric particles, is 20 nm. It should be noted that the values of the specific surface areas of yttrium oxide obtained from 6M and 6T have similar values (60 m
2/g for the oxide from 6T and 50 m
2/g for the oxide from 6M). Samples of yttrium oxide obtained from 6M and 6T have different bulk density, in which identical weights of oxide had volumes differing by about 1.5 times.
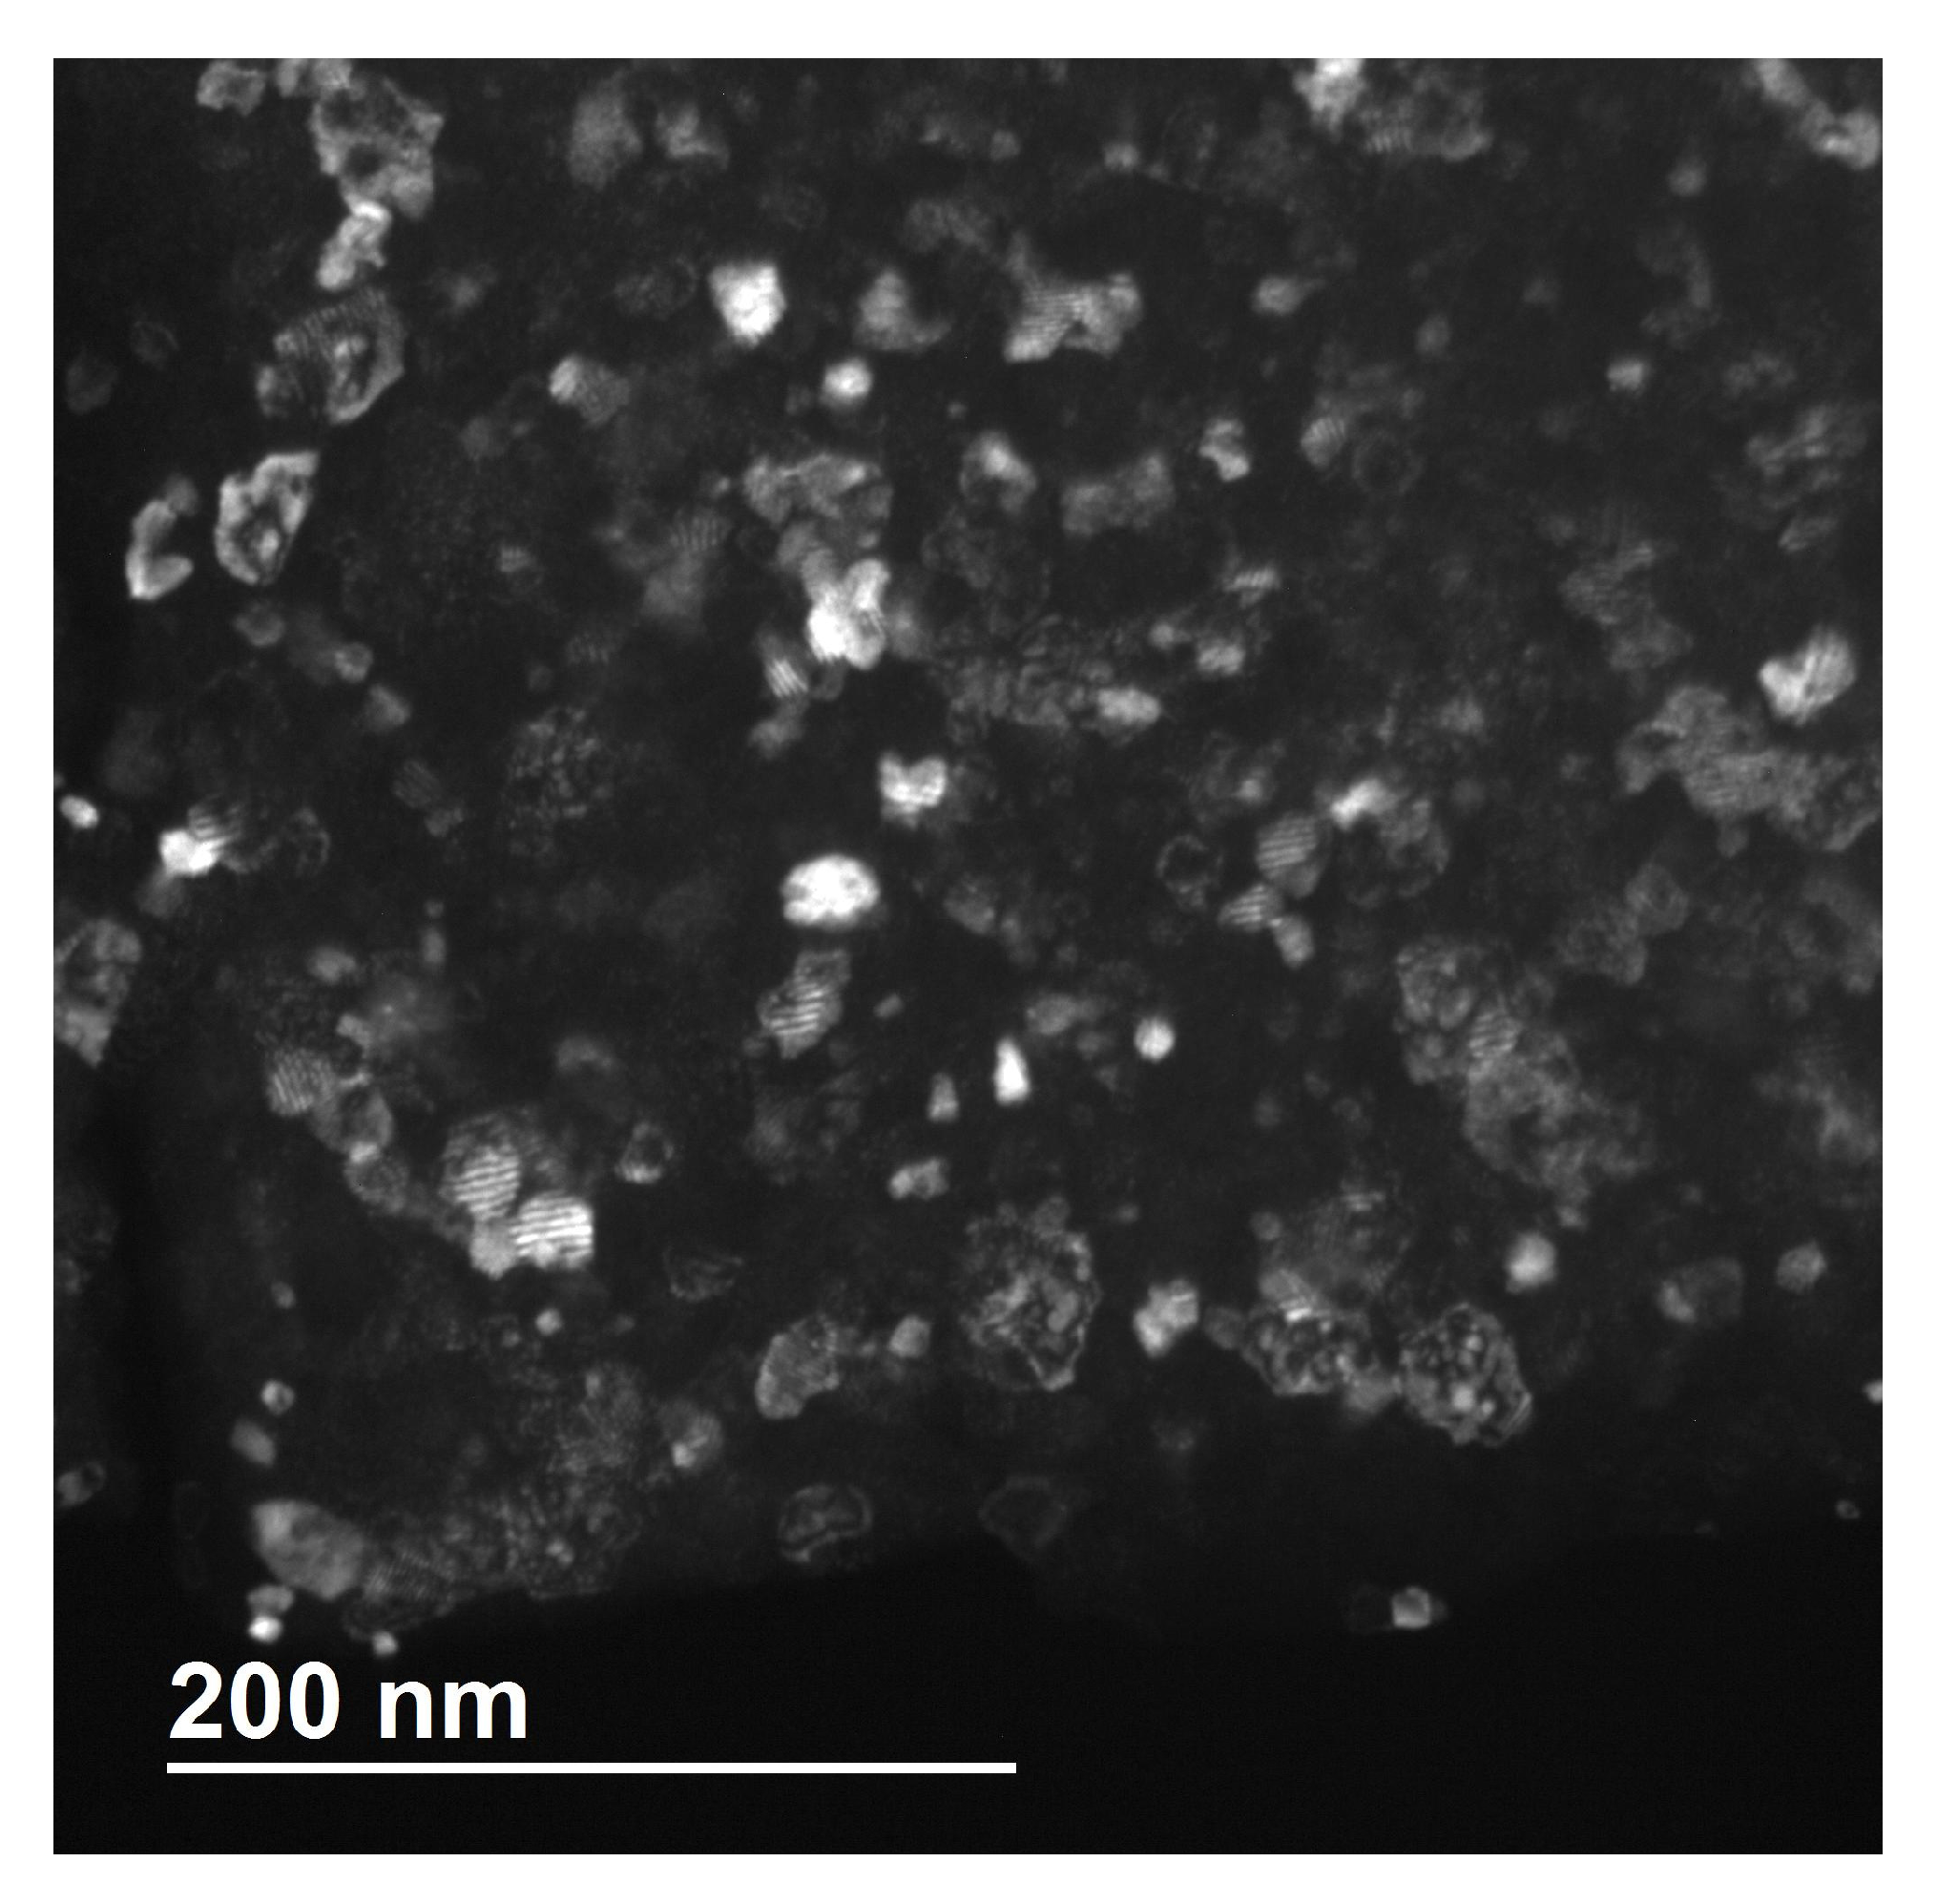
The samples of yttrium oxide with the largest specific surface area (60 m
2/g) have been studied using TEM and XRD methods. A TEM image is shown in
Figure 7 and shows that the resulting oxide particles are agglomerates consisting of smaller particles about 10–20 nm in size and are permeated with pores about 5 nm in size. The average size of the crystallites of yttrium oxide calculated from the peak broadening was 12–13 nm (
Figure S7). Particle sizes of the obtained oxide estimated on the basis of the three methods match well.
At the stage of oxide formation, the sample does not undergo morphological changes. It can be said that the final decomposition product—yttrium oxide—is a pseudomorph of particles that were formed at the very first stage of thermal decomposition—the formation of hexahydrate from decahydrate. The difference in morphology from the formation of different phases of the hexahydrate is retained at this stage of the reaction. Yttrium oxide powders obtained from the monoclinic and triclinic hexahydrate phases have the same specific surface area, but different morphology and bulk density. This observation is interesting in that, while maintaining the size of the pseudomorph, the pores inside it grow step by step in accordance with solid-state transformations, which makes it possible to create oxide nanoparticles assembled into agglomerates, but separated by a hierarchical system of pores. Obviously, with the possibility of such distant inheritance, control of product morphology at all stages of any solid-state reaction is of great importance to the properties of the reaction product.
The evolution of the morphology and microstructure of yttrium oxide is explained from the analysis of volume shrinkage at various stages of the reaction (
Table 1). The formation of two phases of hexahydrates at the first stage of dehydration is accompanied by different destruction and stacking of particles. The volume shrinkage is about 20% at this stage of the reaction. The formation of the 3,5-hydrate and dihydrate does not lead to a change in morphology, since the total shrinkage after these two stages does not exceed 17%. The formation of oxycarbonate is accompanied by the largest shrinkage during the reaction of about 70%. At this stage, there is a significant increase in the specific surface area. Fine particles of oxycarbonate are packed into agglomerates, which retain the shape and size from the hexahydrate stage. Thus, during oxalate thermolysis the pseudomorph is obtained. The difference in morphology from the formation of different phases of the hexahydrate is retained at this stage of the reaction. The change in volume during thermolysis is realized in the appearance of pores inside the pseudomorph. The morphology and microstructure of the particles during the transformation of oxycarbonate into yttrium oxide change insignificantly. This is because volume shrinkage at this stage of the reaction is about 23%, which is much less than during the formation of oxycarbonate.
In addition, the yttrium oxide pseudomorph has been found to have a very interesting optical property—birefringence (
Figure S8). This is surprising, because yttrium oxide has a cubic lattice (Ia-3), but at the same time interacts with light as an anisotropic medium. The particle shown in
Figure S8 consists of a large amount of yttrium oxide nanoparticles. The reason for the anisotropy of the optical properties is assumed to be the anisotropy of the oxide nanoparticle shape and preferred orientation. In the pseudomorph, an ordered system of oxide nanoparticles and pores is formed and the pore morphology is also a reaction product, the parameters of which can be controlled.
The changes in the specific surface area of yttrium oxide upon annealing have been investigated. First, oxycarbonate was synthesized at 320 °C with a specific surface area of 60 m2/g. Yttrium oxide obtained from this oxycarbonate at 450 °C for 24 h had a specific surface area of 40 m2/g. Annealing of the oxide was performed at 550 °C and 650 °C for one hour. Annealing at 650 °C predictably reduced the specific surface area of oxide to 20 m2/g. However, annealing at 550 °C increased the specific surface area of the sample to 48 m2/g. Such an unexpected increase in the specific surface area can be explained by a low sintering rate and the burnout of carbon residues, which were present in the initial oxide obtained at 450 °C. The experimental weight loss after annealing at 550 °C is 63.5–63.6%, a slight discrepancy from the expected value (63.7%) caused by the inevitable adsorption of gases and the reaction of nanocrystalline oxide with atmospheric H2O and CO2. Since oxide sintering proceeds relatively slowly at 550 °C and carbon burns out actively, it was assumed that under these conditions it is possible to quickly obtain yttrium oxide in one stage with a specific surface area no worse than in two-stage production with an intermediate oxycarbonate. In this experiment, the yttrium oxalate decahydrate was decomposed at 550 °C for an hour. This assumption was confirmed: the obtained oxide indeed had a high specific surface area equal to 65 m2/g. This shows it is convenient to obtain yttrium oxide with the maximum specific surface area in one step by decomposing yttrium oxalate at 550 °C, avoiding the lengthier procedure for obtaining an intermediate oxycarbonate.


