1. Introduction
Ceramic materials based on calcium phosphates are widely used for bone implant production [
1,
2], since their chemical composition is identical to the inorganic component of bone tissue, hydroxyapatite (HA, Ca
10(PO
4)
6(OH)
2). Synthetic powders with desired properties including phase composition and particle size distribution are demanded for the fabrication of high-quality ceramics [
3]. Precipitation of calcium phosphates powder from aqueous solution is the most popular and convenient synthetic approach to the nanosized particles [
4]. The phase composition, morphology, and particle size distribution of the so prepared synthetic calcium phosphates strongly depend on a set of interrelated parameters such as pH, temperature, Ca/P ratio, and the components concentration in the reaction zone [
5,
6,
7,
8]. The choice of the pair of precursors (water-soluble substances containing Ca
2+ and HPO
42− ions, respectively) is an additional factor governing the phase composition and quality of calcium phosphates powders and the ceramics based on them [
9]. The most popular pairs of precursors for the synthesis of calcium phosphates powders for ceramics production include Ca(OH)
2/H
3PO
4 [
10,
11] and Ca(NO
3)
2/(NH
4)
2HPO
4 [
8,
12,
13]. Besides the target calcium phosphate compounds (i.e., hydroxyapatite or brushite), the interaction of these precursors yields certain by-products (NH
4NO
3 or H
2O) which can be removed from the powder compact or semi-finished item via heat treatment at relatively low temperature and therefore do not affect the sintering process occurring at temperatures above 500 °C [
7].
There are other pairs of precursors exhibiting the same feature, formation of the by-products that can be completely removed from the calcium phosphates powder via the heat treatment prior to sintering. Obviously, the HPO
42− ions can be provided by phosphoric acid or by ammonium hydrophosphates. A variety of calcium compounds, such as CaCO
3 [
14], Ca(OH)
2 [
10,
11], CaCl
2 [
15,
16], Ca(NO
3)
2 [
7,
8,
13,
16,
17], and the carboxylic acids salts (calcium formate [
18], calcium acetate [
16,
19,
20], calcium propionate [
21,
22,
23], calcium lactate [
24,
25], or calcium saccharates [
26,
27]) can be used as the source of Ca
2+ ions. Most of the listed carboxylic acids or their salts are used as pH regulators in the food industry [
28]; furthermore, these carboxylates, ammonium, and (hydro)phosphate ions are known as components of aqueous buffer solutions [
29]. This fact can be exploited in the development of novel convenient methods of obtaining the powders for calcium phosphate ceramics production. It should be noted that calcium acetate is the most used calcium carboxylate for calcium phosphate synthesis as the source of Ca
2+ ions. According to Equations (1) and (2), the interaction of Ca(CH
3COO)
2 and (NH
4)
2HPO
4 during calcium phosphates synthesis affords acetic acid and/or ammonium acetate as the reaction by-products:
It is worth mentioning that the phase composition of the ceramics based on the calcium phosphate powders (prepared in turn via the interaction of calcium acetate and ammonium hydrophosphate in an aqueous solution without pH adjusting) is affected by the precursors concentrations and ratio used in the calcium phosphate synthesis [
16,
19]. In detail, calcium phosphates powders synthesized from 0.5 M Ca(CH
3COO)
2 and 0.5 M (NH
4)
2HPO
4 aqueous solutions (at Ca/P = 1) [
16] and from 2.0 M Ca(CH
3COO)
2 and 1.33 M (NH
4)
2HPO
4 (at Ca/P = 1.5) [
19] contained low-crystalline hydroxyapatite and amorphous phases. However, phase composition of the ceramic materials after firing at 1100 °C was different: Ca
2P
2O
7 + Ca
3(PO
4)
2 in the former case [
16] and Ca
3(PO
4)
2 + Ca
10(PO
4)
6(OH)
2 in the latter case [
19]. These examples show that phase composition of the as-synthesized and fired calcium phosphates depends on the precursors concentrations in the reaction mixture. However, to the best of our knowledge, this effect has not been systematically considered so far.
In order to fill in the gap, we investigated the interaction between calcium acetate and ammonium hydrophosphate (aqueous solution, Ca/P = 1.5, no pH adjusting), the calcium acetate concentration varying between 0.125 and 2.0 M, with the focus on the phase composition of the formed calcium phosphates powders and the derived sintered ceramic. The obtained knowledge is a strong basis for the development of a convenient yet versatile procedure to prepare a powdered precursor of calcium phosphate ceramics with desirable phase composition.
3. Results and Discussion
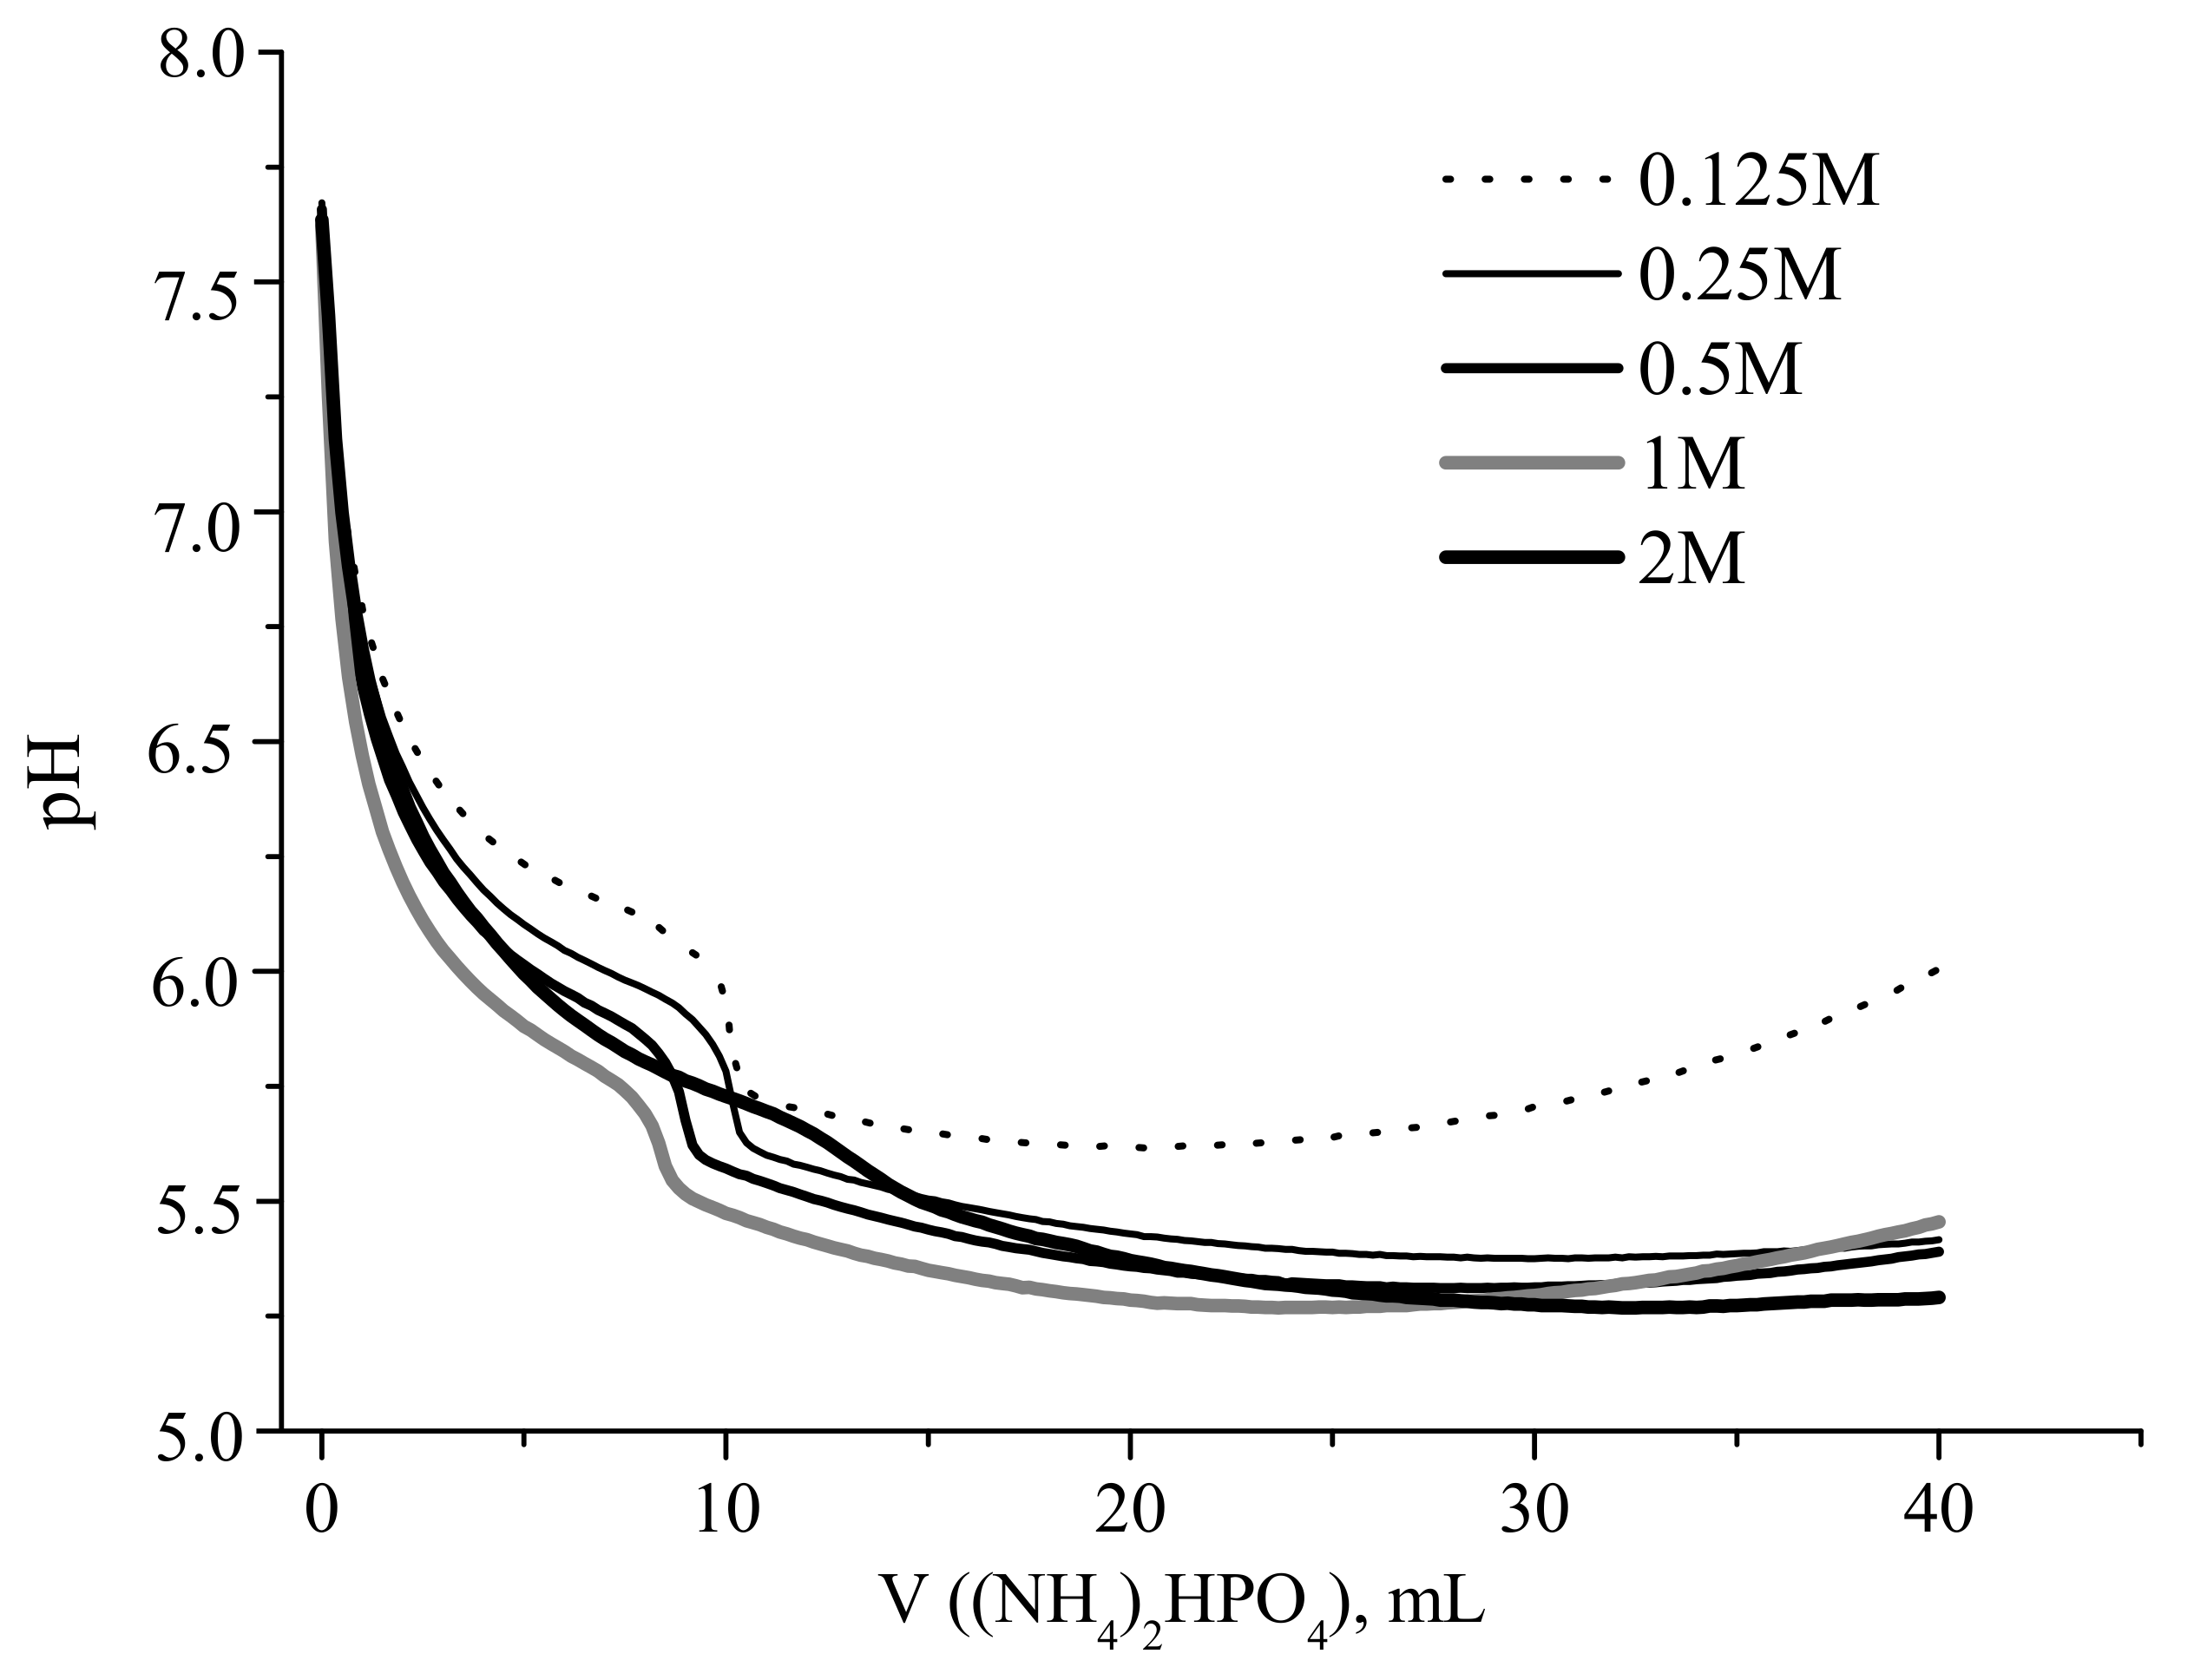
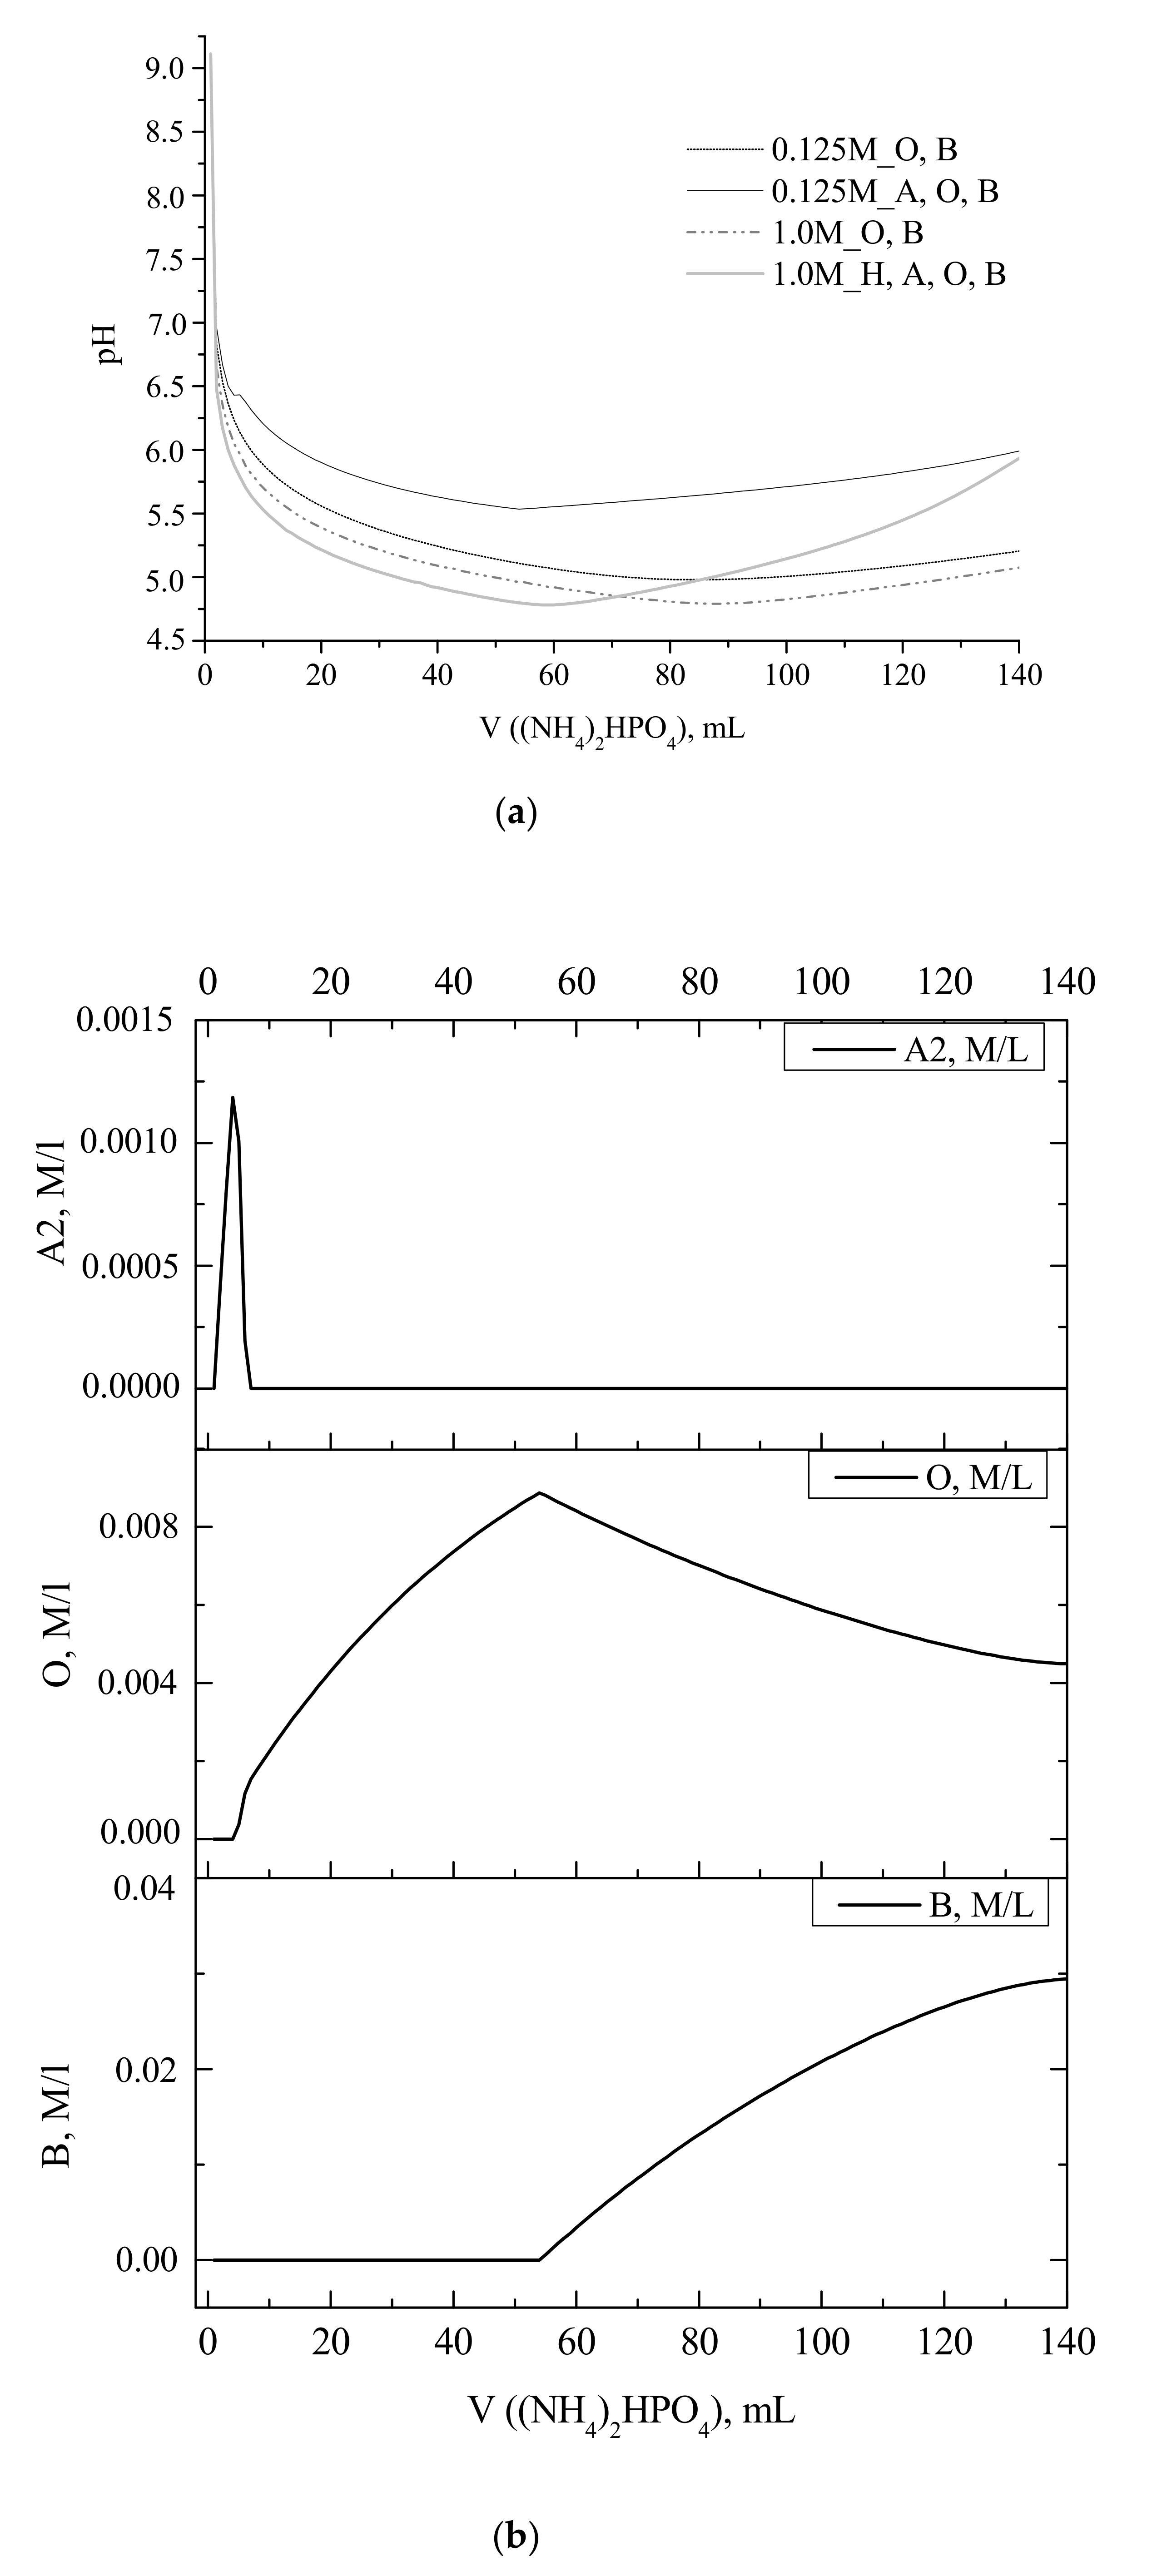
Experimental and calculated curves showing the change in the reaction zone pH during portionwise addition of a solution of (NH
4)
2HPO
4 to that of Ca(CH
3COO)
2 are presented in
Figure 1 and
Figure 2, respectively.
Both dependences were strongly nonlinear, revealing a sharp decrease in the pH after the addition of the first portions of the ammonium hydrophosphate solution. For example, the addition of 2 mL of ammonium hydrophosphate solution resulted in the decrease in pH from 7.6 to about 6.15, and 6.5 for starting calcium acetate concentrations of 1 and 0.125 mol/L, respectively (
Figure 1). The obtained calculated curves showed the pH drop from 9.1 to 6.8 at the corresponding point (
Figure 2). The sharp decrease in the pH level in the beginning of the synthesis can be explained by the formation of amorphous calcium phosphate Ca
3(PO
4)
2 (type I, ACP1 [
32,
33]) or hydroxyapatite Ca
10(PO
4)
6(OH)
2 which have a positive or zero saturation index according to the calculation.
It should be noted that the experimental pH curves obtained for the solutions with Ca(CH
3COO)
2 concentration of 0.125 to 1.0 M were similar in the presence of the sharp second pH drop. In particular, the addition of 6–11 mL of (NH
4)
2HPO
4 solution resulted in the pH decrease from 5.79 to 5.44 (1 M calcium acetate), from 5.92 to 5.56 (0.5 M), from 5.98 to 5.6 (0.25 M), and from 6.14 to 5.69 (0.125 M). The pH curve for 2 M Ca(CH
3COO)
2 solution was much smoother, exhibiting gradual decrease in the pH between the starting and the final (40 mL) points, with an inflection around 12.5 mL of the added (NH
4)
2HPO
4 solution. After addition of half of the stoichiometric (according to Equation (2)) amount of the (NH
4)
2HPO
4 solution (20 mL), the experimental curves (except for that for 2 M calcium acetate solution) showed a slight increase in the pH (
Figure 1). The calculated saturation index for brushite CaHPO
4·2H
2O (B) became positive after the addition of about half of the stoichiometric amount of (NH
4)
2HPO
4 solution (50 mL,
Figure 2). The measured pH in the reaction zone ranged between 6.4 and 5.3 for the studies experimental cases.
From the set of the calculated pH profiles, only that for 0.125 M Ca(CH
3COO)
2 solution with amorphous calcium phosphates Ca
3(PO
4)
2 (A), octacalcium phosphate Ca
8H
2(PO
4)
6·5H
2O (O), and brushite CaHPO
4·2H
2O (B) as the allowed crystal phases showed the second pH drop similar to those for the experimental curves recorded at calcium acetate concentrations of 0.125 to 1.0 M. That drop could be assigned to the change in the saturation index for octacalcium phosphate Ca
8H
2(PO
4)
6·5H
2O (O) from negative to positive, corresponding to the maximum in the curve of the ACP2 content. A similar drop in the experimental pH curve has been earlier observed during the interaction between 7.5 mM K
2HPO
4 and 10 mM CaCl
2 aqueous solutions [
32]. The obtained data have been ascribed to the competition of two reactions: The formation of ACP2 causing the release of H
+ into the solution and dissolution of ACPI accompanied by the consumption of H
+ ions. A similar experimental pH curve has been earlier observed during the interaction between of solutions of sodium phosphate ([NaOH]/[H
3P0
4] molar ratio approx. 1.75, pH 7.4) and calcium chloride CaCl
2 aqueous solutions [
34].
As mentioned above, the experimental pH curves obtained at calcium acetate starting concentrations of 0.125–1 M demonstrated the increase in the pH value after addition of about half of stoichiometric amount of (NH
4)
2HPO
4 (
Figure 1). That fact was attributed to the increase in the concentration of brushite crystalline phase, as confirmed by the calculated profiles of pH and concentration of crystalline phases (
Figure 2). In contrast, the experimental pH curve obtained for 2 M aqueous solution of Ca(CH
3COO)
2 did not exhibit any pH increase. Hence, we concluded that the formation of brushite was suppressed in the latter case, obviously due to the buffering action of CH
3COONH
4 formed in fairly high concentration.
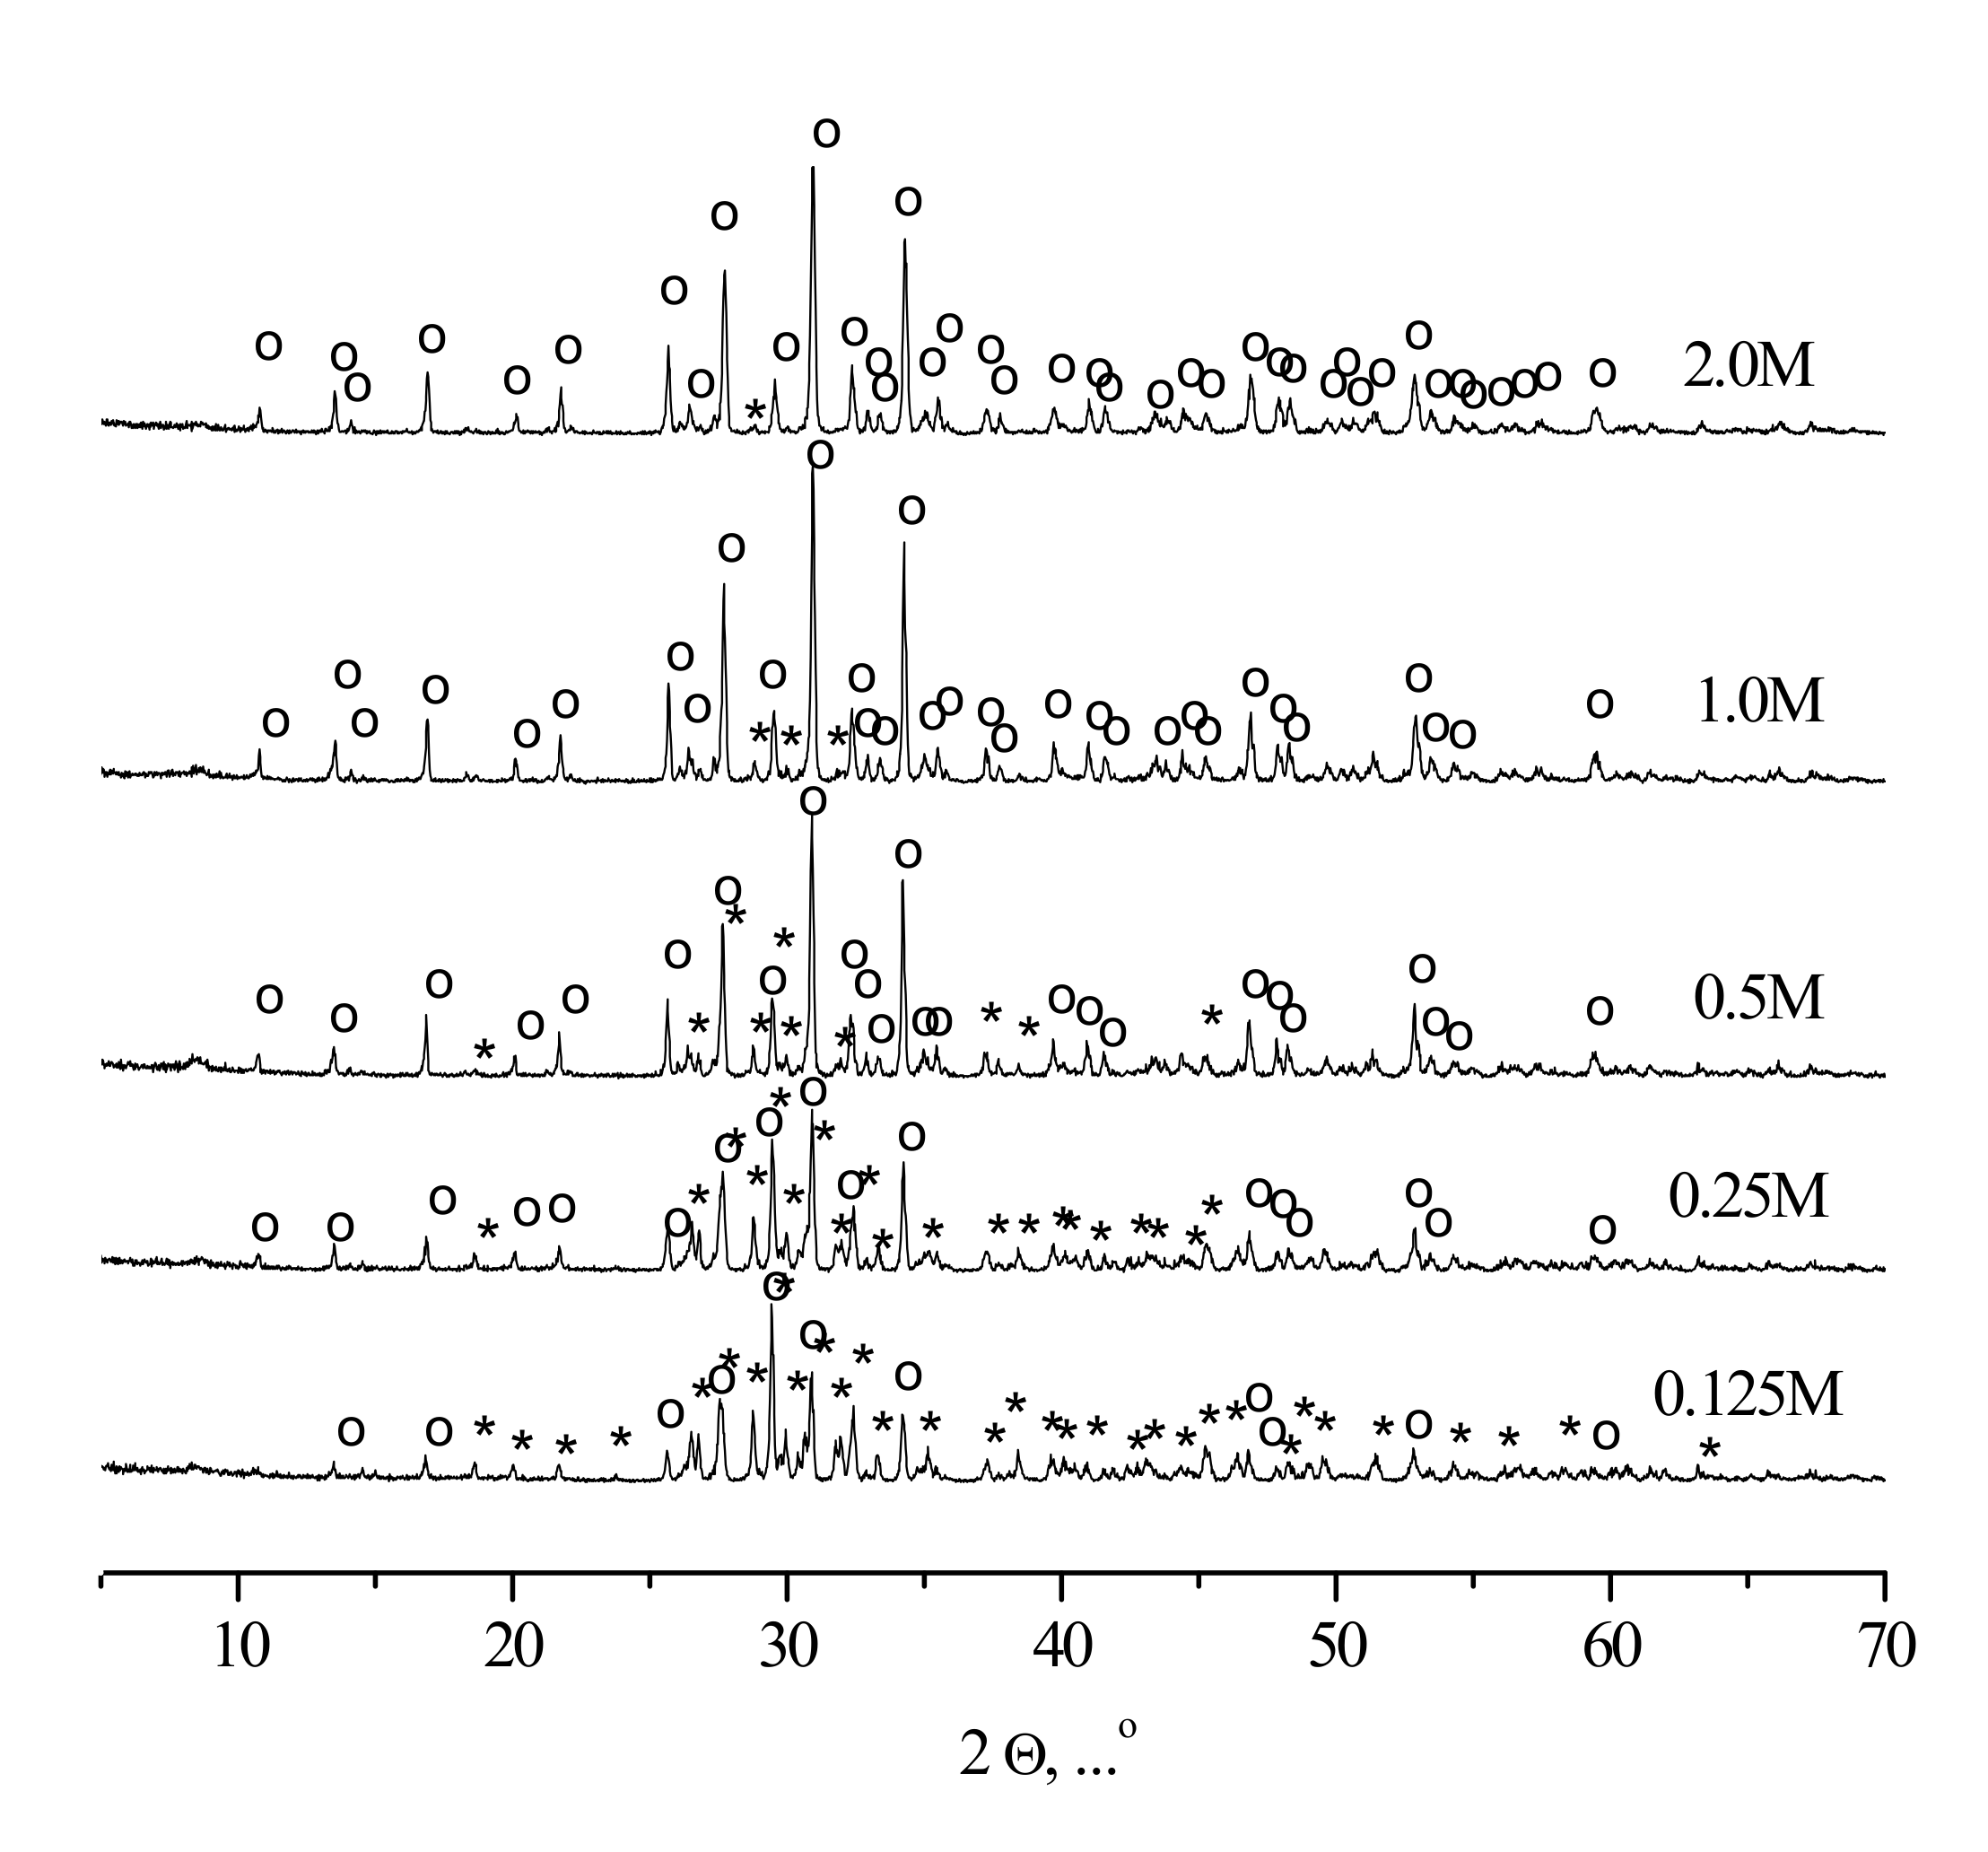
According to XRD data (
Figure 3), the powder synthesized from most concentrated (2 M) aqueous solution of Ca(CH
3COO)
2 consisted of low-crystalline calcium phosphate with XRD reflexes which could be attributed to hydroxyapatite Ca
10(PO
4)
6(OH)
2 (PDF card # 9-432). The powder synthesized from the most dilute (0.125 M) aqueous solution of Ca(CH
3COO)
2 consisted majorly of brushite CaHPO
4·2H
2O (PDF card # 9-77). The “0.25 M”, “0.5 M”, and “1.0 M” powders contained both brushite CaHPO
4·2H
2O (PDF card # 9-77) and hydroxyapatite Ca
10(PO
4)
6(OH)
2, (PDF card # 9-432). It should be noted that the lower concentration of calcium acetate in the aqueous solution (and, hence, that of ammonium hydrophosphate) used for the synthesis resulted in less apparent signals of hydroxyapatite in the XRD patterns. Overall, the XRD data coincided with the data of pH measurements.
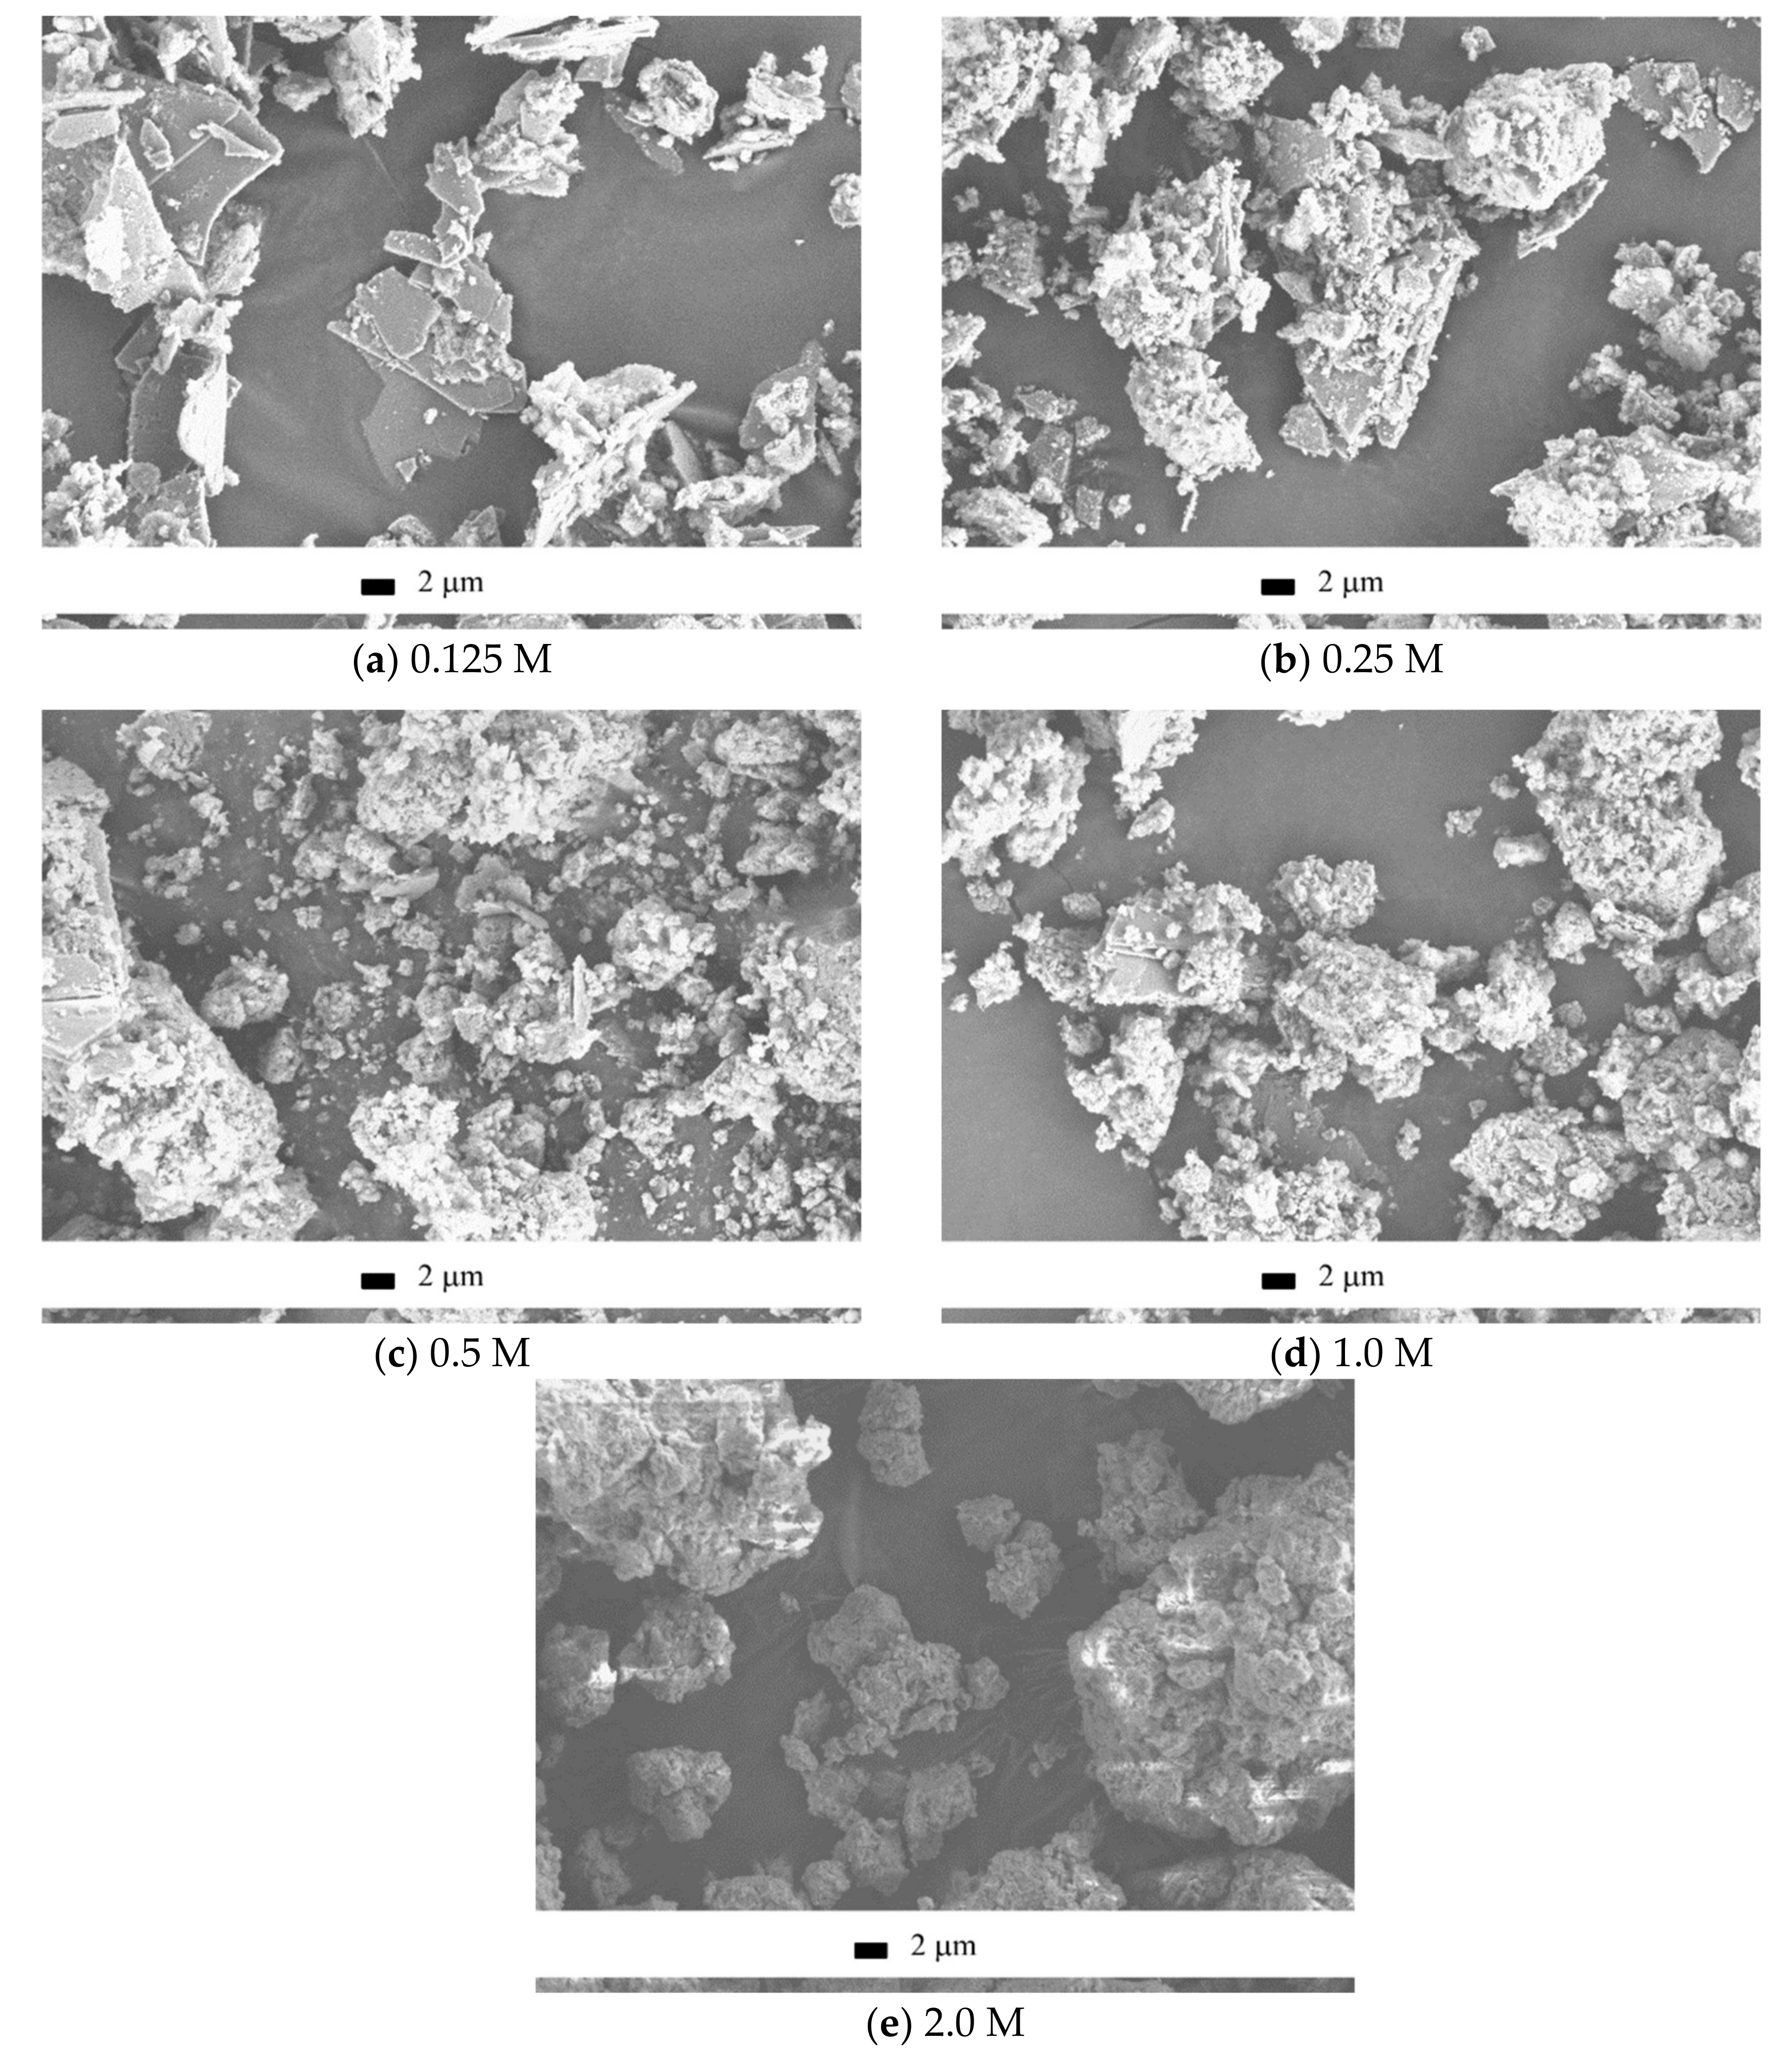
SEM images of the synthesized powders are collected in
Figure 4. It can be seen that the observed particles morphology was in agreement with the XRD data. In detail, when more dilute solutions were used for the synthesis, the brushite signals in the XRD pattern were more apparent (
Figure 3) and more plate-shaped particles were observed in the microscopy images (
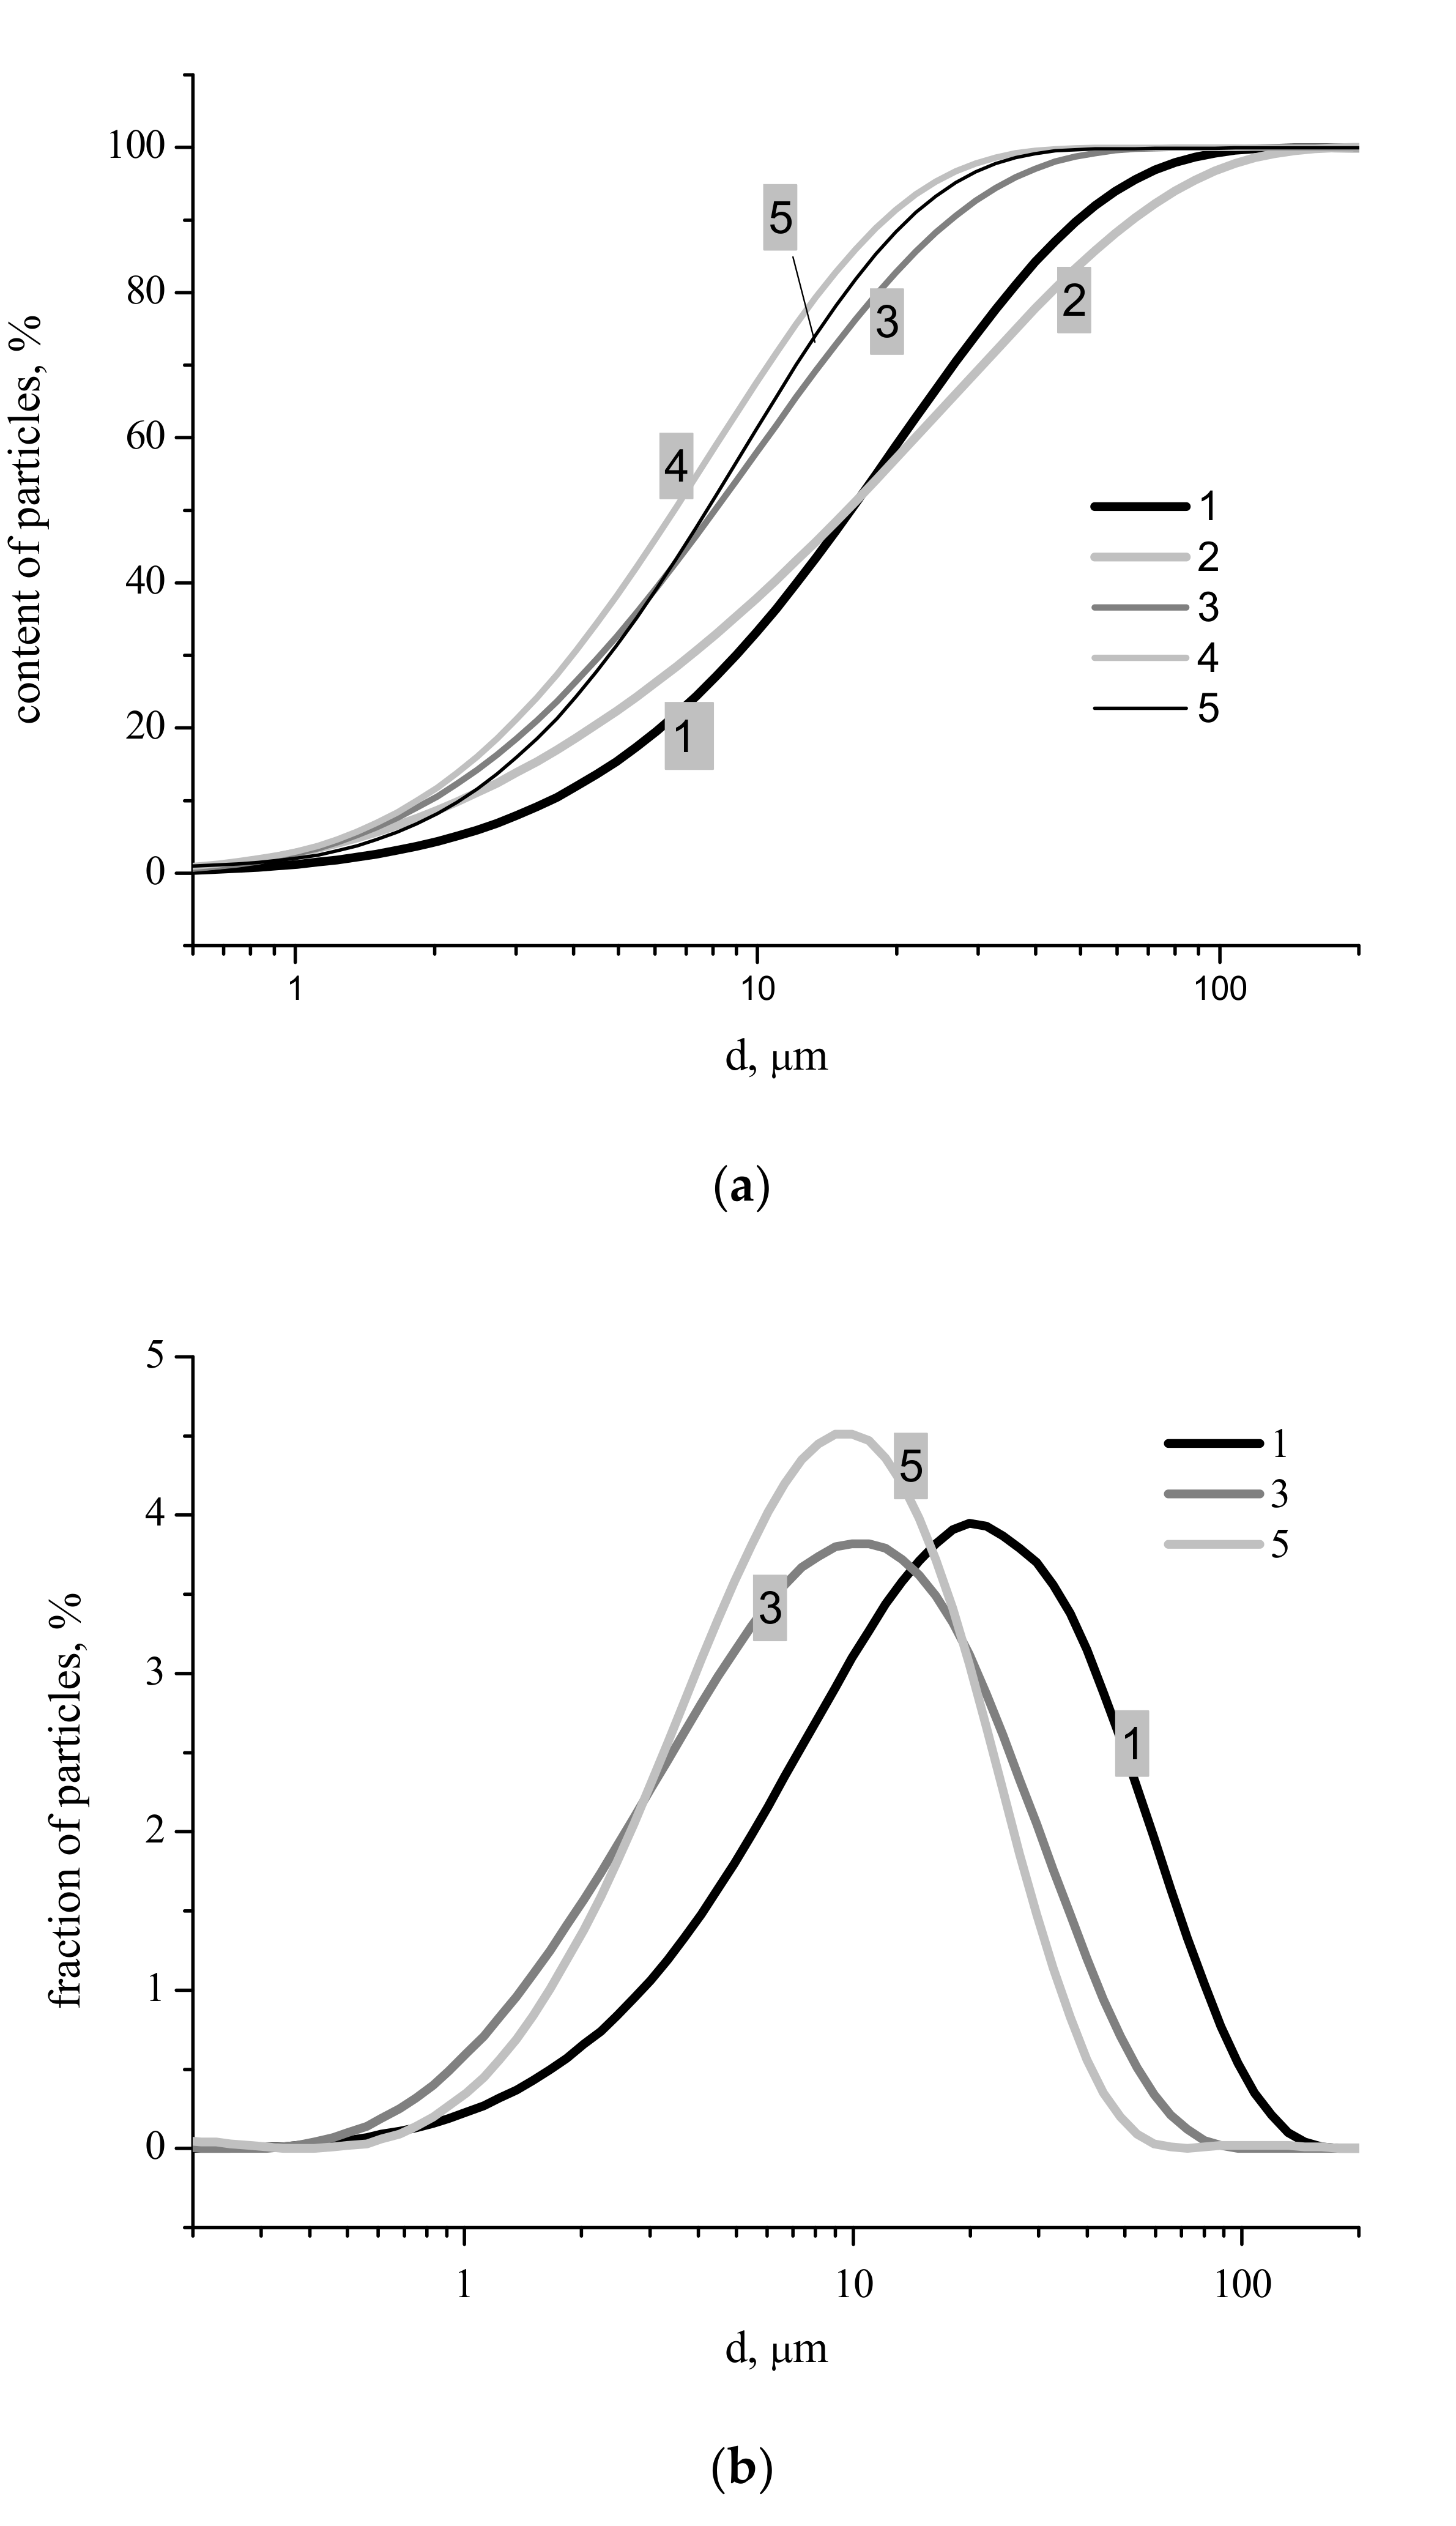
Figure 4). Particle size distributions for synthesized powders after disaggregation are presented in
Figure 5. The integral carvers (
Figure 5a) form two groups of lines: One group for more concentrated starting solutions of Ca(CH
3COO)
2 with concentrations of 1 and 2 M, and another for more dilute starting solutions of Ca(CH
3COO)
2 with concentrations of 0.5, 0.25 and 0.125 M. Particle size distributions obviously connected with the difference in morphology of particles with different phase composition of synthesized powders (
Figure 3) and with the quantity of synthesis by-product, which can be estimated from thermal analysis data (
Figure 6). Sizes of particle aggregates (
Figure 5b), as one can see at differential carvers, are in the interval of 0.5–175 μm for powder synthesized from 2.0 M solution of Ca(CH
3COO)
2, 0.4–100 μm for powder synthesized from 0.5 M solution of Ca(CH
3COO)
2, 0.5–70 μm for powder synthesized from 0.125 M solution of Ca(CH
3COO)
2. Larger aggregates are in powders synthesized from more concentrated starting solutions with higher content of calcium deficient hydroxyapatite and with higher content of reaction by-products including ammonium acetate CH
3COONH
4 and acetic acid CH
3COOH. The opportunity to form slight amounts of imine resin exists during disaggregation of synthesized powders in acetone in presence of NH
4+ [
35]. In addition, we guess that imine resin can bind the individual particles of calcium phosphates together to form bigger aggregates. The bonding effect of imine resin is more apparent for powders synthesized from more concentrated solutions. In spite of the smaller dimensions of individual particles of calcium deficient hydroxyapatite Ca
9(HPO
4)(PO
4)
5(OH) than dimensions of individual particles of CaHPO
4·2H
2O (
Figure 4), the most probable size of the aggregates for powder synthesized from 2.0 M (21 μm) solution of Ca(CH
3COO)
2 is higher than for powder synthesized from 0.125 M (10 μm) solution of Ca(CH
3COO)
2.
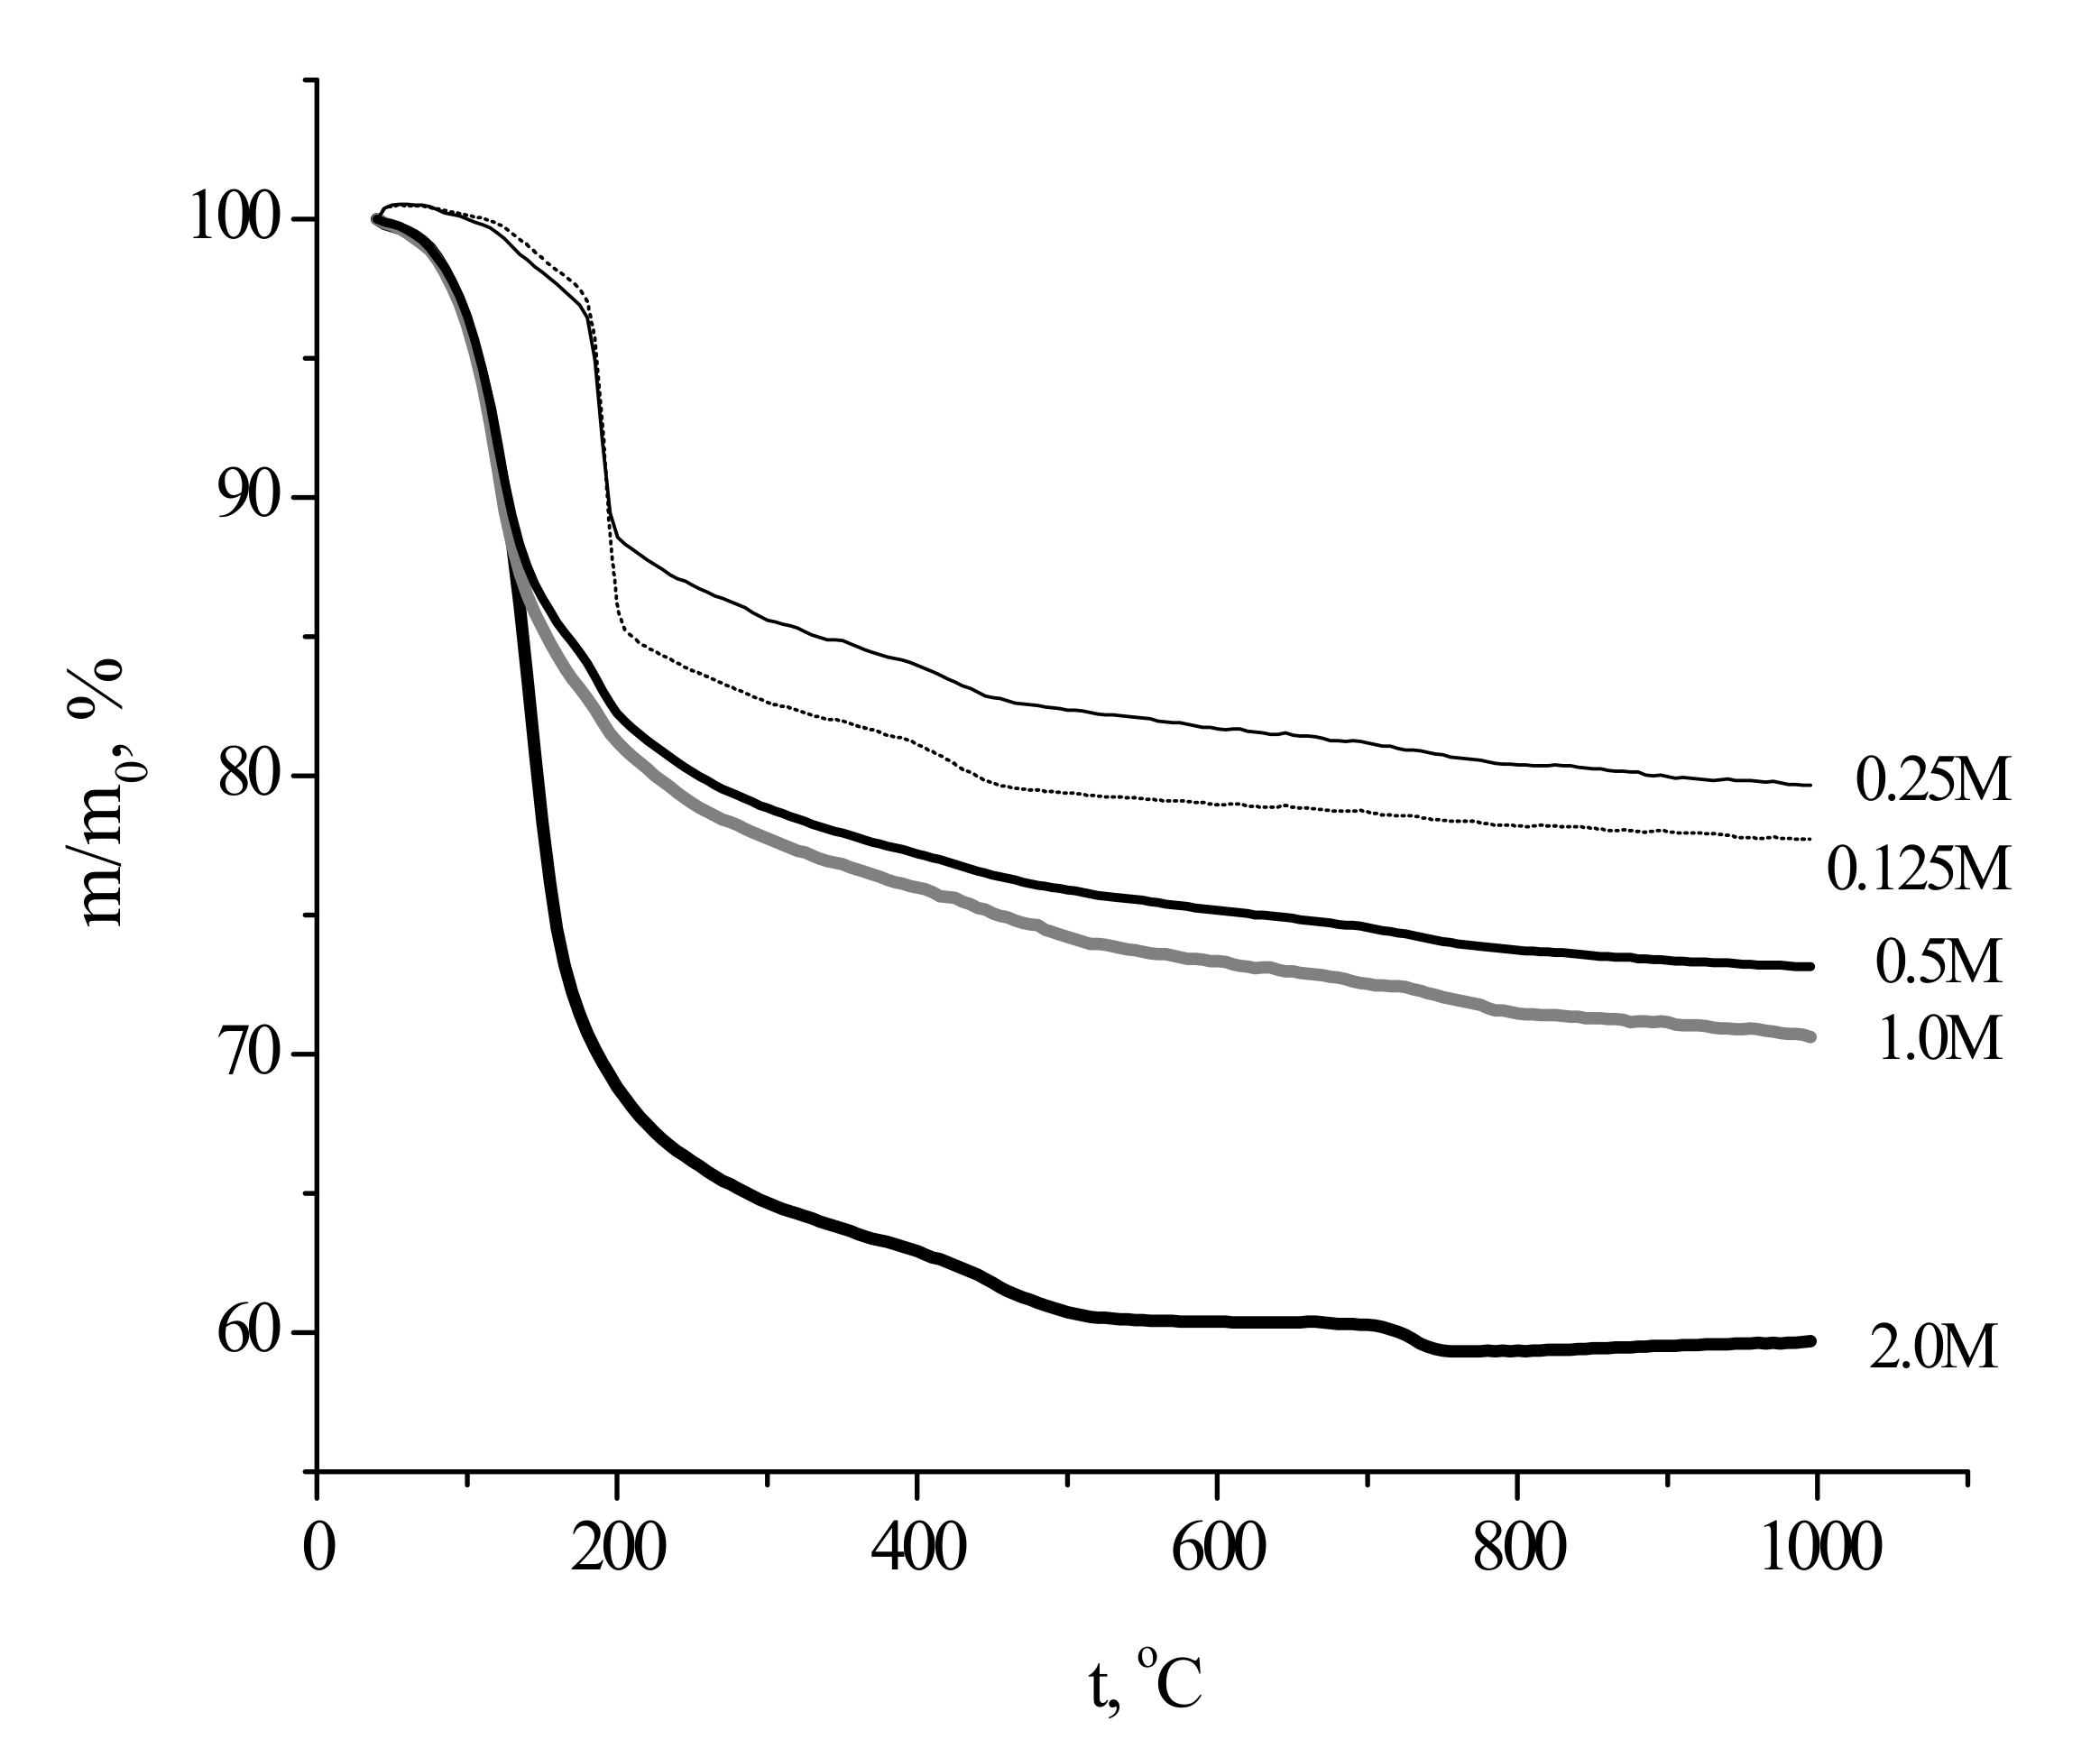
The collected TA data (
Figure 6) revealed that total mass loss of the as-prepared powders upon heating to 1000 °C ranged between about 20% (the “0.25 M” sample) and 40% (the “2 M” sample).
The highest mass loss for the powder prepared from the most concentrated solutions was evidently due to high content of the reaction by-product in the sample. The specific smell of the powder suggested that the by-product contained acetic acid and/or ammonium acetate, even though the corresponding reflexes were not observed in the XRD pattern. Ammonium acetate could be adsorbed at the powder surface from the mother liquor during synthesis. The effect of the precursors concentration during calcium phosphates synthesis on the by-product(s) content in the prepared powder from has been shown earlier as well [
8]. The presence of brushite caused steep mass loss at 200 °C for the powders prepared using 0.125 and 0.25 M calcium acetate solutions; the mass loss at 200 °C was more prominent in the case of the more dilute precursor solution. On the other hand, the TG curve for the powder prepared from the most concentrated precursor solution (2 M) resembled that for Ca-deficient hydroxyapatite Ca
9(HPO
4)(PO
4)
5(OH) [
13,
36], exhibiting a typical bend at 700–750 °C. The TG curves for the “0.5 M” and “1.0 M” powders were in between the above-described extreme cases, exhibiting intermediate mass losses both at 200 and 1000 °C.
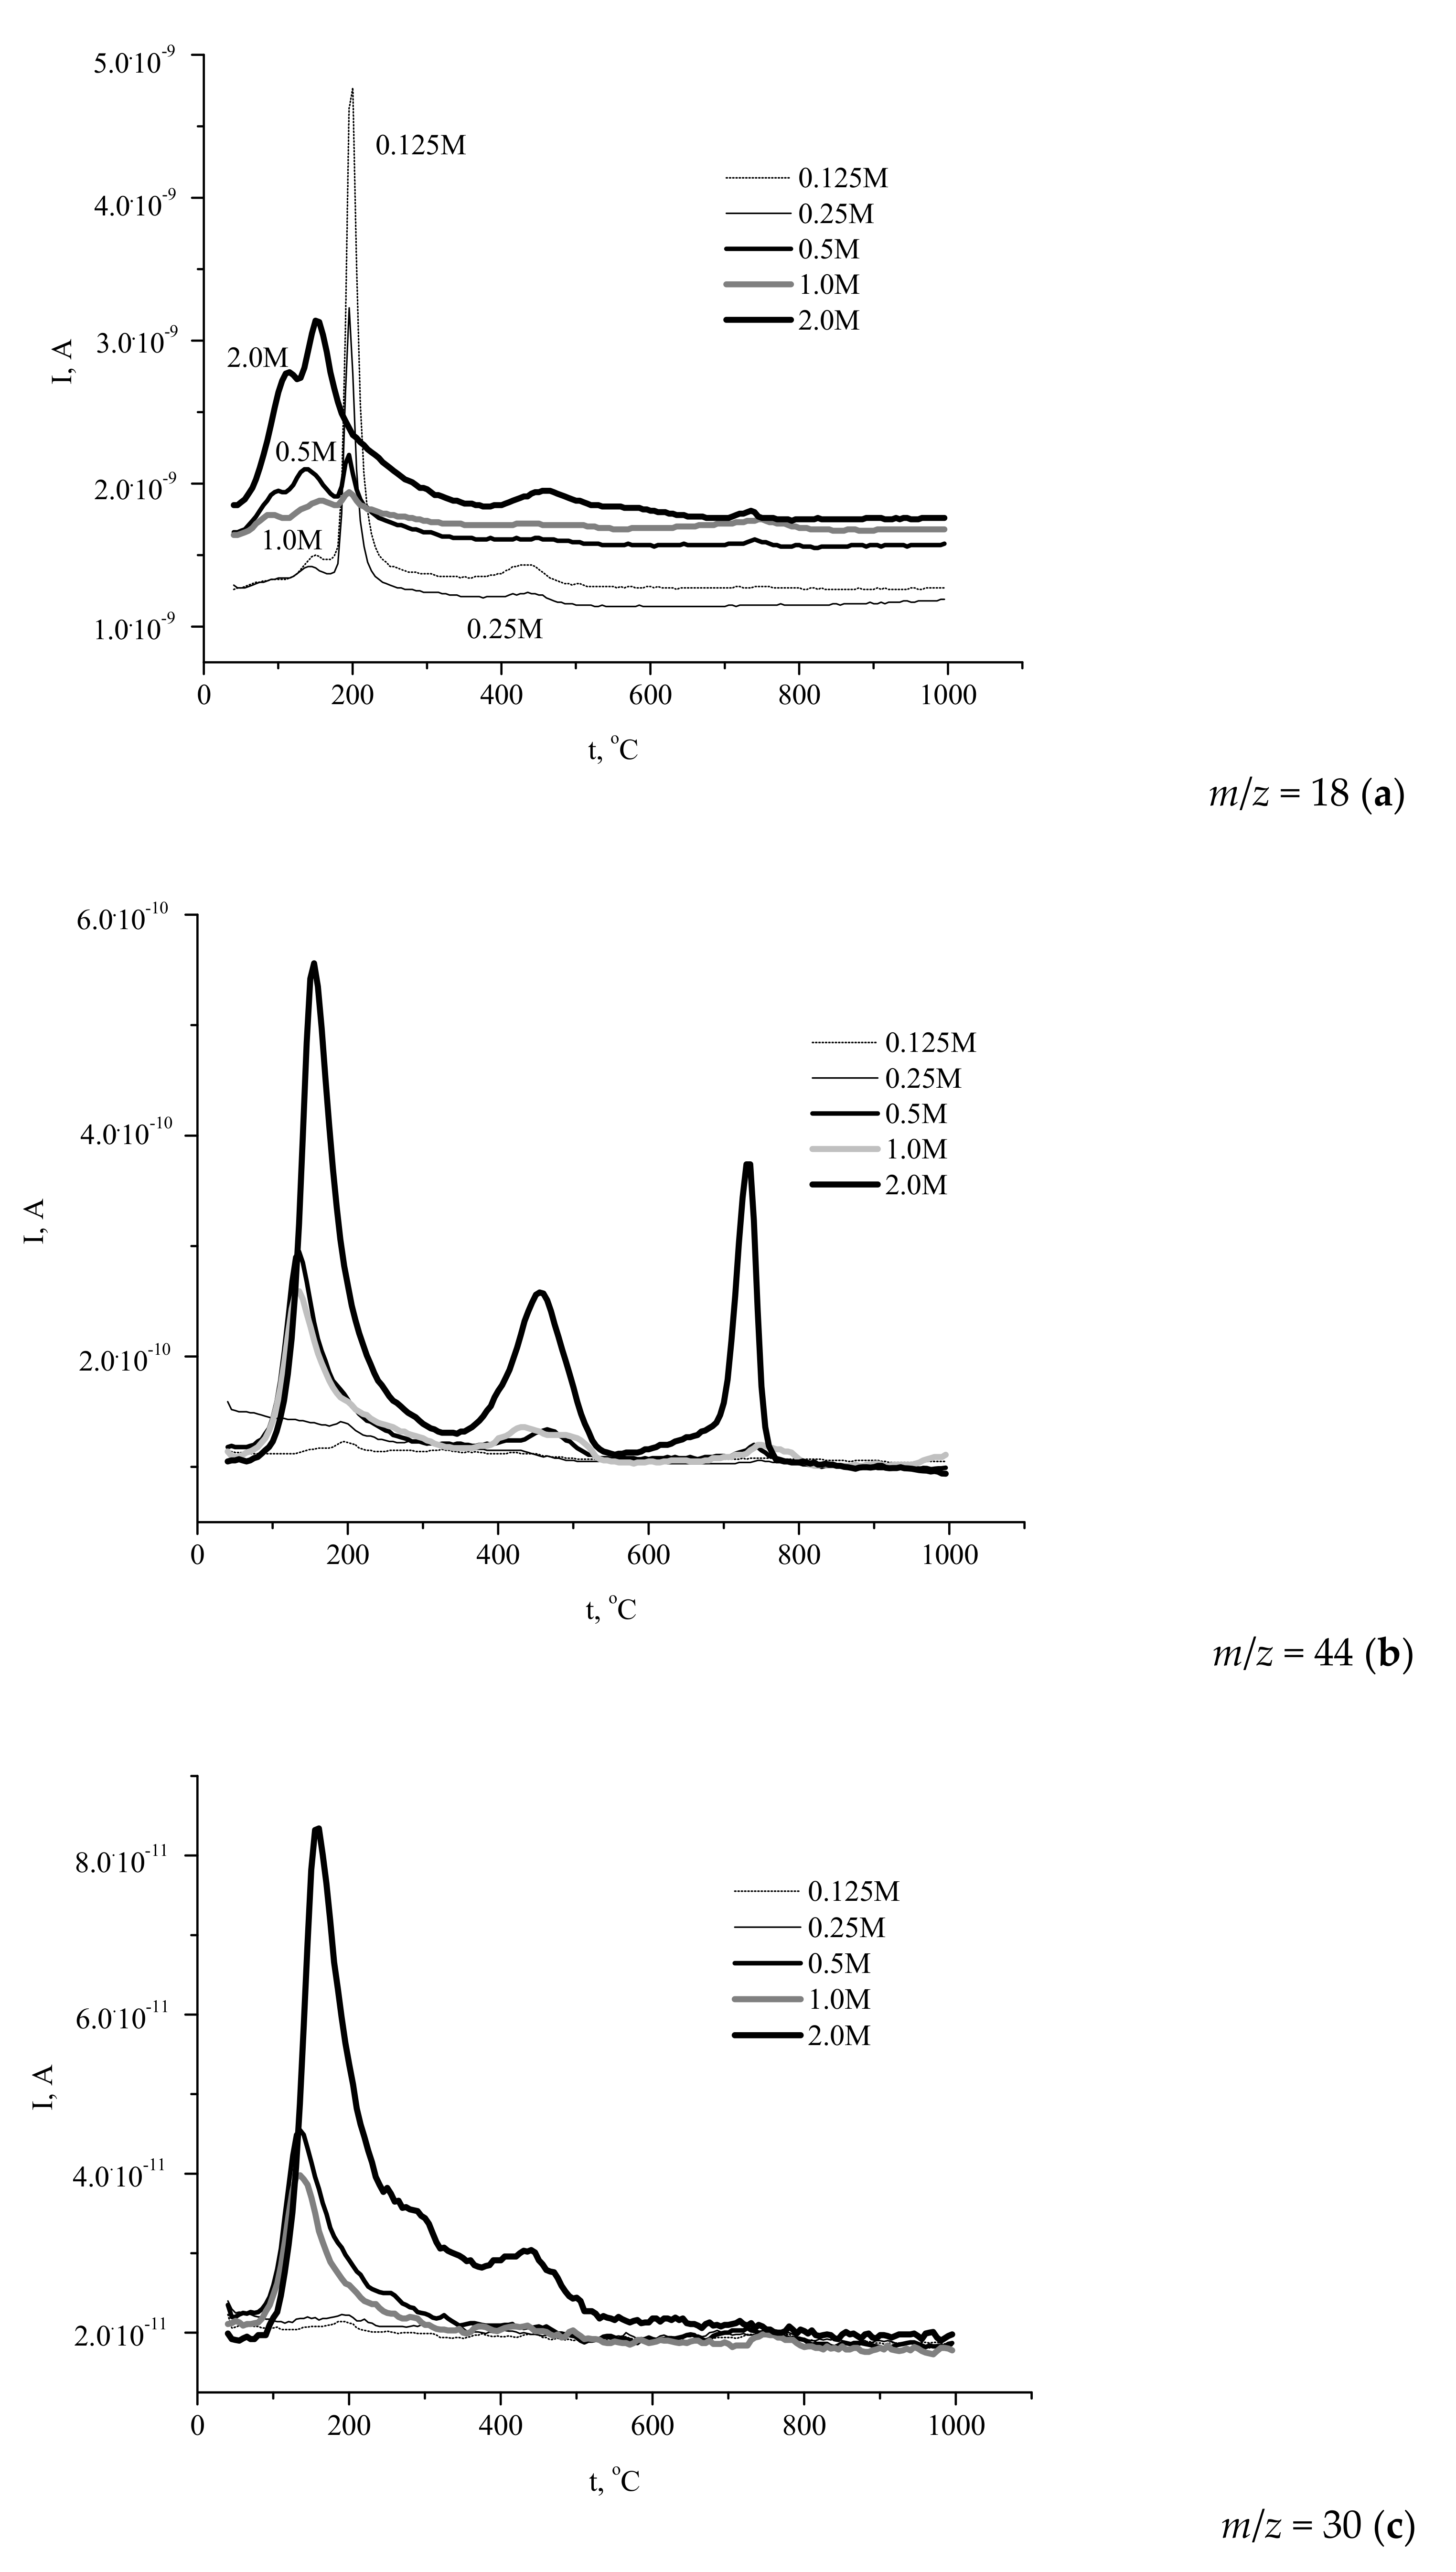
The simultaneously recorded mass spectra (MS) profiles (
Figure 7) of the gases evolved during the heat treatment showed that H
2O (
m/
z 18,
Figure 7a) gave the major contribution to the mass loss of the powders.
The profiles of water evolution could be divided into three types. The first one reflected the decomposition of brushite phase with prominent signals at 200 and 400 °C (the “0.125 M” and “0.25 M” powders). Another shape of the curve corresponded to the decomposition of Ca-deficient hydroxyapatite (the “2 M” powder). Other samples showed the intermediate type curves of water evolution during decomposition, containing the peaks typical of both brushite and calcium deficient hydroxyapatite.
The profiles of carbon dioxide evolution (
m/
z 44,
Figure 7b) from the synthesized powders reflected the contribution of ammonium acetate (CH
3COONH
4) decomposition to the heat-induced mass loss of the samples. As seen in
Figure 7b, the evolution of CO
2 from the powders prepared from 0.5–2.0 M calcium acetate solutions occurred in three stages with the maximums observed at 130–150, 430–470, and 730–750 °C.
It should be noted that evolution of CO2 was negligibly weak for the powders prepared using more dilute precursor solutions (0.125–0.25 M), due to the low content of the reaction by-product in the samples. The presence of three maximums revealed the complex pathway of the organic by-product decomposition. Obviously, the transformations of ammonium acetate yielded a mixture of various carbonaceous solids, their ratio being changed during heating at 400–800 °C. The presence of carbonaceous species (including carbon) in the solid residue was confirmed by the observed evolution of the sample color during heating. Likely, the color of calcium phosphates powder was determined by the presence of the products of partial decomposition over the lower temperature range and by amorphous carbon at intermediate temperature, whereas carbon was completely removed during the third stage of decomposition.
Heating of ammonium compounds in the presence of oxygen can lead to the formation of different nitrogen oxides via a complex multistage process. In this study, we report the data for NO evolution (
m/
z 30). The corresponding profiles (
Figure 7c) showed that elimination of NO from the powder prepared at the highest concentration of the precursor (2 M) occurred over a broad temperature range (80–700 °C) with a sharp peak at 160 °C, whereas in the case of the products obtained at intermediate precursor concentrations the range of NO evolution was narrower: Up to 350 °C (“1 M”) and up to 320 °C (“0.5 M”), with sharp peaks at about 135 °C. No noticeable evolution of NO was detected for the powders prepared at lower precursor concentrations. Hence, the amount of the evolved NO and the range of its evolution were expectedly affected by the amount of the reaction by-product in the synthesized powder. Let us mention that some of the maximums in the “
m/
z 30” curves coincided with those in the “
m/
z 18” profiles, while other peaks corresponded to those in the “
m/
z 44” traces. Therefore, various stages of NO evolution were accompanied by the formation of H
2O or CO
2, and the overall mass loss was a result of several competing multistage processes involving both calcium phosphate species and ammonium acetate. It has been earlier revealed [
18,
20,
23,
24,
26] that the reaction by-product consisting of carboxylic acids and their ammonium salts undergoes partial and then complete decomposition at temperatures below 800 °C. Therefore, the calcium phosphates powders containing carboxylic acids or their salts (ammonium, sodium [
37], or potassium [
38]) heat-treated at 400–800 °C were black-colored due to the formation of carbon or products of partial decomposition of organic substances present in the as-prepared samples.
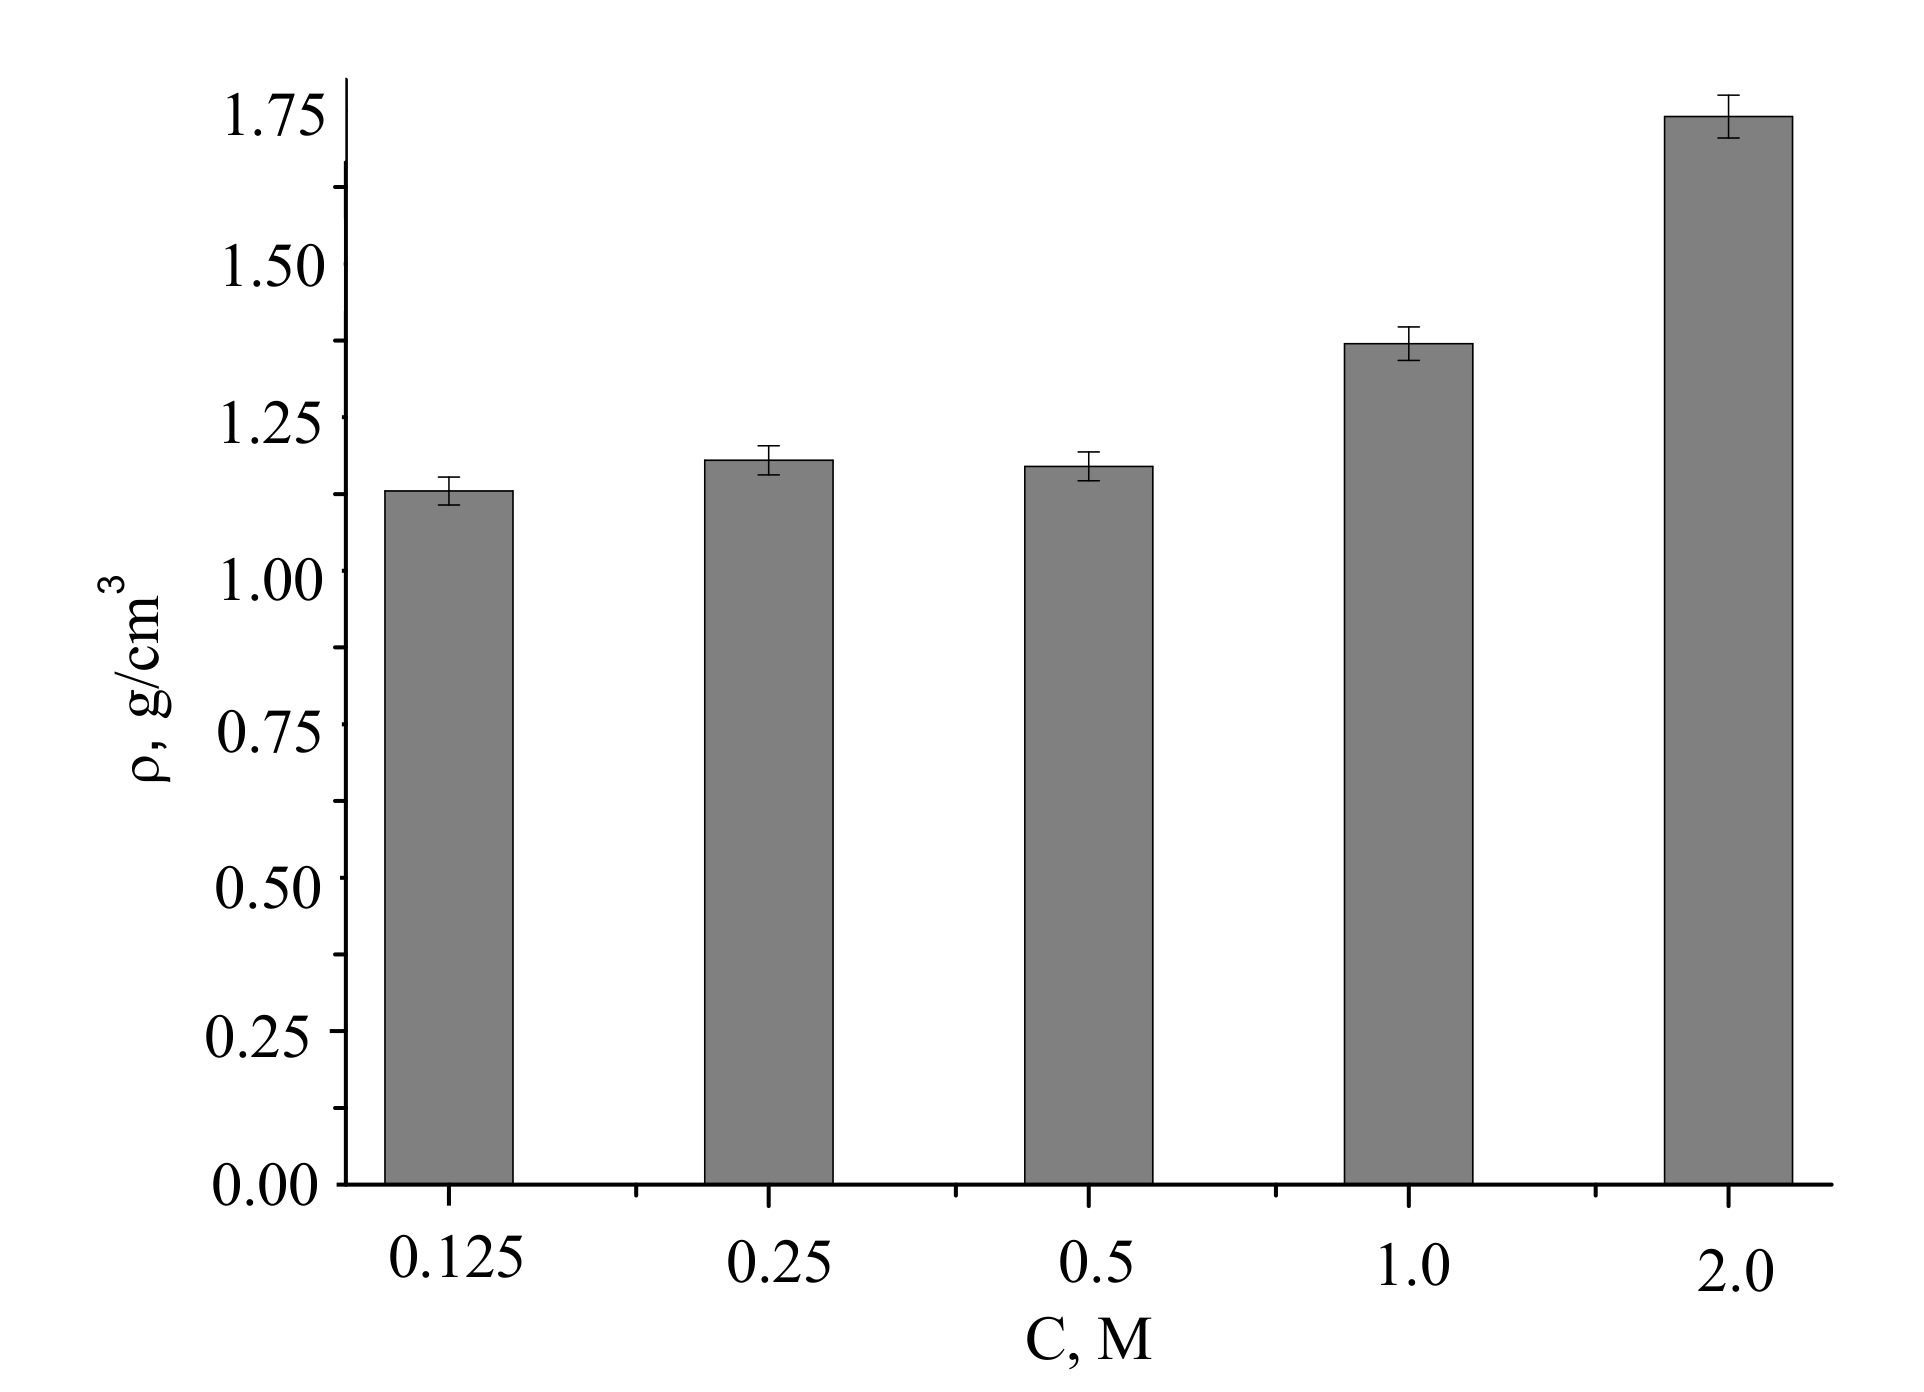
Rheological properties of the synthesized powders could be estimated from the density values of green compacted samples after pressing at 100 MPa (
Figure 8).
The relative densities of the powder compacts were calculated based on the pycnometric density of calcium phosphate ceramic samples after firing at 1100 °C for 2 h. The relative densities of the powder compacts fabricated from the powders synthesized from more dilute precursor solutions (0.125–0.5 M) were about 37% to 39%. The relative densities of the powder compacts fabricated from the powders prepared from more concentrated precursor solutions (1 and 2 M) were about 44% and 57%, respectively. We suppose that the achievable density of the powder compact was related to the morphology of the powder particles (
Figure 4) and the presence of the reaction by-product in the synthesized powders after disaggregation. In the case of the studied powders, ammonium acetate played the role of temporary technological binder facilitating sliding of the particles to form a denser package. Indeed, the samples of the “2 M” powder compacted by pressing had the highest green density, coinciding with the fact that it consisted of isometric particles and contained the highest amount of the reaction by-product.
XRD patterns of the compacted powder specimens heat-treated at 1100 °C are given in
Figure 9.
According to the XRD data, tricalcium phosphate β-Ca3(PO4)2 (PDF card # 1-169) and calcium pyrophosphate β-Ca2P2O7 (PDF card # 9-346) were present in ceramic samples, fabricated from synthesized powders. The sample corresponding to the highest precursor concentration (“2 M”) contained exclusively tricalcium phosphate β-Ca3(PO4)2 after the heat treatment, the sample fabricated from the “0.125 M” powder consisted preferably of calcium pyrophosphate β-Ca2P2O7, whereas the intermediate ceramic samples revealed the presence of both tricalcium phosphate β-Ca3(PO4)2 and calcium pyrophosphate β-Ca2P2O7 phases with the regularly changing reflexes intensities.
The formation of calcium pyrophosphate β-Ca
2P
2O
7 could be expressed by Reactions (3) and (4):
The formation of tricalcium phosphate β-Ca
3(PO
4)
2 which could be treated as dominated phase for the “2 M” powder was explained by Reactions (5) and (6) or Reactions (5), (6), (8) and (10) for other powders:
The presence of CaO in the powder compact at high temperature could be due to the transformations of the Ca(CH3COO)2 admixture (Reactions (6) and (8)). In turn, Ca(CH3COO)2 admixture was a result of the formation of brushite (with Ca/P = 1) from the mixtures of the nominal composition corresponding to Ca/P = 1.5. Indeed, the Ca/P = 1.5 starting conditions correspond to the excess of Ca(CH3COO)2 according to Equation (1).
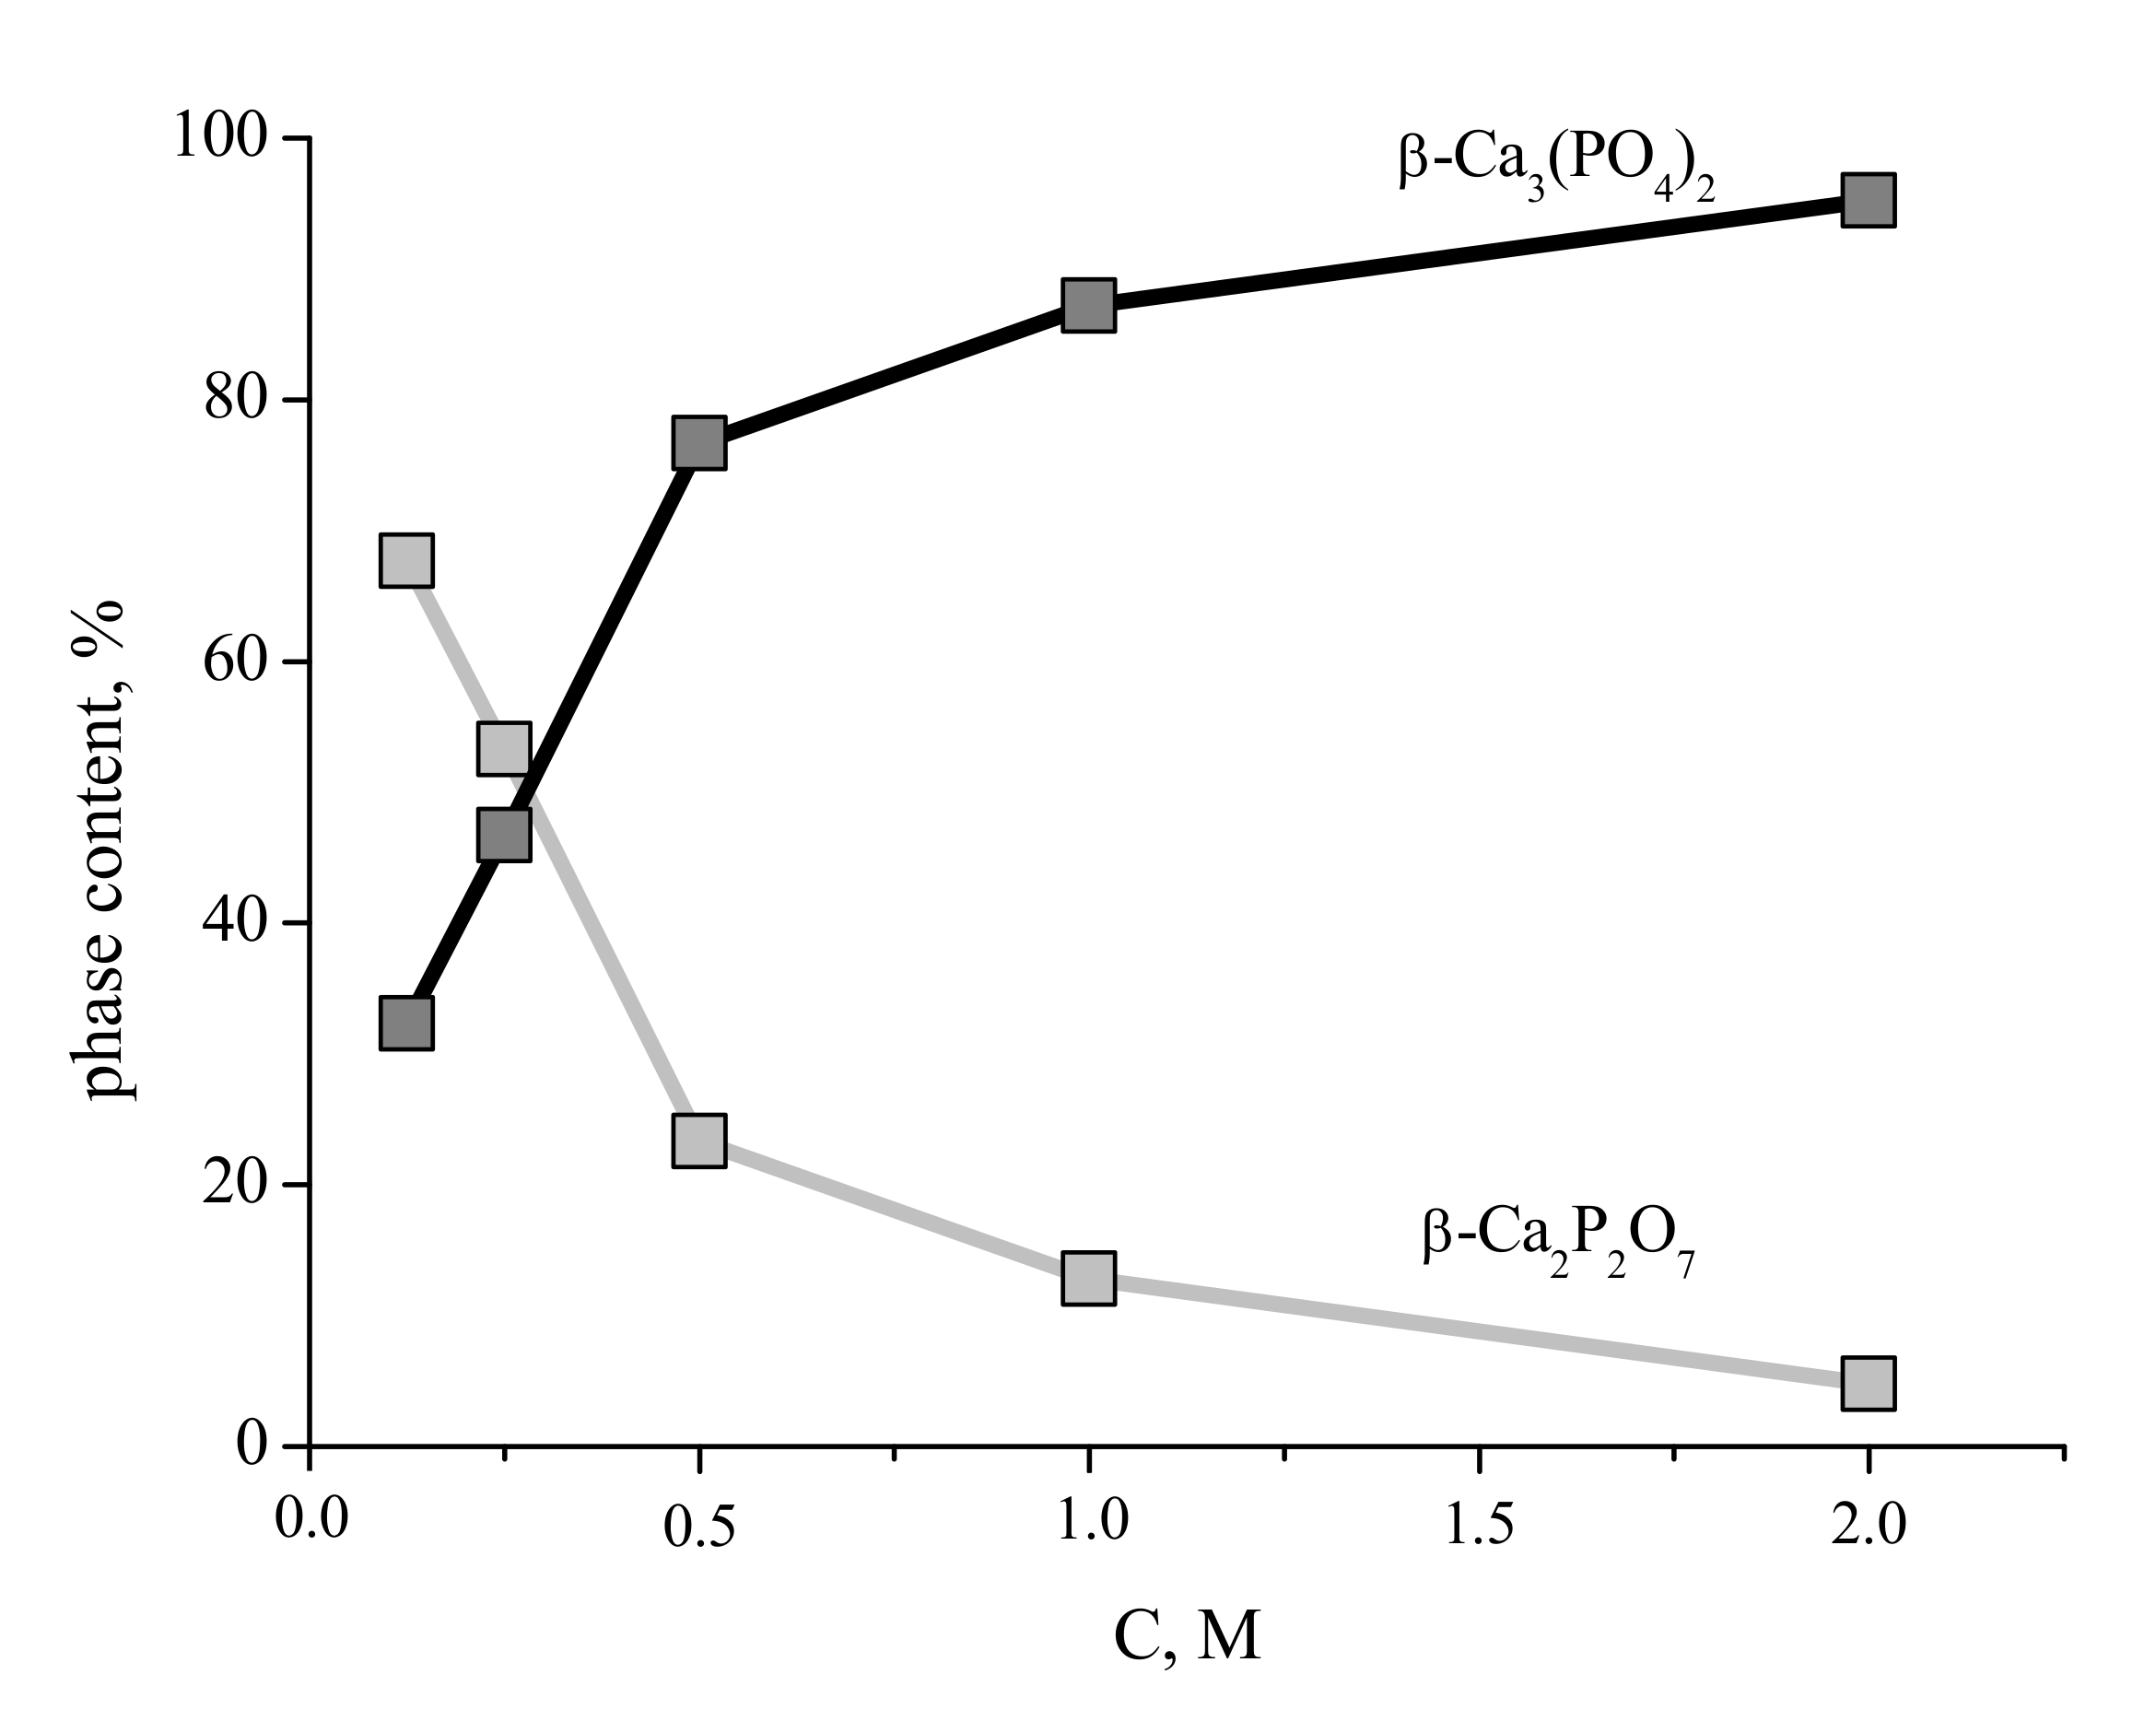
The content of the phases in the ceramic samples prepared from the synthesized powders after firing at 1100 °C are presented in
Figure 10. The content of the β-Ca
3(PO
4)
2 phase in the ceramic samples increases with increasing of concentration of starting solutions and after firing at 1100 °C for ceramics based on powder synthesized from solution with 2 M concentration of Ca(CH
3COO)
2 reaches 95%.
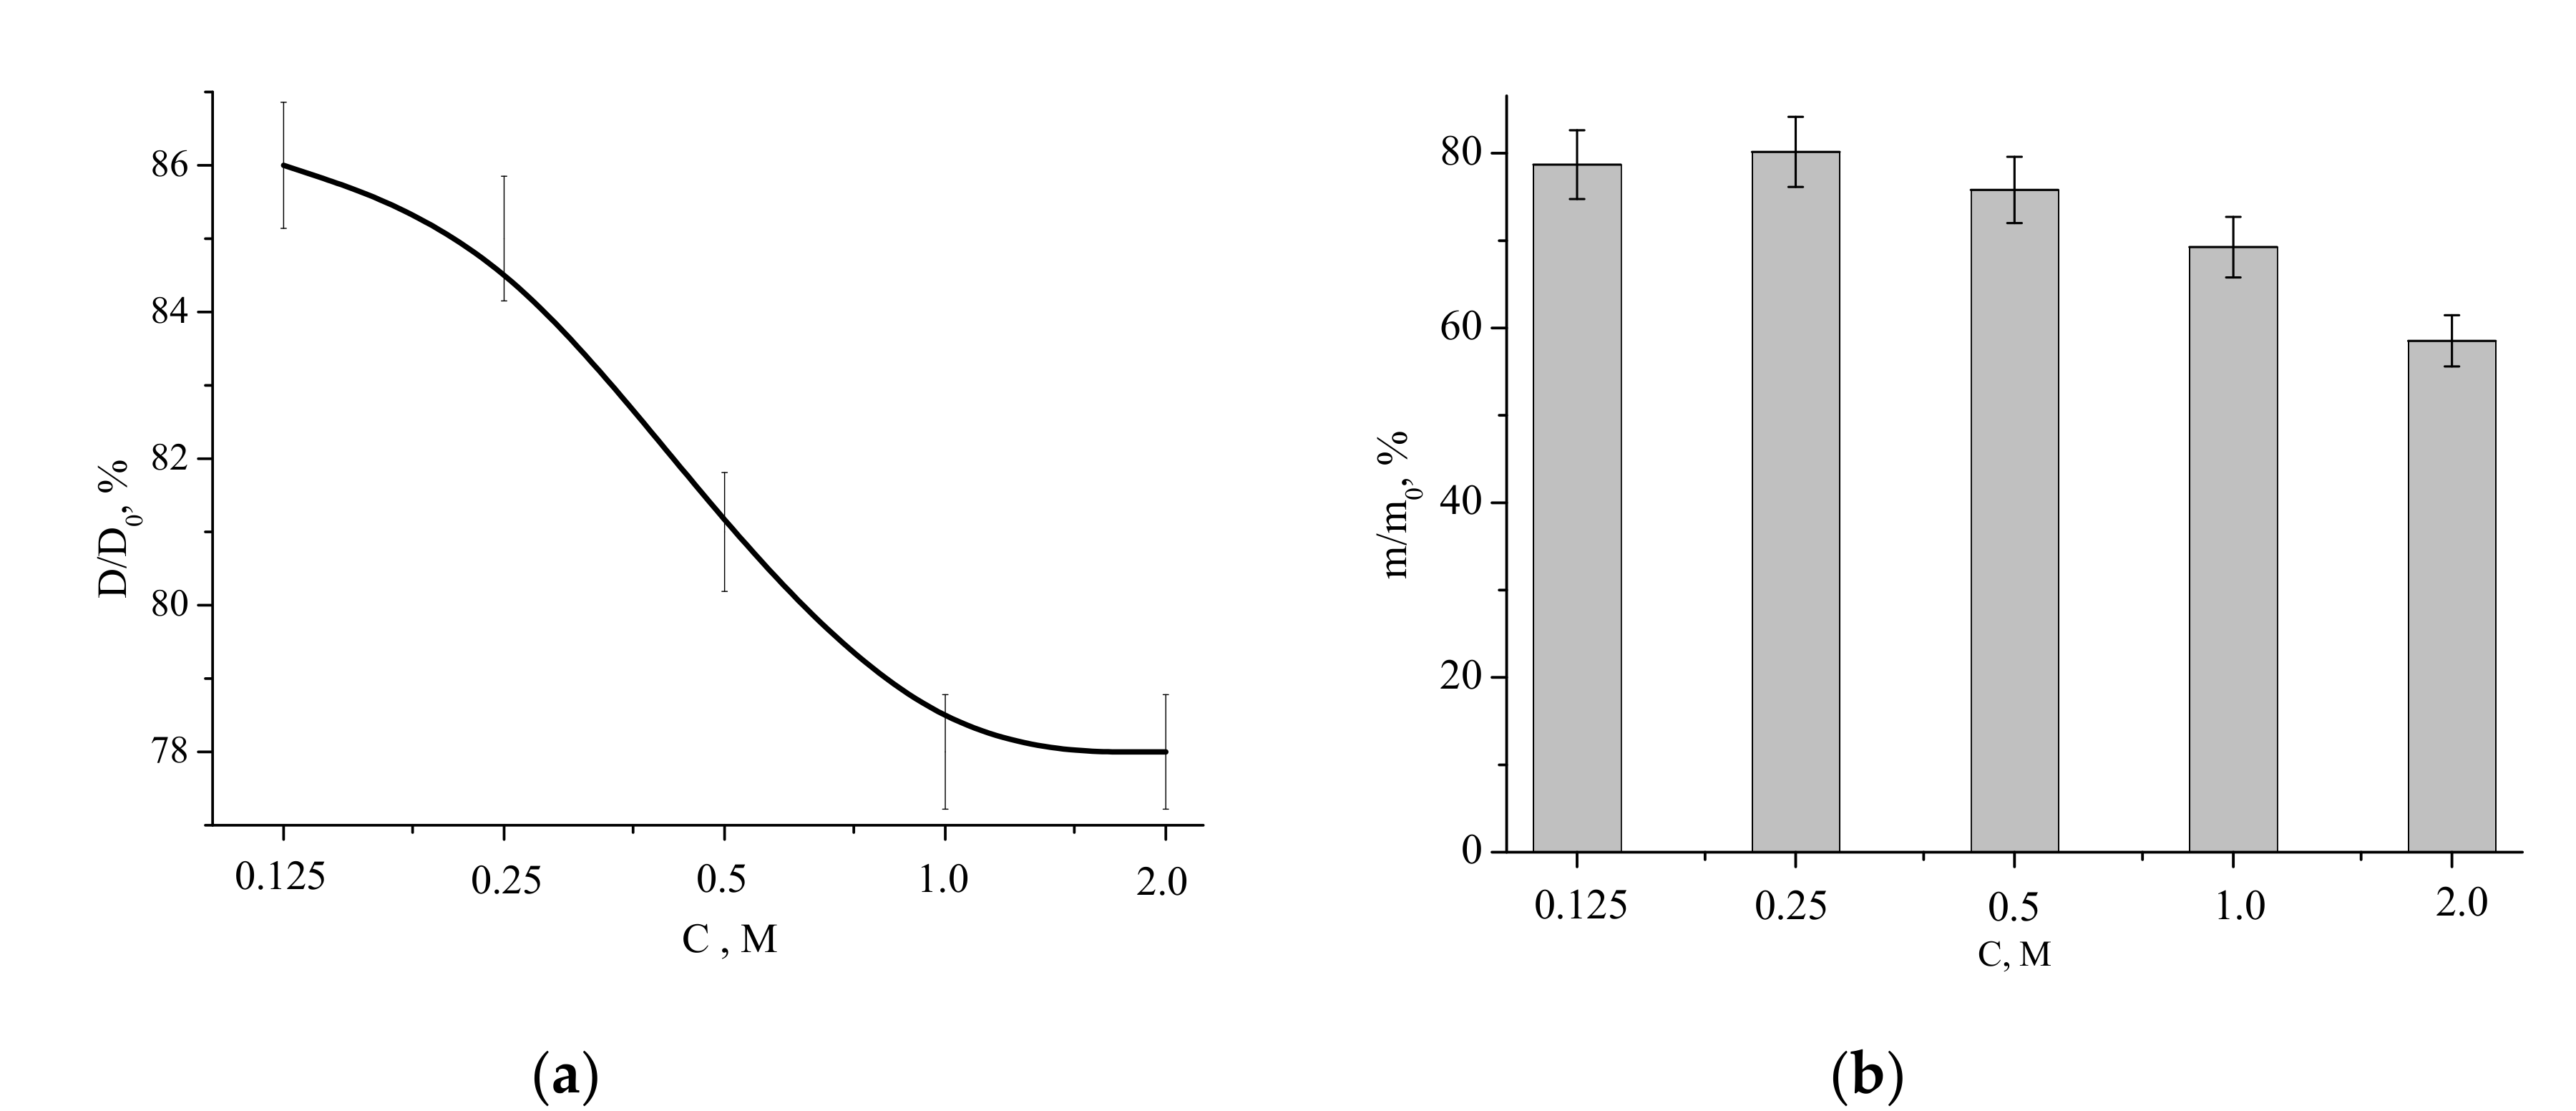
Relative diameter and mass (with respect to those of the compacted sample before the heat treatment) of the ceramic samples as functions of the Ca(CH
3COO)
2 concentration in the starting solution are presented in
Figure 11.
The relative diameter dependence was decreasing, showing the lowest value (linear shrinkage of 22%) for the samples fabricated from the “1 M” and “2 M” powders. The highest relative diameter (the lowest liner shrinkage of 14%) was observed for the sample prepared from the “0.125 M” powder. The mass loss of the powders after firing at 1100 °C for 2 h was within the 22% to 42% range, coinciding with the TA data (
Figure 6).
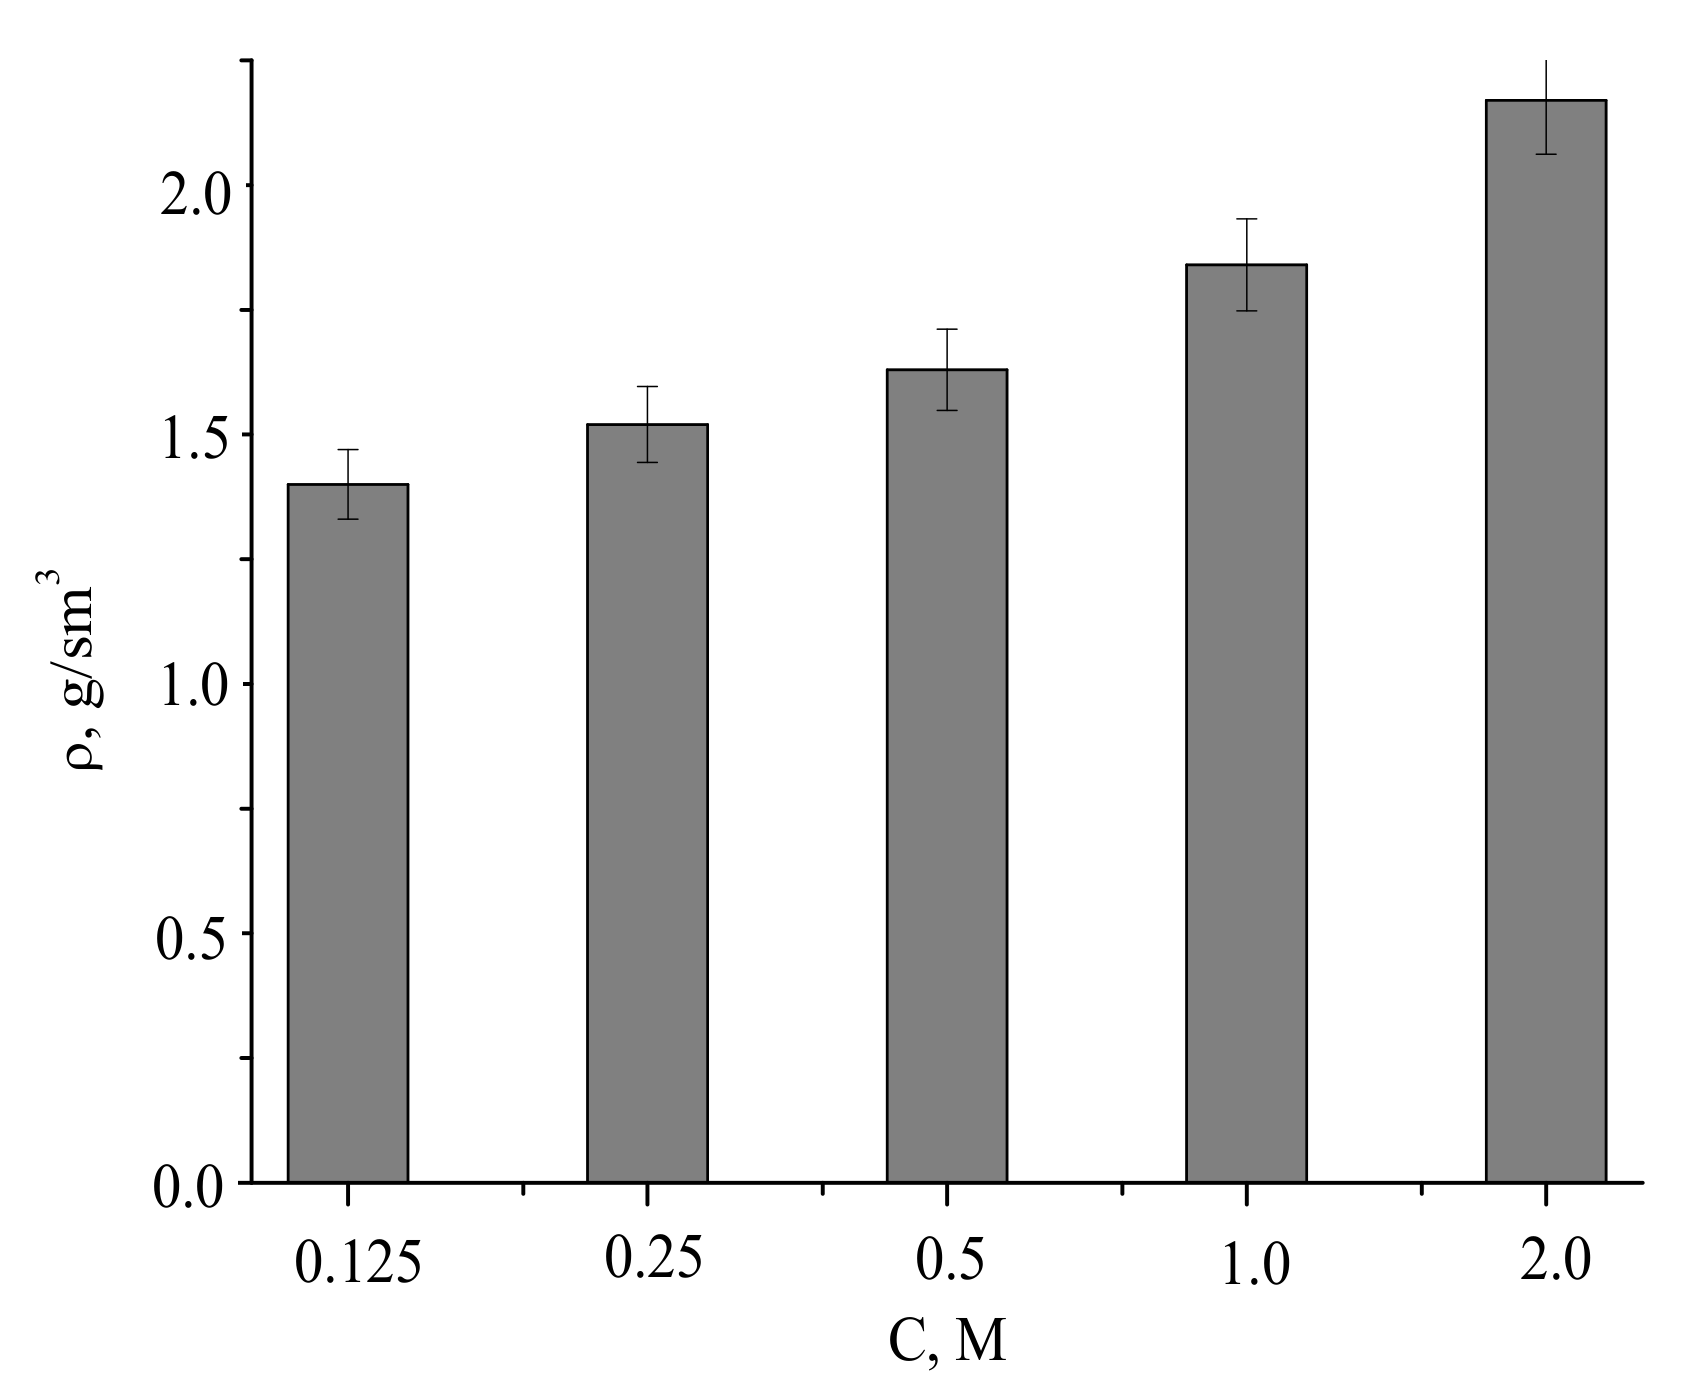
The densities of the compacted powder samples and after firing at 1100 °C were of 1.4–2.2 g/cm
3, increasing with the concentration of the precursor used for the powder preparation (
Figure 12).
Assuming pycnometric density of samples after firing at 1100 °C, the measured densities of the ceramics corresponded to 46% to 70% of the theoretical values.
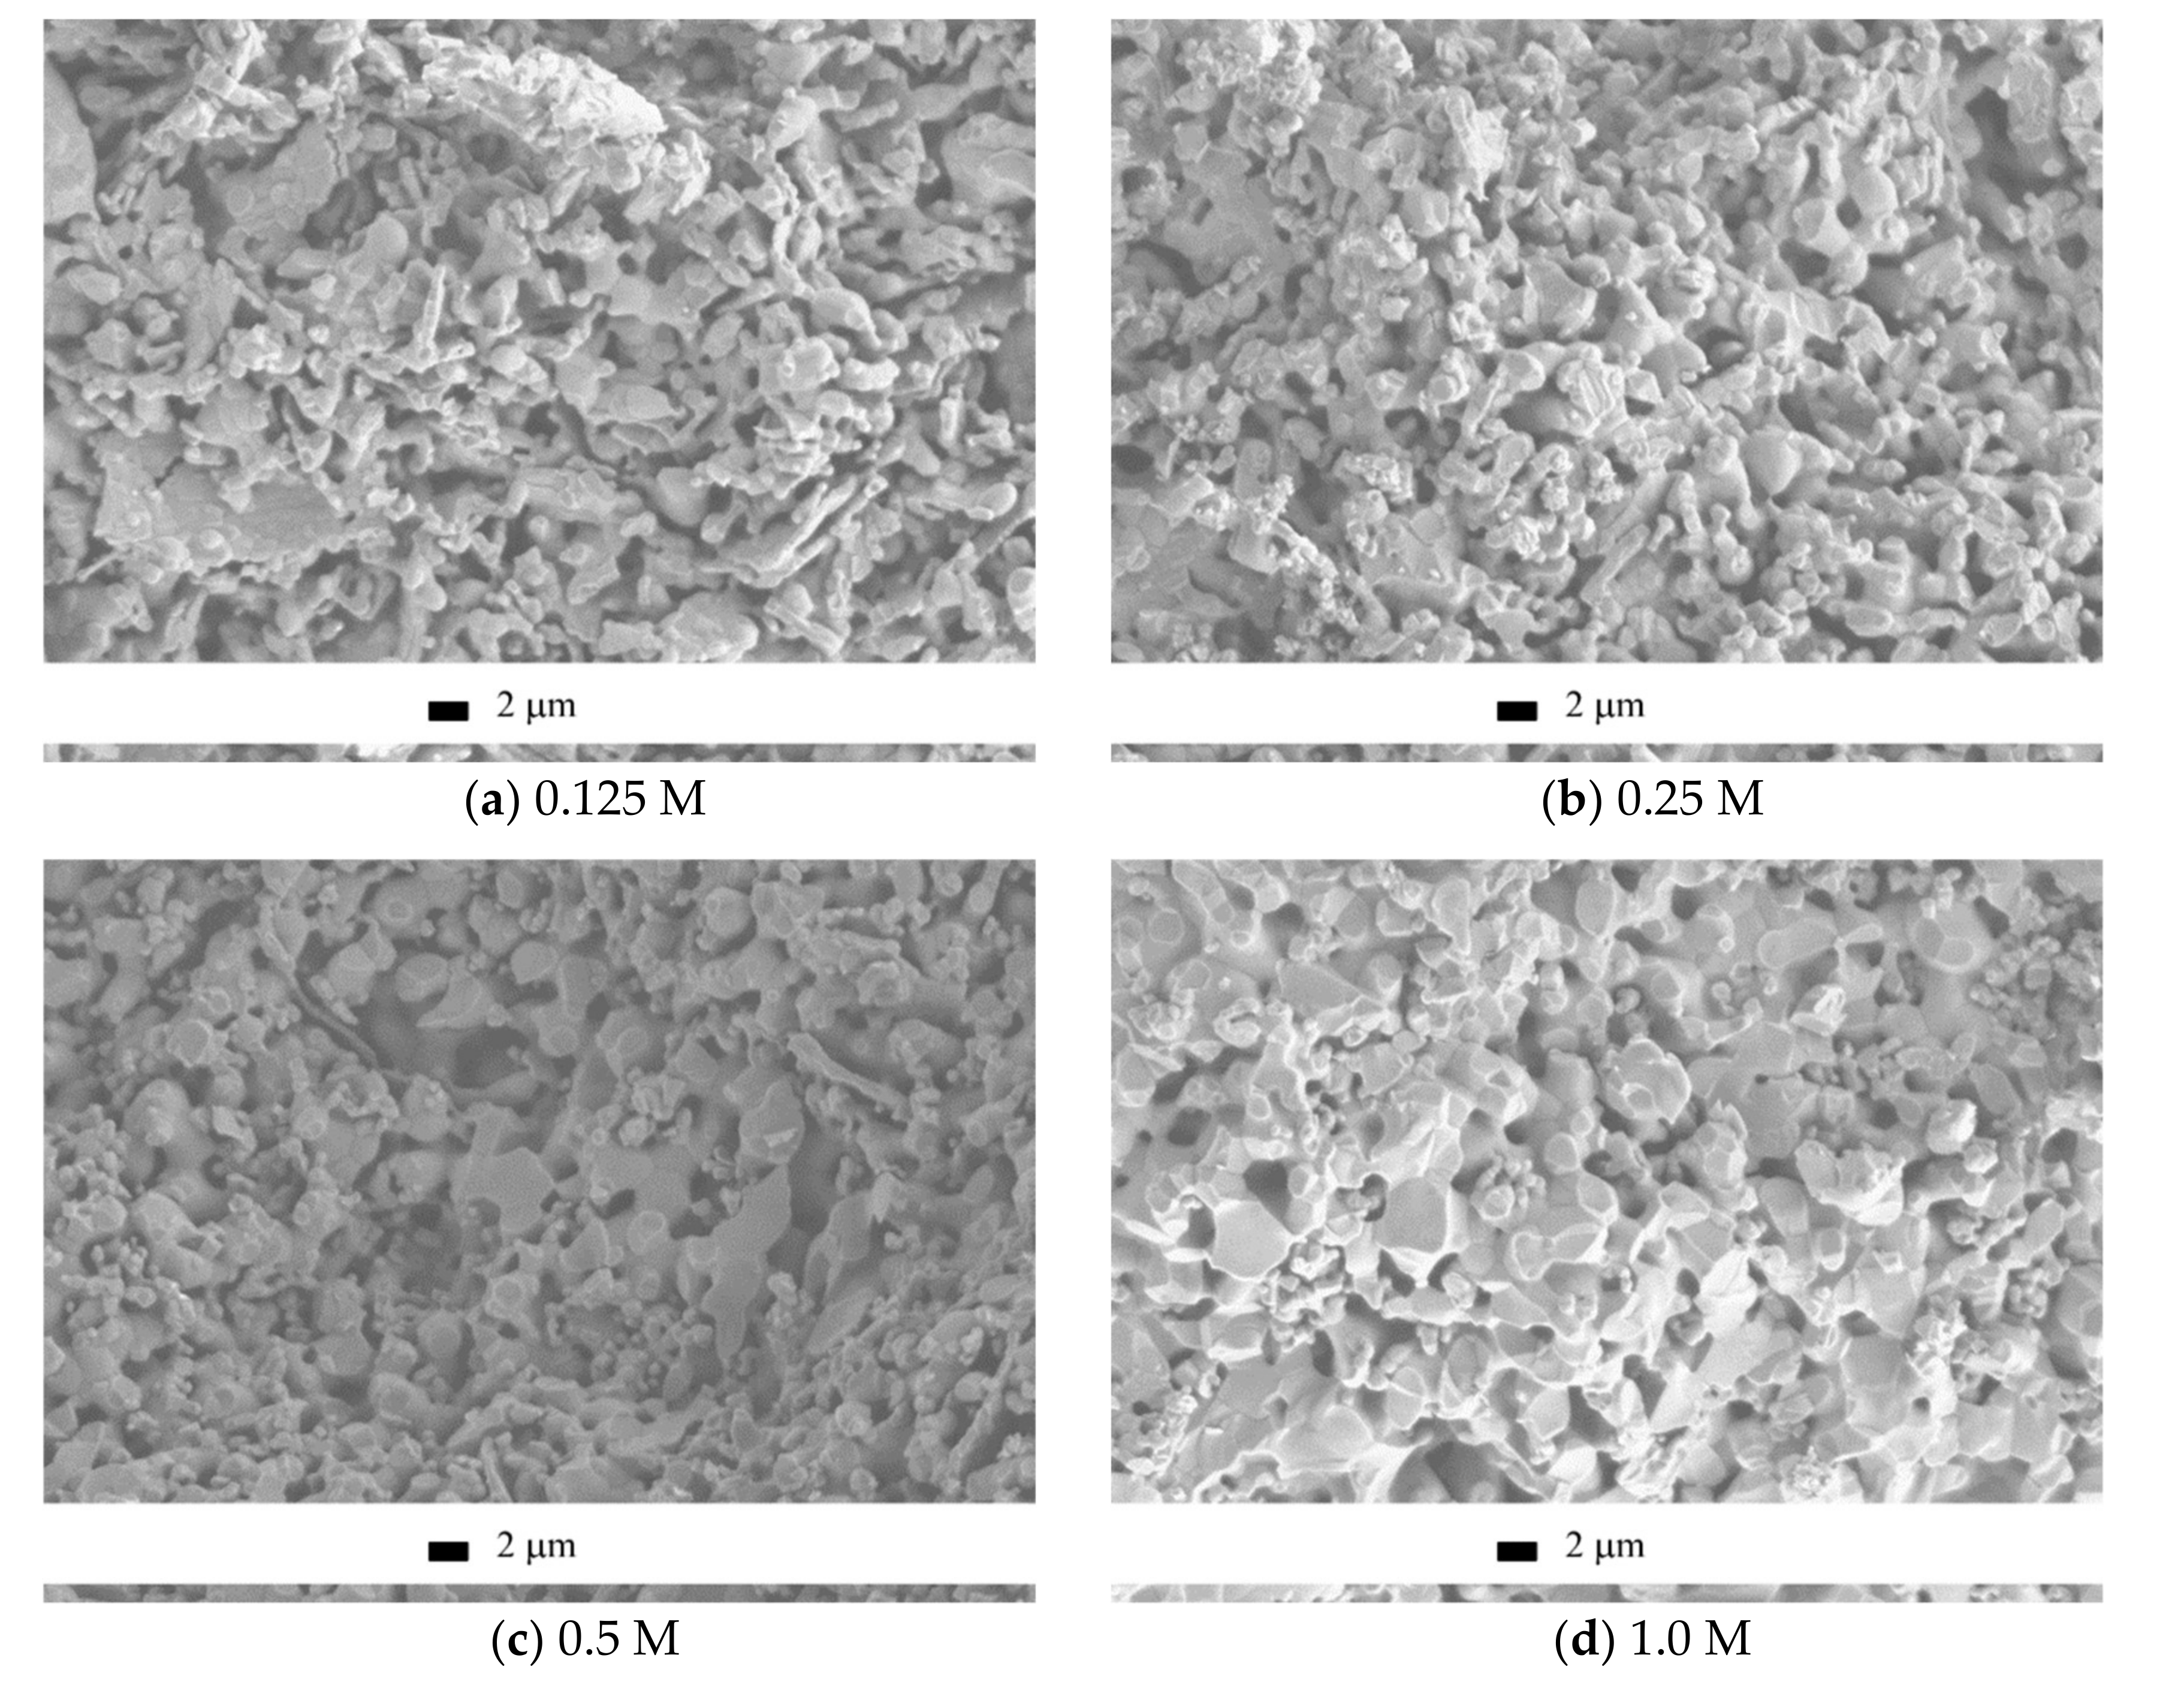
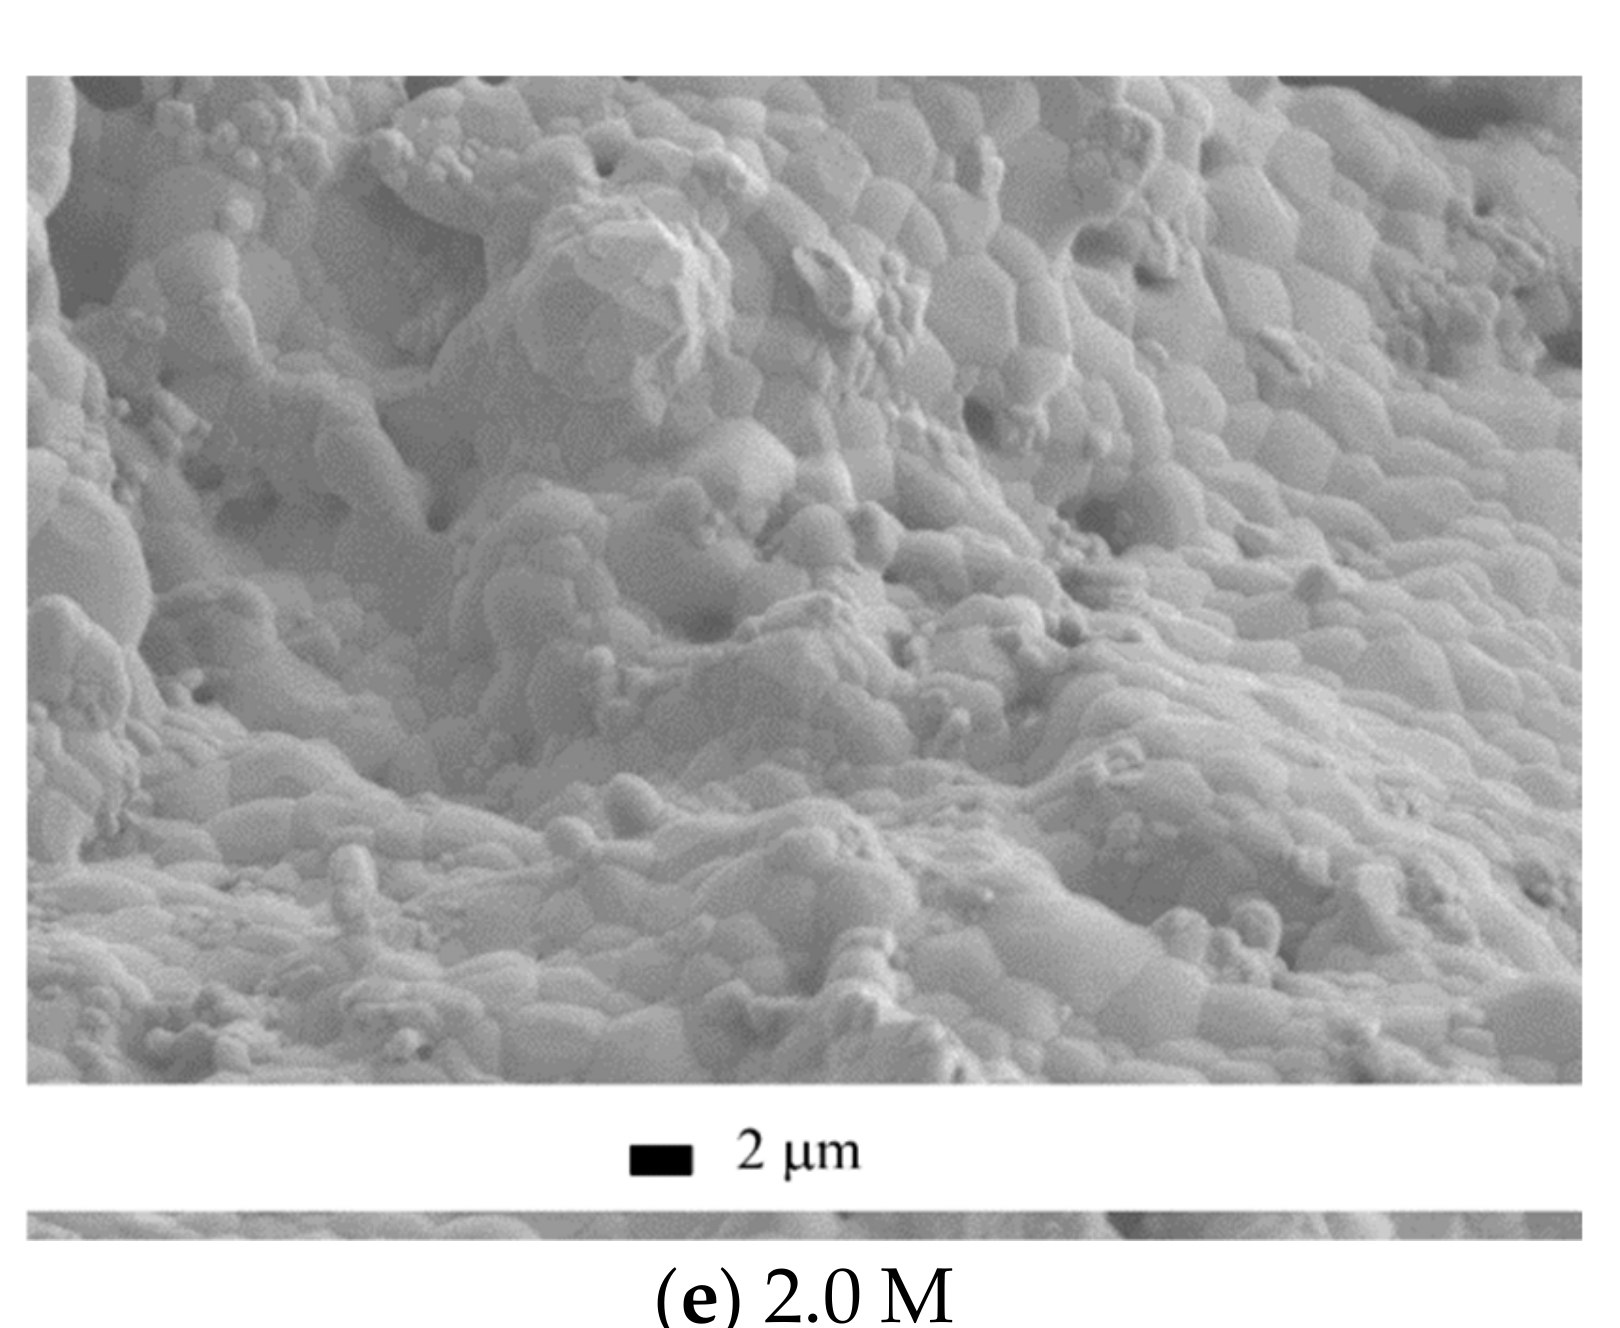
The microstructure of the ceramic materials after annealing at 1100 °C (
Figure 13) coincided with the discussed trends of the relative diameter and density.
The microstructure of the ceramics fabricated from the “0.125 M”, “0.25 M”, “0.5 M”, and “1 M” powders looked “undersintered,” containing 0.5–4 μm pores and 0.5–4 μm grains, partially plate-shaped. It should be noted that the fraction of coarse grains in the sample grew with the increase in the Ca(CH
3COO)
2 concentration in the starting solution. The microstructure of ceramics fabricated from the “2 M” powder looked different, being quite uniform. The constituting grains were of 0.5–3 μm, predominantly of 2–3 μm. The difference in the microstructure of the ceramics based on calcium pyrophosphate and that containing majorly tricalcium phosphate can be explained by lower staring powder compact density, plate morphology of the brushite particles and possibly by low mobility of the pyrophosphate ions during the solid-state sintering [
39,
40].
