1. Introduction
Similar to what happens to high-entropy alloys [
1,
2,
3,
4], high-entropy oxides or entropy-stabilized oxides are compounds that result from the combination of an equimolar content of several oxides prepared in such a way that the cations are randomly distributed in the cationic sublattice [
5]. The preparation involves heat treatment at temperatures that allow for the migration of the cations to thermodynamically minimum energy sites, followed by quenching to room temperature to retain the thermodynamic configuration achieved at high temperatures. X-ray diffraction is the main technique to monitor the phase constitution of the primary components and the evolution of the crystalline structure to that of the final compound. If that transition is reversible, i.e., if the compound can be decomposed back to the primary components, the transition is recognized as entropy-driven [
5]. The thermodynamically metastable new compound may have new structural phases and/or lattice parameters with new, eventually enhanced, physical properties. A series of experiments was reported on a new compound based on an equimolar mixture of MgO, CoO, NiO, CuO and ZnO, a five-component oxide with high configurational entropy [
5].
Aliovalent substitutions of cations in high-entropy oxides lead to a large number of possible combinations allowing for the synthesis of many new compounds. This opens an opportunity for discovering new compounds with improved properties, like colossal dielectric constants [
6]. Preliminary results on lithium and sodium fast ion conductors were reported on (MgCoNiCuZn)
1−x−yGa
y (Li or Na)
xO [
7]. Some recent publications deal with synthesis, phase stability and properties of high-entropy oxides: with fluorite structure (HfO
2, ZrO
2 and CeO
2) with additions of Y, Yb, Ca, Ti, La, Mg, and Gd oxides as fluorite phase stabilisers [
8]; multicomponent rare earth oxides [
9]; high entropy single-phase oxide with even 10 components (Gd, La, Nd, Sm, Y, Co, Cr, Fe, Mn and Ni), with a multiphase-single phase reversibility under heating [
10]; (Co,Cr,Fe,Mn,Ni)
3O
4 high entropy oxide with spinel structure [
11], high-entropy multicomponent perovskite solid solutions Sr
1−xBa
x(Zr
0.2Sn
0.2Ti
0.2Hf
0.2A
0.2)O
3 (x = 0.5, A = Mn, Nb, Ce, Y) [
12].
It has been suggested that entropy-stabilisation is a “particularly effective compound with ionic character”, we investigated this suggestion using equimolar combinations of paradigmatic ionic conductors ZrO
2: 8 mol % Y
2O
3 (8YSZ) and CeO
2: 20 mol % Sm
2O
3 (SDC20). 8YSZ is already commercially available, as a component of electrochemical devices allowing for the environmentally compatible production of electrical energy, heat, and high-temperature solid oxide fuel cells (800–1000 °C HT-SOFCs) [
13,
14,
15,
16,
17]. SDC20 was proposed as a candidate to substitute 8YSZ in these devices to enable a decrease in operating temperature to intermediate temperatures (600–800 °C IT-SOFCs) [
18,
19,
20,
21].
Chemical species are known to be accumulated or depleted at the interfaces of ceramic ionic conductors, creating a space charge region, which is considered to be responsible for the blocking of oxide ions, inhibiting their transport across the grain boundaries. This leads to the grain boundary resistivity detected as a low-frequency semicircle in the impedance diagrams in oxides conventionally sintered [
22,
23,
24,
25,
26,
27,
28,
29].
The purpose of this paper was to look at the distribution of charged species at the interface of solid solutions of equimolar ZrO2: 8 mol % Y2O3 and CeO2: 20 mol % Sm2O3, either quenched or slowly cooled from high temperatures, by collecting impedance spectroscopy data.
2. Materials and Methods
The ceramic powders were commercial ZrO2: 8 mol % Y2O3 (8YSZ, Tosoh, Tokyo, Japan) with 16 ± 3 m2/g surface area, and CeO2: 20 mol % Sm2O3 (SDC20, Fuel Cell Materials, Lewis Center, OH, USA) with 36.1 m2/g surface area. 10 g of equimolar amounts of both powders were thoroughly mixed in an agate mortar. Afterwards the mixed powders were attrition milled at 5000× rpm with sintered ceramic spheres of 1 mm diameter tetragonal zirconia (ZrO2: 5 mol % Y2O3, Tosoh, Tokyo, Japan) and isopropyl alcohol in a custom-made polytetrafluoroethylene (Teflon®)-lined metallic jar; this procedure was repeated four times for 15 min milling, with intermediate resting to avoid excessive heating that could result in powder agglomeration. The powders were uniaxially pressed into cylindrical shape pellets (ϕ 5 mm × 3 mm) at 10 MPa and isostatically (National Forge Co., Irvine, CA, USA) at 200 MPa. The geometrical density of all samples was 40–45% TD (TD: theoretical density). The sequence to quench the oxides was to insert the samples (two similar at a time) inside a programmable furnace (Lindberg Blue M, Watertown, WI, USA) previously heated at 1200, 1300, 1400 and 1500 °C using a Pt mesh and Pt wires to pull the samples in and out the furnace at 100 °C/s heating rate and 100 °C/s cooling rate to room temperature. Similar samples were heated to 1500 °C at 0.17 °C/s and cooled at the same rate to room temperature.
X-ray diffraction analyses were carried out at room temperature with a Bruker-AXS D8 Advance diffractometer (Karlsruhe, Germany), Bragg-Brentano configuration, with Cu kα radiation (λ = 1.54049 Å) in the 20–80 2θ range, 0.02° step size, 10 s step time. The patterns had their background subtracted with the EVA® Bruker-AXS software. Rietveld refinement analyses of the diffraction patterns were performed with the Topas® software with five diffraction lines for Cu kα radiation. The crystal structure information was collected in the Inorganic Crystal Structure Database (ICSD). The background was evaluated with a fifth order Chebyshev polynomial; Lorentz polarization was fixed at zero; lattice parameters, scale factor, Lorentz and/or Gauss contribution to crystal size, and sample displacement were allowed to be refined simultaneously.
Impedance spectroscopy measurements were carried out with a Hewlett Packard 4192A impedance analyzer (Yokogawa-Hewlett Packard, Tokyo, Japan) with 200 mV input signal, 20 points per decade in the 5–13 MHz frequency range, in samples spring-loaded between platinum disks inside a sample chamber made of inconel 600, alumina, and platinum terminal leads. Silver paste was deposited on the parallel surfaces of the ceramic green pellets and cured at 300 °C/15 min. For the collection of the impedance data, a model 360 Hewlett Packard Controller was used; the collection, analysis and deconvolution of the [−Z″(f) × Z′(f)] impedance diagrams were performed with a special software [
30]; Z′ and Z″ are the real and the imaginary components of the impedance and f is the frequency of the input signal. Specimens with similar diameter and thickness were used, being needless to correct data by considering their geometric factors.
The surfaces of the sintered specimens were polished with diamond pastes (15 µm to 1 µm) and thermally etched for 15 min at a temperature 100 degrees lower than the sintering temperature for observation in a scanning electron microscope (Inspect F50 FEG-SEM, FEI, Brno, Czech Republic).
3. Results
3.1. X-ray Diffraction Analysis
Figure 1 shows the results of the X-ray diffraction analysis of equimolar ZrO
2: 8 mol % Y
2O
3 + CeO
2: 20 mol % Sm
2O
3 green pellets heated to and quenched from 1200, 1300, 1400 and 1500 °C.
It was apparent that a single phase was reached at 1500 °C. The next step was to prepare ZrO
2: 8 mol % Y
2O
3 + CeO
2: 20 mol % Sm
2O
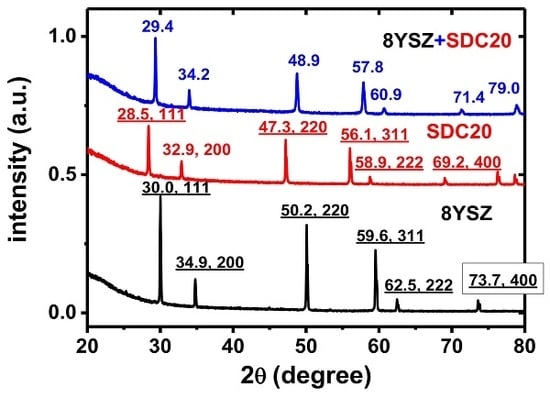
3 pellets quenched from 1500 °C to compare with each of the component compositions quenched from 1500 °C as well. The X-ray diffraction patterns of 8YSZ, SDC20 and the equimolar 8YSZ + SDC20 mixture are shown in
Figure 2.
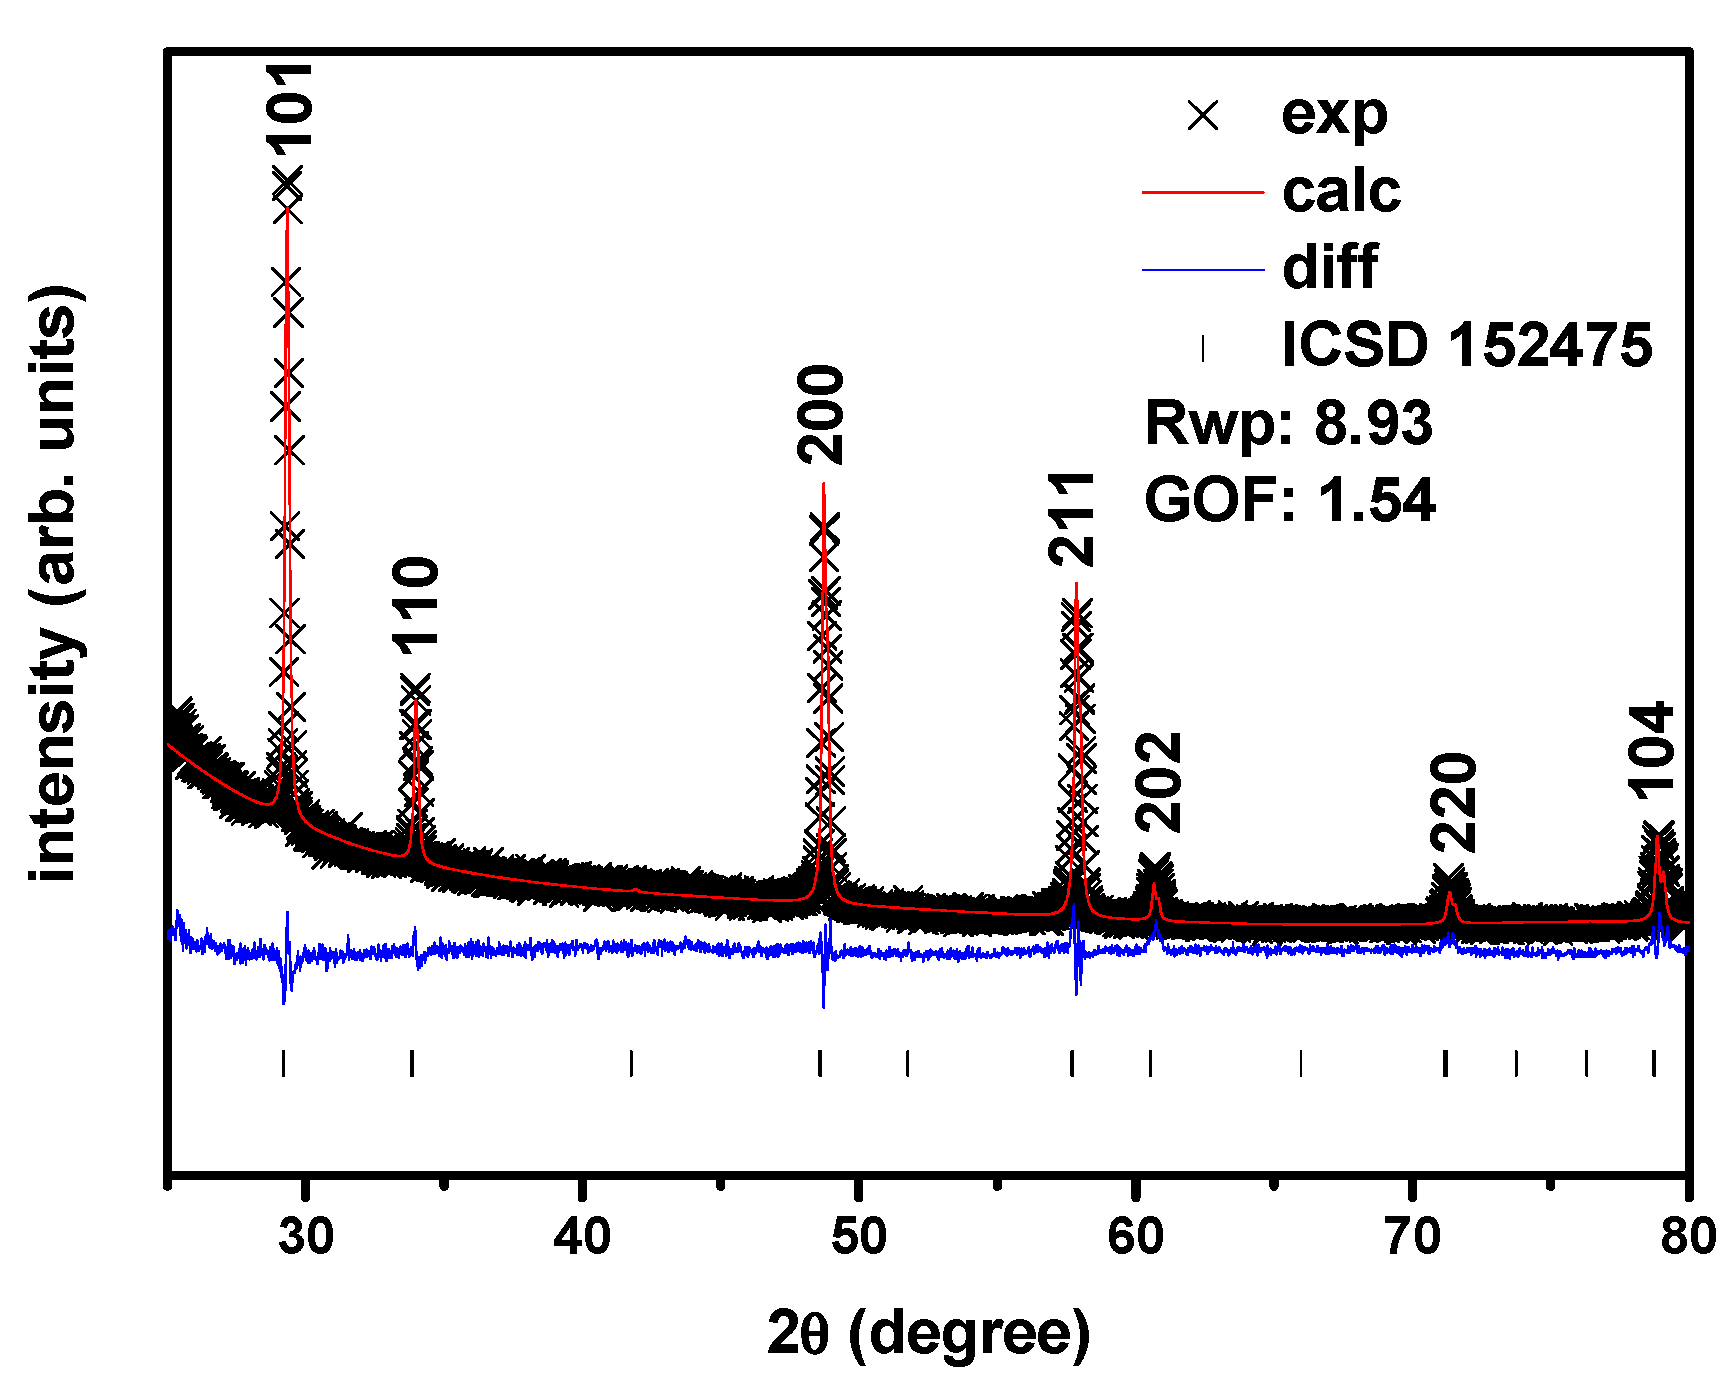
The typical X-ray diffraction peaks of 8YSZ and SDC20 are not present in the diffraction pattern of the quenched equimolar mixture, indicating that a new structural phase is formed, with the peak 2θ X-ray diffraction angles lying between the 8YSZ and SDC20. For example, the largest amplitude 111 reflections of SDC20 and 8YSZ have a peak maximum at 28.5° and 30.0°, respectively, while the corresponding quenched equimolar mixture peaks at 29.4°. The results of the Rietveld analysis are shown in
Figure 3. The solid solution of the two cubic fluorite phases belonging to yttria-stabilized zirconia and samaria-doped ceria has a new crystallographic structure, a single tetragonal phase. Moreover, the Bragg peaks are narrow, and no other peaks are detected.
3.2. Scanning Electron Microscopy
Figure 4 shows scanning electron microscopy images of the surfaces of the 8YSZ, SDC20 and equimolar 8YSZ + SDC20 mixture, quenched from 1500 °C, polished and thermally etched at 1400 °C.
3.3. Impedance Spectroscopy Analysis
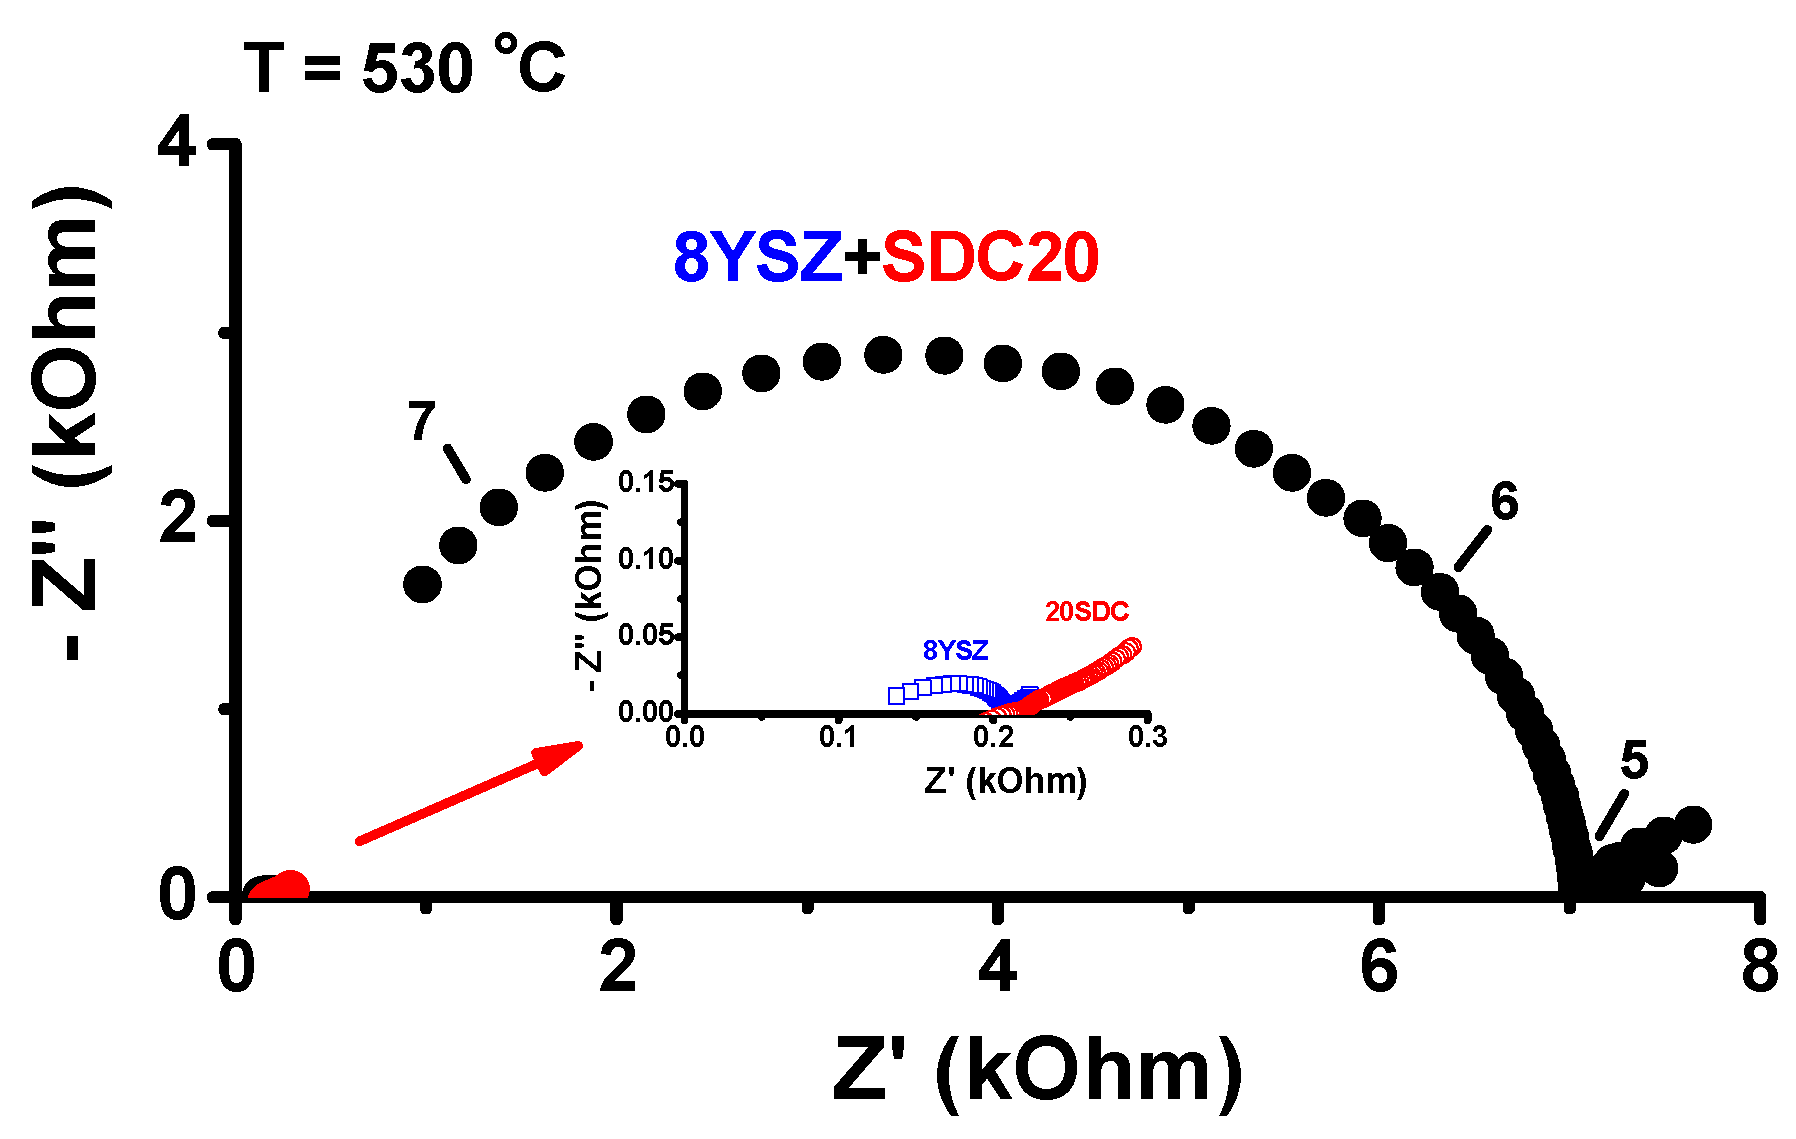
Impedance spectroscopy measurements were carried out in the three cold-pressed pellets quenched from 1500 °C to room temperature: 8YSZ, SDC20 and their equimolar mixture. The results are shown in
Figure 5.
The impedance diagrams measured at 530 °C show an interesting behavior: the frequency response of the impedance of the quenched equimolar sample presents only one semicircle in the 10
5–10
7 Hz frequency range, typical of a R//C component corresponding to the bulk contribution to the electrical resistivity, with R = 7.0 kOhm and C = 1.0 × 10
−12 F [
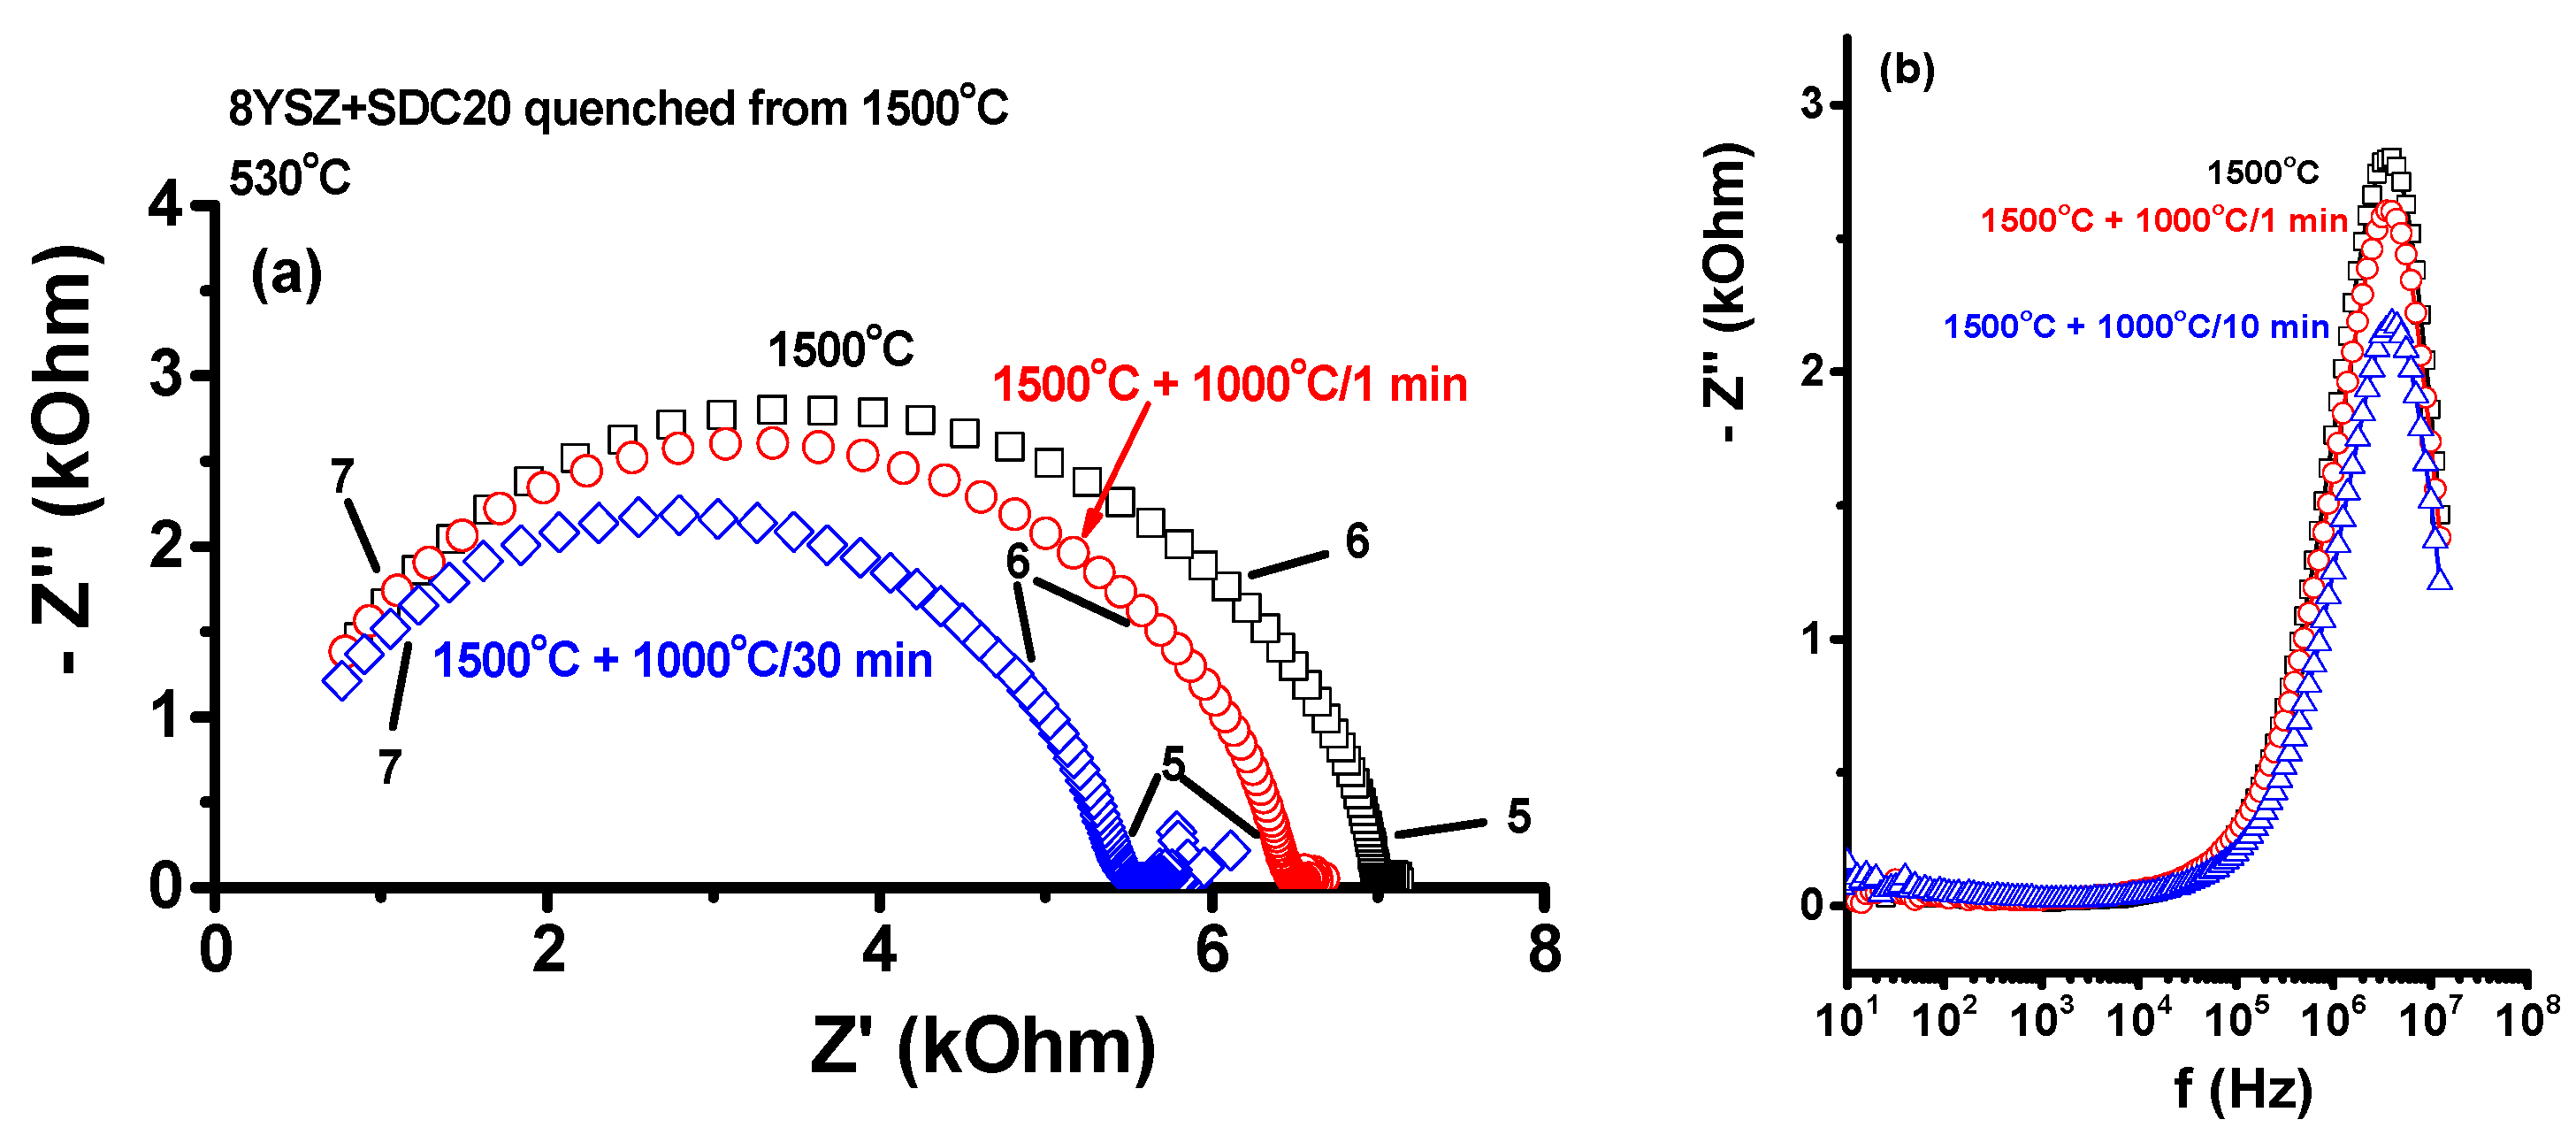
31]. Even though the electrical resistance is ~35 times higher than those of 8YSZ and SDC20 (~0.22 and ~0.21 kOhm, respectively), apparently there is no contribution from the interfaces, namely, grain boundaries. To check the possibility of annealing out the defects produced by stress in the bulk of the sample during the quenching process, impedance spectroscopy measurements were carried out in a sample quenched from 1500 °C with further heat treatments at 1000 °C. The pellets of the equimolar mixture quenched from 1500 °C were then heated to 1000 °C for different dwelling times (1 and 30 min) to relieve possible tensions caused by the quenching process. The impedance and the Bode diagrams of the quenched sample before and after 1000 °C annealing are shown in
Figure 6. A decrease of the total electric resistance from 7.0 kOhm to 5.5 kOhm is measured; both diagrams have a similar shape, with only one semicircle due to the bulk resistivity. The Bode diagrams of the imaginary component of the impedance are also plotted to ascertain that there is only one response corresponding to one semicircle in the impedance diagram.
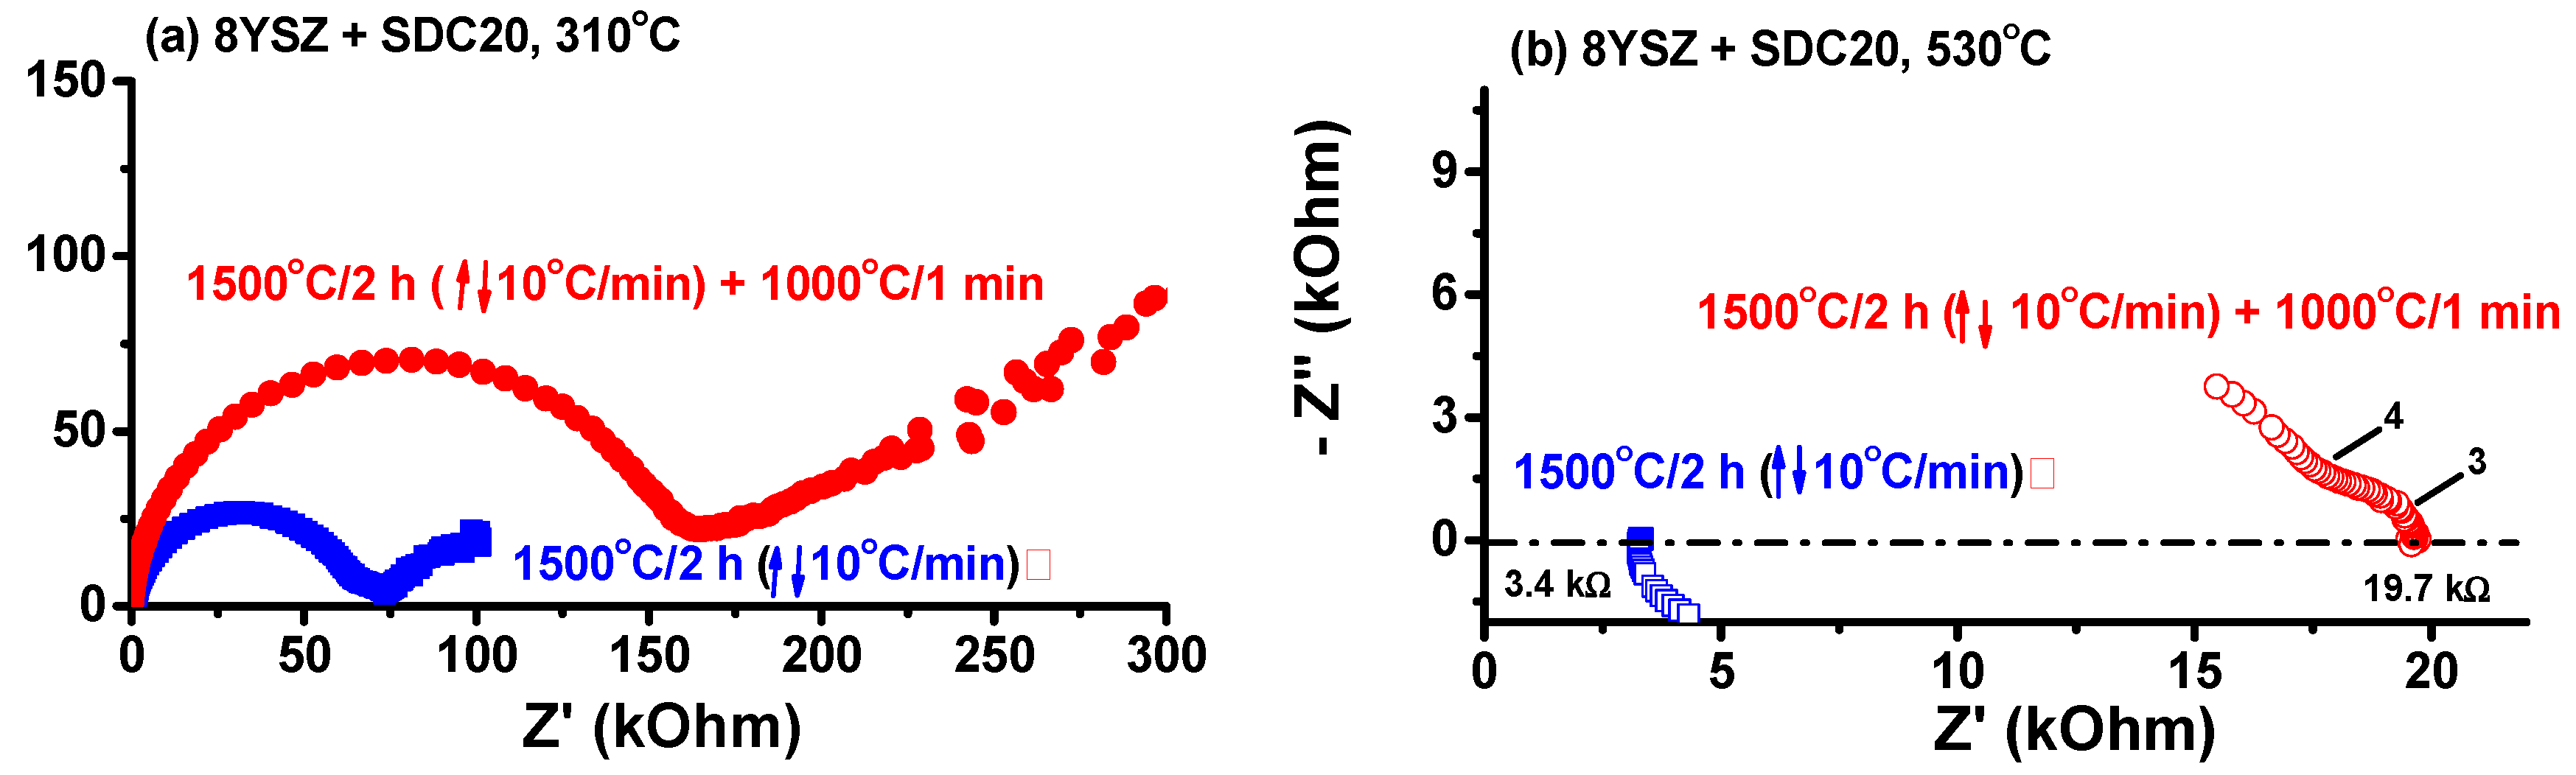
Another experiment was required to assess what happens to a non-quenched similar sample. Instead of quenching, an equimolar mixture of ZrO
2: 8 mol % Y
2O
3 + CeO
2: 20 mol % Sm
2O
3 was heated to 1500 °C/2 h with 10 °C/min heating and cooling rates. The impedance diagrams of this sample were measured at 310 °C and 530 °C, and are shown in
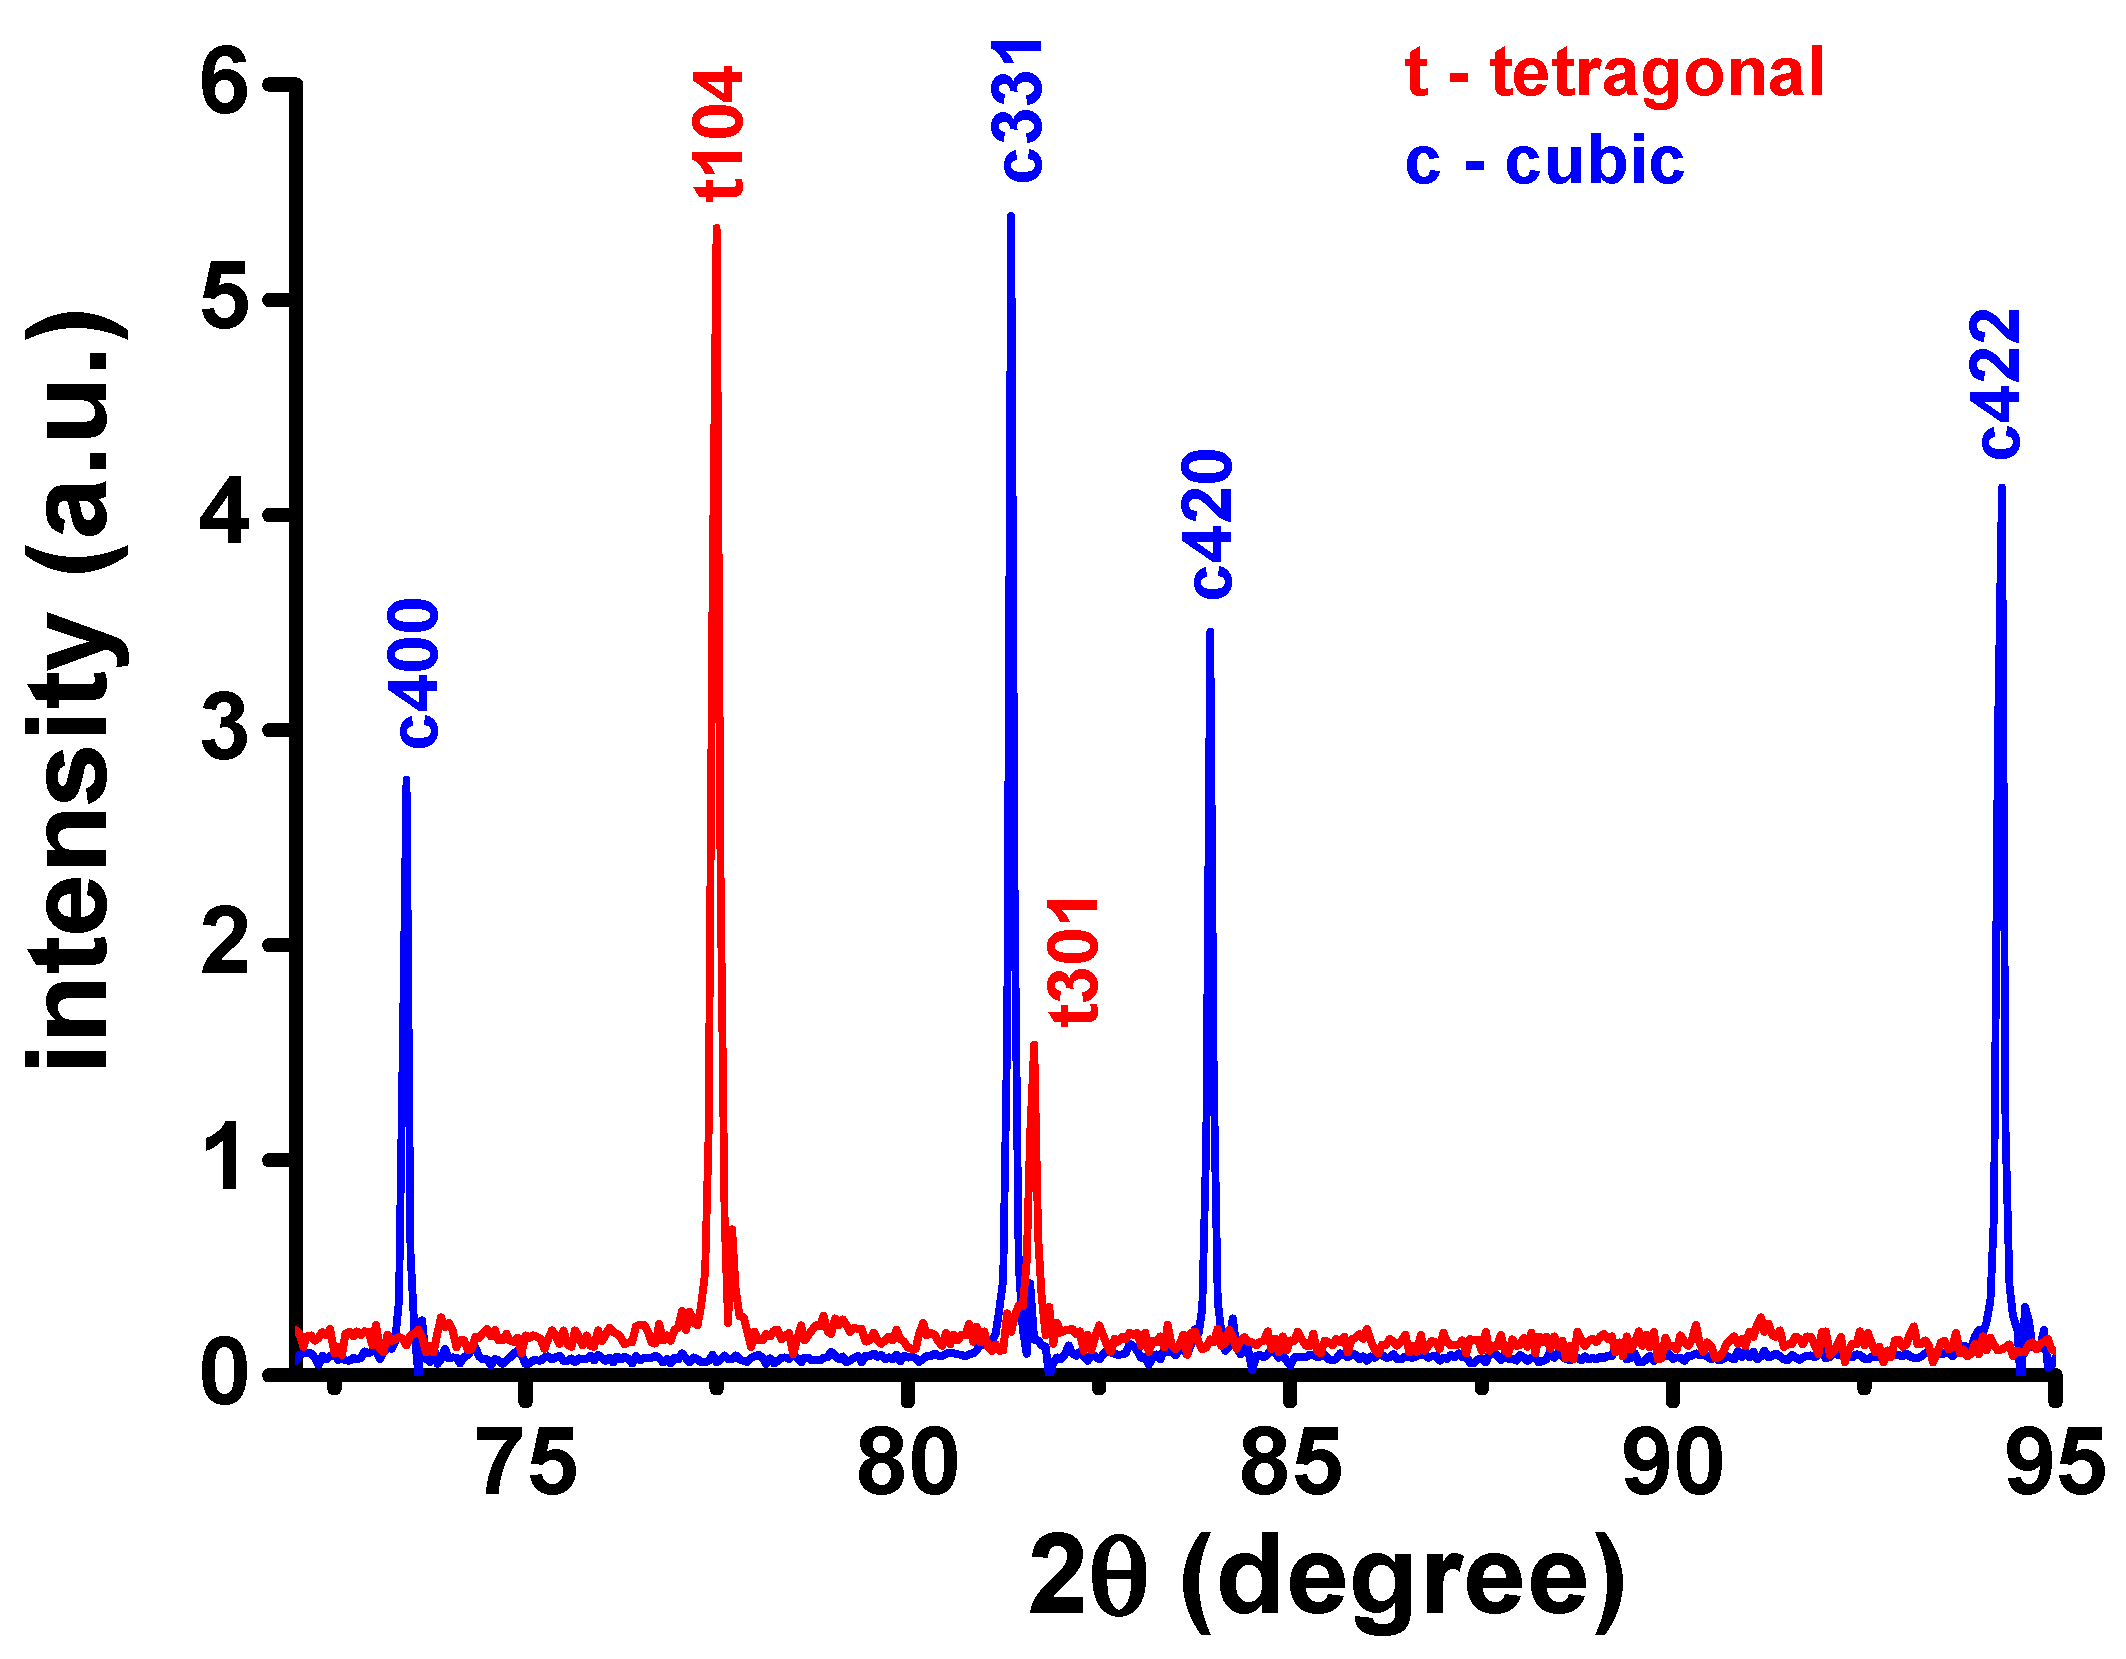
Figure 7. The total resistance measured at 310 °C (530 °C) is 74 kOhm (3.47 kOhm) for the sintered sample and 170 kOhm (19.7 kOhm) after further annealing at 1000 °C/1 min. As the increase of the electrical resistance could be due to destabilization of the tetragonal phase, X-ray diffraction experiments were carried out at the specimen before and after the 1000 °C annealing. The X-ray diffraction patterns of both specimens are shown in
Figure 8 in the 72–95° 2θ range. In this range, it is possible to distinguish unequivocally the reflections due to the cubic and the tetragonal phases (#30-1468 and #82-1245 JCPDS files).
4. Discussion
4.1. X-ray Diffraction Analysis
Quenching from 1200, 1300, 1400 and 1500 °C, the compacts of the equimolar mixture of zirconia: 8 mol % yttria and ceria: 20 mol % samaria shows the evolution of the two original cubic fluorite structures to a new structure. Moreover, the X-ray diffraction peaks are narrow, and no other peaks are detected. The Rietveld analysis,
Figure 3, shows that this phase is a cerium zirconate tetragonal phase, and are in agreement with the reports on oxidized pyrochlore equimolar cerium zirconate [
32,
33]. The identification of the four first peaks, from the left, with Miller indices was performed according to #152175 ICSD file [
34]; the remaining peaks were tentatively ascribed to known peaks of stabilized tetragonal zirconias.
4.2. Scanning Electron Microscopy
The FEG-SEM images of 8YSZ and SDC20 quenched from 1500 °C are apparently almost fully densified, presenting large (micron size) and small (submicron size) grains, respectively. The equimolar sample of the quenched sample, on the other hand, has wide distribution of micron size irregular grains, the large grains being stressed due to local tension to accommodate the new tetragonal phase.
4.3. Impedance Spectroscopy Analysis
High electrical resistances have already been observed in single-phase high-entropy fluorite oxides in comparison with 8YSZ [
8]. One may consider that at 1500 °C all impurities and dopants are diluted into the bulk of the samples, and quenching to room temperature may freeze that configuration; therefore, the blocking of oxide ions at the grain boundaries will decrease due to a reduced concentration of chemical species at the grain-to-grain interfaces. Chemical species are known to be accumulated or depleted at the interfaces, creating a space charge region, considered responsible for ion blocking, leading to the grain boundary resistivity detected in the impedance diagrams in conventionally sintered oxides [
29]. This means that after quenching from 1500 °C there is not enough accumulated or depleted charged chemical species at the interfaces, i.e., there is a decrease of the chemical potential due to those charged species at the space charge region. The configuration of defects achieved upon quenching is a metastable thermodynamic state at room temperature. Heating to 530 °C to collect the impedance spectroscopy data is not sufficient to destabilize that state, and the sample has a limited space charge region, with little or no blocking of oxide ions at the grain boundaries; the opposite situation may happen in samples slowly cooled (not quenched) to room temperature. Two main reasons may be responsible for the increase in total electrical resistivity of the quenched sample, comparing to those of the individual components: association of defects like (Y
Zr’ −V
O•• −Y
Zr’) and (Sm
Ce’ −V
O•• −Sm
Ce’), provided the oxygen vacancy-dopant association remains after the high temperature treatment, and/or micro-cracks produced by micro-tension created by the different thermal expansion coefficients of 8YSZ (9.80 × 10
−6 K
−1 [
35]) and SDC20 (12.6 × 10
−6 K
−1 [
36]), previously observed in the FEG-SEM micrographs (
Figure 4). Dissociation of those defects and relief of mechanical stresses could be accomplished by annealing at temperatures lower than 1500 °C. The quenched equimolar samples were then heat treated at 1000 °C for 1 min and 30 min, and slowly cooled down to room temperature. A decrease of the electrical resistivity is measured (
Figure 6).
Impedance spectroscopy analyses were carried out on equimolar ZrO
2: 8 mol % Y
2O
3 + CeO
2: 20 mol % Sm
2O
3 sintered at 1500 °C/2 h with 0.17 °C/s (10 °C/min) heating and cooling rates to compare with the impedance spectroscopy measurements in quenched samples. The behavior is the opposite of that observed in the quenched sample: there is an increase of the total electrical resistance, due to partial destabilization of the tetragonal phase, as indicated in
Figure 8 after measurements at 310 °C and 530 °C.
5. Conclusions
Quenching from 1500 °C, a compact composed of an equimolar mixture of 8 mol % yttria-stabilized zirconia and 20 mol % samarium-doped ceria, both having fluorite cubic structure, yielding a new compound with tetragonal structure, according to a detailed Rietveld analysis of the X-ray diffraction data. Even though the new compound had oxide ion resistivity higher than the starting compounds, it showed no blocking of oxide ions at the grain boundaries, suggesting that quenching inhibited the accumulation or depletion of charged chemical species into the grain boundaries, avoiding the formation of a space charge region at the interfaces. Improvement of the total electrical conductivity was achieved by heating the quenched samples to 1000 °C, which probably caused the relief of micro-tension produced during quenching. Similarly, non-quenched specimens, on the other hand, showed blocking of oxide ions at the grain boundaries and a decrease in the total electrical conductivity after heat treating at 1000 °C, ascribed (and confirmed) to change in the structural phase.
Author Contributions
R.M., D.Z.d.F. and E.N.S.M. conceived, designed, performed the experiments and wrote the paper.
Funding
CNEN, CNPq (Procs. 470952/2013-0, 303483/2013-0 and 311803/2015-6), and FAPESP (CEPID-CDMF Proc. 2013/07296-2).
Acknowledgments
To CEM (Federal University of ABC) for the Topas software availability. One of the authors (R.M.) is grateful to Federal University of ABC for the Senior Visiting Researcher fellowship.
Conflicts of Interest
The authors declare no conflict of interest. The founding sponsors had no role in the design of the study; in the collection, analyses, or interpretation of data; in the writing of the manuscript, and in the decision to publish the results.
References
- Ye, Y.F.; Wang, Q.; Lu, J.; Liu, C.T.; Yang, Y. Design of high entropy alloys: A single-parameter thermodynamic rule. Scr. Mater. 2015, 104, 53–55. [Google Scholar] [CrossRef]
- Ye, Y.F.; Liu, C.T.; Yang, Y. A geometric model for intrinsic residual strain and phase stability in high entropy alloys. Acta Mater. 2015, 94, 152–161. [Google Scholar] [CrossRef]
- Zhang, Y.; Zuo, T.T.; Tang, Z.; Gao, M.C.; Dahmen, K.A.; Liaw, P.K.; Lu, Z.P. Microstructures and properties of high-entropy alloys. Prog. Mater. Sci. 2014, 61, 1–93. [Google Scholar] [CrossRef]
- Tsai, M.-H.; Yeh, J.-W. High-Entropy Alloys: A Critical Review. Mater. Res. Lett. 2014, 2, 107–123. [Google Scholar] [CrossRef]
- Host, C.M.; Sachet, E.; Borman, T.; Moballegh, A.; Dickey, E.C.; Hou, D.; Jones, J.L.; Curtarolo, S.; Maria, J.-P. Entropy-stabilized oxides. Nat. Commun. 2015, 6, 8485. [Google Scholar] [CrossRef]
- Bérardan, D.; Franger, S.; Dragoe, D.; Meena, A.K.; Dragoe, N. Colossal dielectric constant in high entropy oxides. Phys. Status Solidi-RRL 2016, 10, 328–333. [Google Scholar] [CrossRef]
- Bérardan, D.; Franger, S.; Meena, A.K.; Dragoe, N. Room temperature lithium superionic conductivity in high entropy oxides. J. Mater. Chem. A 2016, 4, 9536–9541. [Google Scholar] [CrossRef]
- Gild, J.; Samiee, M.; Braun, J.L.; Harrington, T.; Vega, H.; Hopkins, P.E.; Vecchio, K.; Luo, J. High-entropy fluorite oxides. J. Eur. Ceram. Soc. 2018, 38, 3578–3584. [Google Scholar] [CrossRef]
- Sarkar, A.; Djenadic, R.; Wang, D.; Hein, C.; Kautenburger, R.; Clemens, O.; Hahn, H. Rare earth and transition metal based entropy stabilised perovskite type oxides. J. Eur. Ceram. Soc. 2018, 38, 2318–2327. [Google Scholar] [CrossRef]
- Djenadic, R.; Sarkar, A.; Clemens, O.; Loho, C.; Botros, M.; Chakravadhanula, V.S.K.; Kubel, C.; Bhattacharya, S.S.; Gandhif, A.S.; Hahn, H. Multicomponent equiatomic rare earth oxides. Mater. Res. Lett. 2017, 5, 102–109. [Google Scholar] [CrossRef]
- Dabrowa, J.; Stygar, M.; Mikuła, A.; Knapik, A.; Mroczka, K.; Tejchman, W.; Danielewski, M.; Martin, M. Synthesis and microstructure of the (Co,Cr,Fe,Mn,Ni)3O4 high entropy oxide characterized by spinel structure. Mater. Lett. 2018, 216, 32–36. [Google Scholar] [CrossRef]
- Jiang, S.; Hu, T.; Gild, J.; Zhou, N.; Nie, J.; Qin, M.; Harrington, T.; Vecchio, K.; Luo, J. A new class of high-entropy perovskite oxides. Scr. Mater. 2018, 142, 116–120. [Google Scholar] [CrossRef]
- Minh, N.Q. Ceramic fuel cells. J. Am. Ceram. Soc. 1993, 76, 563–588. [Google Scholar] [CrossRef]
- Goodenough, J.B. Oxide-ion electrolytes. Annu. Rev. Mater. Res. 2003, 33, 91–128. [Google Scholar] [CrossRef]
- Ormerod, R.M. Solid oxide fuel cells. Chem. Soc. Rev. 2003, 32, 17–28. [Google Scholar] [CrossRef] [PubMed]
- Minh, N.Q. Solid oxide fuel cell technology-features and applications. Solid State Ion. 2004, 174, 271–277. [Google Scholar] [CrossRef]
- Holtappels, P.; Vogt, U.; Graule, T. Ceramic materials for advanced solid oxide fuel cells. Adv. Eng. Mater. 2005, 7, 292–302. [Google Scholar] [CrossRef]
- Steele, B.C.H. Appraisal of Ce1-yGdyO2-y/2 electrolytes for IT-SOFC operation at 500 degree C. Solid State Ion. 2000, 129, 95–110. [Google Scholar] [CrossRef]
- Brandon, N.P.; Skinner, S.; Steele, B.C.H. Recent advances in materials for fuel cells. Annu. Rev. Mater. Res. 2003, 33, 183–213. [Google Scholar] [CrossRef]
- Lee, K.T.; Yoon, H.S.; Wachsman, E.D. The evolution of low temperature solid oxide fuel cells. J. Mater. Res. 2012, 27, 2063–2078. [Google Scholar] [CrossRef]
- Patakangas, J.; Ma, Y.; Jing, Y.F.; Lund, P. Review and analysis of characterization methods and ionic conductivities for low-temperature solid oxide fuel cells (LT-SOFC). J. Power Sources 2014, 263, 315–331. [Google Scholar] [CrossRef]
- Maier, J. Space charge regions in solid two phase systems and their conduction contribution—II contact equilibrium at the Interface of two ionic conductors and the related conductivity effect. Ber. Bunsenges Phys. Chem. 1985, 89, 355–362. [Google Scholar] [CrossRef]
- Maier, J. Ionic-conduction in space charge regions. Prog. Solid State Chem. 1995, 23, 171–263. [Google Scholar] [CrossRef]
- Guo, X.; Maier, J. Grain boundary blocking effect in zirconia: A Schottky barrier analysis. J. Electrochem. Soc. 2001, 148, E121–E126. [Google Scholar] [CrossRef]
- Guo, X.; Sigle, W.; Fleig, J.; Maier, J. Role of space charge in the grain boundary blocking effect in doped zirconia. Solid State Ion. 2002, 154, 555–561. [Google Scholar] [CrossRef]
- Lubomirsky, I.; Fleig, J.; Maier, J. Modeling of space charge effects in nanocrystalline ceramics: the influence of geometry. J. Appl. Phys. 2002, 92, 6819–6827. [Google Scholar] [CrossRef]
- Guo, X.; Waser, R. Electrical properties of the grain boundaries of oxygen ion conductors: acceptor-doped zirconia and ceria. Prog. Mater. Sci. 2006, 51, 151–210. [Google Scholar] [CrossRef]
- Shirpour, M.; Rahmati, B.; Sigle, W.; van Aken, P.A.; Merkle, R.; Maier, J. Dopant segregation and space charge effects in proton-conducting BaZrO3 perovskites. J. Phys. Chem. C 2012, 116, 2453–2461. [Google Scholar] [CrossRef]
- Gregori, G.; Merkle, R.; Maier, J. Ion conduction and redistribution at grain boundaries in oxide systems. Prog. Mater. Sci. 2017, 89, 252–305. [Google Scholar] [CrossRef]
- Kleitz, M.; Kennedy, J.H. Resolution of multicomponent impedance diagrams. In Fast Ion Transport in Solids; Mundy, J.N., Shenoy, G.K., Vashishta, P., Eds.; Elsevier: North Holland, The Netherlands, 1979; pp. 185–188. ISBN 10: 0444003533. [Google Scholar]
- Fletcher, J.G.; West, A.R.; Irvine, J.T.S. The AC Impedance response of the physical interface between yttria-stabilized zirconia and YBa2Cu3O7-x. J. Electrochem. Soc. 1995, 142, 2650–2654. [Google Scholar] [CrossRef]
- Otobe, H.; Nakamura, A.; Yamashita, T.; Minato, K. Oxygen potential and defect structure of oxygen-excess pyrochlore Ce2Zr2O7+x. J. Phys. Chem. Solids 2005, 66, 329–334. [Google Scholar] [CrossRef]
- Urban, S.; Dolcet, P.; Möller, M.; Chen, L.; Klar, P.J.; Djerdj, I.; Gross, S.; Smarsly, B.M.; Over, H. Synthesis and full characterization of the phase-pure pyrochlore Ce2Cr2O7 and the K-Ce2Zr2O8 phases. Appl. Cataly. B Environ. 2016, 197, 23–34. [Google Scholar] [CrossRef]
- Lamas, D.G.; Fuentes, R.O.; Fábregas, I.O.; Fernández de Rapp, M.E.; Lascalea, G.E.; Casanova, J.R.; Walsoe de Reca, N.E.; Craievich, A.F. Synchrotron X-ray diffraction study of the tetragonal–cubic phase boundary of nanocrystalline ZrO2–CeO2 synthesized by a gel-combustion process. J. Appl. Crystallogr. 2005, 38, 867–873. [Google Scholar] [CrossRef]
- Montross, C.S.; Yokokawa, H.; Dokiya, M. Thermal stresses in planar solid oxide fuel cells due to thermal expansion differences. Brit. Ceram. Trans. 2002, 101, 85–93. [Google Scholar] [CrossRef]
- Zheng, Y.; Zhou, M.; Ge, L.; Li, S.; Chen, H.; Guo, L. Effect of Dy on the properties of Sm-doped ceria electrolyte for IT-SOFCs. J. Alloys Compd. 2011, 509, 1244–1248. [Google Scholar] [CrossRef]
© 2018 by the authors. Licensee MDPI, Basel, Switzerland. This article is an open access article distributed under the terms and conditions of the Creative Commons Attribution (CC BY) license (http://creativecommons.org/licenses/by/4.0/).


