1. Introduction
Development of alternative environmentally friendly energy sources is an important issue today. Use of solar panels for electricity generation appears to be one of the most promising solutions. Owing to advanced development of silicon technologies, relatively low-cost Si solar cells are currently the most widely used. However conversion efficiency is limited to ~30% due to spectral mismatch [
1]. This value can be increased by conversion of the UV and IR light coming from the Sun into a light range more suitable for these solar cells. Infrared photons can be converted into more energetic ones using up-conversion [
2,
3]. Higher energy photons can be transformed into the optimal absorption region using down-shifting or down-conversion (also known as quantum cutting) processes. The latter mechanism is preferable, since it implies conversion of one high energy photon into two photons of optimal energies, resulting in a theoretical quantum efficiency of 200%.
Down-conversion can be realized using a pair of REE [
3]. Here, the Yb
3+ ion serves as a perfect acceptor ion, since its emission is well matched with the c-Si solar cell energy gap. Moreover, issues associated with excited-state absorption, up-conversion and concentration quenching can be eliminated due to the presence of only one excited 4f manifold in the ion, allowing the use of high doping concentrations. Down-conversion was demonstrated for different REE-Yb
3+ pairs in [
2] and references therein, where REE can be Ce
3+, Pr
3+, Eu
3+, Ho
3+, Tm
3+, and Tb
3+. Also, it was shown that quantum cutting can be obtained in Tb-Yb co-doped materials [
4,
5,
6,
7]. The quantum efficiency of the cooperative energy transfer from single Tb
3+ to two Yb
3+ ions observed experimentally can be as high as 196% [
8].
Choice of the host material is a very important parameter for the potential practical applications. Sol-gel derived ZrO
2-SiO
2 glasses are a good candidate in this case; lower phonon energies as compared to pure SiO
2 glass can lead to higher quantum efficiency (QE) of the REE emission, and use of the sol-gel process allows the acquisition of a variety of chemical compositions with up to 50 mol. % ZrO
2 [
9], which is not possible using classic high temperature melt techniques. These glasses possess good corrosion resistance and a low thermal expansion coefficient, which are important for outdoor applications. As an additional benefit these glasses can be easily crystallized under heat treatment, forming glass ceramics with embedded ZrO
2 crystals. Visible to near-infrared (NIR) down-conversion has been demonstrated for Tb and Yb doped nanocrystalline ZrO
2 [
10]. Thus, devitrification of the glasses could lead to more luminescence efficient GC materials since emission QE of crystalline materials is typically higher, as has been successfully demonstrated for silica-hafnia glass ceramics [
5,
11] or Eu doped aluminosilicate glasses [
12]. Metal-silicate systems, where the metal can be Zr, Hf, Y or La, deserve special attention here since these materials are particularly suitable for decomposition into a metal- and silica-rich phases in a quite broad range of SiO
2 content [
13], which affects the crystallization behavior [
14]. Moreover, HfO
2-SiO
2 system and ZrO
2-SiO
2 system phase diagrams are very similar [
15,
16], having the middle of their miscibility gap at approximately 30 mol. % of the metal oxide content [
13]. Therefore it can be expected, that 30ZrO
2-70SiO
2 based materials will obtain GC materials with optical performances similar to previously demonstrated 30HfO
2-70SiO
2 based glass ceramics [
5,
11].
2. Materials and Methods
In the present study 30ZrO
2-70SiO
2 glasses and glass ceramic materials doped solely with 1 mol % Tb
2O
3 or with 1 mol % Tb
2O
3 and 10 mol. % Yb
2O
3 were investigated. First, the gels were synthesized following a standard procedure described in [
9,
14,
17], using zirconium(IV) isopropoxide, tetraethyl orthosilicate, and terbium and ytterbium chloride hexahydrate as the raw components. Then, the gels were heat treated at different temperatures for different periods of time: 700 °C for 7 h, and at 1000 and 1100 °C for 2, 5, 10 and 30 hours for both the temperatures. The bulk samples with an approximate size of 5 mm × 5 mm × 1 mm were obtained after the treatment. The notation “
T/t”, where “T” and “t” are temperature and time of the heat-treatment is used within the manuscript, e.g.,
700/7 is used for the sample treated at 700 °C for 7 hours. The doping is identified within the text with additional suffixes: Tb and Tb-Yb are referred to as Tb-only and Tb-Yb co-doped samples, respectively.
Fluorescence spectroscopy characterization was performed using a UV-Vis-NIR fluorometer equipped with TSCPS system (Fluorolog 3, Horiba Scientific, Edison, NJ, USA) with 450 W CW and 70 W pulsed Xe-lamps as the excitation source for steady state and time-resolved experiments, respectively. Time response of the experimental setup was limited by the lamp (~1 µs).
Structural characterization of the samples was performed using Raman spectroscopy, which distinguishes different ZrO2 phases more easily compared to X-Ray diffraction (XRD). Raman mapping was performed using a Raman microscope (Nicolet Almega XR, Thermo Fischer Scientific, Waltham, MA, USA). Under the excitation with a 532 nm laser, the Raman signal does not interfere with the luminescence of the REE. Additional XRD characterization was done for Tb-Yb co-doped 1100 °C treated samples using the Kristalloflex D500 system (Siemens AG, Karlsruhe, Germany).
In this study, the Raman microscope was also used as a confocal fluorescence microscope. The Almega XR Raman microscope with a 780 nm laser was used as an excitation source to directly map excited Yb
3+ luminescence whereas a modular Raman-spectrometer based on a monochromator (iHR 320, Horiba Scientific, Edison, NJ, USA), 488 nm laser (Sapphire SF 488, Coherent, CA, USA) and equipped with an XY-stage (based on the ARABICA experimental setup, described in detail in [
18]) was used for micro characterization of directly excited Tb
3+ emission and indirectly excited Yb
3+ luminescence. All maps obtained on the different equipment have a similar lateral spatial resolution of about 1 μm.
3. Results and Discussion
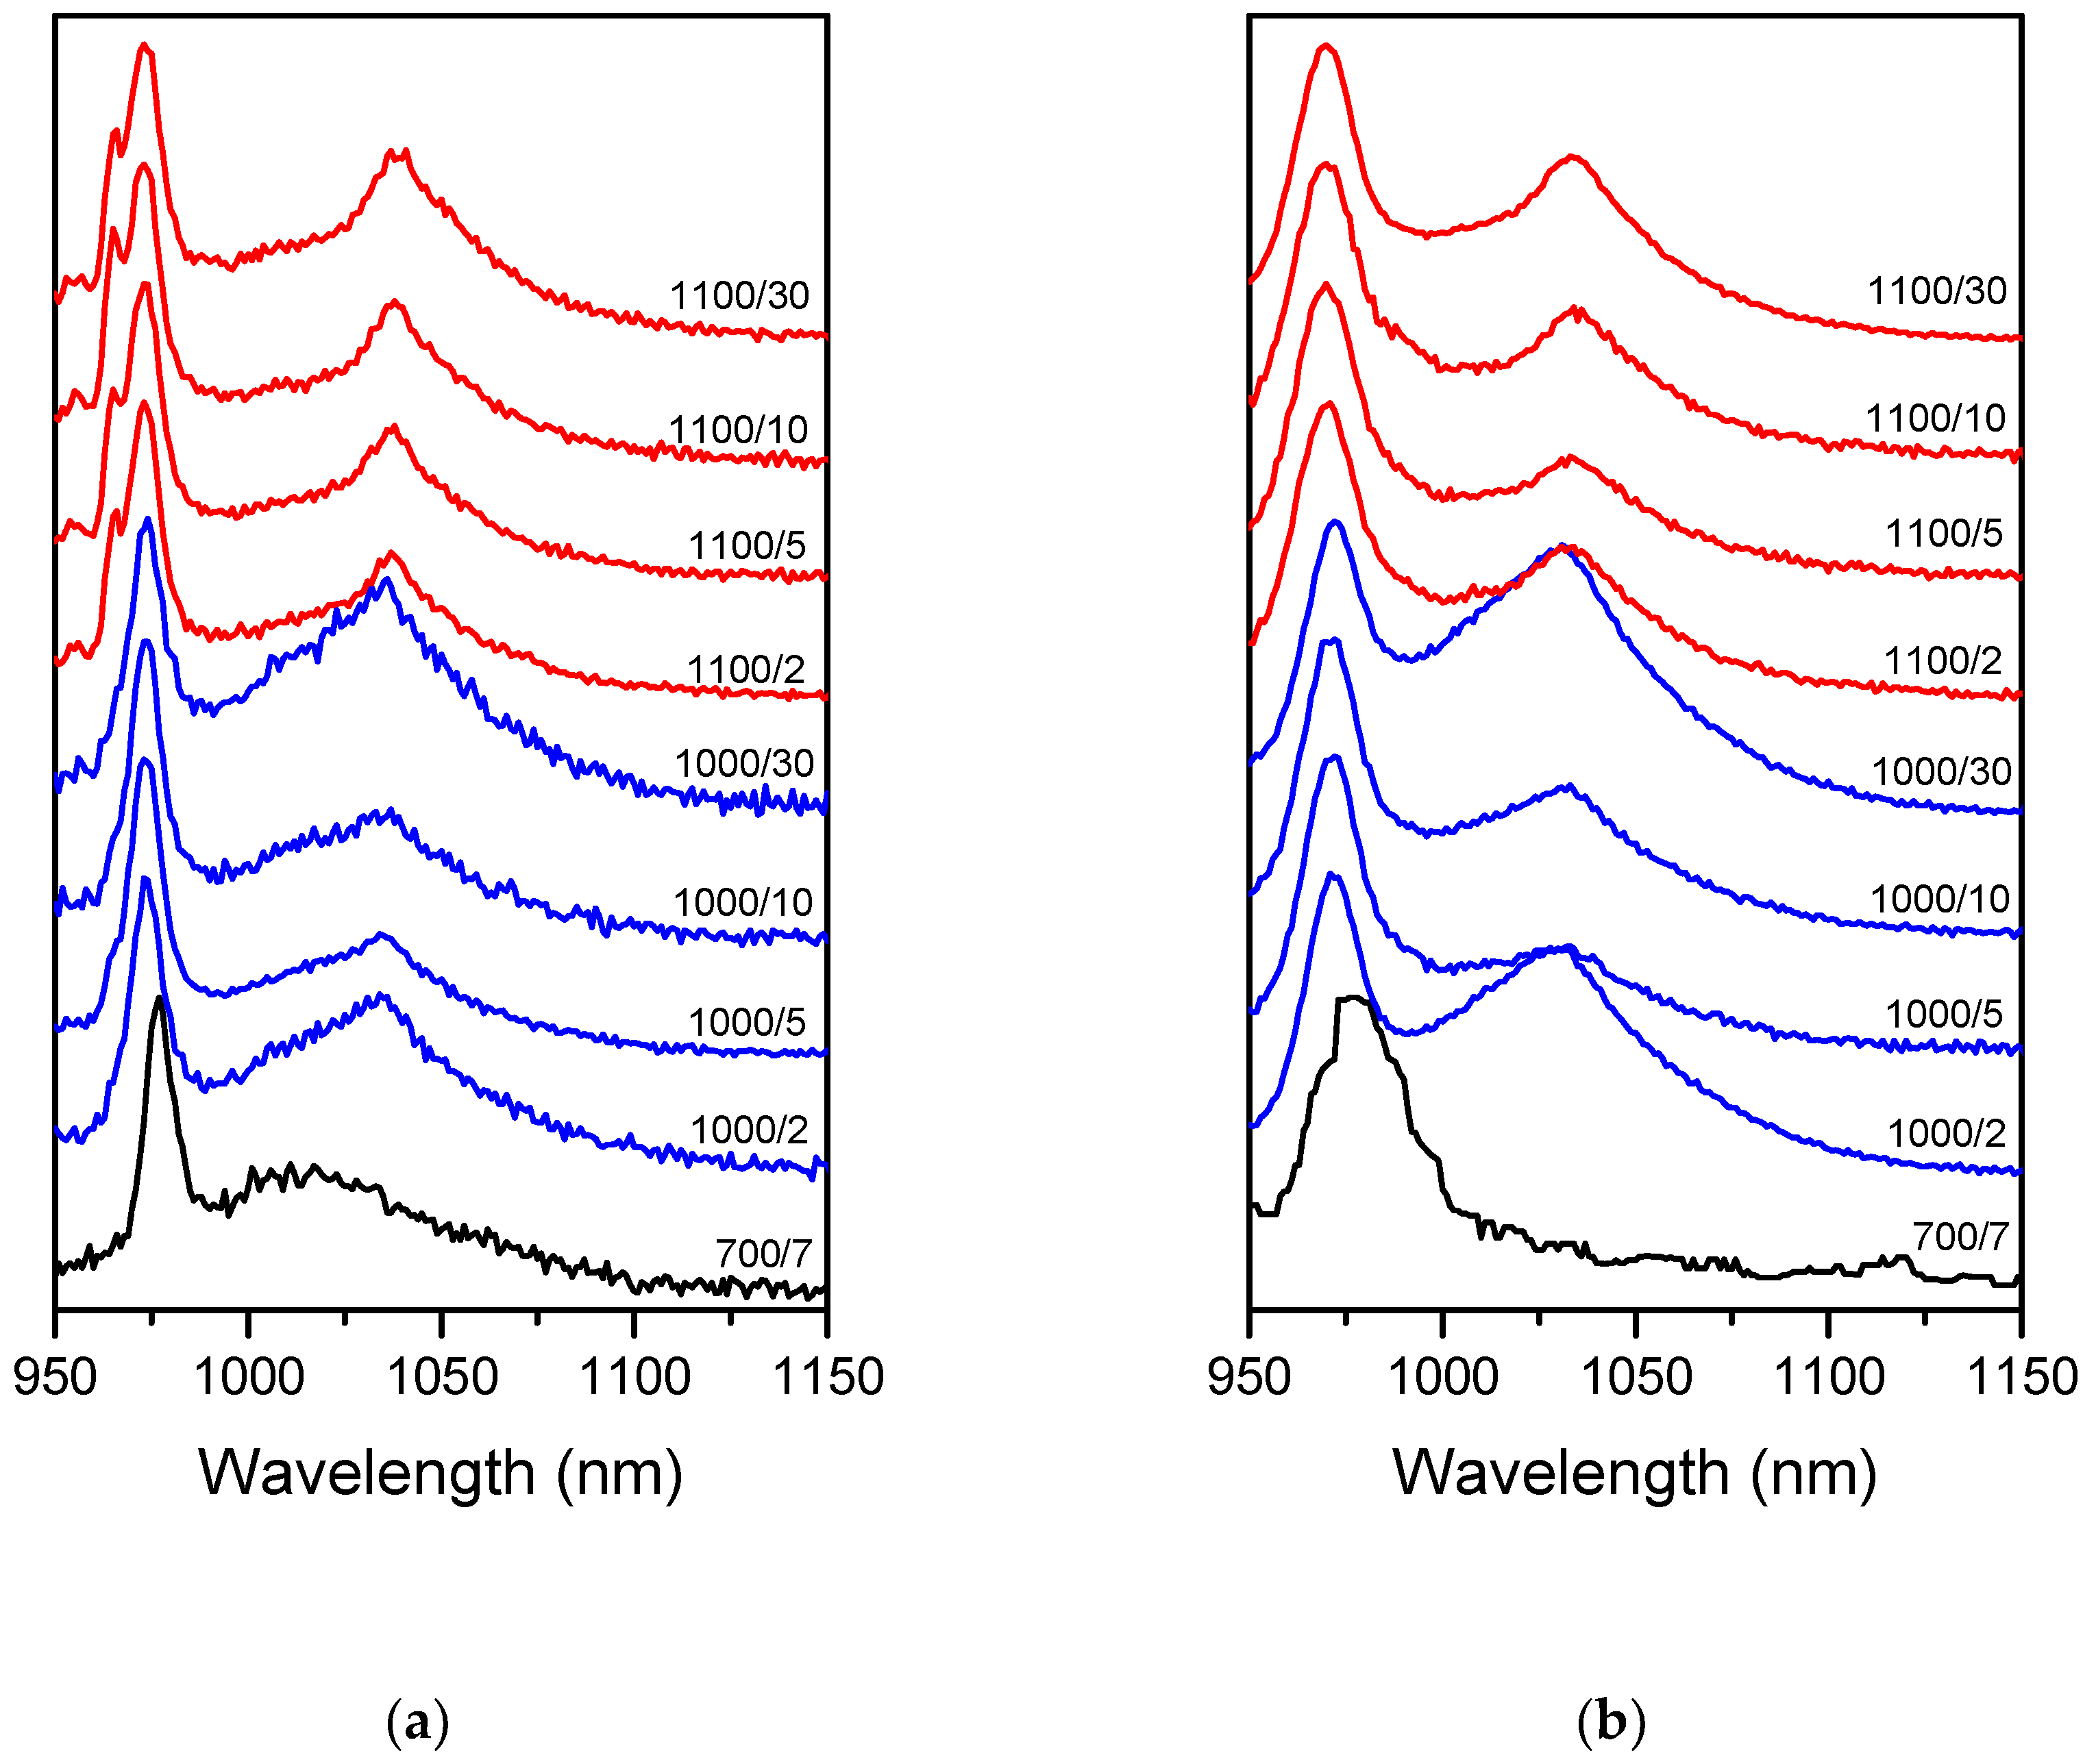
All the samples possessed the NIR luminescence emitted by Yb
3+ under the direct excitation of this ion with λ
ex = 920 nm (
Figure 1a). The higher the temperature and the longer the time of the treatment, the greater the observed changes in Yb
3+ luminescence as compared to
700/7 Tb-Yb sample. Additional sharp bands appeared at 955, 965 and 1035–1038 nm whereas the main band shifted from 976 to 974 nm. These changes were the greatest in the samples treated at 1100 °C for 10 and 30 h. It showed that Yb
3+ occupied additional sites with different environments. For all the samples, Tb→Yb energy transfer was observed and the Yb
3+ NIR luminescence was detected under 488 nm excitation (
Figure 1b). The luminescence spectra observed in this case were found to be similar to the directly excited (λ
ex = 920 nm). As one can see in
Figure 1a,b, only between
700/7 samples the spectra differ significantly with change of the excitation wavelength. The noticeable difference between direct and indirect excitation emission spectra are due to the lower spectrometer resolution used with excitation at 488 nm.
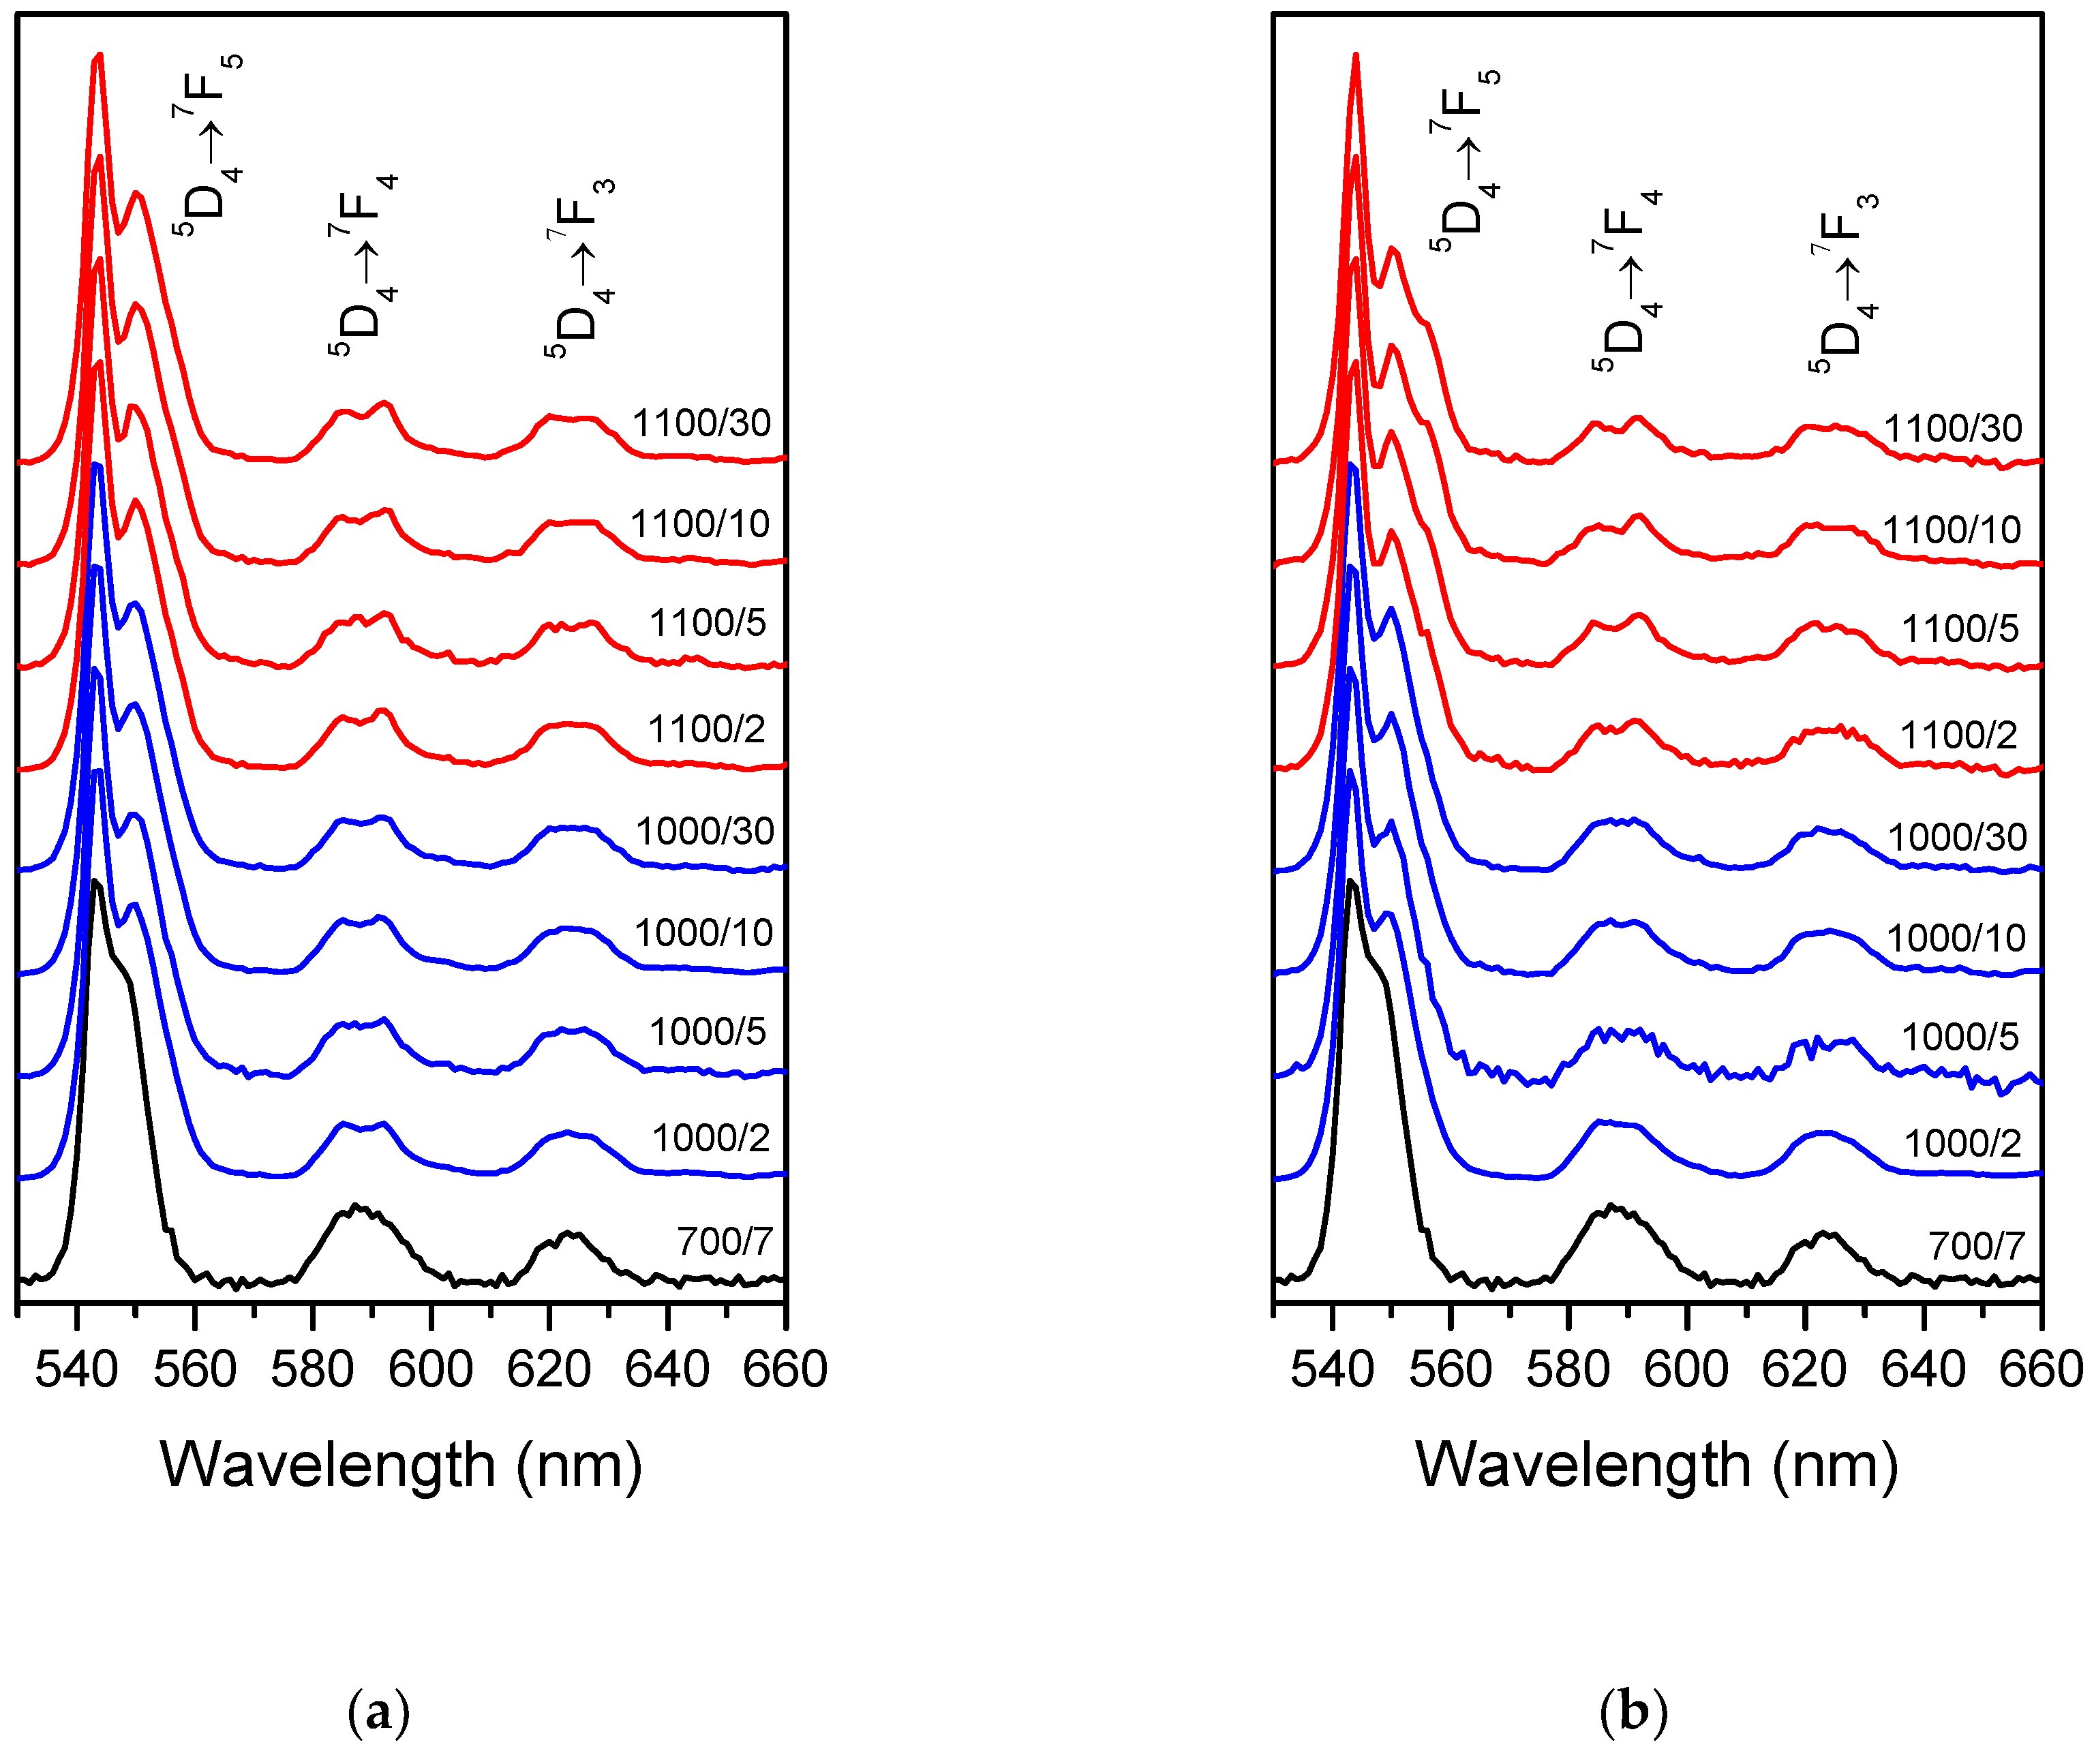
The samples obtained possessed visible luminescence originating from the Tb
3+ ion. As was shown before for Yb
3+ emission, Tb
3+ spectra also evolve with treatment temperature and time (
Figure 2a and 2b for Tb and Tb-Yb doped samples, respectively). At least two Stark sub-components became visible for
5D
4→
7F
5 and
5D
4→
7F
4 transitions after the treatment at 1000 and 1100 °C, evidencing formation of new Tb
3+ sites with different strength and symmetry of the crystal field around the ions. Moreover, small differences could be seen between Tb (
Figure 2a) and Tb-Yb doped (
Figure 2b) samples treated at 1100 °C. In the case of Tb-Yb samples, the emission spectra were more resolved and after 30 hours, three components were clearly visible for
5D
4→
7F
5 transition whereas only two could be distinguished with the naked eye for the Tb-only doped sample. Thus, even with the same thermal history of the samples, co-doping with Yb
3+ influenced Tb
3+ environment.
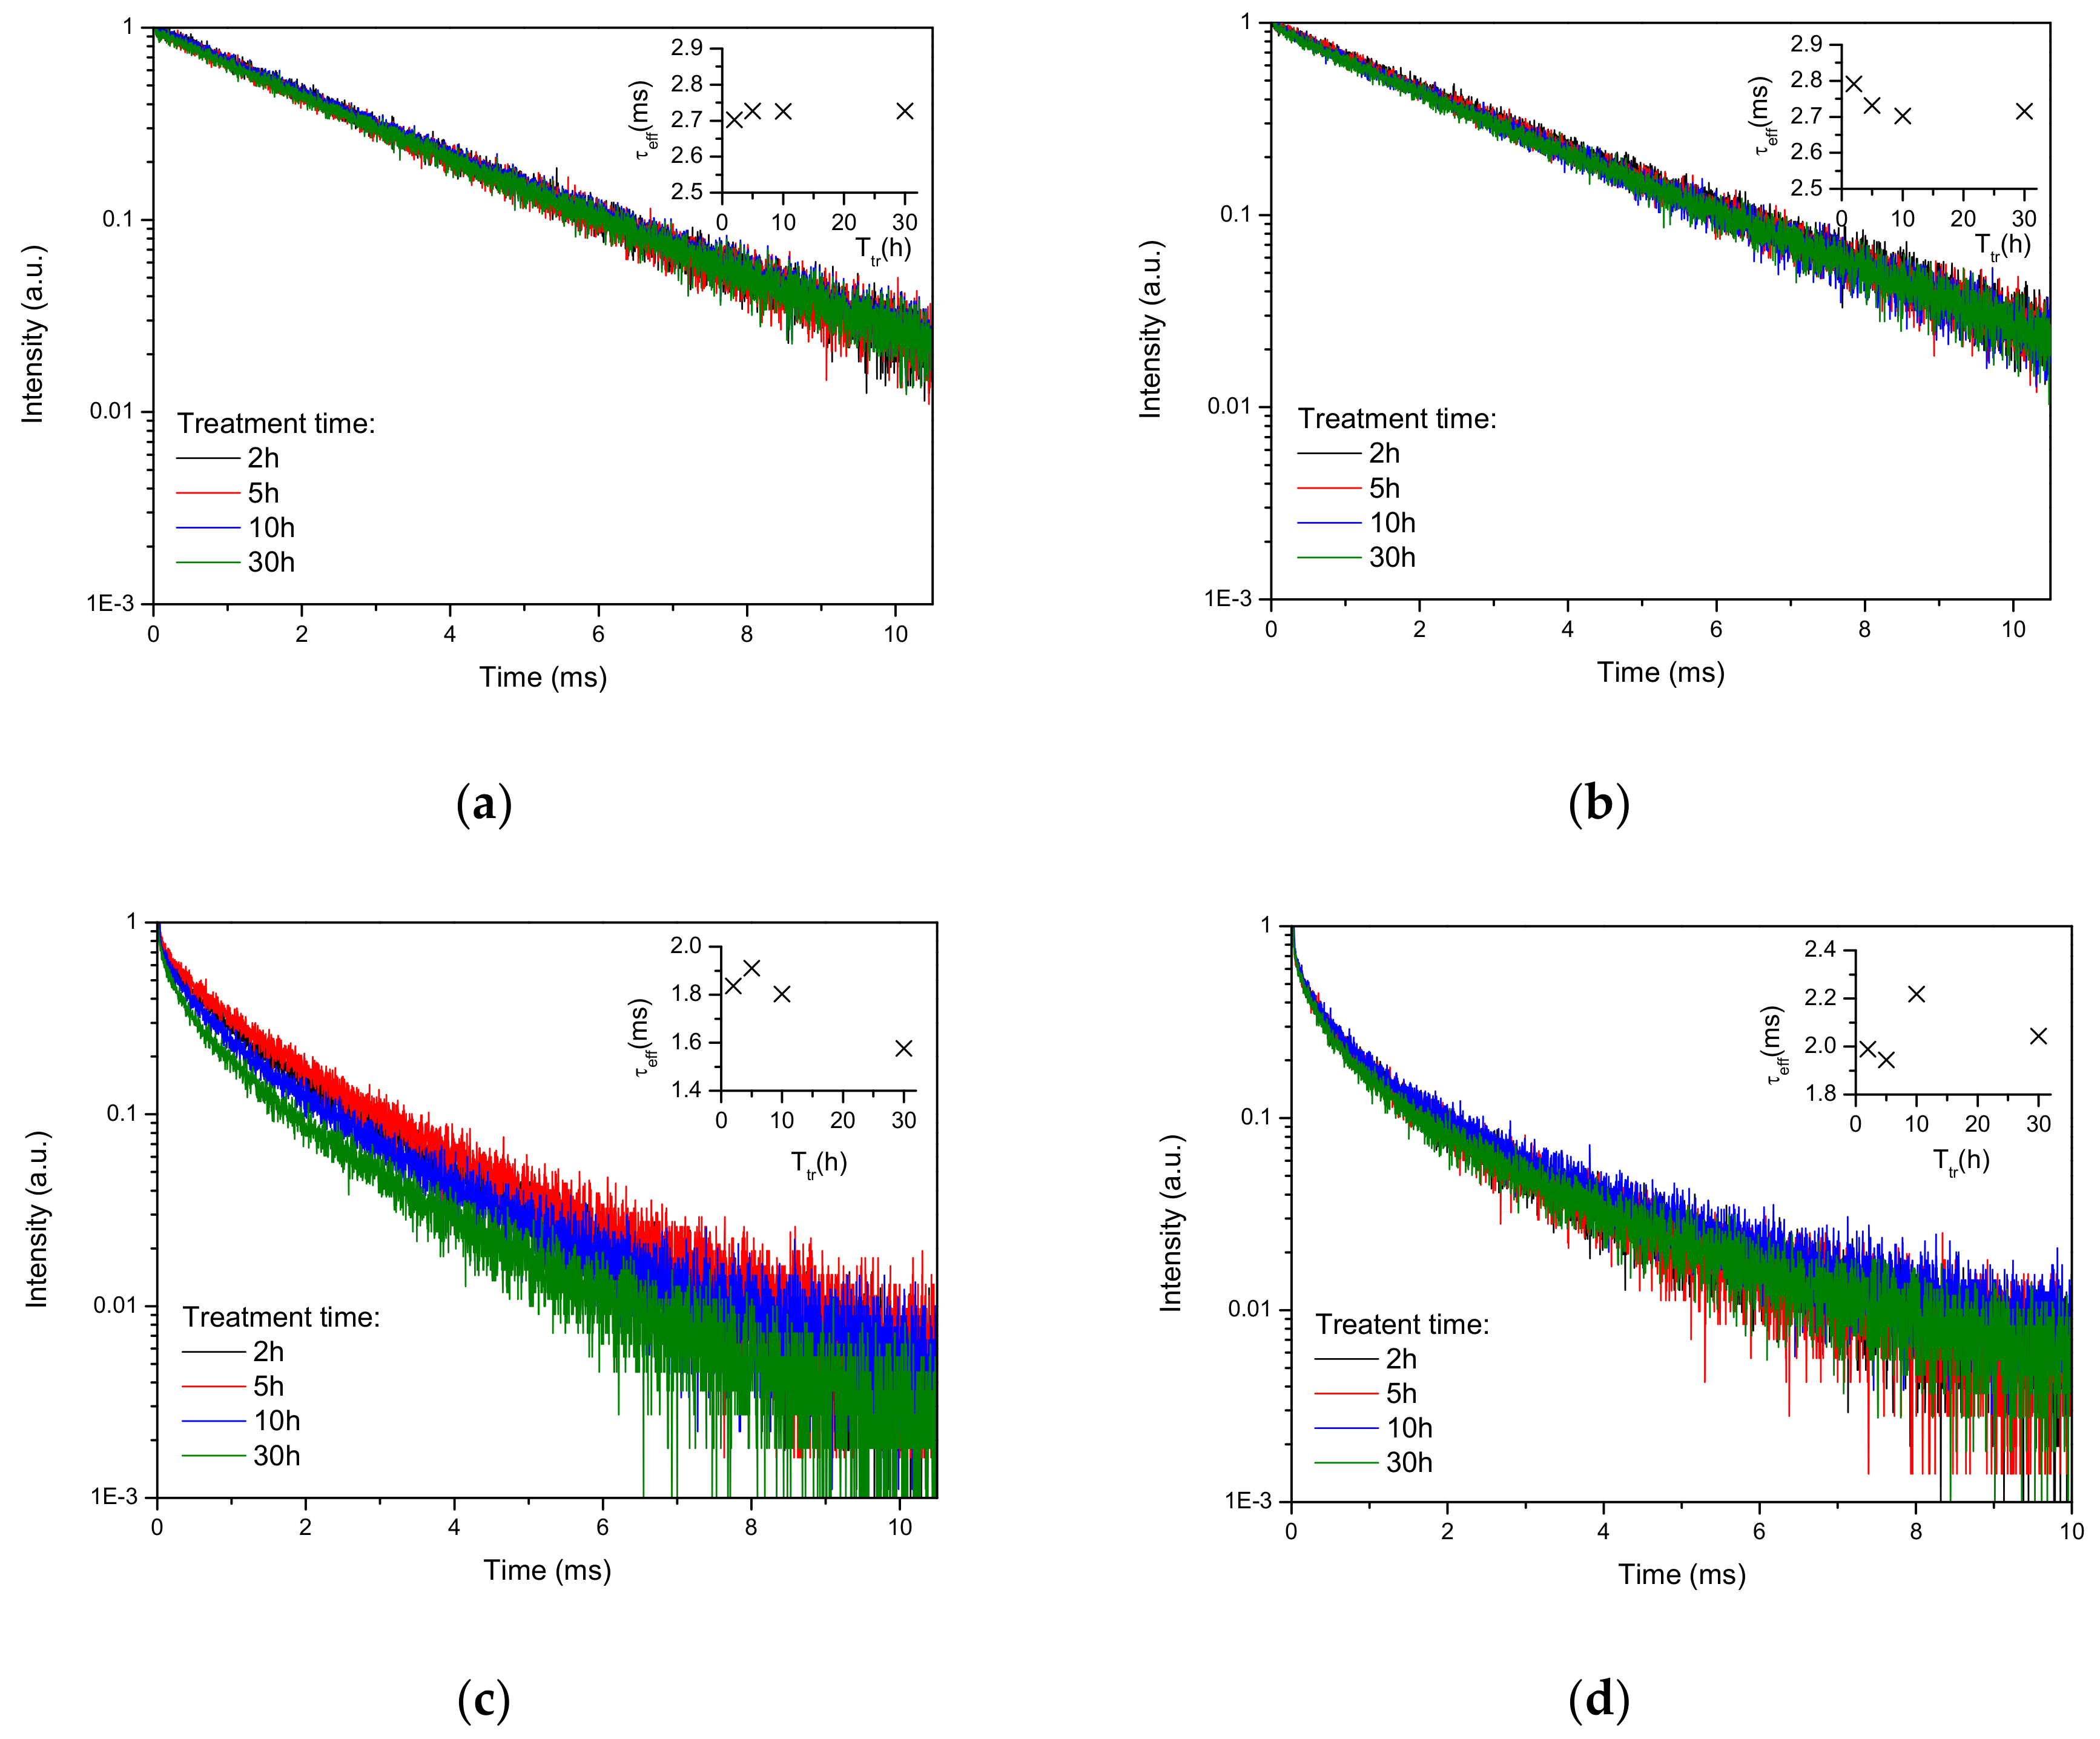
Luminescence decay curves recorded under excitation at 488 nm and emission at 542 nm are found to be mono-exponential for all Tb-only doped samples (
Figure 3a,b) and strongly non-exponential for Tb-Yb doped samples (
Figure 3c,d). Using these experimental data, the effective luminescence time was calculated as
τeff = ∫I(t)∙t∙dt/∫ I(t)∙dt [
19]. The effective lifetimes obtained are shown in the insets of
Figure 3a–d. For
700/7 samples (not shown in
Figure 3) the lifetimes were 2.63 and 2.15 ms for Tb-only and Tb-Yb doped samples, respectively. For Tb-only doped samples Tb
3+ lifetime barely changed with the heat treatment and remained around 2.7 ms. On co-doping with Yb, the decay curves became non-exponential and effective lifetimes decreased significantly in Tb-Yb as compared to Tb-doped samples. This evidences the existence of Tb→Yb energy transfer. For the samples obtained at 1000 °C, the effective lifetime of Yb-Tb samples decreased with the treatment time. This was not the case for the samples treated at 1100 °C, the lifetime of which slightly increased after 30 hours as compared to 2 hours of treatment.
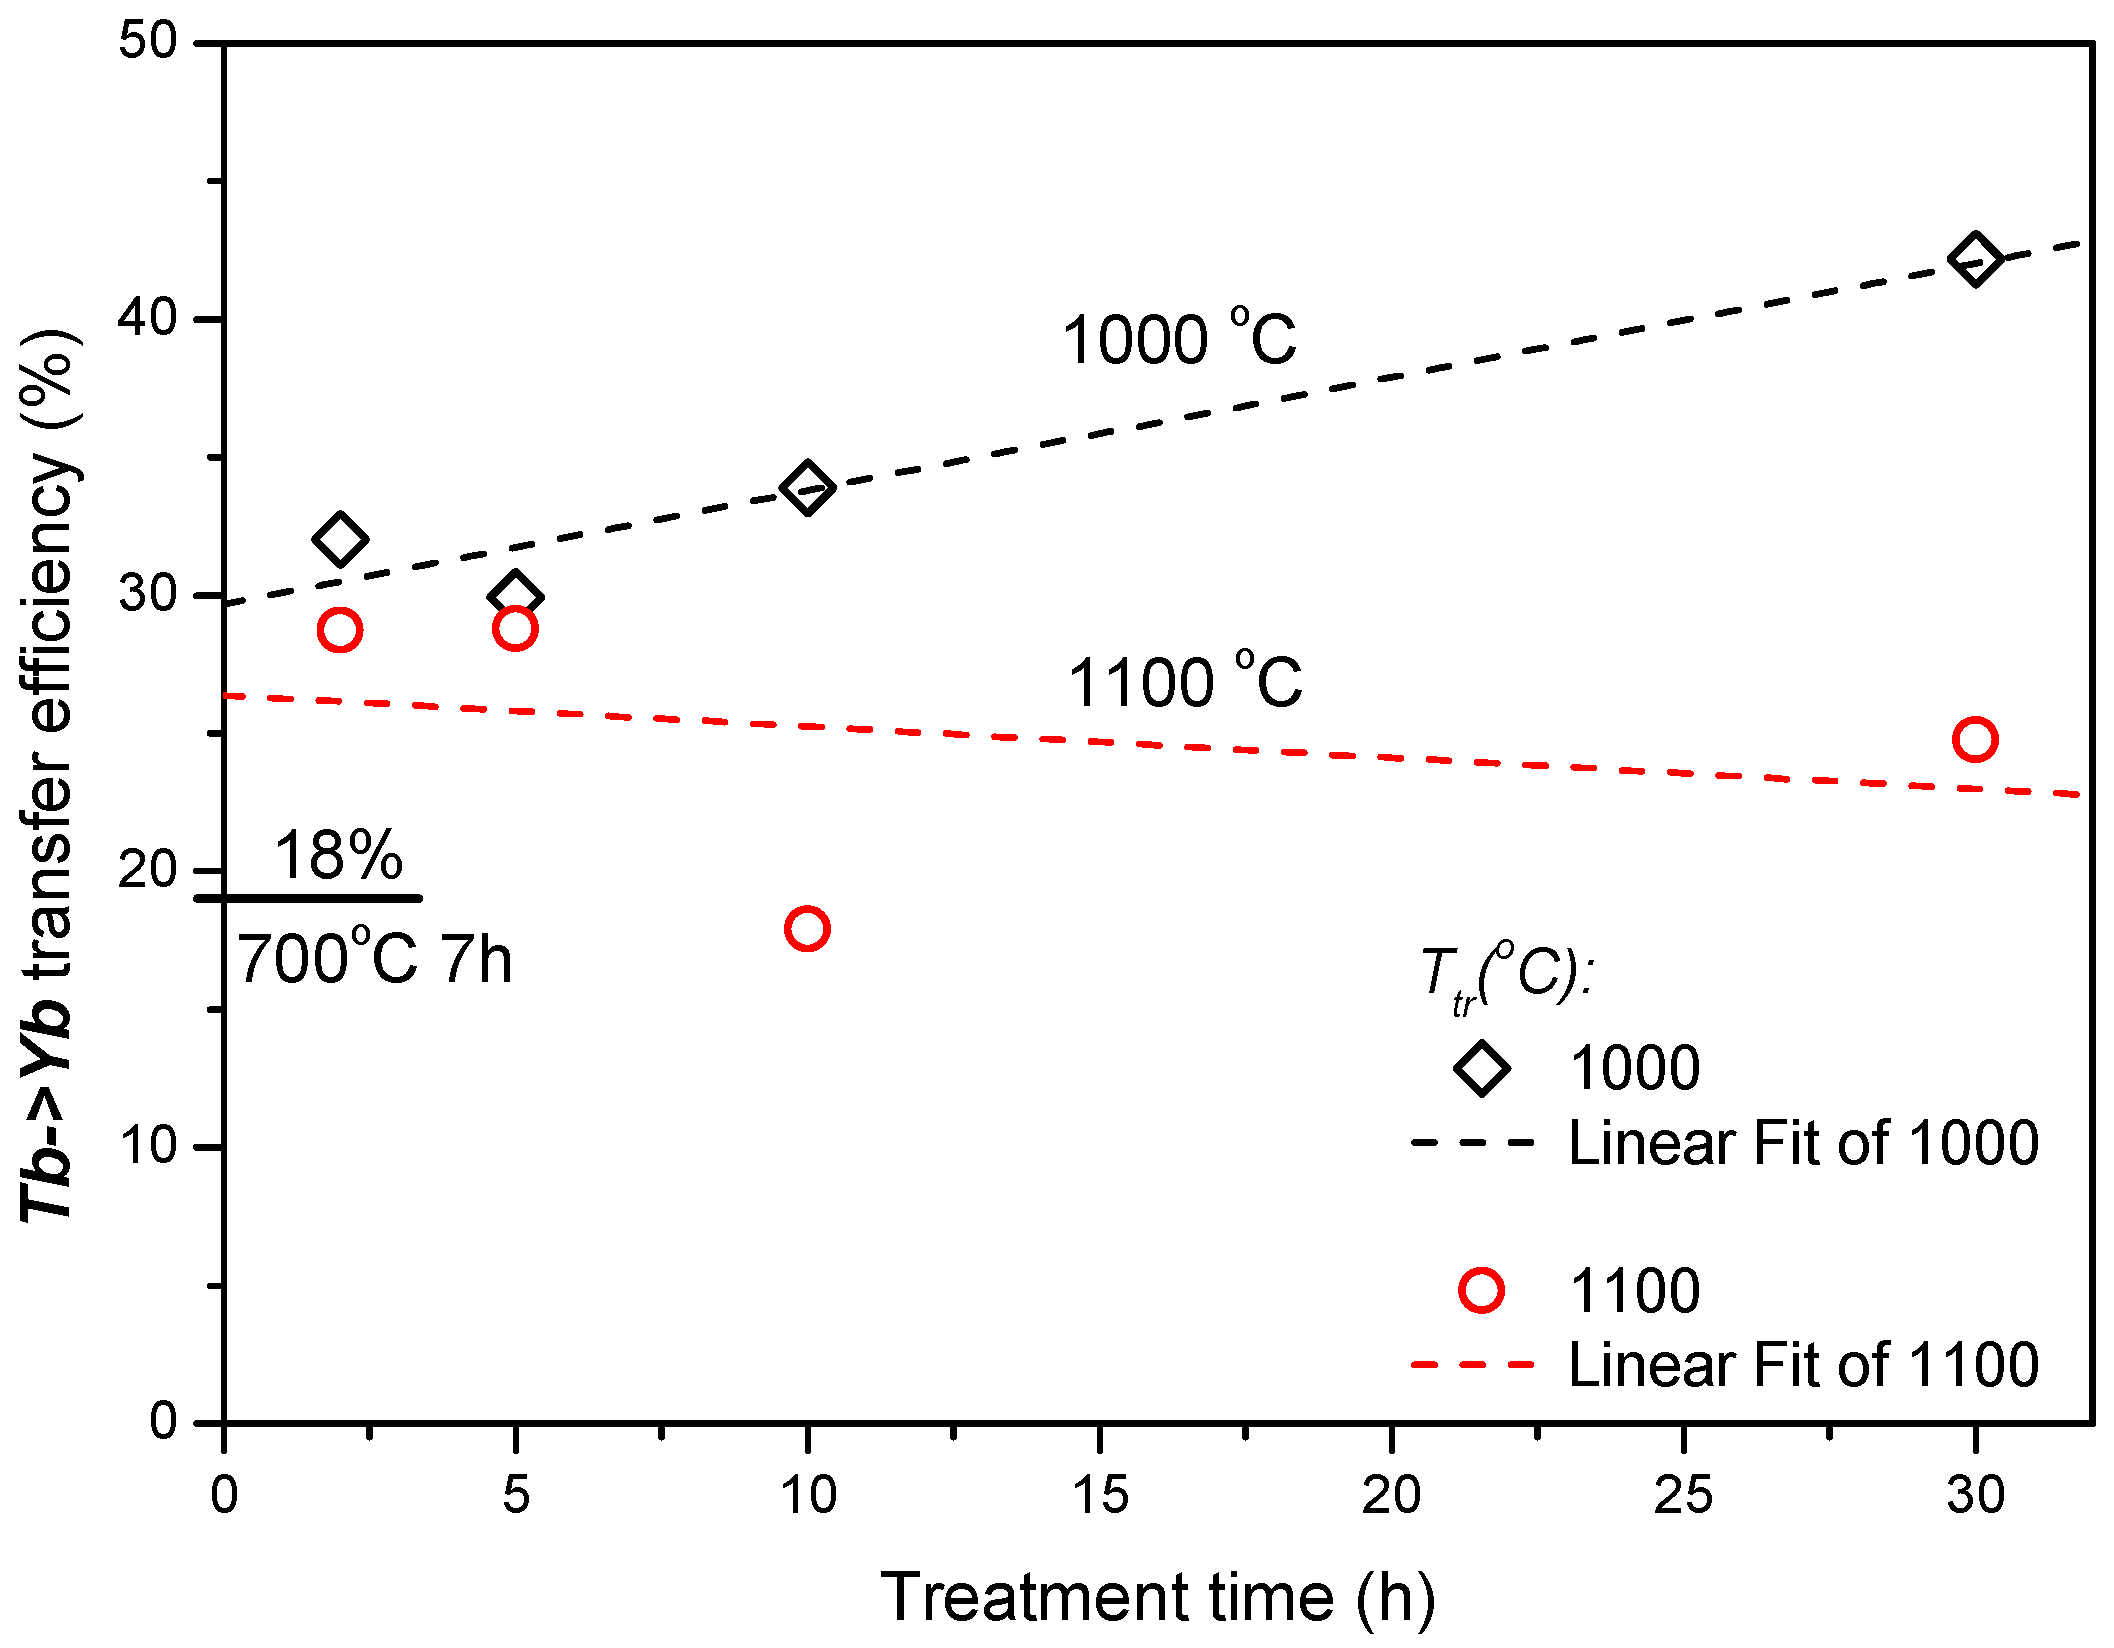
The values of the effective lifetime,
τeff, were used to estimate the energy transfer efficiency (ETE) as
ηETE = 1−
τTbYb∕
τTb [
4], the result is shown in
Figure 4. An energy transfer with efficiency of about 18% was already observed in
700/7 Tb-Yb sample. The heat treatment at higher temperatures for 2 hours increased this value up to around 30%. Longer treatment further advanced this parameter in the case of 1000 °C samples up to 42% after 30 hours, whereas stagnation or even a small decrease was observed for 1100 °C samples.
The structural changes induced by the heat treatment were studied to try to correlate them with the observed changes in optical properties. The Raman spectra of
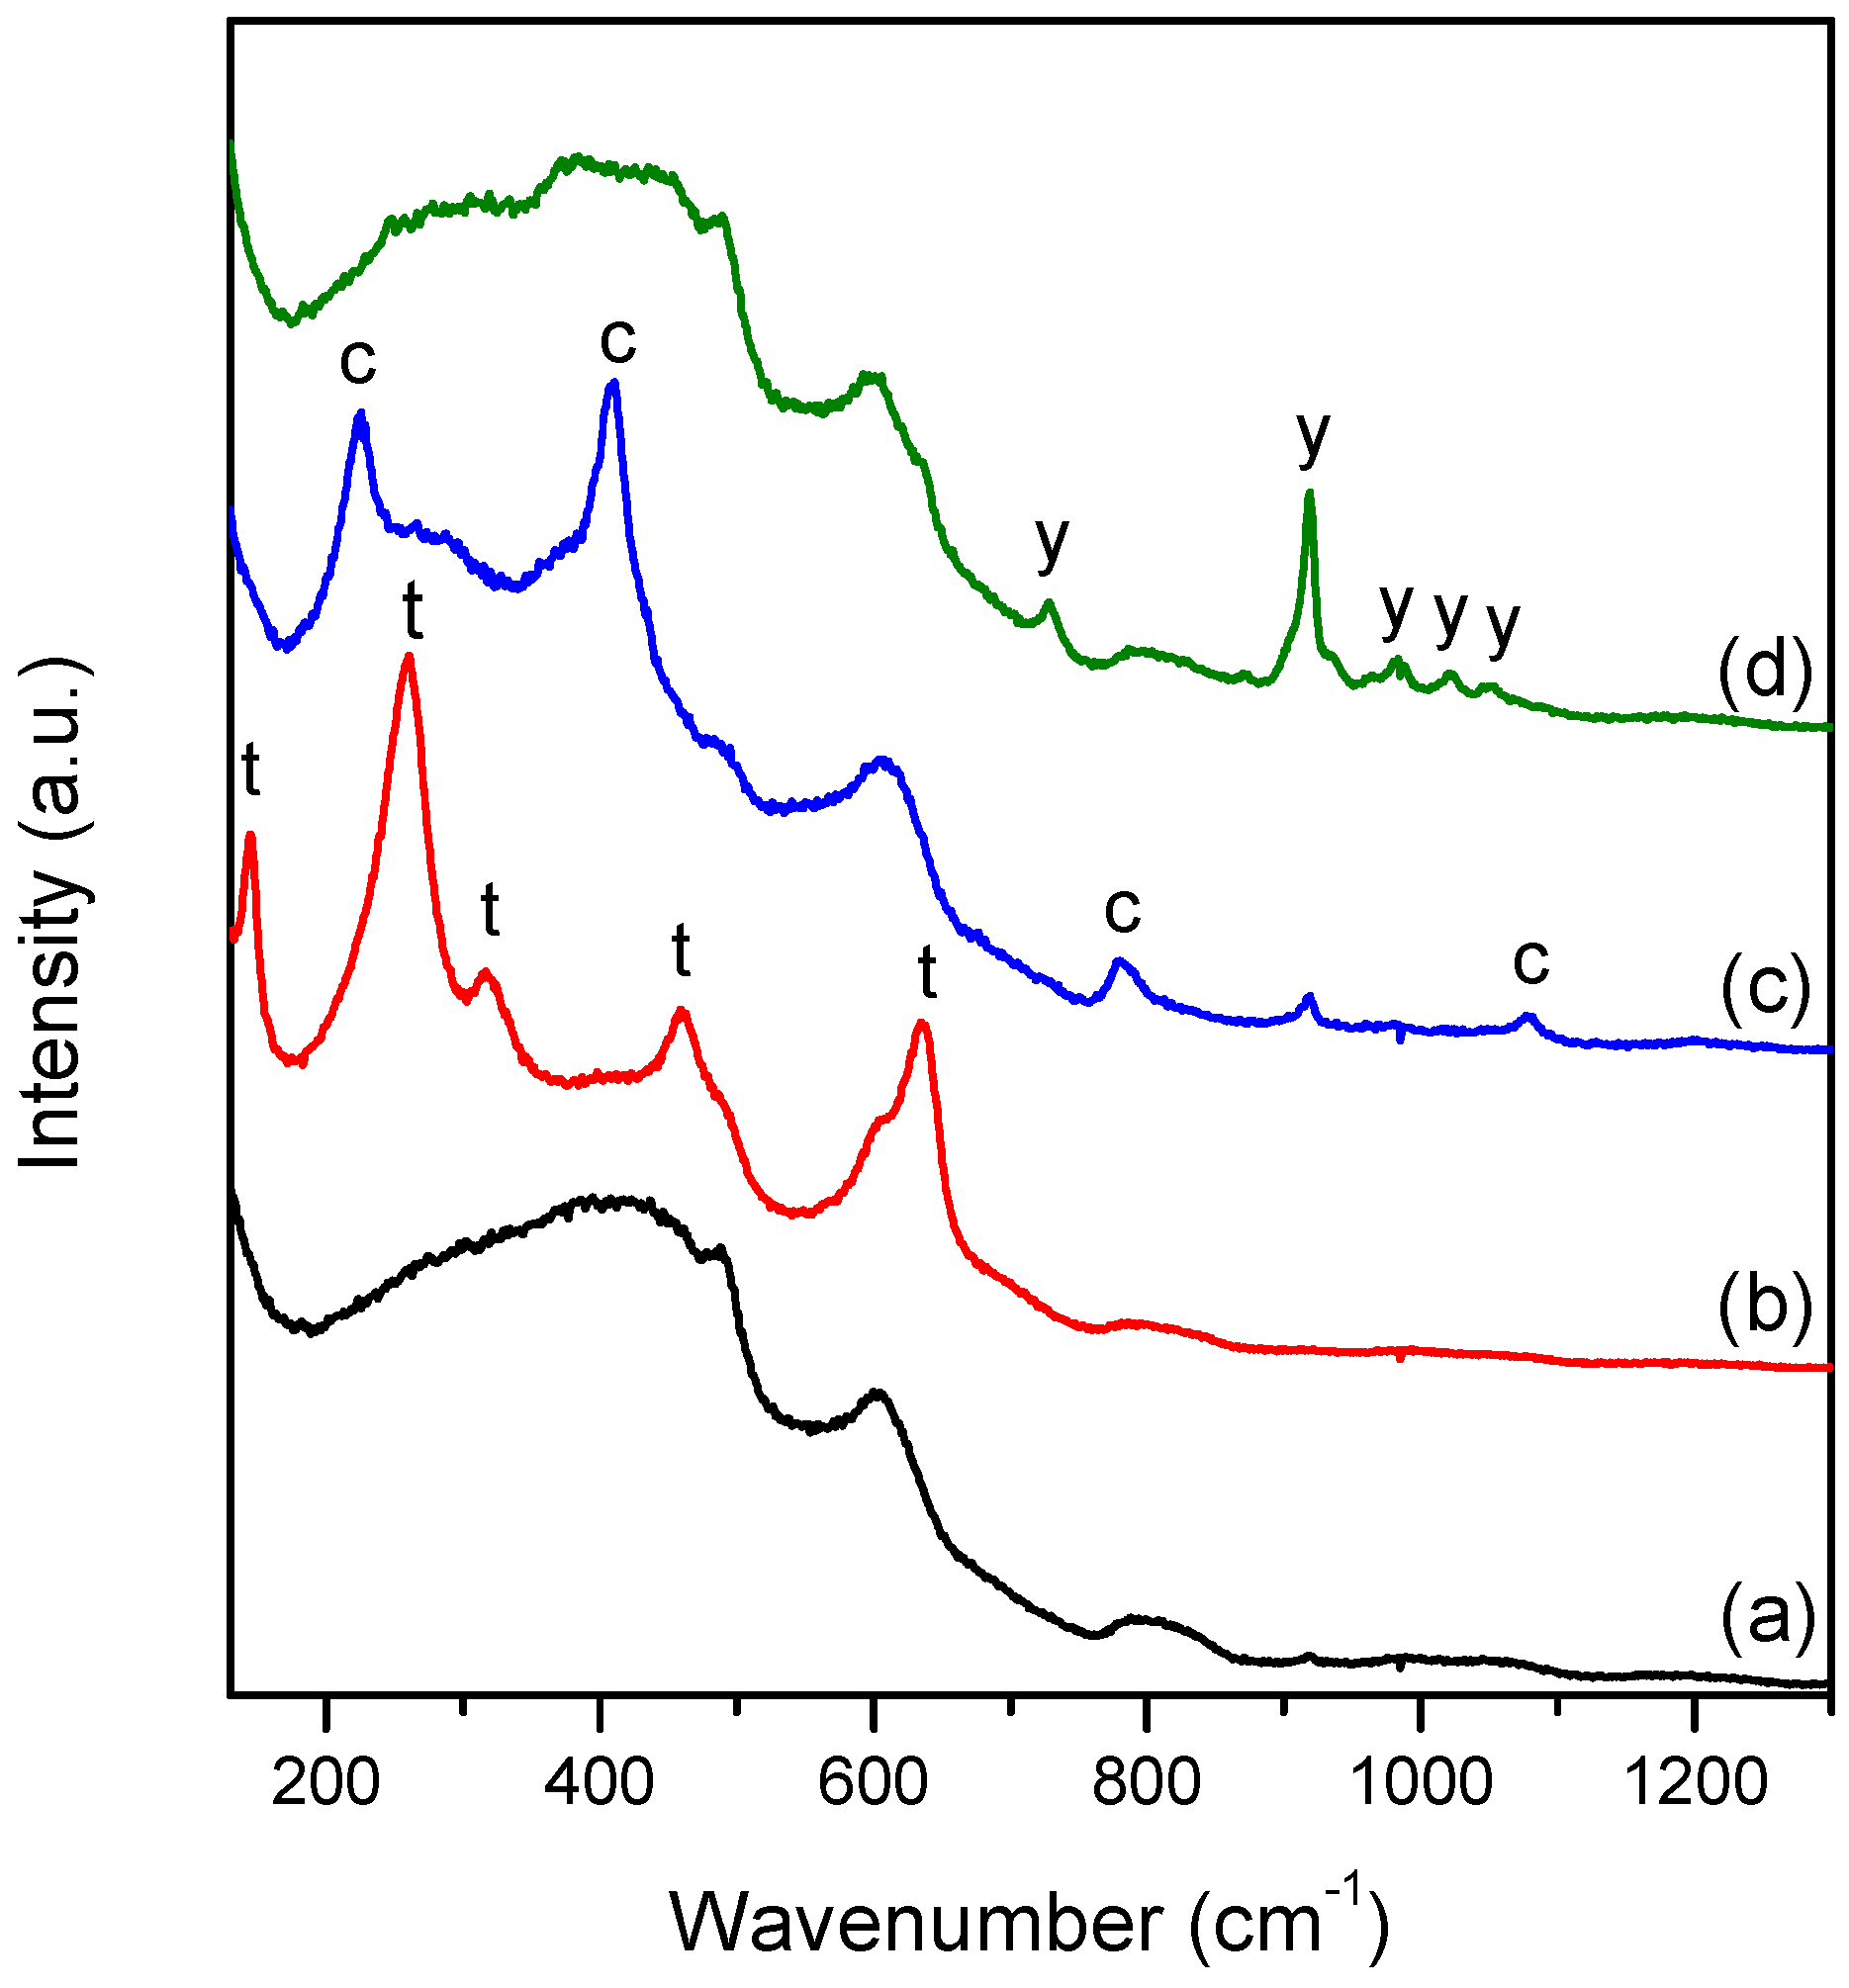
700/7 samples had no sharp peaks (
Figure 5) and agrees well with the literature spectrum of undoped ZrO
2-SiO
2 sol-gel derived glass of similar composition [
20]. After the heat treatment at higher temperatures, the spectra of Tb-only samples were dominated by sharp peaks (
Figure 5). According to the literature, these vibrational bands were assigned to tetragonal ZrO
2 phase [
21,
22,
23,
24]. This means that the crystallinity of Tb-only doped samples increases with time and temperature. The same trend was observed for Tb-Yb samples during the 1000 °C treatment. However, at 1100 °C the spectra look more amorphous than crystalline (
Figure 5).
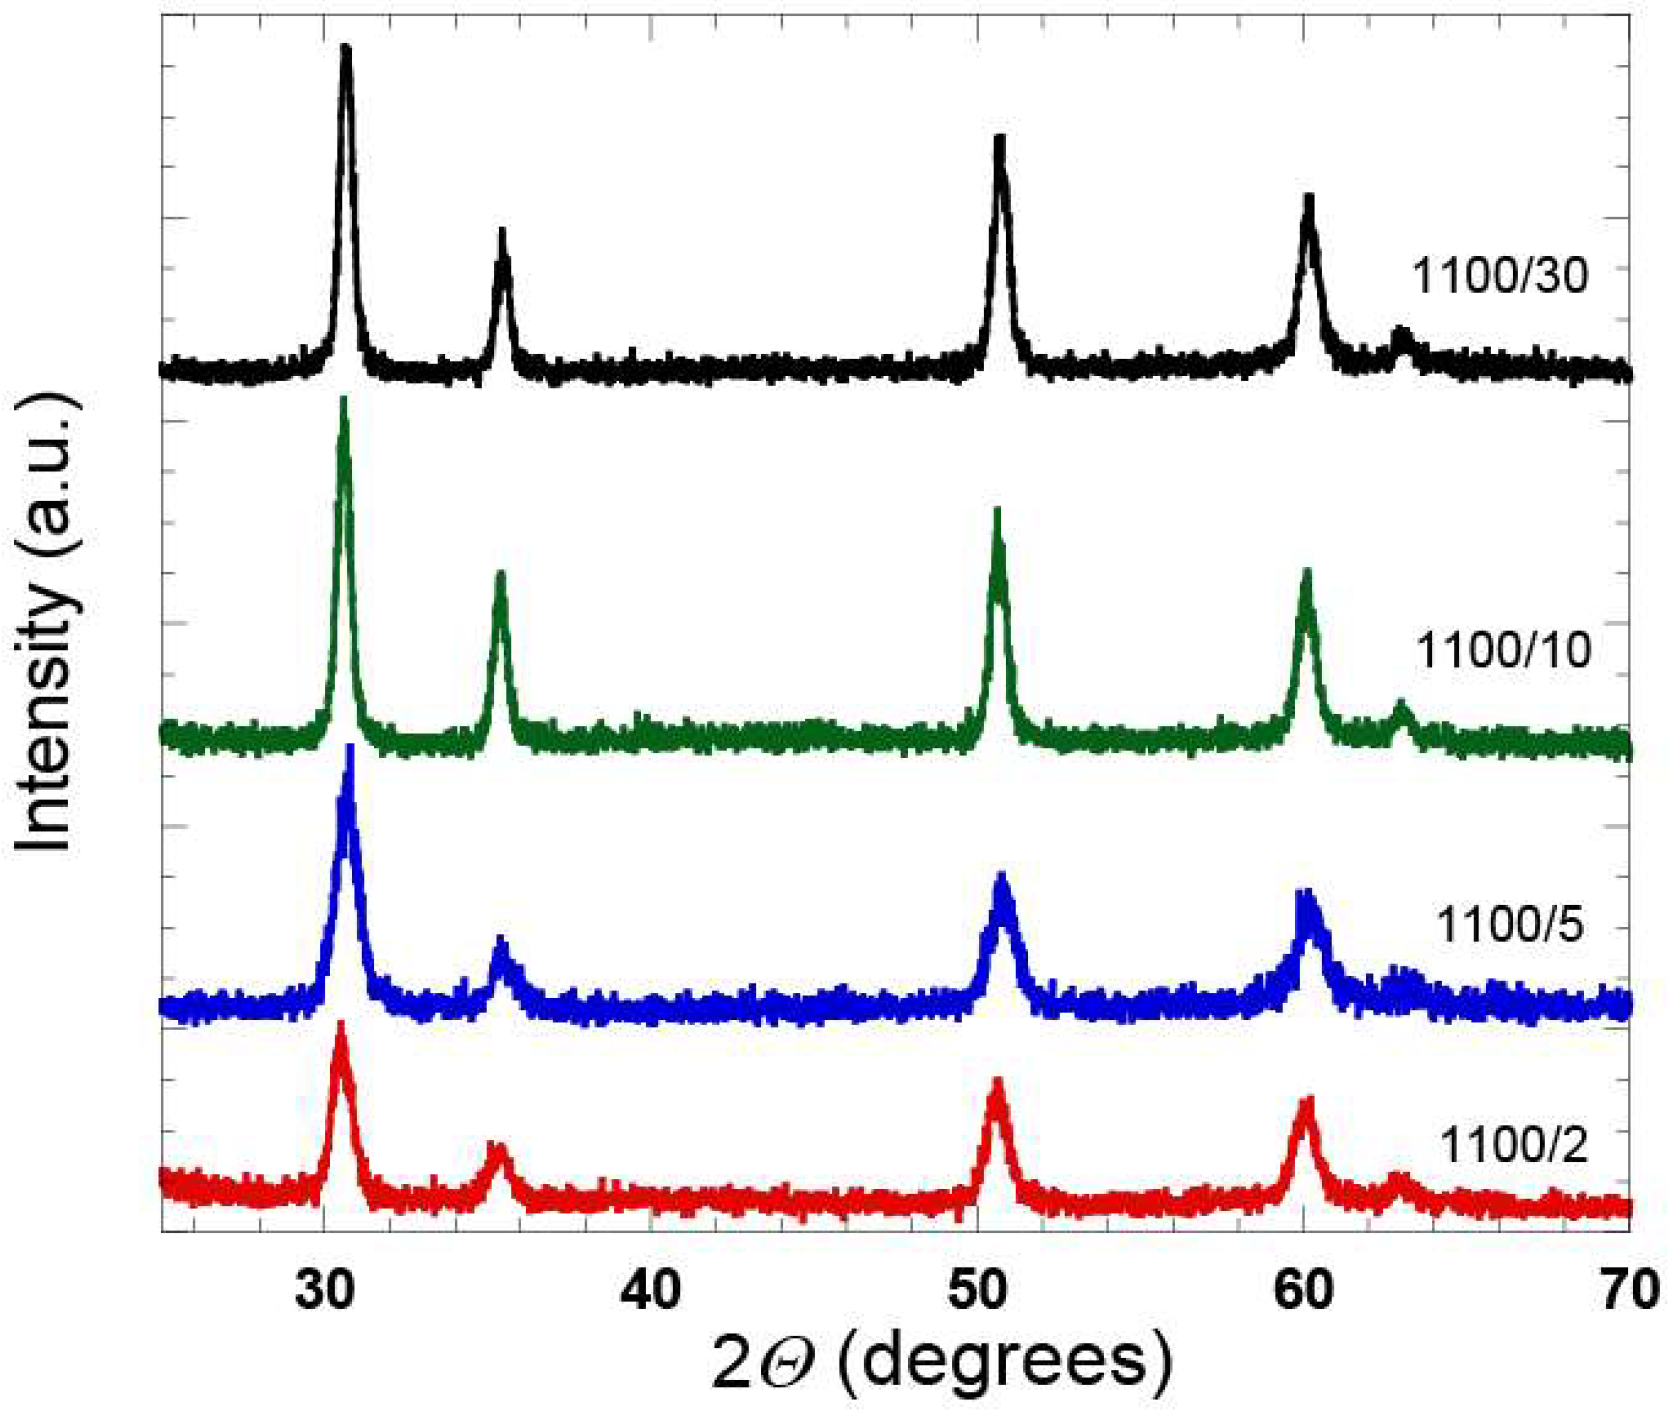
Additional XRD analysis was done for this series of the samples, which confirmed an increase of the crystallinity with an increase in the heat treatment time (
Figure 6). With the XRD analysis it is hard to distinguish whether the diffraction peaks originate from the tetragonal or cubic ZrO
2 phase [
25], however, further analysis of the samples by means of Raman spectroscopy (see below), confirmed the presence of the t-ZrO
2 phase.
According to the literature data, an undoped 30ZrO
2-70SiO
2 sol-gel system at treatment temperatures below 1200 °C should stabilize in the tetragonal phase [
26]. Doping with REE can shift the equilibrium and lead to stabilization of different ZrO
2 polymorphs [
27], but according to our results this is not the case for the sol-gel derived samples analyzed in this study.
The Raman spectra of 1100 °C Tb-Yb samples were found to vary from point to point, presenting big spatial inhomogeneities (
Figure 7). It is important to mention that this effect was not observed for Tb-only doped samples and 1000 °C Tb-Yb samples, and these materials can be considered to be homogeneous within a micrometric scale. The detected samples inhomogeneity was investigated in more detail for
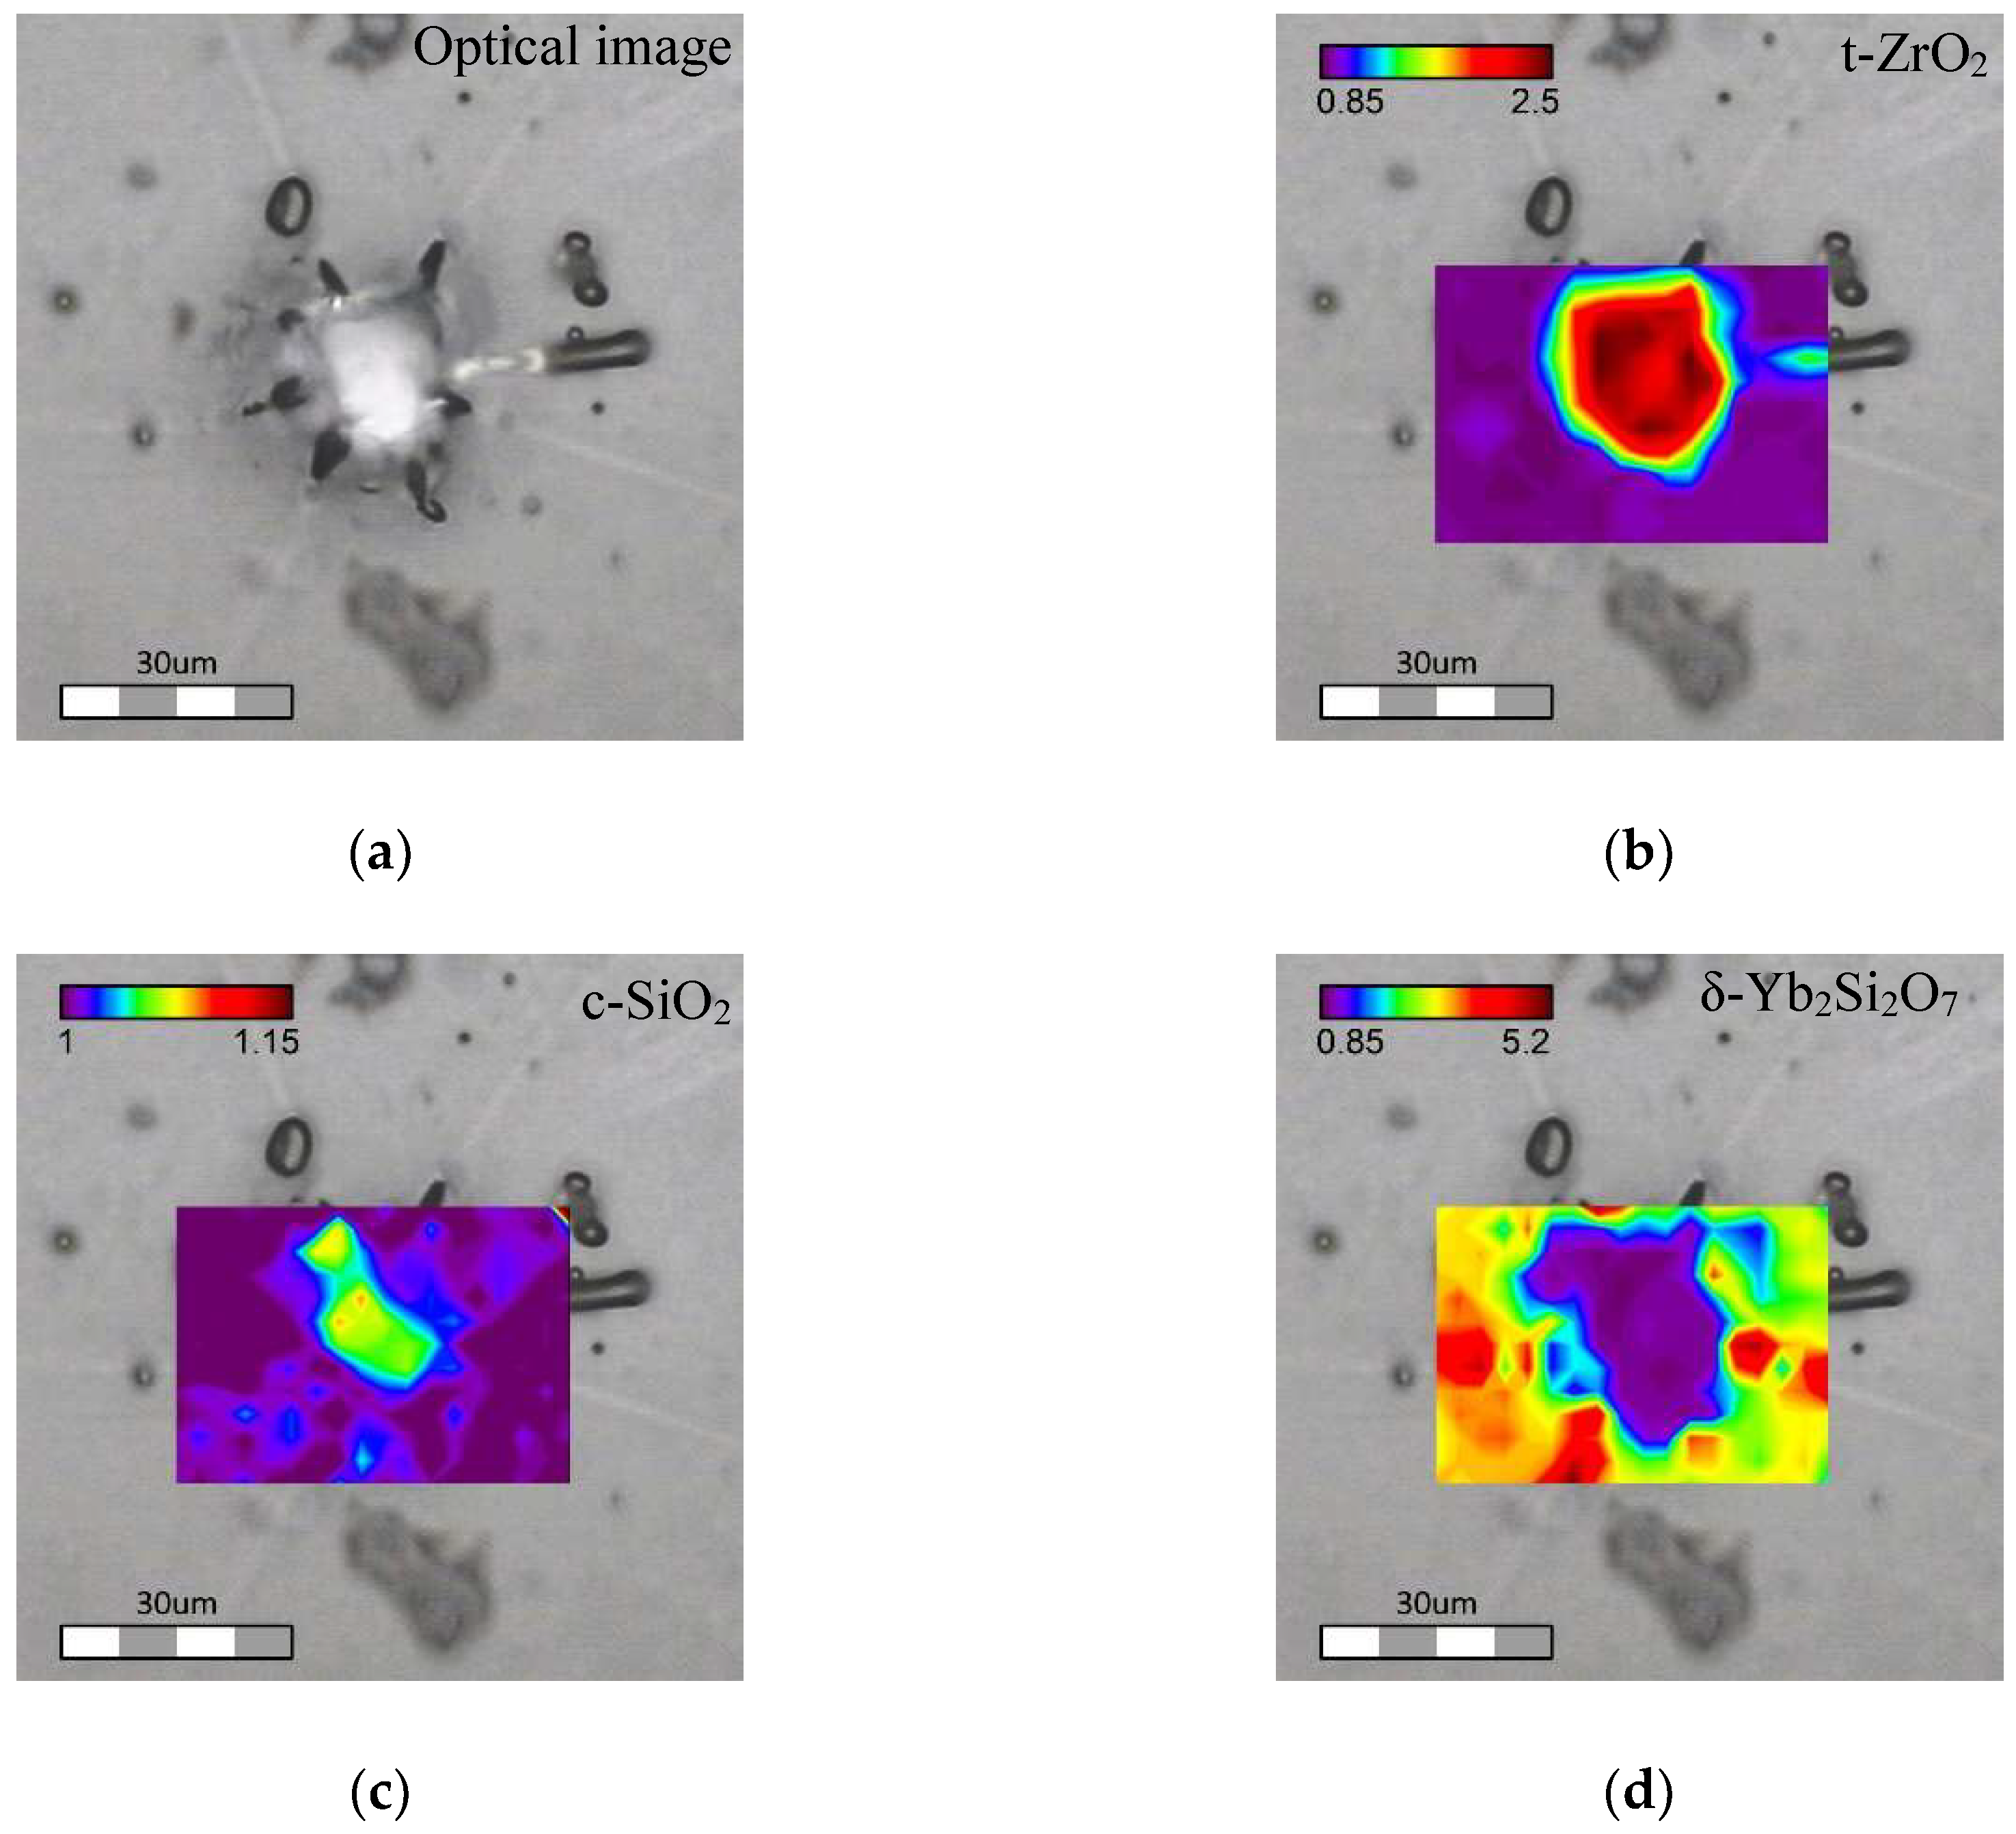
1100/30 Tb-Yb sample. It was found that crystalline inclusions with sizes of up to 30 μm were formed in
1100/30 Tb-Yb sample (
Figure 8a). These rather large crystalline inclusions look mostly monocrystalline. They are surrounded by apparent cracks disposed radially. These cracks probably appeared due to the mismatch in thermal expansion coefficients of the different phases.
Point by point Raman mapping was done for the area close to one of such crystalline inclusions. The structural properties of this can be described by the presence of 4 different phases: glassy phase, tetragonal ZrO
2, SiO
2 cristobalite and Yb
2Si
2O
7. Their characteristic Raman spectra are shown in
Figure 7, curves a-d, respectively. The Yb-disilicate has different polymorphs. According to previous studies, the stabilized polymorph depends on the REE ionic radius and for Yb
3+, the β phase of the crystal should be the most favorable [
28]. Nevertheless, the Raman spectrum observed in our study does not match the literature data [
29], but it was found to be very similar to δ-Y
2Si
2O
7 [
30]. This could be evidence that δ-Yb
2Si
2O
7 phase was stabilized in our case.
The spectrum of the amorphous phase in
1100/30 Tb-Yb differs significantly from the one in
700/7 Tb-Yb. After the heat treatment, the residual amorphous phase looks to be closer to the silica glass spectrum [
31]. This is reasonable, since part of REE and Zr left the glass to form novel crystalline phases.
To estimate the number of different phases over the investigated area, for each crystalline phase two spectral points were chosen: one corresponding to a characteristic vibrational band and the second was taken close to the first, but where only the glassy phase had a contribution. After, the relative intensity between these two peaks was calculated to get an appropriate Raman image. Thus, distribution of the crystalline phases was estimated by calculating the relative intensity of characteristic peaks: intensities at 410 cm
−1 over 378 cm
−1 for cristobalite, 260 cm
−1 over 369 cm
−1 for t-ZrO
2 and 919 cm
−1 over 887 cm
−1 for Yb
2Si
2O
7 crystalline phases. The results of these recalculations are shown in
Figure 8b–d.
As one can see on the phase distribution maps (
Figure 8), the big crystalline inclusions are formed by t-ZrO
2. Excess of “free” SiO
2 after crystallization of the pure zirconium crystal results in formation of cristobalite phase located mostly at the same area as t-ZrO
2. Since the t-ZrO
2 seems transparent and monocrystalline in the optical image, the cristobalite presence needs to be imagined as small local crystalline phases embedded in the t-ZrO
2 crystal itself. Ytterbium disilicate, having some concentrated spots, was detected almost everywhere except the t-ZrO
2 area. As can be seen in
Figure 8d, the location of Yb
2Si
2O
7 seems to be correlated with the presence of the radial cracks.
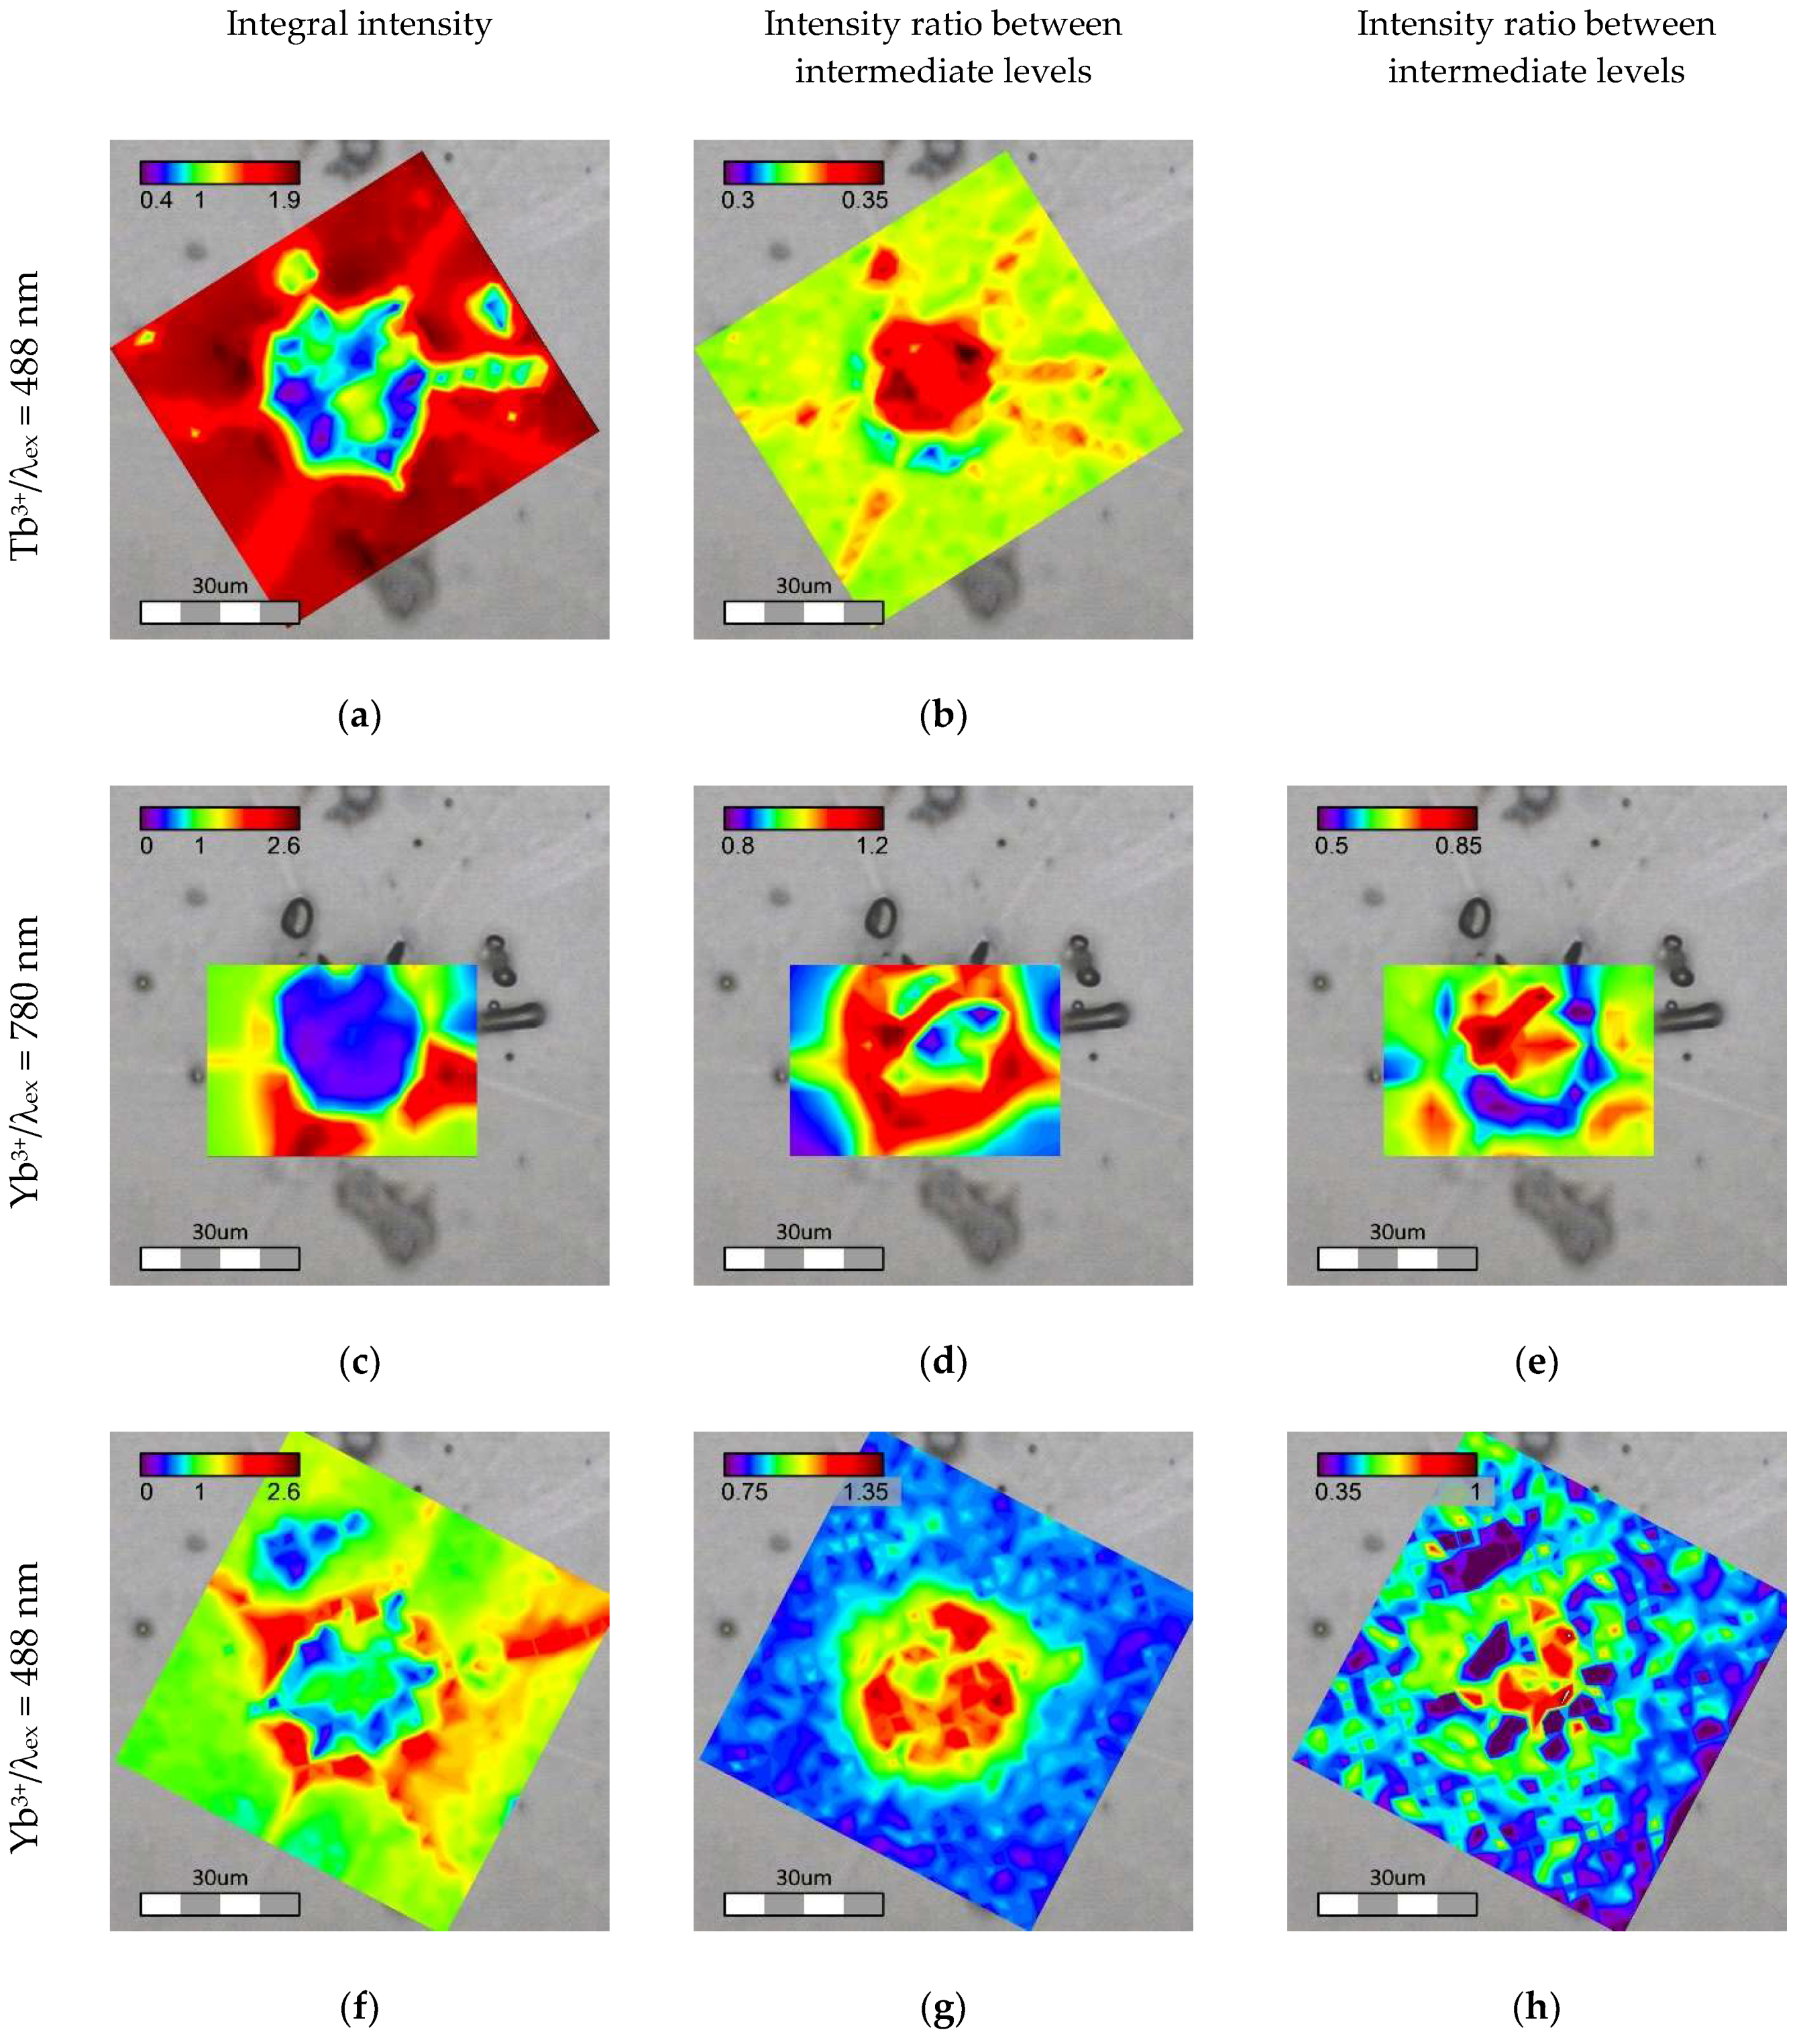
Point by point luminescence mapping of the area around the same crystal was done using Raman confocal microscopes under excitation at 488 and 780 nm. The blue and the infrared lasers directly excited Tb3+ and Yb3+ ions, respectively, and their emission spectra were recorded. Moreover, Yb3+ luminescence excited through the energy transfer from Tb3+ ion was collected under 488 nm excitation.
The luminescence spectra collected were analyzed for two aspects: integral intensity of the emission (
Figure 9a,c,f for Tb
3+/λ
ex = 488 nm, Yb
3+/λ
ex = 780 nm and Yb
3+/λ
ex = 488 nm emission, respectively) and change in relative intensities between different emission components. In the case of the Tb
3+ ratio between subcomponents of
5D
4→
7F
5 at 544 and 555 nm was calculated (
Figure 9b). For Yb
3+ intensities at 966 and 1036 nm relative to 973 nm were calculated (
Figure 9d,e,g,h for Yb
3+/λ
ex = 780 nm and Yb
3+/λ
ex = 488 nm emission, respectively).
Under direct excitation, the integral minimum of luminescence intensity for both Tb3+ and Yb3+ coincides well with the t-ZrO2 phase. At the same time, areas with maximum of Yb3+ luminescence were located close to ytterbium disilicate. The changes in the relative luminescence peak intensities are also strongly correlated with the crystals formed in the sample. The ratio between 5D4→7F5 subcomponents of Tb3+ emission has a pronounced maximum in the area of t-ZrO2. Changes in Yb3+ luminescence were not so trivial. The relative intensity of the 966 nm peak increases close to the crystalline phases (both t-ZrO2 and Yb2Si2O7), but at the same time the maximum is observed around the t-ZrO2 crystal rather than directly inside this area. The component at 1036 nm increases within the t-ZrO2 phase and at the outer border of Yb2Si2O7 whereas a minimum zone is observed around t-ZrO2. Changes in the optical properties, in both intensity and the emission spectrum, suggest that REE are redistributed in different sites and phases present in the material, and the final optical characteristics depend on the local environment of the ions. Owing to a big ionic radii mismatch between the REE and Si, it is hardly possible that Tb and Yb enter cristobalite lattice, but they can substitute for Zr in crystalline ZrO2. Decreases in the luminescence intensity observed for the t-ZrO2 indicate that the concentration of the REE in the lattice is much less as compared to the amorphous phase. This assumption was confirmed with chemical analysis done locally with EDX. Only about 3 mol. % of Yb was still present in the tetragonal phase. Tb could not be detected because its concentration was below the detection limit.
The intensity of the Yb
3+ luminescence mapping excited through the energy transfer from Tb
3+ (λ
ex = 488 nm) differs significantly from the directly excited one. The most intense emission was observed at the border of t-ZrO
2 and it did not coincide with the position of the Yb-disilicate phase (
Figure 8). On the other hand, the changes in intensities at 966 and 1036 nm relative to 973 nm, determined in the same manner as for the directly excited Yb
3+ luminescence (λ
ex = 780 nm), are more pronounced in the t-ZrO
2 area (
Figure 9g,h). One of the reasons for the less intense emission in t-ZrO
2 is lower concentration of the REE, which is probably partially compensated by higher luminescence efficiency in the crystal lattice as compared to the glassy phase.
Here it is important to understand the mechanism of the Tb→Yb energy transfer, since quantum cutting implies the need for high doping concentration of the acceptor (here Yb
3+), which seems to be not the case for the formed t-ZrO
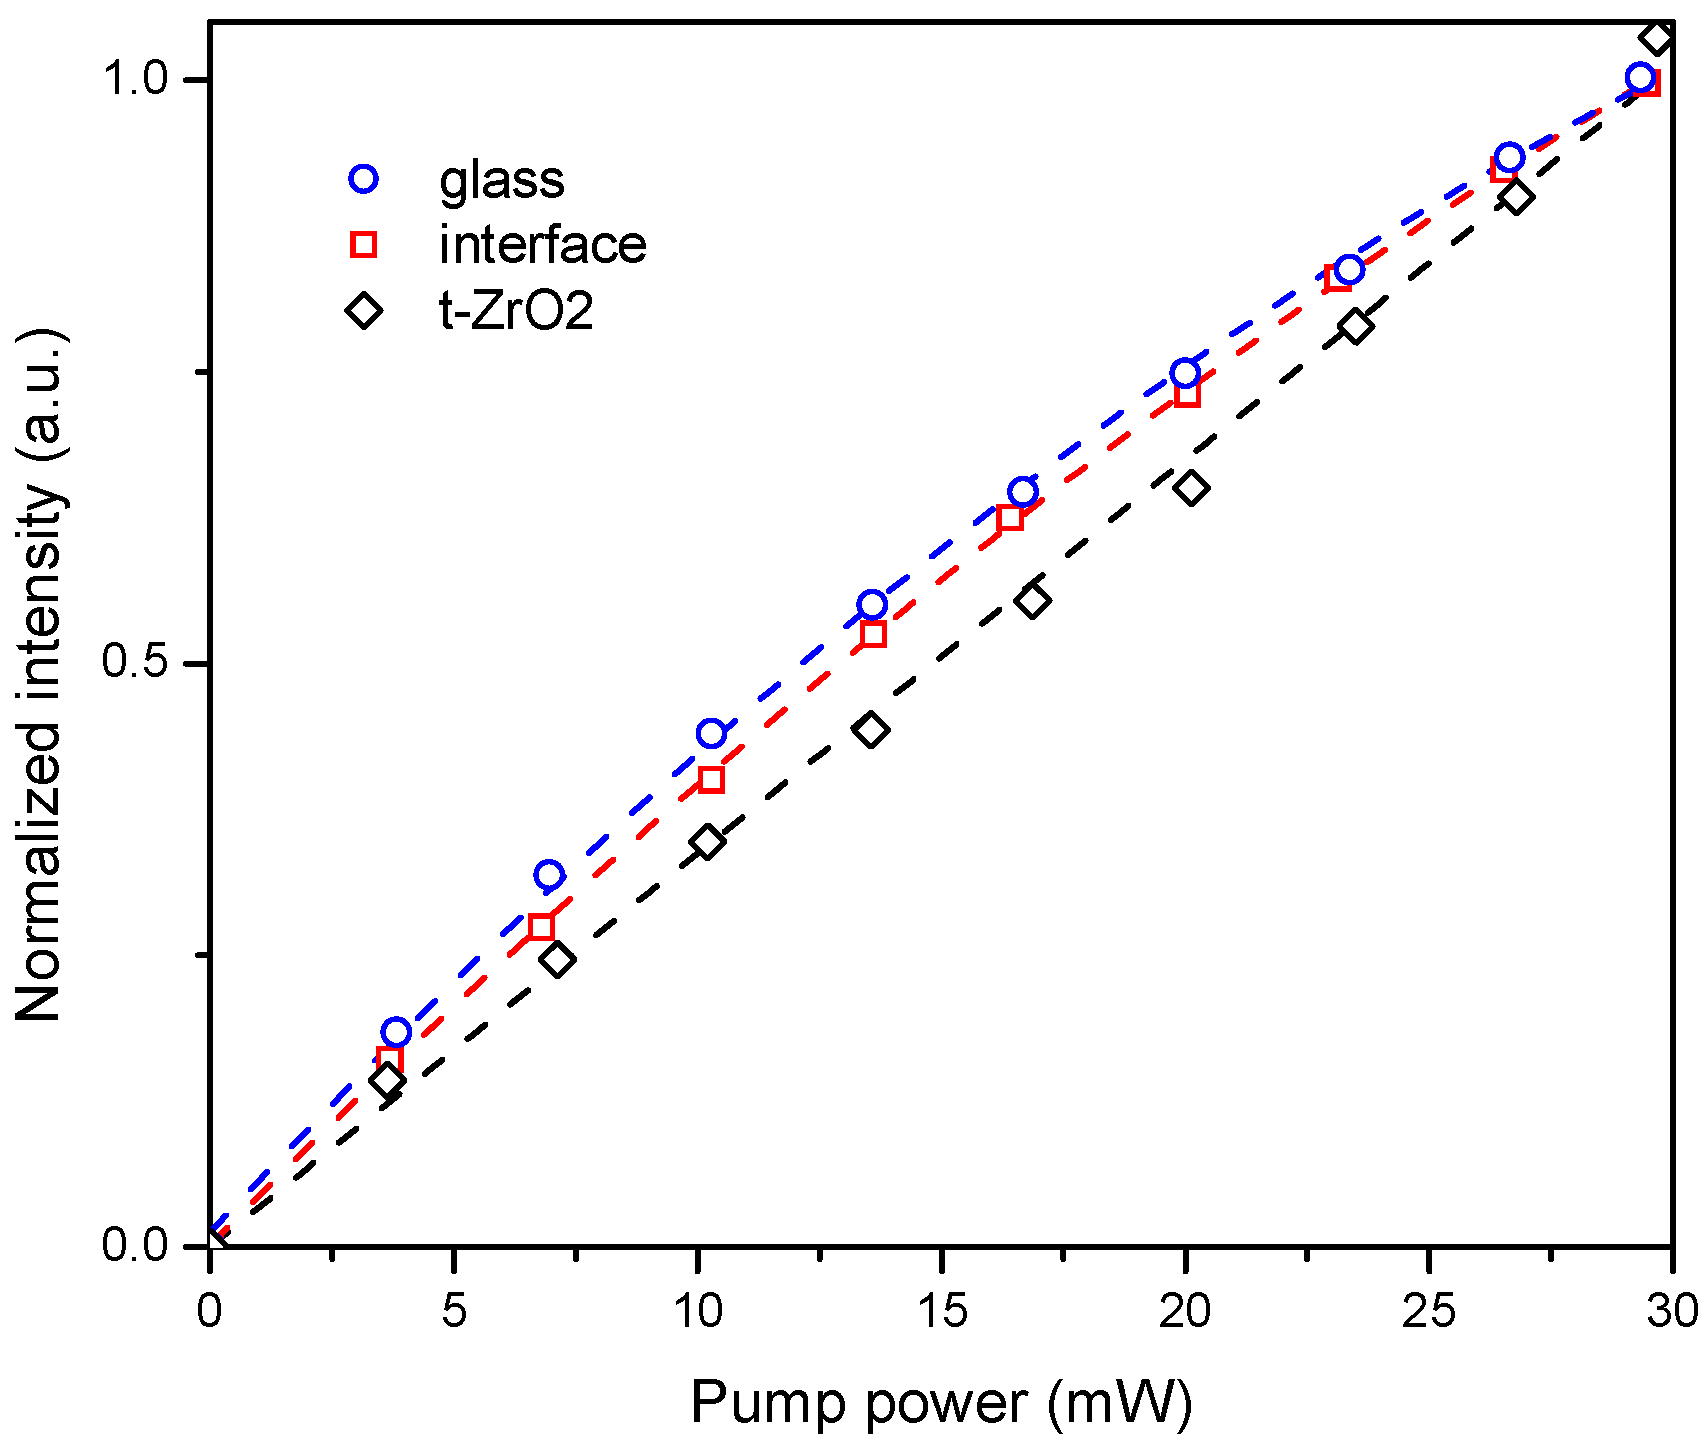
2. To better understand the mechanism of the energy transfer, emission intensity versus laser excitation power was measured in t-ZrO
2, at the t-ZrO
2/glass interface and in the glass area, far from the big crystalline inclusions. The dependence was found to be linear for the crystalline phase, and non-linear for both glass and interface areas (
Figure 10).
According to the literature, non-linear dependence of luminescence intensity versus excitation power evidences second-order nonlinear quantum cutting process with energy transfer through a virtual energy level [
32]. In turn, linear dependence in the case of t-ZrO
2 can be explained by the cooperative energy transfer process from
5D
4(Tb
3+) to Yb
3+ [
32]. However, the existence of a unique energy transfer in the case of t-ZrO
2 is not irrefutable proof of the quantum cutting process. Typically, the Tb→Yb cooperative energy transfer is considered to be the most probable relaxation pathway from the
5D
4 excited state of the Tb
3+ ion since the probability of the non-radiative multi-phonon relaxation needed to compensate the energy gap between the
5D
4 (Tb
3+) and
3F
5/2 (Yb
3+) excited states, is small. In some materials the one-to-one energy transfer mechanism can dominate over the down-conversion process [
33]. As was mentioned above, the concentration of the REE in the t-ZrO
2 crystalline phase decreased significantly when compared to the pristine glass, i.e., the possibility of finding an Yb–Yb pair in the nearest sphere of Tb
3+ is much smaller. This typically results in a decreased rate in the cooperative energy transfer process. At the same time RE
3+ substitution for Zr
4+ in the t-ZrO
2 lattice requires charge compensation. The latter leads to the formation of oxygen vacancies, and as a consequence, different optical defect centers [
34,
35]. We suggest that these oxygen-related defects could serve as an additional energy sink capable of compensating the Tb-Yb energy gap, and one-to-one photon conversion cannot be completely excluded here.
Detailed comparison of the structural and luminescence properties in the 1100/30 Tb-Yb sample revealed that the changes in the optical properties are mostly determined by formation of different phases: the residual glass phase and three different crystalline phases. However, there is no evidence that Tb→Yb energy transfer in the crystals is more efficient when compared to the amorphous phase. The most intense emission of Yb3+, when excited through Tb3+ ion at 488 nm, was found at the interface between t-ZrO2 crystal and the glass. This can be explained by the fact that the doping level of ZrO2 with REE cannot be as high as for the glass and the excess Yb and Tb ions are displaced to the outer rim of the crystalline inclusions. This leads to the formation of a REE rich layer at the glass-crystal interface with higher energy transfer probability. Excessively high concentration of the REE can also lead to crystallization REE-containing phases, e.g., for 1100/30 Tb-Yb the presence of Yb2Si2O7 was detected. The latter obviously excludes part of the Yb3+ ion from the energy transfer process since there is no donor Tb3+ ions in the near environment.
1100/30 Tb-Yb sample is the extreme point in the set of samples examined in this study: it had the highest crystallinity but became spatially inhomogeneous due to formation of large crystalline inclusions. However, we may assume that the phenomena happening under devitrification of the samples are the same, but less pronounced at lower time and temperature of the treatment. From this point of view, control of the crystalline phases and the size of the crystalline inclusion will play a crucial role in the final ETE, and this agrees with the experimental data obtained in the study. Moreover, many small crystals will have a higher surface as compared to a big crystal of the same volume, i.e., higher effective volume of the REE-rich material can be achieved, although too high a concentration of the REE could lead to self-quenching of the luminescence, decreasing the overall efficiency. This could explain why moderate heat treatment at 1000 °C results had higher Tb-Yb energy transfer efficiency as compared to the treatment at higher temperatures.
