Article

Influence of Aging on Mechanical Properties of Yttria-Doped Zirconia

1
Institute of Multidisciplinary Research for Advanced Materials, Tohoku University, 2-1-1 Katahira, Aoba-ku, Sendai, Miyagi 980-8577, Japan
2
Graduate School of Environmental Studies, Tohoku University, 6-6-01, Aramaki Aoba Aoba-ku, Sendai, Miyagi 980-8579, Japan
*
Author to whom correspondence should be addressed.
Current address: Tokyo Gas Co., Ltd., 1-7-7, Suehirocho, Tsurumi-ku, Yokohama 230-0045, Japan.
Ceramics 2018, 1(2), 287-303; https://doi.org/10.3390/ceramics1020023
Submission received: 1 September 2018 / Revised: 25 September 2018 / Accepted: 9 October 2018 / Published: 12 October 2018
(This article belongs to the Special Issue Functional Ceramics for Energy Applications)

Abstract

:
We evaluated the influence of aging on mechanical properties of 8% yttria-doped zirconia (8YSZ) from room temperature to 1200 K. The temperature dependence of the dynamic Young’s and shear moduli of 8YSZ with and without the aging treatment was investigated by using a resonance method. The dynamic Young’s and shear moduli of 8YSZ without the aging treatment decreased by 33% below 700 K and gradually increased at higher temperatures with increasing temperature. On the other hand, those with the aging treatments decreased by around 20% below 600 K while did not significantly change above 600 K with increasing temperature. These demonstrated the effect of aging on the dynamic Young’s and shear moduli of 8YSZ was most remarkable at intermediate temperatures (600~1000 K). Although it was suggested that the existence ratio of the metastable tetragonal phase was increased during the aging treatment, it is likely that the influence of this phase transition on the dynamic Young’s and shear moduli was not significant. It seemed that the difference in the dynamic Young’s and shear moduli of 8YSZ with and without the aging treatment at intermediate temperatures was due to the local ordering of the oxygen vacancies.

1. Introduction

Solid oxide fuel cells (SOFCs) are one of the next-generation energy conversion devices. They can directly convert chemical energy of fuels into electric energy and thus have high power generation efficiency. Furthermore, due to their high operating temperature, SOFCs can directly utilize hydrocarbon gases as a fuel and generate high quality waste heat. However, there are still several problems for their full-scale commercialization in aspects of long-term stability. One of the issues related with the long-term stability of SOFCs is the deterioration of the conductivity of zirconia-based electrolyte materials due to aging [1,2,3,4,5,6,7,8,9]. The deterioration of the conductivity of the electrolyte leads to a reduction in the output and energy conversion efficiency of SOFCs. Therefore, a number of studies have been conducted to reveal the degree of the conductivity drop due to aging and its mechanism. So far, several mechanisms have been proposed to explain the conductivity drop due to aging such as formation of lower-symmetry phases [1,2,3,4,5,6], ordering of oxygen vacancies [1,7], change in the grain boundary resistivity [8] and so forth. If such physical and/or chemical changes occur during aging, they can also influence mechanical properties of the electrolyte material. If the mechanical properties of the electrolyte material change during aging, the stress distribution in SOFCs can also vary. And then mechanical degradation such as cracks in the electrolyte materials and/or delamination of the interface between the electrode and the electrolyte may occur. Thus, the aging of the electrolyte material may result in not only the deterioration of the output and energy conversion efficiency of SOFCs but also the degradation of mechanical stability of SOFCs. Therefore, it is important to understand the influence of aging on the mechanical properties of zirconia-based electrolyte materials. Our group has evaluated the mechanical properties of the electrolyte and electrode materials for SOFCs in the temperature range from room temperature to around operating temperature of SOFCs under controlled atmosphere by using a resonance method [10,11,12]. The resonance method is a dynamic measuring method in which the dynamic elastic moduli are calculated from the resonance frequencies of a sample. One of the advantages of this measuring method is that the measurements can be conducted without destructing samples. Thus, the temperature and/or atmosphere dependence of the mechanical properties can be systematically measured with high accuracy by using one sample. Additionally, in this measuring method, the internal friction of the sample can be measured from the damped oscillation of the sample. The internal friction enables us to evaluate the degree of the non-elastic behavior of the material and the relationship between the non-elastic behavior and the change in the dynamic elastic moduli of the sample.
In this study, we investigated the influence of aging on mechanical properties of 8% yttria-doped zirconia, which is one of the typical electrolyte materials for SOFCs, from room temperature to around SOFC operating temperature by using the resonance method.

2. Materials and Methods

2.1. Sample Preparation

Commercial powder of (Y2O3)0.08(ZrO2)0.92 (8YSZ; 99.9%, Tosoh Corp., Tokyo, Japan) was used for the preparation of the sintered compacts. The powder was hydrostatically pressed at 150 MPa into compacts and then sintered in air at 1623 K for 5 h. The sintered compacts were cut into rectangles (ca. 8 × 1.5 × 45 mm) and polished with the diamond paste of 3 μm. The relative density of all the samples was around 96~97%.

2.2. Aging Treatment

Figure 1a shows the electric furnace used for the aging treatment in this study. Several samples of 8YSZ were placed in the electric furnace (FP41, Yamato Scientific Co., Ltd., Tokyo, Japan) and heat treated at 1073 K in air for a maximum of seven months. The samples for the resonance measurements were taken out from the electric furnace one by one after heat treated for 720, 1465, 2210 and 5110 h. When the samples were taken out, the temperature in the electric furnace was cooled to room temperature with the cooling rate of 5 °C/min and then increased to 1073 K again with the heating rate of 5 °C/min.
One of the samples of 8YSZ was used for conductivity measurements. Platinum porous electrodes were mounted on the sample as shown in Figure 1b and the conductivity of the sample was repeatedly measured by the AC four-terminal method using a potentiogalvanostat (Solartron 1287, Ametek, Inc., Berwyn, PA, USA) in a frequency range from 105 to 10 Hz with the potential amplitude of 10 mV during the aging treatment. The conductivity of the sample, σsample, was calculated by the following equation;
  σ sample = L R S  
where R, L, S are the ohmic resistance, the distance between the voltage terminals and the cross-sectional area of the sample, respectively. The distance between the voltage terminals and cross-sectional area of the sample were about 1.1 cm, 0.11 cm2, respectively.
The crystal structure and microstructure of the samples before and after the aging treatment was analyzed by X-ray diffraction (M18X, Bruker AXS GmbH, Karlsruhe, Germany) and scanning electron microscopy (SEM, JSM 7001F, JEOL Ltd., Tokyo, Japan), respectively.

2.3. Resonance Measurement

The resonance method was employed to evaluate the dynamic Young’s and shear moduli and the Poisson’s ratio of 8YSZ. The detailed information for this measuring method is described in our previous papers [10,11,12]. Resonance measurements were performed by using three kinds of elastic modulus meters (JE, JG and EG-HT, Nihon Technoplus Co., Ltd., Osaka, Japan). JE and JG perform free hold resonance measurements and determine the dynamic Young’s and shear moduli, respectively. On the other hand, EG-HT performs cantilever resonance measurements. Generally, the free hold resonance measurements have a higher accuracy than cantilever ones [13]. However, the JE and JG are available only for measurements at room temperature. Therefore, in this work, absolute values of the dynamic Young’s and shear moduli obtained at room temperature with EG-HT were calibrated by those with JE and JG.
In this study, the dynamic Young’s and shear moduli, the Poisson’s ratio and the internal friction of 8YSZ were evaluated at every 25 K while elevating temperature from 298 to 1273 K under the oxygen partial pressure, P(O2), of 0.01 bar. The resonance measurements were performed 35 min after reaching each set temperature. The heating rate was 10 K/min. The P(O2) around the sample was controlled by flowing mixture gases of O2 and Ar and monitored by an yttria-stabilized zirconia oxygen sensor.

2.4. Raman Spectroscopy

Raman spectroscopy was performed by using RMS-320 (HORIBA Jobin Yvon S. A. S., Longjumeau, France) as a spectrometer and the He-Cd laser (KIMMON KOHA Co., Ltd., Tokyo, Japan) to investigate the local crystal structure of the samples. The wave length and the spot diameter of the laser were 442 nm, 20 μm, respectively. The measuring wavenumber range was from 100 to 1917 cm−1. The measurements were conducted in air and in the temperature range from room temperature to 873 K. Above room temperature, the measurements were conducted 35 min after reaching the set temperature. When the local crystal structure of the samples without aging treatment was investigated by the Raman spectroscopy, the samples were heat treated at 1273 K for 1 h in advance of the Raman spectroscopy in order to remove the influence of the thermal history during the resonance measurement at high temperatures. On the other hand, the samples with aging treatments were used for the Raman spectroscopy before the resonance measurement without any other heat treatments.

3. Results and Discussion

3.1. Temperature Dependence of the Dynamic Elastic Moduli and Internal Friction of 8YSZ without the Aging Treatment

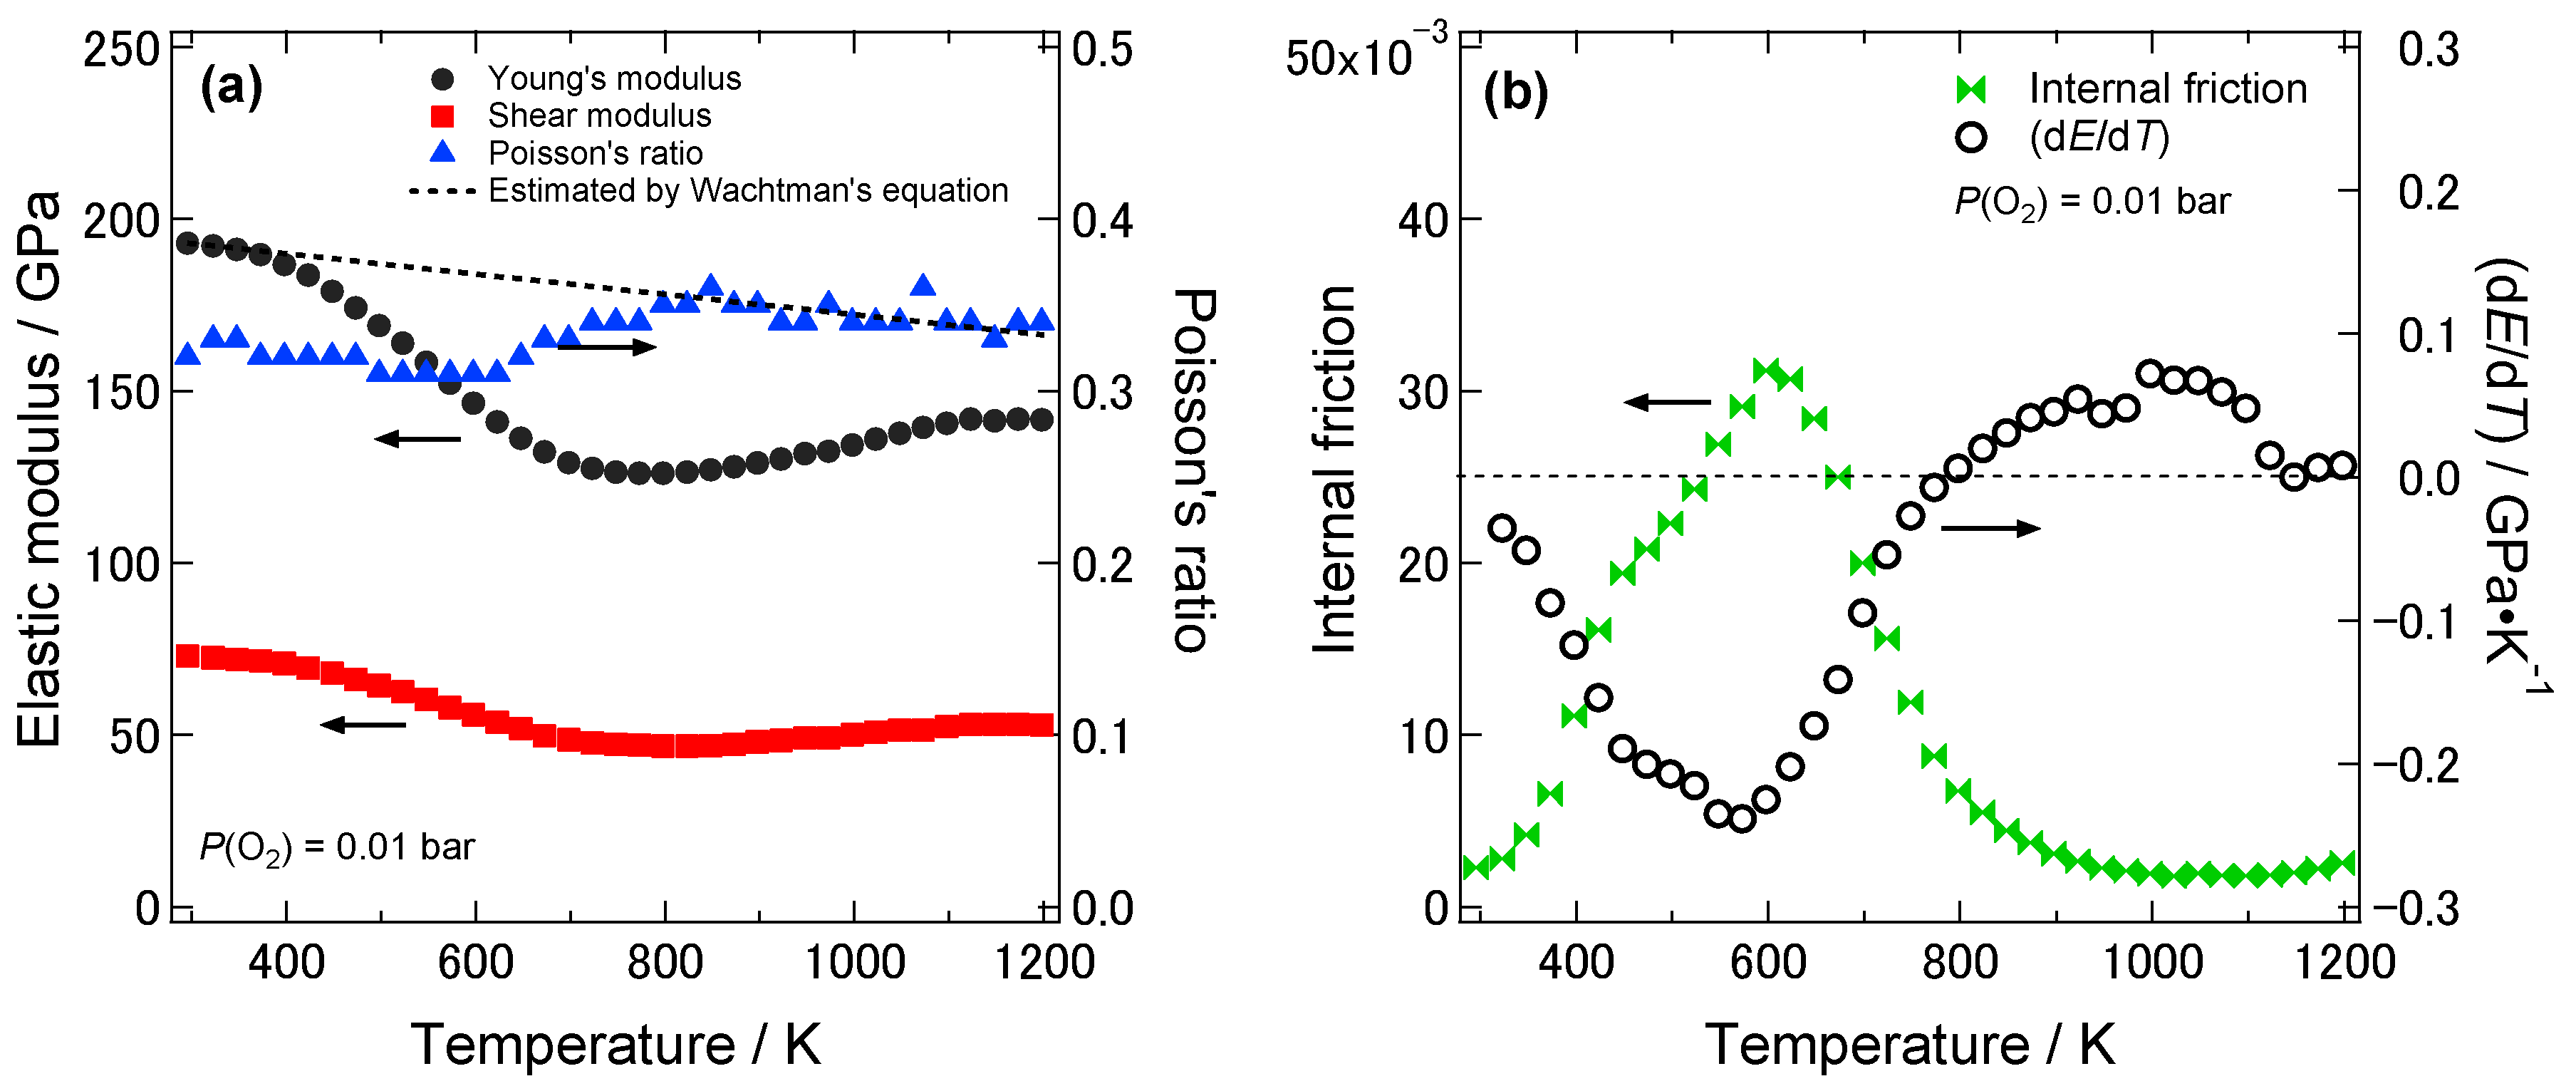
Figure 2a shows the temperature dependence of the dynamic Young’s and shear moduli and the Poisson’s ratio of 8YSZ without the aging treatment in the temperature range from room temperature to 1273 K under the P(O2) of 0.01 bar. The dynamic Young’s modulus of 8YSZ was 193 GPa at room temperature. As the temperature increased, the dynamic Young’s modulus of 8YSZ drastically decreased by 33% below 700 K. At higher temperatures, the dynamic Young’s modulus gradually increased with increasing temperature. Similar to the dynamic Young’s modulus, the dynamic shear modulus of 8YSZ drastically decreased by 33% below 700 K and gradually increased at higher temperatures as the temperature increased. The Poisson’s ratio of 8YSZ stayed almost constant in the measuring temperature range and its average value was 0.33. Figure 2b shows the temperature dependence of the internal friction and the change in the dynamic Young’s modulus with temperature, dE/dT, of 8YSZ without aging treatment under P(O2) of 0.01 bar. Two internal friction peaks were observed at around 430 and 580 K. The peak at lower temperature was smaller than that at higher temperature. The temperature range where the dE/dT was large corresponded with the temperature range where the internal friction peaks were observed
The value of the dynamic Young’s modulus at room temperature was smaller than the value we previously reported, for example, 210 GPa. The difference in the dynamic Young’s modulus is attributed to the difference in the relative density of the samples. The relative density of the sample used in this study was around 96~97% while the one used in our previous study was over 99%. Atkinson et al. reported that the composite sphere model by Ramakrishnan and Arunachalam could well describe the porosity dependence of the Young’s modulus of 8YSZ [14]. According to their model, the porosity dependence of the Young’s modulus can be described as follows [15];
  E = E 0 ( 1 p ) 2 ( 1 + b E p )  
where E, E0 and p are the Young’s modulus of the sample, the Young’s modulus at zero porosity and the porosity of the sample, respectively. The bE in Equation (1) is given by;
  b E = 2 3 v 0  
where v0 is the Poisson’s ratio at zero porosity. Regarding the dynamic Young’s modulus and the Poisson’s ratio in our previous study as the values at zero porosity, we estimated the apparent Young’s modulus of the sample used in this study. The porosity of the sample in this study was 3~4% and the dynamic Young’s modulus and the Poisson’s ratio in our previous study were about 210 GPa and 0.35, respectively. Then the apparent dynamic Young’s modulus of the sample in this study can be estimated as 186~192 GPa, which is in good agreement with the value observed in this study.
The temperature dependence of the dynamic Young’s modulus of 8YSZ greatly deviated from the one of typical refractory oxides such as Al2O3, MgO and ThO2. The Young’s moduli of those oxides gradually and monotonically decrease with increasing temperature. This temperature dependence can be interpreted due to the decrease in the strength of ionic bonds caused by increase in the atomic distance with increasing temperature, that is, thermal expansion. It is known that the temperature dependence of the Young’s moduli of the above refractory oxides can be well described by the Wachtman’s equation [16], which is expressed as;
  E = E 0 K B T exp ( T 0 / T )  
where E, E0K are the Young’s modulus of the sample and the Young’s modulus at 0 K, respectively and B, T0 are the arbitrary constants. The dynamic Young’s modulus of 8YSZ below 323 K was fitted using the Equation (4) with E0K, B, T0 as fitting parameters. The fitting curve was shown with a black broken line in Figure 2a. Such a large deviation between the experimentally obtained temperature dependence of the dynamic Young’s modulus of 8YSZ and the one estimated by the Wachtman’s equation implies that there are other factors that more greatly affect the dynamic Young’s modulus of 8YSZ than the thermal expansion. Considering that the temperature range where the dE/dT was large corresponded with the temperature range where the internal friction peaks were observed, it seems that the deviation between experimental and estimated dynamic Young’s modulus by the Wachtman’s equation was due to the mechanical damping.
The two internal friction peaks with the drastic decrease in the dynamic Young’s modulus of 8YSZ below 700 K were also observed by Gao et al. [17], Lakki et al. [18] and Kondoh et al. [19]. Gao et al. evaluated the temperature and frequency dependence of the dynamic Young’s modulus and the internal friction of yttria-doped zirconia by using a dynamic mechanical analysis [17]. They reported that the temperatures at which the two internal friction peaks were observed depended on frequency and shifted to higher temperatures with increasing frequency. This suggests that the causes of the internal friction peaks were thermally activated processes. Thus, they estimated the activation energies of these two internal friction peaks. The activation energies for the internal friction peaks at lower and higher temperatures were around 1.28, 2.67 eV, respectively. These values were consistent with other literatures [17,18]. Furthermore, they reported that the activation energy for the internal friction peak at the lower temperature was comparable with the activation energy for the reorientation of the [ Y Zr V O .. ] . complexes in 8YSZ. The [ Y Zr V O .. ] . complexes, which are formed by an Y atom and a trapped oxygen vacancy, can be regarded as the electric dipoles. Thus, these electric dipoles can reorient under an external electric field by short-range oxygen vacancies hopping around an Y atom. Furthermore, the [ Y Zr V O .. ] . complexes generate local lattice strain in the crystal. It has been proposed that such lattice defects with lower symmetry compared to the host lattice can reorient not only under an external electric field but also a stress field in specific directions [20,21,22]. The mechanism of the reorientation of [ Y Zr V O .. ] . complexes under a stress field is also the short-range oxygen vacancy hopping around the dopant atom. Considering the above discussion, it is suggested that the internal friction peak at the lower temperature and the corresponding decrease in the dynamic Young’s modulus were related to anelastic relaxation due to the short-range oxygen vacancy hopping around an Y atom in the [ Y Zr V O .. ] . complexes. The activation energy for the internal friction peak at the higher temperature was reported to be 2.67 eV, which was higher than the one at the lower temperature. The preceding studies attributed the internal friction peak at the higher temperature to anelastic relaxation of more complex associate defects such as [ 2 Y Zr V O .. ] x or to the local ordering of oxygen vacancies [17,23]. The cause of the internal friction peak at the higher temperature will be further discussed later.
One of the other possible causes for the peculiar temperature dependence of the dynamic Young’s modulus of 8YSZ is phase transition. There are several reports that show the phase transition have a large influence on Young’s modulus [24,25,26]. Our previous studies also have confirmed that the dynamic Young’s modulus of scandia-doped zirconia significantly decreased below the phase transition temperature, T* and then increased above T* with increasing temperature [9]. If our 8YSZ sample was subjected to the phase transition during the temperature dependence measurement, the dynamic Young’s modulus of our 8YSZ sample may be influenced by the phase transition. The phase diagram of yttria-doped zirconia has been extensively studied [27,28,29,30,31]. However, it is known that the phase state of the yttria-doped zirconia depends on synthesis and/or annealing condition due to the slow kinetics, especially at low temperatures [27]. Therefore, there are remarkable discrepancies in the phase state of yttria-doped zirconia especially under 1273 K. Some literatures reported that 8YSZ was cubic phase below 1273 K [28,29] while other literatures reported that 8YSZ was subjected to the phase transition from the mixed phase of monoclinic and cubic phases to the mixed phase of tetragonal and cubic phases below 1273 K [30,31]. Furthermore, Yashima et al. reported that there was metastable tetragonal phase, t’’, in the ZrO2-Y2O3 solid solution (around 6.5~11 mol% Y2O3, below 1673 K), whose space group was assigned to be P42/nmc [27,32]. The axial ratio of this metastable tetragonal t’’ phase is unity but O atoms are displaced along the c-axis making the symmetry tetragonal. Thus, it is difficult to distinguish the t’’ phase from cubic phase by using XRD because O atoms have a smaller scattering factor than Zr or Y atoms. Yashima et al. confirmed the existence of t’’ phase by observing the Raman peak at around 470 cm−1, which was characteristic of the tetragonal phase [32].
In order to investigate the phase state of our 8YSZ samples, the XRD and Raman spectroscopy measurements were conducted at room temperature. 
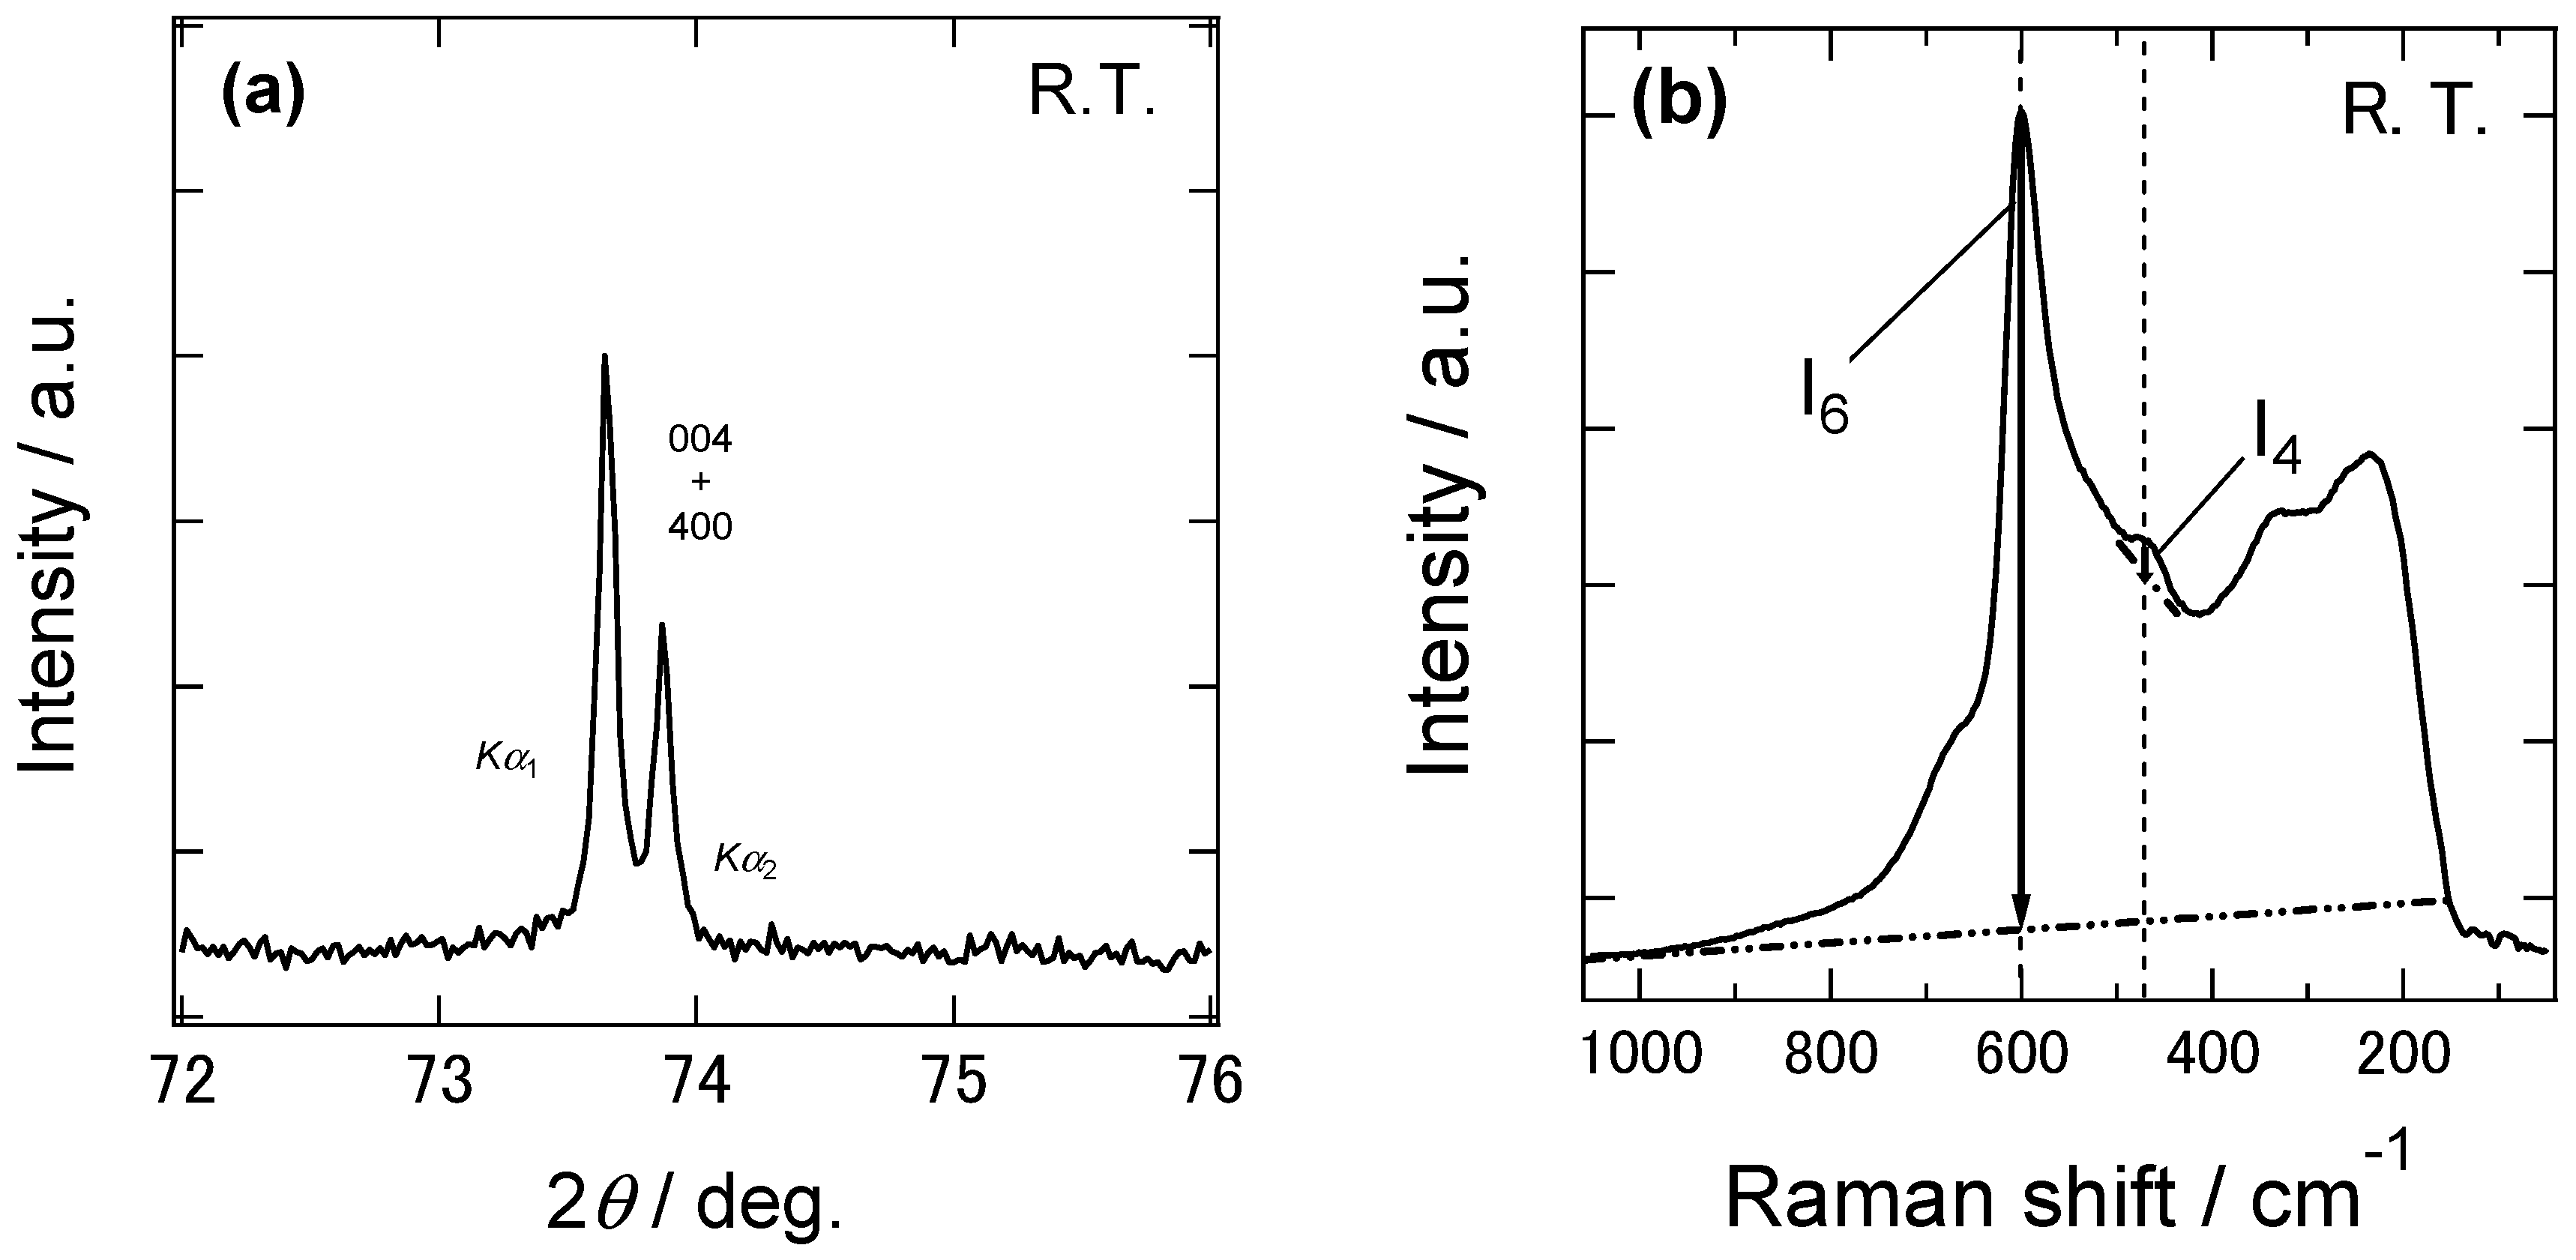
Figure 3a shows the X-ray diffraction patterns at 2θ = 70~78° of the 8YSZ sample without aging treatment. If 8YSZ is in cubic or tetragonal phase, only 004 (400) peak is observed in this angle range. On the other hand, splitting between 004 and 400 peaks are observed if 8YSZ is in monoclinic phase. As shown in this figure, there was no splitting between 004 and 400 peaks. This indicates that the monoclinic phase was not contained in the 8YSZ sample without aging treatment at room temperature. Figure 3b shows the Raman spectrum of the same 8YSZ sample. A peak at around 470 cm−1, which was characteristic of tetragonal ZrO2-Y2O3 solid solution, was clearly observed. These results suggest that the 8YSZ sample without aging treatment was in the metastable tetragonal t’’ phase or the mixed phase of the t’’ phase and cubic phase at room temperature. 
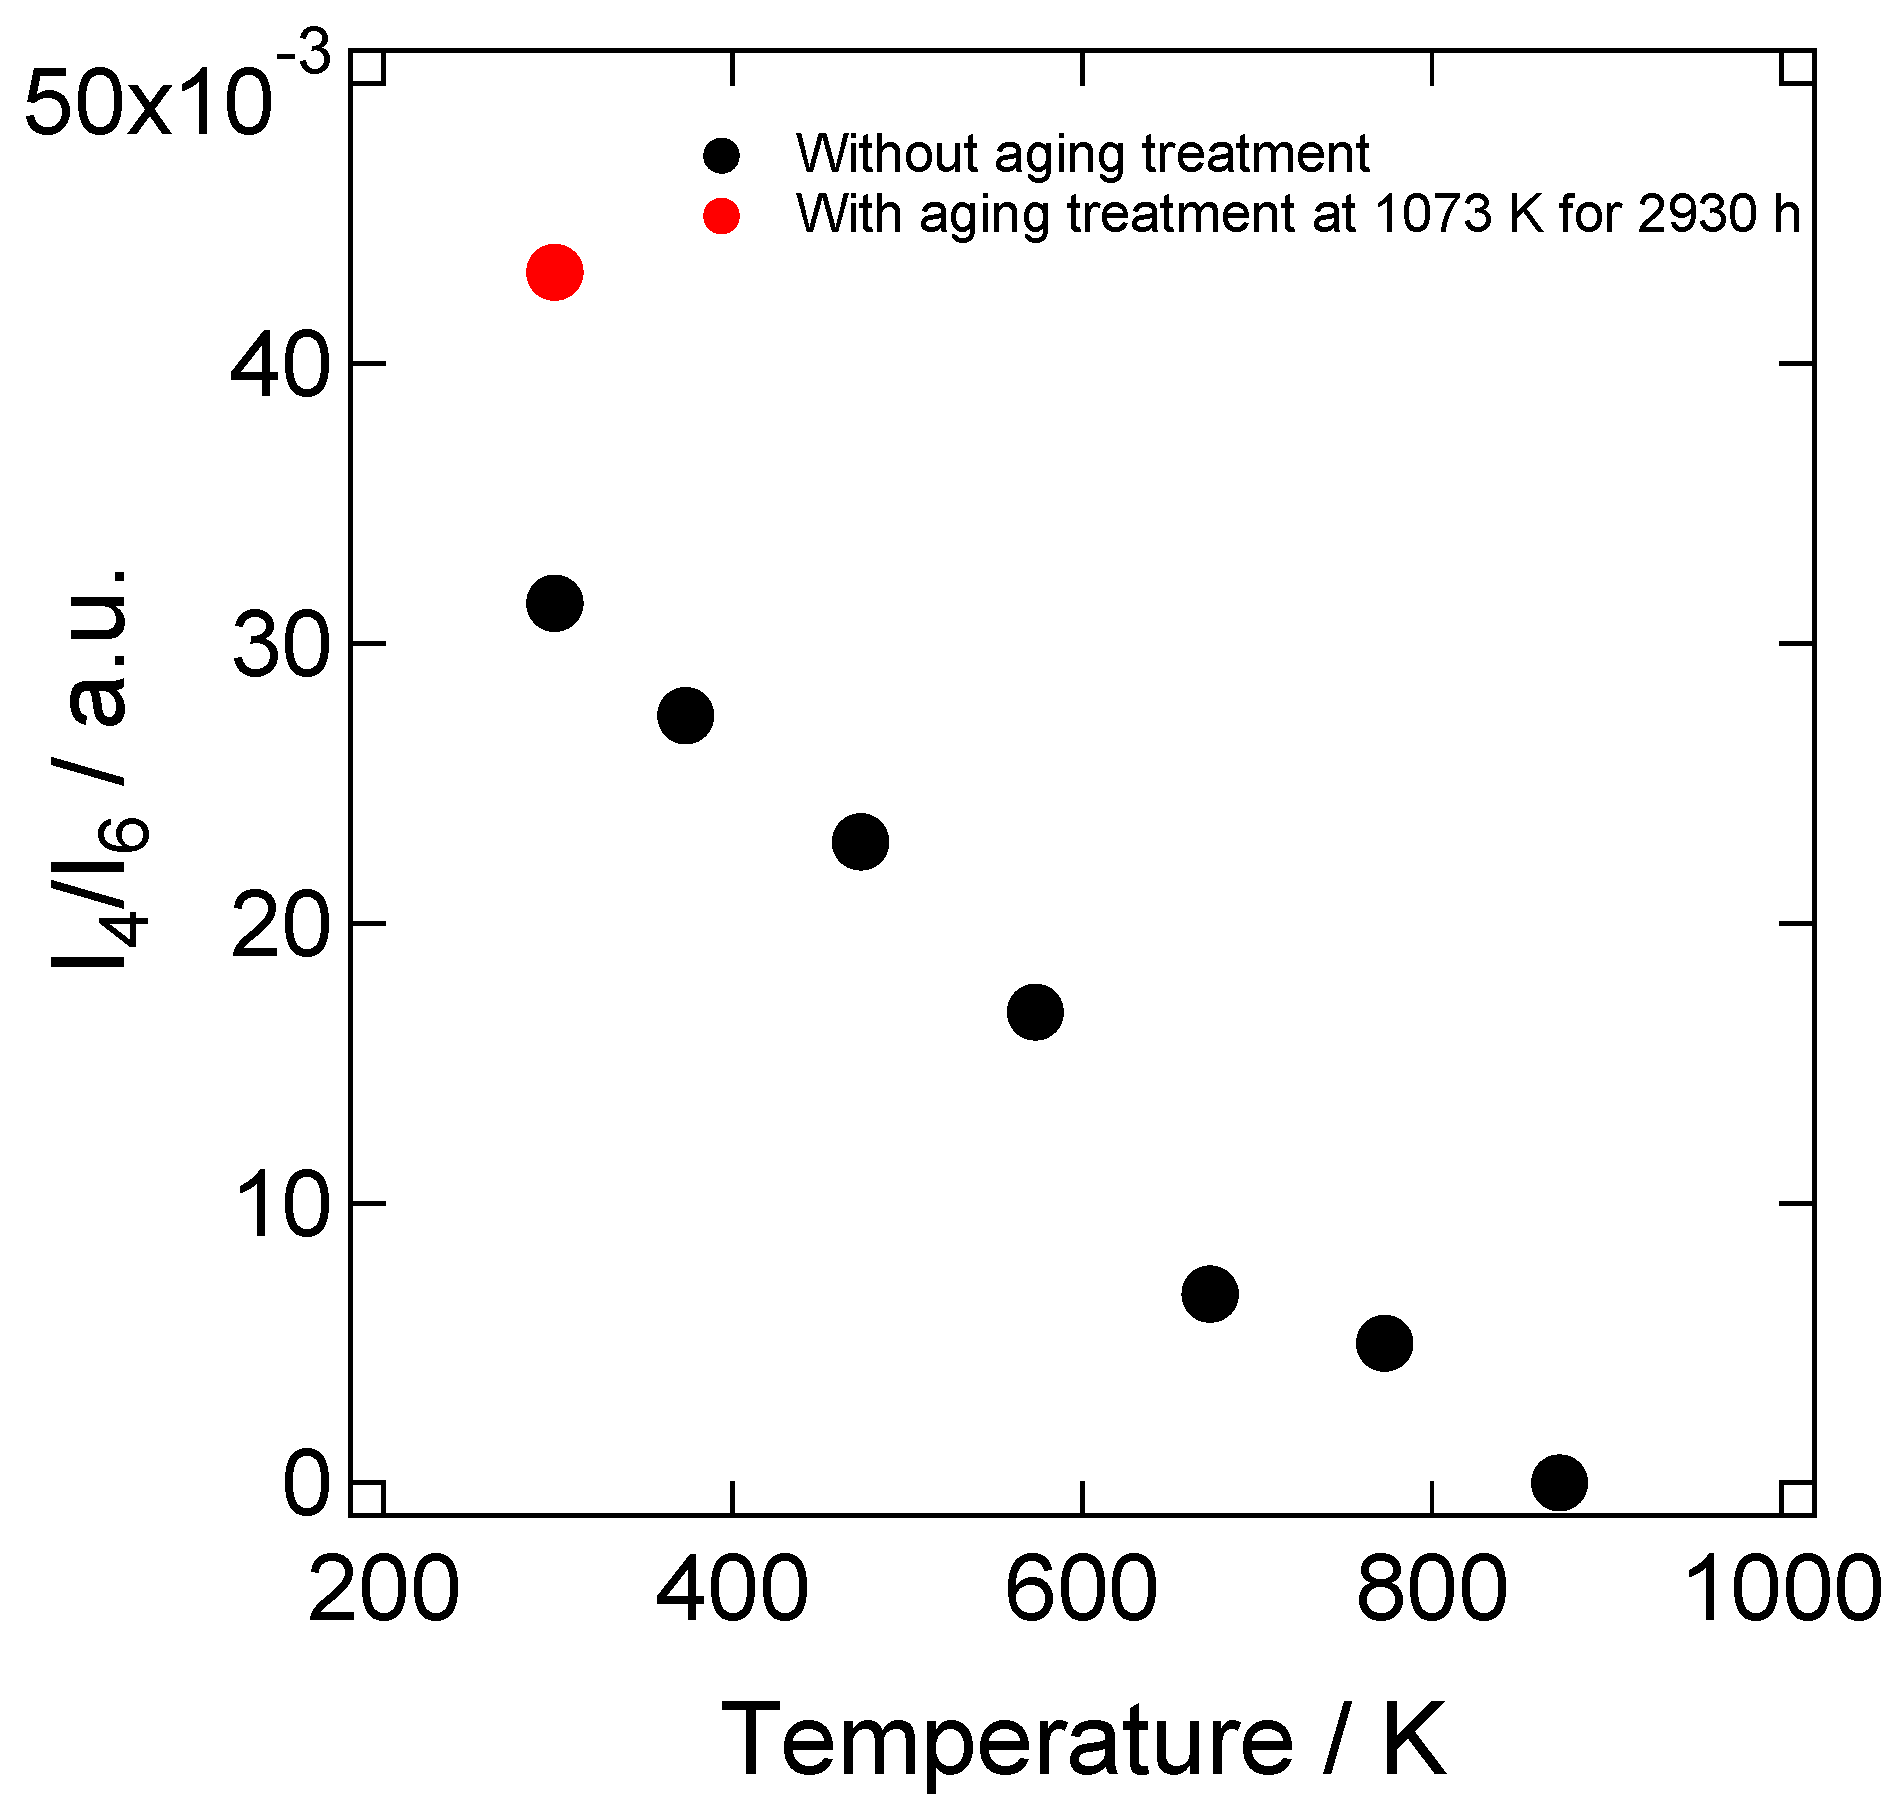
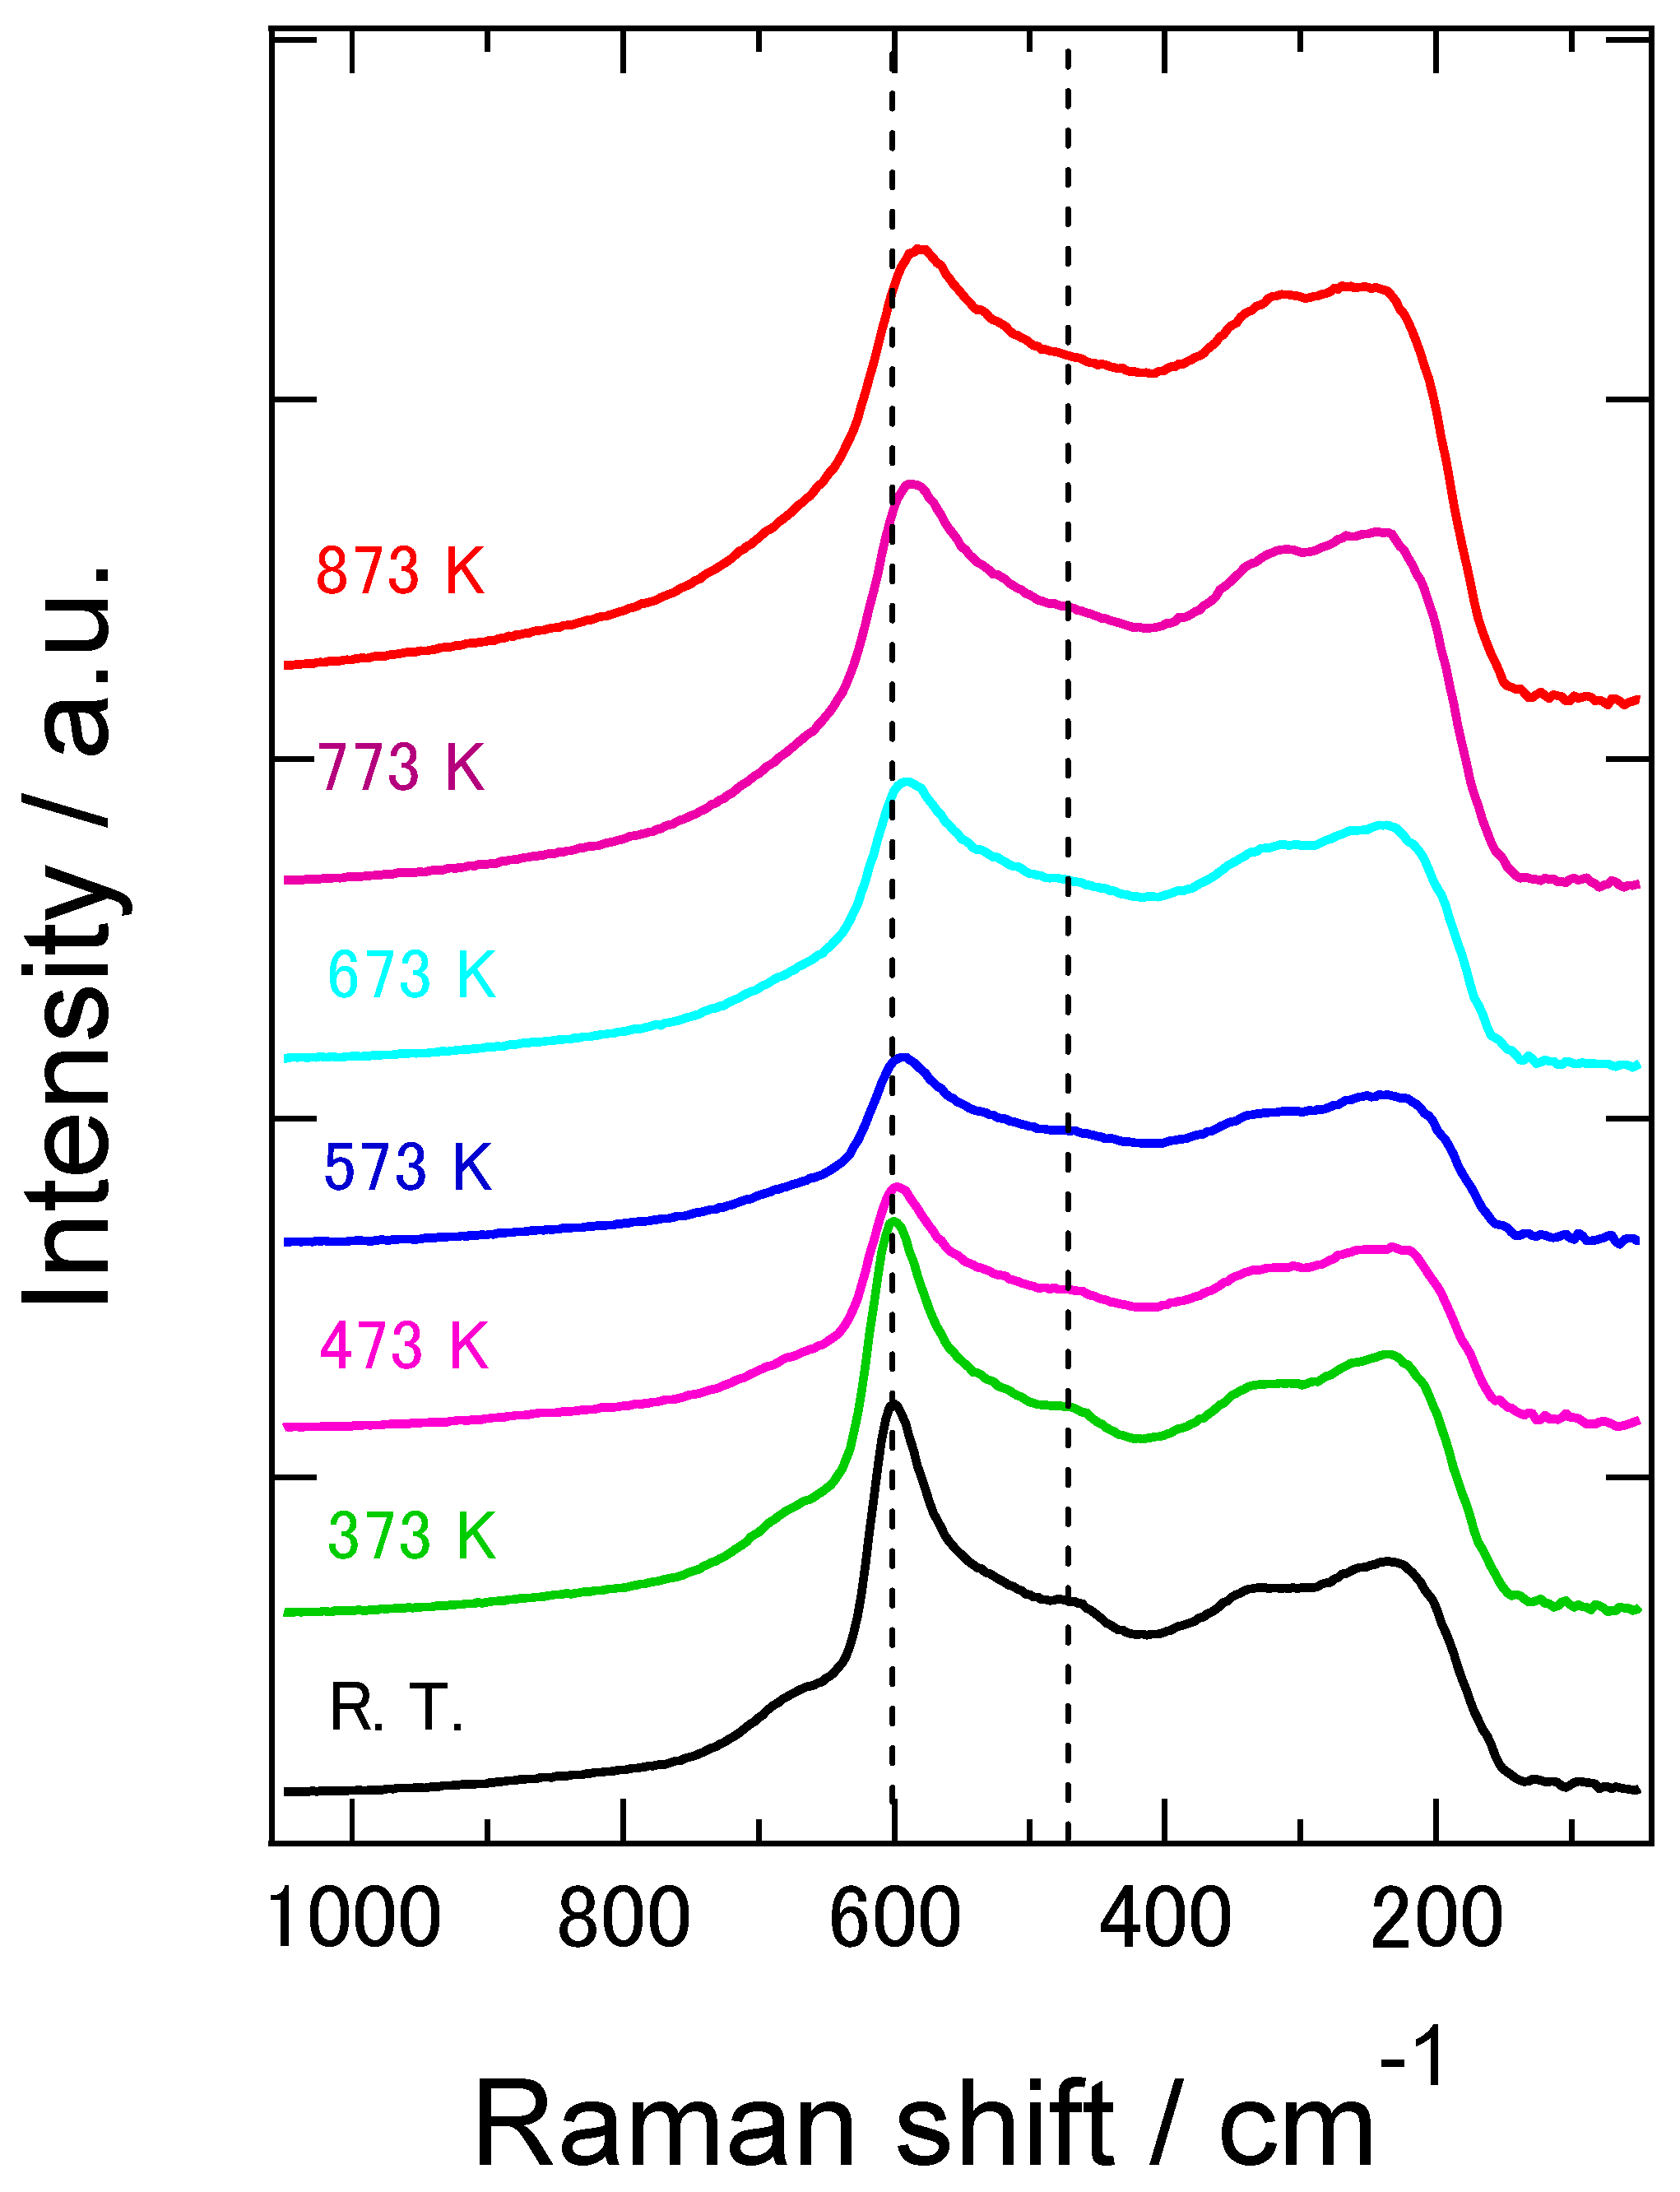
Figure 4 shows the Raman spectra of the 8YSZ sample without aging treatment measured from room temperature to 873 K. It seems that the peak at around 470 cm−1 decreased with increasing temperature. Yashima et al. used the peak height ratio of the peaks at around 610 and 470 cm−1, I4/I6, to determine the phase boundary between the cubic phase and the mixed phase containing t’’ phase [32]. Following their analysis, we evaluated the temperature dependence of I4/I6, as depicted in Figure 5. The peak height ratio monotonically decreased with increasing temperature and became almost zero at around 873 K. This suggests that the 8YSZ sample without aging treatment was subjected to the phase transition from metastable tetragonal t’’ phase to cubic phase at around 873 K. If this phase transition influences the dynamic Young’s modulus, the anomalous change in the dynamic Young’s modulus should be observed at around 873 K. However, the dynamic Young’s modulus of 8YSZ monotonically increased with increasing temperature and no anomalous change was observed at around 873 K. Therefore, we concluded that there might be the phase transition from t’’ phase to cubic phase at around 873 K but it had little impact on the dynamic Young’s modulus of 8YSZ.

3.2. Change in the Conductivity of 8YSZ during Aging

Figure 6 shows the conductivity of the 8YSZ with the aging treatment as a function of aging time. There was a comparatively sudden decrease in the conductivity from the beginning of the aging treatment to approximately 1500 h. After approximately 1500 h, the conductivity gradually decreased with increasing the aging time. In Figure 6, the aging-time dependence of the conductivity of 8YSZ at 1073 K, which was measured by Kondoh et al., was also shown for comparison [7]. Although the initial decrease in the conductivity observed in this work was less severe than that observed by Kondoh et al., the conductivity of 8YSZ in this work showed similar aging-time dependence with that reported by Kondoh et al.

3.3. Change in the Mechanical Properties of 8YSZ with the Aging Treatment

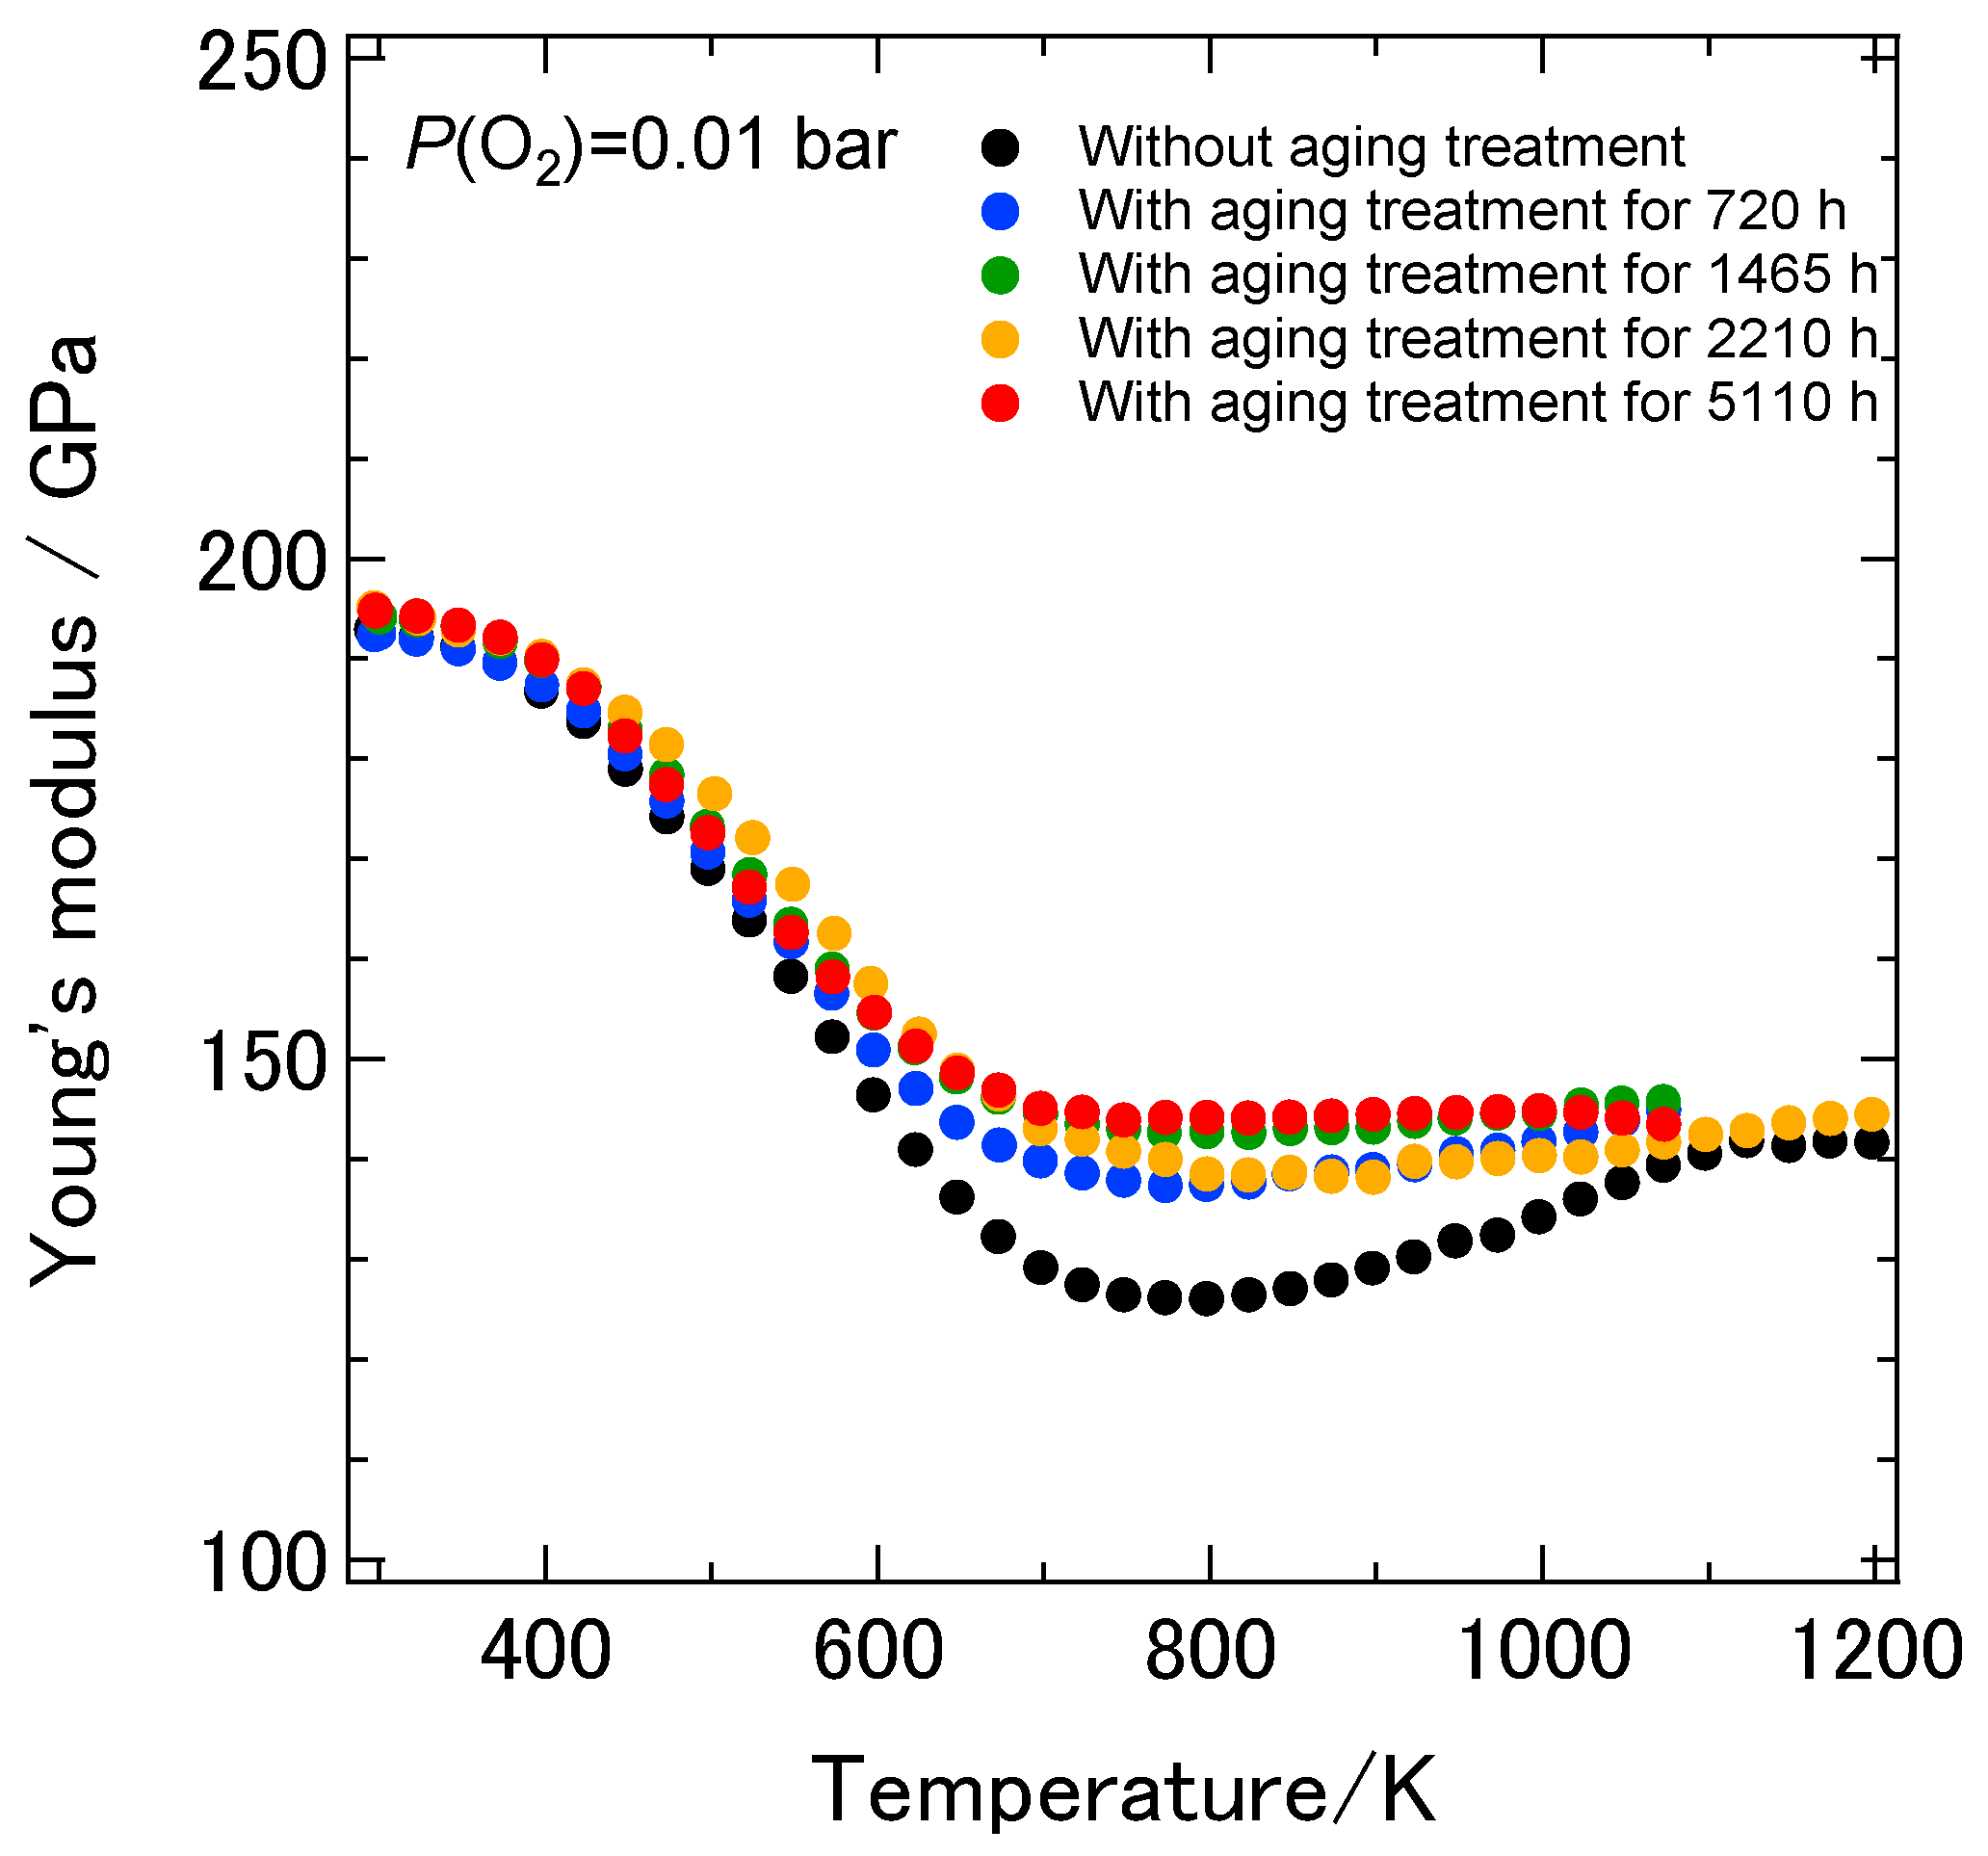
Figure 7 shows the temperature dependence of the dynamic Young’s modulus of the 8YSZ sample without the aging treatment and those with the aging treatment for 720, 1465, 2210 and 5110 h. As described earlier, the dynamic Young’s modulus of 8YSZ without aging treatment was 193 GPa at room temperature. It drastically decreased by 33% below 773 K and gradually increased above 773 K with increasing temperatures. The dynamic Young’s modulus of the 8YSZ sample with the aging treatment for 720 h was 192 GPa at room temperature and comparable to the one without the aging treatment. It drastically decreased by approximately 20% below 600 K and was not greatly changed above 600 K with increasing temperature. The temperature dependence of the dynamic Young’s modulus of the samples with the aging treatment for longer than 720 h was close to that of the sample with the aging treatment for 720 h. It can be said that the difference in the dynamic Young’s modulus between the samples with and without the aging treatment was most significant in the intermediate temperature range from 600 to 1073 K. 
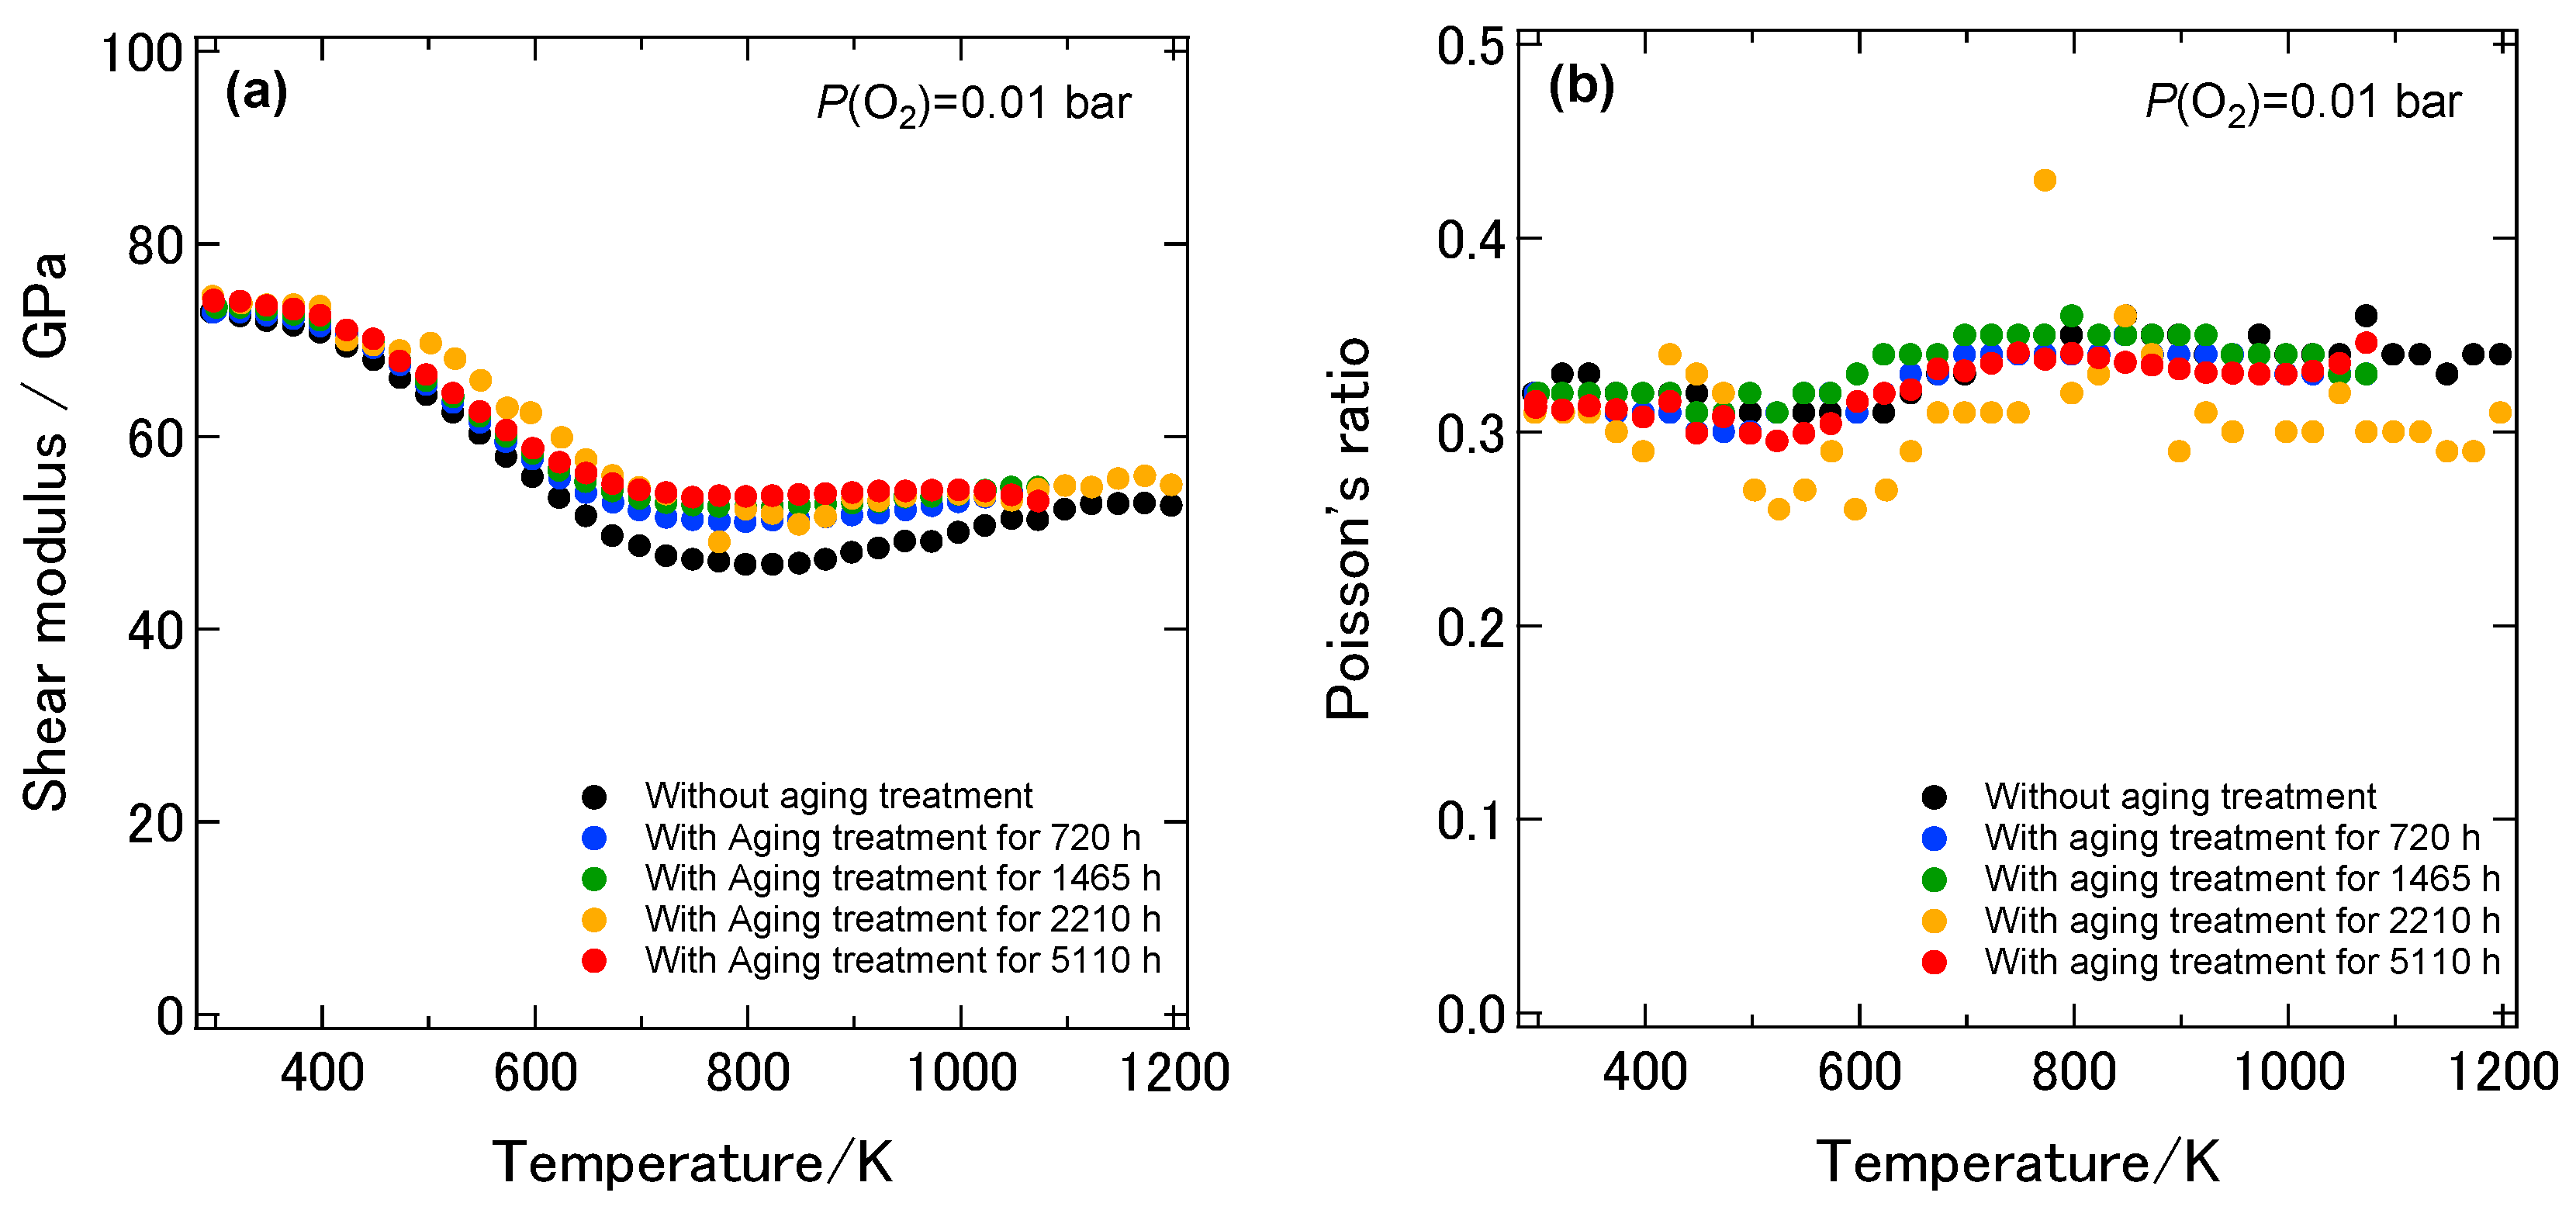
Figure 8a shows the temperature dependence of the dynamic shear modulus of the 8YSZ samples with and without the aging treatment. Irrespective of the aging time, the dynamic shear modulus of the 8YSZ sample with the aging treatment drastically decreased by around 20% below 600 K and was not greatly changed above 600 K with increasing temperature. Figure 8b shows the temperature dependence of the Poisson’s ratio of the 8YSZ samples with and without the aging treatment. The absolute values and the temperature dependence of the Poisson’s ratio did not significantly vary by the aging treatment. The Poisson’s ratio stayed almost constant in the measuring temperature range and its average value was about 0.33. 
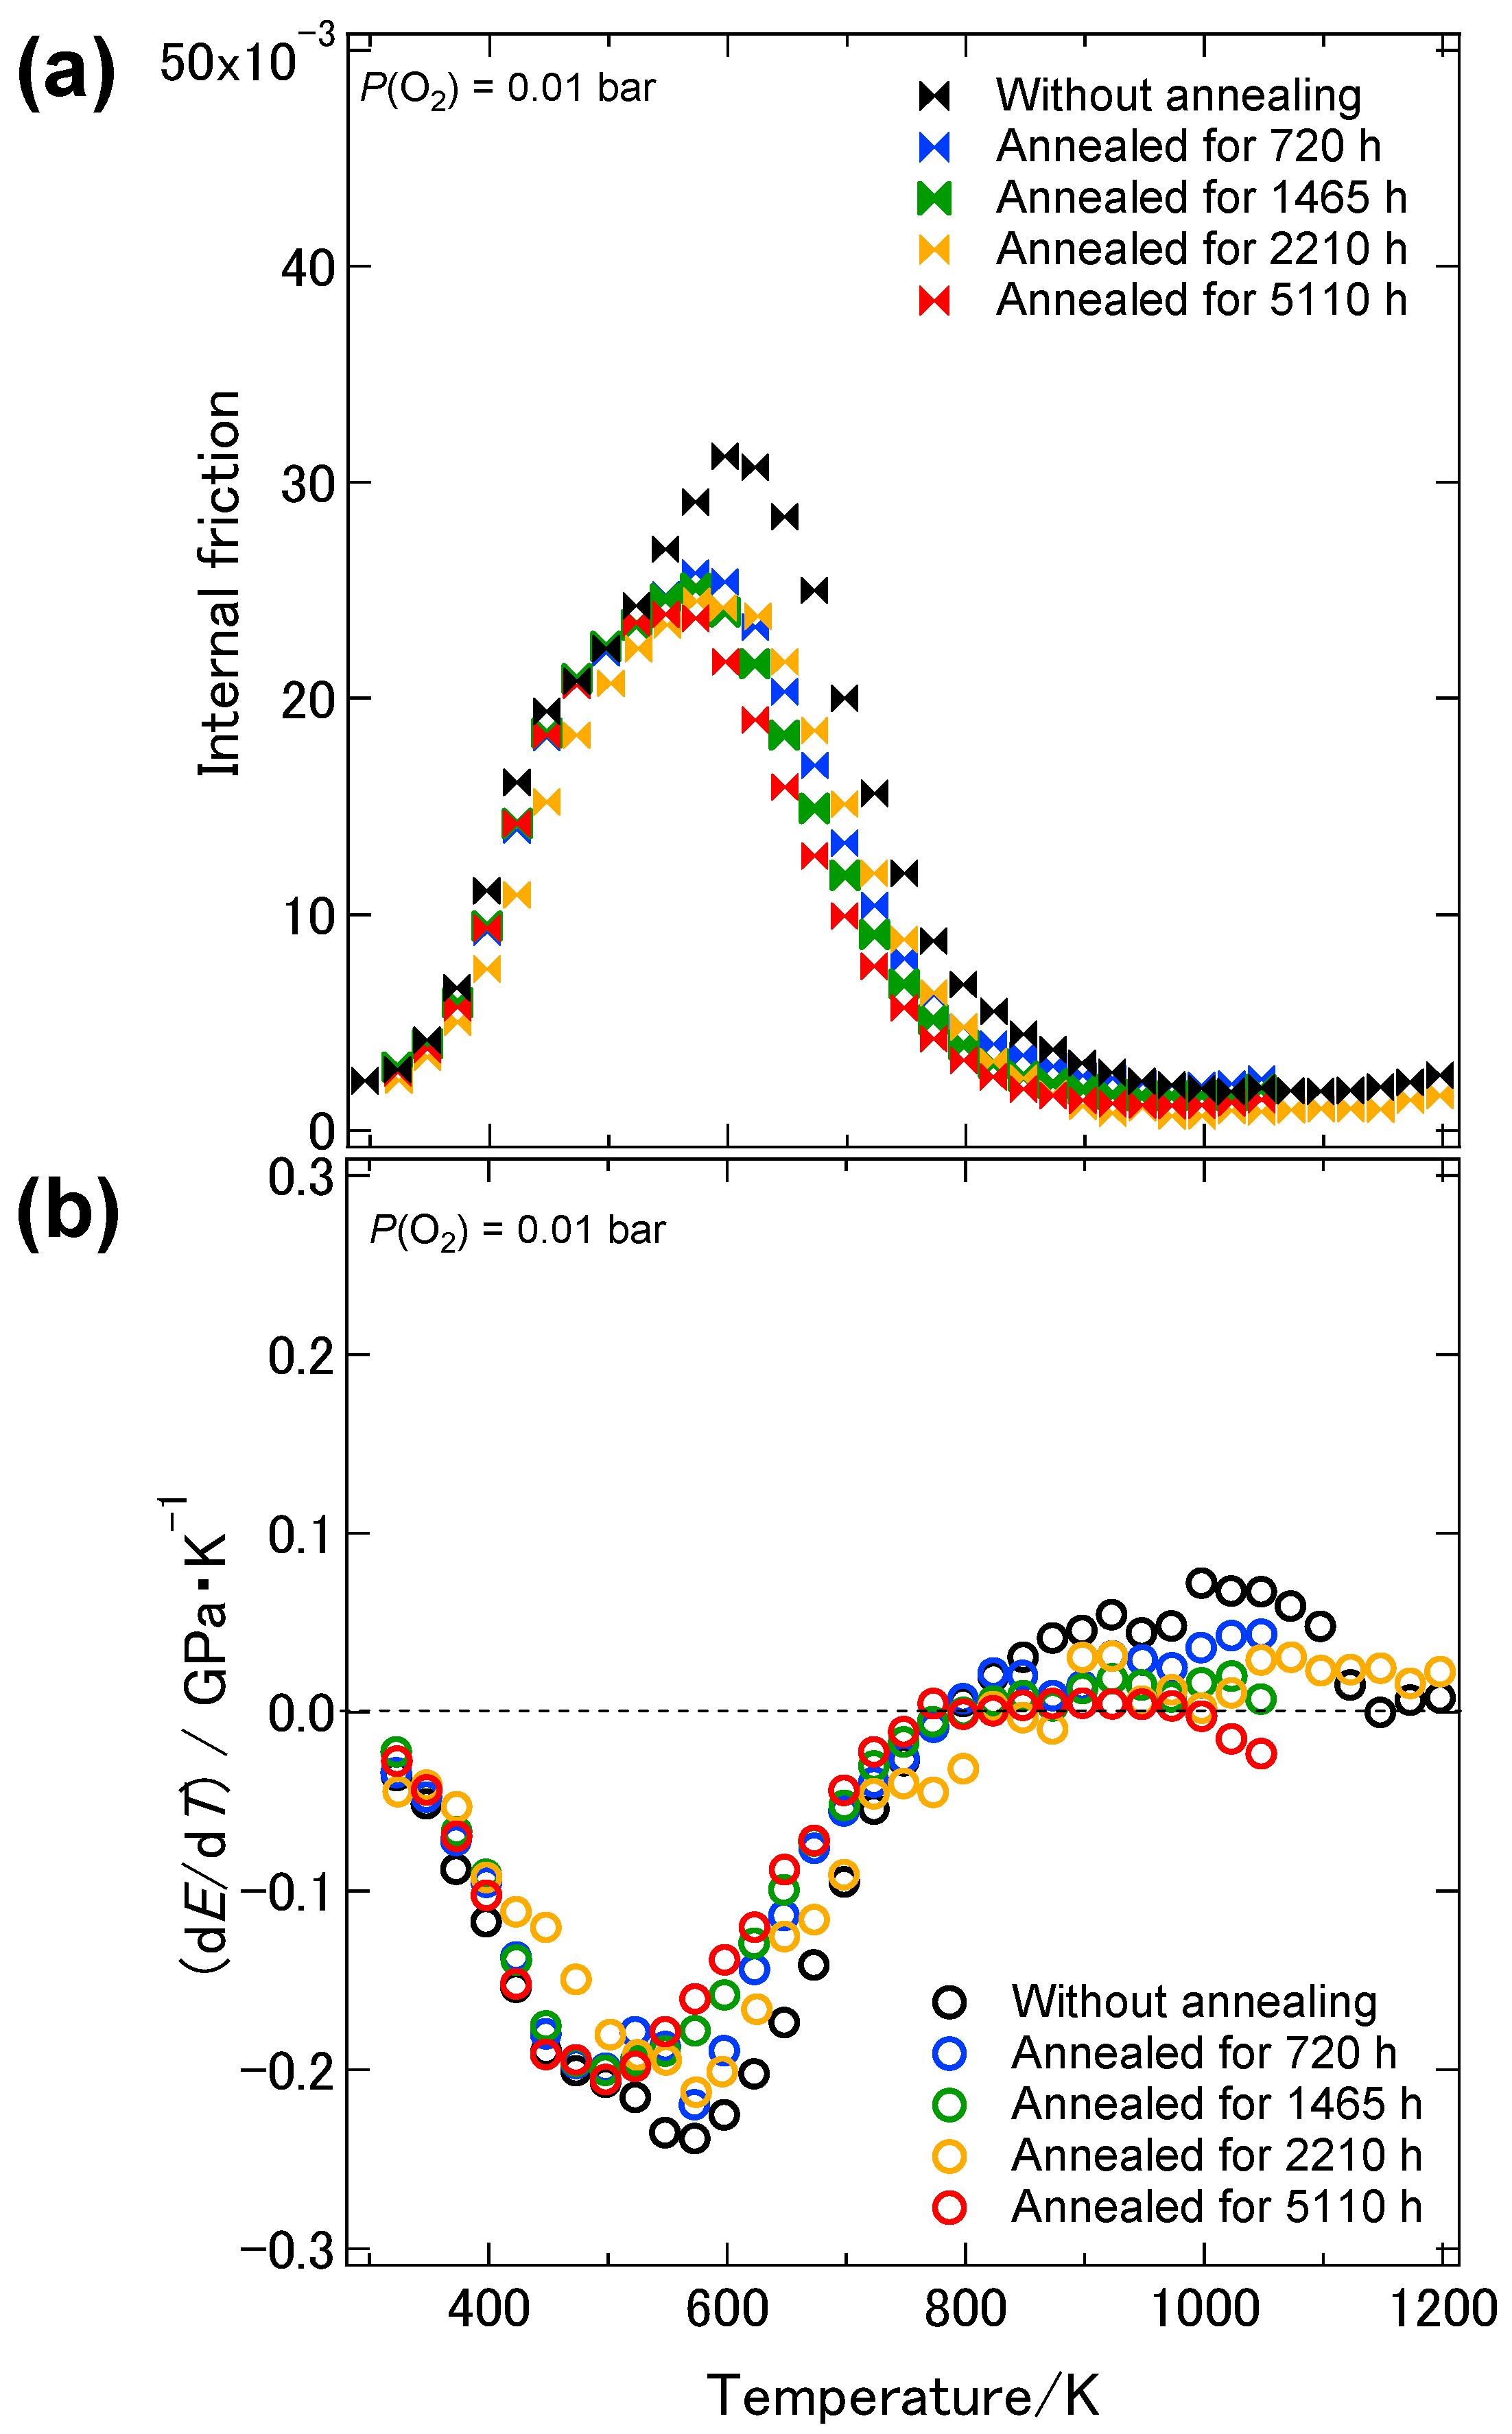
Figure 9a,b shows the internal friction and the change in the dynamic Young’s modulus with temperature, dE/dT, of the 8YSZ samples with and without the aging treatment. Similar to the sample without the aging treatment, two internal friction peaks were observed at around 430 and 580 K with the 8YSZ sample with the aging treatment for 720 h. The height of the internal friction peak at the lower temperature was almost the same as that without the aging treatment. On the other hand, the height of the internal friction peak at the higher temperature was smaller than that without the aging treatment. The temperature dependence of the internal friction peaks of the 8YSZ samples with the aging treatment did not significantly depend on the aging time. The temperature range where the internal friction peaks were observed corresponded with the temperature range where the dE/dT was large. This suggests that the drastic decrease in the dynamic Young’s modulus was caused by the mechanical damping. Considering the above, the difference in the dynamic Young’s modulus of the 8YSZ sample with and without the aging treatment in the intermediate temperature range may be related with the decrease in the internal friction peak at the higher temperature.
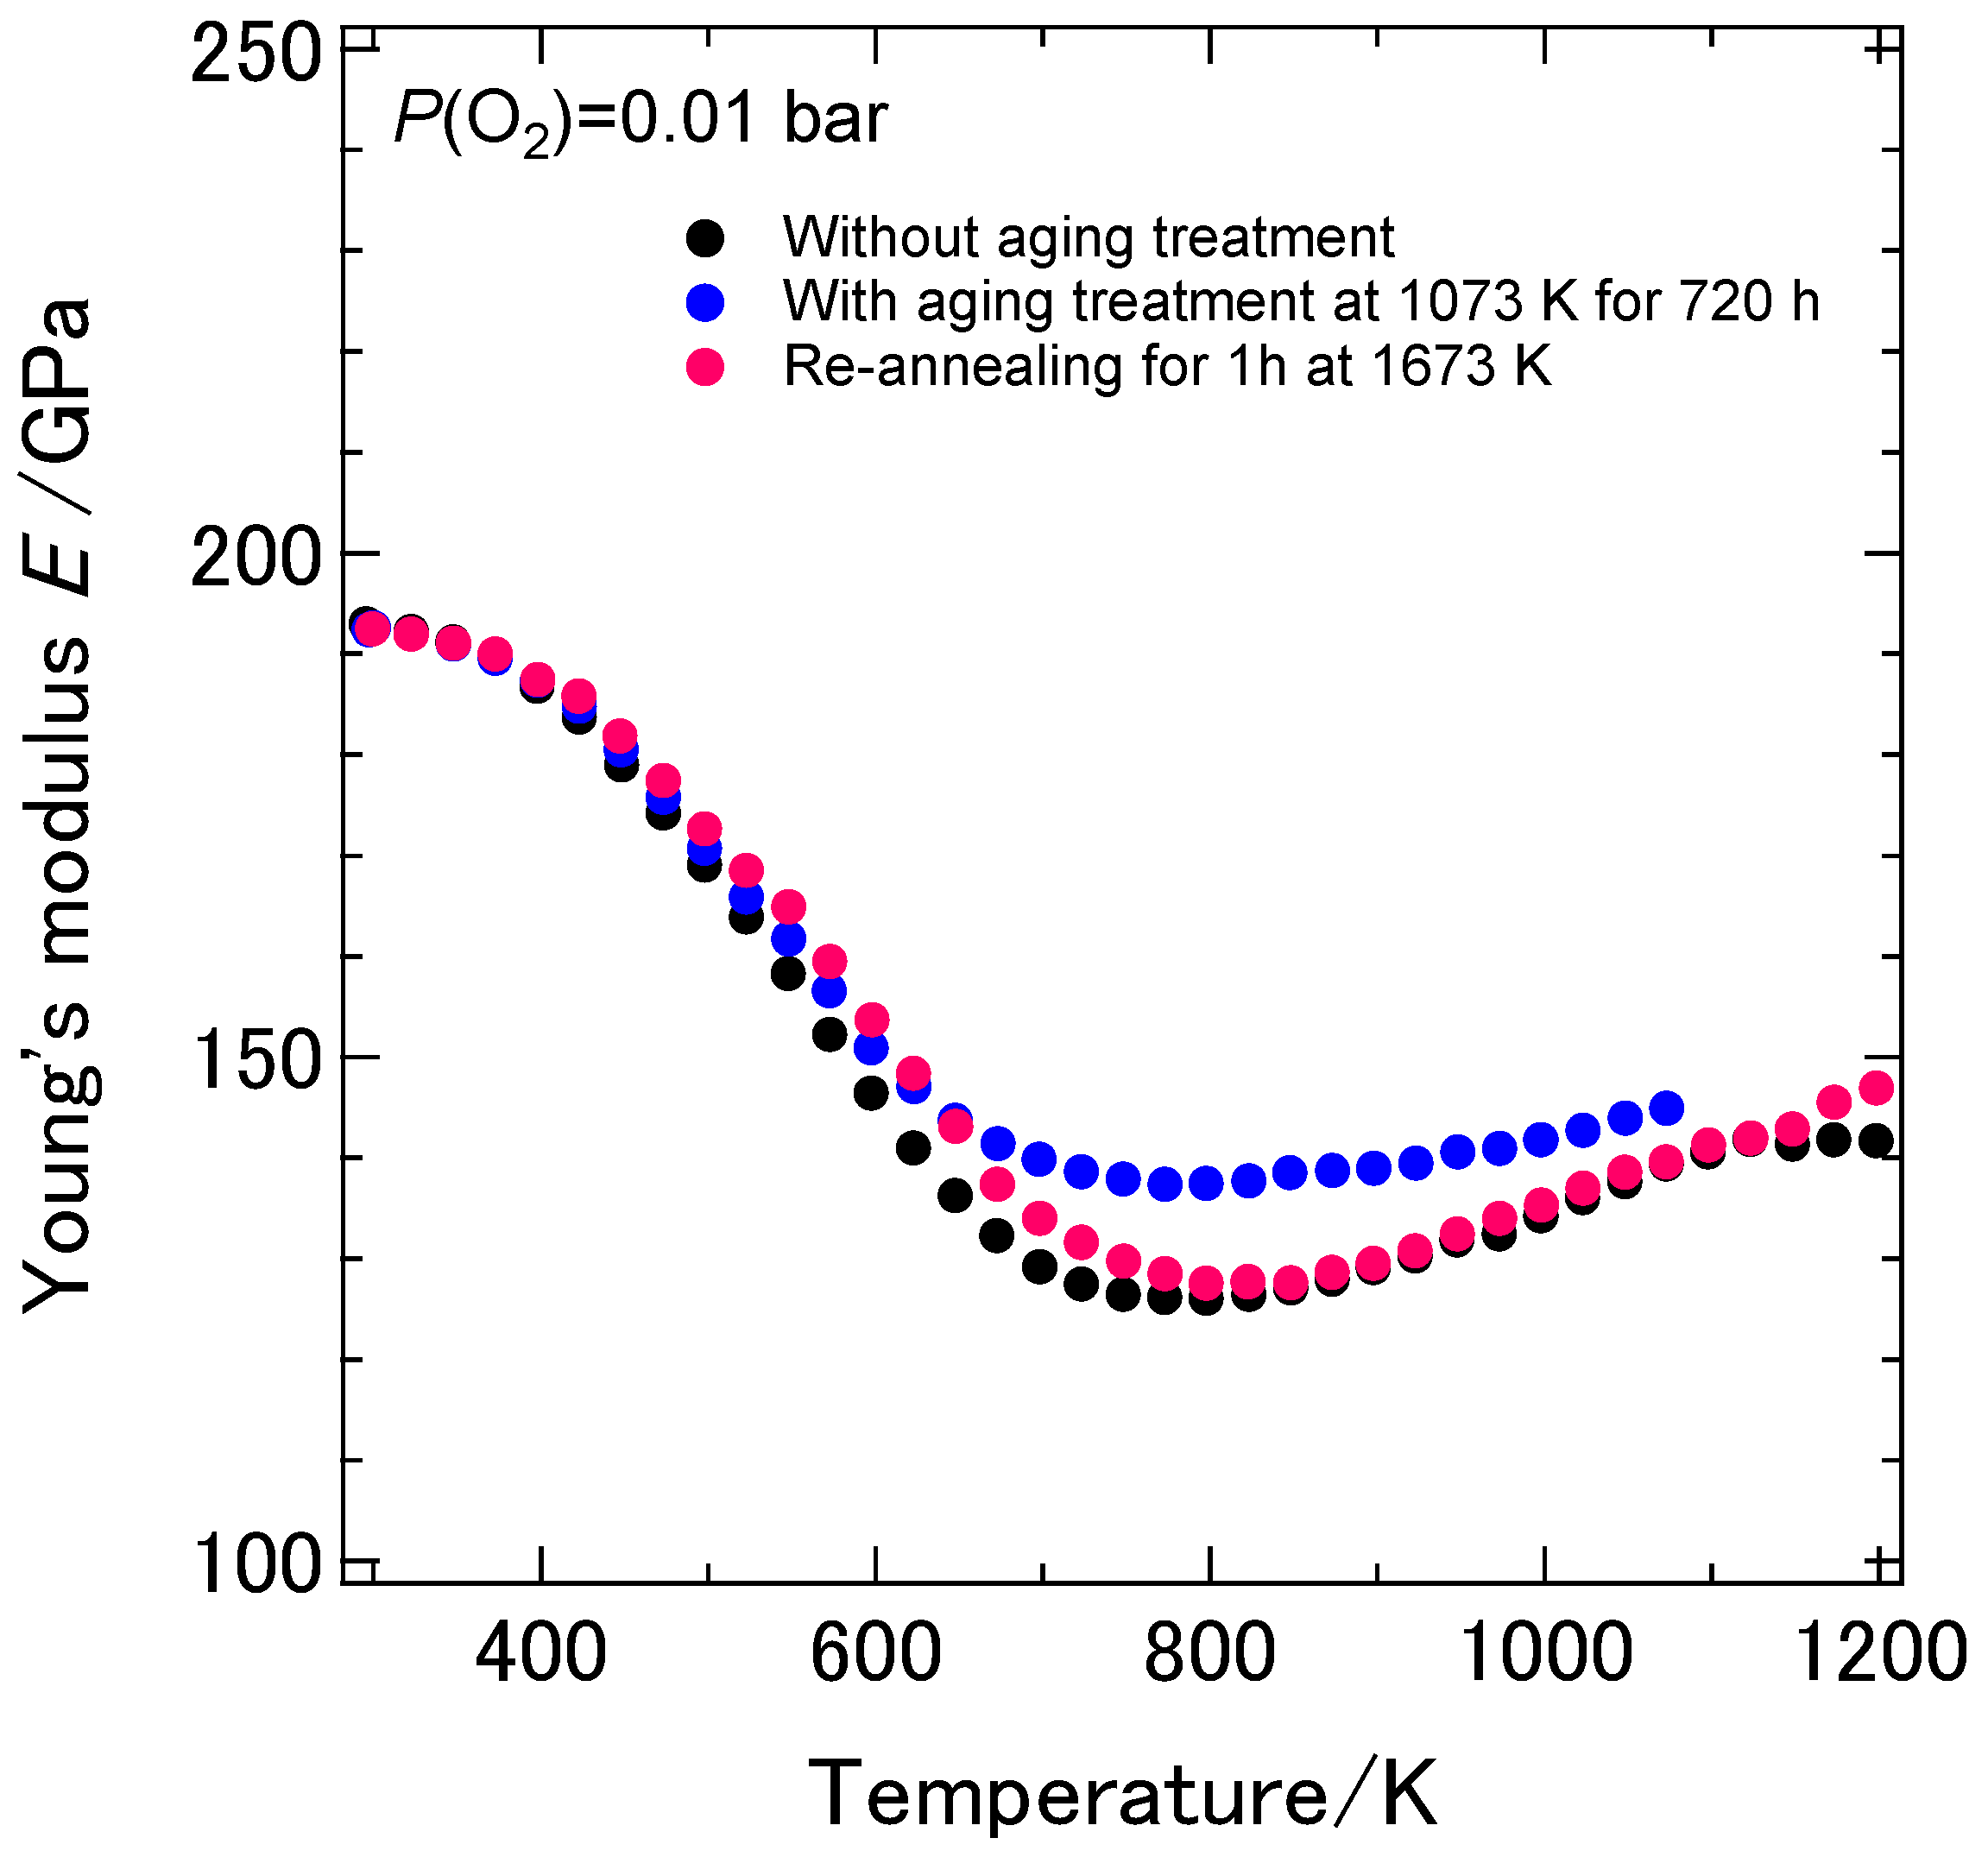
It should be verified that the above-mentioned changes in the temperature dependence of the dynamic Young’s and shear moduli were due to the aging effect but not due to the irreversible microstructural changes in the samples such as grain growth or generation of micro cracks during the aging treatment. We observed the microstructure of the sample without and with the aging treatment for 2210 h by using SEM. No micro cracks or other mechanical defects were observed after the aging treatment for 2210 h. On the other hand, the average grain size of the 8YSZ sample increased from 3 to 7 μm. In order to verify the changes in the dynamic elastic moduli after aging was due to the aging effect or the irreversible microstructural changes, the sample with the aging treatment for 720 h was re-annealed at 1673 K for 1 h after the resonance measurement and then the temperature dependence of the mechanical properties were measured. Figure 10 shows the temperature dependence of the dynamic Young’s modulus of the sample before and after re-annealing and that of the sample without the aging treatment. The temperature dependence of the dynamic Young’s modulus of the re-annealed sample was similar to that of the sample without the aging treatment. This fact indicates that the changes in the temperature dependence of the dynamic Young’s modulus of 8YSZ were attributed to the aging effect and those changes can be reverted by the annealing at higher temperatures.
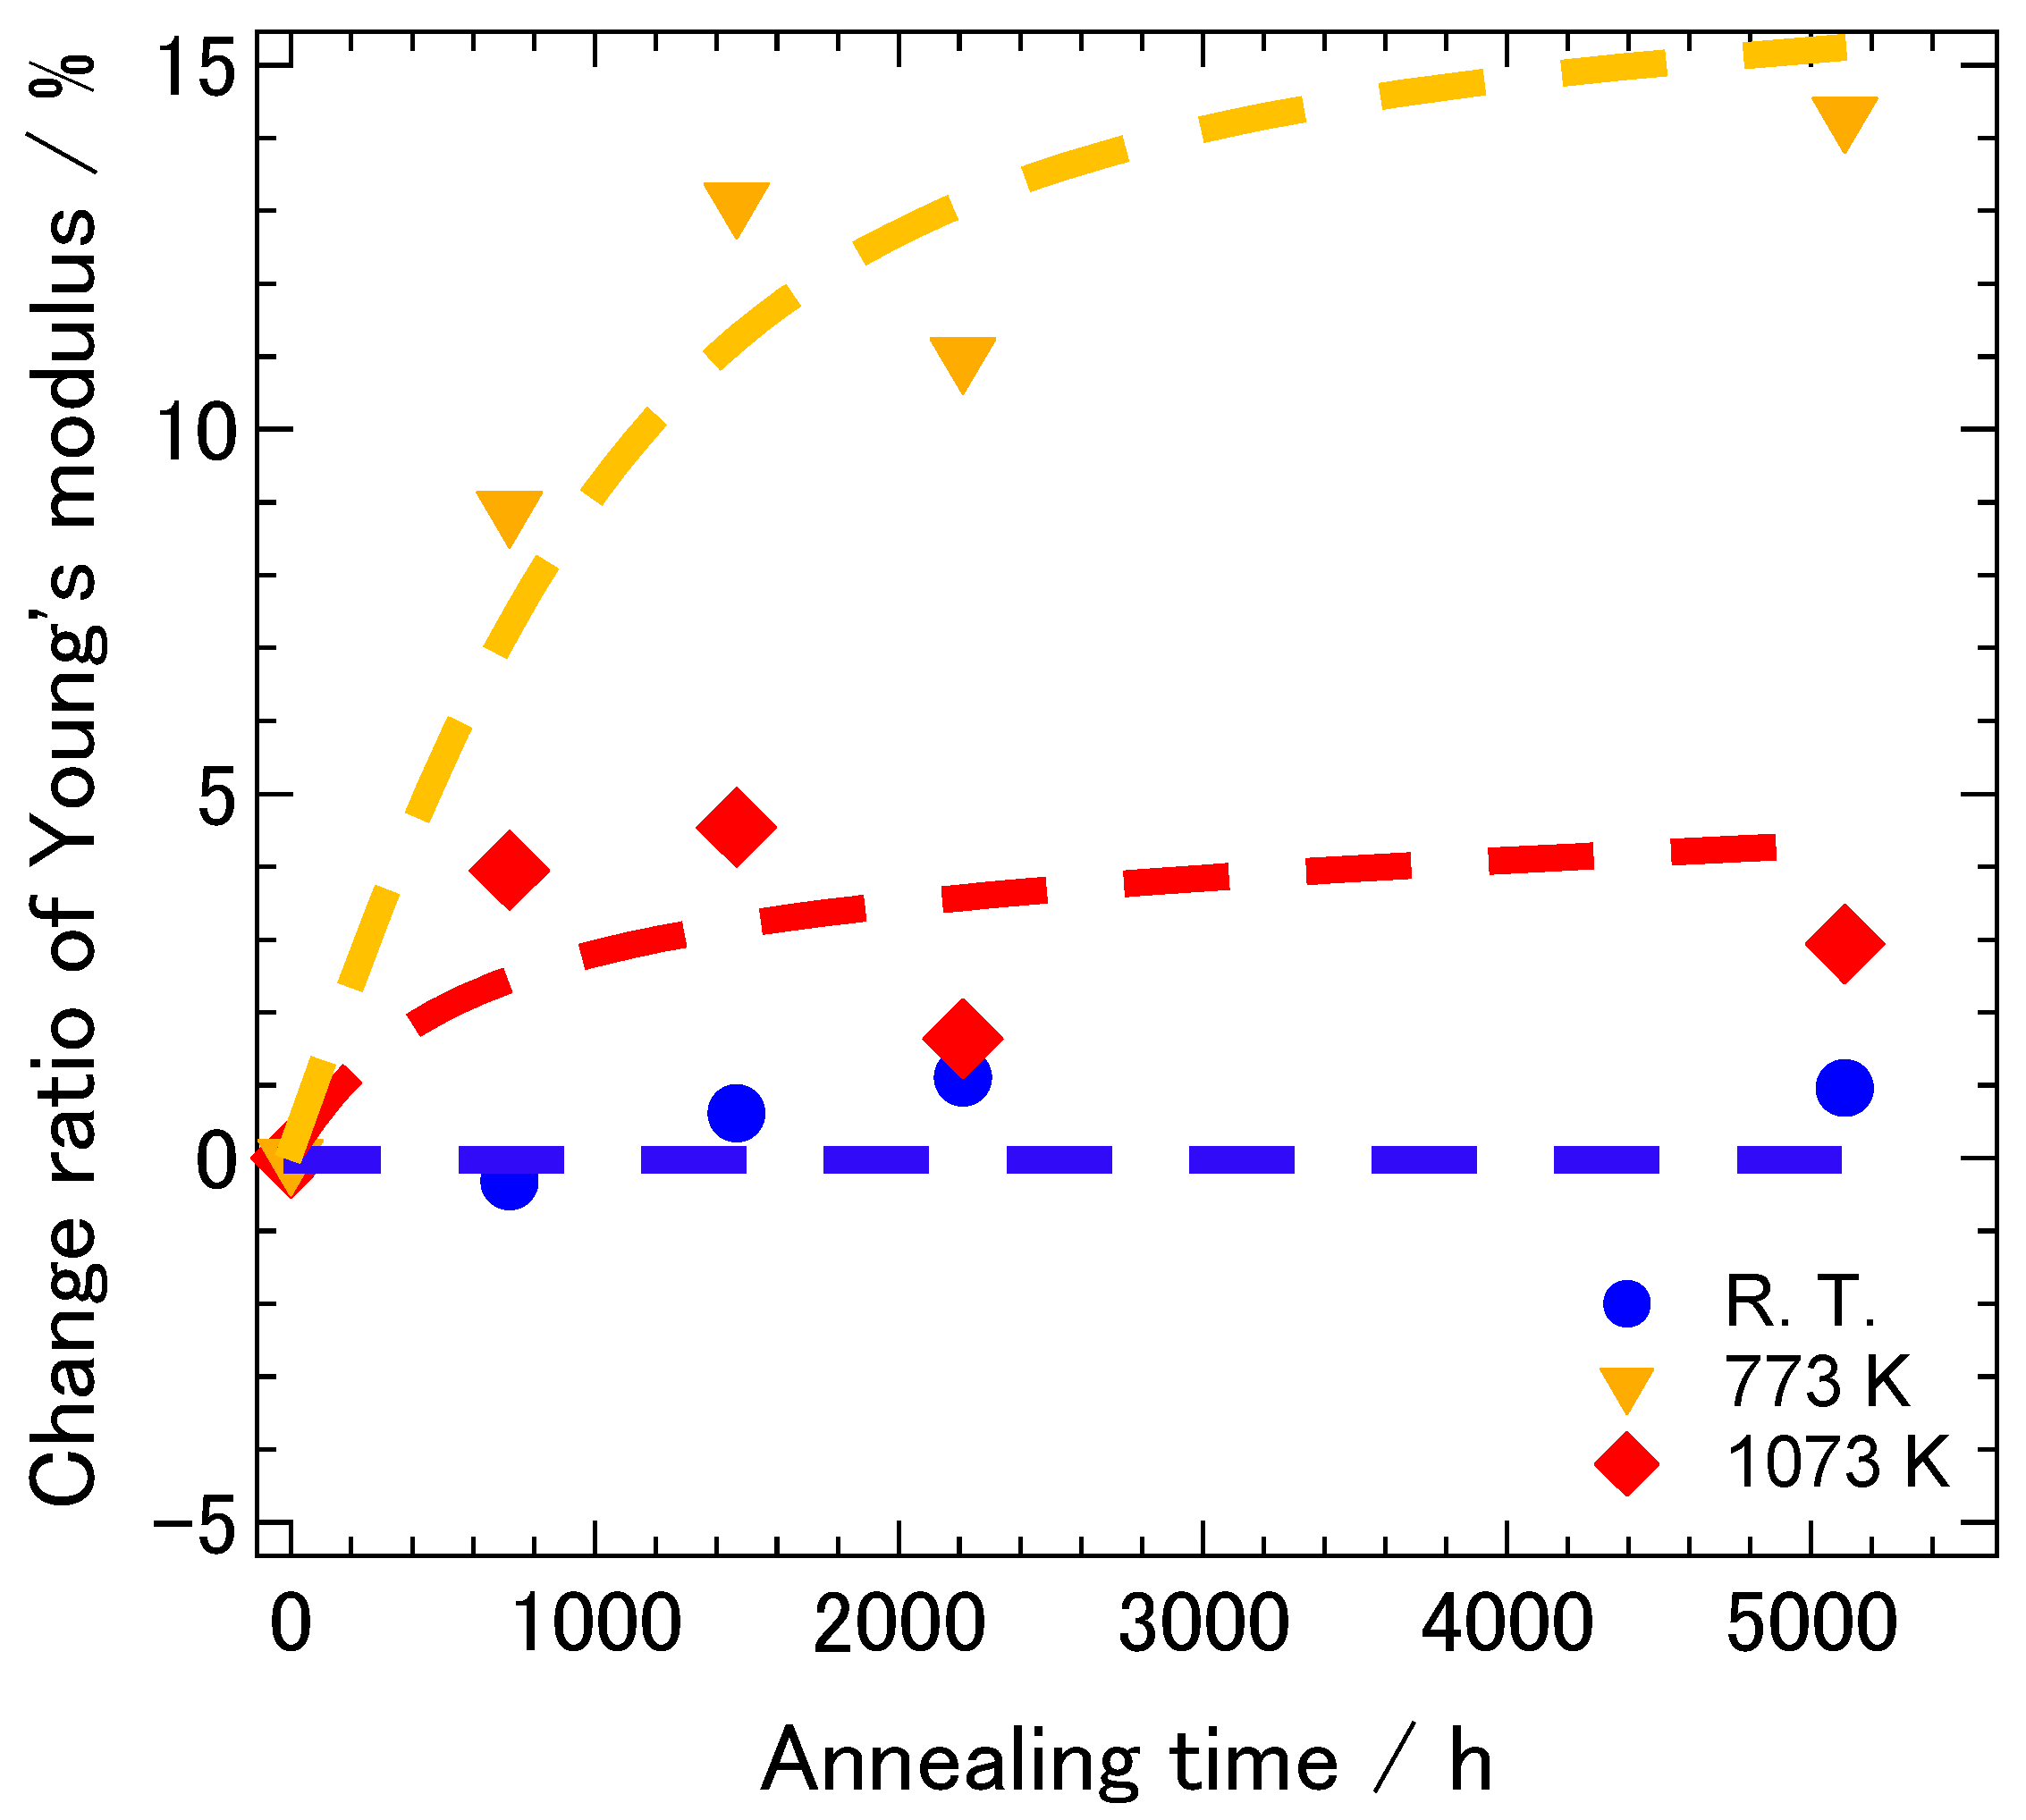
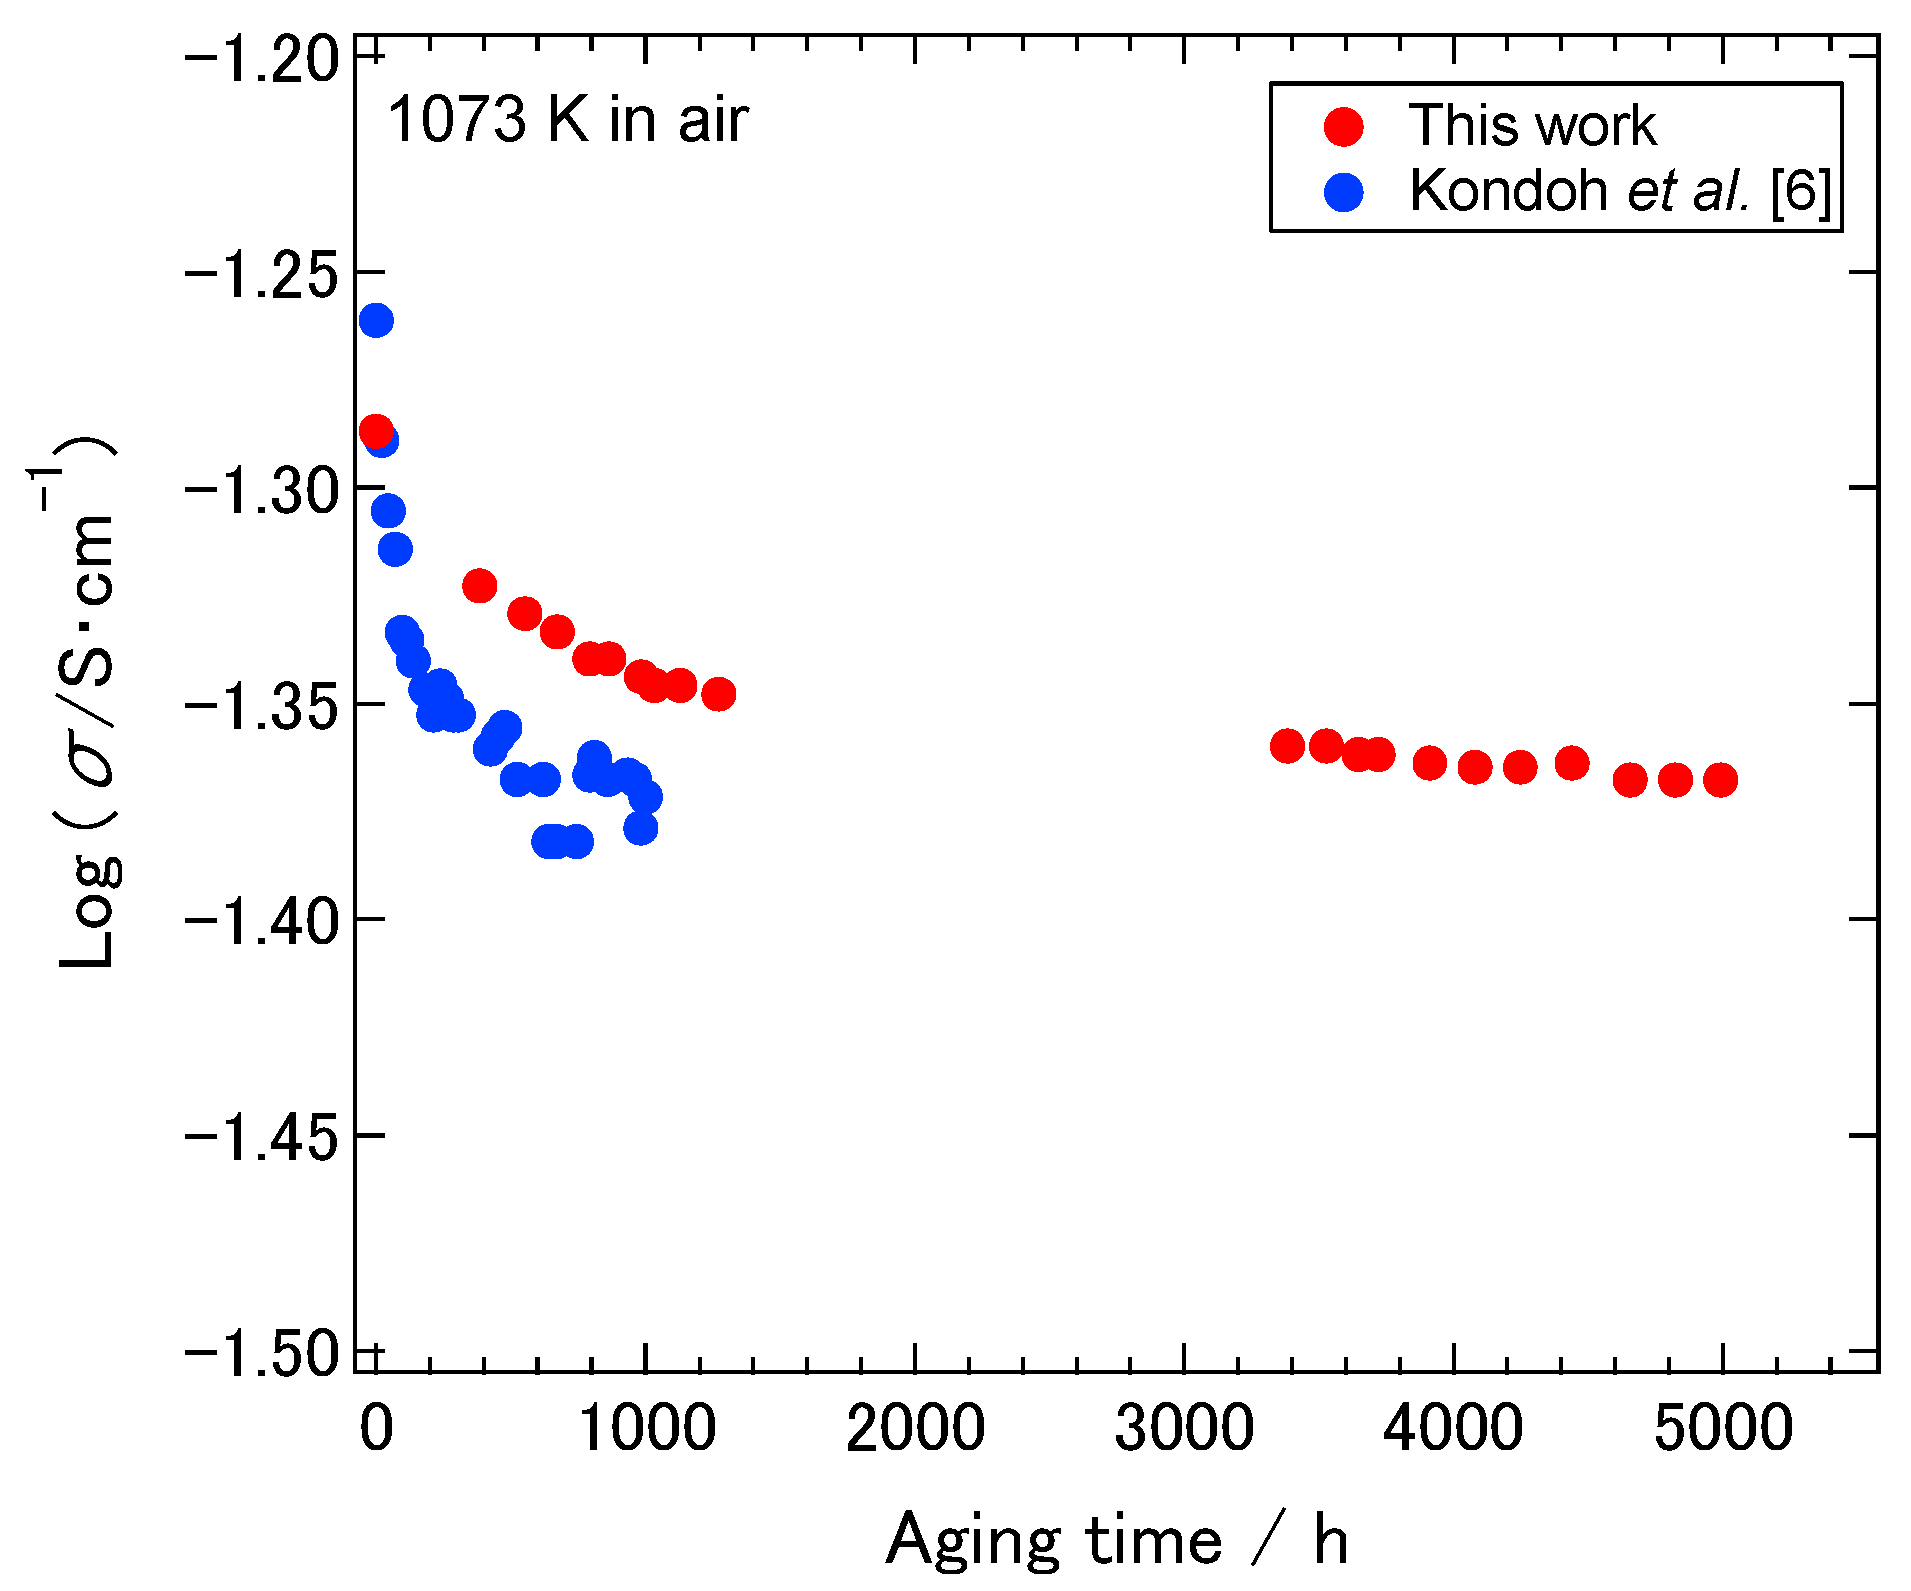
Figure 11 shows the change ratios of the dynamic Young’s modulus of 8YSZ as a function of aging time at low (room temperature), intermediate (773 K) and high (1073 K) temperatures, respectively. We chose 773 K as a representative temperature in the intermediate temperature range since the difference in the dynamic Young’s modulus between the samples with and without the aging treatment was most significant at this temperature. At the low temperature, the change in the dynamic Young’s modulus due to the aging treatment was not greater than 1%. At 1073 K, the dynamic Young’s modulus slightly increased due to the aging treatment but the increase ratio was less than 5%. Thus, the effect of aging on the dynamic Young’s modulus was not very significant. On the other hand, the dynamic Young’s modulus considerably increased by 13% with increasing aging time until the aging time reached approximately 1500 h at the intermediate temperature. It then gradually increased to 14% with increasing aging time further. As described above, the aging-time dependence of the dynamic Young’s modulus was similar to that of the conductivity. This suggests that the deterioration of the conductivity and the increase in the dynamic Young’s modulus of 8YSZ during aging was caused by the same mechanism.
One possible cause that brought about the changes in the conductivity and the dynamic Young’s modulus with aging is the partial phase transition. Hattori et al. performed Raman spectroscopy measurement to evaluate the crystal structure of 8YSZ annealed at 1273 K for 1000 h. They reported that the Raman peak characteristic to the tetragonal phase increased after the annealing [5]. Thus, they concluded that the deterioration of the conductivity during the aging treatment was due to the increase in the tetragonal phase. In order to check the phase-state change of 8YSZ after aging, we carried out XRD and Raman spectroscopy measurements of the samples with the aging treatment at 1073 K for 2930 h. 
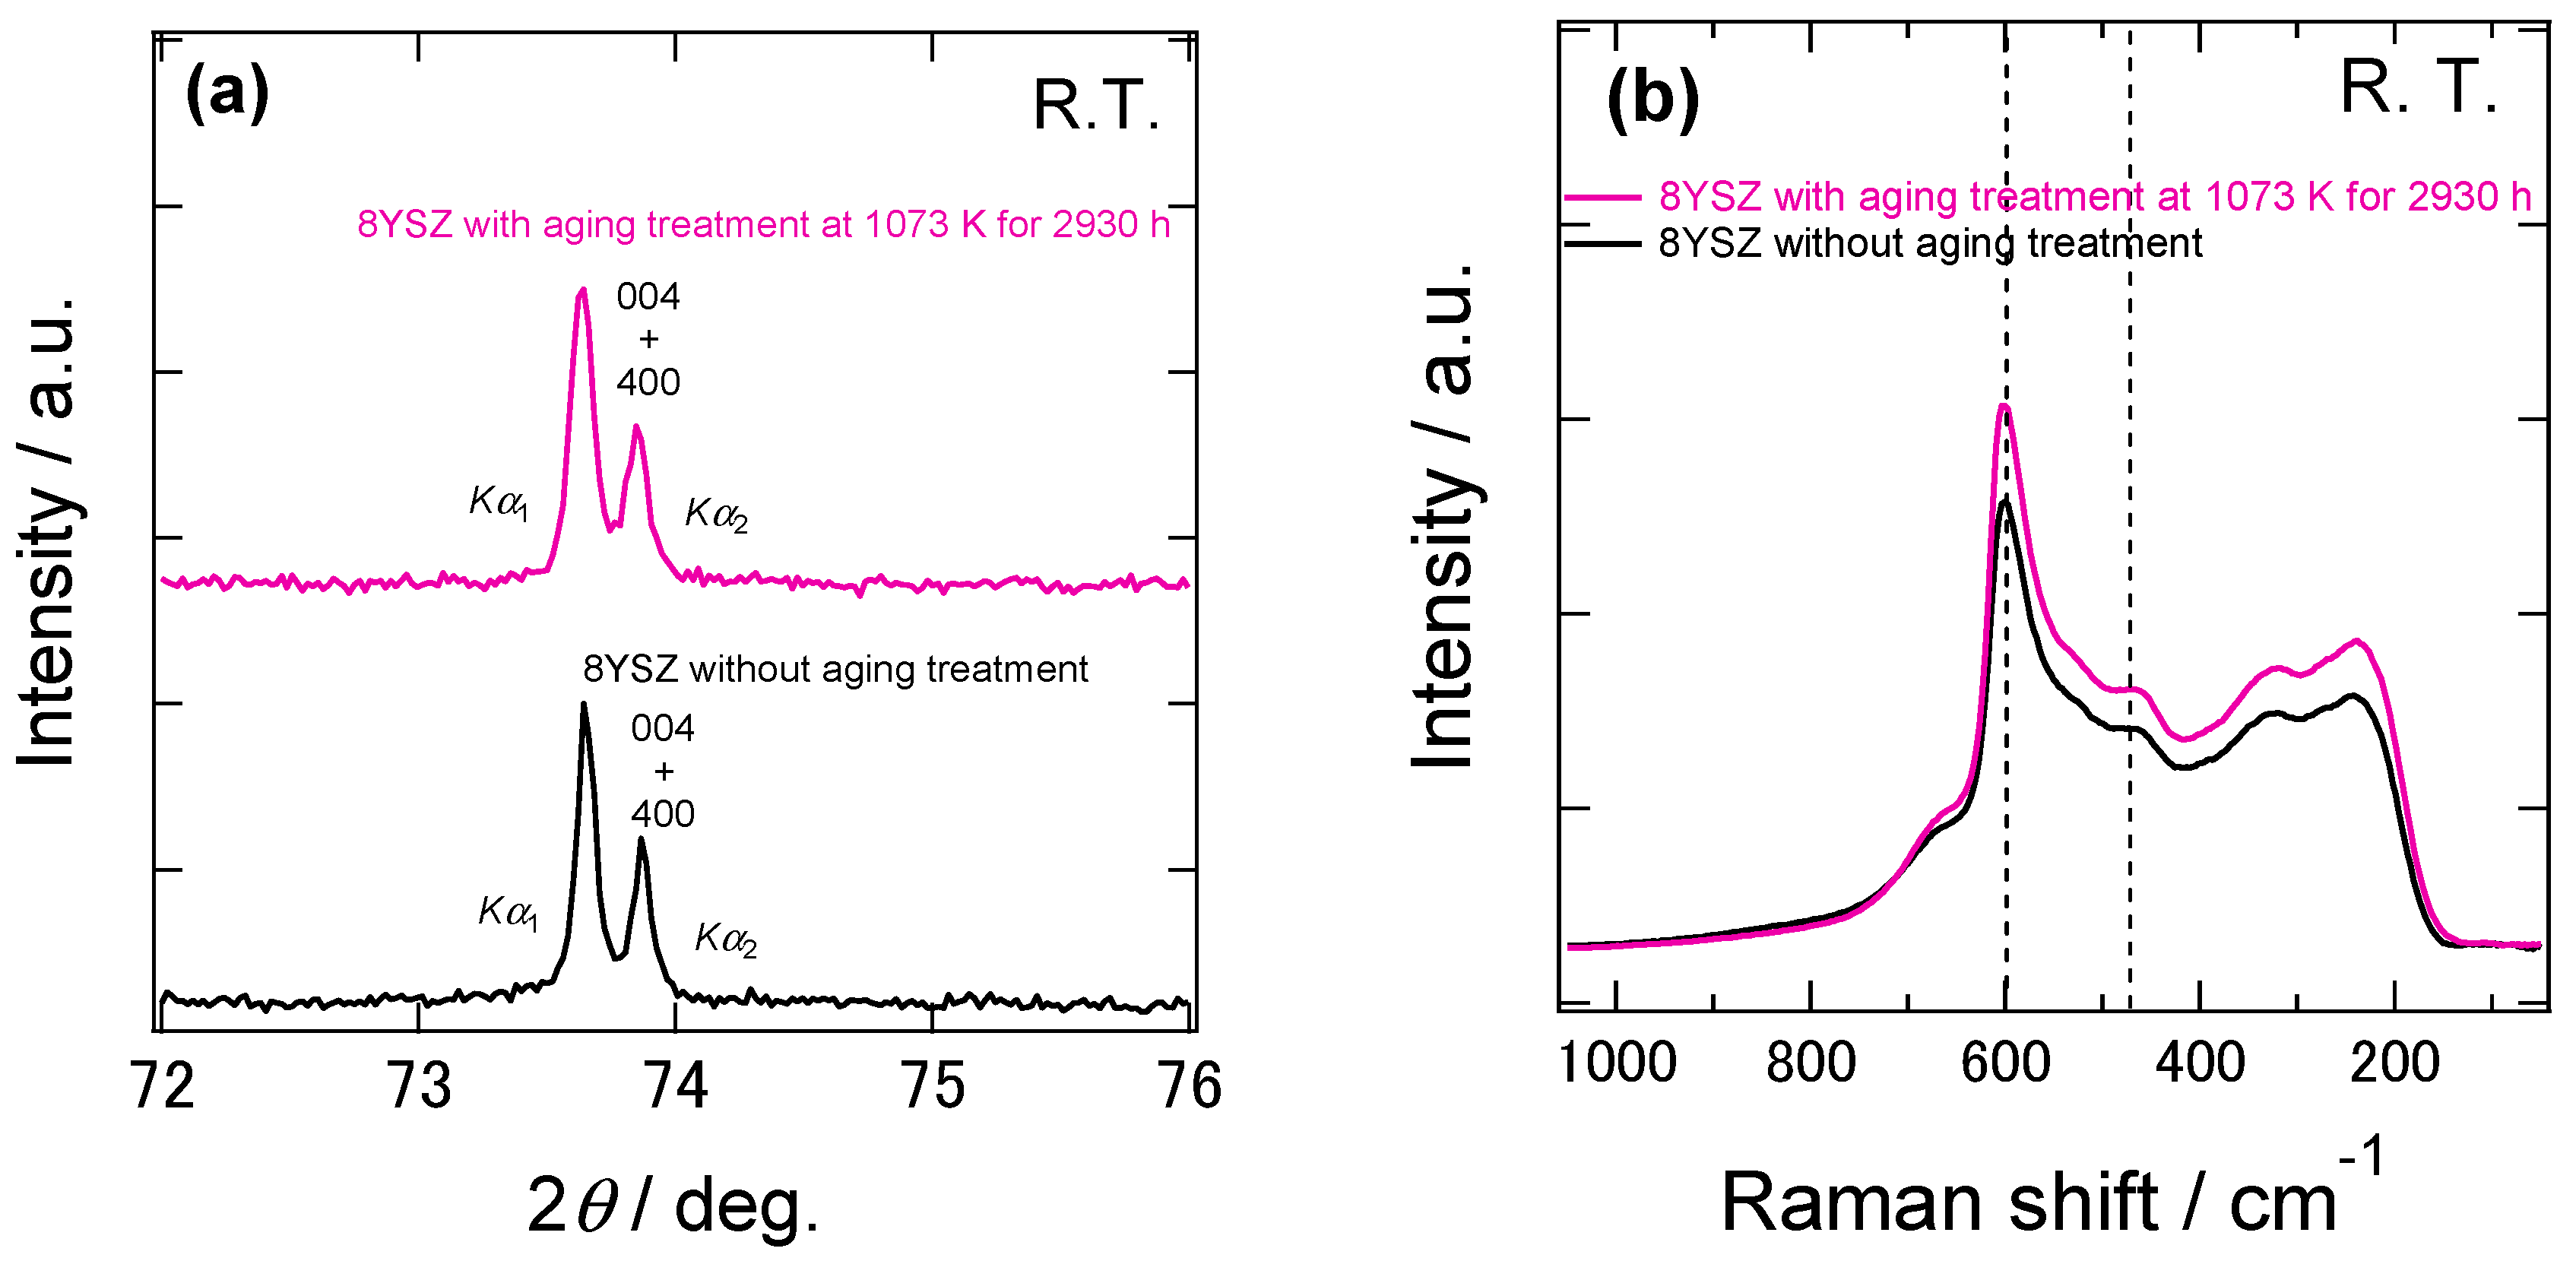
Figure 12a shows the X-ray diffraction patterns at 2θ = 70~78° of the 8YSZ samples before and after the aging treatment. As shown in this figure, there was no significant difference in the two profiles. Thus, the change in the phase state due to the aging treatment was not confirmed by XRD. Figure 12b shows the Raman spectra of the same samples. Both of the Raman spectra showed the peak at around 470 cm−1, which was attributed to tetragonal ZrO2-Y2O3 solid solution. This suggests that both of the samples with and without the aging treatment contained the t’’ phase. In order to evaluate the change in the existence ratio of the t’’ phase during the aging treatment, we calculated the peak height ratio of the peaks at around 610 and 470 cm−1 of the sample with the aging treatment. A red circle in the Figure 5 represents the peak height ratio of the 8SYZ sample with the aging treatment. The peak height ratio of the 8YSZ sample became slightly larger after the aging treatment. This implies that the existence ratio of the t’’ phase slightly increased during the aging treatment. As already mentioned in the previous section, however, no significant change in the dynamic Young’s modulus of 8YSZ was observed at around the phase transition temperature from t’’ phase to cubic phase. Additionally, the dynamic Young’s modulus of 8YSZ at room temperature was not significantly changed by the aging treatment. Considering these facts, although it was suggested that the existence ratio of t’’ phase was increased during the aging treatment, it seems that the influence of the phase change on the dynamic Young’s modulus was not great in 8YSZ.
Another possible cause of the changes in the conductivity and the dynamic Young’s modulus during the aging treatment is local oxygen ordering. Kondoh et al. carried out extended X-ray absorption fine structure (EXAFS) analysis to investigate the local structure of the 8YSZ annealed above 1073 K for 300~1000 h and they found that the number of the first nearest neighbor oxygen around Zr ions decreased with aging, which implied that the oxygen vacancies were locally ordered around Zr ions [23]. The local ordering of oxygen vacancies around Zr ions means that oxygen vacancies were trapped near the Zr ions, resulting in the deterioration of the conductivity. Such a local ordering of oxygen vacancies can also relax the anisotropic lattice distortion due to the substitution of Y ions. Therefore, it can lead to the decrease in the mechanical damping and suppress the corresponding decrease in the dynamic Young’s modulus. Indeed, Kondoh et al. reported that the height of the internal friction peak at around 573 K significantly decreased by the aging treatment [23]. Furthermore, as mentioned in the previous section, GaO et al. also pointed out that the internal friction peak at the higher temperature can be attributed to the local ordering of oxygen vacancies and/or [ 2 Y Zr V O .. ] x elastic dipoles [17]. As described above, we also observed the decrease in the height of the internal friction peak at 580 K by the aging treatment and the increase in the dynamic Young’s modulus above 600 K. Taking the above results and the reports by Kondoh et al. [23] and Gao et al. [17] into account, the decrease in the internal friction peak at the higher temperature, followed by the increase in the dynamic Young’s modulus at intermediate temperatures, may be due to the local ordering of the oxygen vacancies.
In the present study, it was found that the effect of aging on the mechanical properties of 8YSZ was remarkable at intermediate temperatures (600~1073 K) while the effect was not large at low (below 600 K) and high (above 1073 K) temperatures. When the 8YSZ is used as an electrolyte for SOFCs, 8YSZ is exposed to the temperature of 973~1273 K during the operation of SOFCs. In this temperature range, it seems that the change in the dynamic Young’s and shear moduli due to aging is not significant. Therefore, if the 8YSZ electrolyte is permanently used in this temperature range, it is likely that the impact of the aging of 8YSZ on mechanical stability of SOFCs is not remarkable. On the other hand, the dynamic Young’s and shear moduli of 8YSZ increased at the intermediate temperatures due to aging. Thus, larger mechanical stress can be generated during shutting down and starting up process of SOFC after the prolonged operation. Therefore, in terms of mechanical stability in the long-term operation, the safety margin of SOFCs should be carefully determined, taking into account of the change in mechanical properties of YSZ electrolyte due to aging.

4. Conclusions

We evaluated the influence of aging on mechanical properties of 8% yttria-doped zirconia (8YSZ) from room temperature to around SOFC operating temperature by using a resonance method. The dynamic Young’s and shear moduli of 8YSZ without the aging treatment decreased by 33% below 700 K and gradually increased at higher temperatures with increasing temperature. On the other hand, those with the aging treatment at 1073 K for 720~5110 h decreased by around 20% below 600 K and they were not greatly changed above 600 K with increasing temperature. Although it was suggested that the existence ratio of the metastable tetragonal t” phase increased during the aging treatment, it seemed that the influence of this partial phase transition on the dynamic Young’s and shear moduli was not significant. The annealing time dependence of the dynamic Young’s modulus corresponded with that of the conductivity. This suggests that the change in the dynamic Young’s modulus and the conductivity of 8YSZ during aging was caused by the same mechanism. Considering that the internal friction peak at higher temperature, which was considered to be related with local oxygen vacancy ordering, became smaller after aging, the cause of the change in the dynamic Young’s and shear moduli and the conductivity may be due to local oxygen vacancy ordering during aging.
It was found that the dynamic Young’s and shear moduli of 8YSZ after aging most remarkably increased in the intermediate temperature range from around 600 to 1000 K. Thus, larger mechanical stress can be generated, particularly during shutting down and starting up process of SOFC after the prolonged operation. Therefore, one should take the change in the mechanical properties of YSZ at intermediate temperatures into account and carefully determine the safety margin of SOFCs.

Author Contributions

Conceptualization, A.U., K.A. and T.K. (Tatsuya Kawada); Methodology, T.K. (Takuto Kushi); Formal Analysis, T.K. (Takuto Kushi) and Y.K.; Investigation, T.K. (Takuto Kushi) and Y.K.; Data Curation, T.K. (Takuto Kushi) and Y.K.; Writing-Original Draft Preparation, Y.K.; Supervision, A.U., K.A. and T.K. (Tatsuya Kawada); Funding Acquisition, T.K. (Tatsuya Kawada).

Acknowledgments

This research was funded by development of systems and elemental technology on SOFC, which was supported by the New Energy and Industrial Technology Development Organization (NEDO), Japan.

Conflicts of Interest

The authors declare no conflict of interest.

References

  1. Badwal, S.P.S. Zirconia-based solid electrolytes: Microstructure, stability and ionic conductivity. Solid State Ionics 1992, 52, 23–32. [Google Scholar] [CrossRef]
  2. Butz, B.; Kruse, P.; Störmer, H.; Gerthsen, D.; Müller, A.; Weber, A.; Ivers-Tiffée, E. Correlation between microstructure and degradation in conductivity for cubic Y2O3-doped ZrO2. Solid State Ionics 2006, 177, 3275–3284. [Google Scholar] [CrossRef]
  3. Badwal, S.P.S. Effect of dopant concentration on electrical conductivity in the Sc2O3-ZrO2 system. J. Mater. Sci. 1987, 22, 4125–4132. [Google Scholar] [CrossRef]
  4. Ciacchi, F.T.; Badwal, S.P.S. The System Y2O3-Sc2O3-ZrO2: Phase Stability and Ionic Conductivity Studies. J. Eur. Ceram. Soc. 1991, 7, 197–206. [Google Scholar] [CrossRef]
  5. Hattori, M.; Takeda, Y.; Sakaki, Y.; Nakanishi, A.; Ohara, S.; Mukai, K.; Lee, J.-H.; Fukui, T. Effect of aging on conductivity of yttria stabilized zirconia. J. Power Sources 2004, 126, 23–27. [Google Scholar] [CrossRef]
  6. Nomura, K.; Mizutani, Y.; Kawai, M.; Nakamura, Y.; Yamamoto, O. Aging and Raman scattering study of scandia and yttria doped zirconia. Solid State Ionics 2000, 132, 235–239. [Google Scholar] [CrossRef]
  7. Kondoh, J.; Kawashima, T.; Kikuchi, S.; Tomii, Y.; Ito, Y. Effect of Aging on Yttria-Stabilized Zirconia I. A Study of Its Electrochemical Properties. J. Electrochem. Soc. 1998, 145, 1527–1536. [Google Scholar] [CrossRef]
  8. Vlasov, A.N.; Perfiliev, M.V. Ageing of ZrO2-Based Solid Electrolytes. Solid State Ionics 1987, 25, 245–253. [Google Scholar] [CrossRef]
  9. Haering, C.; Roosen, A.; Schichl, H. Degradation of the electrical conductivity in stabilized zirconia systems Part I: Yttria-stabilised zirconia. Solid State Ionics 2005, 176, 253–259. [Google Scholar] [CrossRef]
  10. Kushi, T.; Sato, K.; Unemoto, A.; Hashimoto, S.; Amezawa, K.; Kawada, T. Elastic modulus and internal friction of SOFC electrolytes at high temperatures under controlled atmospheres. J. Power Sources 2011, 196, 7989–7993. [Google Scholar] [CrossRef]
  11. Amezawa, K.; Kushi, T.; Sato, K.; Unemoto, A.; Hashimoto, S.; Kawada, T. Elastic moduli of Ce0.9Gd0.1O2−δ at high temperatures under controlled atmospheres. Solid State Ionics 2011, 198, 32–38. [Google Scholar] [CrossRef]
  12. Kimura, Y.; Kushi, T.; Hashimoto, S.; Amezawa, K.; Kawada, T. Influences of Temperature and Oxygen Partial Pressure on Mechanical Properties of La0.6Sr0.4Co1−yFeyO3−δ. J. Am. Ceram. Soc. 2012, 95, 2608–2613. [Google Scholar] [CrossRef]
  13. Japanese Industrial Standards. Test Method for Young’s Modulus of Metallic Materials at Elevated Temperature; JIS Z 2280; Japanese Industrial Standards: Tokyo, Japan, 1993.
  14. Atkinson, A.; Selçuk, A. Mechanical behaviour of ceramic oxygen ion-conducting membranes. Solid State Ionics 2000, 134, 59–66. [Google Scholar] [CrossRef]
  15. Ramakrishnan, N.; Arunachalam, V.S. Effective elastic moduli of porous solids. J. Mater. Sci. 1990, 25, 3930–3937. [Google Scholar] [CrossRef]
  16. Wachtman, J.B., Jr.; Tefft, W.E.; Lam, D.G., Jr.; Apstein, C.S. Exponential Temperature Dependence of Young’s Modulus for Several Oxides. Phys. Rev. 1961, 122, 1754–1759. [Google Scholar] [CrossRef]
  17. Gao, P.; Lara-Curzio, E.; Trejo, R.; Radovic, M. Dynamic Mechanical Analysis of Phase Transformations and Anelastic Relaxation in Stabilized Zirconias. J. Electrochem. Soc. 2015, 162, F14–F22. [Google Scholar] [CrossRef]
  18. Lakki, A.; Herzog, R.; Weller, M.; Schubert, H.; Reetz, C.; Görke, O.; Kilo, M.; Borchardt, G. Mechanical loss, creep, diffusion and ionic conductivity of ZrO2-8 mol% Y2O3 polycrystals. J. Eur. Ceram. Soc. 2000, 20, 285–296. [Google Scholar] [CrossRef]
  19. Kondoh, J. Aging strengthening of 8 mol% yttria-fully-stabilized zirconia. J. Alloys Compd. 2004, 370, 285–290. [Google Scholar] [CrossRef]
  20. Nowick, A.S. The combining of dielectric and anelastic relaxation measurements in the study of point defects in insulating crystals. J. Phys. 1985, 46, 507–511. [Google Scholar] [CrossRef]
  21. Weller, M. Anelastic Relaxation of Point Defects in Cubic Crystals. J. Phys. IV 1996, 6, 63–72. [Google Scholar] [CrossRef]
  22. Wachtman, J.B., Jr. Mechanical and Electrical Relaxation in Th02 Containing CaO. Phys. Rev. 1963, 131, 517–527. [Google Scholar] [CrossRef]
  23. Kondoh, J.; Kikuchi, S.; Tomii, Y.; Ito, Y. Effect of Aging on Yttria-Stabilized Zirconia Ill. A Study of the Effect of Local Structures on Conductivity. J. Electrochem. Soc. 1998, 145, 1550–1560. [Google Scholar] [CrossRef]
  24. Carpenter, M.A.; Sinogeikin, S.V.; Bass, J.D. Elastic relaxations associated with the Pm 3 ¯ m–R 3 ¯ c transition in LaAlO3: II. Mechanisms of static and dynamical softening. J. Phys. Condens. Matter 2010, 22, 035404. [Google Scholar] [CrossRef]
  25. Slonczewski, J.C.; Thomas, H. Interaction of Elastic Strain with the Structural Transition of Strontium Titanate. Phys. Rev. B 1970, 1, 3599–3608. [Google Scholar] [CrossRef]
  26. Gao, P.; Bolon, A.; Taneja, M.; Xie, Z.; Orlovskaya, N.; Radovic, M. Thermal expansion and elastic moduli of electrolyte materials for high and intermediate temperature solid oxide fuel cell. Solid State Ionics 2017, 300, 1–9. [Google Scholar] [CrossRef]
  27. Yashima, M.; Kakihana, M.; Yoshimura, M. Metastable-stable phase diagrams in the zirconia-containing systems utilized in solid-oxide fuel cell application. Solid State Ionics 1996, 86–88, 1131–1149. [Google Scholar] [CrossRef]
  28. Ruh, R.; Mazdiyasni, K.S.; Valentine, P.G.; Bielstein, H.O. Phase Relations in the System ZrO2-Y2O3 at Low Y2O3 Contents. J. Am. Ceram. Soc. 1984, 67, C190–C192. [Google Scholar] [CrossRef]
  29. Srivastava, K.K.; Patil, R.N.; Choudhar, C.B.; Gokhale, K.V.G.; Subbarao, E.C. Revised phase-diagram of system ZrO2-YO1.5. Trans. J. Br. Ceram. Soc. 1974, 73, 85–91. [Google Scholar]
  30. Scott, H.G. Phase relationships in the zirconia-yttria system. J. Mater. Sci. 1975, 10, 1527–1535. [Google Scholar] [CrossRef]
  31. Stubican, V.S.; Hink, R.C.; Ray, S.P. Phase Equilibria and Ordering in the System ZrO2-Y2O3. J. Am. Ceram. Soc. 1978, 61, 17–21. [Google Scholar] [CrossRef]
  32. Yashima, M.; Ohtake, K.; Arashi, H.; Kakihana, M.; Yoshimura, M. Determination of cubic-tetragonal phase boundary in Zr1−xYxO2−x/2 solid solutions by Raman spectroscopy. J. Appl. Phys. 1993, 74, 7603–7605. [Google Scholar] [CrossRef]
Figure 1. (a) Electric furnace used for the aging treatment in this study. Several samples of 8YSZ were placed in the furnace and heat-treated at 1073 K in air for a maximum of seven months. Conducting wires were connected to one of the samples in the furnace for the electrical conductivity measurements. (b) Sample for the electrical conductivity measurements. The electrical conductivity was measured by the AC four-terminal method in a frequency range from 105 to 10 Hz with the potential amplitude of 10 mV.
Ceramics 01 00023 g001
Figure 2. (a) Temperature dependence of the dynamic Young’s and shear moduli and the Poisson’s ratio of 8YSZ without aging treatment under P(O2) of 0.01 bar. Black circle, red square and blue triangle represent the dynamic Young’s modulus, the dynamic shear modulus and the Poisson’s ratio, respectively. The black broken line expresses the fitting curve of the dynamic Young’s modulus of 8YSZ below 323 K by Wachtman’s equation [16]. (b) Temperature dependence of the internal friction and the change in the dynamic Young’s modulus with temperature, dE/dT, of 8YSZ without aging treatment under P(O2) of 0.01 bar. Green symbol and open black circle show the internal friction and dE/dT, respectively.
Ceramics 01 00023 g002
Figure 3. (a) X-ray diffraction patterns at 2θ = 70~78° and (b) Raman spectrum of the 8YSZ sample without the aging treatment measured at room temperature.
Ceramics 01 00023 g003
Figure 4. Raman spectra of the 8YSZ sample without the aging treatment measured at room temperature, 373, 473, 573, 673, 773 and 873 K.
Ceramics 01 00023 g004
Figure 5. Peak height ratios of the peaks at around 610 and 470 cm−1, I4/I6, in the Raman spectrum of the 8YSZ sample with and without the aging treatment as a function of temperature. Red/black circles represent the result with the sample with/without the aging treatment, respectively.
Ceramics 01 00023 g005
Figure 6. Conductivity of the 8YSZ with the aging treatment at 1073 K in air as a function of aging time. Red and blue circles represent the conductivity obtained in this work and the one reported by Kondoh et al. [7].
Ceramics 01 00023 g006
Figure 7. Temperature dependence of the dynamic Young’s modulus of the 8YSZ sample without the aging treatment and those with the aging treatment for 720, 1465, 2210 and 5110 h.
Ceramics 01 00023 g007
Figure 8. Temperature dependence of (a) the dynamic shear modulus and (b) the Poisson’s ratio of the 8YSZ sample without the aging treatment and those with the aging treatment for 720, 1465, 2210 and 5110 h.
Ceramics 01 00023 g008
Figure 9. Temperature dependence of (a) the internal friction and (b) the change in the dynamic Young’s modulus with temperature, dE/dT, of the 8YSZ sample without the aging treatment and those with the aging treatment for 720, 1465, 2210 and 5110 h.
Ceramics 01 00023 g009
Figure 10. Temperature dependence of the dynamic Young’s modulus of the 8YSZ sample with aging treatment for 720 h, that after re-annealing at 1673 K for 1 h and that without the aging treatment.
Ceramics 01 00023 g010
Figure 11. Change ratio of the dynamic Young’s modulus of 8YSZ sample as a function of aging time at low (room temperature), intermediate (773 K) and high (1073 K) temperatures. The broken lines are guides to the eye.
Ceramics 01 00023 g011
Figure 12. (a) X-ray diffraction patterns at 2θ = 70~78° and (b) Raman spectra of the 8YSZ samples with and without the aging treatment at 1073 K for 2930 h. Both the X-ray diffraction measurements and the Raman spectroscopy were conducted at room temperature.
Ceramics 01 00023 g012

