Article

Sustainable Supply Chain Resilience Assessment Based on Fuzzy Bayesian-ANP

Department of Numerical Logistics and Engineering, School of Management Science and Engineering, Shandong University of Finance and Economics, Jinan 250014, China
*
Author to whom correspondence should be addressed.
Appl. Syst. Innov. 2026, 9(8), 164; https://doi.org/10.3390/asi9080164
Submission received: 28 May 2026 / Revised: 8 July 2026 / Accepted: 23 July 2026 / Published: 4 August 2026
(This article belongs to the Section Applied Mathematics)

Abstract

Against the backdrop of increasing global uncertainty and the growing acceptance of sustainable development principles, enhancing supply chain resilience has become a core issue for enterprises in managing risks and ensuring operational security. Based on a review of the literature and theoretical analysis, this study constructs an evaluation system comprising 12 third-level indicators across three dimensions: proactive defense capability, green operational capability, and collaborative recovery capability. When determining whether there are interdependent relationships among the indicators, this study introduces an extended Bayesian fusion method based on trapezoidal fuzzy numbers to evaluate and confirm these relationships, thereby reducing biases arising from subjective judgments. By quantifying experts’ assessments of the relationship strength and confidence levels between indicators using trapezoidal fuzzy numbers, this method effectively integrates the opinions of multiple experts, reducing the randomness and subjectivity associated with individual judgments. During the ANP weight calculation stage, to overcome the ambiguity and uncertainty inherent in traditional pairwise expert comparisons, trapezoidal fuzzy numbers were similarly used to quantify the comparison results. These were then defuzzified using the mean area metric to construct a precise judgment matrix. Finally, using the publicly available annual reports and ESG disclosure data from three multinational corporations—one in the semiconductor manufacturing sector (Company T), one in industrial digital manufacturing (Company S), and one in the food and beverage industry (Company N)—as empirical samples, the cross-industry applicability and validity of the constructed evaluation system were verified. The results demonstrate that this method can systematically reflect the key factors influencing sustainable supply chain resilience and their weighting structure.

1. Introduction

In recent years, natural disasters, major emergencies, trade frictions, rapid changes in consumer demand, and shortened product iteration cycles have led to a gradual increase in supply chain disruption risks and significantly higher management complexity (Li Shunyong et al., 2025) [1], making the vulnerability of global supply chains increasingly prominent. Against this backdrop, enhancing supply chain resilience is not only a key measure to ensure sustainable development for countries worldwide, especially China, but also an important foundation for building a manufacturing powerhouse (Jiang Zhongzhong et al., 2025) [2]. Meanwhile, as environmental awareness rises and policies are implemented, companies face increasing social regulatory pressure, needing to continuously adjust and implement sustainable supply chain networks to meet policy and environmental requirements. Therefore, the question of how to enhance supply chain resilience while balancing the Sustainable Development Goals has become a frontier issue of concern for both academia and industry. In the context of supply chain risk and resilience analysis, Bayesian networks have emerged as a powerful probabilistic graphical modeling tool, as comprehensively reviewed by Hosseini and Ivanov (2020) [3]. Meanwhile, recent studies have explored resilient supply chain network design under super-disruptions using data-driven stochastic optimization approaches (Vali-Siar et al., 2026) [4].
Regarding factors influencing supply chain resilience, empirical research conducted by Ma Xiaoyu et al. (2023) [5] found that flexibility, agility, remodelability, visibility, and supply chain cooperation can all positively affect supply chain resilience, but none of these factors alone constitute a necessary condition for high resilience; high resilience can instead be achieved through multi-factor collaborative configuration. Tao Feng et al. (2023) [6] took the perspective of industrial and supply chain resilience; they found that downstream enterprises’ digital transformation can enhance the resilience of industrial and supply chains by optimizing supply–demand matching, stabilizing supply–demand relationships, and improving supplier innovation capabilities. Zhang Shushan et al. (2023) [7] showed that smart logistics can significantly enhance supply chain resilience. According to theoretical and empirical evidence, smart logistics empowers supply chain resilience.
In terms of specific industry applications, Du Wenwen et al. (2024) [8] used the ANP-VIKOR model to evaluate the resilience of cold chain logistics supply chains. By constructing a network architecture model and using Super Decisions software to calculate weights, they found that low information sharing and market demand are the most important factors restricting the resilience of cold chain supply chains. Zhu Xinjian et al. (2026) [9] used the DEMATEL-ISM-MICMAC method for their analysis; they found that the IoT, big data, and blockchain are the main drivers of improvements in supply chain resilience. Among them, blockchain can compensate for the disadvantages of other technologies and enhance the reliability of information transmission. From the perspective of supply chain spillover, Yuan Yehu et al. (2025) [10] found that enterprise digital transformation can significantly improve supply chain resilience, with effects varying by stage. From the enterprise perspective, a supplier’s resilience usually refers to their ability to be restored to their original or an even more ideal state after being disturbed (Wang Xinyu et al., 2025) [11]. According to Wang Yuhao et al. (2024) [12], based on micro-level evidence from Chinese listed companies, the development of cross-border e-commerce can significantly enhance the resilience of enterprise supply chains. Cross-border e-commerce empowers enterprises to enhance supply chain resilience. Song Donglin et al. (2024) [13] found, based on social network analysis, that digital transformation can significantly enhance the capabilities of the supply chain in three areas and indirectly enhance resilience by reducing transaction costs and improving supply quality. Cai Yongmei et al. [14] (2026) found that data assets can significantly enhance supply chain resilience, and the mechanism lies in simultaneously improving internal and external governance levels within enterprises. He Guosheng et al. (2026) [15] empirically found that patient capital improves supply chain resilience by enhancing corporate innovation capabilities and increasing relational investment. Li Ting et al. (2026) [16] used dynamic QCA methods from the perspective of digitalization and green synergy, identifying three configuration paths: organization-led/digital-technology-driven, regulatory-multi-element collaboration, and green innovation-led pathways. Xue Yang et al. (2026) [17] used dual machine learning methods to find that the marketization of data elements significantly improves supply chain resilience by enhancing enterprises’ coordination, integration, learning, absorption, and transformation capabilities. Wang et al. (2025) [18] conducted a quantitative analysis of resilience factors in the coal power supply chain using fuzzy DEMATEL, ISM, and ANP methods, providing insights into the mechanisms driving supply chain resilience. Lee et al. (2026) [19] developed an ANP-based decision framework for ESG-driven green supply chain management, demonstrating the applicability of ANP in sustainability-oriented supply chain contexts.
At the methodological level, previous studies—such as the fuzzy multi-criteria modeling method used by Domínguez and Carnero (2020) [20] in decision making regarding medical technology updates—share a similar methodological intent, aiming to reduce the uncertainty inherent in expert judgments. The novel surface fuzzy AHP method proposed by Simjanović et al. (2023) [21] focuses on improving the representation of fuzzy numbers. Nguyen et al. (2021) [22] combined spherical fuzzy AHP with PLS-SEM and ANN to predict vaccination willingness, demonstrating cutting-edge applications of fuzzy multi-criteria methods in social management decision-making. This study shares similar multi-stage integration characteristics with previous work in its methodological framework, but it differs in its application context and form of fuzzy processing. Table 1 below compares the methods commonly used in previous studies with the method employed in this study. Zhou et al. (2026) [23] proposed a fuzzy Bayesian-based integrated framework for risk analysis, combining triangular fuzzy numbers with Bayesian networks to address data scarcity in risk assessment. Khalilzadeh et al. (2025) [24] integrated fuzzy DEMATEL-ANP with artificial neural networks for risk analysis of water supply projects, showcasing the effectiveness of hybrid fuzzy MCDM approaches. Additionally, Leonelli et al. (2023) [25] contributed to the sensitivity and robustness analysis of Bayesian networks, providing methodological tools for validating model assumptions.
In summary, while existing research provides an important foundation for assessing supply chain resilience, the following shortcomings remain: 1. Existing resilience evaluation frameworks rarely incorporate sustainability into their evaluation systems, making it difficult to meet ESG-oriented management needs; 2. Most studies rely on deterministic scoring using AHP/ANP, failing to effectively address the inherent ambiguity and uncertainty in expert judgments; 3. Existing fuzzy evaluation methods predominantly use triangular fuzzy numbers, which have limited precision in expressing the range of expert perceptions and do not incorporate a fusion mechanism to address the consistency of opinions among multiple experts. Based on these research gaps, this study makes the following contributions: (1) It constructs a sustainable supply chain resilience evaluation indicator system integrating three dimensions, proactive defense, green operations, and collaborative recovery, systematically incorporating sustainability factors into the resilience evaluation framework for the first time; (2) It proposes an extended Bayesian fusion method based on trapezoidal fuzzy numbers, which effectively addresses the integration of uncertainty in multi-expert judgments by quantifying experts’ relationship degrees and confidence levels; (3) Using three representative enterprises—one each from the semiconductor manufacturing, industrial digital manufacturing, and food and beverage sectors—as empirical samples, the study validates the effectiveness and operability of the proposed evaluation system, providing a practical tool for the quantitative assessment of corporate supply chain resilience.

2. Establishment of a Sustainable Supply Chain Resilience Evaluation System and Determination of the Interrelationship of Indicators

This chapter first establishes an evaluation system for sustainable supply chain resilience and then creates a survey based on trapezoidal fuzzy numbers. The responses are defuzzified according to the degree of relation and confidence filled in by experts. Several defuzzified expert surveys are then combined using Bayesian fusion to obtain a matrix of the interrelationships among the indicators.

2.1. Establishment of a Sustainable Supply Chain Resilience Evaluation System

Based on existing research results, this study follows the principles of systematicness, scientificity, and operability, and constructs a sustainable supply chain resilience evaluation index system containing 12 tertiary indicators across three dimensions: proactive defense capability, green operation capability, and collaborative recovery capability.

2.1.1. Preemptive Defense Capability

Proactive defense capability reflects the preparedness and preventive capacity of the supply chain before risks occur. Specifically, supplier dispersion reflects the level of diversification of the enterprise’s supply chain. Multi-source procurement not only helps improve the service level of the supply chain but also significantly reduces overall supply risks caused by interruptions at specific nodes. Resilient financial reserves measure the enterprise’s cash buffer capacity, and patient capital can significantly enhance supply chain resilience, mainly by suppressing supply chain disruption risks and reducing supply–demand coordination costs. Rapid response capability emphasizes the enterprise’s immediate reaction to sudden disruptions, choosing appropriate plans and strategies to minimize the impact of disruptions. Supply chain transparency reflects the degree of information visibility, as increased visibility enhances information transparency within the supply chain, reduces uncertainty, and helps enterprises grasp more effective decision-making information in real time.

2.1.2. Green Operating Capability

Green operation capability reflects the performance of the supply chain in sustainable development. Green inventory management focuses on the environmental friendliness of the inventory process, and appropriate safety stock can significantly enhance supply chain supply resilience with minimal sacrifice of operational costs. Sustainable suppliers emphasize the green qualifications of suppliers, and corporate green innovation has a positive impact on supply chain resilience, with corporate ESG performance playing a mediating role in this relationship. The level of green processes reflects the greenness of the production process, and green finance can significantly enhance enterprise supply chain resilience, with mechanisms including reducing transaction costs, alleviating financing constraints, and improving the supply chain’s risk resistance.

2.1.3. Collaborative Recovery Capability

Collaborative recovery capability reflects the supply chain’s ability to cooperate and recover after a disruption occurs. Flexible delivery capability reflects the enterprise’s ability to adjust delivery methods to adapt to changes. Flexibility refers to the enterprise’s capacity to respond to long-term or fundamental changes in the market environment by adjusting the supply chain structure, adapting to the constantly changing external environment with minimal time and resources. The degree of information sharing measures the level of information exchange among supply chain members, and information sharing can enhance mutual inventory willingness and collaboration. The cooperative coordination capability reflects the level of collaboration among supply chain partners. The deepening of cooperative relationships and cooperation intensity significantly promotes information sharing and trust building among entities, helping to reduce uncertainty in operations management. Recovery operation time measures the speed at which the supply chain returns to normal after a disruption. Supply chain resilience is a critical capability for preventing, resisting, and managing risks, determining the scope, direction, and intensity of risk transmission within the supply chain. The application of digital technology reflects the empowerment of resilience by digital technology. The Internet of Things, big data, and blockchain are the main drivers of enhanced supply chain resilience, while artificial intelligence can shorten inventory turnover days to improve resilience, alleviate inefficient fund allocation, and address the issue of a single external resource structure.
The indicator structure of this article is shown in Table 2.

2.2. Determination of Indicator Relationships in an Extended Bayesian Fusion Method Based on Trapezoidal Fuzzy Numbers

Before establishing an ANP network relationship chart, it is necessary to first determine the mutual influence relationships among the three third-level indicators, i.e., to determine their causal relationships. Experts are usually required to score them and then take the average to obtain the relationship map. However, experts’ judgments are inherently uncertain and subjective. To better consider this uncertainty and the experts’ psychological states, this study introduces the relationship between degree k and confidence degree c. Degree k indicates the degree of mutual influence between the two indicators, while confidence level c indicates how confident one is in the relationship. This study compiles scores from five experts.
To address this cognitive ambiguity, this study introduces trapezoidal fuzzy numbers to quantitatively express experts’ language evaluations. Ambiguous numbers generally include interval fuzzy numbers, triangular fuzzy numbers, and trapezoidal fuzzy numbers. Trapezoidal fuzzy numbers describe a fuzzy set through four parameters (a, b, c, d), where the membership degree in the interval [b, c] is always 1, representing the most likely range of expert judgment; [a, b] and [c, d] are transition intervals, representing the boundary of uncertainty in judgment. Compared to trigonometric fuzzy numbers (with only one point membership degree of 1), this structure can more accurately express the “most likely interval” in expert judgment rather than the “most likely single point,” better matching actual decision-making scenarios. The interval number only expresses the upper and lower bounds of the judgment, losing internal information. The interval number describes the expert’s fuzzy judgment as [a, a], implicitly assuming all possible values within the interval, which does not match the actual psychological characteristics of expert judgment. In summary, trapezoidal fuzzy numbers are chosen to handle ambiguity. This paper uses the five-level language evaluation set S = {S0, S1, S2, S3, S4}, corresponding to five levels: “None,” “Weak,” “Average,” “Strong,” and “Very Strong.” The correspondence between each language level and normalized trapezoidal fuzzy numbers is shown in Table 3.
The reasons for selecting trapezoidal fuzzy numbers rather than triangular fuzzy numbers in this study are as follows. (1) Higher expression accuracy: Triangular fuzzy numbers use only a single vertex to represent the “most likely value,” which is essentially a special case of trapezoidal fuzzy numbers when b = c; trapezoidal fuzzy numbers, on the other hand, use the interval [b, c] to express the range of the expert’s “most confident” judgment, more accurately reflecting the cognitive characteristic that experts often have confidence in a specific interval rather than a single value when assessing the degree of the relationship between indicators. (2) Greater information capacity: The two end intervals [a, b] and [c, d] of trapezoidal fuzzy numbers represent the left and right fuzzy boundaries of the judgment, respectively. This allows for the preservation of more original judgment information during defuzzification, thereby reducing information loss caused by excessive simplification. (3) Suitability for the research problem: Supply chain resilience assessment involves multidimensional qualitative judgments, and experts’ perceptions of such relationships inherently exhibit interval-based fuzziness; the use of trapezoidal fuzzy numbers can more accurately accommodate this cognitive characteristic.

2.2.1. Denoising

For the trapezoidal fuzzy number A ~ = ( a , b , c , d ) , it is converted into a precise value w using the centroid method. The formula for the centroid method is:
w = a + 2 b + 2 c + d 6
where b and c are the main intervals of the trapezoid, representing the values that experts are most likely to want to assign. Therefore, they have a larger weight in the calculation of the geometric centroid, given a weight of 2; a and d are the two end boundaries of the trapezoid, with a weight of 1.
Let the linguistic evaluation of the n-th expert on the degree of relationship between indicator i and indicator j be converted into a trapezoidal fuzzy number K ~ ij n = ( a K , ij n , b K , ij n , c K , ij n , d K , ij n ) , and the linguistic evaluation of the confidence level be converted into a trapezoidal fuzzy number C ~ ij n = ( a C , ij n , b C , ij n , c C , ij n , d C , ij n ) . The formula for converting the degree of relationship and the confidence level into precise values is as follows:
K i j n = a K , i j n + 2 b K , i j n + 2 c K , i j n + d K , i j n 6
C i j n = a C , i j n + 2 b C , i j n + 2 c C , i j n + d C , i j n 6

2.2.2. Bayesian Fusion

In order to make the relationships between indicators more accurate, but also considering the large workload of the questionnaire (this study has a total of 12 third-level indicators, so it is necessary to assess 12 × 11 = 132 relationships, plus the degree of relationship and the degree of confidence, amounting to 264 judgments), five experts were invited to make judgments. After obtaining the data from the five experts, the Bayesian fusion method was used to determine the influence relationships between the indicators.
In terms of basic information about the five experts: three are from the field of supply chain management research at universities (including one professor and two associate professors), and two are from the supply chain operations management departments of large manufacturing companies (both senior managers). Their professional backgrounds cover areas such as supply chain risk management, green supply chains, sustainable operations, and digital supply chains, and they all have at least eight years of work experience. The expert selection criteria included: (1) at least eight years of work or research experience in supply chain management; (2) familiarity with multi-criteria decision-making methods such as ANP and AHP, and the ability to accurately understand the evaluation logic of pairwise comparisons; (3) representation from at least three different institutions to ensure diversity and representativeness in judgment and avoid bias stemming from a single institutional perspective. To protect the experts’ privacy and avoid authority bias, their identities have been anonymized.
For the five experts, we first use the confidence level as the weight to perform a weighted average of the relationship degree, obtaining the comprehensive relationship degree K ¯ i j :
K ¯ i j = n = 1 N C i j n K i j n n = 1 N C i j n
At the same time, we take the arithmetic average of the confidence levels to obtain the comprehensive confidence level C ¯ i j :
C ¯ i j = 1 N n = 1 N C i j n
We substitute the comprehensive relationship degree K ¯ i j and the comprehensive confidence degree C ¯ i j into the Bayesian fusion formula to calculate the probability β i j that indicator i has an influence on indicator j:
P 1 = C ¯ i j K ¯ i j + ( 1 C ¯ i j ) ( 1 K ¯ i j )
P 2 = C ¯ i j ( 1 K ¯ i j ) + ( 1 C ¯ i j ) K ¯ i j
β i j = P 1 P 1 + P 2
Here, P1 is the comprehensive support for the existence of a relationship, and P2 is the comprehensive support for the non-existence of a relationship. βij ∈ [0, 1] represents the probability that indicator i has an influence on indicator j. A threshold λ = 0.5 is set; exceeding the threshold indicates that the two are related, while a value below the threshold indicates that the two are unrelated. The relationship probability βij is converted into a binary decision value.
We set the threshold λ = 0.5; a value above the threshold indicates a correlation between the two variables, while a value below the threshold indicates no correlation. We convert the relationship probability βij into a binary value.
The selection of the threshold λ has a fundamental impact on the ANP network structure: different values of λ will directly alter the distribution of 0 s and 1 s in the adjacency matrix, thereby affecting the connectivity pattern of the entire indicator relationship network and the subsequent weight calculation results. The rationale for selecting λ = 0.5 in this study is as follows. (1) Probability theory logic: Within the Bayesian fusion framework, the composite probability p ranges from [0, 1]. The median of this range, 0.5, carries a natural decision-making significance—when p ≥ 0.5, it implies that the posterior probability of “a relationship exists” is no less than that of “no relationship exists.” In this case, it is determined that a substantive influence exists between the two indicators, which aligns with the neutral prior principle in Bayesian inference. (2) Symmetry and fairness: λ = 0.5 ensures that the determinations of “a relationship exists” and “no relationship exists” have equivalent base probabilities, thereby avoiding prior bias toward either side. If λ is significantly lower than 0.5 (e.g., 0.3), a large number of weak associations would be classified as “having an influence,” resulting in an overly dense network that loses analytical significance; if λ is significantly higher than 0.5 (e.g., 0.7), potential relationships would be excessively excluded, leading to an overly sparse network that loses important structural information. (3) Literature Support: In similar studies combining fuzzy multi-criteria decision-making with Bayesian methods, 0.5 is also the most commonly used neutral threshold for binary conversion, and its validity has been widely accepted. (4) Robustness Verification: To test the validity and robustness of λ = 0.5, this study conducted a sensitivity analysis to examine changes in the ANP network structure and the final weight rankings when λ was set to 0.3, 0.4, 0.5, 0.6, and 0.7. The results indicate that the main conclusions remain robust when λ falls within the range of 0.4 to 0.6 (see the sensitivity analysis section for details), further supporting the validity of λ = 0.5.
a i j = 1 , β i j 0.5 0 , β i j < 0.5
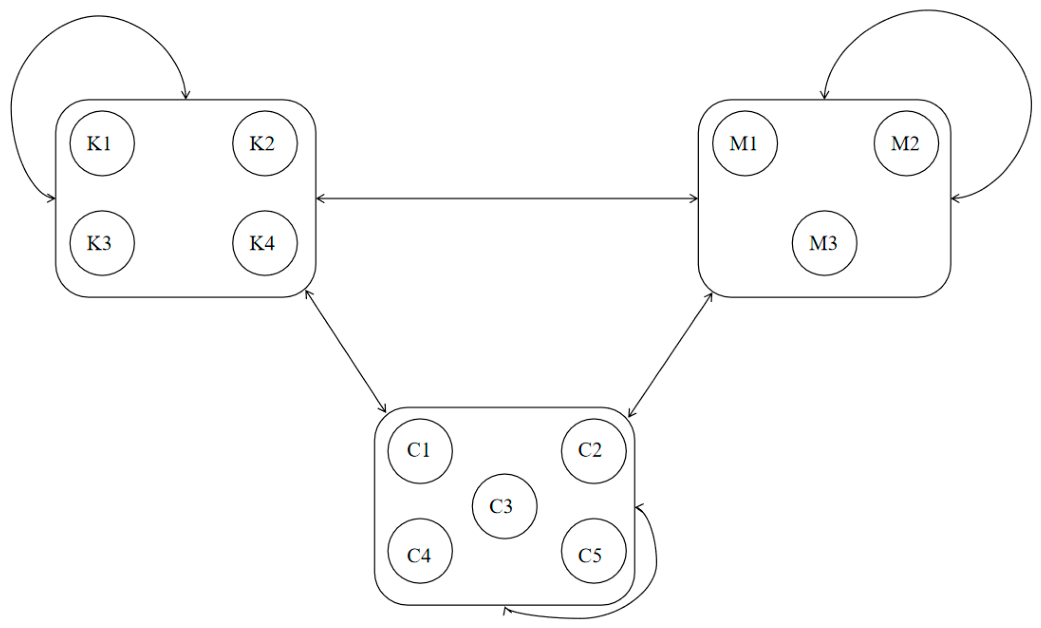
After repeating the above calculation for all indicators, a 12 × 12 adjacency matrix was obtained, as shown in Table 4. In this table, rows represent influencing factors, and columns represent influenced factors. A ‘1’ indicates that the influencing factor affects the influenced factor, while a ‘0’ indicates that the influencing factor does not affect the influenced factor. For example, the element in the first row and second column means that k1 affects k2. The matrix assumes no self-influence, so the diagonal elements are ‘0’. This matrix forms the basis of the ANP network structure and is used for constructing the judgment matrix to determine the weights of each indicator.
Based on this matrix, the indicator relationship model diagram was obtained using SD, as shown in Figure 1. K1–K4: proactive defense capability indicators; M1–M3: green operation capability indicators; C1–C5: collaborative recovery capability indicators. Arrows represent directional influence relationships.

3. Determination of Comprehensive Weights Based on Trapezoidal Fuzzy Numbers

In the judgment matrix of the classical ANP, the 1~9 scale method is usually used. However, in order to better reflect the fuzziness and uncertainty of human judgment, this study uses trapezoidal fuzzy numbers instead of the 1~9 scale method when determining the weights of indicators, as shown in Table 5. The ANP judgment scale based on trapezoidal fuzzy numbers is based on the same principle as the 1~9 scale method and also uses a nine-level scoring system.

3.1. Scoring the Judgment Matrix Based on Trapezoidal Fuzzy Numbers

In AHP/ANP, a judgment matrix is used to represent the pairwise relative importance of indicators under the same criterion. When comparing an indicator with itself, its importance should be completely equal, with no preference difference, so the diagonal is 1. To maintain the basic principle of having a diagonal of 1, the diagonals of all judgment matrices in this study are (1,1,1,1). Due to space limitations, this study uses Table 6 as an example. Taking the element in the first row, second column as an example, (2,3,4,5) indicates that, under the sub-criterion of proactive defense capability, when comparing proactive defense capability with green operation capability, proactive defense capability is slightly more important than green operation capability.

3.2. Defuzzification of the Judgment Matrix

This article collected the scoring matrices of five experts. After the collection, the first step is to defuzzify the scoring tables of the five experts. The initial judgments given by each expert are trapezoidal fuzzy numbers a ~ = ( a , b , c , d ) , where a ≤ b ≤ c ≤ d. Defuzzification is performed using the centroid method to obtain the precise value w:
w = a + 2 b + 2 c + d 6
Here, taking Table 3 as an example again, after defuzzification, the defuzzified table is shown in Table 7. Based on this formula, after defuzzifying each expert’s scoring table, five precise judgment matrices are obtained.

3.3. Fusion of Multiple Expert Judgment Matrices Based on Geometric Average

After obtaining the precise judgment matrices A(1),A(2),A(3),A(4),A(5) from five experts, they are integrated into a single comprehensive judgment matrix A ¯ = ( a ¯ i j ) using the geometric mean method. The geometric mean is a standard method for maintaining reciprocity in group decision making, and it is defined as:
a ¯ i j = k = 1 5 a ¯ i j ( k ) 1 5 , i , j .

3.4. Indicator Weight Calculation

3.4.1. Consistency Check

When the number of evaluation indicators is relatively large, the degree of interrelation among the indicators will also increase, and the scale and quantity of the resulting judgment matrix will be very large. The probability that the matrix cannot pass the consistency test will also be high. Therefore, it is necessary to test the judgment matrix, and, when the random consistency ratio CR < 0.10, the results are considered to have satisfactory consistency.
CR = CI / RI
CI = λ max n n 1
Here, λmax is the maximum eigenvalue of the judgment matrix, n is the order of the matrix, and RI is the average random consistency value of the matrix. The value of RI is generally determined based on the order of the matrix, with values shown in Table 8.
Below are the various precise comprehensive judgment matrices and CR values (for some judgment matrices with only one indicator, this part has been omitted in the subsequent tables), as shown in Table 9, Table 10 and Table 11. (Due to space constraints and to maintain the article’s readability, the remainder of the decision matrix is included in the Appendix A).
It can be seen that all judgment matrices have passed the consistency test.

3.4.2. Calculate the Unweighted Supermatrix

After all the judgment matrices are established, we calculate the normalized eigenvector of each matrix and then use the eigenvalue method to find the ranking vector, denoted as Wij. The column vectors in the ranking vector represent the importance ranking of elements ei1, ei2…ein in Cj with respect to elements ej1ej2……ejn in Cj. If the elements in Cj are not affected by the elements in Ci, then Wij = 0. The supermatrix W = Wij(i, j = 1, 2…N), where each Wij is a submatrix, and the supermatrix W is not column-normalized, as shown in Table 12.
W i j = w i 1 j 1 w i 1 j n w i n j 1 w i n j n
W = w 11 w 1 N w N 1 w N N

3.4.3. Calculating the Weighted Supermatrix

The purpose of calculating the weighted supermatrix W ¯ is to normalize the columns of the supermatrix W. After comparing the relative importance of the elements within all groups and normalizing them, the following weighted matrix A is obtained:
A = a 11 a 1 N a N 1 a N N
Then, the unweighted supermatrix W is weighted. The relationship between each element in matrix W corresponds to the group weight of elements in the weighted matrix A. These two matrices are combined through calculation to obtain the weighted supermatrix, as shown in Table 13:
W ¯ i j = a i j W i j ( i , j = 1,2 N )

3.4.4. Determining the Limit Supermatrix

We calculate the ultimate limit supermatrix W ¯ = l i m k k = 1 N W k N , where each column vector of W ¯ represents the weight value of the corresponding element, as shown in Table 14.

3.5. Results and Analysis of Indicator Weights

3.5.1. Results of Indicator Weighting

After completing the calculation of the extreme supermatrix, the global weights of each primary and secondary indicator and their ranking results were obtained, as shown in Table 15. Below, the weight distribution is systematically analyzed from the three dimensions of proactive defense capability, green operation capability, and collaborative recovery capability.

3.5.2. Analysis of Indicator Weights

At the primary indicator level, collaborative recovery capability ranks first with a weight of 0.5828, far surpassing the preemptive defense capability (0.3333) and green operation capability (0.0839). These results indicate that, in the sustainable supply chain resilience assessment system, collaboration and recovery after supply chain disruptions are considered the most critical factors. This closely aligns with reality: today’s global supply chains face increasing uncertainty and sudden shocks, and no comprehensive prevention system can fully eradicate risks. Therefore, the ability of all parties to quickly coordinate resources and restore operational order after disruptions directly determines the supply chain’s viability and long-term resilience. Proactive defense capability ranks second, indicating that preparation and prevention before risks occur in the supply chain cannot be ignored, but, compared to post-event recovery capability, their importance is slightly lower. The weight of green operational capability is significantly low, at only 0.0839. This does not mean green operations are unimportant but rather reflects that, in the current context of supply chain resilience assessment, green goals often need to be gradually achieved while ensuring basic operational safety and recovery efficiency. Companies typically prioritize survival and short-term recovery, while green operations are more of an additional requirement for long-term sustainable development.
Looking at the global weight ranking of secondary indicators, digital technology applications rank first with a weight of 0.1989. This result fully confirms the empowering role of digital technology in supply chain resilience. Technologies such as the Internet of Things, big data, blockchain, and artificial intelligence not only improve information transparency and sharing efficiency but also quickly adjust resource allocation and optimize decision-making paths during disruptions, serving as the core driving force in collaborative recovery capabilities. Collaboration and collaboration capability ranked second, with a value of 0.151, indicating that coordination and information sharing among supply chain partners play a key role in recovery. Close partnerships can accelerate resource integration and process reengineering, shortening recovery time. Supplier dispersion ranked third at 0.1146, reflecting the importance of diversified procurement strategies in the pre-defense phase. Multi-source supply can effectively reduce systemic risks caused by single-node disruptions. Flexible delivery capability has a weight of 0.1038, ranking fourth, indicating that the supply chain’s ability to adjust flexibly is also an important component of resilience. Rapid response capability ranks fifth with a weight of 0.0973, emphasizing the ability to respond instantly to sudden interruptions. The degree of information sharing had a weight of 0.0838, ranking sixth, reflecting the fundamental role of information flow in supply chain collaboration. Supply chain transparency has a weight of 0.0755, ranking seventh. The level of visualization helps companies identify risks in advance. The resilient financial reserve weight is 0.0459, ranking eighth, indicating that while capital buffering is necessary, it is not the core element of resilience. The weight of recovery time was 0.0453, ranking ninth, reflecting that the importance of post-disruption recovery speed is lower than that of the other collaborative capabilities. The sustainable supplier weight is 0.0443, ranking tenth; green process level weight is 0.0252, ranking eleventh; green inventory management weight is 0.0144, ranking last. The three indicators under green operation capability rank lower overall, further confirming the judgment at the primary indicator level: in supply chain resilience assessment, green operations play a more auxiliary role, and companies usually need to gradually advance greening while ensuring safety and efficiency.

4. Empirical Research

4.1. Scoring Criteria for Each Tertiary Indicator

To ensure that the evaluation results align with the actual operations of enterprises and that the evaluation indicators are data-collectible, for the 12 established tertiary indicators, since some data have not been disclosed, this article uses the presence of disclosure or clear cases as the scoring method in the scoring standards. Based on this, the following five-level quantitative scoring standards (see Table 16, Table 17 and Table 18) were established to avoid subjective and vague judgments in the evaluation process and ensure objectivity and efficiency.
This study selected three multinational corporations from different industries as empirical case studies, based on the following criteria:
(1)
Industry diversity: The three companies operate in the semiconductor manufacturing (Company T), industrial digital manufacturing (Company S), and food and beverage (Company N) sectors, ensuring that the proposed resilience evaluation framework is applicable across industries rather than limited to a specific sector.
(2)
Data availability: All three companies are publicly traded and regularly publish annual reports, ESG/sustainability reports, and supply chain disclosures, ensuring that the data used for the evaluation is verifiable and auditable, thereby avoiding reliance on estimates or internal data.
(3)
Supply Chain Complexity: All three companies manage large-scale, globally distributed supply chain networks and face multiple disruption risks, including geopolitical risks, raw material shortages, and demand fluctuations, making them typical subjects for supply chain resilience assessment.
(4)
Sustainability Relevance: All three companies have publicly committed to sustainability goals (such as green procurement, carbon reduction, and the circular economy), which align with the green operations dimension included in this evaluation framework.
To maintain the objectivity of the analysis and prevent readers from focusing on specific corporate cases rather than the evaluation methodology itself, the company names have been anonymized and are designated as T, S, and N.

4.2. Taking Three Companies as an Example

In order to verify the rationality, applicability, and operability of the evaluation system in this article, this section selects companies at three different development stages as empirical samples, namely T, S, and N. Scores were assigned according to the scoring criteria in Section 4.1, and the scores for the corresponding indicators were given the respective weights (calculated in Section 3.5) to obtain the scores for each company.
To make scoring more convenient and operable, a five-point scale was adopted, with each indicator divided into five levels from high to low, as shown in Table 19.
To ensure the objectivity and traceability of the data, all data used in this study come from publicly disclosed annual reports, ESG reports, social responsibility reports, and publicly available statistical data from industry associations. All data can be directly verified through public channels, with no subjective surveys or estimated content involved.

4.3. Overall Corporate Score Situation

After obtaining the scores of each tertiary indicator of the enterprises and then combining them with the weights of the indicators, the weighted comprehensive scores of these three enterprises were obtained, as shown in Table 20.

4.4. Analysis of Company Scores

The above case analysis shows that, in the highest-weighted digital technology application indicator (C5, 0.1989), both Enterprise T (5 points) and Enterprise S (5 points) received full marks, while Enterprise N (4 points) was slightly lower but still at a relatively high level, fully confirming the research conclusion that “digital technology has become the core engine driving supply chain resilience.” At the same time, supplier dispersion (k1, 0.1146) also had a significant impact on the overall score: Enterprise T scored only 3 points due to high concentration of core equipment suppliers (the top five costs account for over 50%), while both Company S and Company N each scored 5 points, indicating that supplier diversification indeed helps strengthen the resilience foundation.
In terms of overall scores, Enterprise T ranks first with 4.50 points, followed closely by Company S with 4.46 points, with a very small gap (0.04 points), and Company N ranks third with 4.06 points. The specific analysis is as follows:
Enterprise T earned high marks for its strong financial resilience (cash ratio 1.92), comprehensive supply chain transparency, systematic supplier sustainability management, and leading digital manufacturing capabilities. Although there are certain shortcomings in supplier concentration on the equipment side, the outstanding performance in other dimensions effectively compensates for this shortcoming, demonstrating the complementary effects among various resilience dimensions.
Company S scored full marks in supplier dispersion, green material usage rate, information sharing, and digital technology application, with overall balanced performance and nearly equal to T Company scores. This indicates that, in supply chain resilience building, a broad supplier network combined with deep digital collaboration can also generate a powerful comprehensive effect.
Company N excelled in green operations: green material usage, sustainable suppliers, and green process levels all received perfect scores. However, its scores for collaborative recovery capabilities such as rapid response capability and time to resume operations were relatively low (both 3 points), reflecting the unique challenges the food and beverage industry faces in disruption response timeliness and insufficient quantitative information disclosure in the industry. Nevertheless, its composite score remains in a good range, indicating that green operating capability contributes somewhat to overall resilience, though its weight is limited (only 0.0839).
Synthesizing the performance of the three companies, the evaluation system constructed in this study can effectively distinguish the supply chain resilience levels of different enterprises, and the scoring results are consistent with each company’s industry characteristics and publicly available facts. The higher the score for the highest-weighted digital technology application indicator, the higher the enterprise’s overall resilience ranking, further validating the rationality of the indicator weight allocation. Additionally, all three companies scored highly in collaborative recovery capability indicators such as information sharing and collaborative collaboration (average 4.3 points), which aligns with Chapter 2’s conclusion that “collaborative resilience has the highest weight (0.5828),” indicating that collaboration and recovery capability after disruptions have become core concerns in supply chain resilience construction.

5. Conclusions

Based on the above research, this study draws the following conclusions. First, the constructed sustainable supply chain resilience evaluation system, which includes 12 indicators across three dimensions (proactive defense, green operations, and collaborative recovery) can systematically reflect the key factors affecting enterprise supply chain resilience. Second, the use of the trapezoidal-fuzzy-number-improved ANP method effectively addresses the fuzziness and uncertainty in expert judgments. The weight calculation results show that collaborative recovery ability (0.5828) and the application of digital technology (0.1989) rank first in the primary and tertiary indicators, respectively, indicating that post-event collaboration and digital empowerment are the core pathways to enhancing resilience. Third, a case study based on publicly available data from three representative enterprises verifies the system’s discriminative power and operability, with scoring results consistent with each enterprise’s actual resilience performance. This study provides methodological support for enterprises to quantitatively evaluate and, in a targeted manner, enhance supply chain resilience in uncertain environments.
This study has the following limitations: (1) The sample size of experts was small (five individuals), which may affect the representativeness and robustness of the findings; in future studies, the sample could be expanded to 10 or more individuals to enhance statistical reliability; (2) The empirical sample consisted of only three companies, all of which used publicly disclosed data, limiting the study’s applicability to companies that do not fully disclose ESG information; (3) The case companies were anonymized (T, S, N), which to some extent limits other scholars’ ability to independently replicate the findings and conduct cross-study comparative validation.


Author Contributions

Conceptualization, T.N.; methodology, T.N.; software, T.N. and Z.Z.; validation, T.N.; formal analysis, T.N. and Z.Z.; investigation, T.N. and Z.Z.; resources, T.N.; data curation, T.N. and Z.Z.; writing—original draft preparation, T.N. and Z.Z.; writing—review and editing, T.N.; visualization, T.N.; supervision, T.N.; project administration, T.N.; funding acquisition, T.N. All authors have read and agreed to the published version of the manuscript.

Funding

This research was funded by the Shandong Provincial Social Science Planning Research Project (grant number 22CGLJ17) under the auspices of the Shandong Academy of Social Sciences.

Data Availability Statement

The data presented in this study are available in the public annual reports and ESG disclosure reports of the respective companies.

Conflicts of Interest

The authors declare no conflict of interest.

Appendix A

The following is the decision matrix that was not included in Section 3.4 due to space constraints, as shown in Table A1, Table A2, Table A3, Table A4, Table A5, Table A6, Table A7, Table A8, Table A9, Table A10, Table A11, Table A12, Table A13, Table A14, Table A15, Table A16, Table A17, Table A18, Table A19, Table A20, Table A21 and Table A22.
Table A1. Resilient financial reserves—proactive defense capability.
Supplier DispersionSupplier Dispersion
Supplier dispersion13.5
Rapid response capability 1
CR = 0
Table A2. Rapid response capability—preemptive defense capability.
Supplier DispersionSupplier DispersionSupplier Dispersion
Supplier Dispersion10.3111114.5
Resilient Financial Reserves 16.5
Supply Chain Transparency 1
CR = 0.0688
Table A3. Rapid response capability—Collaborative Recovery Ability.
Flexible Delivery CapabilityFlexible Delivery CapabilityFlexible Delivery CapabilityFlexible Delivery CapabilityFlexible Delivery Capability
Flexible delivery capability10.3111110.1876985.50.157341
Level of information sharing 10.3111117.50.233333
Collaboration and coordination capability 18.8333330.486111
Recovery time for operations 10.111111
Application of digital technology 1
CR = 0.0793
Table A4. Supply chain transparency—preventive capability.
Supplier DispersionSupplier Dispersion
Supplier dispersion13.5
Rapid response capability 1
CR = 0
Table A5. Supply chain transparency—collaborative resilience.
Degree of Information SharingDegree of Information SharingDegree of Information Sharing
Degree of information sharing10.3111110.233333
Collaboration and coordination capability 10.486111
Application of digital technology 1
CR = 0.0201
Table A6. Green inventory management—green operation capability.
Sustainable SuppliersSustainable Suppliers
Sustainable suppliers10.311111
Green process level 1
CR = 0
Table A7. Green inventory management—collaborative recovery capability.
Degree of Information SharingDegree of Information Sharing
Degree of information sharing10.233333
Application of digital technology 1
CR = 0
Table A8. Sustainable suppliers—preemptive defense capability.
Supplier DispersionSupplier Dispersion
Supplier dispersion14.5
Supply chain transparency 1
CR = 0
Table A9. Sustainable suppliers—green operation capabilities.
Green Inventory ManagementGreen Inventory Management
Green Inventory Management10.233333
Green Process Level 1
CR = 0
Table A10. Sustainable suppliers—collaborative recovery capability.
Collaboration and Coordination AbilityCollaboration and Coordination Ability
Collaboration and coordination ability10.486111
Application of digital technology 1
CR = 0
Table A11. Green process level—green operation capability.
Green Inventory ManagementGreen Inventory Management
Green Inventory Management10.486111
Sustainable Suppliers 1
CR = 0
Table A12. Flexibility delivery capability—preemptive defense capability.
Supplier DispersionSupplier Dispersion
Supplier dispersion13.5
Rapid response capability 1
CR = 0
Table A13. Flexible delivery capability—collaborative recovery capability.
Degree of Information SharingDegree of Information SharingDegree of Information SharingDegree of Information Sharing
Degree of information sharing10.3111117.50.233333
Collaboration and coordination capability 18.8333330.486111
Recovery operation time 10.111111
Application of digital technology 1
CR = 0.079
Table A14. Level of Information Sharing—Collaborative Recovery Ability.
Rapid Response CapabilityRapid Response Capability
Rapid response capability12.5
Supply chain transparency 1
CR = 0
Table A15. Information sharing level—collaborative recovery capability.
Agile Delivery CapabilityAgile Delivery CapabilityAgile Delivery CapabilityAgile Delivery Capability
Agile delivery capability10.1876985.50.157341
Collaboration capability 18.8333330.486111
Recovery time 10.111111
Application of digital technology 1
CR = 0.0975
Table A16. Collaborative capability—preemptive defense capability.
Supplier DispersionSupplier DispersionSupplier Dispersion
Supplier dispersion13.54.5
Quick response capability 12.5
Supply chain transparency 1
CR = 0.0474
Table A17. Collaborative capability—collaborative recovery capability.
Flexible Delivery CapabilityFlexible Delivery CapabilityFlexible Delivery CapabilityFlexible Delivery Capability
Flexible delivery capability10.4861111.7328620.406638
Degree of information sharing 12.8601660.486111
Recovery operation time 10.362437
Application of digital technology 1
CR = 0.026
Table A18. Recovery operation time—pre-defense capability.
Resilient Financial ReservesResilient Financial Reserves
Resilient financial reserves15.5
Rapid response capability 1
CR = 0
Table A19. Recovery operation time—collaborative recovery capability.
Flexible Delivery CapabilityFlexible Delivery CapabilityFlexible Delivery CapabilityFlexible Delivery Capability
Flexible delivery capability10.3719150.1876980.206667
Degree of information sharing 10.3111110.312954
Collaboration and coordination capability 10.486111
Application of digital technology 1
CR = 0.0416
Table A20. Application of digital technology—preemptive defense capability.
Rapid Response CapabilityRapid Response Capability
Rapid response capability12.5
Supply chain transparency 1
CR = 0
Table A21. Digital technology application—green operation capability.
Green Inventory ManagementGreen Inventory ManagementGreen Inventory Management
Green Inventory Management10.4861110.233333
Sustainable Suppliers 10.311111
Green Process Level 1
CR = 0.0201
Table A22. Application of digital technology—collaborative recovery capability.
Flexibility in Delivery CapabilityFlexibility in Delivery CapabilityFlexibility in Delivery CapabilityFlexibility in Delivery Capability
Flexibility in delivery capability10.3111110.1876985.5
Level of information sharing 10.3111117.5
Cooperation and collaboration capability 18.833333
Recovery operation time 1
CR = 0.0864

References

  1. Li, S.; Xu, M.; Cui, L. Research on Sustainable Resilient Supply Chain Networks: Review and Outlook. China Manag. Sci. 2026, 34, 272–284. [Google Scholar] [CrossRef]
  2. Jiang, Z.; Guo, J.; Zheng, W. Supply Chain Resilience: Research Review and Prospects. J. Northeast. Univ. (Nat. Sci. Ed.) 2025, 46, 59–70. [Google Scholar]
  3. Hosseini, S.; Ivanov, D. Bayesian networks for supply chain risk, resilience and ripple effect analysis: A literature review. Expert Syst. Appl. 2020, 161, 113649. [Google Scholar] [CrossRef] [PubMed]
  4. Vali-Siar, M.M.; Tikani, H.; Demir, E.; Shamstabard, Y. Resilient supply chain network design under super-disruption considering inter-arrival time dependency: A new data-driven stochastic optimization approach. Transp. Res. Part E 2026, 207, 104615. [Google Scholar]
  5. Ma, X.; He, Z.; Lin, C. Agent-Based Modeling and Simulation of Supply Chain Risk Management: Current Status, Issues, and Prospects. Manag. Rev. 2026, 38, 1–18. [Google Scholar] [CrossRef]
  6. Tao, F.; Wang, X.; Xu, Y.; Zhu, P. Digital Transformation, Resilience of Industrial Chain and Supply Chain, and Enterprise Productivity. China Ind. Econ. 2023, 5, 118–136. [Google Scholar] [CrossRef]
  7. Zhang, S.; Gu, C.; Zhang, P. Intelligent logistics empowers supply chain resilience: Theory and empirical evidence. China Soft Sci. 2023, 11, 54–65. [Google Scholar] [CrossRef]
  8. Du, W.; Xu, W. Evaluation of Cold Chain Logistics Supply Chain Resilience Based on ANP-VIKOR. Logist. Technol. 2024, 47, 139–142. [Google Scholar] [CrossRef]
  9. Zhu, X.; Liu, Y.; Liu, X.; Li, X.; Wang, B.; Song, N. Analysis of supply chain resilience influencing factors based on DEMATEL-ISM-MICMAC method. J. Shandong Univ. (Sci. Ed.) 2025, 1–11. Available online: https://link.cnki.net/urlid/37.1389.N.20260128.1359.008 (accessed on 15 May 2026). [CrossRef]
  10. Yuan, Y.; Wu, D. Enterprise digital transformation and supply chain resilience —Based on the perspective of supply chain spillover. Syst. Eng. Theory Pract. 2025, 45, 2309–2326. [Google Scholar]
  11. Wang, X.; Tang, J.; Liu, A.; Hou, B. A survey of the resilient supplier selection and order allocation problem under risks. Syst. Eng. Theory Pract. 2025, 45, 2995–3009. [Google Scholar]
  12. Wang, Y.; Ma, Y.; Cheng, P. Cross-border E-commerce Empowers Enterprises to Improve Supply Chain Resilience: Micro Evidence from China’s Listed Companies. World Econ. Res. 2024, 6, 105–119+137. [Google Scholar] [CrossRef]
  13. Song, D.; Liu, P.; Ding, W. Digital transformation of enterprises and supply chain resilience: A social network analysis perspective. J. Southeast Univ. (Philos. Soc. Sci. Ed.) 2024, 26, 47–60+149+2. [Google Scholar] [CrossRef]
  14. Cai, Y.; Bian, X.; Li, X.; Wang, X. Data Assets and Manufacturing Supply Chain-Resilience. Financ. Account. Mon. 2026, 47, 49–55. [Google Scholar] [CrossRef]
  15. He, G.; Li, X. Research on the Impact of Patient Capital on Corporate Supply Chain Resilience—From the Perspectives of Innovation Incentives and Supply Chain Collaboration. Shanghai Econ. Res. 2026, 42–57. [Google Scholar] [CrossRef]
  16. Li, T.; Rong, Q.; Yan, Q.; Lu, J. A configurational study on the enhancement of supply chain resilience driven by digital-green synergy. Res. Manag. 2026, 47, 116–126. [Google Scholar] [CrossRef]
  17. Xue, Y.; Gao, W.; Feng, T. Data Element Marketization, Dynamic Capability Adaptation, and Supply Chain Resilience—A Causal Inference Based on Double Machine Learning. J. Harbin Univ. Commer. (Soc. Sci. Ed.) 2026, 3–19. Available online: https://link.cnki.net/urlid/23.1503.F.20260121.1117.002 (accessed on 15 May 2026).
  18. Wang, Y.; Li, M.; Sun, L.; Liu, J.; Wang, Y. Resilience factors and mechanisms in the coal power supply chain: A quantitative analysis using fuzzy DEMATEL, ISM, and ANP methods. PLoS ONE 2025, 20, e0322952. [Google Scholar] [CrossRef] [PubMed]
  19. Lee, C.-W.; Yang, C.-C.; Wang, C.-C.; Fu, M.-W.; Giovanni, I.R. An ANP-Based Decision Framework for ESG-Driven Green Supply Chain Management with Proposed Neural Feature Extraction. Sustainability 2026, 18, 2876. [Google Scholar] [CrossRef]
  20. Dominguez, S.; Carnero, M.C. Fuzzy Multicriteria Modelling of Decision Making in the Renewal of Healthcare Technologies. Mathematics 2020, 8, 944. [Google Scholar] [CrossRef]
  21. Simjanović, D.J.; Vesić, N.O.; Ignjatović, J.M.; Ranđelović, B.M. A Novel Surface Fuzzy Analytic Hierarchy Process. Filomat 2023, 37, 3357–3370. [Google Scholar] [CrossRef]
  22. Nguyen, P.-H.; Tsai, J.-F.; Lin, M.-H.; Hu, Y.-C. A Hybrid Model with Spherical Fuzzy-AHP, PLS-SEM and ANN to Predict Vaccination Intention against COVID-19. Mathematics 2021, 9, 3075. [Google Scholar] [CrossRef]
  23. Zhou, Y.; He, Y.; Qin, G.; Wang, Y.; Guo, C.; Fang, C.; Lin, R.; Wang, B. A Fuzzy Bayesian-Based Integrated Framework for Risk Analysis of a Dual-Cycle Liquefied Natural Gas Cold Energy Power Generation System. Energies 2026, 19, 688. [Google Scholar] [CrossRef]
  24. Khalilzadeh, M.; Banihashemi, S.A.; Heidari, A.; Božanić, D.; Milić, A. Risk Analysis and Assessment of Water Supply Projects Using the Fuzzy DEMATEL-ANP and Artificial Neural Network Methods. Water 2025, 17, 1995. [Google Scholar] [CrossRef]
  25. Leonelli, M.; Ramanathan, R.; Wilkerson, R.L. Sensitivity and robustness analysis in Bayesian networks with the bnmonitor R package. Knowl.-Based Syst. 2023, 278, 110882. [Google Scholar] [CrossRef]
  26. Zhang, J.; Ji, Z.; Tian, K.; Yang, C. Development of New Quality Productive Force and Improvement of Supply Chain Resilience: Taking the New Energy Vehicle Industry as an Example. J. Econom. 2026, 6, 652–674. [Google Scholar]
  27. Shao, C.; Chen, Y. Supply Chain Risks and Reshaping: How Do Firms Manage Supply Chain Risks. China Ind. Econ. 2026, 146–169. [Google Scholar] [CrossRef]
  28. Yu, N.; Cheng, H.; Ruan, P.; Wang, P. The Impact of Patient Capital on Supply Chain Resilience: The Moderating Effects of Efficient Market and Digital Economy. Financ. Forum 2026, 42, 65–75. [Google Scholar] [CrossRef]
  29. Wu, J.; Long, Y. Decision optimization of emergency materials supply chain considering supplier failure from perspective of resilience. Control Decis. 2025, 40, 2439–2449. [Google Scholar] [CrossRef]
  30. Wang, C.; Liu, Y.; Hu, T.; Zhong, Z. Resilience without Recklessness: Dynamic Collaborative Optimization of Resilience and Holding Costs in Fresh Agricultural Product Supply Chains. Oper. Res. Manag. 2026. Available online: https://link.cnki.net/urlid/34.1133.G3.20251128.0906.002 (accessed on 15 May 2026).
  31. Li, H.; Mei, M.; Zhang, Y. How Does “Data-Driven Tax Governance” Enhance Supply Chain Resilience? Evidence from the Quasi-Natural Experiment of the Golden Tax Project III. China Manag. Sci. 2026, 1–19. [Google Scholar] [CrossRef]
  32. Han, Y.; Hu, J.; Yu, X. Corporate ESG Performance and Resilience of Industrial and Supply Chains—A Perspective of Signaling. Econ. Manag. Res. 2025, 46, 3–20. [Google Scholar] [CrossRef]
  33. Ma, J.; Ni, J.; Liu, Y.; Zhao, Y. Impact of China’s carbon emissions trading policy on low-carbon supply chain resilience. China Popul. Resour. Environ. 2025, 35, 49–59. [Google Scholar]
  34. Liu, J.; Xia, X.; Zhu, Q. The Research Progress and Prospects of Sustainable Supply Chain Management under the New Development Pattern. China Manag. Sci. 2025, 33, 213–226. [Google Scholar] [CrossRef]
  35. Li, C.; Feng, X. The Impact of Green Finance on Enterprise Supply Chain Resilience: Empirical Evidence from China’s A-Share Listed Companies. Sci. Technol. Entrep. Mon. 2026, 39, 147–155. [Google Scholar]
  36. Shi, D.; Li, X.; Li, D. How Can Intelligent Supply Chain Improve Enterprise Performance: Study on Supply Chain Optimization Resilience Perspective. China Manag. Sci. 2025, 33, 325–334. [Google Scholar] [CrossRef]
  37. He, N.; Li, Y.; Jiang, Z. Information Sharing Options and Collaborative Inventory Optimization under Supply Disruption Risk. Syst. Eng. Theory Pract. 2025, 1–17. Available online: https://link.cnki.net/urlid/11.2267.N.20250915.1020.012 (accessed on 15 May 2026).
  38. Zhou, J.; Lv, W.; Wang, J. Impact of risk and information coupled propagation in multilayer networks on supply chain resilience. J. Tsinghua Univ. (Nat. Sci. Ed.) 2025, 65, 1050–1059. [Google Scholar] [CrossRef]
  39. Zhang, X.; Li, S.; Xiong, Q. External Integration and Internal Coordination: Enhancing Organizational Resilience from a Supply Chain Network Perspective. Nankai Manag. Rev. 2025, 1–22. [Google Scholar]
  40. Chen, X.; Liu, C.; Fu, W.; Hu, D.; Wei, L. Conditional value at risk assessment of supply chain disruption risk under the ripple effect. China Manag. Sci. 2026. [Google Scholar] [CrossRef]
  41. Lu, Y.; Chen, Y.; Wu, Z. Global supply chain risk assessment and resilience measurement: Taking soybean as an example. Acta Geogr. Sin. 2024, 79, 2651–2669. [Google Scholar]
  42. Deng, H.; Liu, Y.; Wang, Q. How Does Artificial Intelligence Influence Supply Chain Resilience: Evidence from Listed Companies. J. Zhejiang Univ. (Humanit. Soc. Sci. Ed.) 2024, 54, 5–23. [Google Scholar]
  43. Song, H. Transitioning from Digitization to Intelligent Digitization: Transition Path and Capability Building of Supply Chain. China Circ. Econ. 2025, 39, 27–35. [Google Scholar] [CrossRef]
  44. Li, Z.; Liu, Q.; Zhang, L. How Artificial Intelligence Innovation Reduce Supply Chain Disruption Risks. China Circ. Econ. 2025, 39, 58–76. [Google Scholar] [CrossRef]
  45. Shen, L.; Chao, X. The Influence Mechanism and the Supply Chain Spillover Effect of Artificial Intelligence on the Resilience of Manufacturing Enterprises. Nankai Econ. Res. 2025, 271–288. [Google Scholar] [CrossRef]
Figure 1. Indicator relationship model diagram.
Asi 09 00164 g001
Table 1. Comparison of commonly used multi-criteria decision-making methods.
MethodMain AdvantagesMain Limitations
Traditional AHPClear structure, easy to operate and understandAssumes independence among criteria, fails to capture inter-criteria dependencies
Traditional ANPAllows interdependent relationships among criteria, closer to real decision-making scenariosLarge number of pairwise comparison matrices, heavy burden on experts
Fuzzy AHP/ANPCapable of handling fuzziness and uncertainty in expert judgmentsMostly uses triangular fuzzy numbers, limited precision in expressing expert cognitive intervals
DEMATELIdentifies causal relationships and influence paths among criteriaProvides only relational structure, does not directly yield criteria weights
VIKORProvides compromise ranking of alternatives, facilitates solution selectionRequires predetermined weights, does not generate criteria importance weights
Proposed methodHigher expression precision via trapezoidal fuzzy numbers; Bayesian fusion mechanism effectively integrates multi-expert opinions; simultaneously outputs network structure and criteria weightsRelatively complex computational process; heavy questionnaire design workload
Table 2. Evaluation indicators of sustainable supply chain resilience.
Primary IndicatorSecondary IndicatorLevel 3 IndicatorSymbol
Sustainable Supply Chain ResiliencePreemptive defense capability (k)Supplier dispersion [26,27]k1
Resilient financial reserves [28]k2
Quick response capability [29,30]k3
Supply chain transparency [31,32]k4
Green operating capability (m)Green inventory management [33,34]m1
Sustainable supplierm2
Level of green technology [35]m3
Collaborative recovery capability (c)Flexible delivery capability [36]c1
Degree of information sharing [37,38]c2
Collaboration and coordination ability [39]c3
Resumption of operations time [40,41]c4
Application of digital technology [42,43,44,45]c5
Table 3. Conversion of the five-level language evaluation set into trapezoidal fuzzy numbers.
Fuzzy Language LevelFuzzy Language RepresentationNormalized Trapezoidal Fuzzy Number
s 0 None(0,0,0,0.143)
s 1 Weak(0,0.143,0.286,0.429)
s 2 Average(0.286,0.429,0.571,0.714)
s 3 Strong(0.571,0.714,0.857,1)
s 4 Very Strong(0.857,1,1,1)
Table 4. Adjacency matrix.
k1k2k3k4m1m2m3c1c2c3c4c5
k1011101010100
k2001000100010
k3010100011111
k4101001001101
m1000001101001
m2100110100101
m3010011000001
c1101000001111
c2001110010111
c3001101011011
c4011000011101
c5001111111110
Table 5. ANP judgment scale based on trapezoidal fuzzy numbers.
MeaningScale (Trapezoidal Fuzzy Number)1/Scale (Reciprocal)
Equally importantL1 (1,1,1,1)V1 (1,1,1,1)
Adjacent intermediate valueL2 (1,2,3,4)V2 (1/4,1/3,1/2,1)
Slightly importantL3 (2,3,4,5)V3 (1/5,1/4,1/3,1/2)
Adjacent intermediate valueL4 (3,4,5,6)V4 (1/6,1/5,1/4,1/3)
Obviously importantL5 (4,5,6,7)V5 (1/7,1/6,1/5,1/4)
Adjacent intermediate valueL6 (5,6,7,8)V6 (1/8,1/7,1/6,1/5)
Strongly importantL7 (6,7,8,9)V7 (1/9,1/8,1/7,1/6)
Adjacent intermediate valueL8 (7,8,9,9)V8 (1/9,1/9,1/8,1/7)
Extremely importantL9 (9,9,9,9)V9 (1/9,1/9,1/9,1/9)
Table 6. Example of a judgment matrix based on trapezoidal fuzzy numbers (using preemptive defense capability as a sub-criterion).
Preemptive Defense CapabilityPreemptive Defense CapabilityPreemptive Defense Capability
Preemptive defense capability(1,1,1,1)(2,3,4,5)(1/4,1/3,1/2,1)
Green operation capability (1,1,1,1)(1/6,1/5,1/4,1/3)
Collaborative recovery capability (1,1,1,1)
Table 7. Example of deblurring.
Preemptive Defense CapabilityPreemptive Defense CapabilityPreemptive Defense Capability
Preemptive defense capability13.50.4861
Green operation capability 10.2333
Collaborative recovery capability 1
Table 8. Average random consistency index.
n12345678910
RI000.520.891.121.261.361.411.461.49
Table 9. Pre-emptive defense capability used as a sub-criterion.
Preemptive Defense CapabilityPreemptive Defense CapabilityPreemptive Defense Capability
Preemptive Defense Capability13.920670.486111
Green Operation Capability 10.21748
Collaborative Recovery Capability 1
CR = 0.0338
Table 10. Green operation capability is taken as a sub-criterion.
Pre-Emptive Defense CapabilityPre-Emptive Defense CapabilityPre-Emptive Defense Capability
Pre-emptive defense capability13.426960.486111
Green operation capability 10.244002
Collaborative recovery capability 1
CR = 0.0315
Table 11. Collaborative recovery capability is used as a sub-criterion.
Preemptive Defense CapabilityPreemptive Defense CapabilityPreemptive Defense Capability
Preemptive defense capability13.426960.486111
Green operation capability 10.244002
Collaborative recovery capability 1
CR = 0.0315
Table 12. Unweighted supermatrix.
k1k2k3k4m1m2m3c1c2c3c4c5
k100.77780.26650.777800.818200.777800.651600
k2000.656200010000.84620
k300.222200.22220000.22220.71430.23240.15380.7143
k4100.0773000.1818000.28570.11600.2857
m1000000.18920.327101000.1293
m210010.237300.672900100.2302
m301000.76270.8108000000.6404
c1100.0715000000.10020.16930.06750.1225
c2000.14520.11450.1892000.143800.28780.13930.2694
c3000.30670.318500.327100.32270.345300.33080.5708
c4010.025700000.03390.03450.115100.0373
c5000.45080.5670.81080.672910.49960.520.42780.46240
Table 13. Weighted supermatrix.
k1k2k3k4m1m2m3c1c2c3c4c5
k100.25810.09850.258100.266800.286300.212500
k2000.24250000.32610000.31140
k300.073700.07370000.08180.23290.07580.05660.2329
k40.331900.0286000.0593000.09320.037800.0932
m1000000.02160.037300.114000.0147
m20.1021000.10210.040100.0767000.11400.0263
m300.1021000.1290.0924000000.073
c10.566100.0451000000.05610.09480.04260.0686
c2000.09160.06480.1572000.090900.16110.0880.1508
c3000.19340.180300.183100.20390.193300.2090.3196
c400.56610.016200000.02140.01930.064400.0209
c5000.28420.3210.67360.37670.55990.31570.29110.23950.29220
Table 14. Limit supermatrix.
k1k2k3k4m1m2m3c1c2c3c4c5
k10.11460.11460.11460.11460.11460.11460.11460.11460.11460.11460.11460.1146
k20.04590.04590.04590.04590.04590.04590.04590.04590.04590.04590.04590.0459
k30.09730.09730.09730.09730.09730.09730.09730.09730.09730.09730.09730.0973
k40.07550.07550.07550.07550.07550.07550.07550.07550.07550.07550.07550.0755
m10.01440.01440.01440.01440.01440.01440.01440.01440.01440.01440.01440.0144
m20.04430.04430.04430.04430.04430.04430.04430.04430.04430.04430.04430.0443
m30.02520.02520.02520.02520.02520.02520.02520.02520.02520.02520.02520.0252
c10.10380.10380.10380.10380.10380.10380.10380.10380.10380.10380.10380.1038
c20.08380.08380.08380.08380.08380.08380.08380.08380.08380.08380.08380.0838
c30.1510.1510.1510.1510.1510.1510.1510.1510.1510.1510.1510.151
c40.04530.04530.04530.04530.04530.04530.04530.04530.04530.04530.04530.0453
c50.19890.19890.19890.19890.19890.19890.19890.19890.19890.19890.19890.1989
Table 15. Indicator Weight Distribution.
Primary IndicatorWeightSecondary IndicatorLocal WeightGlobal WeightSort
Preemptive defense capability0.3333Supplier dispersion0.34370.11463
Resilient financial reserves0.13780.04598
Rapid response capability0.2920.09735
Supply chain transparency0.22650.07557
Green operation capability0.0839Green inventory management0.17150.014412
Sustainable suppliers0.52850.044310
Green process level0.30.025211
Collaborative Recovery Capability0.5828Flexible delivery capability0.17810.10384
Degree of information sharing0.14380.08386
Collaborative capability0.2590.1512
Recovery operation time0.07770.04539
Application of digital technology0.34130.19891
Table 16. Preemptive defense capability scoring criteria.
Tertiary IndicatorsScoring Criteria54321
Supplier Dispersion (k1)Proportion of purchases from the top five suppliers≤40%40–50%50–60%60–70%>70%
Resilient Financial Reserves (k2)Cash ratio (cash and equivalents ÷ current liabilities)≥0.50.3–0.50.15–0.30.05–0.15<0.05
Rapid Response Capability (k3)Cases of quick recovery after disruption or delayed delivery resolutionThere are clear cases with significant resultsThere are cases that have been resolvedThere are cases, but the effect is averageOnly mentions measures without empirical evidenceNo public cases
Supply Chain Transparency (k4)Whether a traceable system/blockchain technology coverage is disclosedFull process traceable and details disclosedThe core links can be tracedMentioned traceability measures but did not quantify themOnly mention the conceptNo disclosure
Table 17. Green operation capability scoring standards.
Level 3 IndicatorsScoring Criteria54321
Flexibility in Delivery Capability (c1)Flexible manufacturing/multi-source distribution casesClear system and empirical data Systematically implemented and effectiveSystematic but limited in effectOnly mention conceptsNo disclosure
Extent of Information Sharing (c2)Deployment of ERP/EDI/supply chain collaboration platformsPlatform covers core suppliers with detailed data The platform has been deployed but coverage is limitedMentions informatization measuresOnly mention conceptsNo disclosure
Collaboration and Coordination Capability (c3)Collaborative measures such as strategic cooperation/emergency agreements/supplier trainingMultidimensional collaboration with empirical evidence There is a clear coordination planHas a basic cooperation frameworkOnly mention conceptsNo disclosure
Recovery Time of Operations (c4)Cases of post-disruption recoveryClear and relatively short recovery time (<7 days) There are recovery cases, but the time is relatively long.Only mentions response measuresOnly mention emergency plansNo disclosure
Application of Digital Technology (c5)Deployment of digital technologies such as AI/IoT/blockchain in the supply chainComplete technical system with quantifiable resultsThe technology is widely applied and has examplesHas technological applications but on a limited scaleOnly mention digital transformationNo disclosure
Table 18. Collaborative recovery capability scoring criteria.
Level 3 IndicatorsScoring Criteria5432
Flexibility in Delivery Capability (c1)Are there multi-source delivery cases? Clear system and empirical data Systematically implemented and effectiveSystematic but limited in effectOnly mention concepts
Degree of Information Sharing (c2)Is ERP/EDI deployed? Platform covers core suppliers with detailed data Platform deployed but coverage limitedMentions informatization measuresOnly mention concepts
Collaborative Coordination Capability (c3)Are strategic cooperation and other collaborative measures disclosed? Multidimensional collaboration with empirical evidence Clear collaboration planHas a basic cooperation frameworkOnly mention concepts
Recovery Time for Operations (c4)Are there cases of recovery after interruptions? Clear and relatively short recovery time (<7 days) Recovery cases exist but take a long timeOnly mentions response measuresOnly mention emergency plans
Application of Digital Technology (c5)Is AI/IoT technology deployed in the supply chain?Complete technical system with quantifiable resultsTechnology widely applied with examplesHas technological applications but on a limited scaleOnly mention digital transformation
Table 19. Enterprise scoring situation.
Tertiary IndicatorsT Enterprise ScoreS Enterprise ScoreN Enterprise Score
k13 55
k2554
k3443
k4544
m1355
m2545
m3545
c1444
c2554
c3544
c4443
c5554
Table 20. Comprehensive score of enterprises.
EnterpriseWeighted Composite ScoreRanking
T4.501
S4.462
N4.063
Disclaimer/Publisher’s Note: The statements, opinions and data contained in all publications are solely those of the individual author(s) and contributor(s) and not of MDPI and/or the editor(s). MDPI and/or the editor(s) disclaim responsibility for any injury to people or property resulting from any ideas, methods, instructions or products referred to in the content.