1. Introduction
With the rapid advancement of modern electronic technologies, the product iteration cycle of electronic devices has been significantly shortened, particularly for flat-screen television (TV) products. Flat-screen TVs are widely used in household entertainment, commercial displays and other application scenarios, while their structural designs are continuously evolving toward larger and thinner configurations, which further increase the fragility of core components, especially TV screens. During the logistics of transportation and handling, TVs are highly vulnerable to accidental drop impacts, which may cause severe damage, such as screen fracture and failure of critical components [
1]. Appropriately designed cushioning packaging can effectively attenuate impact loads transmitted to the TV product, thereby reducing transportation-induced damage risks and associated economic losses [
2,
3].
Cushioning packaging design is an important engineering activity closely related to product safety and transportation reliability. It is necessary to consider not only the basic attributes of the product, such as mass, dimensions and structural characteristics, but also its damage-sensitive components and fragility level. Product fragility characterizes the ability of a product to resist external impact loads and reflects its tolerance to vibration and shock during transportation. Once the peak acceleration response induced by impact exceeds the fragility threshold, product damage may occur. Therefore, using product fragility as a constraint threshold and accurately evaluating the peak acceleration of TV packaging systems during drop impact is essential for improving the protective performance and design efficiency of TV cushioning packaging.
At present, conventional cushioning packaging design relies predominantly on empirical estimation and extensive trial-and-error physical testing, resulting in low design efficiency and high development costs [
4,
5]. Numerical simulation techniques have gradually become important tools for the design and analysis of cushioning packaging systems. In particular, finite element (FE) simulation can predict the mechanical response of products under transportation-related impact conditions, such as free-fall drops, while visualizing the deformation process of cushioning liners and obtaining key response indicators, including peak acceleration. However, FE-based cushioning packaging design still faces practical limitations. The modeling and simulation process is relatively time-consuming, and each new TV model or packaging configuration usually requires repeated parameter adjustment and additional simulation trials. When multiple product sizes, cushioning materials, liner densities, and liner thicknesses need to be evaluated, the overall design cycle may still be considerably extended. This limitation makes it difficult for conventional FE-driven design approaches to meet the requirements of rapid product iteration and efficient cushioning packaging optimization for TV products.
In recent years, machine learning (ML) has emerged as an efficient tool for modeling, prediction, and optimization-oriented design. By learning underlying patterns from existing datasets, ML models can rapidly predict the responses of unseen samples and support data-driven decision-making. ML techniques have been widely applied in material design [
6,
7], performance prediction [
8,
9,
10] and environmental impact assessment [
11]. Moreover, interpretable ML methods have therefore attracted increasing attention because they can reveal the relationships between input design variables and outputs while maintaining high prediction accuracy. When combined with FE simulation, interpretable ML has the potential to transform simulation-derived data into actionable design knowledge, thereby overcoming the efficiency and interpretability bottlenecks of product design. Previous studies have established a foundation in cushioning packaging design, FE-based simulation and ML-based modeling. However, most existing packaging-related ML studies only focus on packaging evaluation and material identification, while ML-assisted cushioning packaging design remains insufficiently explored. In particular, few studies have integrated FE simulation, interpretable ML into a unified framework for rapid performance prediction and evaluation of TV cushioning packaging.
To address this gap, this study proposes a data-driven framework that integrates FE simulation and interpretable ML for rapid peak acceleration prediction and design optimization of TV cushioning packaging. The specific objectives of this study are as follows: (1) to establish an FE-derived dataset for TV drop-impact packaging simulations; (2) to expand the original dataset using data augmentation; (3) to identify the optimal ML model for predicting the peak acceleration of TV cushioning packaging systems; (4) to reveal the key design factors governing cushioning packaging performance; (5) to develop a web-based platform to apply the proposed FE–ML framework and (6) to validate the framework through design exploration and independent FE simulations for new TV products. The main contributions of this study are threefold. First, an integrated FE-ML framework is established for rapid protective performance prediction of TV cushioning packaging under limited simulation samples. Second, the ML model is transformed into an optimization-support method for TV cushioning packaging design. Third, an application-oriented workflow integrating ML prediction and design exploration is demonstrated, providing a reference pathway for the rapid evaluation and optimization of cushioning packaging for other products.
2. Related Work
2.1. FE-Based Simulation for Cushioning Packaging
FE simulation has been widely adopted to improve the reliability of cushioning packaging. Existing studies have applied FE simulation to different packaging systems, including vibration response analysis, drop-impact simulation and stacking analysis. Chang et al. [
12] performed ANSYS-based drop simulations of glass packaging to obtain stress variations and peak acceleration, and further validated the design using fragility theory. Gui et al. [
13] conducted Abaqus simulations of TV packaging systems and verified the effectiveness of cushioning design based on stress distribution. Lu et al. [
14] applied Abaqus to stacking simulations of liquid crystal display packaging systems and analyzed the cushioning effectiveness of folded corrugated paperboard based on stress and displacement responses. By constructing three-dimensional models of products, cushioning liners, and outer packaging, FE methods can simulate drop, vibration and stacking conditions, visualize deformation and stress transfer, and obtain key performance indicators such as peak acceleration and stress distribution. FE simulation can effectively reveal the mechanical response and protective performance of product cushioning packaging systems, thereby reducing dependence on destructive experimental verification.
2.2. ML-Based Modeling in Simulation-Driven Design
FE-based packaging design still involves complex modeling procedures and repeated simulations for different product sizes and packaging schemes. To reduce the computational burden associated with repeated simulations, ML has increasingly been introduced as a surrogate modeling tool in engineering design optimization. Existing studies have shown that ML models can learn nonlinear relationships from experimental or simulation-derived datasets and have been widely applied in material design, structural performance prediction, and reliability evaluation. For example, FE-assisted ML workflows have been used to predict the performance of corroded anchor channels [
10], the compressive strength of eco-friendly concrete [
15] and rock masses [
16], projectile penetration resistance in reinforced concrete [
17], and vibration characteristics of functionally graded material structures [
18]. More importantly, in FE-assisted workflows, algorithms such as random forest (RF), support vector machine (SVM), extreme gradient boosting (XGBoost), k-nearest neighbors (KNN), and multivariate adaptive regression splines (MARS) have increasingly been used as surrogate models to replace repeated simulations once sufficient FE-derived data are available [
16,
19,
20]. ML-based modeling can substantially reduce the computational burden of traditional simulation-driven design while maintaining satisfactory prediction accuracy.
2.3. Robustness and Interpretability of ML Models
The application of ML models in engineering design may face two major challenges: limited-data robustness and model interpretability. On the one hand, ML models trained on small datasets are prone to overfitting and unstable generalization. Hyperparameter optimization methods, such as grid search, random search and Bayesian optimization, have therefore been widely adopted to improve model performance and robustness [
21]. For instance, Kim et al. [
22] evaluated the influence of random search, grid search, and Bayesian optimization on ML-based concrete compressive strength prediction models and found that hyperparameter optimization significantly improved prediction accuracy. Lai et al. [
23] demonstrated the advantages of Bayesian optimization over conventional hyperparameter tuning methods in terms of convergence speed and final model performance.
On the other hand, engineering-oriented ML models should not only produce accurate predictions but also explain how design variables influence model outputs. Interpretable ML methods, especially Shapley Additive Explanations (SHAP), have been used in engineering and material studies to quantify feature contributions and reveal the influence mechanisms of key variables [
24,
25]. For example, Wang et al. [
26] applied SHAP to bearing fault diagnosis and identified the key diagnostic features, which were consistent with the physical mechanism of bearing failure. He et al. [
27] introduced SHAP to reveal the causal contributions of synthesis parameters to zeolite particle size and proposed a SHAP-driven optimization strategy. Combining ML prediction with interpretability analysis can improve both model transparency and engineering applicability.
In addition, the quality and scale of the training dataset are also critical for reliable ML prediction. Generating large datasets through FE simulation is expensive and time-consuming. Data augmentation provides a practical solution by expanding limited datasets without proportionally increasing simulation costs [
28,
29,
30]. Zhou et al. [
16] integrated finite-discrete element simulation, Mixup data augmentation and interpretable ML to predict the uniaxial compressive strength of complex rock masses. Zhou et al. [
31] further demonstrated that generative adversarial network-based data augmentation can address data scarcity in material modeling and improve model performance. By employing models with different theoretical foundations and learning mechanisms, the relationships between discontinuous design parameters and output parameter responses could be explored from complementary perspectives. These findings suggest that, for small sample FE-derived datasets, the integration of data augmentation, interpretable ML, and appropriate hyperparameter optimization is necessary to enhance model robustness, prediction accuracy, and engineering applicability.
2.4. Research Gap in ML-Assisted Cushioning Packaging Design
Previous studies have demonstrated the usefulness of FE simulation in cushioning packaging analysis and the potential of ML surrogate models in engineering prediction. However, existing FE-based cushioning packaging studies have mainly focused on evaluating individual packaging configurations or specific loading responses, and repeated simulations are still required when product dimensions, cushioning materials, densities, or liner thicknesses change. Most FE–ML modeling studies have been developed for general structural or material performance prediction. Packaging-related ML studies have mainly focused on corrugated board strength prediction, packaging material identification, or quality monitoring, with insufficient attention paid to cushioning packaging design coupled with FE simulations. Moreover, few studies have combined model interpretability and design optimization into a workflow that can provide both accurate prediction and practical design guidance for TV product cushioning packaging.
3. Materials and Methods
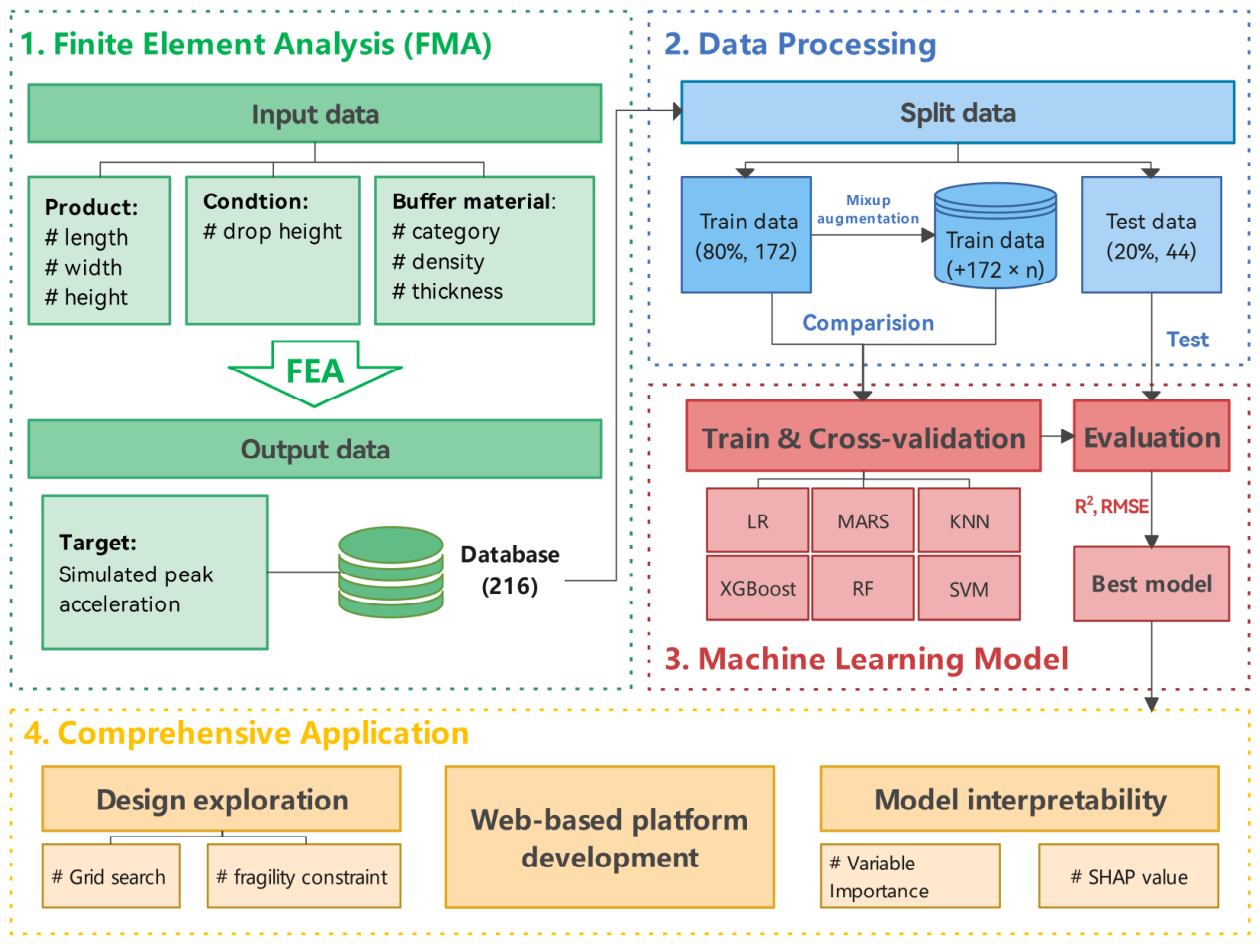
This study proposes an FE-ML workflow for the protective performance prediction of TV cushioning packaging integrating FE simulations and an explainable ML method. To enrich the limited datasets, we applied a Mixup-based synthetic data generation strategy to augment the training dataset. Ultimately, we comprehensively apply the proposed FE-ML framework around model interpretation, platform development, and design exploration. The general structure of the proposed workflow is illustrated in
Figure 1.
3.1. Parameter of TV Cushioning Packaging System
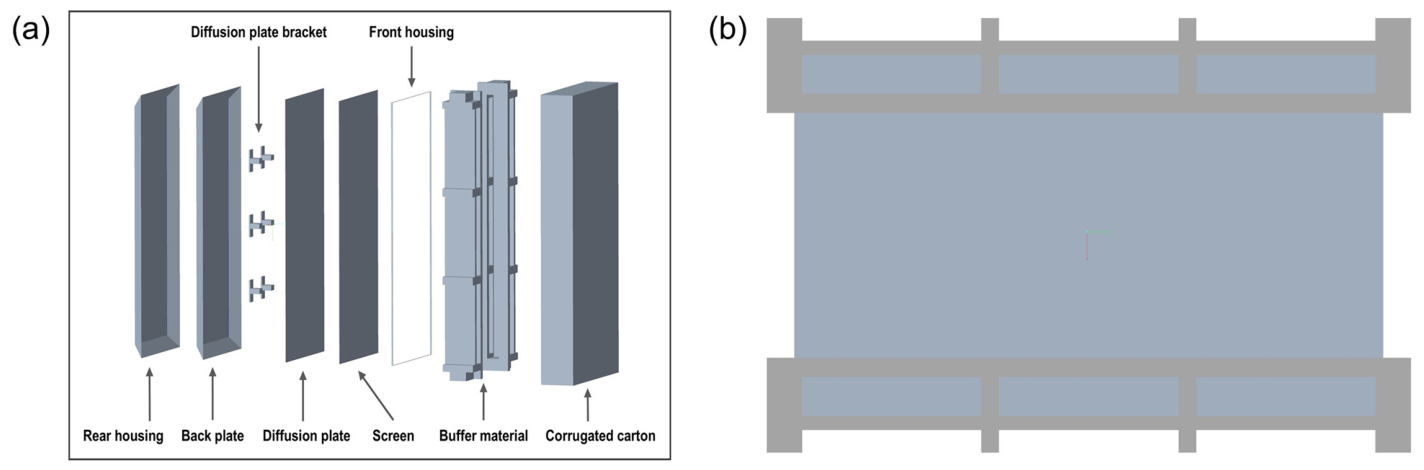
In this study, multiple structural models of TV cushioning packaging were constructed. The modeling features were classified into two categories: TV product attributes and cushioning packaging characteristics. TV product attributes included material properties and geometric parameters, namely length, width, and height. As shown in
Figure 2, three-dimensional structural models of the TV were developed using Creo 11.0 software. During the modeling process, the overall structural configuration of the TV was assumed to remain unchanged, while only the key functional components, including the rear housing, back plate, screen, front housing, diffusion plate, and diffusion plate bracket, were retained. These components were considered to play a dominant role in impact energy transmission during drop-impact events. The representative material properties assigned to each component were obtained from the open literature and are summarized in
Table 1. These material parameters served as the fundamental inputs for subsequent FE numerical simulations [
3].
With respect to the cushioning packaging structure, a typical TV packaging system was considered in this study, consisting of the cushioning liner and outer corrugated carton. Among these components, the stress–strain behavior and thickness of liner material directly determine the impact energy absorption capacity and the transmission level of peak acceleration [
13]. Accordingly, this study focused on the material properties and geometric parameters of cushioning liners as the primary analysis variables. To minimize the influence of structural variations on the simulation results, the outer packaging was uniformly defined as a BC-flute corrugated carton with a 6 mm wall thickness. The structural configuration of cushioning liners is illustrated in
Figure 2, adopting a protective design commonly applied in engineering practice. The geometric dimensions of cushioning liners and outer carton were determined based on the overall dimensions of the TV product, following conventional empirical design formulations.
As summarized in
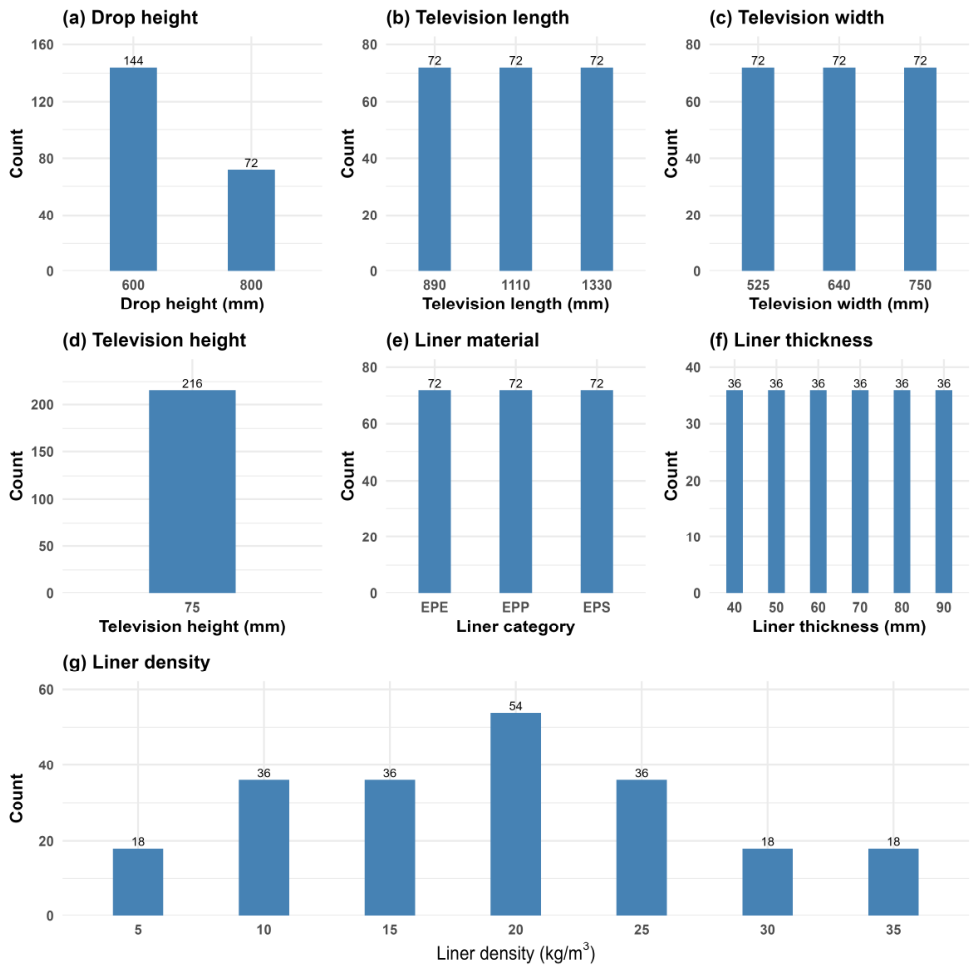
Table 2, the geometric dimensions of TV product (length, width, and height), together with the liner material type, liner density and liner thickness, as well as drop height, were selected as the primary input variables for the FE drop-impact models of the TV packaging system. In this study, three common TV sizes were initially investigated, with the TV height uniformly fixed at 75 mm. In accordance with GB/T 4857.5-1992, equivalent drop heights were assigned based on the mass of each TV product [
32]. Commonly used foam cushioning materials were selected, including expanded polyethylene (EPE), expanded polypropylene (EPP), and expanded polystyrene (EPS). Typical ranges of material density and liner thickness employed in practical engineering applications were adopted, and all parameter ranges were constrained within commonly accepted limits. The distributions of the selected input parameters are presented in
Figure 3.
3.2. Finite Element Simulation of Drop-Impact
In this study, drop-impact simulations were performed for the proposed TV cushioning packaging systems using ANSYS Workbench 2025 coupled with the LS-DYNA explicit dynamics solver. ANSYS Workbench was used as the integrated simulation platform for model import, material assignment, contact definition, meshing, boundary-condition setting, and post-processing, while LS-DYNA was employed to solve the impact response of the TV packaging system [
12]. In this study, the overall FE simulation workflow included model geometry import, material assignment, contact setup, meshing, boundary-condition definition, explicit dynamic solution, and post-processing of peak acceleration.
The TV model was simplified by retaining the main structural and functional components. The outer carton and cushioning liners were then assembled with the simplified TV model in Creo to construct the complete cushioning packaging system. The assembled model was subsequently imported into ANSYS Workbench for finite element analysis. For each simulation case, the geometry of the cushioning liners and outer carton was updated according to the input variables listed in
Table 2, while the simplified TV structure and component material definitions were kept consistent. For the cushioning liners, the stress–strain data of different cushioning materials under representative loading states were adopted and implemented into the numerical material models, as shown in
Supplementary Material Tables S1 and S2 [
33]. Each simulation sample was reconstructed by combining the parameter levels in
Table 2 with the material data in
Table 1,
Tables S1 and S2.
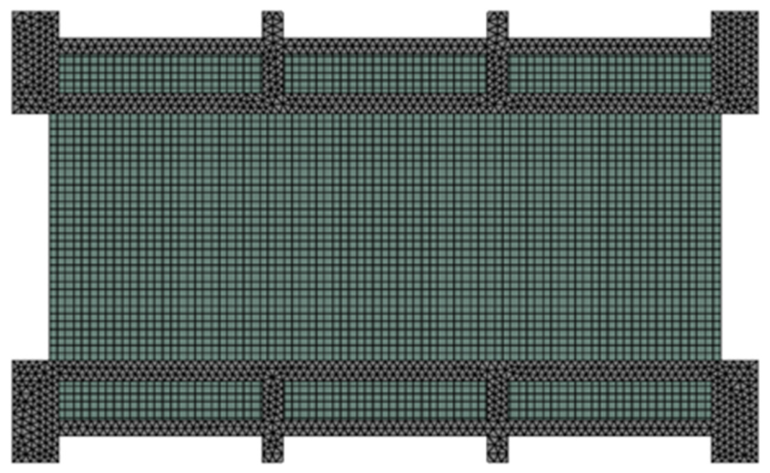
The contact relationships among different components were then defined. Bonded contact was assigned to the internal connections among the individual TV components to maintain structural integrity during impact. Frictional contact was defined between the corrugated carton and the ground, as well as between the corrugated carton and the cushioning liners. The dynamic and static friction coefficients were specified as 0.1 and 0.2, respectively, and symmetric contact behavior was applied to all frictional interfaces. The meshing configuration of the cushioning packaging model is illustrated in
Figure 4. To balance computational efficiency and numerical stability, the element size of the TV components and cushioning materials was uniformly set to 0.025 m while maintaining acceptable mesh quality. The same global mesh setting and contact definitions were applied to all simulation cases, and no case-specific adjustment of mesh size or contact parameters was introduced during dataset generation.
For the boundary conditions, gravitational acceleration perpendicular to the ground surface was applied to the entire packaging system to simulate free-fall motion, and the ground was assigned a fixed constraint. To reduce unnecessary computational time while preserving the impact state corresponding to the target drop height, the simulation was initiated when the packaging system was positioned 100 mm above the ground surface. The initial velocities at the onset of impact were calculated according to the equivalent drop heights. Specifically, initial velocities of 3704 mm/s and 3130 mm/s were applied for drop heights of 800 mm and 600 mm, respectively. These velocities were imposed as initial conditions to reproduce the corresponding impact processes. The drop-impact response was then solved using the LS-DYNA explicit dynamics solver.
After the explicit dynamic solution, the acceleration response at the display screen was extracted through post-processing. The simulation outputs, including acceleration time histories, peak acceleration, and system energy evolution, were obtained for subsequent cushioning performance evaluation and machine learning dataset construction. In particular, the peak acceleration at the display screen was used as the target response for the development of the machine-learning-based prediction model. All FE-derived samples were generated using the same modeling assumptions, material assignment strategy, contact definitions, meshing strategy, and boundary conditions, thereby improving the repeatability and consistency of the simulation dataset.
3.3. Machine Learning Model
3.3.1. Data Processing and Augmentation
Based on the procedure described in
Section 3.2, a total of 216 cushioning packaging data points were obtained from the FE drop-impact simulations. The complete dataset was randomly divided into a training set and a testing set, accounting for 80% (172 data points) and 20% (44 data points) of the samples, respectively. The training dataset was used exclusively for model training, whereas the testing dataset was reserved for independent performance evaluation to assess the generalization capability of the trained models. For data preprocessing, categorical variables, such as liner material type, were transformed into numerical binary vectors using one-hot encoding.
In general, when the available dataset for ML models is limited, model training is more susceptible to overfitting [
28]. To improve model robustness under limited data conditions, the Mixup-based data augmentation strategy was applied to the training dataset prior to model training. Mixup is a widely adopted data augmentation technique that generates new virtual samples by linearly interpolating between two randomly selected samples from the original training dataset [
28,
34]. To avoid physically meaningless interpolation between different cushioning materials, the training samples were first grouped by material type (EPE, EPS, and EPP), and Mixup was then performed separately within each material group. As described in Equations (1) and (2), the mixing coefficient λ was randomly sampled from a symmetric Beta distribution, which determines the relative contribution of each original sample to the generated virtual sample. The shape of the Beta distribution is governed by the parameter γ, which typically ranges from 0.2 to 0.4. In this study, the value of γ was set to 0.2 to balance dataset diversity and preserve the intrinsic characteristics of the original samples [
34].
where
and
denote the input feature vectors of the
i-th and
j-th original training samples, respectively;
and
represent the corresponding ground-truth output values associated with
and
; the symbol
denotes the new input feature vector generated by linearly interpolating the two original samples using the Mixup strategy, and
represents the corresponding output value produced by Mixup method; the parameter
denotes the mixing coefficient that controls the contribution of each original sample in the interpolation process.
3.3.2. Model Building and Hyperparameter Optimization
In this study, multiple ML algorithms were selected and implemented to construct regression models for peak acceleration prediction. These algorithms covered a wide range of modeling paradigms, including linear models, ensemble learning models, kernel-based models, instance-based learning models, and spline-based models. Specifically, the ensemble learning models included RF and XGBoost model. The linear model, kernel-based model, instance-based learning model, and spline-based model were LR, SVM, KNN and MARS model, respectively. Brief descriptions of these ML algorithms were provided in the
Supplementary Material Figure S1. By systematically comparing their predictive performance, the most suitable model for peak acceleration prediction could be identified. All model development, training, and evaluation procedures were implemented using the tidymodels ecosystem within the R programming environment.
To obtain optimal model performance, Bayesian optimization combined with parallel computing was employed to tune the hyperparameters of the ML models [
11]. Parallel evaluation of candidate hyperparameter configurations was enabled to reduce overall computational time. The search ranges of the hyperparameters for all models are summarized in the
Supplementary Material Table S3. Initially, Bayesian optimization randomly sampled 20 sets of hyperparameter configurations to explore the global characteristics of parameter space. Based on these initial samples, 15 subsequent optimization iterations were performed. During this process, a surrogate model was continuously updated to adaptively select hyperparameter configurations with potential performance improvements. Prior to hyperparameter tuning, the training dataset was partitioned into 10 approximately equal-sized subsets using 10-fold cross-validation. In each fold, one subset was used as the validation set, while the remaining subsets were used for model training. Each candidate hyperparameter configuration was evaluated using 10-fold cross-validation, and the mean predictive performance across the validation folds was adopted as the evaluation criterion [
35]. An early stopping strategy was applied, and the Bayesian optimization process was terminated when no further performance improvement was observed over 5 consecutive iterations. Finally, the optimal hyperparameter combination for each ML model was determined based on its cross-validated performance and was subsequently used for model training and prediction.
3.4. Model Selection and Evaluation
The performance of the model was evaluated using two metrics: the coefficient of determination (R
2) and the root mean square error (RMSE). The corresponding calculation formulas are given as follows:
where
n denotes the number of samples,
represents the peak acceleration value obtained from FE simulations,
denotes the corresponding peak acceleration predicted by the ML model, and
is the mean value of the simulated peak acceleration.
The R2 value quantified the degree of agreement between the predicted values and the FE simulation results, where values closer to 1 indicated better model fitting performance. In addition, the root-mean-square-error (RMSE) measured the standard deviation of the differences between the predicted and simulated values, reflecting the dispersion of prediction errors. A smaller RMSE value indicated higher prediction accuracy of the model.
3.5. Shapley Additive ExPlanations (SHAP)
The Shapley Additive exPlanations (SHAP) were exploited to explain the predictions of the model and to avoid the problem of “black-box”. SHAP allows for a robust interpretation of the model’s decisions according to the interactions and effects of multiple inputs [
36]. The global explanation is enhanced by quantifying the contribution of individual variables to the prediction results. In addition, feature importance analysis provides a global interpretation of model predictions across all samples, while partial dependence plot (PDP) analysis in this study further elucidates how individual features influence the model predictions by marginalizing the effects of other variables. The calculation of SHAP values is given as follows:
where
denotes the baseline value of the model, and
represents the SHAP value associated with the
i-th feature.
N indicates the total number of input features, and
S denotes any subset of features that does not include feature
i.
represents the number of features contained in subset
S, and
denotes a feature subset excluding feature
i. The term
represents the model prediction obtained using only the features in subset
S.
3.6. Design Exploration for TV Cushioning Packaging
The trained optimal model was used as a surrogate model to predict the peak acceleration of candidate TV cushioning packaging schemes. The main purpose of this step was to replace repeated FE simulations during the early-stage screening of packaging schemes, support the rapid exploration of feasible cushioning packaging designs, and accelerate the subsequent design refinement process.
For a given new TV product, the design space was defined based on the key variables identified through the interpretability analysis, including cushioning material type, liner density, and liner thickness. A grid search strategy was then applied to generate candidate design combinations within the predefined parameter ranges. For each candidate scheme, the surrogate model predicted the corresponding peak acceleration, and feasible schemes were identified according to the product fragility threshold. Representative schemes were further evaluated through FE simulations to evaluate the rationality of the screening results.
4. Results and Discussion
4.1. Drop-Impact Simulation of TV Cushioning Packaging
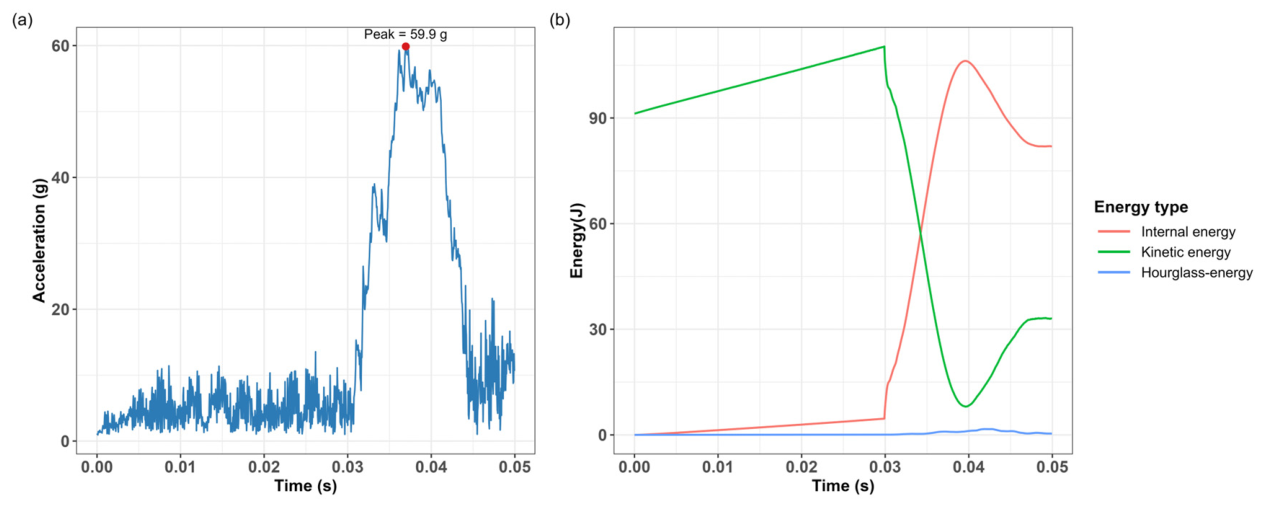
Drop-impact simulations were performed to obtain the acceleration responses of the TV screen in different cushioning packaging systems. A representative case using EPS cushioning material with a 70 mm thickness and a 10 kg/m
3 density was selected for detailed analysis. As shown in
Figure 5a, the screen acceleration remained low during the free-fall stage (t < 0.03 s) before ground contact. When impact occurred at approximately 0.03–0.04 s, the acceleration increased sharply and reached a peak value of about 59.9 g, followed by a rapid decrease and gradual stabilization during the rebound stage (t > 0.04 s). This response reflects the compression, energy absorption, and elastic recovery of the cushioning liner, indicating that the selected packaging configuration effectively dissipated impact energy and reduced the risk of screen damage [
37,
38].
Figure 5b illustrates the corresponding energy evolution during the drop-impact process. During the free-fall stage, the kinetic energy increased with time, while internal energy and hourglass energy remained low. After ground contact, kinetic energy was rapidly converted into internal energy due to liner deformation and impact energy absorption. During the rebound process, part of the internal energy was transformed back into kinetic energy. The hourglass energy remained consistently low throughout the simulation, indicating good numerical stability of the FE model [
37,
38,
39]. These energy evolution characteristics are consistent with the acceleration response shown in
Figure 5a, confirming the rationality and reliability of the drop-impact simulation results.
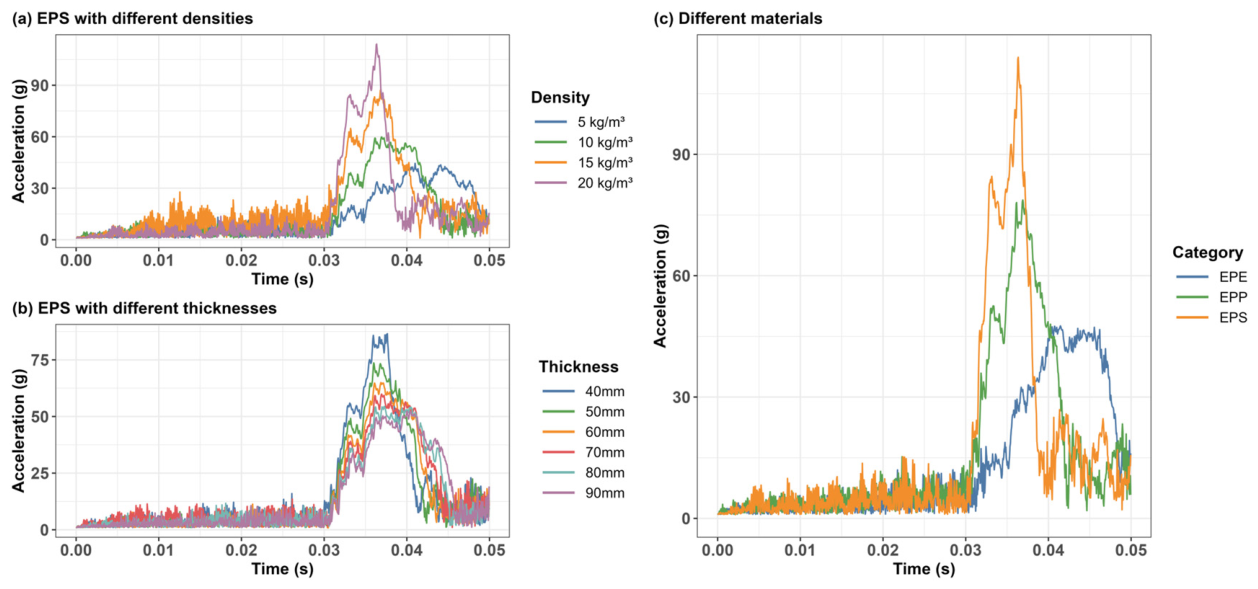
In addition,
Figure 6 presents the effects of cushioning liner density, thickness, and material type on the TV screen acceleration response. In all simulated cases, the acceleration–time curves showed three typical stages—free fall, impact, and rebound stabilization—consistent with the response characteristics observed in
Figure 5. Taking the EPS liner with a thickness of 70 mm as an example,
Figure 6a shows that the peak acceleration increased markedly with increasing liner density, from approximately 40 g at 5 kg/m
3 to more than 110 g at 20 kg/m
3. This increase can be attributed to the higher stiffness and elastic modulus of higher-density liners, which shortened the buffering duration from about 0.015 s to 0.010 s and reduced the energy dissipation capacity of the cushioning system [
33,
40]. Consequently, denser liners produced more severe impact responses and higher peak acceleration levels.
Figure 6b shows the effect of EPS liner thickness on the peak acceleration of the TV screen at a density of 10 kg/m
3. The peak acceleration decreased monotonically as liner thickness increased, indicating that thicker liners can improve cushioning protection. However, once the thickness exceeded a certain level, the energy absorption capacity tended to approach saturation, and further increases in thickness produced only limited reductions in peak acceleration. The cushioning performance of different liner materials was further compared at a thickness of 70 mm and a density of 20 kg/m
3. As shown in
Figure 6c, EPE exhibited the lowest peak acceleration, followed by EPP, whereas EPS showed the highest value, reaching approximately 114 g.
This difference is mainly related to the distinct stress–strain responses and energy absorption mechanisms of the three foam materials. EPS tends to enter the densification stage more rapidly during impact due to its relatively high brittleness and density sensitivity, resulting in higher acceleration transmission. In contrast, EPE shows better ductility and a wider energy absorption plateau, leading to more stable cushioning performance. These observations are consistent with the dynamic cushioning behavior of foamed materials reported by Sun et al. [
41]. Compared with previous FE-based cushioning packaging studies, which mainly focused on verifying the feasibility of individual packaging configurations or explaining a specific drop and vibration response [
12,
13,
14], the present simulation results systematically revealed the inherent mechanism of the influence of parameters such as the type, density, and thickness of TV cushioning packaging liner materials on peak acceleration response.
4.2. Effect of Data Augmentation
The predictive accuracy and generalization capability of ML models strongly depend on the quality, representativeness, and diversity of the training dataset [
28]. In this study, the original 216 FE simulation samples were divided into 172 training samples and 44 testing samples, and Mixup was applied only to the training set. To assess the effect of augmentation intensity, all ML models were optimized by Bayesian optimization with the objective of maximizing R
2, and the optimized hyperparameters are summarized in
Table S4. Based on these optimized models, the performance of six ML algorithms trained with different augmentation factors (AFs) was evaluated using R
2 and RMSE.
The corresponding results are listed in
Table 3 and visualized in
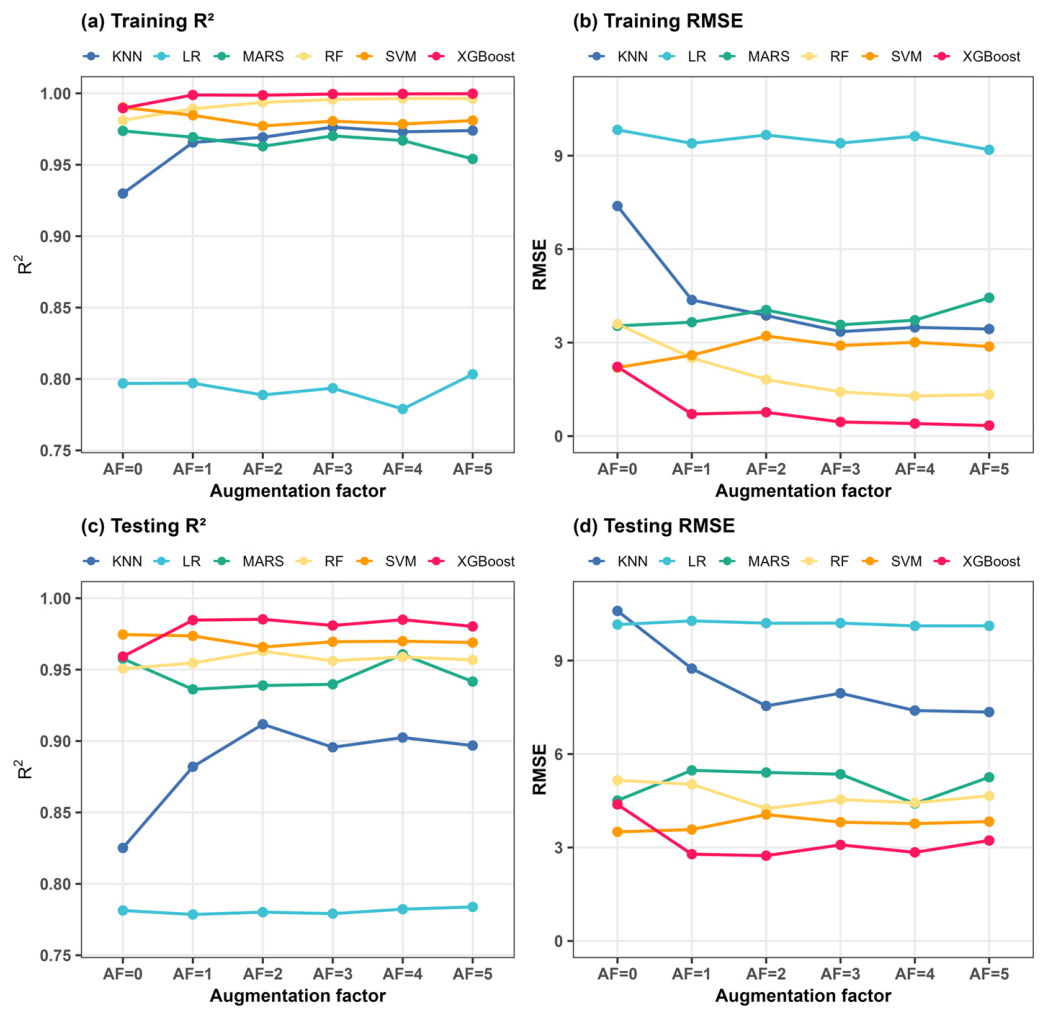
Figure 7. Most ML models achieved R
2 values above 0.95 for both the training and testing datasets, indicating satisfactory predictive performance. Data augmentation further improved the prediction accuracy of several models, although its effect varied among algorithms. For LR, SVM, and MARS, the improvement was limited or unstable, suggesting that interpolated samples could not fully compensate for the limited ability of linear or weakly nonlinear models to capture the nonlinear peak acceleration. In contrast, XGBoost, RF, and KNN benefited from moderate augmentation, particularly at AF = 2, where higher R
2 values and lower RMSE values were obtained on both the training and testing datasets. This might indicate that moderate augmentation can enhance the learning of nonlinear relationships and improved model generalization [
28,
34]. However, when AF was further increased, the improvement became limited or unstable, possibly suggesting that excessive augmentation may introduce redundant local information rather than additional useful physical information.
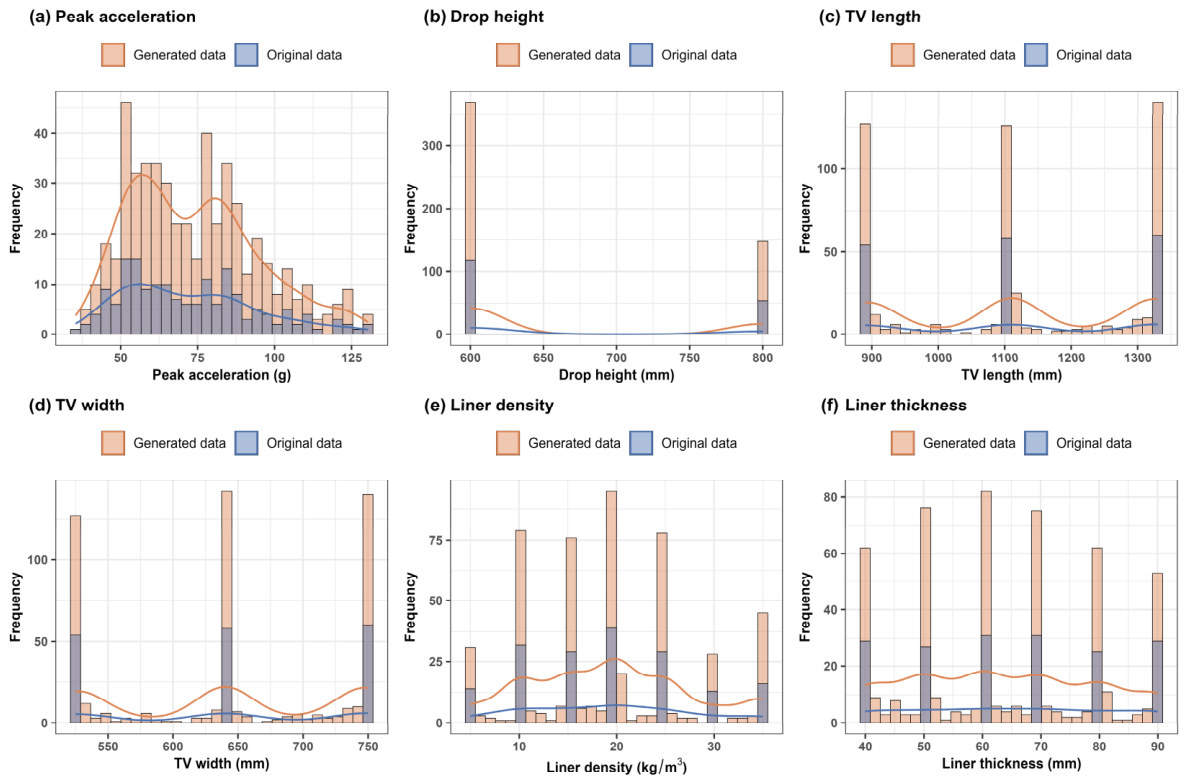
In addition to predictive performance, the statistical characteristics of the augmented dataset were further examined. In this study, the original training data were compared with the augmented training data at AF = 2. The distributions of the input features and peak acceleration are shown in
Figure 8, while the peak-acceleration distributions under different AF values are provided in
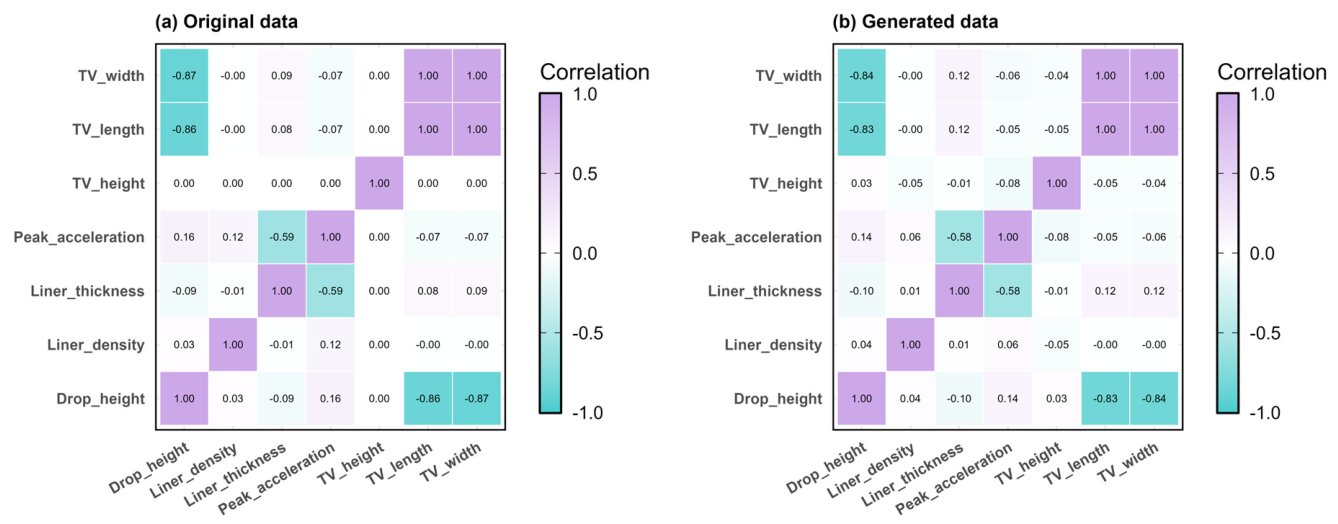
Figure S2 in the Supplementary Material. A strong overlap was observed between the original and augmented data distributions, indicating that the augmented dataset largely preserved the statistical characteristics of the original training set while increasing data diversity. Furthermore, Pearson correlation analysis was performed to quantitatively evaluate the linear relationships between input variables and peak acceleration. As shown in
Figure 9 and
Figure S3 in the Supplementary Material, the main relationships among key variables were well preserved after data augmentation. In particular, the negative correlation between cushioning liner thickness and peak acceleration remained clearly identifiable. Although slight variations in correlation strength were observed for other input features, these changes did not alter the underlying physical trends or statistical relationships among the key variables.
Compared with previous limited-data ML studies in which data augmentation was mainly used to improve model performance, the present results reveal both the benefits and limitations of Mixup for FE-derived cushioning packaging data. Based on the above analysis, AF = 2 was selected for training the six ML models in the subsequent analyses. It should be noted that this selection was based on the present 80/20 training/testing split and evaluation protocol, and would be regarded as only suitable for the current dataset.
4.3. Model Performances and Comparison
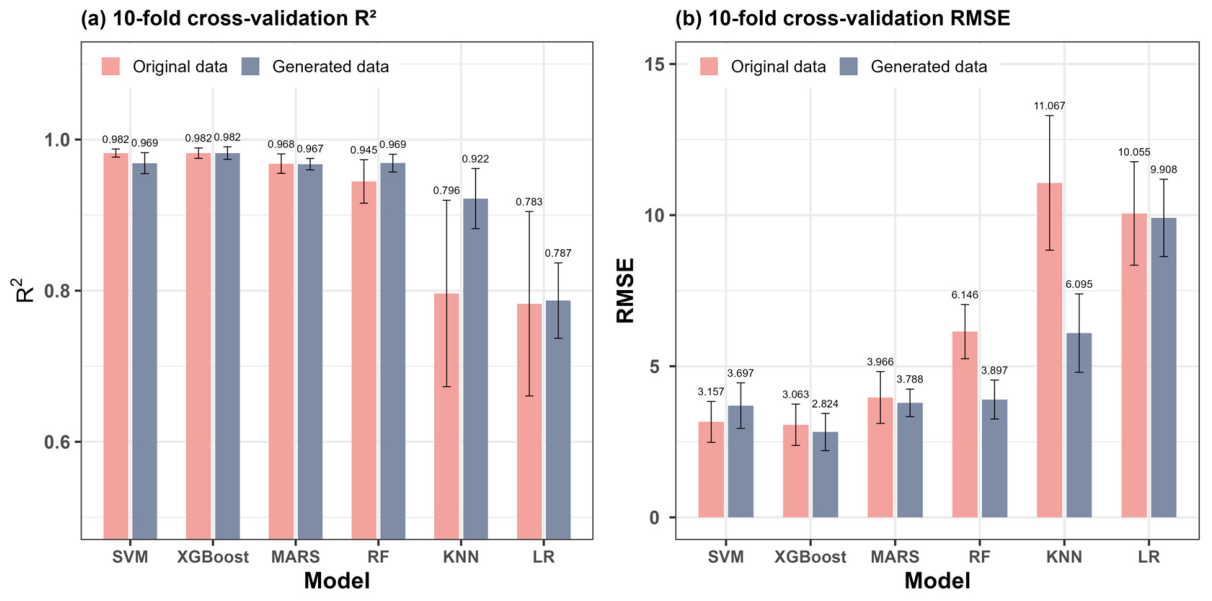
Using 10-fold cross-validation combined with Bayesian optimization, the predictive performance of different ML models was systematically evaluated and compared. The R
2 and RMSE values obtained under the optimal hyperparameter configurations are presented in
Figure 10. When trained on the original dataset, SVM and XGBoost achieved the best prediction accuracy, with R
2 values of approximately 0.982 and low RMSE values of 3.157 and 3.063, respectively. These results indicate their strong fitting capability and high numerical precision in predicting peak acceleration. MARS and RF showed slightly lower but still satisfactory performance, with R
2 values of 0.968 and 0.945, respectively. In contrast, KNN and LR exhibited larger performance fluctuations, as shown in
Figure 10b, with higher RMSE values of 11.067 and 10.055 and R
2 values below 0.80. This indicates their limited capability to capture the nonlinear peak-acceleration responses of TV cushioning packaging systems.
Furthermore, data augmentation with AF = 2 affected the average prediction accuracy and stability of several models across different cross-validation folds, but its effect varied among algorithms. The improvement was most evident for XGBoost, RF, and KNN, whereas SVM showed a slight decrease in predictive performance after augmentation. This may be because SVM had already established a relatively stable support-vector structure under the original small-sample condition, while the interpolated samples generated by Mixup partially disturbed its optimal margin [
34]. These algorithm-specific responses indicate that data augmentation is not universally beneficial; instead, its effectiveness depends on whether the model can exploit the expanded local data distribution without being adversely affected by interpolation-induced perturbations.
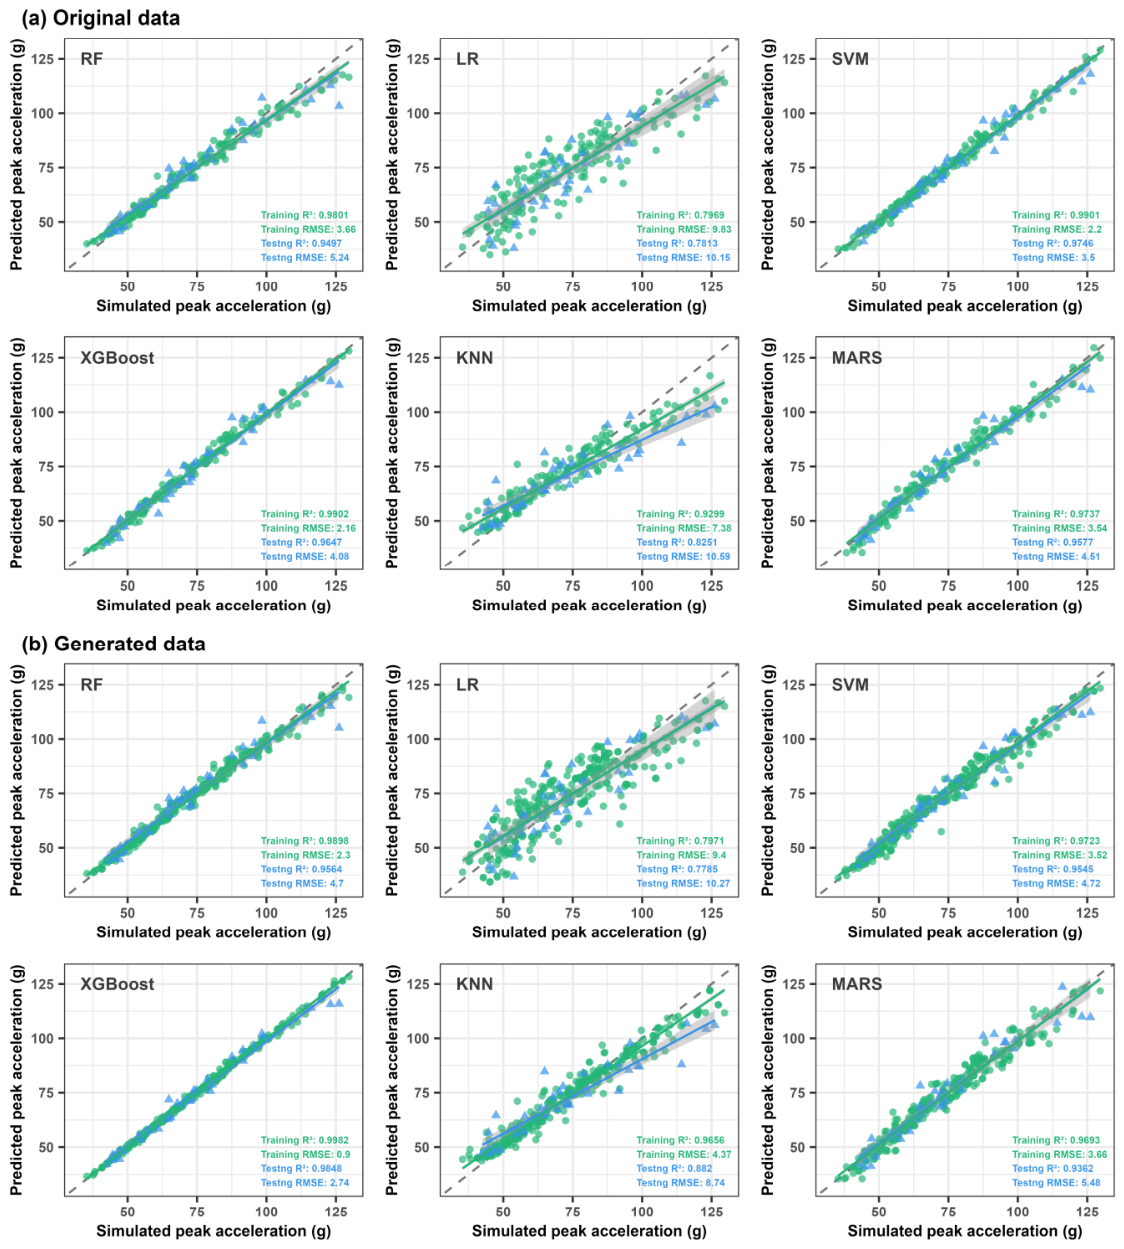
Figure 11 compares the predicted peak acceleration values with the FE simulation results for the six ML models. The gray dashed line represents the ideal prediction line, where the predicted and simulated values are identical. Without data augmentation, RF, SVM, XGBoost, and MARS already showed good agreement with the FE results, with data points close to the ideal line and R
2 values exceeding 0.95. After data augmentation, XGBoost, RF, and KNN showed improved prediction accuracy, among which the augmented XGBoost model achieved the best overall performance and was therefore selected as the optimal surrogate model for peak-acceleration prediction. Specifically, when the number of training samples increased from 172 (AF = 0) to 516 (AF = 2), the training-set R
2 values of XGBoost, RF, and KNN increased from 0.990, 0.981, and 0.930 to 0.998, 0.990, and 0.966, respectively. The corresponding test-set R
2 values increased from 0.961, 0.951, and 0.825 to 0.983, 0.953, and 0.882, respectively. In addition, prediction errors on both the training and testing datasets decreased after augmentation. These results indicate that Mixup-based data augmentation effectively improved the fitting capability and generalization performance of several nonlinear models. Compared with existing packaging-related ML studies, the present model focuses on predicting the drop-impact response of TV cushioning packaging systems. The XGBoost model trained on the augmented dataset demonstrated the highest predictive accuracy and robustness, making it the most suitable model for peak-acceleration prediction in this study.
4.4. Model Interpretability Based on SHAP
To analyze the global interpretability of the optimized XGBoost model, the SHAP framework was employed to quantify the contribution of each input feature to model predictions.
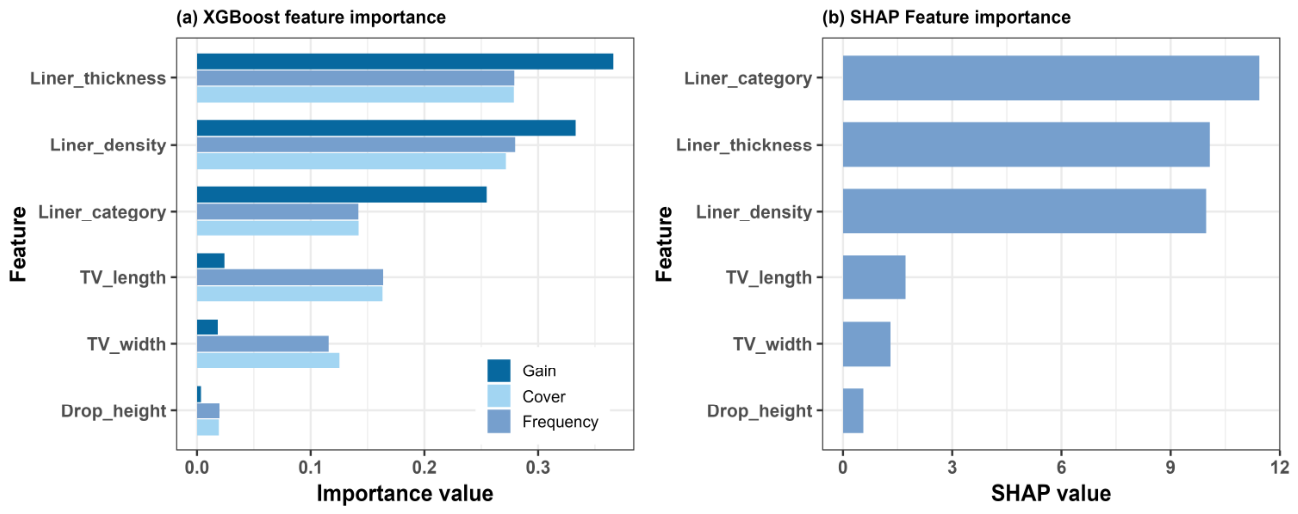
Figure 12 presents the feature-importance results derived from the optimized XGBoost model and the corresponding SHAP-based global importance analysis. In XGBoost, Gain represents the average contribution of a feature to reducing the model loss at tree split nodes, Cover reflects the weighted number of samples affected by splits involving that feature, and Frequency indicates how often the feature is selected for splitting across the ensemble trees.
As shown in
Figure 12, the built-in XGBoost importance metrics were generally consistent with the SHAP-based global importance results. Both analyses indicated that liner thickness, liner material type, and liner density were the dominant factors affecting peak-acceleration prediction. Among them, liner thickness and liner density showed relatively high
Gain,
Cover, and
Frequency values, suggesting that these two parameters contributed substantially to both prediction accuracy and the internal decision-making process of the model. In contrast, liner material type showed lower Cover and Frequency values, which may be related to the limited number of material categories in the dataset. Although this categorical feature was selected less frequently during tree splitting, its high SHAP importance confirms its physical relevance to cushioning performance and peak-acceleration response.
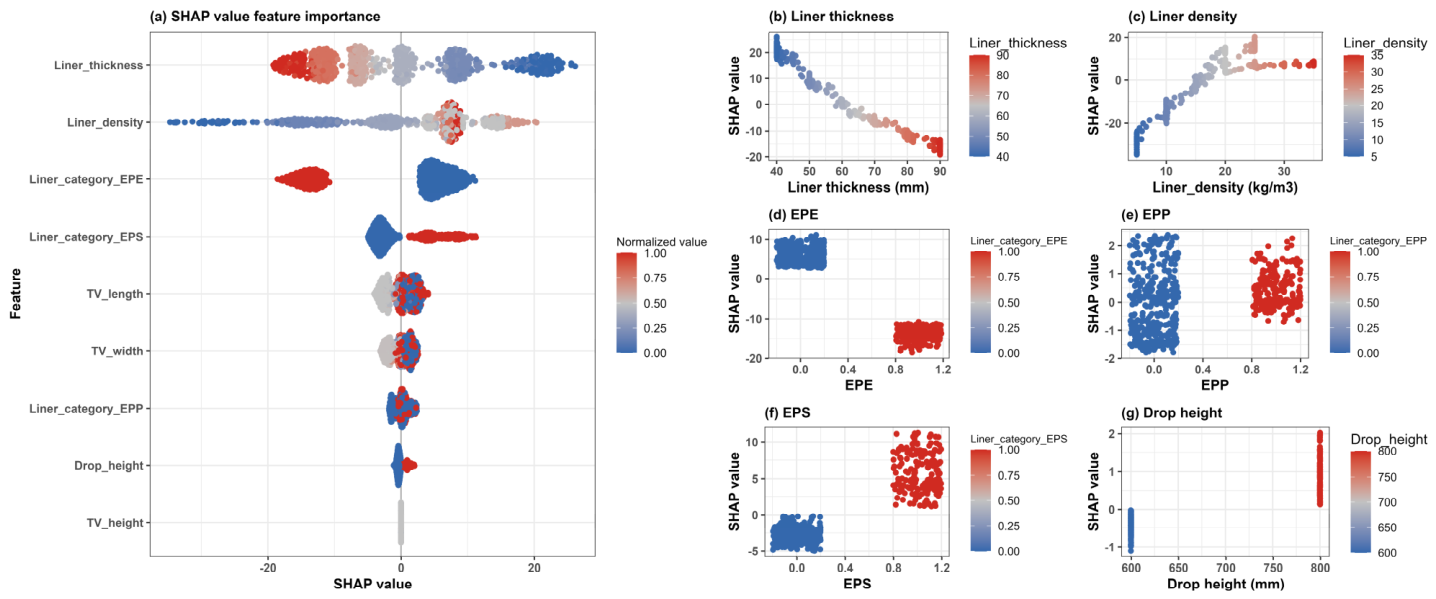
Figure 13a presents the SHAP beeswarm plot, which summarizes the contribution of each input feature to the XGBoost predictions. The corresponding SHAP partial dependence plots in
Figure 13b–g further illustrate how individual variables affect the predicted peak acceleration. In the SHAP framework, positive SHAP values indicate an increase in the predicted peak acceleration, whereas negative values indicate a reduction. In the beeswarm plot, red and blue points represent higher and lower feature values, respectively.
As shown in
Figure 13a,b, the SHAP values of liner thickness decreased approximately linearly with increasing thickness, indicating that thicker liners consistently reduced the predicted peak acceleration. This result agrees with the simulation results in
Figure 6b, where increasing liner thickness provided a longer effective deformation stroke, prolonged the impact duration, and enhanced energy absorption before the impact load was transmitted to the TV screen.
In contrast,
Figure 13a,c show that increasing liner density generally increased the predicted peak acceleration, although its SHAP distribution was nonlinear. This suggests that liner density affects cushioning performance by changing the effective stiffness and plateau stress of the foam material. Higher-density liners provide stronger support but may also increase the initial contact stiffness and shorten the buffering time, thereby amplifying acceleration transmission under the investigated conditions.
The distinct cushioning behaviors associated with different liner materials are highlighted. As shown in
Figure 13f, packaging systems employing EPS liners, represented by red points, were generally associated with higher peak acceleration responses, whereas lower peak acceleration values were observed when EPE was used as illustrated in
Figure 13d. These differences reflect the inherent variations in the stress–strain characteristics, ductility and densification behavior of different foam materials. Furthermore, higher drop heights tended to result in larger peak acceleration values. However, their overall contribution to the model predictions remained relatively limited compared with the dominant liner-related parameters. The remaining product-related input variables, including TV length, width, and height, contributed only marginally to the predicted results, as shown in
Figure S4 in the Supplementary Material. These findings demonstrate that liner thickness, liner density and liner material type dominate the protective performance of TV cushioning packaging, providing a basis for identifying key parameters and prioritizing cushioning packaging optimization strategies.
4.5. Platform Development for Design Support for Cushioning Packaging
A web-based platform was developed to support the practical deployment of the trained ML models for cushioning packaging design. The platform integrates model management, performance prediction, interpretability analysis, and design exploration. The program consists of frontend interaction, backend and core computing layers, and further development details are provided in
Supplementary Materials Figures S5–S7. The platform serves as a deployment tool for rapid prediction and preliminary scheme screening via multiple functional modules. By inputting key cushioning packaging parameters, including dimensions, cushioning material type, liner density, liner thickness, and drop height, users can obtain the predicted peak acceleration, damage judgment based on the product fragility threshold, and local SHAP-based explanations. Furthermore, the design exploration of cushioning packaging was realized by grid search and trained models, through which feasible cushioning packaging schemes can be rapidly identified and the distributions of feasible and infeasible regions can be visualized.
4.6. Design Exploration and Guidance of TV Cushioning Packaging
In this study, grid search-based design exploration was then conducted using the developed platform for two TV products that were not included in either the training or testing datasets. During the grid-search process, the design-variable ranges were defined separately for different cushioning materials, as listed in
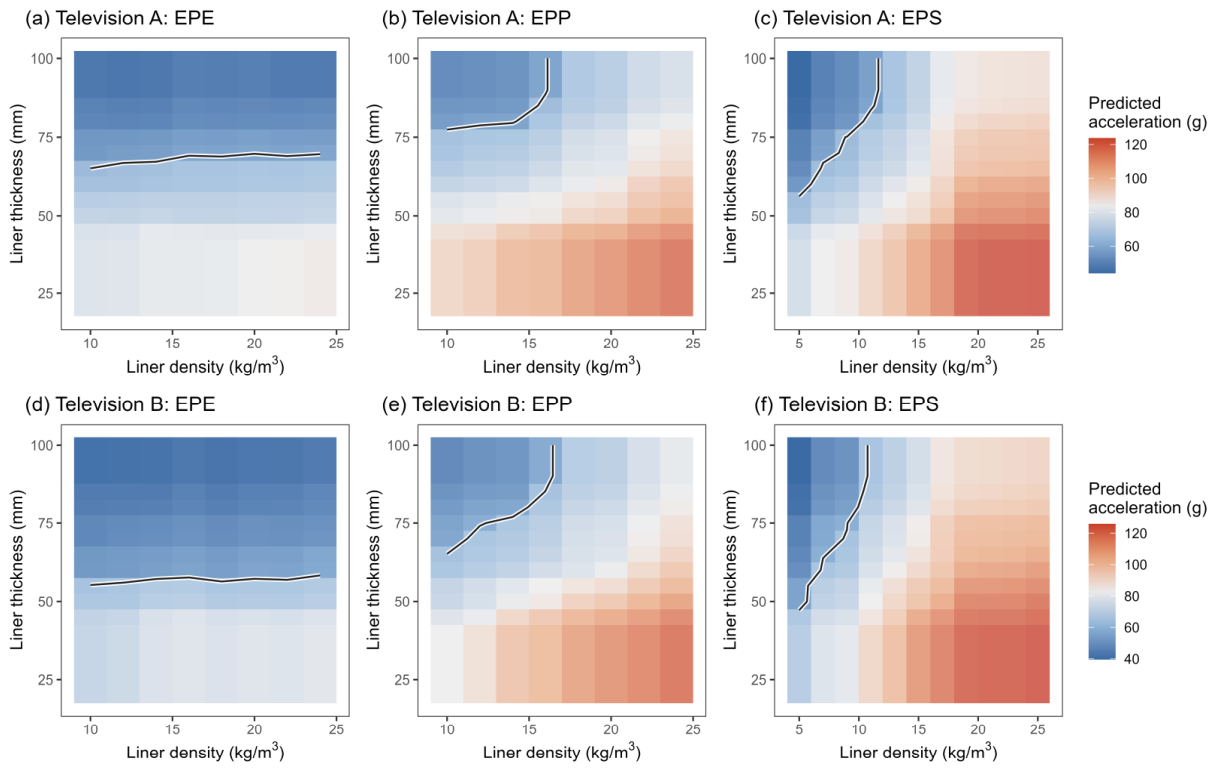
Table S5 in the Supplementary Material. Owing to the high computational efficiency of the ML model, all candidate schemes were predicted and analyzed within 10 s. The prediction results for all combinations of key design parameters are shown in
Figure 14. For the two TV products, 460 design combinations were generated, showing similar prediction distributions. Under the constraint that the predicted peak acceleration should remain below the fragility threshold of 60 g, 99 and 118 feasible design combinations were identified for television A and television B, respectively.
Eleven representative design schemes from each TV product were further selected for FE simulations to evaluate the reliability of the ML-assisted screening results. The comparative results are summarized in the
Supplementary Material Table S6. As shown in
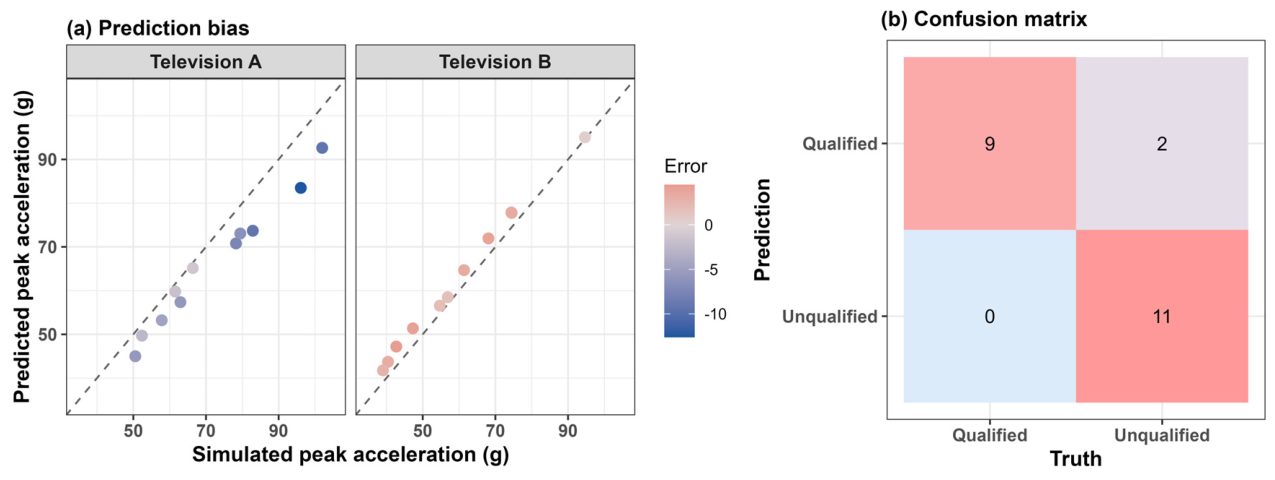
Figure 15a, the data points for the two new TV products are distributed close to the ideal diagonal line, indicating that the trained XGBoost model retained good predictive capability when applied to samples outside the original training and testing datasets. The resulting R
2 reached 0.926, and the prediction errors were mainly concentrated within 0.41–12.62 g, with an average error of 4.49 g. Larger deviations were mainly observed in the high-acceleration region, whereas the predictions were more stable in the low-acceleration region.
As shown in
Figure 15b, from a design-assessment perspective, the FE simulation results identified nine damaged schemes that were fully consistent with the model predictions, while two near-fragility threshold (60 g) schemes were predicted as safe but were classified as damaged by FE simulation [
39]. The resulting damage classification accuracy was 90.91%. Both misclassified cases had simulated peak accelerations only slightly above the 60 g threshold, indicating that additional safety margins should be retained for marginal schemes. This observation discrepancies may be likely attributable to the inherent uncertainty of FE simulations under boundary-condition-dominated scenarios.
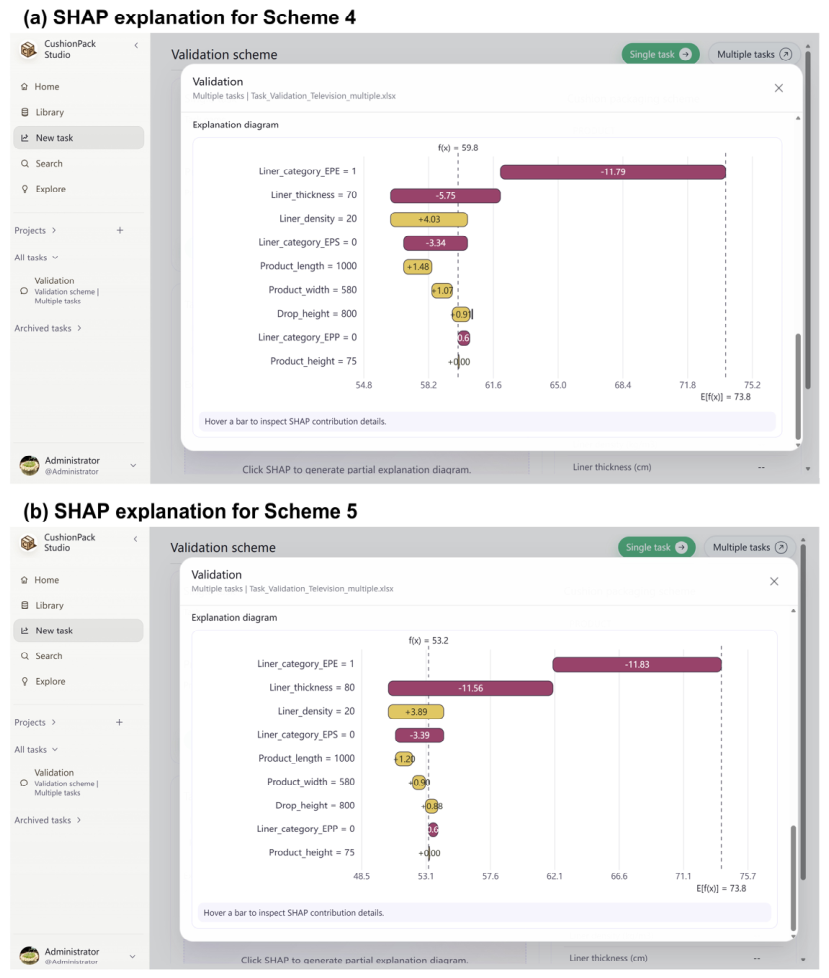
Figure 16a presents the local SHAP explanation for one representative damaged case (Scheme 4 in
Supplementary Table S6). The EPE liner and 70 mm liner thickness contributed negatively to the predicted peak acceleration, indicating that the selected material and deformation stroke were beneficial for impact attenuation. However, the predicted value remained close to the 60 g fragility threshold, so the scheme was regarded as a marginal design. As illustrated in
Figure 16b, increasing the liner thickness from 70 mm to 80 mm reduced the predicted peak acceleration to approximately 53 g. This example shows that local SHAP explanations can help identify which controllable parameter should be adjusted to improve the safety margin of a specific packaging scheme.
From an engineering design perspective, these results demonstrate that integrating the performance prediction model with design exploration may enable rapid screening and optimization of cushioning packaging schemes. In finite element simulation, liner thickness can be regarded as a primary design variable for increasing the safety margin when the predicted peak acceleration approaches the product fragility threshold. However, excessive thickness may lead to material waste and increased package volume. Liner density should be selected in combination with material type rather than simply increased. Higher density generally increased peak acceleration because of the higher effective stiffness of the cushioning liner, whereas an excessively low-density liner may provide insufficient support or undergo excessive deformation prematurely in practical applications. Accordingly, TV cushioning packaging design should first select a suitable cushioning material, then adjust liner thickness as an efficient means of reducing peak acceleration of cushioning packaging system, and finally refine the density–thickness combination under the constraints of product fragility, package size, material consumption and cost.
4.7. Work Significance, Limitations and Future Development
Based on the established FE-XGBoost analysis strategy, the performance of cushioning packaging for TV products can be assessed rapidly. By integrating feature contribution analysis with model interpretability, the key design parameters influencing the peak acceleration response and their corresponding optimization directions can be identified. Grid search-based design exploration enables a more efficient and systematic identification of feasible cushioning packaging schemes. The proposed FE-ML workflow may reduce reliance on extensive FE simulations, facilitate the rapid elimination of unreasonable designs and accelerate early-stage design exploration of TV cushioning packaging. In addition, it can provide a useful workflow reference for the design and optimization of cushioning packaging for other products.
However, at the current stage, the proposed method is mainly intended to assist the optimization and design of TV cushioning packaging, rather than to replace the complete packaging design. The sample data used in this study were primarily derived from FE simulations of a limited number of TV products, and the dataset size remains relatively small. Furthermore, the selection of the augmentation factor may be affected by the dataset partitioning strategy. Different training/testing ratios may alter the relative performance of different augmentation factors and ML models. Moreover, the current prediction and screening objective focuses only on peak acceleration. Although a web-based platform was developed to deploy the proposed FE-ML framework, larger and more systematic databases should be constructed in future work by introducing more real product parameter combinations, including different TV sizes, mass distributions, structural parameters, cushioning layouts, material densities and liner thicknesses. The repeated random splitting and multiple training/testing ratios will be further introduced to evaluate the robustness of augmentation-factor selection more comprehensively. The dataset should incorporate a wider variety of product types and more comprehensive product-related attributes. Although the independent FE simulation for new TV products provided additional verification of the FE-ML framework, physical drop tests using real TV cushioning packaging are still necessary to further validate the practical reliability of the proposed approach. In addition, cost assessment and multi-objective optimization should be incorporated to identify cushioning packaging schemes with improved protective performance and lower costs.
5. Conclusions
This study proposed a hybrid FE-ML approach for the protective performance prediction of TV cushioning packaging integrating FE simulations and an explainable ML model. By incorporating TV product dimensions, cushioning material characteristics, and drop-impact conditions, rapid prediction of peak acceleration for TV cushioning packaging systems was achieved. A total of 216 finite element simulation models of TV cushioning packaging systems were constructed using ANSYS, and the corresponding peak acceleration responses were obtained. On this basis, the Mixup data augmentation was applied to expand the dataset, and Bayesian optimization was employed to train and compare six machine learning models, including RF, SVM, LR, KNN, XGBoost and MARS.
With a data augmentation factor of AF = 2, the XGBoost model achieved the best performance, yielding the R2 value of 0.998 and 0.983 on the training and testing datasets, respectively, with corresponding RMSE values of 0.92 g and 2.85 g. These results indicate that the proposed Mixup-augmented XGBoost model achieved high prediction accuracy and generalization capability for peak acceleration estimation. Through feature importance analysis and global SHAP interpretability analysis, the key design factors governing the peak acceleration of TV cushioning packaging were systematically identified. Among all input variables, liner material type, liner thickness and liner density were found to be the dominant parameters, whereas the effects of the remaining input features were comparatively limited. SHAP partial dependence analysis revealed that peak acceleration decreased with increasing liner thickness, while the effect of liner density was nonlinear and strongly coupled with material type; EPS liners were generally associated with higher acceleration responses, whereas EPE liners showed better cushioning performance. In addition, key design parameter combinations that could effectively protect TV products were identified using grid search-based design exploration, and the actual application effects were verified by FE simulations. Among them, 22 independent TV cushioning packaging schemes were analyzed, and the strong predictive accuracy of the Mixup-augmented XGBoost model was confirmed, achieving an R2 value of 0.926, with an average prediction error of only 4.490 g relative to the FE simulation results.
Overall, the proposed FE–ML framework provides an effective approach for predicting the protective performance of TV cushioning packaging and was preliminarily deployed as a web-based platform to support rapid performance assessment and design optimization, thereby extending its practical value for application-oriented cushioning packaging design.
Supplementary Materials
The following supporting information can be downloaded at
https://www.mdpi.com/article/10.3390/asi9060127/s1. Figure S1: Schematic illustrations of the six machine learning algorithms used in this study; Figure S2: The influence of different augment factors on peak acceleration; Figure S3: Pearson correlation heatmap of training datasets with different augment factors; Figure S4: SHAP value dependence plots of (a) TV length, (b) TV width and (c) TV height; Figure S5: The required packages for platform development; Figure S6: Overall architecture design of platform; Figure S7: The main interface of developed platform for the performance prediction and design of cushioning packaging; Table S1: Properties of cushion materials with different densities; Table S2: The stress (σ)–strain (ε) values of liner materials with different densities and types; Table S3: Training hyperparameters of different machine learning models; Table S4: Optimal hyperparameters of the six machine learning models with different data augmentation factors; Table S5: Detailed information on cushioning packaging parameters for two new TV products; Table S6: FE-simulated and ML-predicted results of 22 cushioning packaging schemes for two new TV products. Refs. [
15,
42,
43,
44,
45,
46] are cited in Supplementary Materials File.
Author Contributions
Conceptualization, methodology, software, visualization, investigation, writing—original draft, Q.Z.; Validation, resources, supervision, writing—review and editing. Y.Z.; Resources, methodology, writing—original draft, J.H. and J.L. All authors have read and agreed to the published version of the manuscript.
Funding
This research received no external funding.
Data Availability Statement
Acknowledgments
During the preparation of this manuscript, the authors used ChatGPT 5.4 for language editing. The authors reviewed and edited the content and take full responsibility for the content of the publication.
Conflicts of Interest
The authors declare no conflicts of interest.
Abbreviations
The following abbreviations are used in this manuscript:
| FE | Finite Element |
| ML | Machine Learning |
| XGBoost | Extreme Gradient Boosting |
| RF | Random Forest |
| SVM | Support Vector Machine |
| KNN | k-nearest Neighbors |
| LR | Linear Regression |
| MARS | Multivariate Adaptive Regression Splines |
| SHAP | Shapley Additive Explanations |
References
- Venkata Naga Chandana, Y.; Venu Kumar, N. Drop test analysis of ball grid array package using finite element methods. Mater. Today Proc. 2022, 64, 675–679. [Google Scholar] [CrossRef] [Scilit]
- Wei, Z.; Hue, G. Research on cushioning package design methods based on infinitive equations. Appl. Mech. Mater. 2012, 200, 109–113. [Google Scholar] [CrossRef] [Scilit]
- Li, M. Numerical Simulation of Dynamic Tipping and Dropping of LCD TV Package. Master’s Thesis, Qingdao University of Science & Technology, Qingdao, China, 2021. [Google Scholar]
- Zhong, C.; Saito, K.; Kawaguchi, K.; Setoue, H. The hybrid drop test. Packag. Technol. Sci. 2014, 27, 509–520. [Google Scholar]
- Zhang, G.M.; Song, X.L.; Shi, Y.; Su, F.; Cao, Y. Evaluation on cushioning packaging system of laptop during drop based on ABAQUS. In Applied Sciences in Graphic Communication and Packaging; Zhao, P., Ouyang, Y., Xu, M., Yang, L., Ren, Y., Eds.; Springer: Singapore, 2018; Volume 477, pp. 437–442. [Google Scholar]
- Dinesh, A.; Rahul Prasad, B. Predictive models in machine learning for strength and life cycle assessment of concrete structures. Autom. Constr. 2024, 162, 105412. [Google Scholar] [CrossRef] [Scilit]
- Wang, Y.Q.; Dong, H.; Guo, Y.C.; Shao, Y.N.; Li, H.; Liang, Y.F.; Guo, Q.Q.; Xia, F.; Yang, Z.; Li, J.P. Simultaneous enhancement of the room temperature and high-temperature properties of Al-Cu-Mg-Ag alloys via machine learning on small datasets. Mater. Charact. 2026, 231, 115896. [Google Scholar]
- Shirzad, K.; Joodaky, A. Enhancing sustainable food packaging design: A machine learning approach to predict ventilated corrugated paperboard strength. Biosyst. Eng. 2024, 247, 26–41. [Google Scholar] [CrossRef] [Scilit]
- Gajewski, T.; Grabski, J.K.; Cornaggia, A.; Garbowski, T. On the use of artificial intelligence in predicting the compressive strength of various cardboard packaging. Packag. Technol. Sci. 2024, 37, 97–105. [Google Scholar] [CrossRef] [Scilit]
- Zhu, Z.; Su, M.Z.; Ye, X.H.; Zhang, H.; Shi, W. Tensile capacity assessment of stochastic-corroded steel anchor channels with channel bolts: Finite element simulation and machine learning model development. Structures 2026, 84, 111003. [Google Scholar] [CrossRef] [Scilit]
- Yu, Y.T.; Zhang, Y.; Feng, Y.J.; Leong, Z.H.; Pan, J.T.; Su, J.P.; Li, Y.Q. Using machine learning to deeply analyze the critical role of trace element additives in anaerobic digestion and guide the optimization of addition strategies. Water Res. 2026, 288, 124693. [Google Scholar]
- Chang, J.; Gong, X.; Sun, Z.H. Analysis of mechanical properties of glass packaging. In Advanced Graphic Communications and Media Technologies; Zhao, P., Ouyang, Y., Xu, M., Yang, L., Ouyang, Y., Eds.; Springer: Singapore, 2017; Volume 417, pp. 635–641. [Google Scholar]
- Kun, G.; Xi, W. Design and analysis of cushioning packaging for home appliances. Procedia Eng. 2017, 174, 904–909. [Google Scholar] [CrossRef] [Scilit]
- Lu, S.G.; Dong, J.; Zhou, T.; Liu, F.; Xu, S. Green Packaging Design and Finite Element Analysis of LCD Buffering Cushion. In Proceedings of the 3rd Annual International Conference on Electronics, Electrical Engineering and Information Science (EEEIS 2017); Cheung, K.S., Ed.; Atlantis Press: Paris, France, 2017; Volume 131, pp. 10–15. [Google Scholar]
- Naser, A.H.; Badr, A.H.; Henedy, S.N.; Ostrowski, K.A.; Imran, H. Application of Multivariate Adaptive Regression Splines (MARS) approach in prediction of compressive strength of eco-friendly concrete. Case Stud. Constr. Mater. 2022, 17, e1262. [Google Scholar] [CrossRef] [Scilit]
- Zhou, Y.J.; Yi, X.Y.; Feng, W.K.; Wu, W.X.; Xu, W.Z. Impact of rock discontinuity geometry on uniaxial compressive strength: Integrating the finite–discrete element method with data-augmented interpretable machine learning. J. Rock. Mech. Geotech. Eng. 2025. [Google Scholar] [CrossRef] [Scilit]
- Long, X.; Ali, I.; Maqbool, K.H.; Khan, M.M. Hybrid framework of penetration resistance analysis by machine learning and finite element simulation. Eng. Appl. Artif. Intell. 2026, 163, 112868. [Google Scholar] [CrossRef] [Scilit]
- Karsh, P.K.; Mukhopadhyay, T.; Dey, S. A stochastic investigation of effect of temperature on natural frequencies of functionally graded plates. In Advances in Structural Engineering and Rehabilitation; Adhikari, S., Bhattacharjee, B., Bhattacharjee, J., Eds.; Springer: Singapore, 2020; Volume 38, pp. 41–53. [Google Scholar]
- Kounlavong, K.; Basyah, S.Q.A.; Tran, D.T.; Keawsawasvong, S.; Jamsawang, P. AI-based approaches for predicting buried pipeline stability in cohesive-frictional soil under inclined forces: FELA, DNN, RNN, LSTM, and MARS. J. Pipeline Sci. Eng. 2025, 5, 100285. [Google Scholar] [CrossRef] [Scilit]
- Wang, B.; Shi, Y.L.; Zheng, L.; Wang, W.D. Finite element and explainable machine learning investigation on the axial compressive behavior of elliptical FRP-concrete-steel double-skin tubular columns. Structures 2025, 82, 110797. [Google Scholar] [CrossRef] [Scilit]
- Elizabeth Michael, N.; Hasan, S.; Al-Durra, A.; Mishra, M. Short-term solar irradiance forecasting based on a novel Bayesian optimized deep Long Short-Term Memory neural network. Appl. Energy 2022, 324, 119727. [Google Scholar] [CrossRef] [Scilit]
- Kim, J.; Lee, D. Comparative study on hyperparameter tuning for predicting concrete compressive strength. Buildings 2025, 15, 2173. [Google Scholar] [CrossRef] [Scilit]
- Lai, Y.C.; Ieee, C.S. Application and effectiveness evaluation of Bayesian optimization algorithm in hyperparameter tuning of machine learning models. In 2024 International Conference on Power, Electrical Engineering, Electronics and Control (PEEEC); Institute of Electrical and Electronics Engineers: Athens, Greece, 2024; pp. 351–355. [Google Scholar]
- Zhang, S.J.; Lei, H.G.; Zhou, Z.C.; Wang, G.Q.; Qiu, B. Fatigue life analysis of high-strength bolts based on machine learning method and SHapley Additive exPlanations (SHAP) approach. Structures 2023, 51, 275–287. [Google Scholar] [CrossRef] [Scilit]
- Liu, B.K.; Lu, W.Z.; Olofsson, T.; Zhuang, X.Y.; Rabczuk, T. Stochastic interpretable machine learning based multiscale modeling in thermal conductivity of Polymeric graphene-enhanced composites. Compos. Struct. 2024, 327, 117601. [Google Scholar] [CrossRef] [Scilit]
- Wang, L.L.; Wu, M.H. Research on bearing fault diagnosis based on machine learning and SHAP interpretability analysis. Sci. Rep. 2025, 15, 41242. [Google Scholar] [CrossRef] [Scilit] [PubMed]
- He, S.; Du, W.L.; Peng, X. Uncertainty-aware optimization of zeolite particle size: Utilizing quantile regression and SHAP analysis. Chem. Eng. J. 2025, 512, 162085. [Google Scholar] [CrossRef] [Scilit]
- Zong, B.T.; Li, J.S.; Yuan, T.H.; Wang, J.; Yuan, R.H. Recent progress on machine learning with limited materials data: Using tools from data science and domain knowledge. J. Mater. 2025, 11, 100916. [Google Scholar] [CrossRef] [Scilit]
- Shafique, R.; Al-Shamayleh, A.S.; Kumar Posa, S.; Ishaq, A.; Rustam, F.; Choi, G.S. Advancing ovarian cancer outcomes with CTGAN-enhanced hybrid machine learning approach. Knowl.-Based Syst. 2025, 328, 114206. [Google Scholar]
- Yeşilkanat, C.M.; Akkoyun, S. SMOTE-based data augmentation for accurate classification of neutron halo nuclei: A machine learning approach in nuclear physics. Knowl.-Based Syst. 2025, 318, 113580. [Google Scholar] [CrossRef] [Scilit]
- Zhou, S.H.; Sun, Z.X.; Li, W.L.; Guo, J.Y.; Sun, D.D.; Xu, L.L.; Wu, K. A hybrid machine learning framework with GAN-based data augmentation for predicting strain properties of fiber-reinforced repair mortar. J. Build. Eng. 2025, 114, 114140. [Google Scholar]
- GB/T 4857.5-1992; Packaging-Transport Packages-Vertical Impact Test Method by Dropping. Mechanical Standardization Institute of the Electromechanical Department: Beijing, China, 1992.
- Huo, Y. The Study of Structure and Mechanics Behavior of Low Density Foamed Plastics. Master’s Thesis, Jiangnan University, Wuxi, China, 2008. [Google Scholar]
- Smucny, J.; Shi, G.; Lesh, T.A.; Carter, C.S.; Davidson, I. Data augmentation with Mixup: Enhancing performance of a functional neuroimaging-based prognostic deep learning classifier in recent onset psychosis. NeuroImage Clin. 2022, 36, 103214. [Google Scholar] [PubMed]
- Dutschmann, T.; Kinzel, L.; ter Laak, A.; Baumann, K. Large-scale evaluation of k-fold cross-validation ensembles for uncertainty estimation. J. Cheminform. 2023, 15, 49. [Google Scholar] [CrossRef] [Scilit]
- Sekadakis, M.; Garefalakis, T.; Moertl, P.; Yannis, G. Analyzing SHAP values of XGBoost algorithms to understand driving features affecting take-over time from vehicle alert to driver action. Displays 2026, 91, 103263. [Google Scholar] [CrossRef] [Scilit]
- Yalkın, H.E.; Karakuzu, R.; Alpyıldız, T. Experimental and numerical behaviors of GFRP laminates under low velocity impact. J. Compos. Mater. 2020, 54, 2999–3007. [Google Scholar] [CrossRef] [Scilit]
- Wang, T.; Li, Y. Design and analysis of automotive carbon fiber composite bumper beam based on finite element analysis. Adv. Mech. Eng. 2015, 7, 757556039. [Google Scholar] [CrossRef] [Scilit]
- Yeshanew, E.S.; Nallamothu, R.B. Numerical simulation and design modification of an automotive bumper to enhance energy absorption by using LS-DYNA. Modell. Simul. Eng. 2025, 2025, 9980385. [Google Scholar] [CrossRef] [Scilit]
- Wang, Z.W. Chapter three-cushioning packaging materials. In Transport Packaging, 1st ed.; China Light Industry Press: Beijing, China, 2020; p. 300. [Google Scholar]
- Sun, D.Q.; Jin, Q.W.; Li, G.Z. Analysis on dynamic cushioning property of expanded polypropylene materials. Packag. Eng. 2019, 40, 114–119. [Google Scholar]
- Rothacher, Y.; Strobl, C. Identifying informative predictor variables with random forests. J. Educ. Behav. Stat. 2024, 49, 595–629. [Google Scholar] [CrossRef] [Scilit]
- Cervantes, J.; Garcia-Lamont, F.; Rodriguez-Mazahua, L.; Lopez, A. A comprehensive survey on support vector machine classification: Applications, challenges and trends. Neurocomputing 2020, 408, 189–215. [Google Scholar] [CrossRef] [Scilit]
- Niazkar, M.; Menapace, A.; Brentan, B.; Piraei, R.; Jimenez, D.; Dhawan, P.; Righetti, M. Applications of XGBoost in water resources engineering: A systematic literature review. Environ. Model Softw. 2024, 174, 105971. [Google Scholar] [CrossRef] [Scilit]
- Srisuradetchai, P.; Suksrikran, K. Random kernel k-nearest neighbors regression. Front. Big Data 2024, 7, 1402384. [Google Scholar] [CrossRef] [Scilit]
- Altork, Y. Comparative analysis of machine learning models for wind speed forecasting: Support vector machines, fine tree, and linear regression approaches. Int. J. Thermofluids 2025, 27, 101217. [Google Scholar] [CrossRef] [Scilit]
Figure 1.
Cushioning packaging design strategy based on finite element simulation and machine learning.
Figure 1.
Cushioning packaging design strategy based on finite element simulation and machine learning.
Figure 2.
Schematic illustration of (a) television model and (b) cushioning structure.
Figure 2.
Schematic illustration of (a) television model and (b) cushioning structure.
Figure 3.
Histogram of the distribution of original database.
Figure 3.
Histogram of the distribution of original database.
Figure 4.
Mesh discretization of the television cushioning packaging (excluding the corrugated carton).
Figure 4.
Mesh discretization of the television cushioning packaging (excluding the corrugated carton).
Figure 5.
(a) Acceleration response curve of the television screen. (b) System energy evolution for a representative cushioning packaging configuration.
Figure 5.
(a) Acceleration response curve of the television screen. (b) System energy evolution for a representative cushioning packaging configuration.
Figure 6.
Acceleration response curve of the television screen under typical cushioning packaging configurations.
Figure 6.
Acceleration response curve of the television screen under typical cushioning packaging configurations.
Figure 7.
Relationship between model evaluation metrics and the augmentation factor: (a) R2 and (b) RMSE for the training dataset, (c) R2 and (d) RMSE for the test dataset.
Figure 7.
Relationship between model evaluation metrics and the augmentation factor: (a) R2 and (b) RMSE for the training dataset, (c) R2 and (d) RMSE for the test dataset.
Figure 8.
Histogram of the feature distribution based on the original training dataset and the augmented training dataset (AF = 2).
Figure 8.
Histogram of the feature distribution based on the original training dataset and the augmented training dataset (AF = 2).
Figure 9.
Pearson correlation heatmaps based on (a) original training dataset and (b) augmented training dataset (AF = 2).
Figure 9.
Pearson correlation heatmaps based on (a) original training dataset and (b) augmented training dataset (AF = 2).
Figure 10.
Comparison of the performance of different models in the 10-fold cross-validation.
Figure 10.
Comparison of the performance of different models in the 10-fold cross-validation.
Figure 11.
Prediction performance of different machine learning models for peak acceleration: (a) original dataset and (b) augmented dataset.
Figure 11.
Prediction performance of different machine learning models for peak acceleration: (a) original dataset and (b) augmented dataset.
Figure 12.
Analysis of the importance of input features on peak acceleration.
Figure 12.
Analysis of the importance of input features on peak acceleration.
Figure 13.
Model interpretability analysis: (a) SHAP value distribution, univariate PDP for (b) liner thickness, (c) liner density, (d) EPE cushioning material, (e) EPP cushioning material, (f) EPS cushioning material and (g) drop height, respectively.
Figure 13.
Model interpretability analysis: (a) SHAP value distribution, univariate PDP for (b) liner thickness, (c) liner density, (d) EPE cushioning material, (e) EPP cushioning material, (f) EPS cushioning material and (g) drop height, respectively.
Figure 14.
Design exploration results for (a–c) Television A and (d–f) Television B with different cushioning materials.
Figure 14.
Design exploration results for (a–c) Television A and (d–f) Television B with different cushioning materials.
Figure 15.
Comprehensive analysis results of two television products: (a) prediction result and (b) confusion matrix.
Figure 15.
Comprehensive analysis results of two television products: (a) prediction result and (b) confusion matrix.
Figure 16.
Design guidance of typical television cushioning packaging schemes by SHAP explanation analysis.
Figure 16.
Design guidance of typical television cushioning packaging schemes by SHAP explanation analysis.
Table 1.
Material properties of key components of the television.
Table 1.
Material properties of key components of the television.
| Component | Material | Density (kg/m3) | Elastic Modulus (MPa) | Poisson’s Ratio |
|---|
| Rear housing | HIPS | 1160.00 | 2600.00 | 0.36 |
| Back plate | Galvanized steel sheet | 7860.00 | 2.00 × 10⁵ | 0.30 |
| Screen | LCD module | 2430.00 | 4.50 × 10⁴ | 0.30 |
| Front housing | PC/ABS | 1180.00 | 2690.00 | 0.35 |
| Diffusion plate | PC | 1180.00 | 2600.00 | 0.35 |
| Diffusion plate bracket | PC | 1180.00 | 2600.00 | 0.35 |
| Corrugated carton | BC corrugated board | 143.40 | 118.50 | 0.34 |
Table 2.
Ranges of input parameters for the model.
Table 2.
Ranges of input parameters for the model.
| Feature Variable | Unit | Values |
|---|
| Television dimension (length × width × height) | mm | 890 × 525 × 75 |
| 1110 × 640 × 75 |
| 1330 × 750 × 75 |
| Drop height | mm | 600, 800 |
| Liner material | / | EPE, EPS, EPP |
| Liner density | kg/m3 | 5, 10, 15, 20, 25, 30, 35 |
| Liner thickness | mm | 40, 50, 60, 70, 80, 90 |
Table 3.
Comparison of the prediction performance (R2 and RMSE) for peak acceleration of original and augmented data.
Table 3.
Comparison of the prediction performance (R2 and RMSE) for peak acceleration of original and augmented data.
| Model | Augment Factor | Training Data | Testing Data |
|---|
| R2 | RMSE | R2 | RMSE |
|---|
| XGBoost | 0 (Original) | 0.9896 | 2.2239 | 0.9592 | 4.3824 |
| 1 | 0.9988 | 0.7077 | 0.9847 | 2.7848 |
| 2 * | 0.9987 | 0.7642 | 0.9852 | 2.7377 |
| 3 | 0.9995 | 0.4531 | 0.9809 | 3.0842 |
| 4 | 0.9996 | 0.4017 | 0.9850 | 2.8439 |
| 5 | 0.9997 | 0.3383 | 0.9803 | 3.2246 |
| SVM | 0 (Original) | 0.9901 | 2.1977 | 0.9746 | 3.5023 |
| 1 | 0.9846 | 2.5946 | 0.9736 | 3.5759 |
| 2 * | 0.9771 | 3.2128 | 0.9658 | 4.0568 |
| 3 | 0.9805 | 2.9049 | 0.9695 | 3.8120 |
| 4 | 0.9785 | 3.0116 | 0.9699 | 3.7651 |
| 5 | 0.9810 | 2.8744 | 0.9690 | 3.8324 |
| RF | 0 (Original) | 0.9811 | 3.5950 | 0.9507 | 5.1561 |
| 1 | 0.9892 | 2.5095 | 0.9546 | 5.0284 |
| 2 * | 0.9936 | 1.8138 | 0.9629 | 4.2462 |
| 3 | 0.9957 | 1.4182 | 0.9561 | 4.5384 |
| 4 | 0.9964 | 1.2855 | 0.9589 | 4.4333 |
| 5 | 0.9964 | 1.3305 | 0.9568 | 4.6587 |
| MARS | 0 (Original) | 0.9737 | 3.5374 | 0.9577 | 4.5077 |
| 1 | 0.9693 | 3.6552 | 0.9362 | 5.4760 |
| 2 * | 0.9630 | 4.0470 | 0.9389 | 5.4073 |
| 3 | 0.9702 | 3.5704 | 0.9397 | 5.3528 |
| 4 | 0.9670 | 3.7197 | 0.9607 | 4.4095 |
| 5 | 0.9541 | 4.4399 | 0.9416 | 5.2544 |
| LR | 0 (Original) | 0.7969 | 9.8293 | 0.7813 | 10.1543 |
| 1 | 0.7971 | 9.3952 | 0.7786 | 10.2736 |
| 2 * | 0.7888 | 9.6643 | 0.7802 | 10.1994 |
| 3 | 0.7935 | 9.4028 | 0.7791 | 10.2022 |
| 4 | 0.7789 | 9.6250 | 0.7822 | 10.1127 |
| 5 | 0.8033 | 9.1892 | 0.7838 | 10.1136 |
| KNN | 0 (Original) | 0.9299 | 7.3836 | 0.8251 | 10.5926 |
| 1 | 0.9656 | 4.3689 | 0.8820 | 8.7420 |
| 2 * | 0.9692 | 3.8698 | 0.9118 | 7.5438 |
| 3 | 0.9763 | 3.3519 | 0.8956 | 7.9511 |
| 4 | 0.9731 | 3.4884 | 0.9025 | 7.3950 |
| 5 | 0.9740 | 3.4364 | 0.8968 | 7.3470 |
| Disclaimer/Publisher’s Note: The statements, opinions and data contained in all publications are solely those of the individual author(s) and contributor(s) and not of MDPI and/or the editor(s). MDPI and/or the editor(s) disclaim responsibility for any injury to people or property resulting from any ideas, methods, instructions or products referred to in the content. |
© 2026 by the authors. Published by MDPI on behalf of the International Institute of Knowledge Innovation and Invention. Licensee MDPI, Basel, Switzerland. This article is an open access article distributed under the terms and conditions of the Creative Commons Attribution (CC BY) license.