1. Introduction
Attention is a key component in the academic process, being the main driver for cognitive achievements through focus and concentration. A priority in higher education is to maintain high levels of attention among students who are listening to lectures. Thus, a research field in education concerns serious games, which can be effective learning tools for education or training. However, some scholars regard them as ineffective, especially in traditional academia. Their arguments are as follows: (i) there is a lack of rigorous scientific validation, as there is insufficient high-quality research showing long-term learning outcomes [
1]; (ii) educators are reluctant to change traditional teaching methods [
2]; (iii) measuring learning outcomes while playing the game is a complicated and costly process [
3]; and finally, (iv) not all students are enthusiastic about this means of education [
4].
Recent advancements in wearable brain–computer interfaces (BCIs), particularly those utilizing electroencephalography (EEG), offer a reliable method for monitoring cognitive states of the brain. Attention is defined as a cognitive process that focuses on capturing specific information. The BCIs demonstrated that they are able to capture brain activity associated with attention, enabling real-time feedback on such activity. Therefore, the outcomes can be integrated into serious games to create neuroadaptive experiences. The result will be an optimization of the serious game by dynamic tuning of the game mechanics, for example, difficulty levels and personalized pacing based on the player’s cognitive state.
A systematic review by [
5] categorized existing BCI-serious game studies into three experimental strategies: evoked signals, spontaneous signals, and hybrid signals. The majority of studies employed spontaneous signals, focusing on real-time monitoring of ongoing cognitive states. This approach has been applied in various domains, including attention rehabilitation for individuals with attention deficit hyperactivity disorder (ADHD) and cognitive training for older adults. For instance, several studies demonstrated that real-time EEG feedback during gameplay improved sustained attention in participants [
6,
7,
8]. Another study presents a systematic review of EEG-based BCIs used in video games, examining the progress of BCI research and its applications in gaming. The study discusses the advantages of integrating BCI with gaming applications to enhance user experience [
9]. Bashivan et al. explore the potential of consumer-grade wearable EEG devices in recognizing mental states [
10]. The study demonstrates the capability of these devices to differentiate between cognitive states induced by different types of video input, such as logical versus emotional content [
10].
This study examines the variation in attention spans between short, intense tasks and long, moderate tasks, utilizing a portable EEG system that provides quantifiable metrics within the context of a serious game designed as courseware for the discipline of Computer Vision, taught at the Master’s Level in Computer Science. The objective was to assess attention through the values generated by the ThinkGear chip integrated into the NeuroSky EEG headset and the Mindwave Mobile 2 device, and interpret these values in the context of the proposed tasks [
11]. The problem investigated in this project is the difficulty of maintaining sustained attention over different periods, particularly how it manifests itself in short but demanding tasks, compared to longer activities, which involve a more passive concentration in the framework of a serious game. Attention values and their temporal variation were analyzed using EEG instruments. It was assumed that human benchmark tasks [
12] intensely strain the prefrontal cortex, causing rapid fluctuations in focus levels. At the same time, long-term activities require more constant maintenance, but at an average level.
The research question we have analyzed is how learners’ attention, as measured by the NeuroSky EEG headset, varies during different stages of serious game use, and how it is influenced by game difficulty or task type. We have formulated the hypothesis as follows:
H1. Attention levels will be higher during interactive or challenge-based game segments than during passive segments (e.g., reading instructions or definitions).
The following sections outline the methods and structure of our research.
Section 2 introduces the materials and techniques applied, the workflow, the setup protocol, and the data analytics.
Section 3 presents the results obtained, and
Section 4 provides our interpretations and discussions. In
Section 5, we conclude on the validity of our hypothesis, draw some conclusions, and discuss future work.
2. Materials and Methods
2.1. Materials for Adaptive Attention Measurements
2.1.1. NeuroSky Mindwave Mobile 2 Headset and NeuroExperimenter (NEx 6.6)
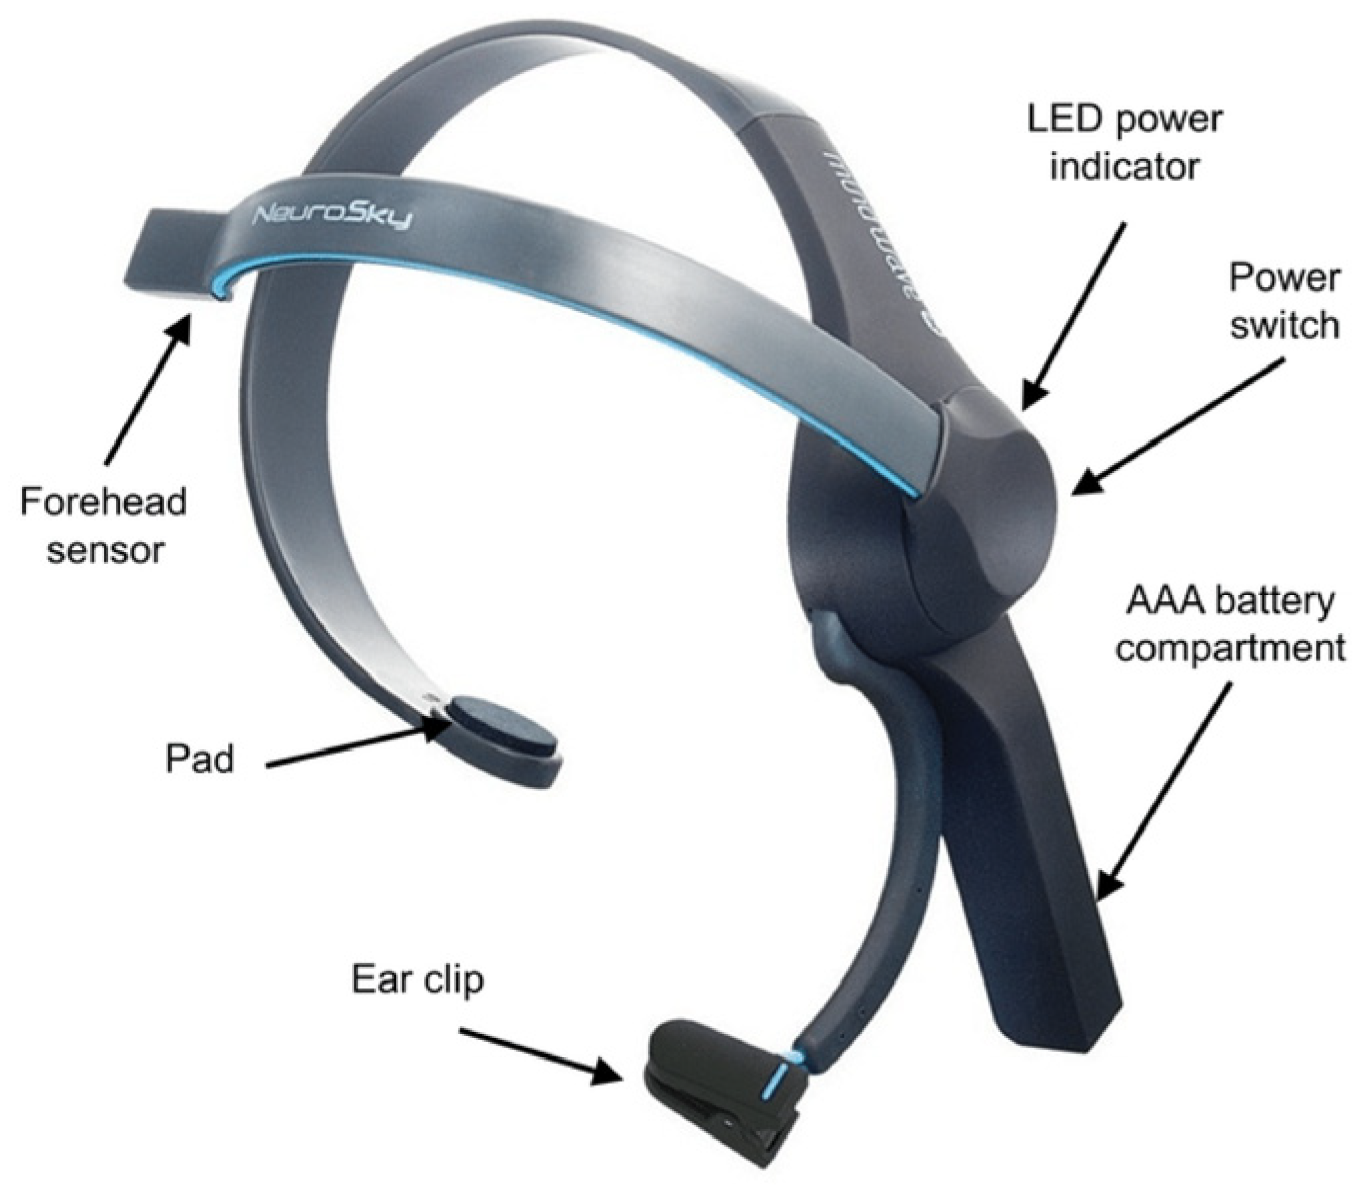
The NeuroSky Mindwave Mobile 2 headset is a single-channel EEG headset featuring a dry forehead sensor, Bluetooth connectivity, and the ability to provide brainwave, attention, meditation, and blinking data (
Figure 1). It is based on the ThinkGear chip [
11]. The technical specifications of the NeuroSky Mindwave Mobile 2 are as follows: A sampling rate of 512 Hz (internal) and down-sampled to lower rates for data transmission (e.g., 128 Hz). The frequency ranges from 3 to 100 Hz, with a signal resolution of 12 bits. As a consumer-grade measuring device, it may not be as accurate or reliable as clinical EEG assessments. However, it has been utilized in a significant number of recent studies. As reported in [
13], the signal quality for the FP1 electrode site is good, making it usable for temporal tracking in experiments. However, its built-in Attention/Meditation metrics are not always accurate [
13]. Another recent project achieved color classification using MindWave EEG signals and an attention-aware LSTM neural network, reaching 93.5% accuracy for binary color tasks (and around 65.8% for four-color classification) [
14]. In another university setting, it has been used to assess anxiety awareness during exams [
15]. In [
16], the State-Trait Anxiety Inventory (STAI) tracking is discussed in the context of study sessions or exams to identify who benefits from guided relaxation, which is another case study involving this kind of device. Reference [
17] reports on utilizing NeuroSky as a lightweight attention indicator to compare lesson segments, support reflective teaching, and analyze group trends. Another application is comparing attention across presentation types (e.g., slides versus video) to optimize instructional design [
18].
The eSense meters provide a simplified measure of attention and meditation, but raw EEG data and frequency bands require more advanced analysis techniques. NeuroSky’s Attention eSense meter is a proprietary algorithm that attempts to quantify a user’s level of mental focus or concentration based on the EEG signals it detects. Because it is proprietary, the exact details of the algorithm are not publicly disclosed.
ThinkGear Connector [
19] is the application that facilitates communication between the Mindwave device and the NeuroExperimenter (NEx) 6.6 software used for data acquisition, storage, and some analytics [
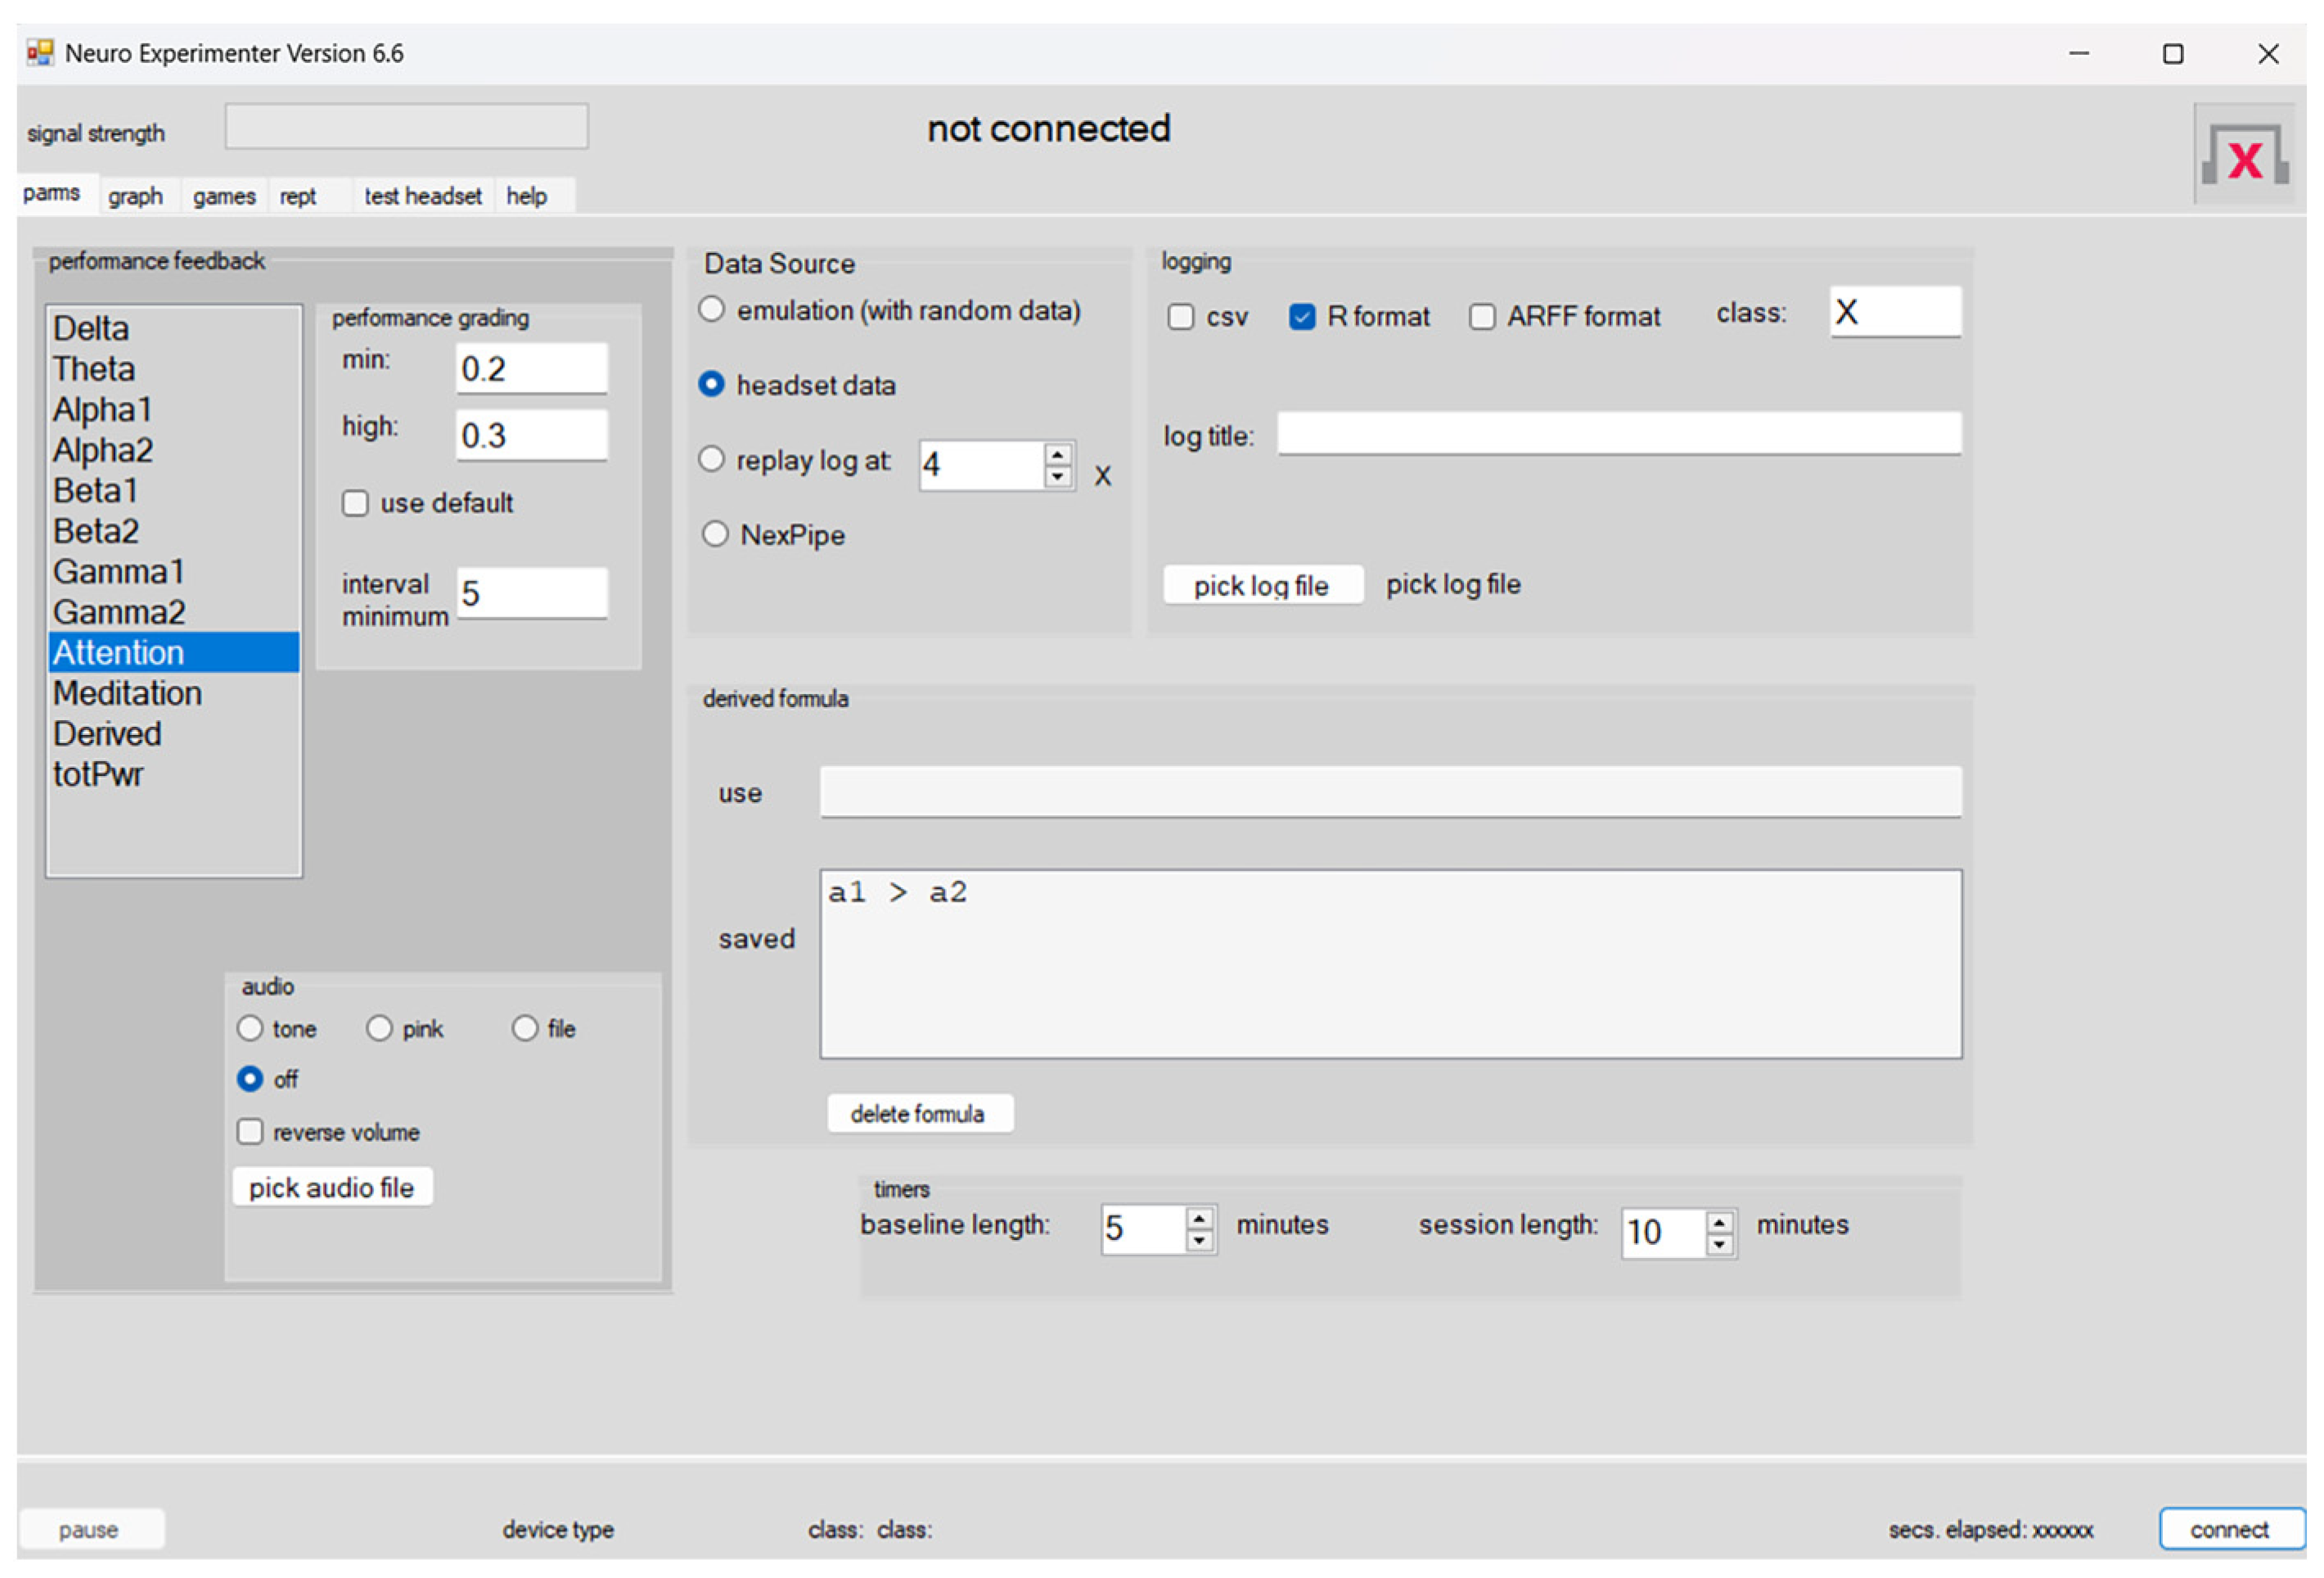
20]. NeuroExperimenter 6.6 captures EEG values in real time and exports them in an analyzable format (R data). The interface is presented in
Figure 2. NEx is a free Windows-based application designed to interface MindWave Mobile and similar NeuroSky devices, providing real-time brainwave monitoring, formula-based derived metrics (e.g., meditation, attention), graphical visualizations, and data export capabilities.
2.1.2. Data Acquisition and Processing
Data acquisition has been performed by selecting the option headset data to acquire data from the headset. To check if the application is connected to the headset, the LED on the headset should be solid, provided one has selected headset data, turned on the headset, and clicked Connect. The system can be paused while using the headset by clicking the pause button. This throws away subsequent samples sent by the headset and suspends logging and reporting. If NEx loses the headset signal while it is paused, it will be disconnected, and the session will end. If one remains connected, click on the pause button (now labeled resume) to continue the session. No time is accumulated in baseline or performance sections until the option Resume appears.
The headset generates “raw” data about 512 times per second. “Power” data are generated about once per second. All 8-power data (one for each wave type) are generated simultaneously. Meditation and Attention data are also generated approximately once per second, but not necessarily at the same time or simultaneously with the power data. Attention and Meditation data (“eSense” data) are calculated by the headset in an unknown manner. The “power spectrum” or the Power Spectral Density (PSD) is calculated by breaking the signal into its component frequencies (Fourier Transform), and the square of the amplitude (as a function of each frequency—alpha, theta, etc.). The Fourier Transform decomposes the EEG time series into a frequency spectral graph commonly called the “power spectrum”, with power being the square of the EEG magnitude, and magnitude being the integral average of the amplitude of the EEG signal, measured from (+) peak-to-(−) peak Equation (1), across the time sampled, or epoch. The epoch length determines the frequency resolution of the Fourier Transform, with a 1 s epoch providing a 1 Hz resolution (plus/minus 0.5 Hz resolution), and a 4 s epoch providing 0.25 Hz, or ± 0.125 Hz resolution as in Equation (1).
The Power Spectral Density (PSD) is given by
It indicates how much power is present at each frequency [
21].
For the processing of EEG signals, the raw electrical activity is decomposed into a series of sine waves using the Fourier Transform. This mathematical method enables the identification of distinct frequency components within the signal and facilitates the analysis of the relative amplitude of each frequency band. Advanced signal processing algorithms—such as digital filtering, moving average smoothing (also known as mobile mediation), peak detection, and spectral analysis—are employed to derive a reliable temporal profile of cognitive states, including attention [
21].
All data from the headset is plotted as they are received. However, data for the log are buffered and accumulated. As data is delivered to NEx, the values are placed in a buffer. Data is not written to the log file until new data arrives, which would overwrite some of the buffered data. This allows us to combine power data and calculated data (Attention, Meditation, Blink) into a single record. The timestamp for this data is that of the last datum that arrived. Since power data arrives at least every second, causing the buffer to be written at least once per second, the timestamp will be accurate to the second. However, the data in the buffer was not generated simultaneously by the headset (just all within the exact second).
Typically, a set of power data and Attention and Meditation will be combined. Since no blink data will have occurred, Blink will be set to NA. When a blink value arrives, if the buffer has no blink data, it will be combined with other data in the buffer. Sometimes, a log record will be created with only blink data (all other data set to NA). This can happen if we have (say) three blinks within the same second. This buffering strategy can result in some log records having the same timestamp (which is accurate to the second).
2.1.3. Normalization
To compare waveforms across samples, data are normalized to be between 0.0 and 1.0. Attention and Meditation are delivered by the headset as values between 0 and 100. These are divided by 100 to normalize them. Thus, all data will have values between 0 and 1.
For the report and for the logs, the samples are not normalized. The actual values from the headset are reported. The NEx program normalizes the power data by first summing all the power data (excluding Meditation, Attention, and Blink) to obtain “total power” for the sample. Then, each power datum in the sample is divided by this total power. Then, the square root is taken of the result. Each of the normalized data in a sample is thus the square root of the proportion of that datum to the total power of the sample. It is between 0.0 and 1.0. Taking the square root has the effect of making the power data (approximately) normally distributed. This allows us to test the significance of the difference between baseline and performance data. (Significance at the p = 0.01 level, two-tailed test, is indicated by an “*” on the summary chart).
The total power (unnormalized) can be viewed by selecting the “totPwr” wave type. The NEx graphs show a normalized value for the eight power values. The Attention and Meditation data are divided by 100 since these values are already scaled to be between 0 and 100 by the headset. These data are (approximately) normally distributed. Blink strength is divided by 255.
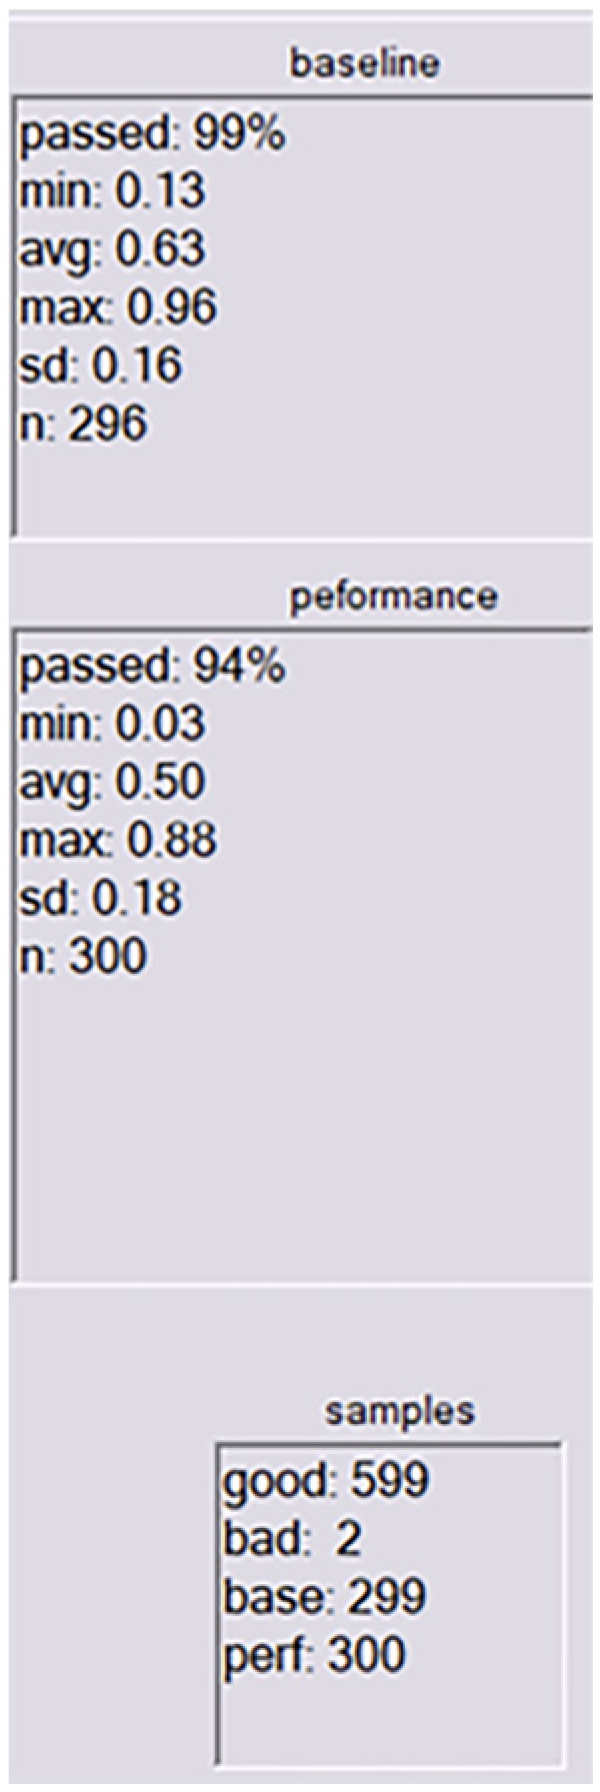
All the graphs show the samples/records box (
Figure 3). The total samples: good, bad (as determined by the headset; bad samples are discarded by the NEx software), and the total good samples collected during the baseline and performance (post-baseline) parts of the session. When one replays a log, the “good” count is the number of records read, as in
Figure 3.
Data acquisition was achieved by taking into consideration the following criteria:
EEG attention data (continuous, per second);
Segment-specific averages for attention;
Post-test scores for learning;
Self-reported engagement and difficulty ratings.
At the end of the ten-minute session, we removed the headset and switched to the graph page to analyze the data.
Figure 4 presents that each bar in this summary represents the performance ratio compared to the baseline for that wave type. The ratio uses the average output in the waveform (as a percent of total “power” output).
2.1.4. Serious Game Description
Master’s students have designed a serious game as part of the Multimedia Techniques and Technologies course. All components and design technology were based on the Gamelearn platform [
22]. The scope of the game was to teach users the basic concepts of artificial vision and image processing in an interactive way, using storytelling, explorable objects, and minigames.
Game Structure: The game is structured in three scenes, each with a distinct environment, interactive characters, and activities that contribute to the accumulation of points and learning.
Exposition: Rebeca, a young woman passionate about technology and digital art, begins her career at an innovative start-up called “VisionBloom”, a company that uses artificial vision to analyze and improve works of art and visual creations. She receives a special mission: to develop a system that can recognize tiny defects or chromatic imperfections in digital paintings and modern art products.
Growing Action: On her journey, Rebeca discovers how computer vision works and what image processing means. She chooses high-resolution cameras and lighting systems suitable for artistic analysis and learns to process images and detect imperfections in color, sharpness, and fine details.
Climax: Rebeca must set up the system for an international modern art exhibition. Everything must work perfectly on time.
Falling Action: After several tests and delicate adjustments, Rebeca manages to create a system that accurately detects defects.
Resolution: VisionBloom becomes famous, thanks to Rebeca’s solution, and she wins the “Young Innovator of the Year” award. Her dream of combining technology and art comes to life.
Gamified elements:
Scoring systems per action.
Minigames for testing and fixing knowledge.
Automatic notes for review.
Game elements:
Artistic 3D cameras.
Objects: paintings, laptops, image processing software.
Points system with badges in the form of butterflies for each successful mission.
Creative games to “touch up” pixelated images.
Decisions: choosing the ideal color combinations.
Challenges (minigames):
Selecting the right camera for scanning art (choice of three).
Correcting a noisy image (filter puzzle).
Choosing the right color space (RGB versus HSL) for artistic analysis.
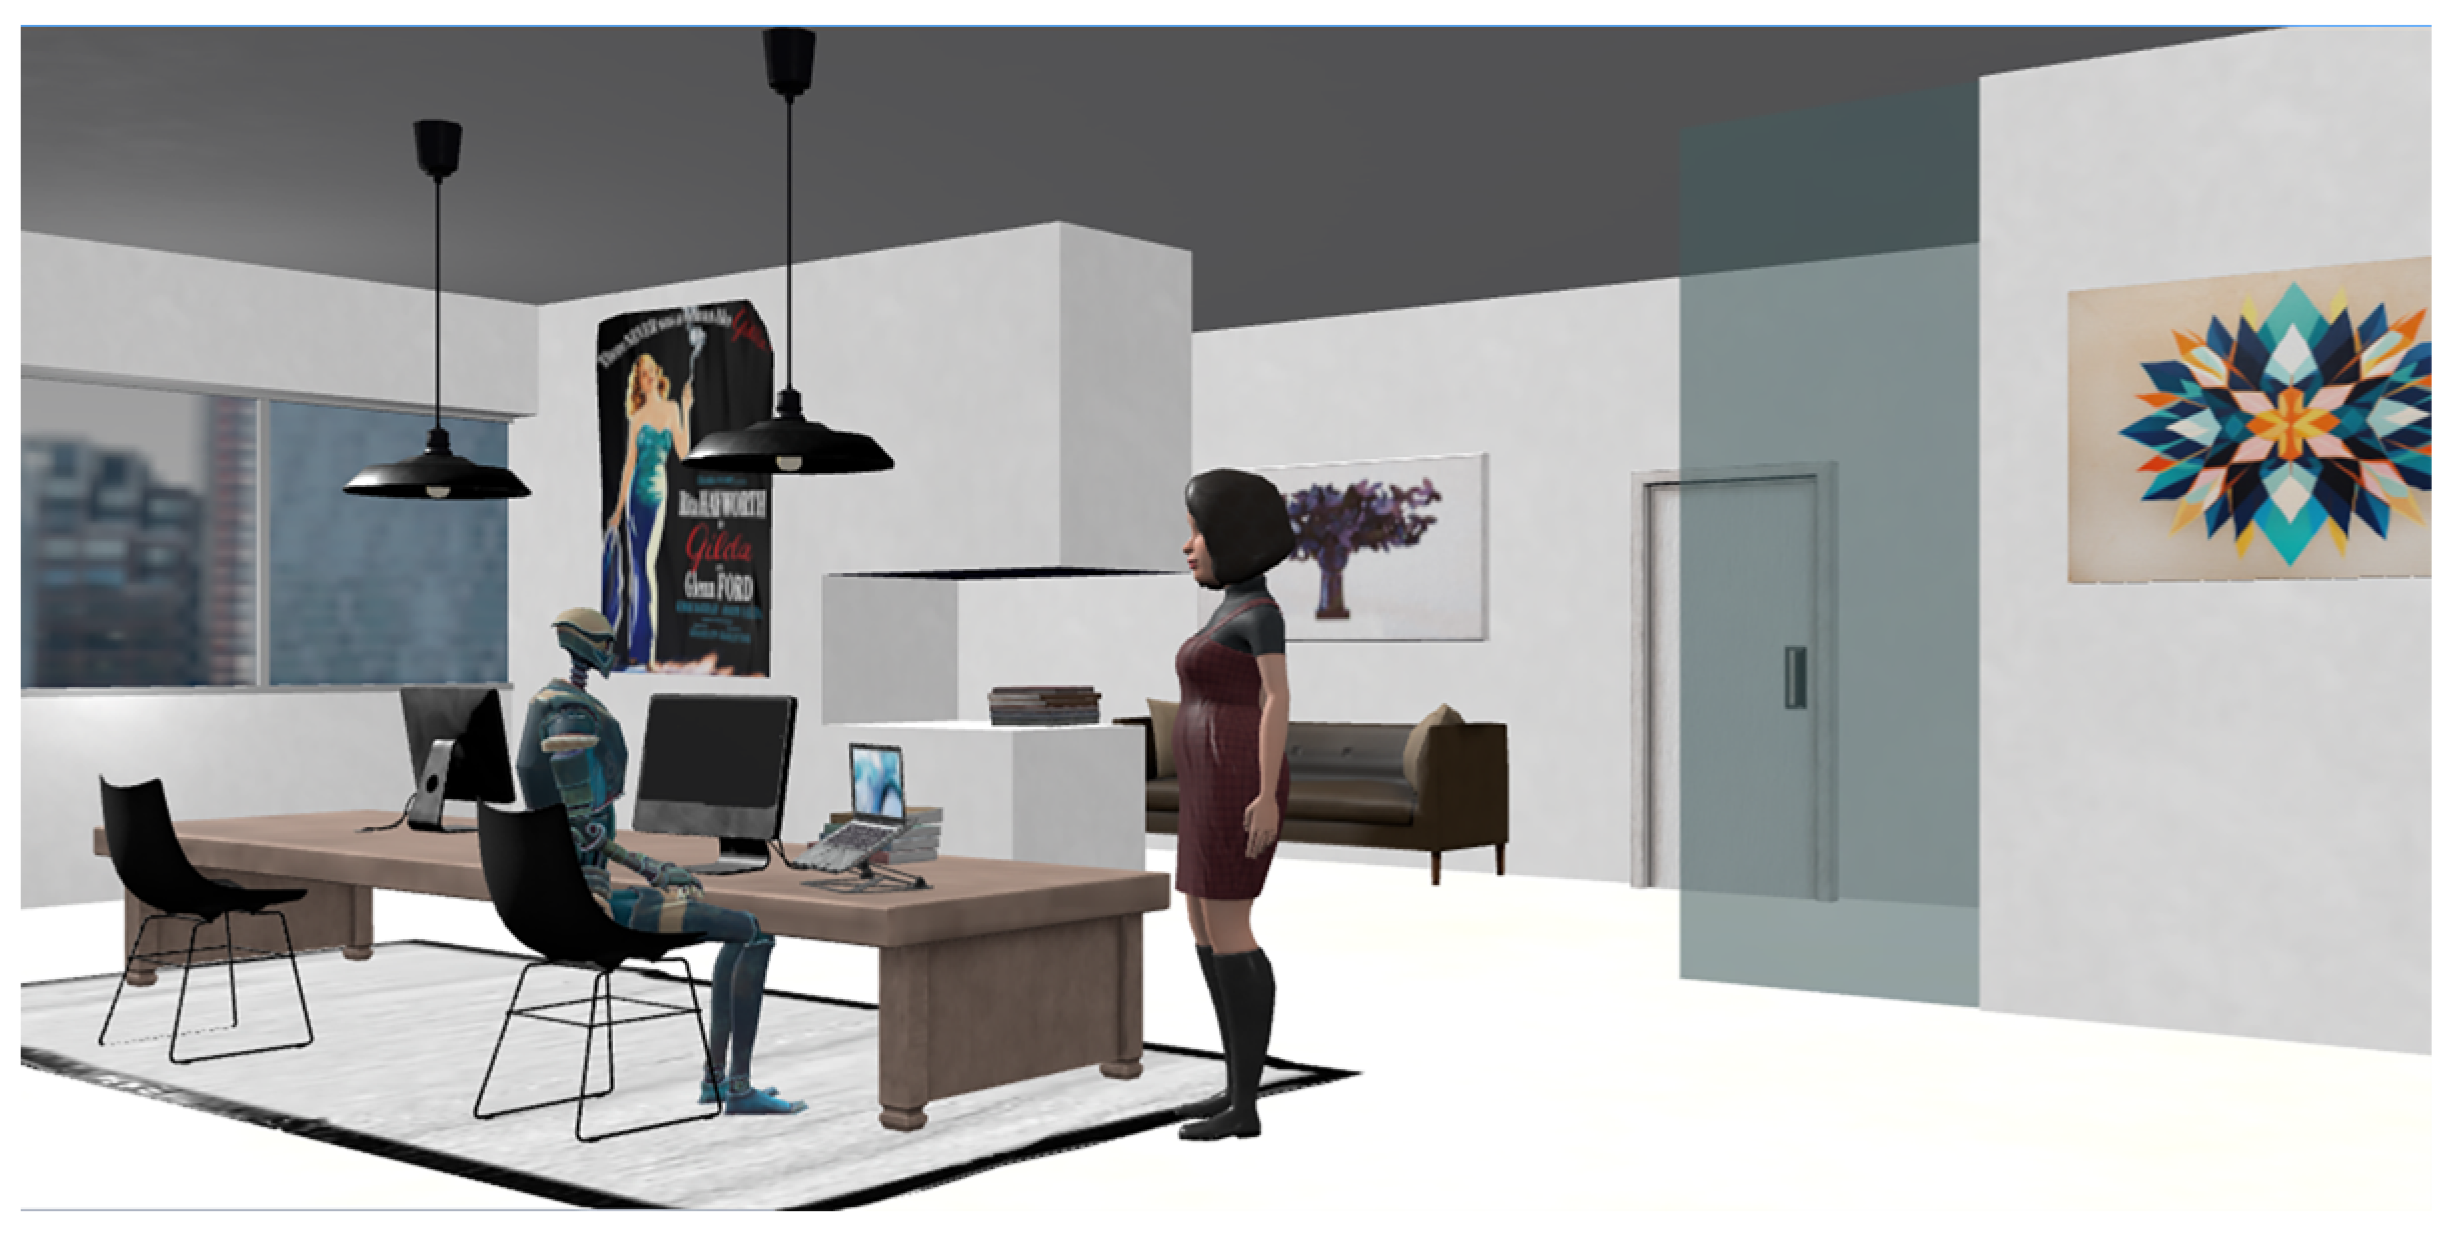
The experiment was designed in two phases. The first phase, lasting 5 min, involved reading a text that presented definitions and concepts related to Computer Vision, serving as a baseline activity completed in Scene 1 (
Figure 5). The second phase of the experiment, which represented performance activity, consisted of 5 min spent solving minigames in Scenes 2 and 3. The difficulty levels have been tracked by progression metrics that track how players advance through levels. The success rates were counted as a percentage of players completing each level. Other metrics implemented were time to completion, challenges of various difficulty (easy, medium, and hard), and error rates that count mistakes or incorrect actions during gameplay.
The required hardware and software for brainwave measurements were installed on a laptop running Windows 11 OS, and the serious game was presented on another computer.
2.2. Workflow Design and Setup Protocol
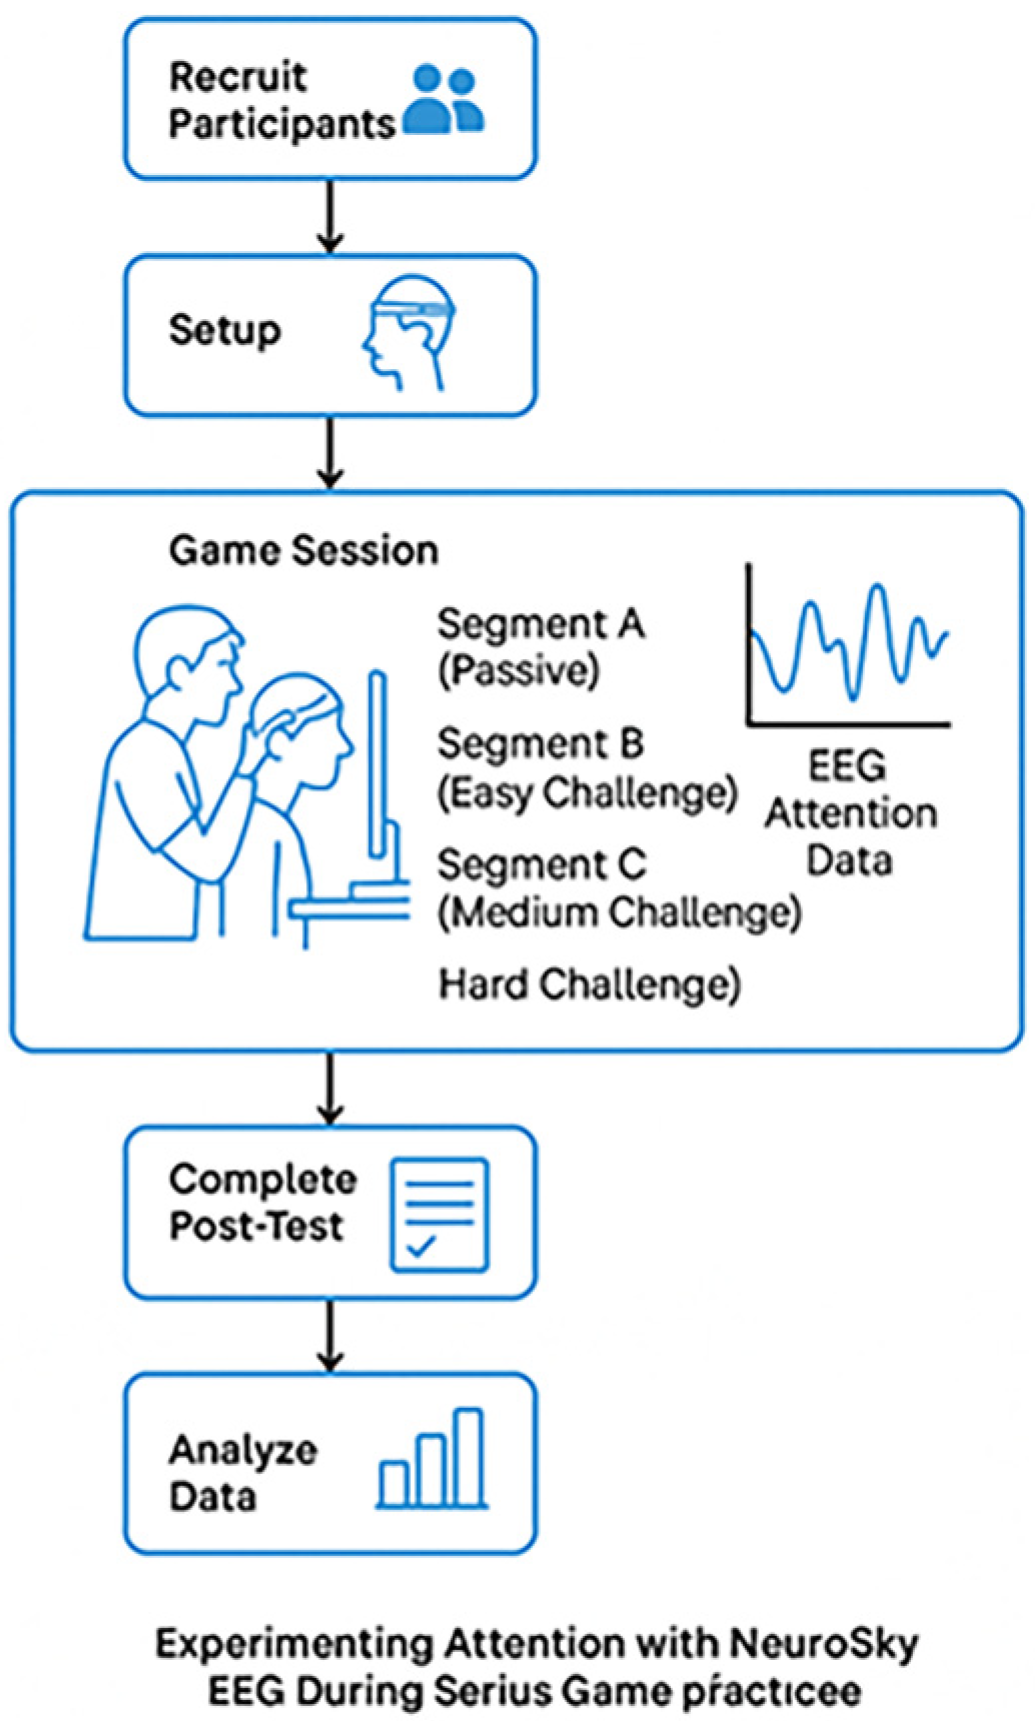
The workflow designed for this experiment is presented in
Figure 6.
We began by recruiting participants. The cohort consisted of ten volunteers who attended the Multimedia Techniques and Technologies course, which was delivered as part of a master’s degree in advanced Programming and Databases during their first year of study. Inclusion criteria included the absence of neurological disorders, normal vision, and no prior serious gaming experience.
During the setup phase, we explained the study to participants and obtained informed consent (see
Supplementary S1. Consent form). The next step was to calibrate the NeuroSky headset and ensure signal quality [
23].
During the game session, the participants played the serious game in two segments, namely
Segment A (Passive–Baseline): Instructions, definitions of concepts, or storytelling (5 min).
Segment B (Active Performance): minigames solving tasks (5 min).
We created a log file to capture data in R format (see
Supplementary S2. Collected Data). The session timer specified the time for the whole session. Beeps sounded at the end of the baseline, at the end of each short phase, and at the end of the session. When the session ended, the headset was automatically disconnected.
The baseline timer ended the first part of the session and started the second part (the “performance” part). Summaries were maintained to compare performance with the baseline.
Attention values and other brain waves have been recorded every second. The study defined independent variables, including task type (Passive instructions, Active interactive challenge) and game difficulty (easy, medium, and hard). We have also described some dependent variables, such as attention level (numerical values from NeuroSky’s attention meter, sampled every second) and control variables, including the same game for all participants, the same environment (a quiet room with consistent lighting), and the same time limit.
Post-Experiment Questionnaire
A post-experiment questionnaire based on a Likert scale [
24] was elaborated to assess the participants’ level of motivation, perceived difficulty, and prior knowledge. During the post-game phase, participants completed a post-test questionnaire to evaluate their learning gain, perceived difficulty, and engagement (See
Supplementary S3. Post-test question).
To assess the reliability of the post-experiment feedback, we have applied Cronbach’s Alpha (α) measure of internal consistency reliability for Likert scales. It assesses how well the items measuring the same construct “work together”. Thus,
- ○
Values of α ≥ 0.7 are generally considered acceptable.
- ○
Values of α ≥ 0.8 are good.
- ○
Values of α ≥ 0.9 are excellent.
- ○
Low alpha (e.g., <0.6) suggests that the items are not measuring the same construct consistently.
Cronbach’s Alpha (α) was calculated using Equation (3).
where
k is the number of items in the scale (i.e., the number of Likert items measuring the same construct).
ΣVi is the sum of the variances of each item.
Vt is the variance of the total scores on the scale (i.e., the variance of the sum of each participant’s scores across all items).
For our post-experiment questionnaire, designed with five items and five scores for the Likert scale, we obtained an α of 0.87, meaning that the items are reliable. The calculus was achieved in R and is presented in
Supplementary S4. Cronbach_alpha.R file.
2.3. Statistical Analysis
Brain waves are electrical signals generated by the activity of neurons and can be classified according to frequency [
25]. The leading EEG frequency bands analyzed in this study are as follows:
Delta: 1–3 Hz—associated with deep sleep and regeneration processes.
Theta: 4–7 Hz—related to light sleep, dreaming, and creativity.
Alpha1: 8–9 Hz; Alpha2: 10–12 Hz—appears in relaxed states with the eyes closed, indicating a calm state.
Beta1: 13–17 Hz; Beta2: 18–30 Hz—associated with active mental activity, concentration, and decision-making.
Gamma1: 31–40 Hz; Gamma2: 41–50 Hz—involved in complex cognitive processes such as memory and integrated consciousness.
The attention metric provided by the ThinkGear chip was calculated internally using a proprietary algorithm called eSense [
26], which analyzes the EEG spectrum in real time, focusing on activity in the Beta and Gamma bands. The resulting value is a score between 0 and 100, where
0–20 indicates a total lack of focus.
21–40 represents low but active attention.
41–60 reflects functional attention, appropriate to routine tasks.
61–80 indicates effective mental involvement.
81–100 suggests maximum attention, specific to complex tasks.
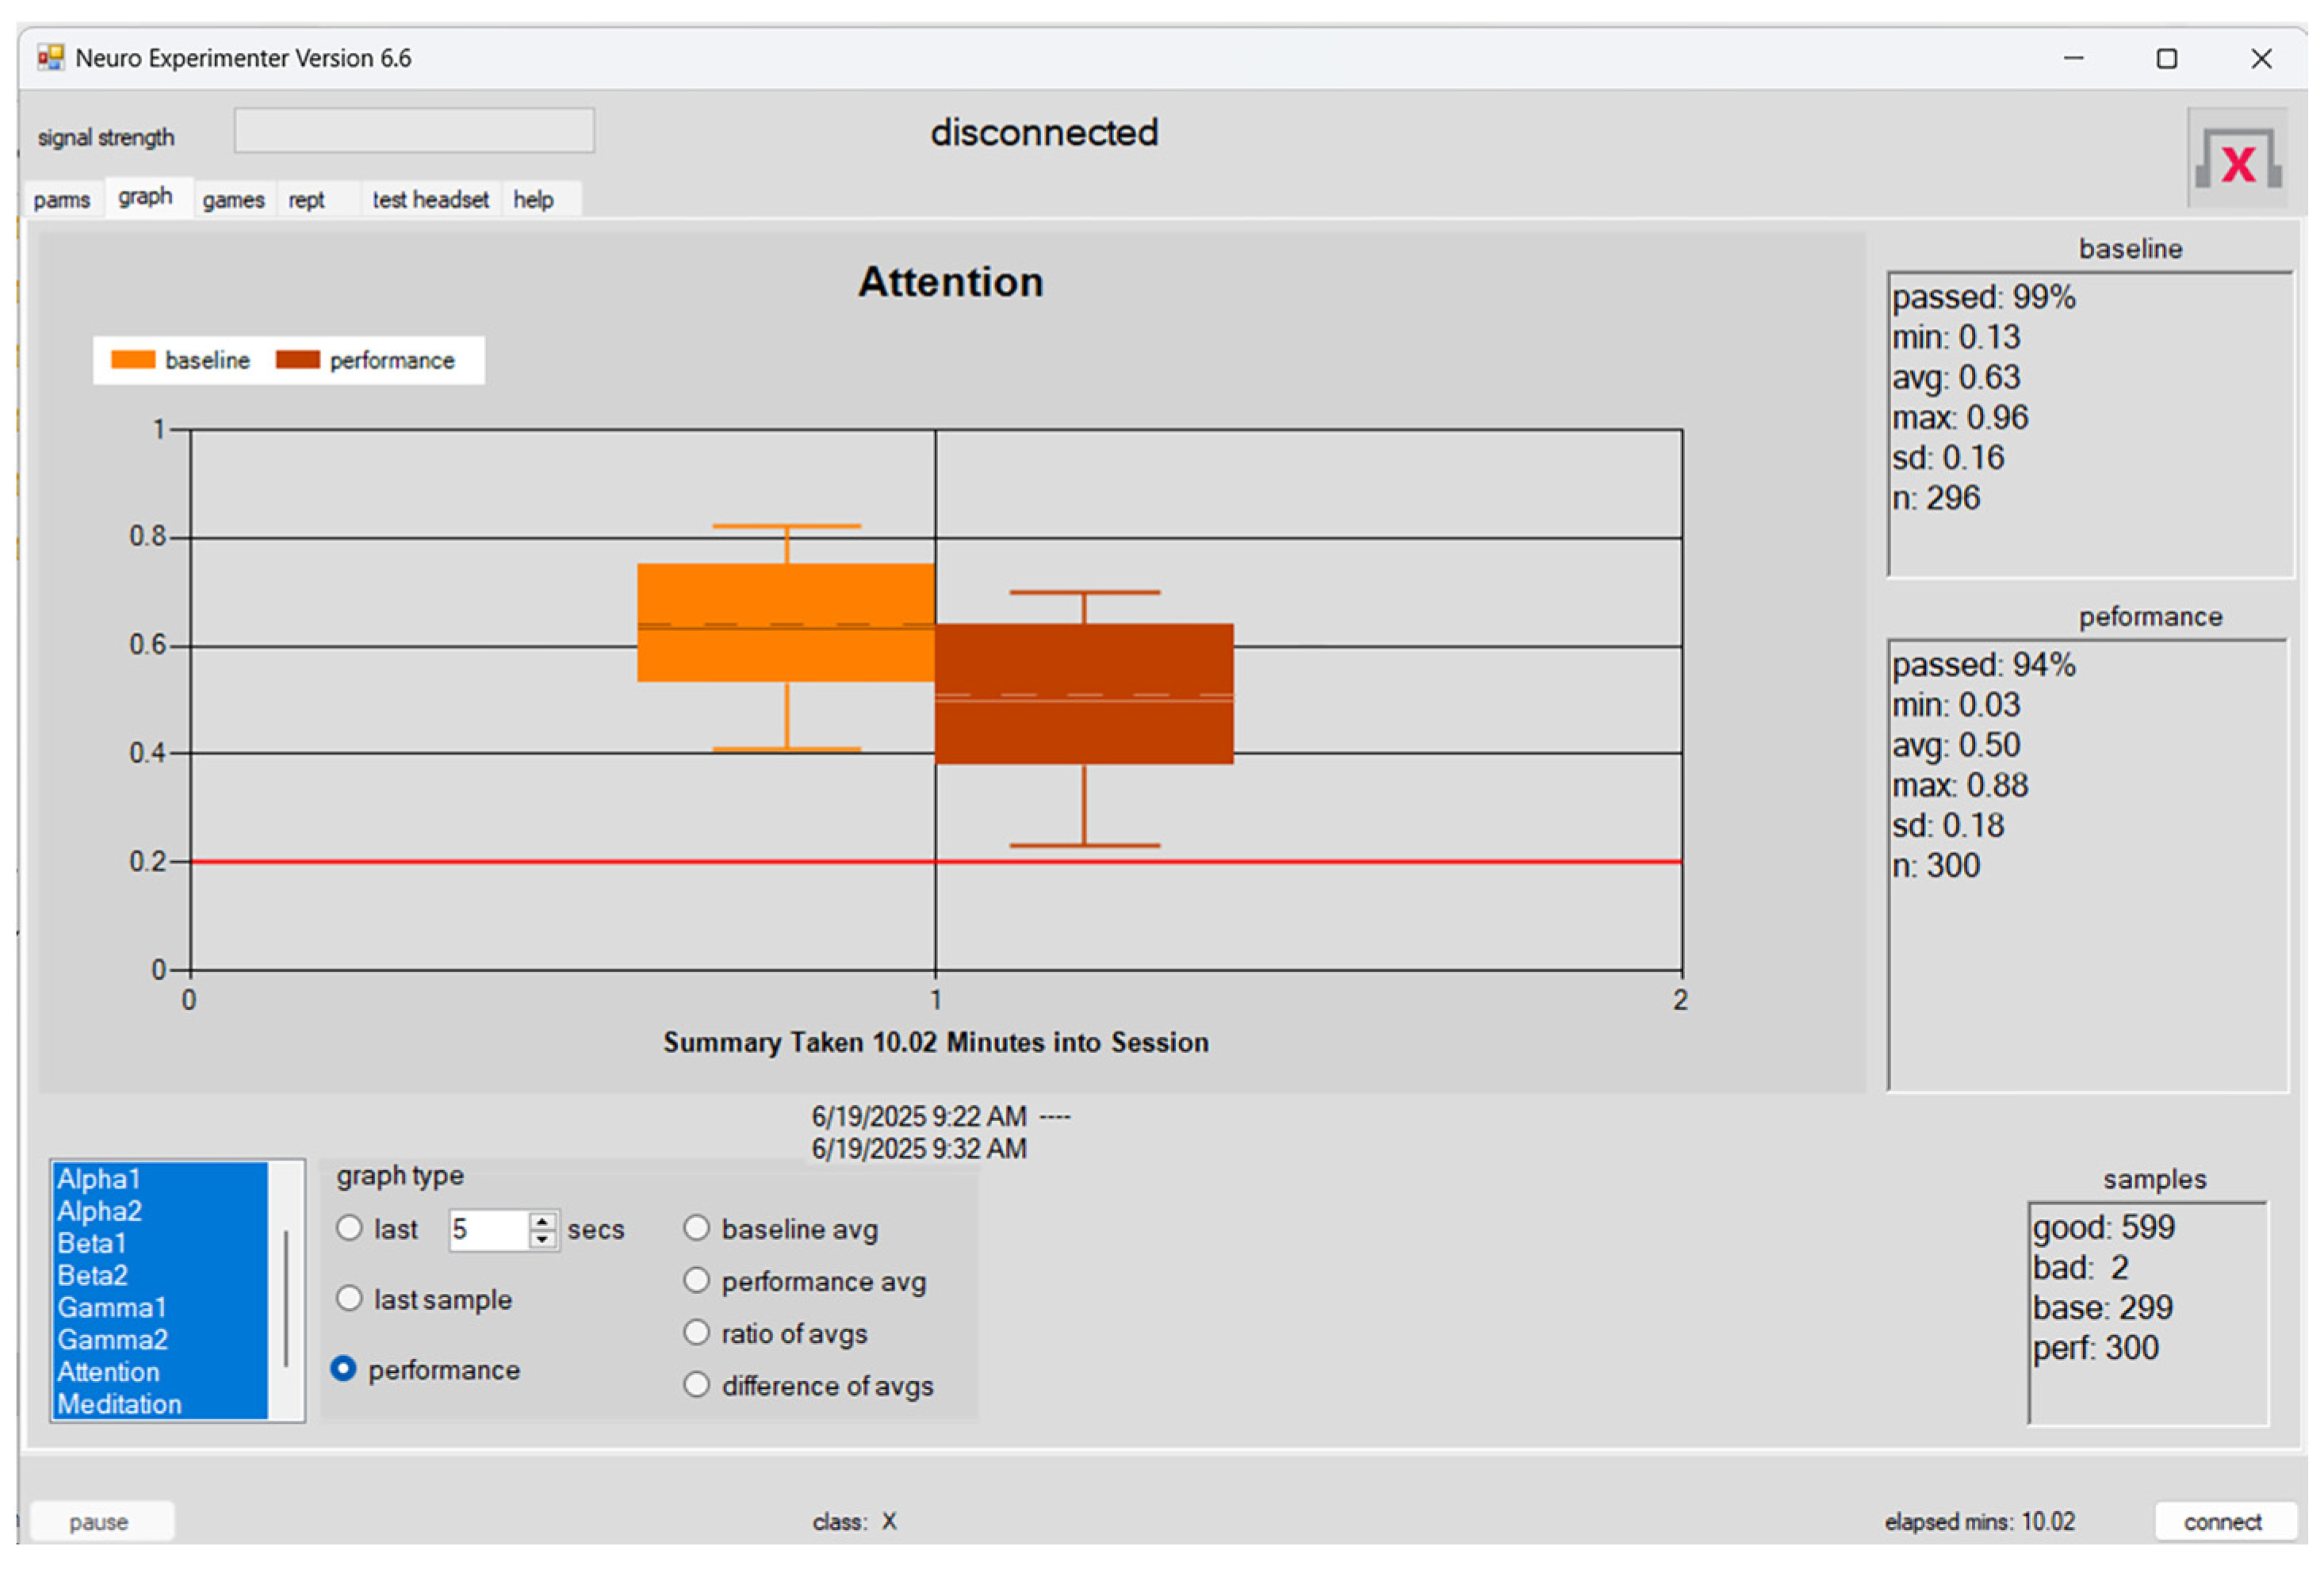
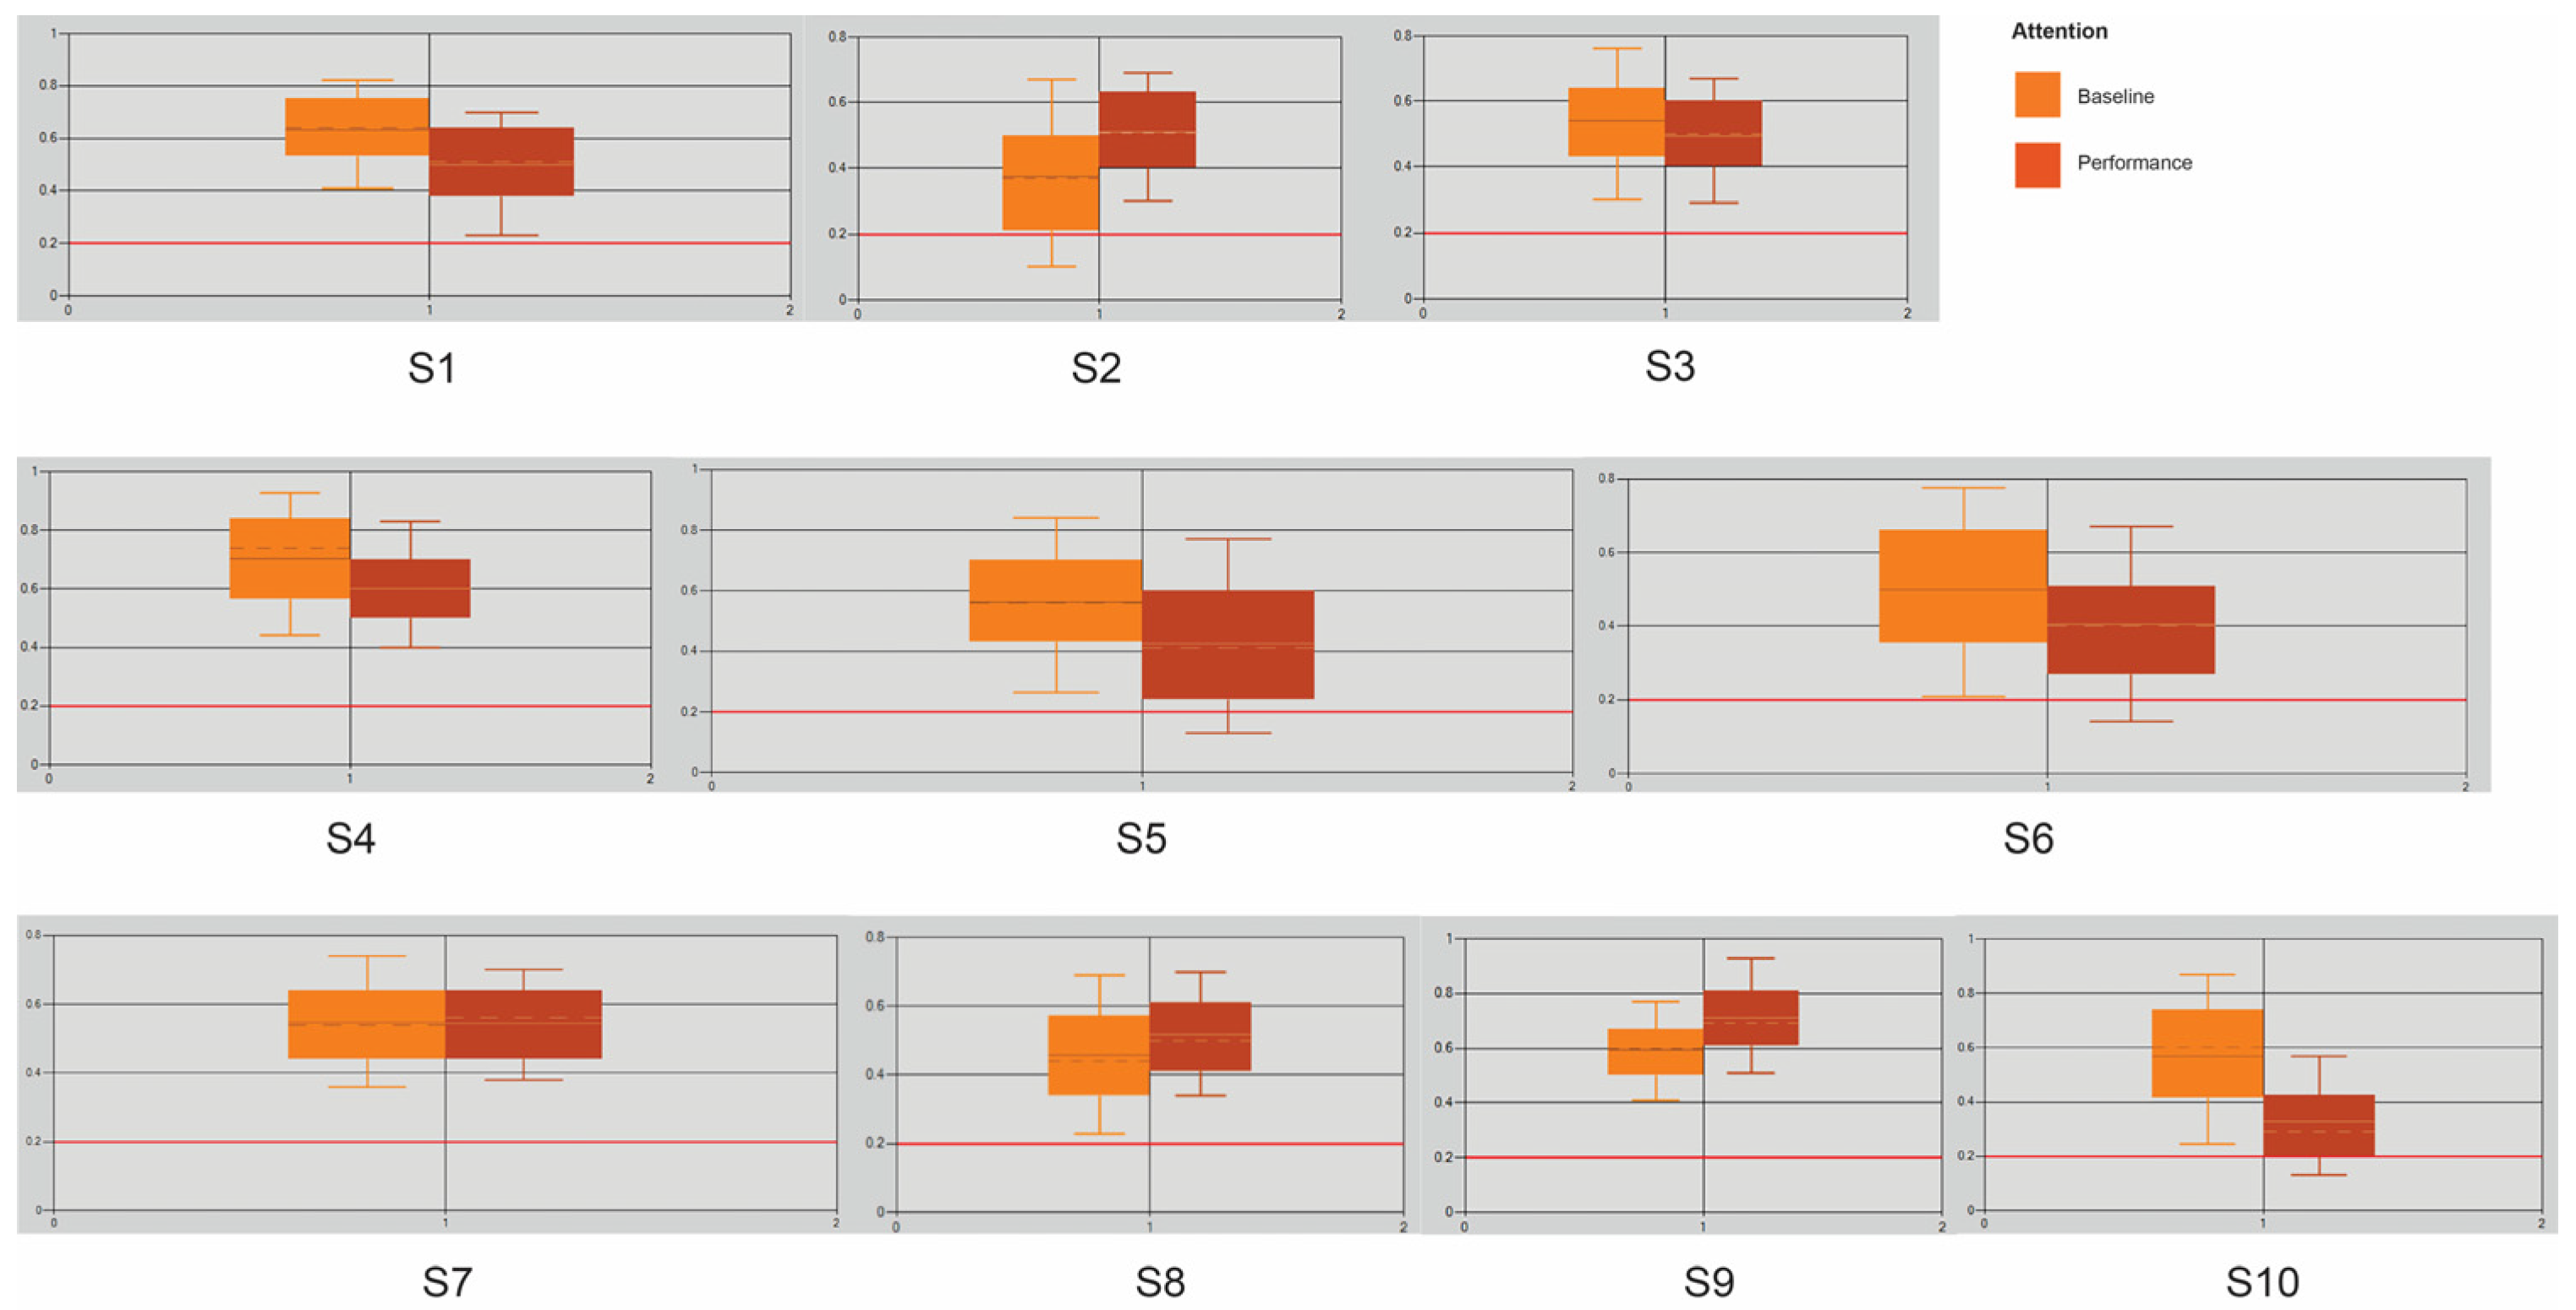
To measure performance in attention, we used a box plot, as shown in
Figure 7.
After selecting a performance wave type (in the parameters settings menu), the performance graph shows box plots and summary data (including the percent of samples that passed the grading logic)—the pass/fail logic for classifying a sample.
The dashed lines in the boxes represent the data median, and the solid line represents the average. The bottom and top of a box mark the 25th and 75th percentiles; the lower and upper whiskers mark the 10th and 90th percentiles. When it is in range, the red line indicates the minimum selected for the performance grading (in the parameters settings menu), which determines whether a sample passes or fails.
All the graphs display the sample/record box. The total samples are divided into good and bad signals (as determined by the headset, bad samples are discarded by the NEx software), and the total sound samples are collected during the session’s baseline and performance (post-baseline) parts. When replaying a log, the “good” count is the number of records read. All the graphs display the sample/records box. One can determine which part of the session is the base by observing whether the perf sample counter increases (
Figure 7).
Data analytics was performed using R and Python languages, R Studio [
27], and with the following libraries utilized: ggplot2, dplyr, readr, gridExtra, reshape2, and standard statistical and inferential tests.
Data processing implied data cleansing by removing missing values (NA) and negative values; normalization of values between 0 and 1 for comparative analysis, and aggregation that combined data from all files into a unified dataset. t-test applied for hypothesis testing.
2.3.1. Data Structure and Nomenclature
The sample collected comprised
n = 10 subjects, which we term
s1,
s2…
s10. For each subject
si, we have time series data across a set of channels.
spanning
T ≃ 600-line entries, each corresponding to measurements in each channel at a given point in time, where the temporal resolution is 1
s elapsing with each line. The channels of interest will be
The latter, A, is a proprietary compound measure provided by the EEG manufacturer and quantifying task engagement through Attention. For this, we will further denote an instance of a measurement for subject i on channel c ∈ C at fixed time t ∈ [1, T] by si (c, t).
The total period of the time series is further categorized into two segments: 1 ↔ K ≃ T/2, called the Baseline segment, and the K + 1 ↔ T, called the Performance segment, which is further subdivided into contiguous equal parts of size ≃ (T − K)/2 measurements each. These three subdivisions have, in order, marked difficulties: Easy, Hard, and Medium.
In the t-test, we will test,
H2. Attention levels will be higher during the interactive segments.
Which we will term the Alternative Hypothesis. This is a within-subjects (or paired) design, where the same students are measured under two conditions: Baseline (passive) and Performance (active) tasks. We wish to determine if there is a statistically significant difference in attention between these two conditions.
Given a fixed channel c ∈ C′, for each subject
i, we will first define attention summaries for the Baseline and Performance segments as follows.
We let
Denote the mean difference, across all the students, in attention scores (active–passive) for the fixed channel c. Namely,
Under these definitions, we are then concerned with a one-tailed test, for which our Alternative Hypothesis, for the fixed channel cm, can be rewritten as
while its corresponding null hypothesis for that channel is
Now, since this is a paired dataset (each student is measured twice), we will utilize a Paired Samples
t-test (also known as a dependent
t-test) with test statistic
tc and sample standard deviation.
We compare the computed t-value for our sample to the critical value t
n−1,α from the t-distribution with n − 1 degrees of freedom [
28] and a set significance level of α = 0.05. In our setup, from the look-up tables, this critical value ends up being t
9,0.05 = 1.833. Finally, if now t
c > t
9,0.05, we can conclude that with statistical significance α = 0.05, we can reject the Null Hypothesis H
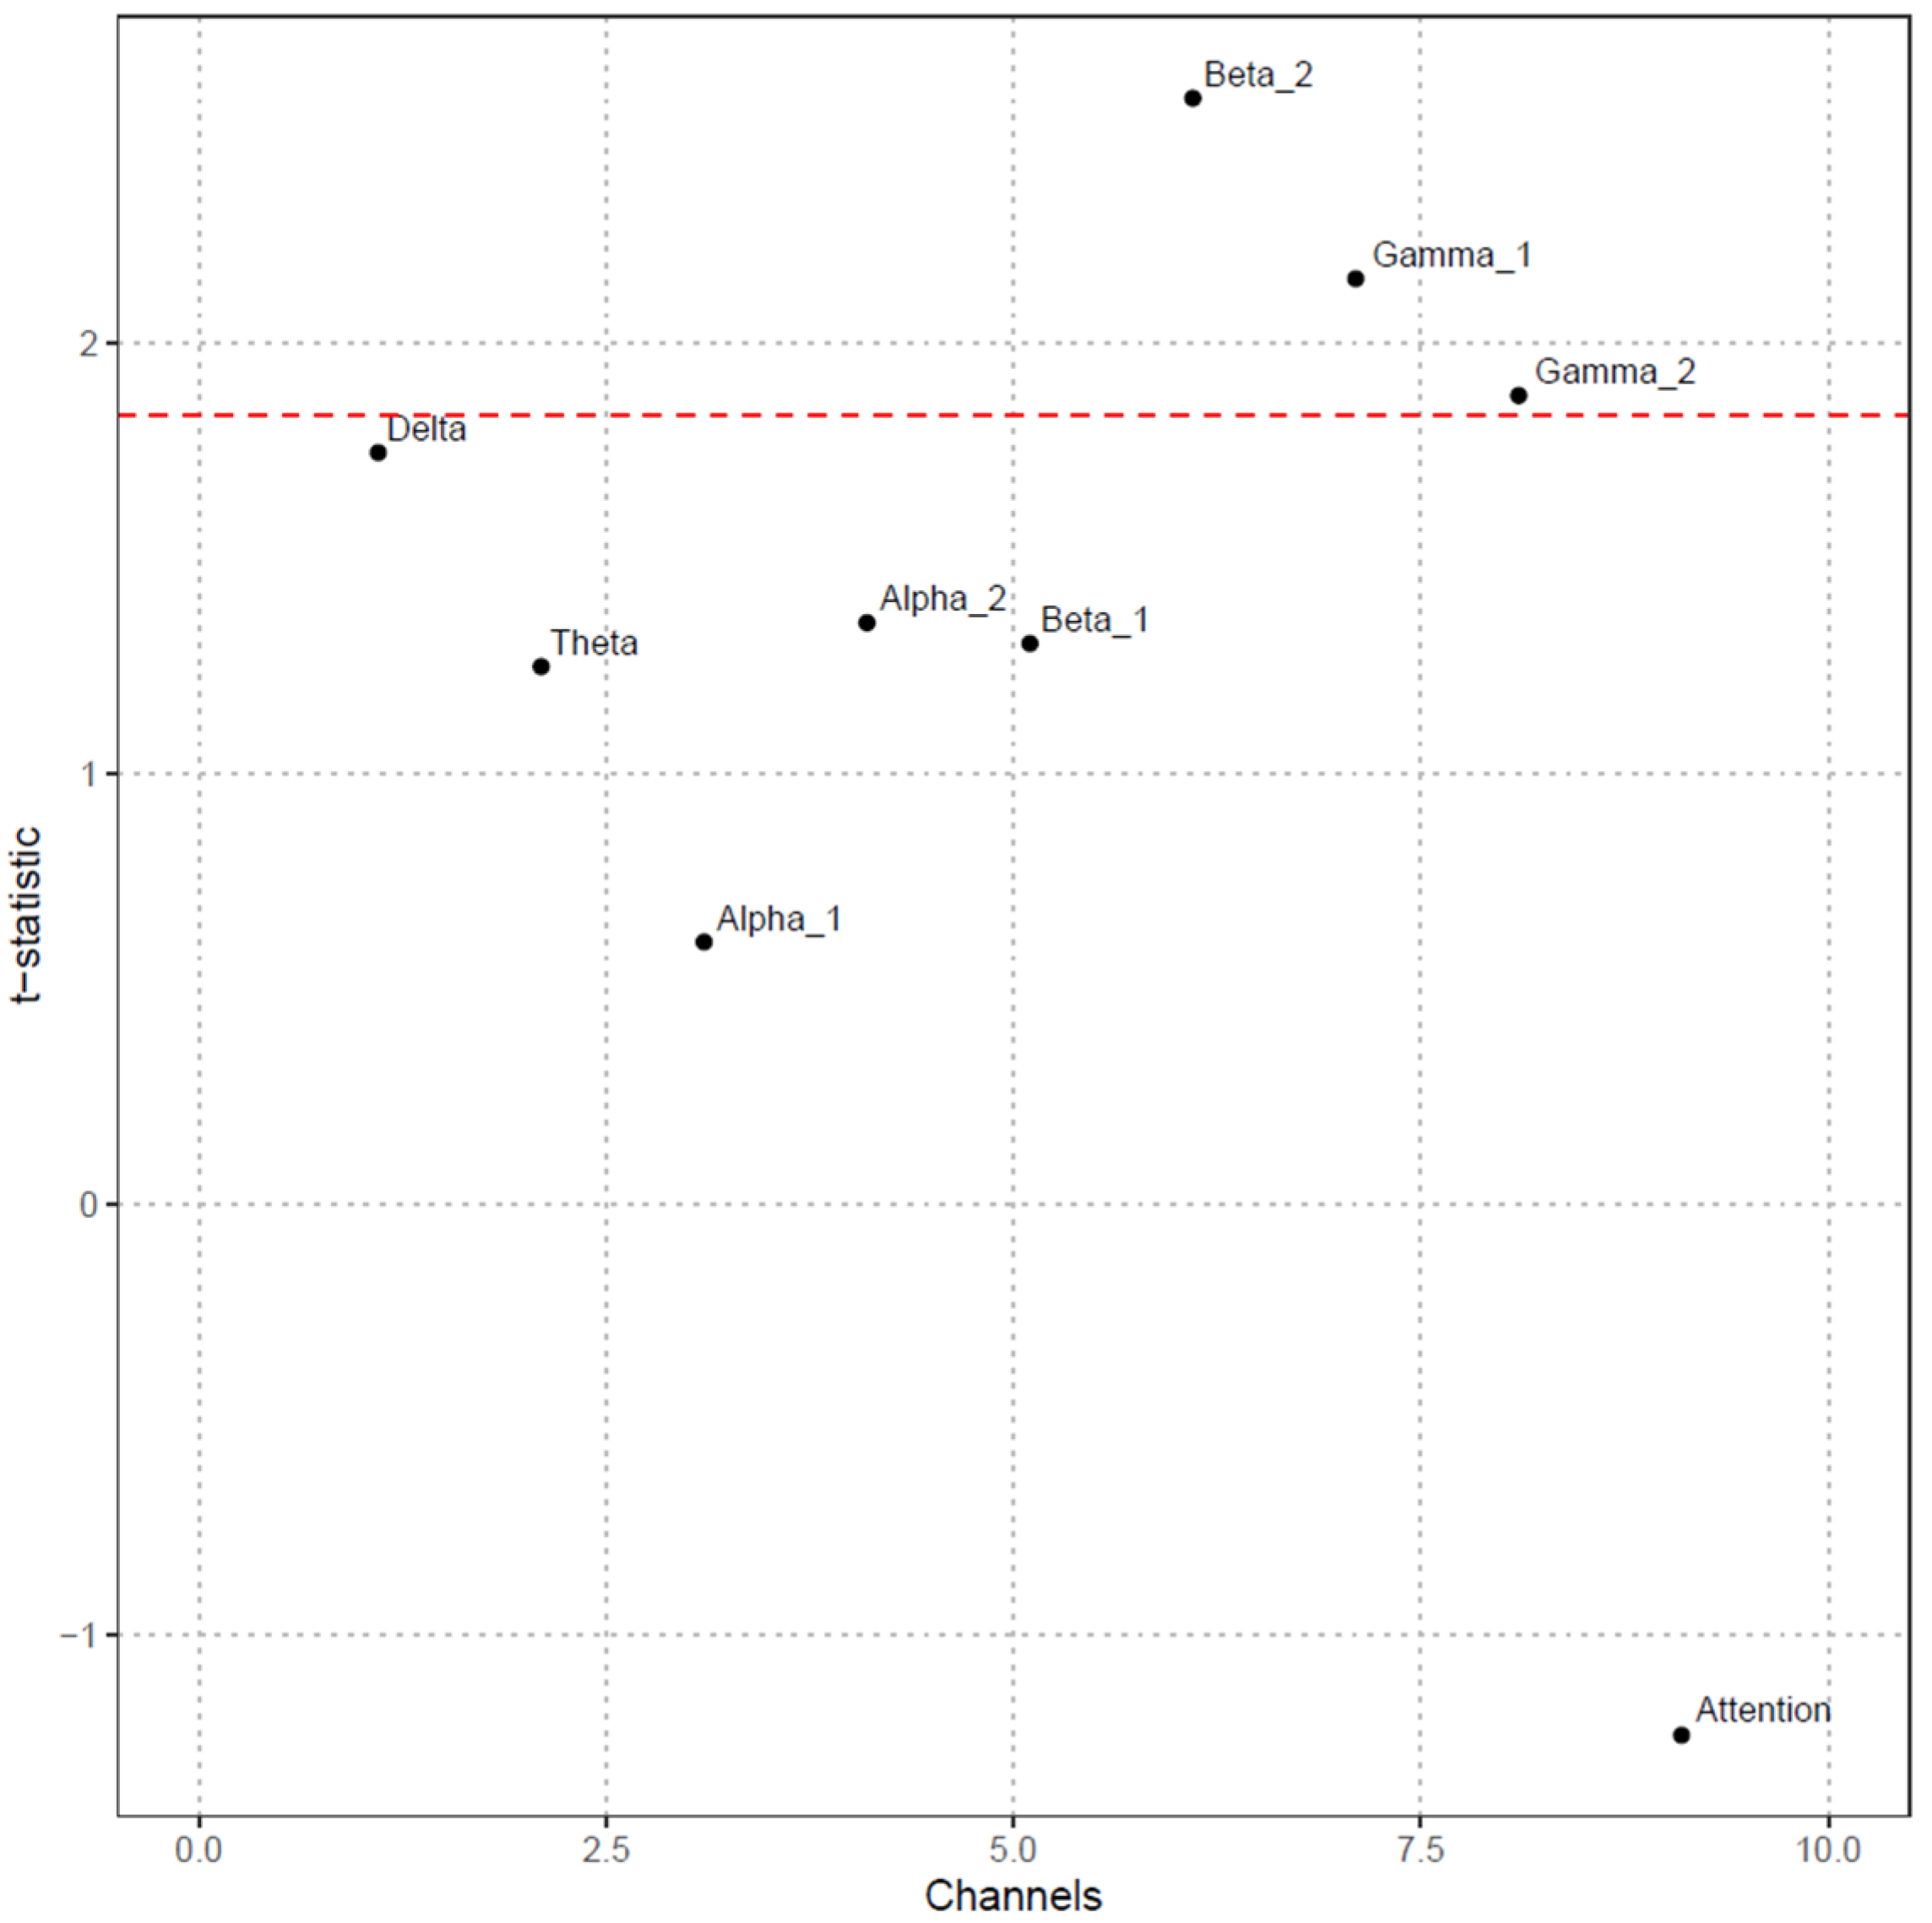
0, i.e., we can conclude that, for channel c, our Alternative Hypothesis, that c-attention levels are higher during interactive segments, is in fact supported by our sample data. We present a summary of this computation for channels c ∈ C′ in
Figure 8.
In
Figure 8, on the x-axis, we have the C′ channels, while on the y-axis, we have their t
c statistic. The horizontal red line represents the critical value t
9, 0.05 = 1.833. For channels c with t
c values above the line, their corresponding Null Hypothesis can be rejected, and the Alternative Hypothesis holds with significance α = 0.05. As disclosed in
Figure 8, only Beta 2, Gamma 1, and Gamma 2 are significant enough to be investigated for attention differentiation between passive and active phases.
2.3.2. Channel Correlations for the Active and Passive Phases
We denote, by
sBi (
c,
t), the Baseline segment of measurements for student
i on a fixed channel
c ∈ C′, and similarly, by
sPi (
c,
t), the Performance segment, respectively. For each student
i, we then compute a channel correlation matrix in each of the two segments as follows. Denote by
The channel-specific averages in each segment for the fixed student
i. The channel correlation matrix in each of the two segments, for the fixed student
i, element entries indexed by pairs of channels (
c,
c′) ∈
C × C′, given by
and, respectively,
Here, the entry
is the correlation between the measurements on channels
c and
c′ for student
i on the Baseline segment, while, similarly,
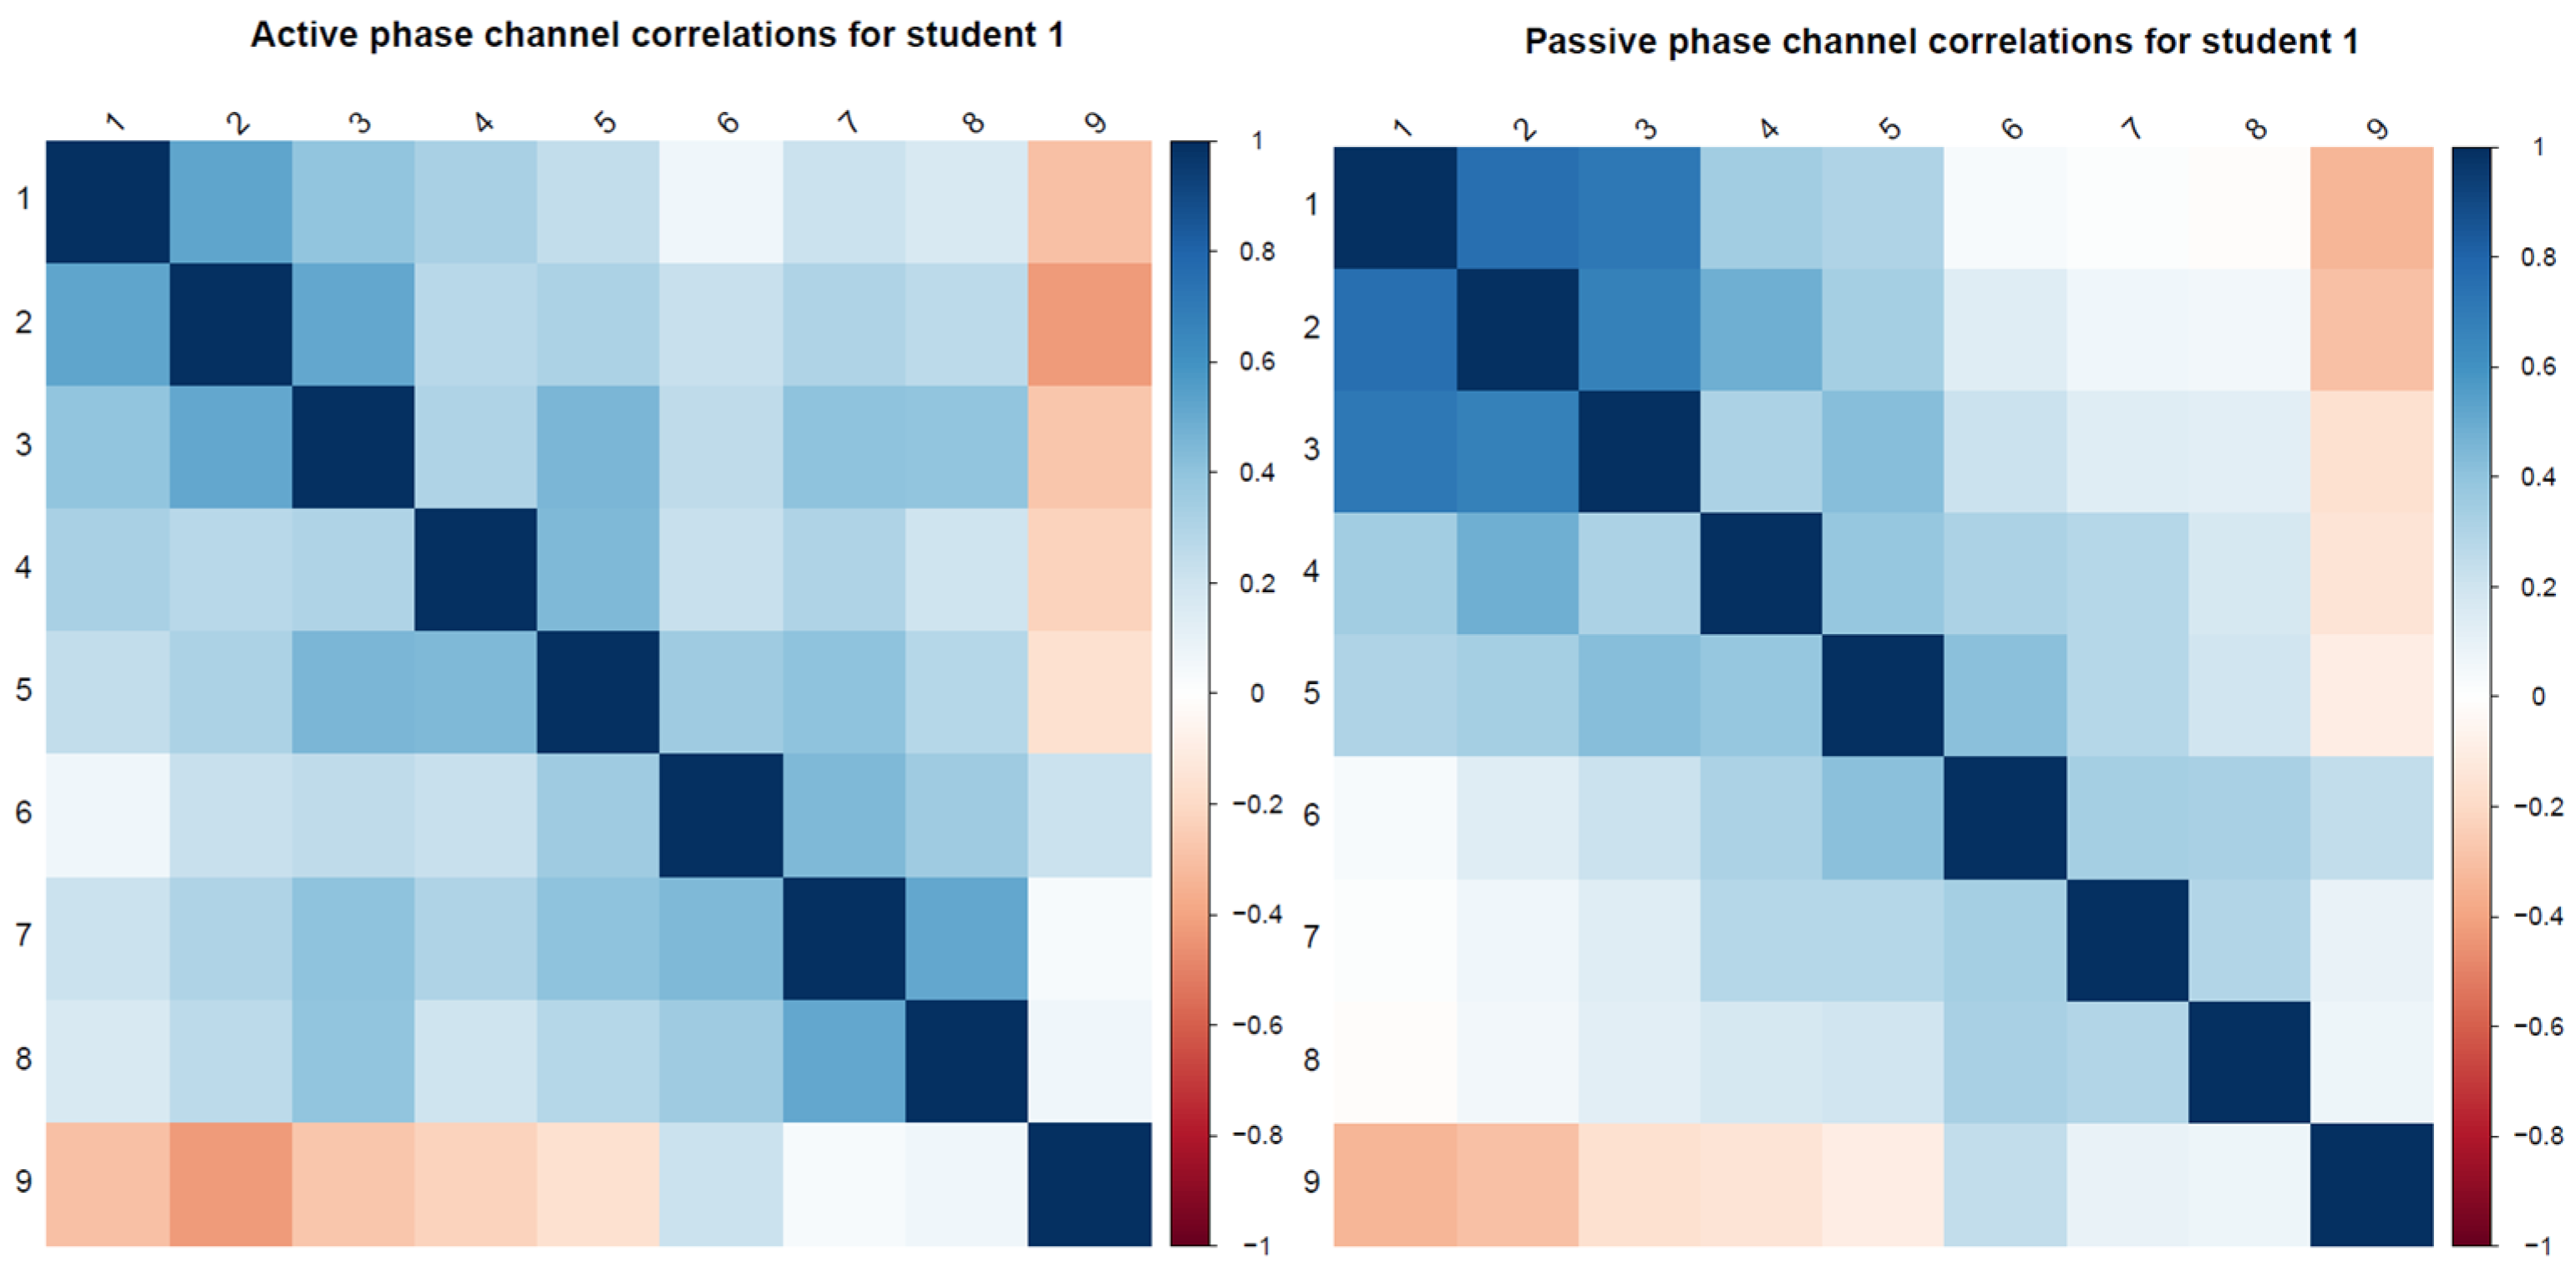
is the exact channel pair correlation, but on the Performance segment. The matrix heat plots of this calculation for each student and each segment can be found in
Supplementary S4.—heatmaps of active–passive correlations. In
Figure 9, we present the heatmaps for the active phase and passive phase channels for student S1.
3. Results
We applied the experiment defined in the previous section to ten anonymous participants named S1 to S10. The data captured during the experiment can be accessed in
Supplementary S2. Collected_data_Rformat. Level of attention during the whole session, divided into a baseline phase and a performance phase, is presented in
Figure 10.
Based on the collected data (see
Supplementary S2. Collected_data_Rformat), we analyzed the average attention levels during the baseline phase and the performance phase. The ratio of the attention averages for the baseline and performance phases is shown in
Figure 11.
3.1. Data Variability
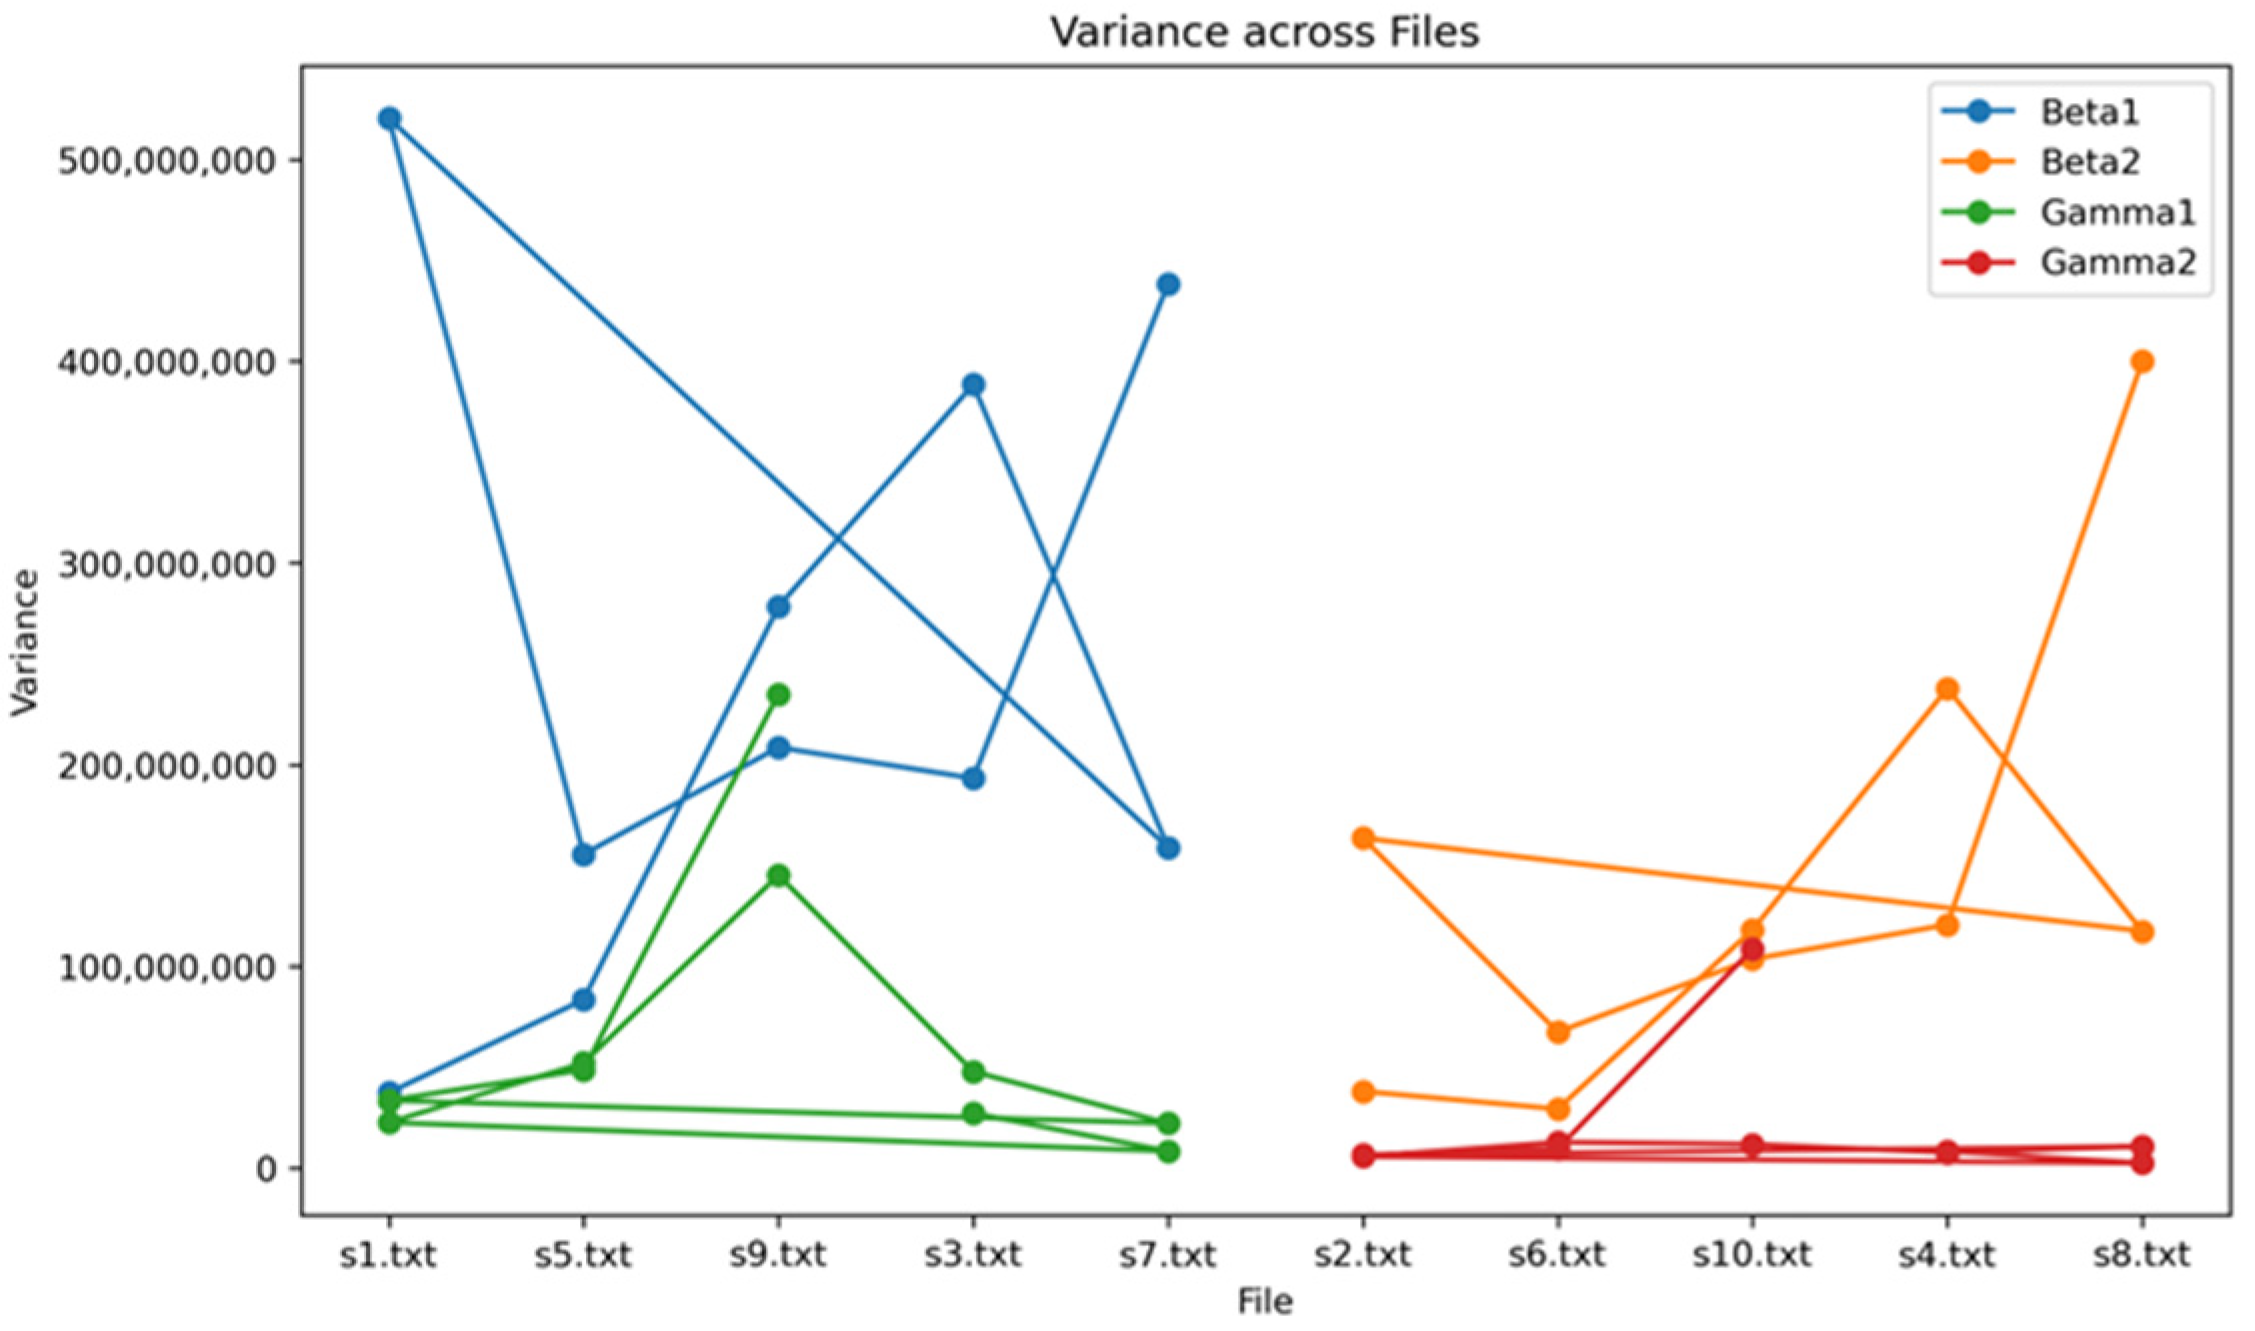
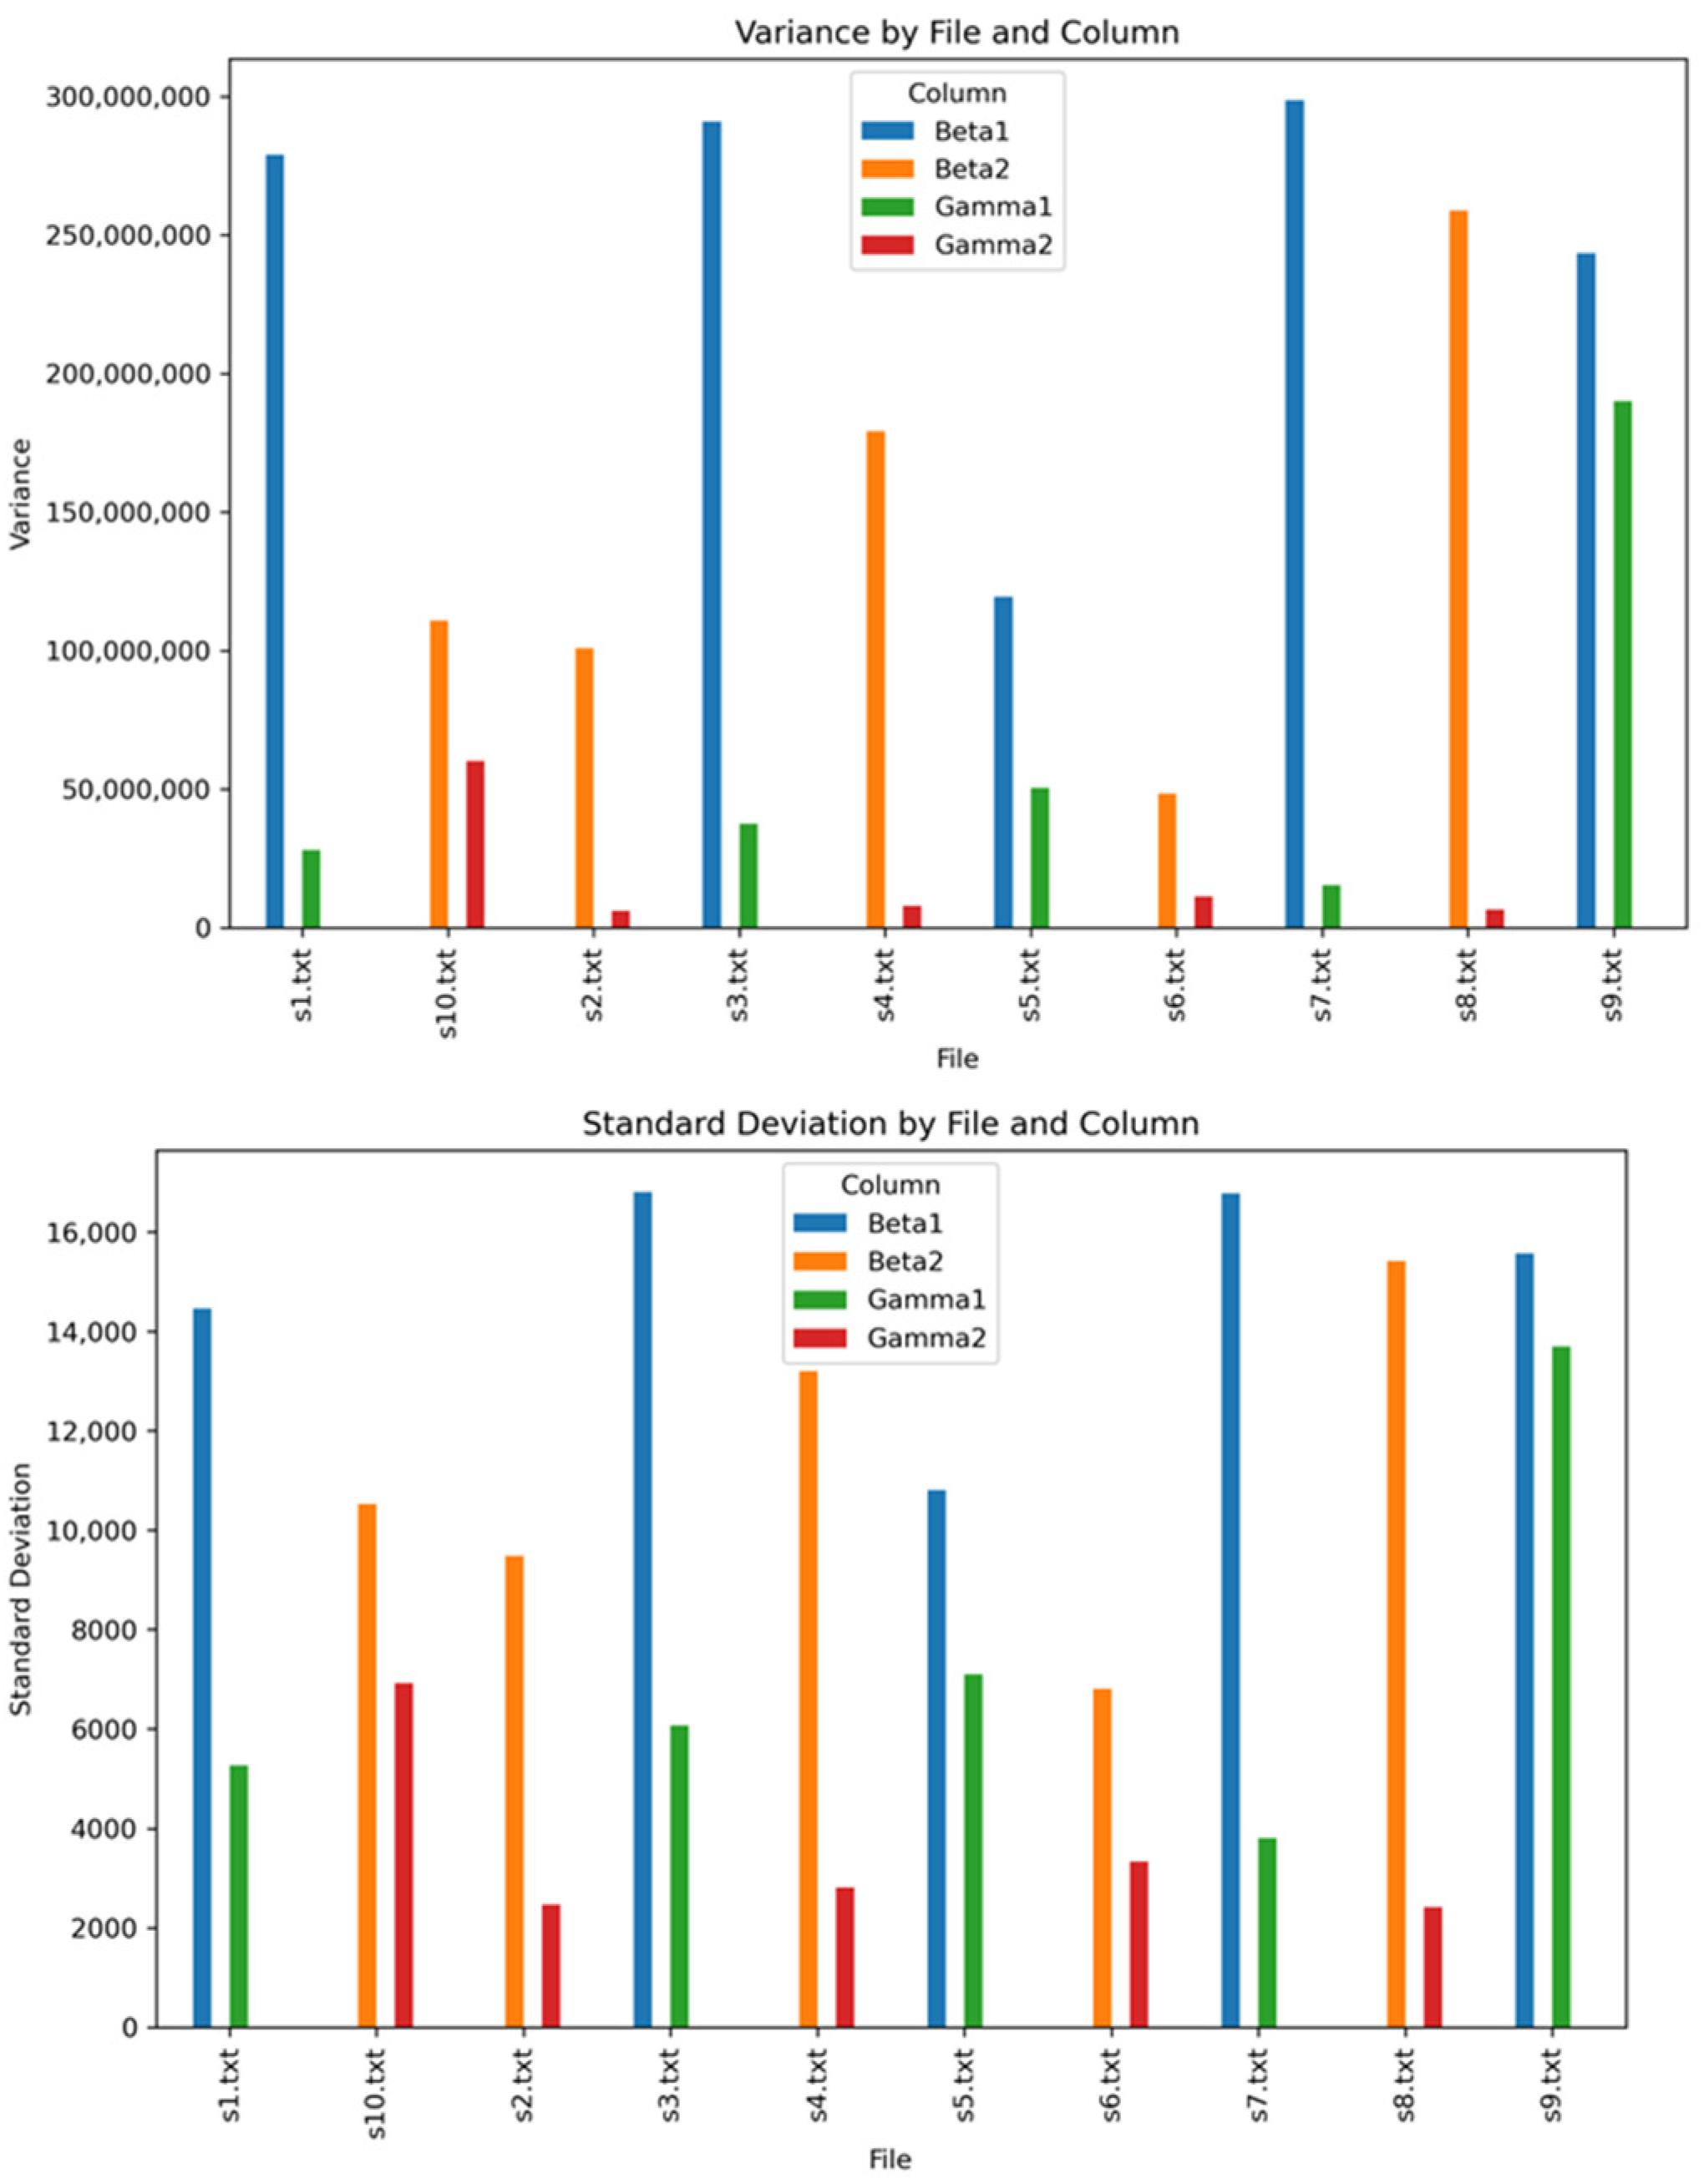
Beta1 Variability: The standard deviation of Beta1 is generally higher than other values, indicating that, across all recordings, Beta1 tends to have the most significant fluctuation when compared to its average value (
Table 1,
Figure 12,
Figure 13 and
Figure 14).
Lowest Variability: Gamma2 consistently has the lowest standard deviation across all recordings, suggesting its values change less compared to Beta1, Beta2, and Gamma1.
S3.txt consistently has the highest standard deviation for the Beta1 frequencies. This might mean that something different was happening during this recording that impacted the frequencies.
Gamma Wave Observations: Gamma1 and Gamma2 both generally have lower SDs than Beta1 and Beta2.
Focus and Gamma Activity: low Gamma1 and Gamma2 variability also correspond to periods of deep focus. This could support the idea that these brain wave frequencies stabilize during focused mental states [
29].
Stress or Cognitive Load: Higher Beta1 activity is often associated with heightened alertness, anxiety, or cognitive processing (e.g., complex tasks, distractions). The high Beta1 variability in those files could reflect these challenges.
Individual Differences: If specific individuals consistently show different patterns of variability, this might highlight baseline differences in their brain activity.
Artifacts or Noise: Abnormally high variability in any variable could also be due to artifacts in the data (e.g., muscle movements, electrical interference) [
29].
Based on the aggregated results:
Overall, Beta variables (especially Beta1) dominate in terms of variability, while Gamma variables show much smaller values.
File-Level Highlights
Beta1:
Beta2:
Gamma1:
Gamma2:
3.2. Post-Experiment Results
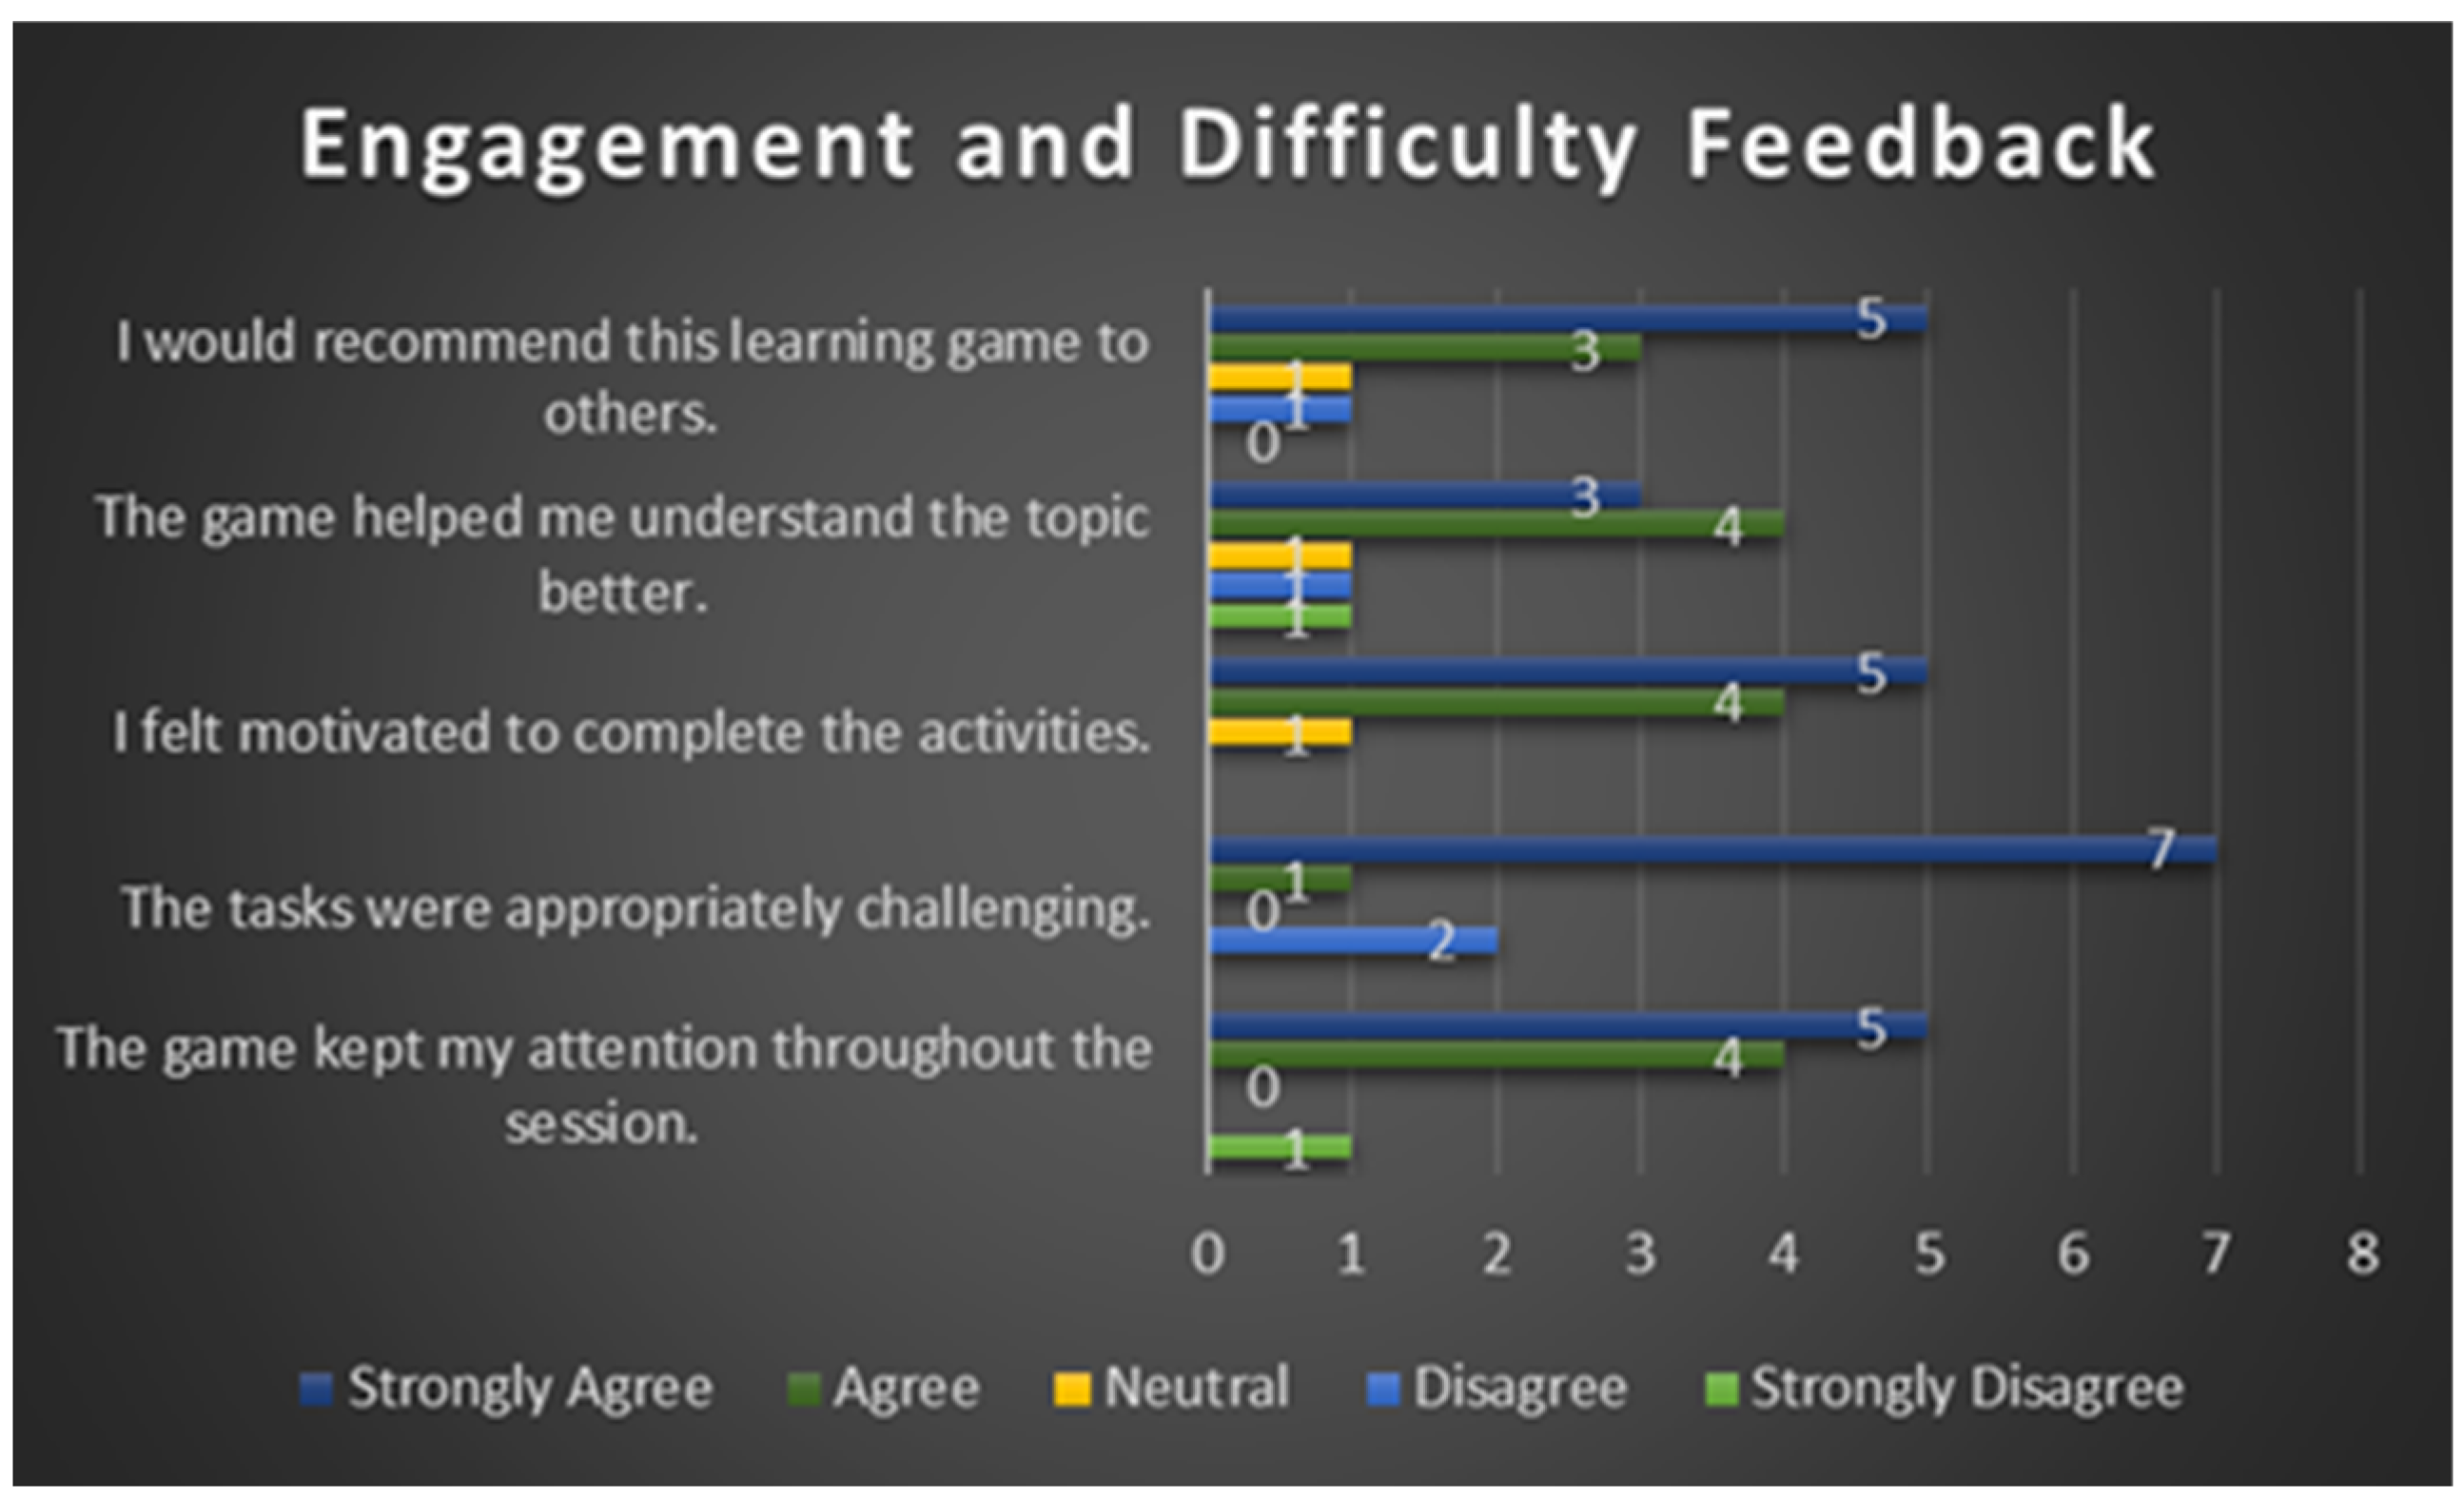
The results of the post-experiment questionnaire are presented in
Figure 15. The questionnaire indicates that the educational game-type activity appears to stimulate participants’ attention more effectively. Beta and Attention brain waves, associated with concentration and cognitive processing, had higher values during gameplay. At the same time, there are significant differences between participants—some react better to reading, while others react better to interactive games.
This experiment provided a fascinating insight into how different activities can influence attention, and the use of EEG sensors as an objective measurement method was helpful and instructive.
4. Discussion
The data collected have been analyzed, and the results of both experiment phases have been corroborated. We noticed attention peaks during medium-difficulty tasks in four cases (s2, s7, s8, s9). Higher attention correlates with better post-test scores (nine cases). Participants report the highest engagement at the optimal challenge level (nine cases).
For our study, based on the t-test results, beta 2, gamma2, and gamma3 were significant. Beta 2 (20–30 Hz) is linked to intense focus, high engagement, and sometimes stress or hyperarousal, sustained attention, and task-related engagement under demanding cognitive tasks. Gamma Waves (30–100+ Hz) are associated with high-level cognitive functioning, perception, conscious awareness, working memory, and attentional control. These are present during intense focus, learning, and problem-solving [
29].
To increase the effectiveness of serious games, it is essential to enhance their educational quality and engagement value while ensuring they align with broader learning goals. Some strategies can be drawn from our results:
Design the game around specific, measurable learning goals.
Include reflection activities to help students connect the game experience with real knowledge.
Include in-game assessments to track progress and provide immediate feedback.
Enable data collection for teachers to monitor student learning.
Utilize adaptive learning to tailor the difficulty and content to everyone’s performance.
Design tasks that mirror real-world situations to support transfer of learning.
The game can adjust difficulty, pace, or content to maintain optimal engagement (not too easy, not too hard).
This supports the concept of dynamic difficulty adjustment (DDA) based on cognitive state.
The system can detect signs of cognitive fatigue by monitoring attention levels. The game can introduce rest periods or switch to less demanding content to prevent burnout.
By user experience and game testing, developers can utilize attention metrics to conduct user testing of game prototypes, pinpoint where users lose interest or feel overloaded, refine the game to maximize flow and engagement, and utilize neurofeedback for focus training. Some serious games aim to train attention themselves (e.g., for ADHD or cognitive therapy). NeuroSky allows neurofeedback loops, where players receive visual or auditory feedback based on their focus level, reinforcing attentive behavior.
A neurofeedback game designed for ADHD therapy reported improvements in attention and cognitive performance, with one subject’s accuracy in puzzle-solving increasing from 74% to 98% after repeated MindWave-based game sessions [
30].
Limitations
Due to limited resources and the difficulty of recruiting participants, we were only able to collect data from ten students. We acknowledge that this small sample size limits the generalizability of our findings. Also, the homogeneity of the participant group, which consisted solely of master’s students in computer science enrolled in the same course, limits the statistical power of our analyses and the generalizability of our findings to other populations. However, there is diversity in the sample (e.g., age range between 21 and 40, gender imbalance of three feminine and six masculine) that may slightly contribute to the generalizability of our findings. While the small sample size limits the quantitative results, the qualitative data obtained from the post-experiment questionnaire provide valuable insights into the overall evaluation of students’ experiences regarding serious games as a means of acquiring specialized knowledge. These insights inform future research and interventions.
The results of this study should be interpreted as preliminary and exploratory, given the limitations of the sample. Future research will continue using larger, more diverse samples to confirm the generalizability of the findings. We will further investigate the effects of the type of subject designed for serious games, students’ profiles, and level of computer literacy on the level of attention and concentration in different student populations.
The MindWave headset can track general attention trends (e.g., increased focus when concentrating). Still, its single-channel design, susceptibility to noise/artifacts, and inconsistent attention algorithm limit its reliability and accuracy for precise or clinical-grade applications. It works reasonably well for casual neurofeedback, learning, or hobbyist projects; however, for rigorous research or control systems, its performance is significantly restricted [
30].
5. Conclusions
EEG-based BCIs offer a non-invasive and continuous approach to assessing attention levels, allowing for dynamic adjustments to game mechanics. Studies have demonstrated the feasibility of using EEG signals to monitor attention and adapt game features accordingly, leading to improved user engagement and learning outcomes [
31,
32].
Serious games are more effective when pedagogically grounded, well-integrated, and learner-centered. They should not replace traditional learning but complement and enhance it by offering interactive, motivating, and personalized experiences.
The NeuroSky headset, a consumer-grade brain–computer interface (BCI), measures brainwave activity—specifically, attention and meditation levels—using electroencephalography (EEG). In the context of serious games, it opens new possibilities by providing real-time data about player attention, which can be used to adapt gameplay, improve engagement, and enhance learning. Some of the outcomes of this study are as follows:
Brainwaves such as Beta2, Gamma 1, and Gamma2 in correlation with Attention data can help customize learning paths.
The game might present more complex tasks if a user shows sustained attention.
The game could introduce breaks, hints, or motivational elements if attention fluctuates.
Traditional assessment relies on tests or observations; NeuroSky provides quantitative EEG-based feedback. Designers and educators can use this data to evaluate which parts of the game maintain or lose attention. They can also identify learning activities that are too boring or too demanding. NeuroSky Mindwave can detect when a player’s attention drops.
The outcomes of this study contribute to the design of personalized learning experiences by customizing learning paths. Attention detection using the NeuroSky headset contributes to serious game design by enabling real-time responsiveness, customized learning, engagement analysis, and focus training. While technology has limitations in precision compared to medical-grade EEG, it provides valuable, cost-effective insights that enhance the interactivity, adaptability, and effectiveness of serious games.
Integrating NeuroSky or similar EEG tools can be a significant step toward more data-driven, learner-aware environments when designing or evaluating educational games.
