Article

Innovative Scaled Hardware Simulator for Designing and Testing an EV’s Battery Storage System Incorporated with an Adaptive ANN Model

1
Graduate School of Science and Engineering, Power System Analysis Laboratory, Doshisha University, Kyoto 610–0321, Japan
2
Yazaki Research and Technology Center, Yazaki Corp, Susono, Shizuoka 410-1194, Japan
*
Author to whom correspondence should be addressed.
Appl. Syst. Innov. 2020, 3(2), 27; https://doi.org/10.3390/asi3020027
Submission received: 12 May 2020 / Revised: 7 June 2020 / Accepted: 19 June 2020 / Published: 23 June 2020
(This article belongs to the Special Issue New Trends towards Electric Vehicle Connection to the Power System)

Abstract

:
In this study, a scaled-down system, which can be used as a benchmark test for the battery storage designing of electric vehicles (EVs) is proposed. This model was based on the hardware simulator of the battery storage system (BSS) used from a single cell up to 4 cells in a series pack system, which simulates a practical battery pack. The developed simulator can charge and discharge any rechargeable battery, such as Li-Ion, Ni–MH or Pb battery. The scaling ratio of the simulator was evaluated by the ratio of the current or power of the battery pack specimen related to the specification. Also, this study proposes an innovative state of charge (SoC) estimation of the battery pack for EVs based on genuine results obtained through practical tests. This estimation was carried out by an adaptive artificial neural network (ANN) algorithm, using simple inputs. As well, this model can deduct the state of health (SoH) of the battery pack based on the power output level and waveform characteristics. The results of the ANN showed high generalization, a low error of SoC estimation at the level of 1.1%, with a calculation time less than 16.5 s. Regarding the hardware simulator, the similarity of the results and waveform accuracy of the scaled-down battery systems compared with the real battery pack was very acceptable with a maximum deviation of 2.1% in the worst scenario. The cells cycled with different depths of discharge (DoD) or C-rates, at different temperatures with different initial SoCs using any arbitrary current waveforms. Our conclusions will help battery manufacturers to test and evaluate the performance of the BSS in different applications, such as EVs, PV generation, and wind farm, with significant cost reduction. Also, the ANN algorithm can be used and embedded in EVs or in any other industrial application, as proposed in this paper. This study contributed to the real-time diagnosis of the BSS without interrupting the normal operation based on its features.

1. Introduction

In recent years, the importance and necessity for power generation systems based on renewable power sources have become a primary focus of research [1,2]. Through the improvement and implementation of the power generation systems based on natural energy, it will be possible to solve the issue of CO2 emissions. The importance of rechargeable batteries nowadays is increasing from portable electronic devices and solar energy industry up to the development of new electrical vehicle (EV) models. In addition, the necessity for larger, efficient, and reliable storage systems is heightened. Rechargeable batteries are considered as the most common storage devices. Nowadays, the battery storage system (BSS) has been drastically improved through the improvement of battery technology and the implementation of different types of sensors to measure complex parameters such as static/dynamic temperature distribution, aging effects, increase of the internal impedance, humidity, balancing the SoC of the cells inside each module, and the ability to operate without problems during heavy stress conditions or in dynamic loads [3,4,5].
However, the actual diagnostical technology cannot make an accurate and reliable diagnosis in real-time; also it is necessary to stop the operation of the device for full service which would mean an extra cost for the non-operation of the system while in maintenance. A fast increase of the EV in the period 2020–2030 is statistically estimated based on the global institutes related to smart vehicles and EVs. This leads to the increase of rechargeable BSS mostly based on Li-Ion and its derived chemistries. However, despite the fact of increased production, it is necessary to maximize the usage of the actual batteries, as well as to evaluate how to reuse again the deteriorated battery in different industry applications.
The battery is the most important part of EVs, which provides the energy, but still another more advanced system should and needs to direct and control it for the purposes of operating everything else in the EV. The main challenges of a battery in an electric vehicle (BEV) are the limited mileage of operation, high cost, battery issues and non-standardization and undergoing optimization of charging infrastructure.
Since the batteries in a BSS are always in the charging/discharging process, its deterioration characteristics and behavior should be included and recognized starting from the early design stage of the storage system. The application fields are not restricted since the developed simulator has the capability of arbitrary current control, i.e., waveform, amplitude, duty cycle. It is useful not only for the design and test of EV’s BSS but also those of PV and wind turbine generation. In the case of the PV and wind turbine, the scaling factor of the system includes some parameters by assuming or predicting the power generation and/or load power which is affected by various parameters such as the intensity of solar radiation and wind speed.
Another important matter, which distinguishes the EV’s manufacturers nowadays, is the charging speed. The battery cells have to be developed in consideration with the capability of quick charge without suffering from a tremendous loss of age and keeping into consideration elevated temperatures which might cause ignition and explosions. These abilities affect and change the fundamental design of the battery. This design includes the chemical properties of the new batteries, by defining how their chemical structure should be formulated. On the other hand, it is important to design the pack composition in a way to satisfy the required energy and maintaining the temperature inside the allowable range. This requires an advanced cooling system, which should consider the necessity of small size, low power loss and lightweight. It is necessary to fully understand of the process in minimal detail because certain interactions are almost impossible to be calculated mathematically with real results and to be sure of the accuracy. The most challenging issue hereby is that a large-scale “dynamic” (i.e., with differential/difference equations rather than only algebraic equations) [6], including mixed-integer nonlinear programming (MINLP) difficulties which must be solved in real-time.
Software simulation cannot explain everything as a real and practical benchmark. It is necessary to develop a new hardware simulation that can test the battery pack based on the scaled-down ratio. This opens the opportunity for more advanced technologies, with lower costs during testing and manufacturing process.
In this paper, a scaled-down system for the real-time test of the battery pack for EVs is introduced. Since the hardware simulator can charge and discharge any types of rechargeable batteries as confirmed in [7,8,9,10,11,12,13,14,15], it can practically simulate the charging and discharging characteristics using a single cell up to four series connection model constituting the battery pack installed in the storage system. In order to confirm the reliability and the accuracy of the proposed simulator, real data obtained from EV tests were used to confirm the efficacy of the model. Finally, a synthesis algorithm of an equivalent circuit of each battery was implemented into the simulator using the abilities of ANN which accelerate the estimation in case of reduced data by increasing the vast of testing scenarios.
A further investigation will be made on the optimization and simplification of the ANN structure by reducing the necessary input cells for accelerating the calculation, training and estimation without sacrificing the accuracy. During estimation, the results are compared at the same time with a practical test based on unsupervised learning process (UL). If the accuracy is low, then ANN will continue to train and updating its weights until the error is reduced and the structure is finally optimized.
This helps for the implementation of real-time estimation of the SoC or SoH of the battery as well it can enrich the generalization of the model.
Although the SoH estimation is not the main focus of this manuscript, the authors are under investigation regarding this matter, and some papers are already published using the proposed MTC device as a cost-efficient method of SoH evaluation method.
In simple words, this study proposes an alternative and cost-effective approach of benchmark stress test and diagnosis of the BSS during the early designing phase comparing to high-cost industrial devices. Also, through this study it was possible to obtain an accurate SoC estimation of the BSS without compromising the high generalization of the proposed model, which can be used not only in EV’s but as well in the renewable generation system. Comparing to other methods of SoC estimation is lacking in generality, which leads to wrong SOC estimation in certain battery types. This method is based on a high accurate and reliable model in order to obtain the characteristics of the real-life battery and predict its behavior under a wide variety of conditions. In addition, it is a time saving and mobile friendly approach for low- and medium-power applications.

2. Proposed System

2.1. Hardware Configuration

The battery itself is very nonlinear with respect to temperature, SoC and SoH, which is a reflection of the remaining energy. Although the SoH and other parameters related to the quality of battery are already available in the battery system [16,17,18,19], the deterioration process is expressed through complex models. However, the model cannot be used for a numerical simulation due to its heavy computational load especially in industrial applications. That needs some kind of simplification. Recently, the computer-aided design method is widely used to improve the efficiency of the storage system [20,21,22,23,24,25]. For an accurate simulation, the battery characteristic should be included. However, the simple simulation cannot strictly consider the electrochemical reaction of the battery, because the reaction is difficult to express in mathematical forms. As a result, the battery characteristics of the storage system cannot be accurately analyzed with the deterioration characteristics.
The proposed hardware simulator with an elevated generalization which includes the ability to test different battery chemistry, a wide range of voltage and current level, as well different current waveform for the charging/discharging process, gives a better explanation to the chemical reactions, i.e., the simulator includes every battery characteristic behavior within the results. Depending on the application, the target profile is different. Some applications require high peak power with a very dynamic operation, in others, energy efficiency or safety is the primary design criteria. Fast charging could be one of the key technologies in some EVs. On the other hand, the standby operation, i.e., slow charging is allowable in other EVs having long rest periods. Optimization in the charging system is required not only for the battery itself but also for other components. The temperature of a battery is an important parameter that affects its performance and lifetime. The attached power electronics converter can be used to help control the temperature of the battery. Although the sensing system of batteries has migrated into the monitoring of individual cells, not just the overall pack, the charger unit is still external. Since the rechargeable batteries have the risk of ignition and explosion due to over-charge/discharge, a protection system, such as a battery management system (BMS), is essential to monitor and control the battery current and voltage for safety operation.
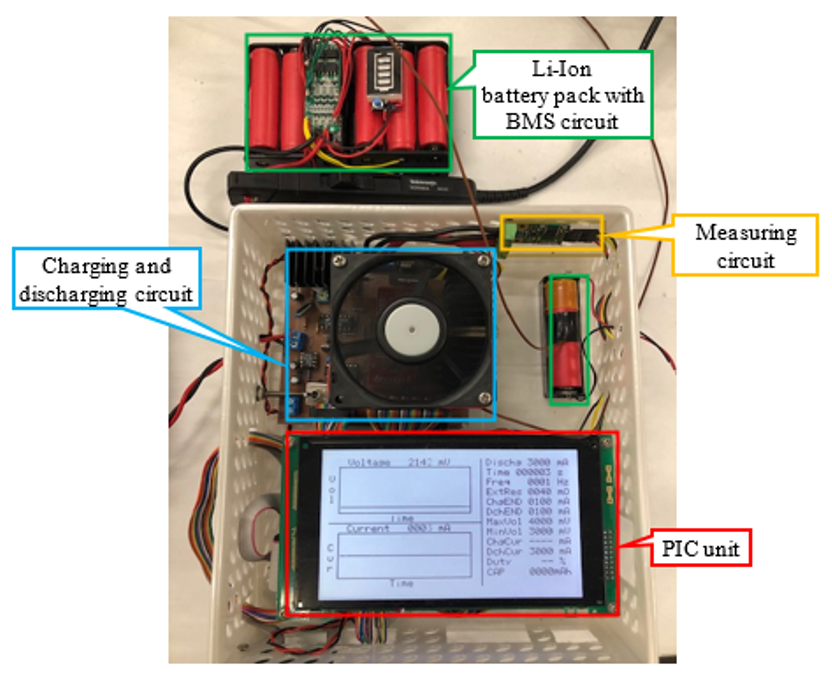
Figure 1 shows the block diagram of the proposed system. This system is developed and explained firstly by Gondo [10], and now the improved model is proposed by the first author in this paper. It is composed of three blocks: a charging and discharging circuit equipping the integrated circuits (ICs), the microprocessor board named “PIC unit” to control the battery charge/discharge, and a measuring circuit to obtain the battery voltage and current data.
The main circuit of the improved multi type chemistry charging/discharging (MTC) for the secondary-batteries is configured in the same way as the previous model, but the quality of the electronic components are improved in faster switching time, and higher voltage and current operation, also with a lower operating temperature of the components due to a better cooling system. These enhancements give the opportunity to test various battery packs. The main circuit is composed of a charging and a discharging circuit, each regulated through a charging management IC as a simple BMS. The discharging circuit is also controlled by the charging management IC; thus, the support circuit consisting of three blocks to assist the discharging circuit, and to protect the main circuit from overvoltage and current, for single-cell operation. In case of a battery pack test, a specific BMS is connected with the battery pack, protect from under-voltage or current faults. The operation of the system is controlled by a programmable interface controller (PIC) equipped on a microprocessor board MA350. Due to the usage of a wide variety of rechargeable batteries, the hardware simulator proposed in this paper has to manage a wide voltage range. The challenge to design an optimal storage system, which brings out the full potential of each battery, is necessary. In order to examine the characteristic, the proposed MTC has to test any typical secondary batteries, such as lithium-ion (Li-Ion), nickel-metal hydride (Ni–MH), and lead-acid (Pb) batteries. As long as the specification of the battery pack is within the range from 2 to 12.6 V. Table 1 shows the specifications of the proposed MTC hardware scaled simulator.
The number of parallel batteries (i.e., the current amplitude) can be increased by changing the final power MOS-FET. Another important and innovative feature of this method is the ability not to rely on initial values of SoC or other parameters, and it can be applied to any battery pack composition.
The battery control of the developed simulator is based on a current control method. In addition, the system can control the battery according to the battery power by the current control with the measured battery terminal voltage. The appearance of the system is shown in Figure 2.
Regarding the protection system, it is based on the use of an emergency stop switch. The temperature level drastically improved from last model [10], which is maintained cooled using a fan based on forced air method, with noise level from 12.8 dB to 28 dB. The overall size of the MTC device is optimal for mobile applications to be carried out for test outside the conventional laboratory environment, with device size of 208W × 282D × 72H (mm).

2.2. Performance and Evaluation

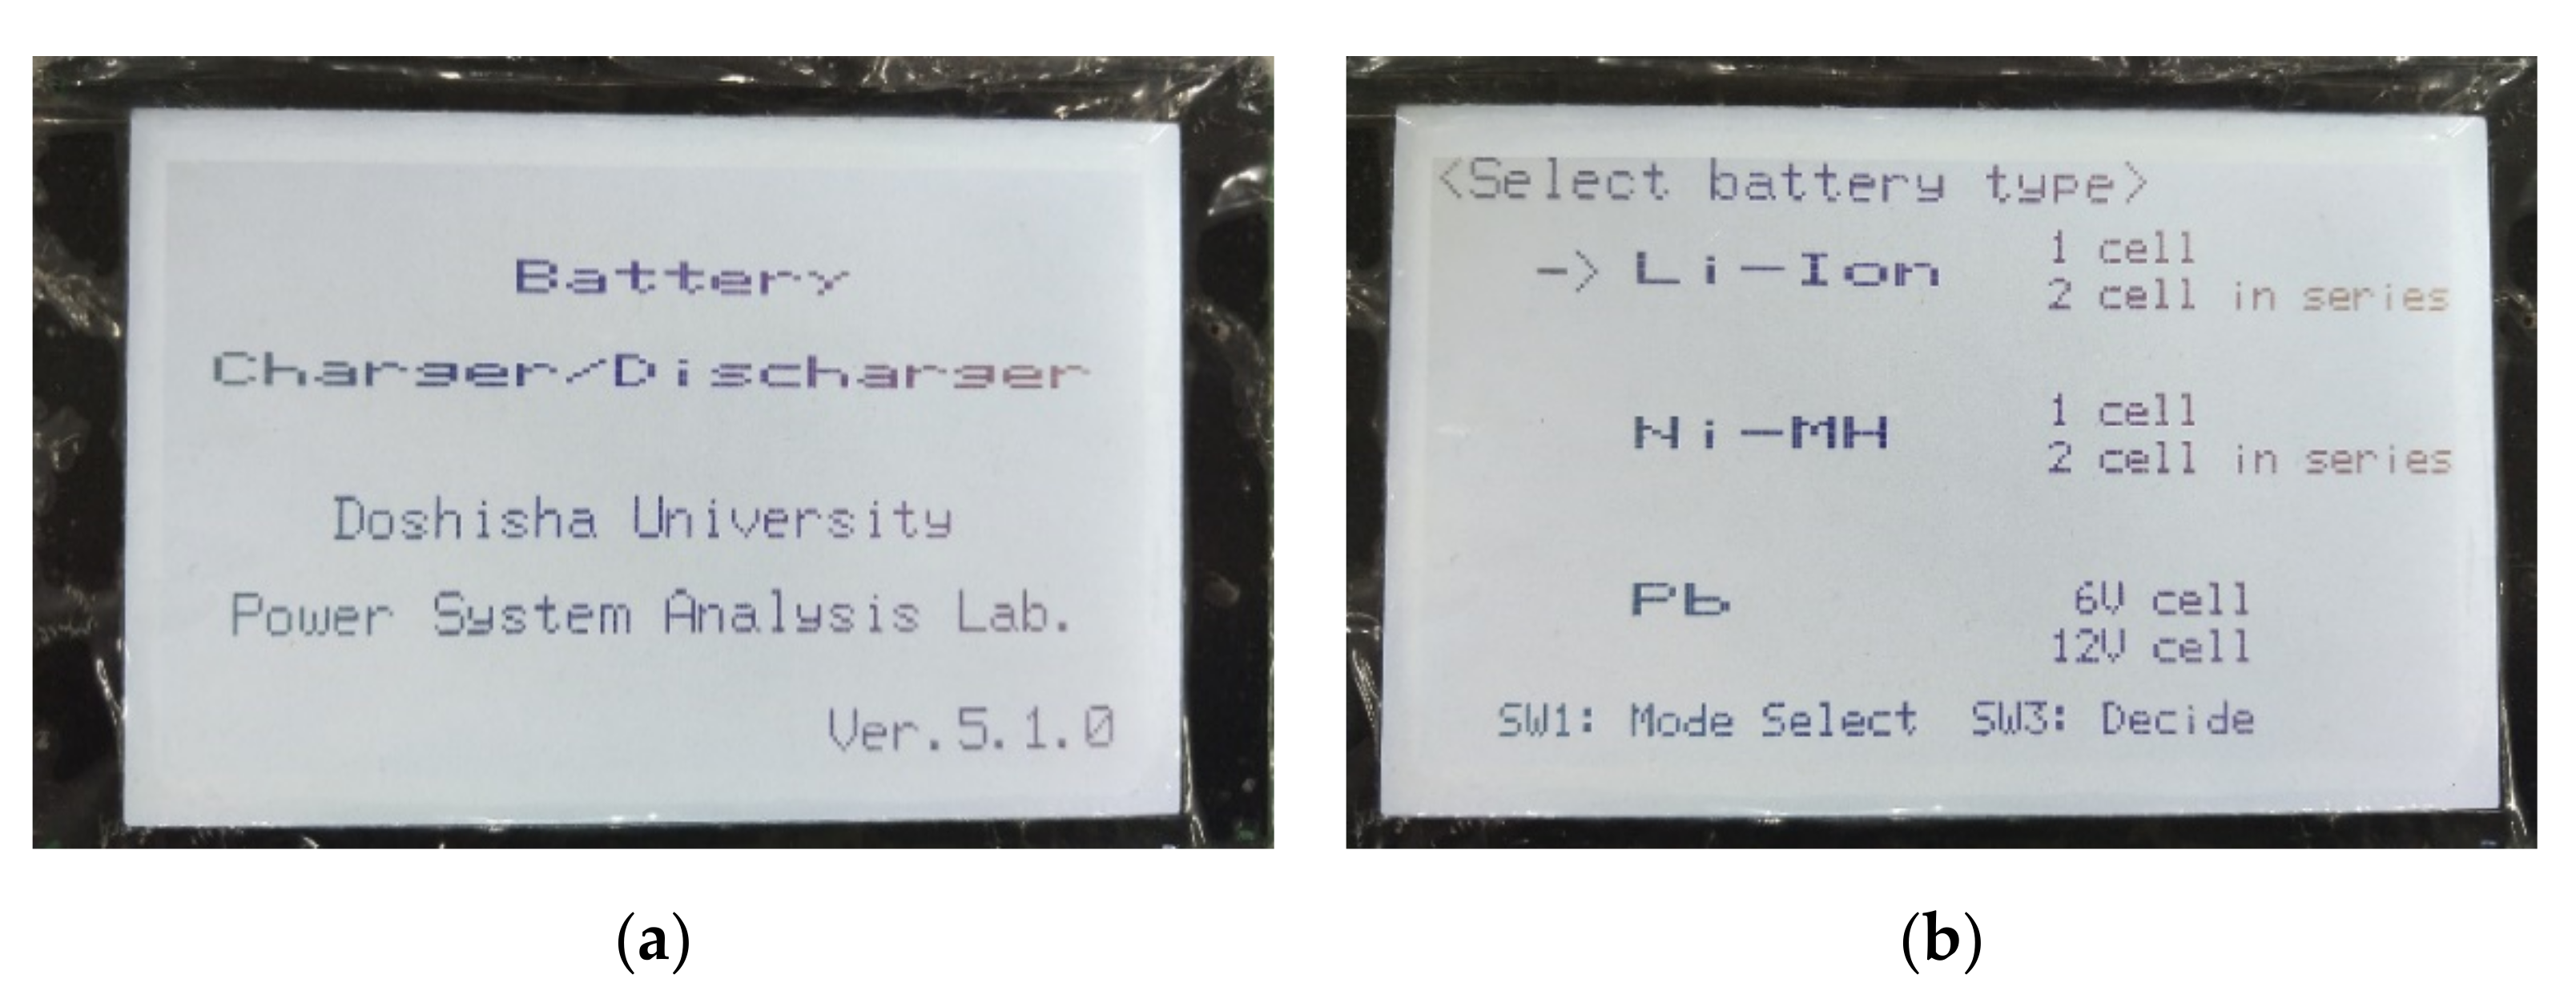
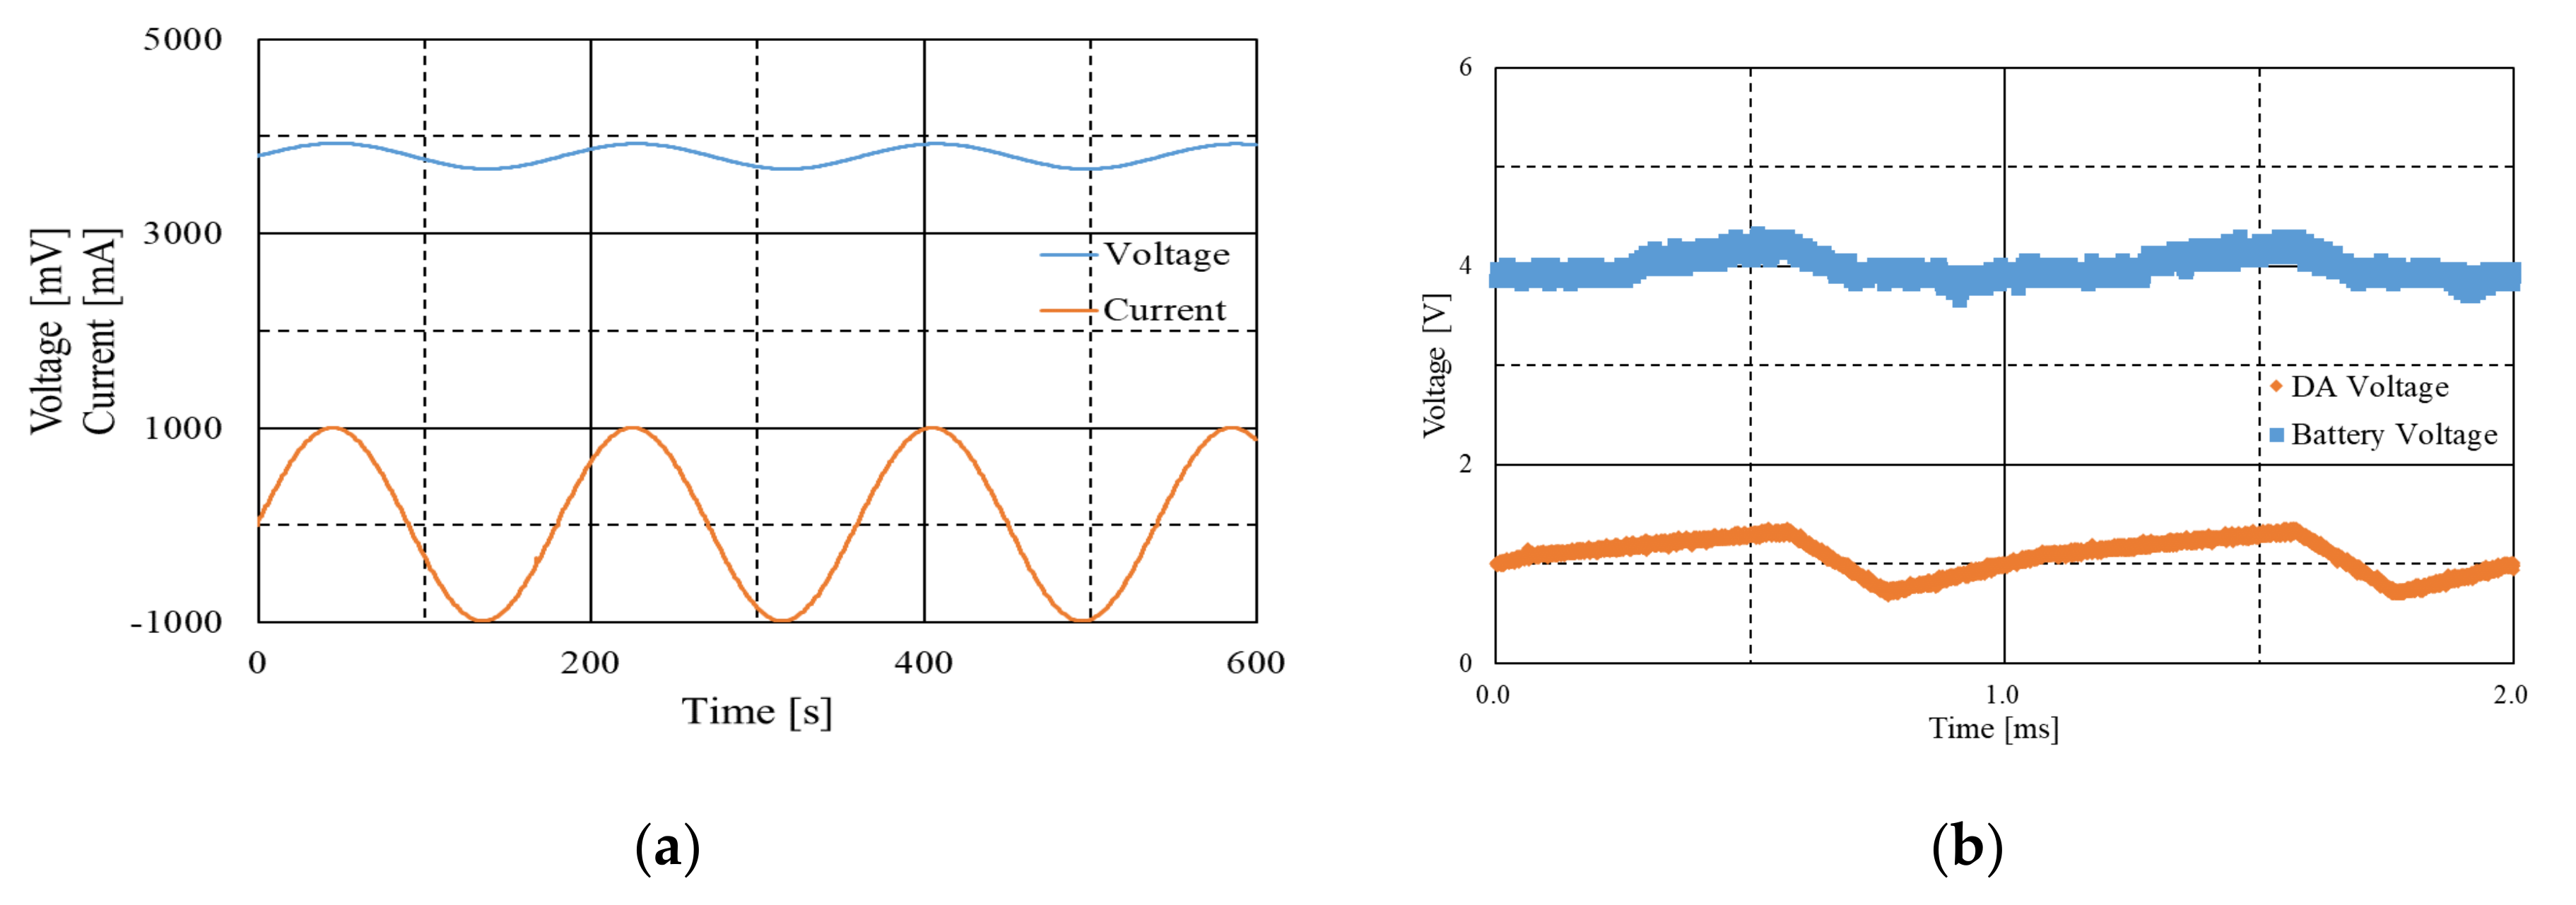
In this section, the potential of improved MTC is explored and evaluated with the usage of the proposed BMS included in. Below is the explained the operation and use of the MTC. The new MTC software V.5.1.0 has higher voltage operation compared with the previous version V4.2.1 [8,9], which was limited up to 9 V, where the new one can operate up to 12.6 V. This improvement allows the use of 3S4P BMS configuration. Also, the interface and menu are changed by giving more freedom in terms of battery selection, type of waveform operation i.e., Constant Current Constant Voltage (CCCV), pulse or arbitrary for different combinations of battery connections such as in series or parallel. The details are shown in Figure A1, Figure A2 and Figure A3 in the Appendix A. The user can insert the information such as the upper and lower voltage limits of the test battery for safe operation. Then, test condition such as frequency and the current value is also entered. Regarding the test condition of the proposed MTC is the same with the previous system, which is set by the controller with a rotary encoder, and the conditions are always displayed on the liquid crystal display (LCD) during the test. At that time, the charging and discharging circuit are controlled by a feedback system based on the voltage and current data. The data obtained from the test can be saved in an SD card and displayed graphically. Figure 3 and Figure 4 show the system performances when a Li-Ion battery cell is charged and discharged by the system.
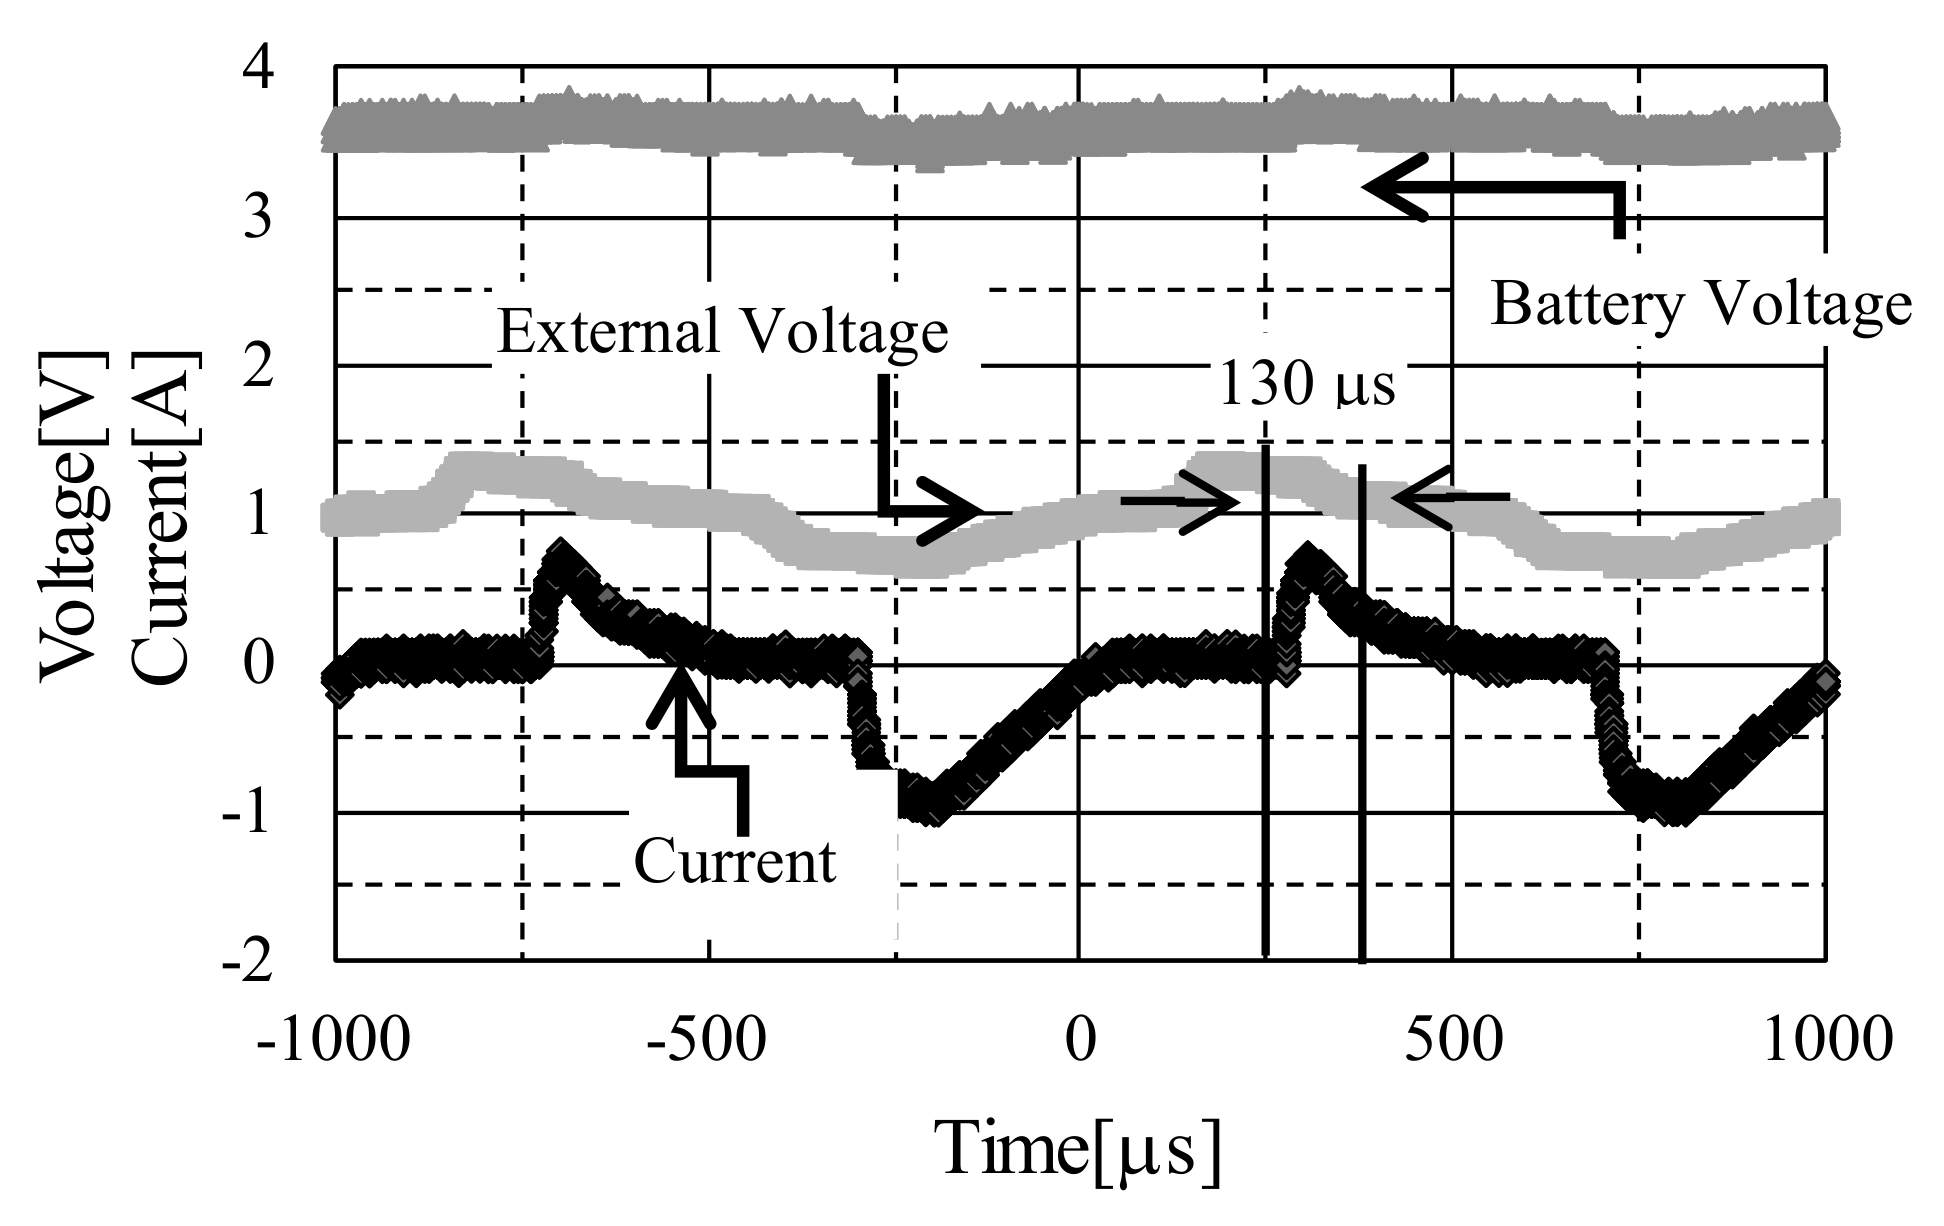
The battery current can be controlled by the built-in microcomputer or an external oscillator, as shown in Figure 2. For example, the current waveform is sinusoidal with an amplitude of 3 A and a frequency of 1 Hz. The maximum difference between the target and measured current is in the range of 120 mA, which indicates the accuracy of the developed simulator. From the measured voltage and current, the battery characteristic can be obtained. For example, the capacitive characteristic of the internal impedance is obtained from the phase difference, and the impedance of 130 mΩ is obtained from the voltage fluctuation amplitude of 400 mV and the current amplitude of 3 A. The validation of the characteristics in a high-frequency region, the arbitrary waveform having the current amplitude of 1 A with the frequency of 1 kHz is entered as the external signal input as explained in Figure 4. In this example, a delay of 130 μs is observed at the switching from the charging to the discharging. It is the required time for switching the operation of charging management ICs in the charging and discharging circuit controlled by the microprocessor.
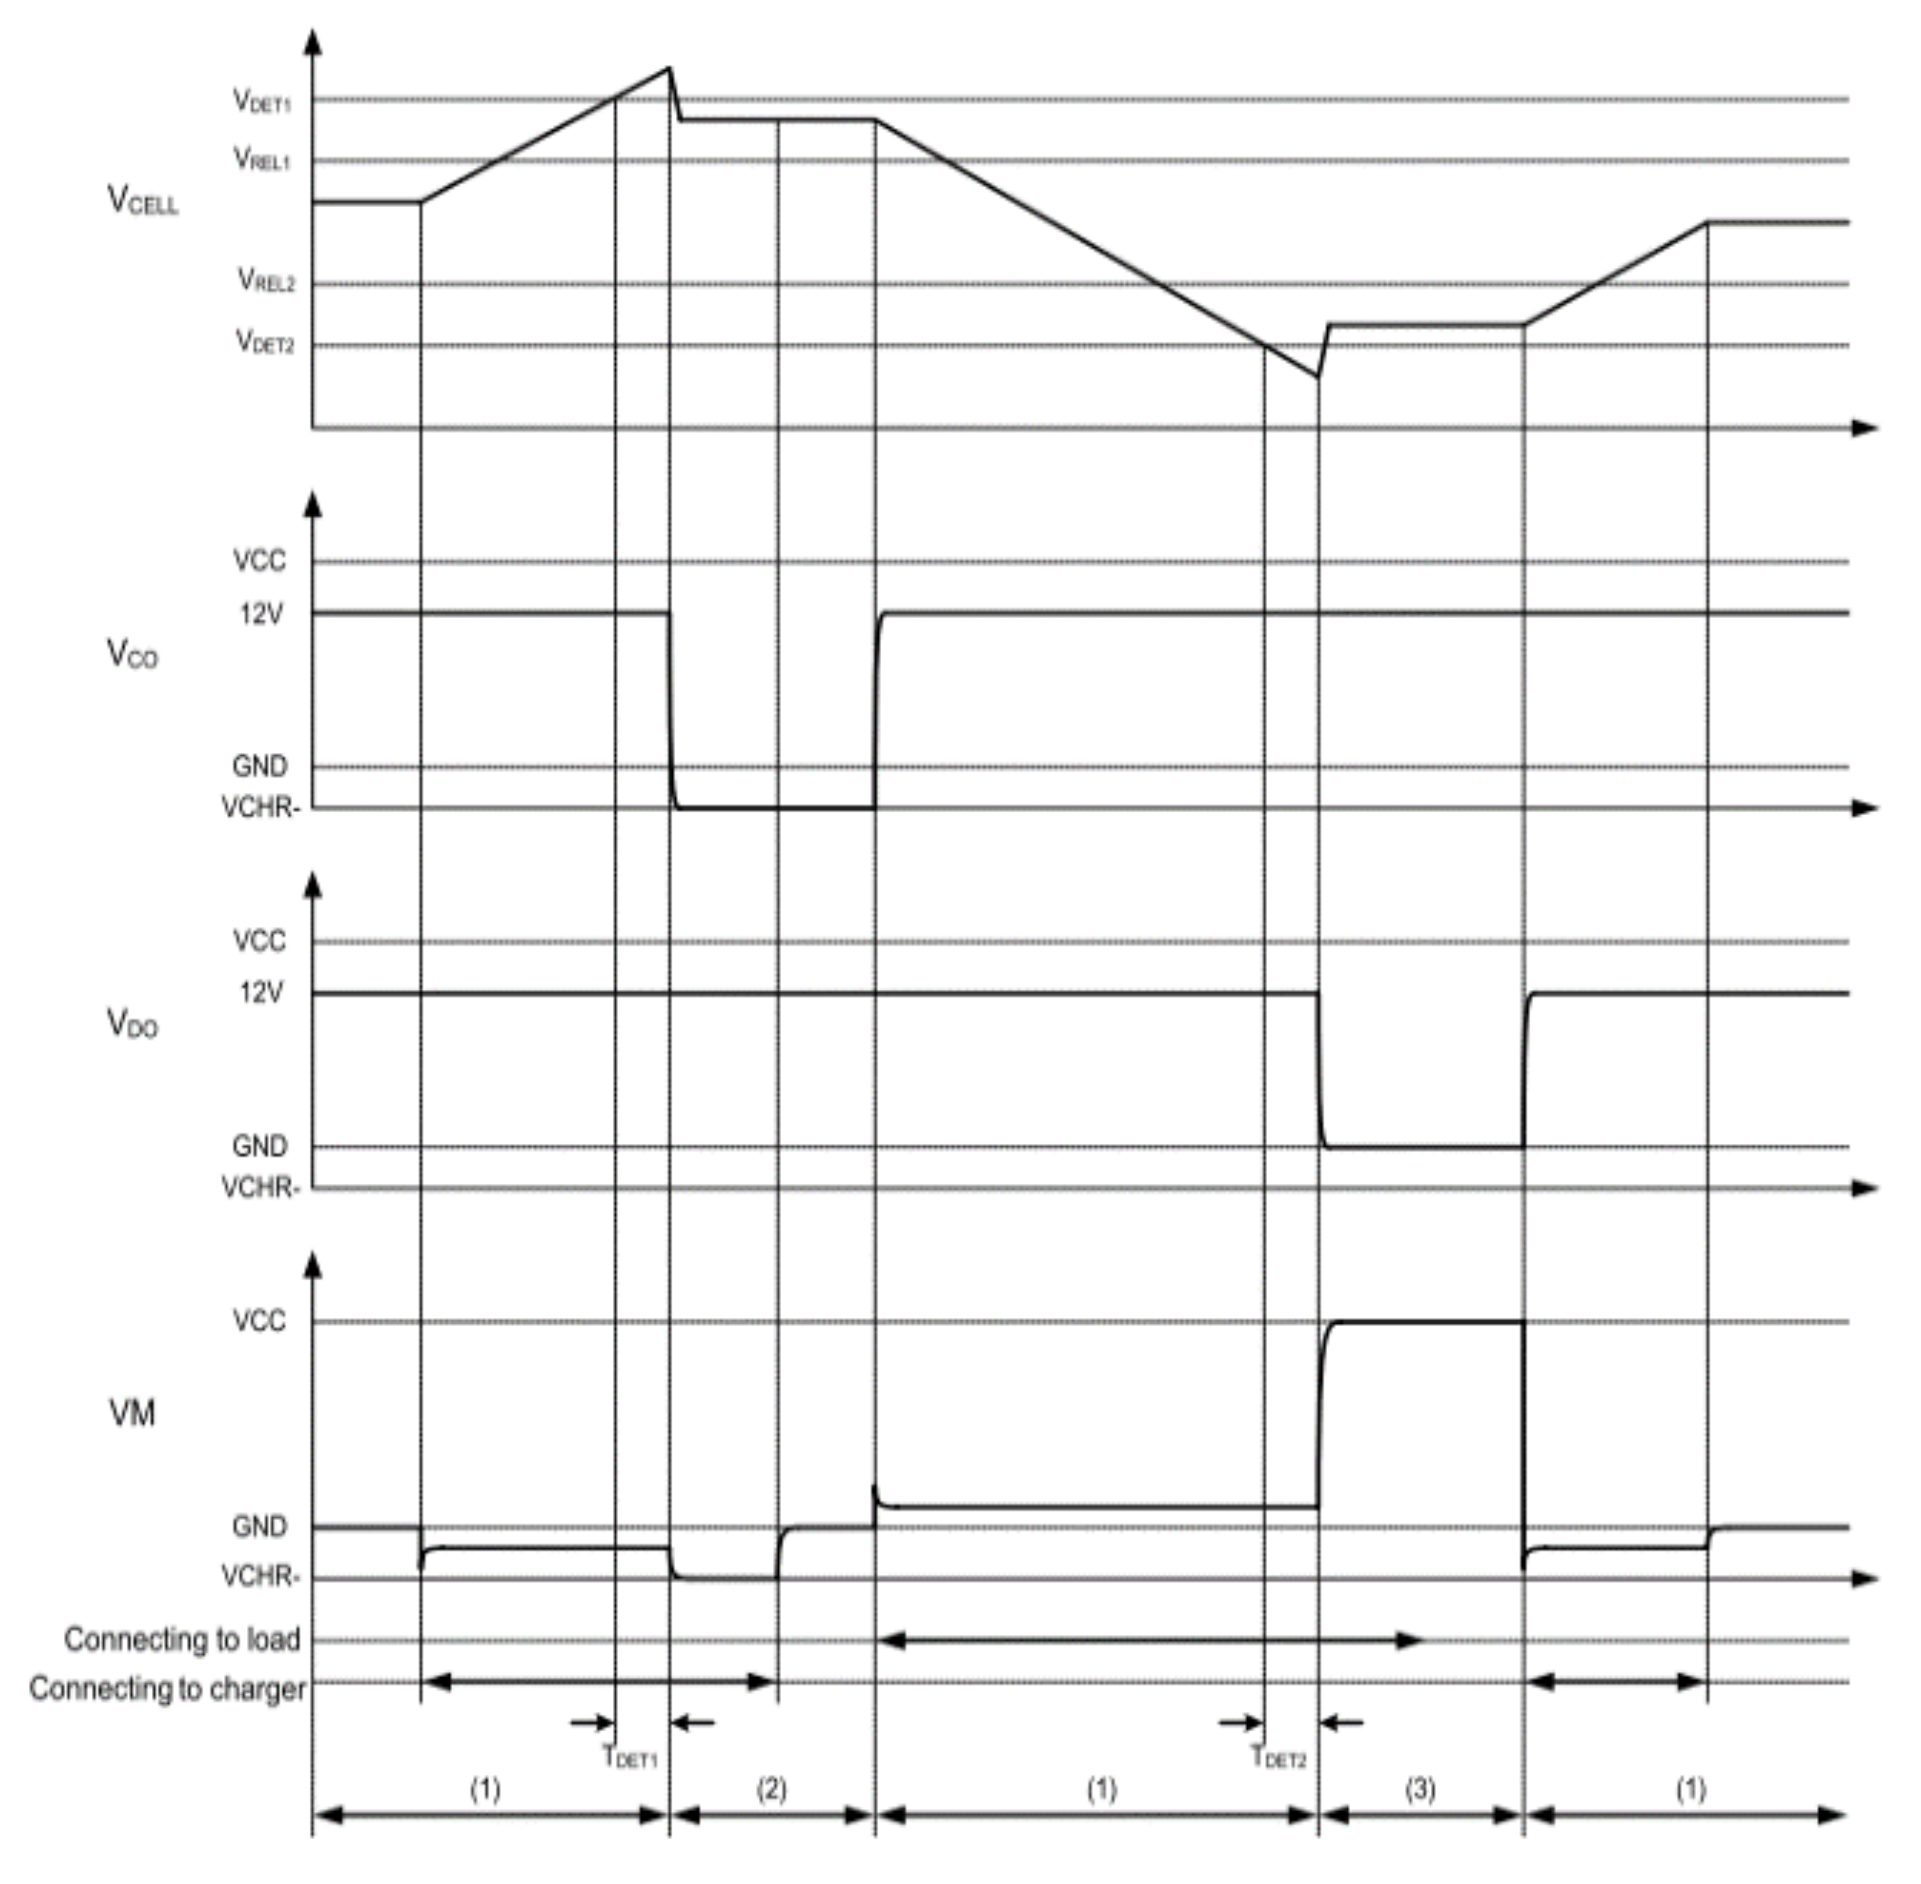
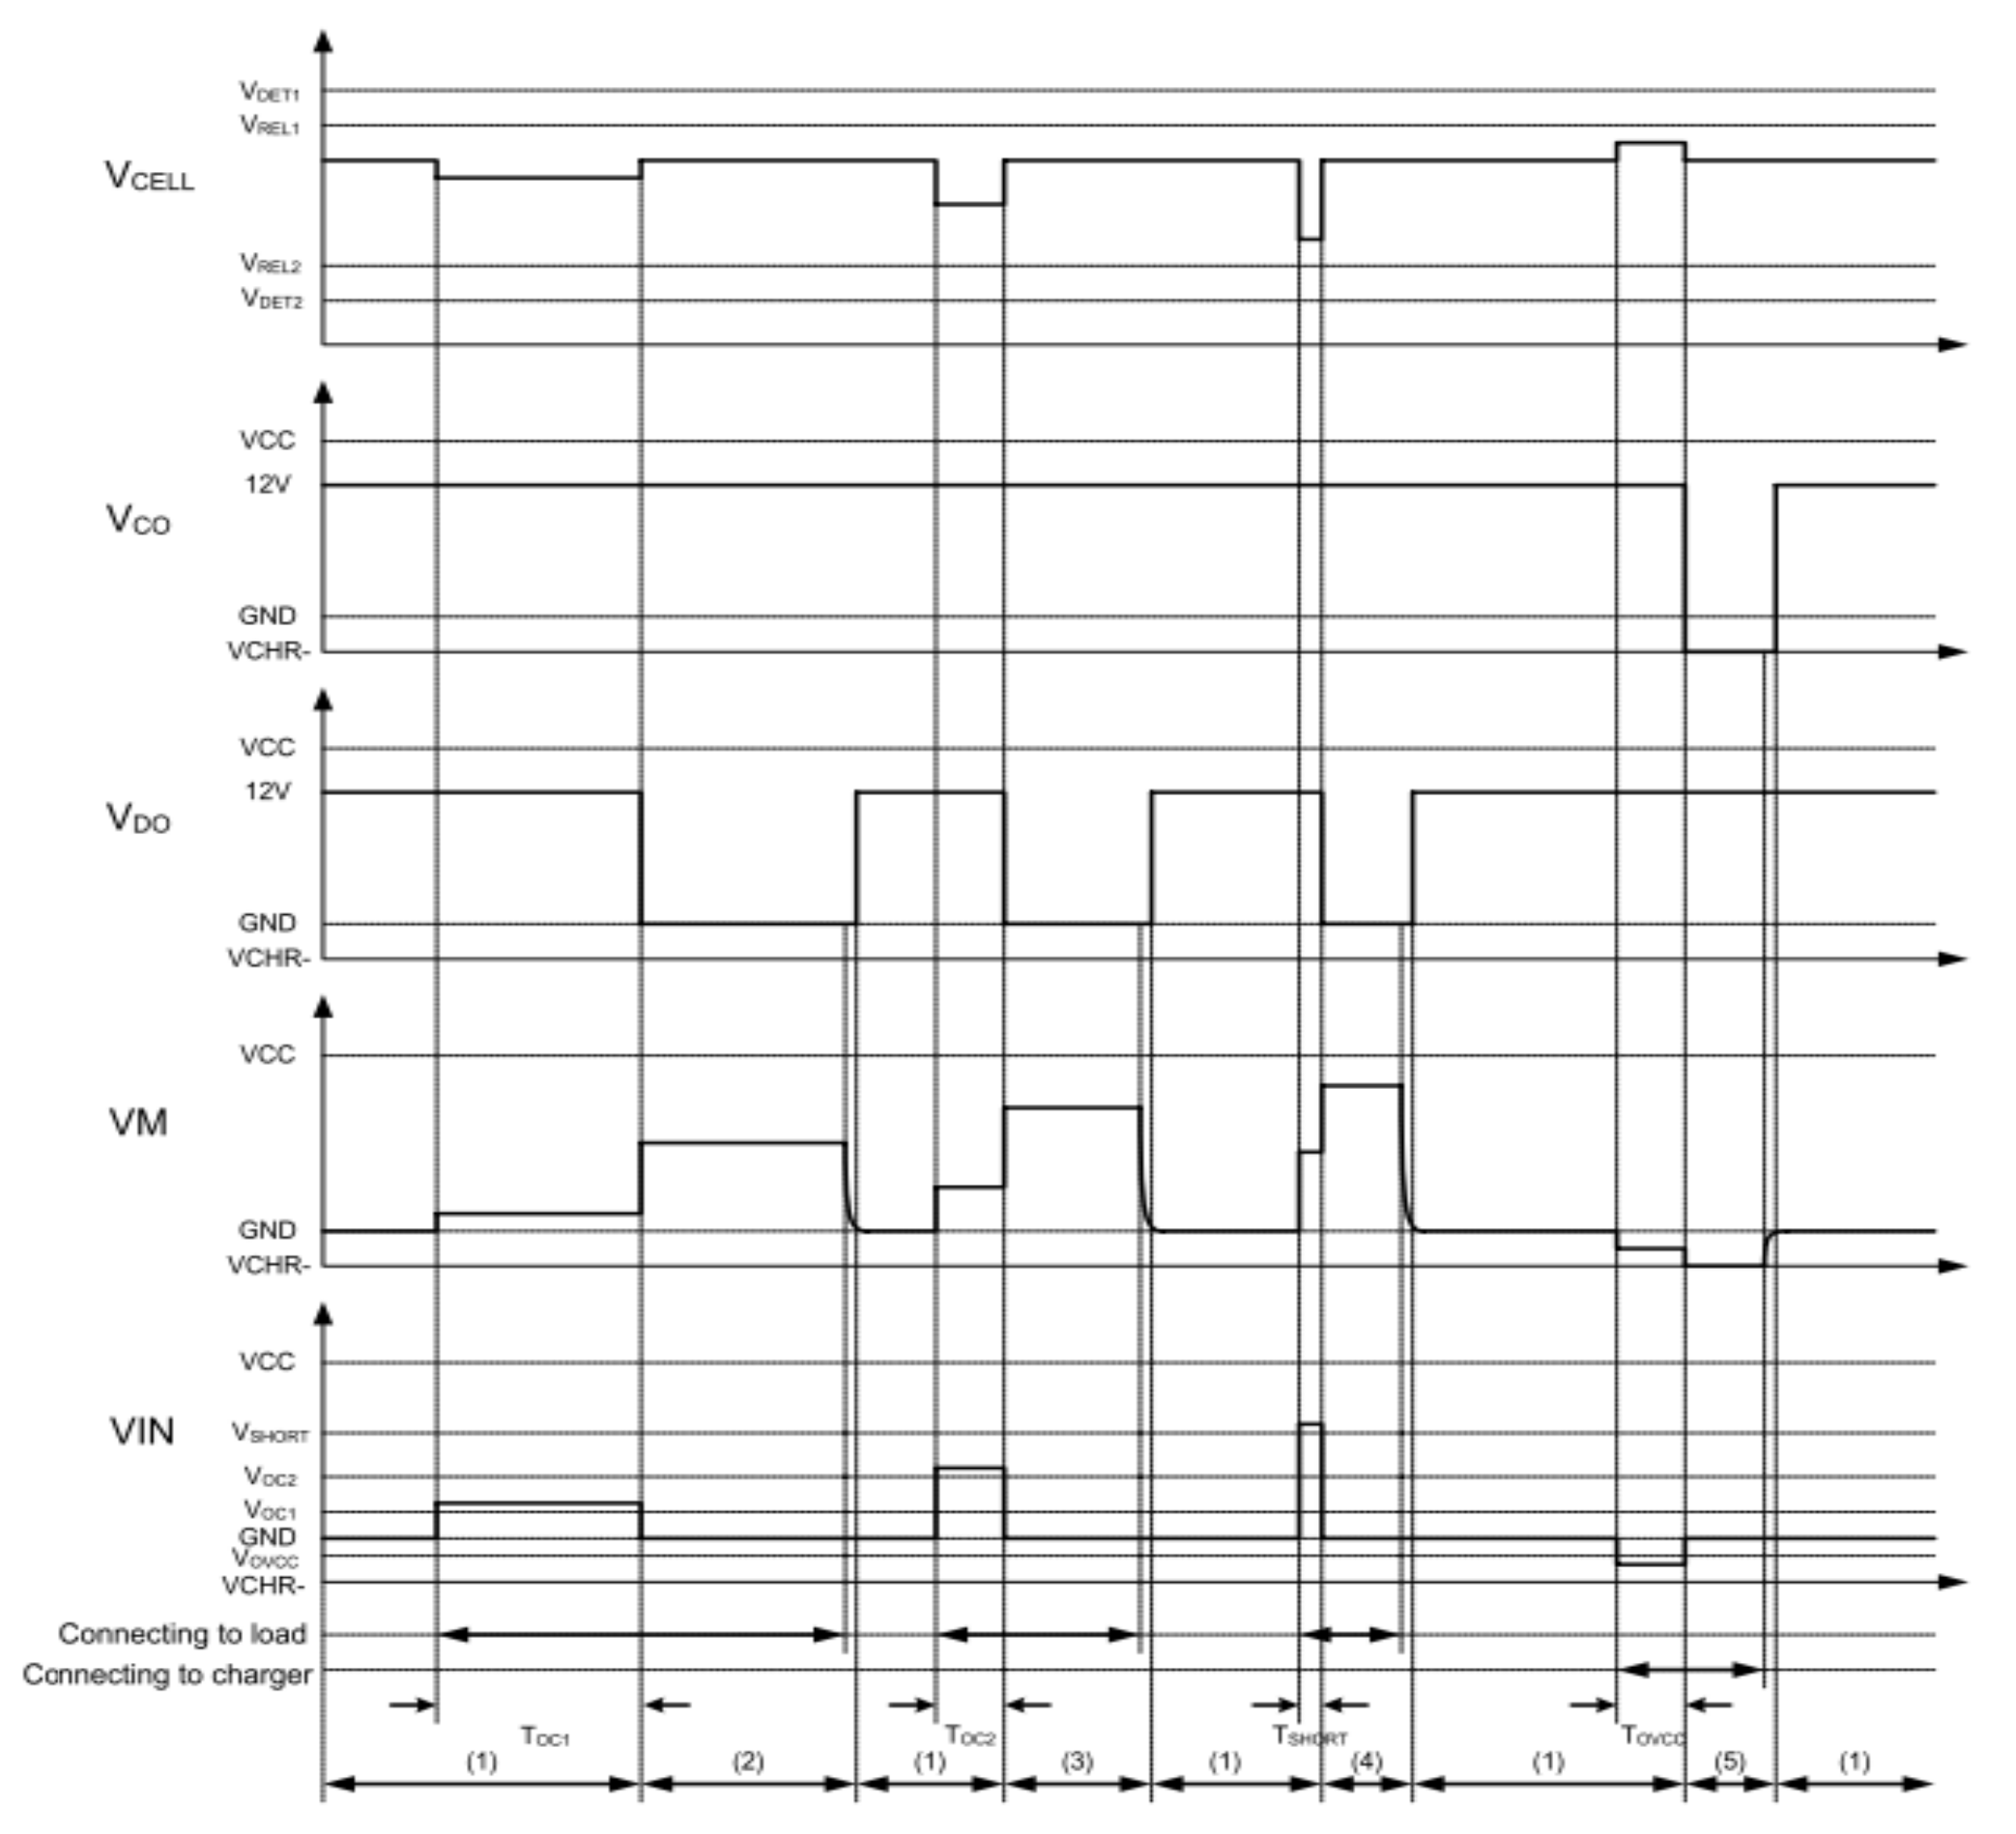
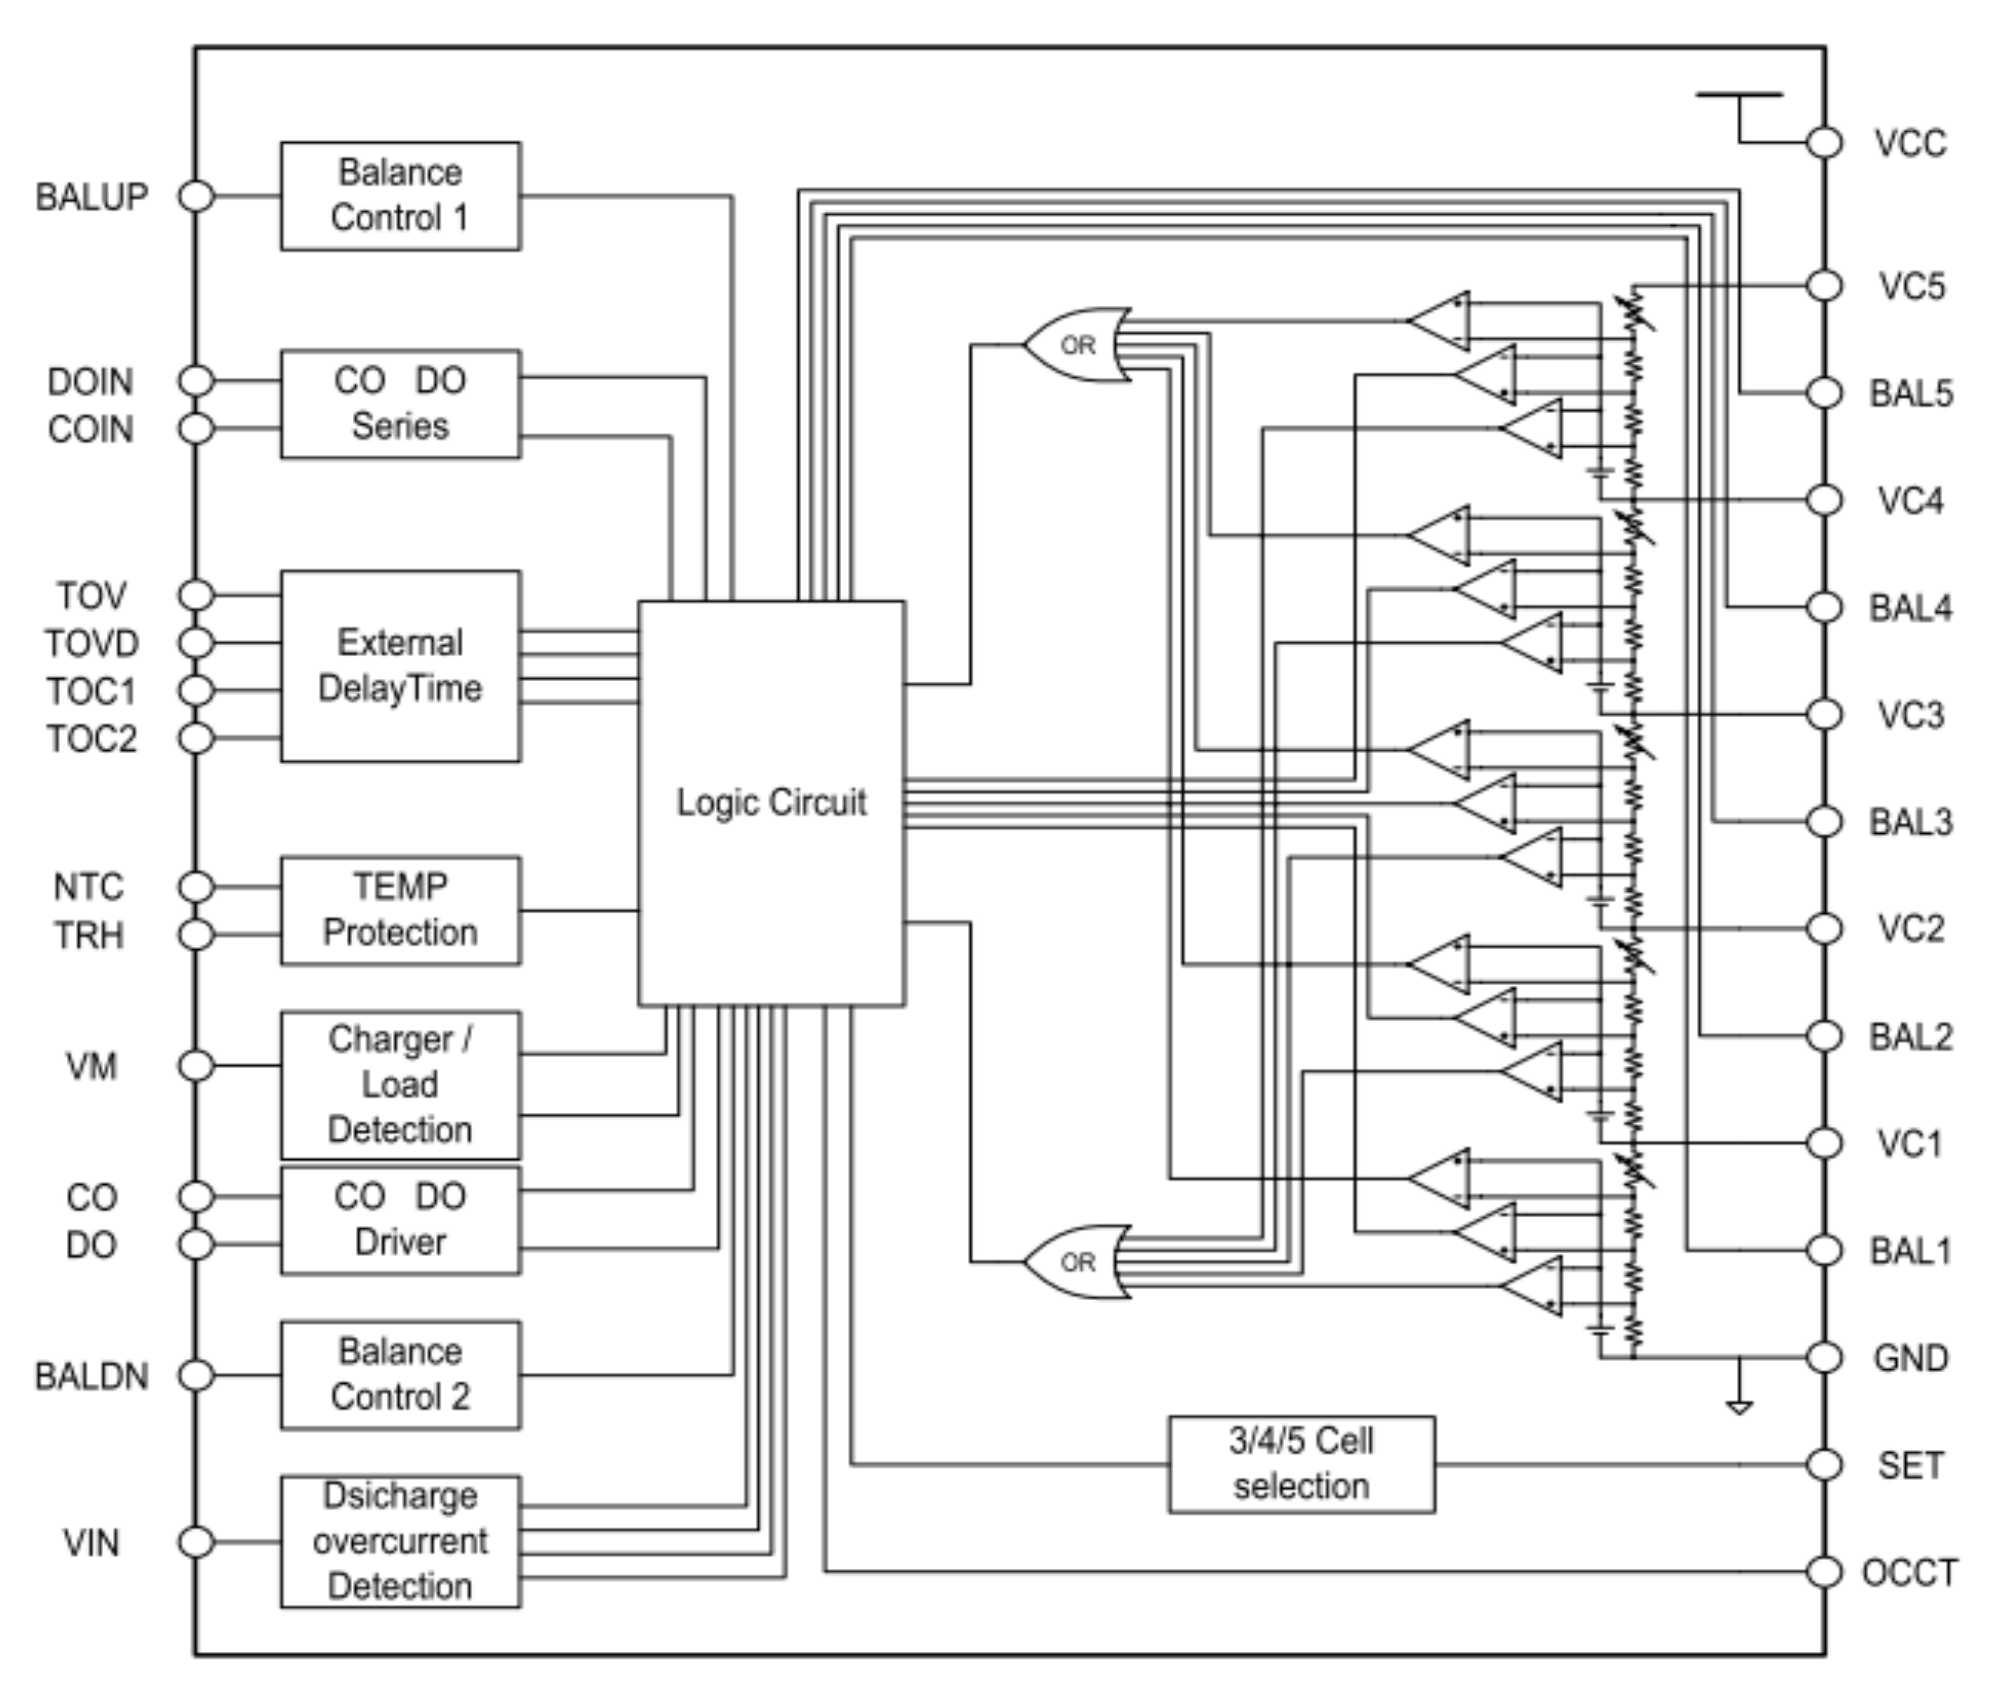
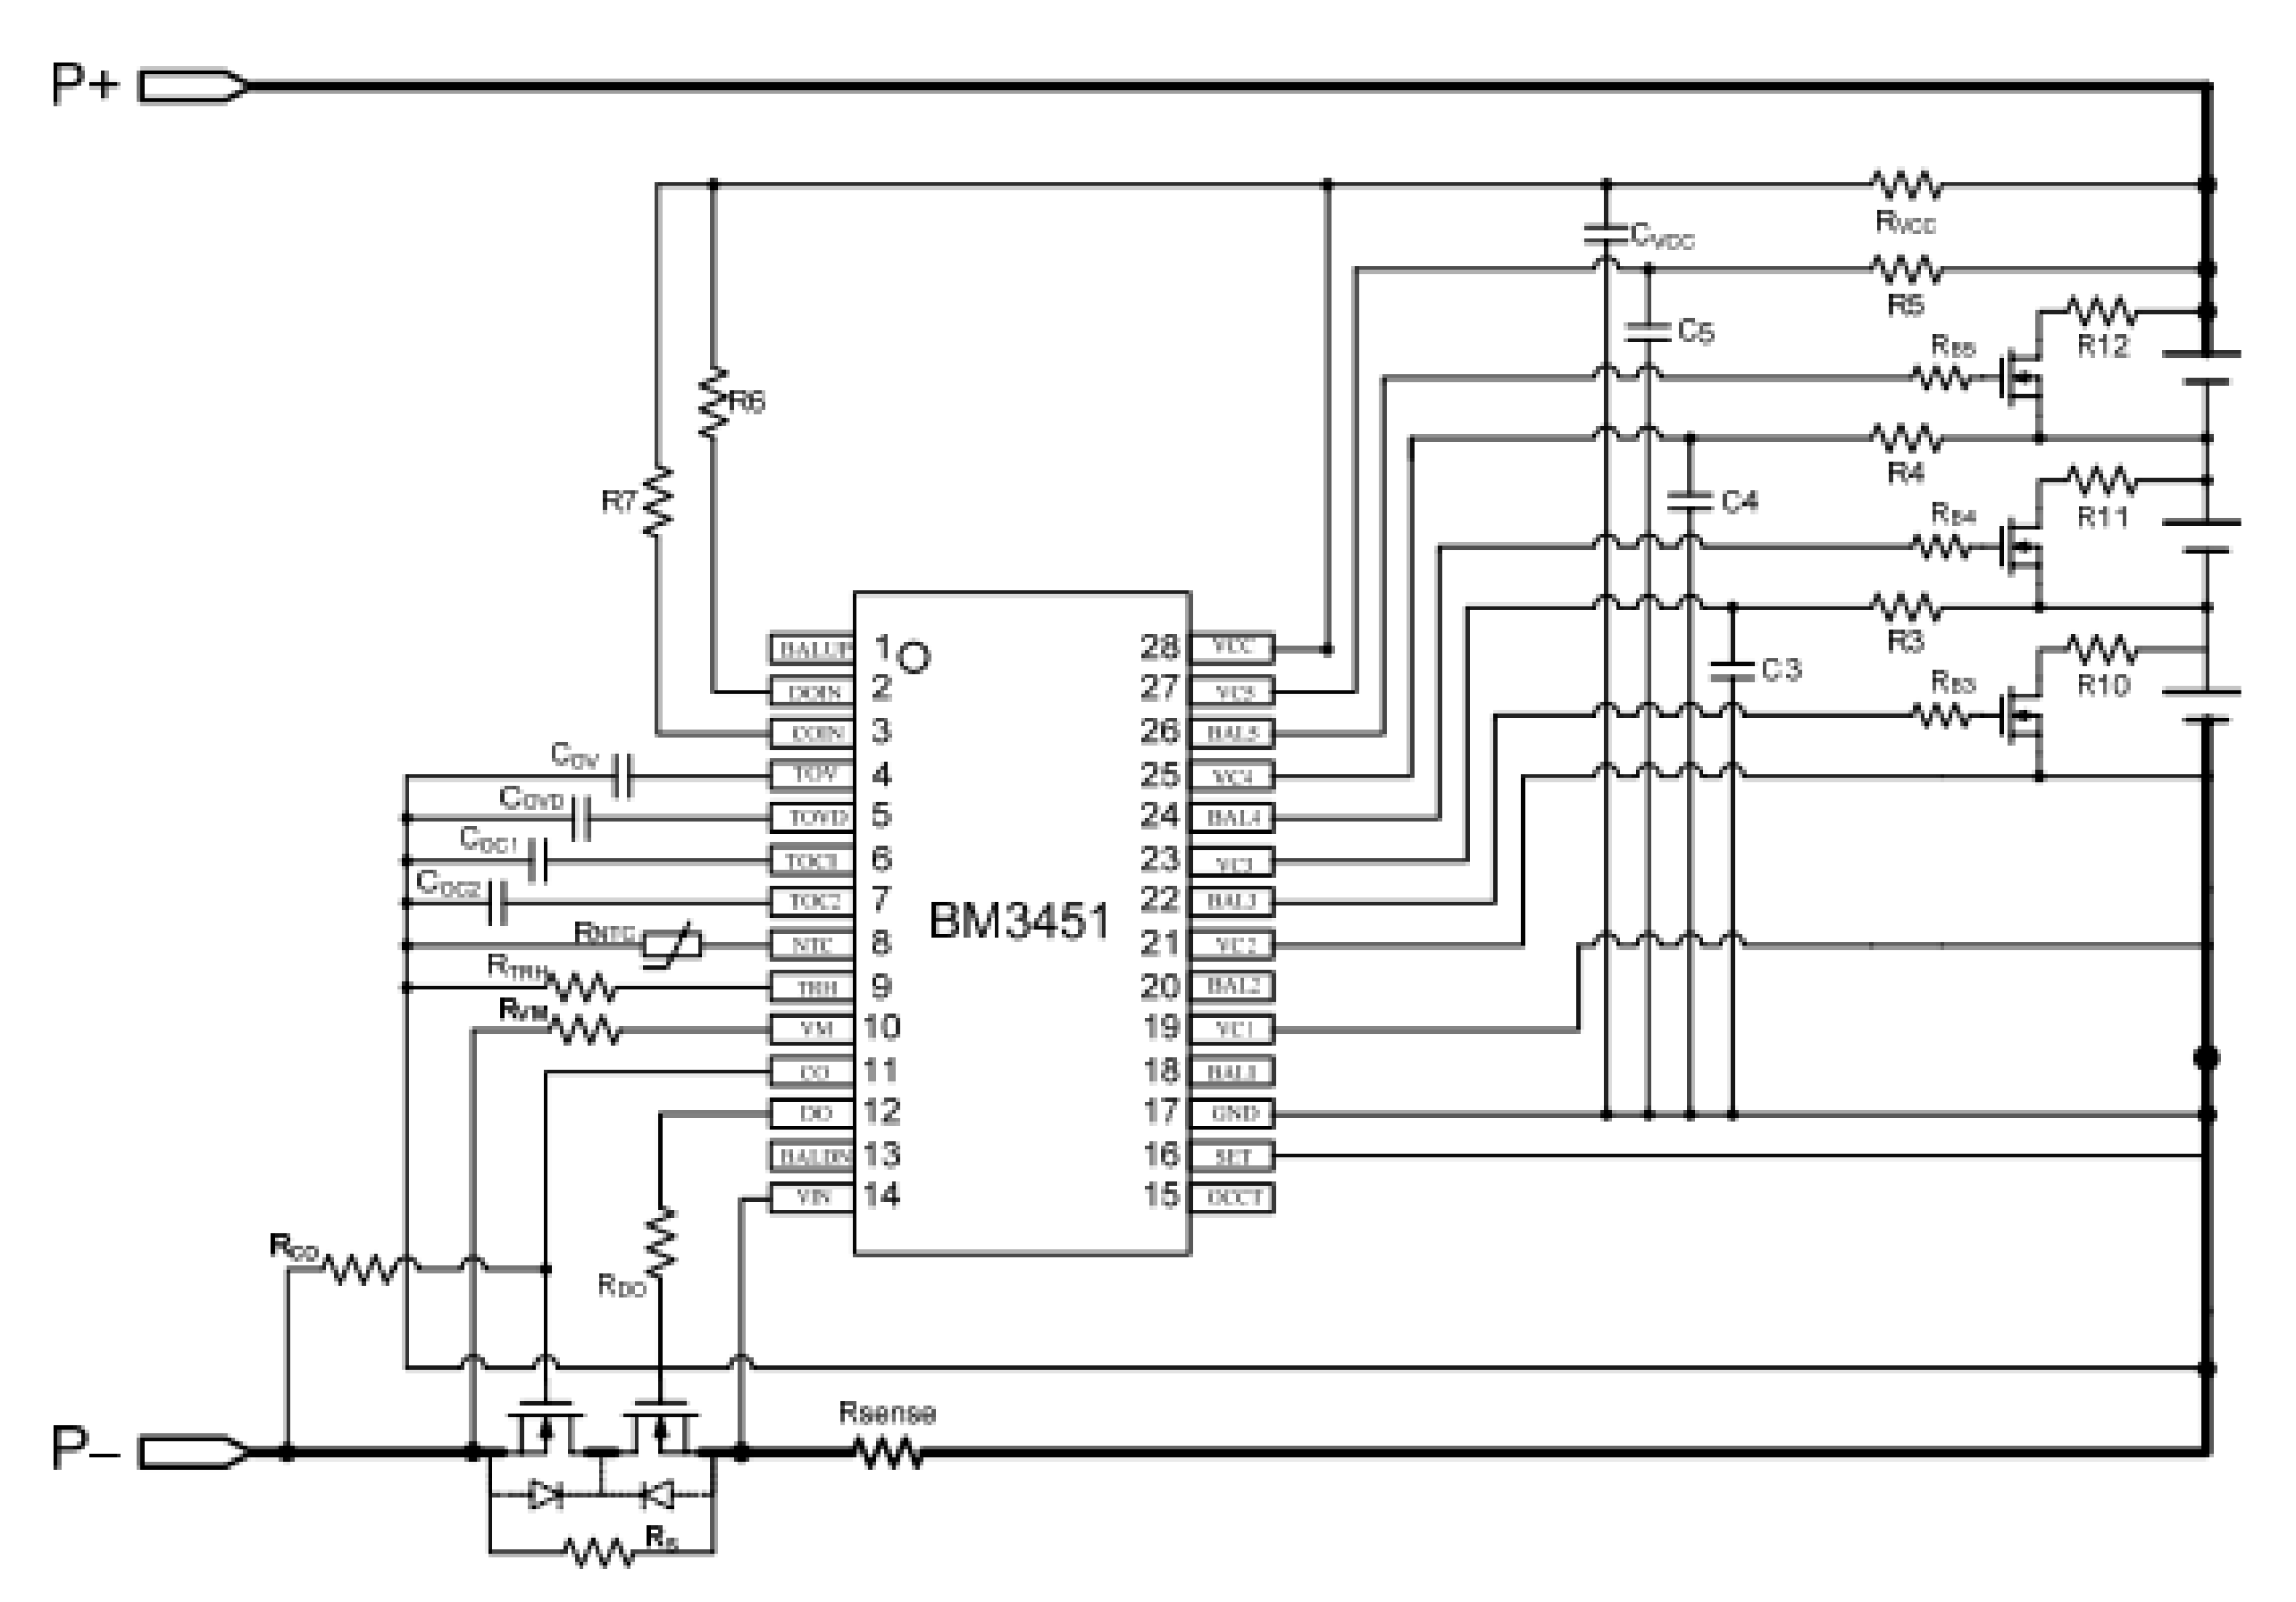
Regarding the BMS circuits and components, BM3451 IC commercially purchased component is used for the proposed BMS circuit. The BM3451 continuously works to monitor each cell’s voltage, the current of charge or discharge, and the temperature of the environment to detect over-charge/discharge, overcurrent, short circuit, and over-temperature, etc. Besides, also it can change the protection delay time of overcharge, over-discharge and discharge overcurrent by setting the external capacitors. The BM3451 provides external bleeding for the cell-capacity balance function to avoid unbalanced capacity between each cell. Thus, the batteries can work for longer. In Figure 5 and Figure 6 are shown the block diagram of BM3451 with three-cell application including balance function.
The extended function module embedded in the BM3451 ICs makes them work for an increased number of battery packs with multiple chips, and they can protect 6-cell batteries or even more than 6-cell batteries.
It introduces features like:
a)
High accuracy voltage detection for each cell
  • Overcharge threshold 3.6 V~4.6 V with accuracy: ±25 mV (+25 °C) / ±40 mV (−40 °C to + 85 °C)
  • Overcharge hysteresis 0.1 V with accuracy: ±50 mV
  • Over-discharge threshold 3.6 V~4.6 V with accuracy: ±80 mV
  • Over-discharge hysteresis 0 V/0.2 V/0.4 V with accuracy: ±100 mV
b)
Three grades voltage detection of discharge overcurrent
  • Discharge overcurrent 1 0.025 V~0.30 V (50 mV step);
  • Discharge overcurrent 2 0.2 V/0.3V/0.4V/0.6 V;
  • Short circuit 0.8 V/1.2 V.
c)
3/4/5/6 cells protection enable
d)
Supports external bleeding for balance
e)
Over-temperature protection
f)
Setting of output delay time
  • Overcharge, over-discharge, discharge overcurrent 1 and discharge overcurrent 2 protection delay time can be set by external capacitors.
g)
Controlling the state of charge or discharge by external signals
h)
The maximum output voltage of CO/DO:12V
i)
Breaking wire protection
j)
Low power consumption
  • Operation mode (with Temp protection) 25 μA typical;
  • Operation mode (without Temp protection) 15 μA typical;
  • Sleeping mode 6 μA typical.
Another important component for the design of the 3S BMS type is the switching control block, where it was based on the usage of the STD95N3L (LH6) Power MOSFET. It has the required specifications and features for the development of the used BMS proposed in this study, as:
  • Extremely low on-resistance RDS(on);
  • Low gate drive power losses;
  • High avalanche ruggedness.
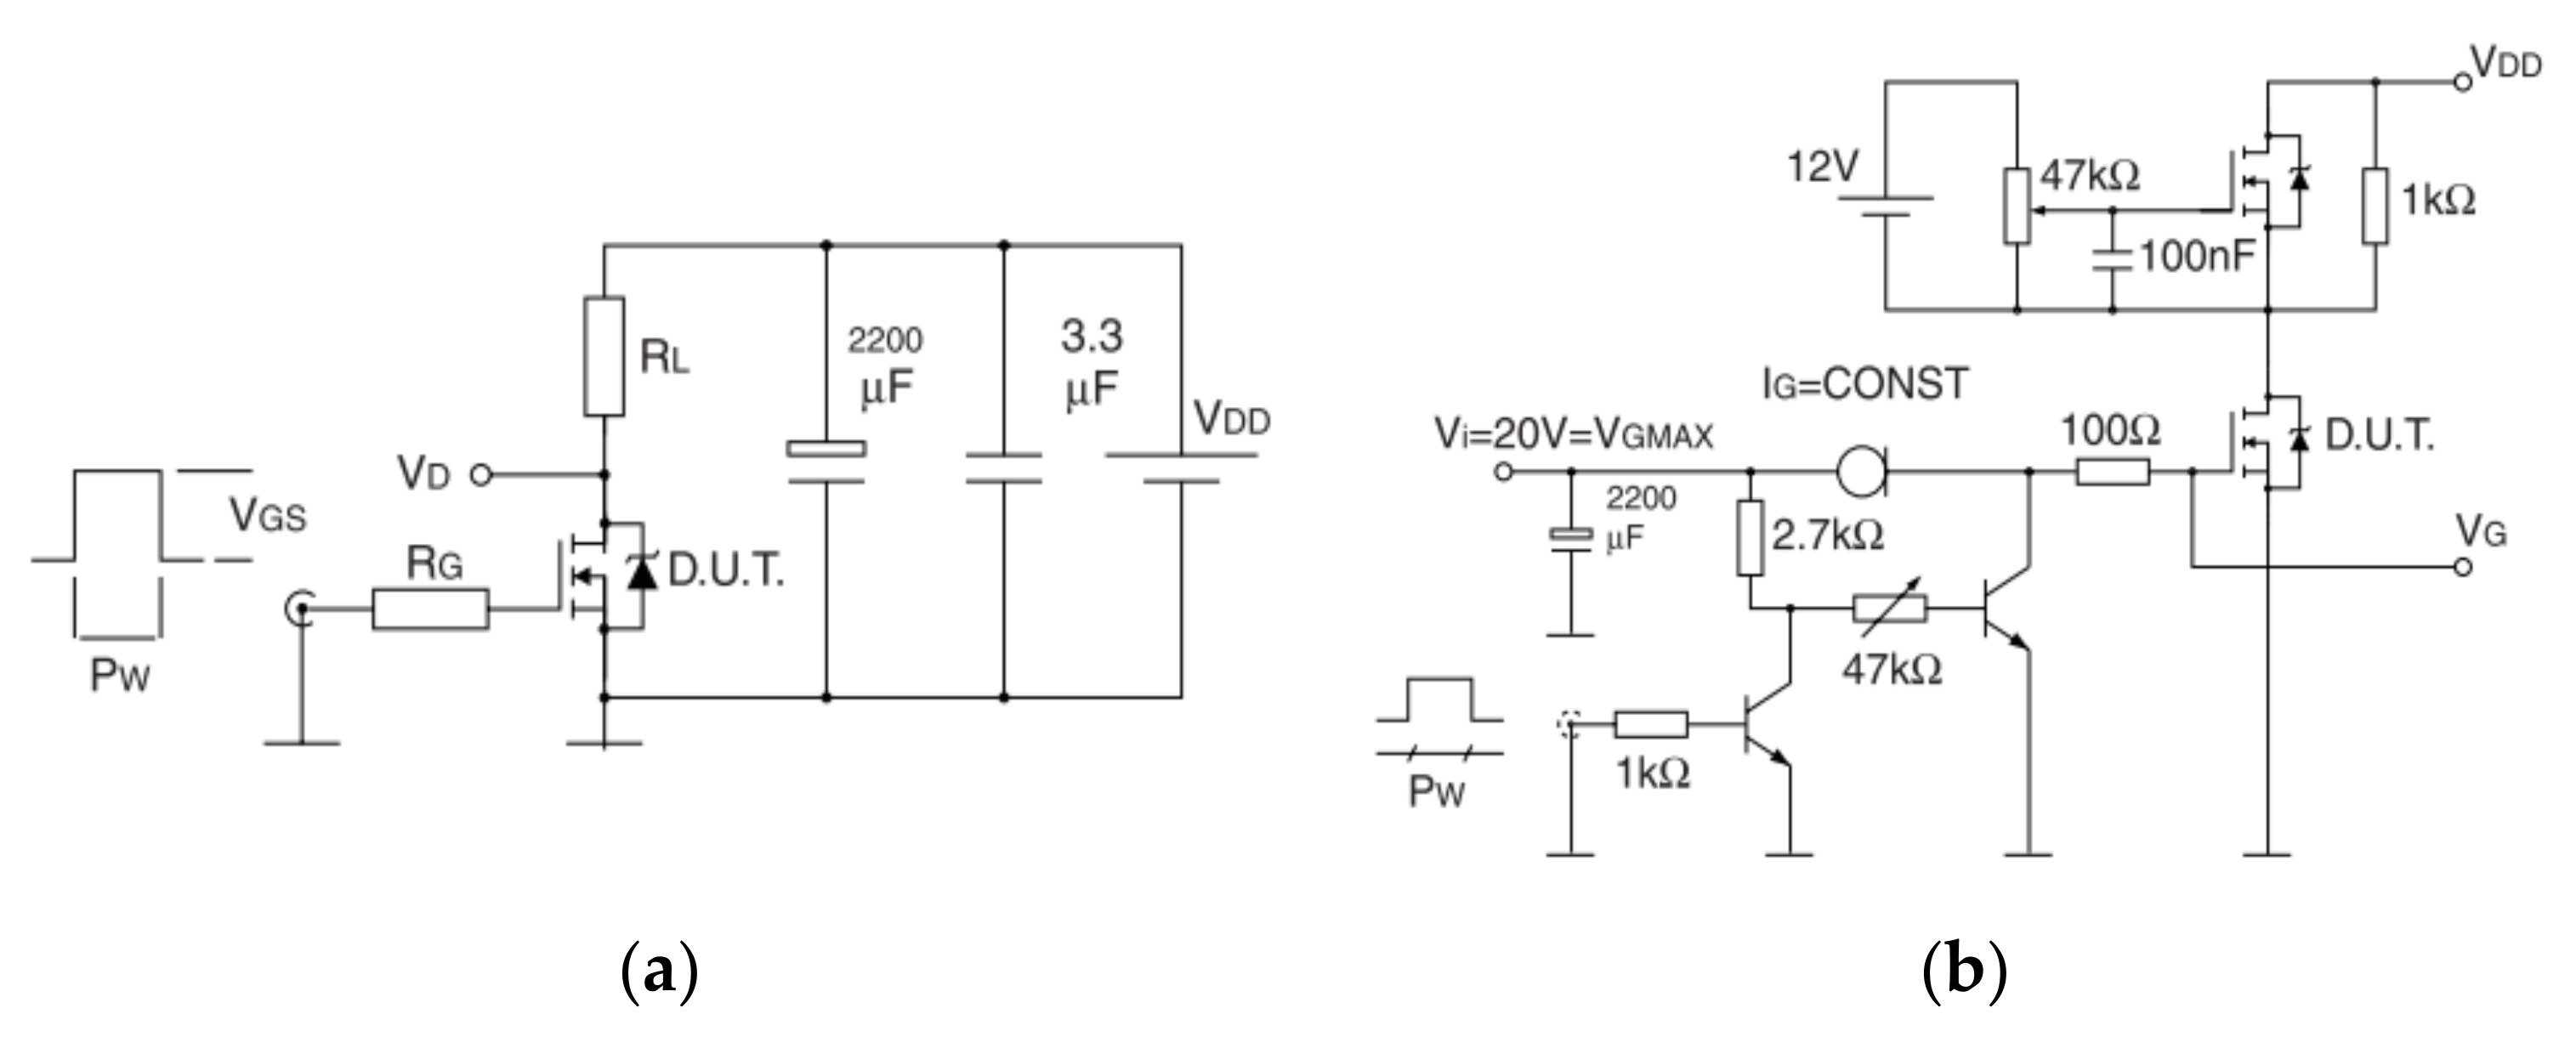
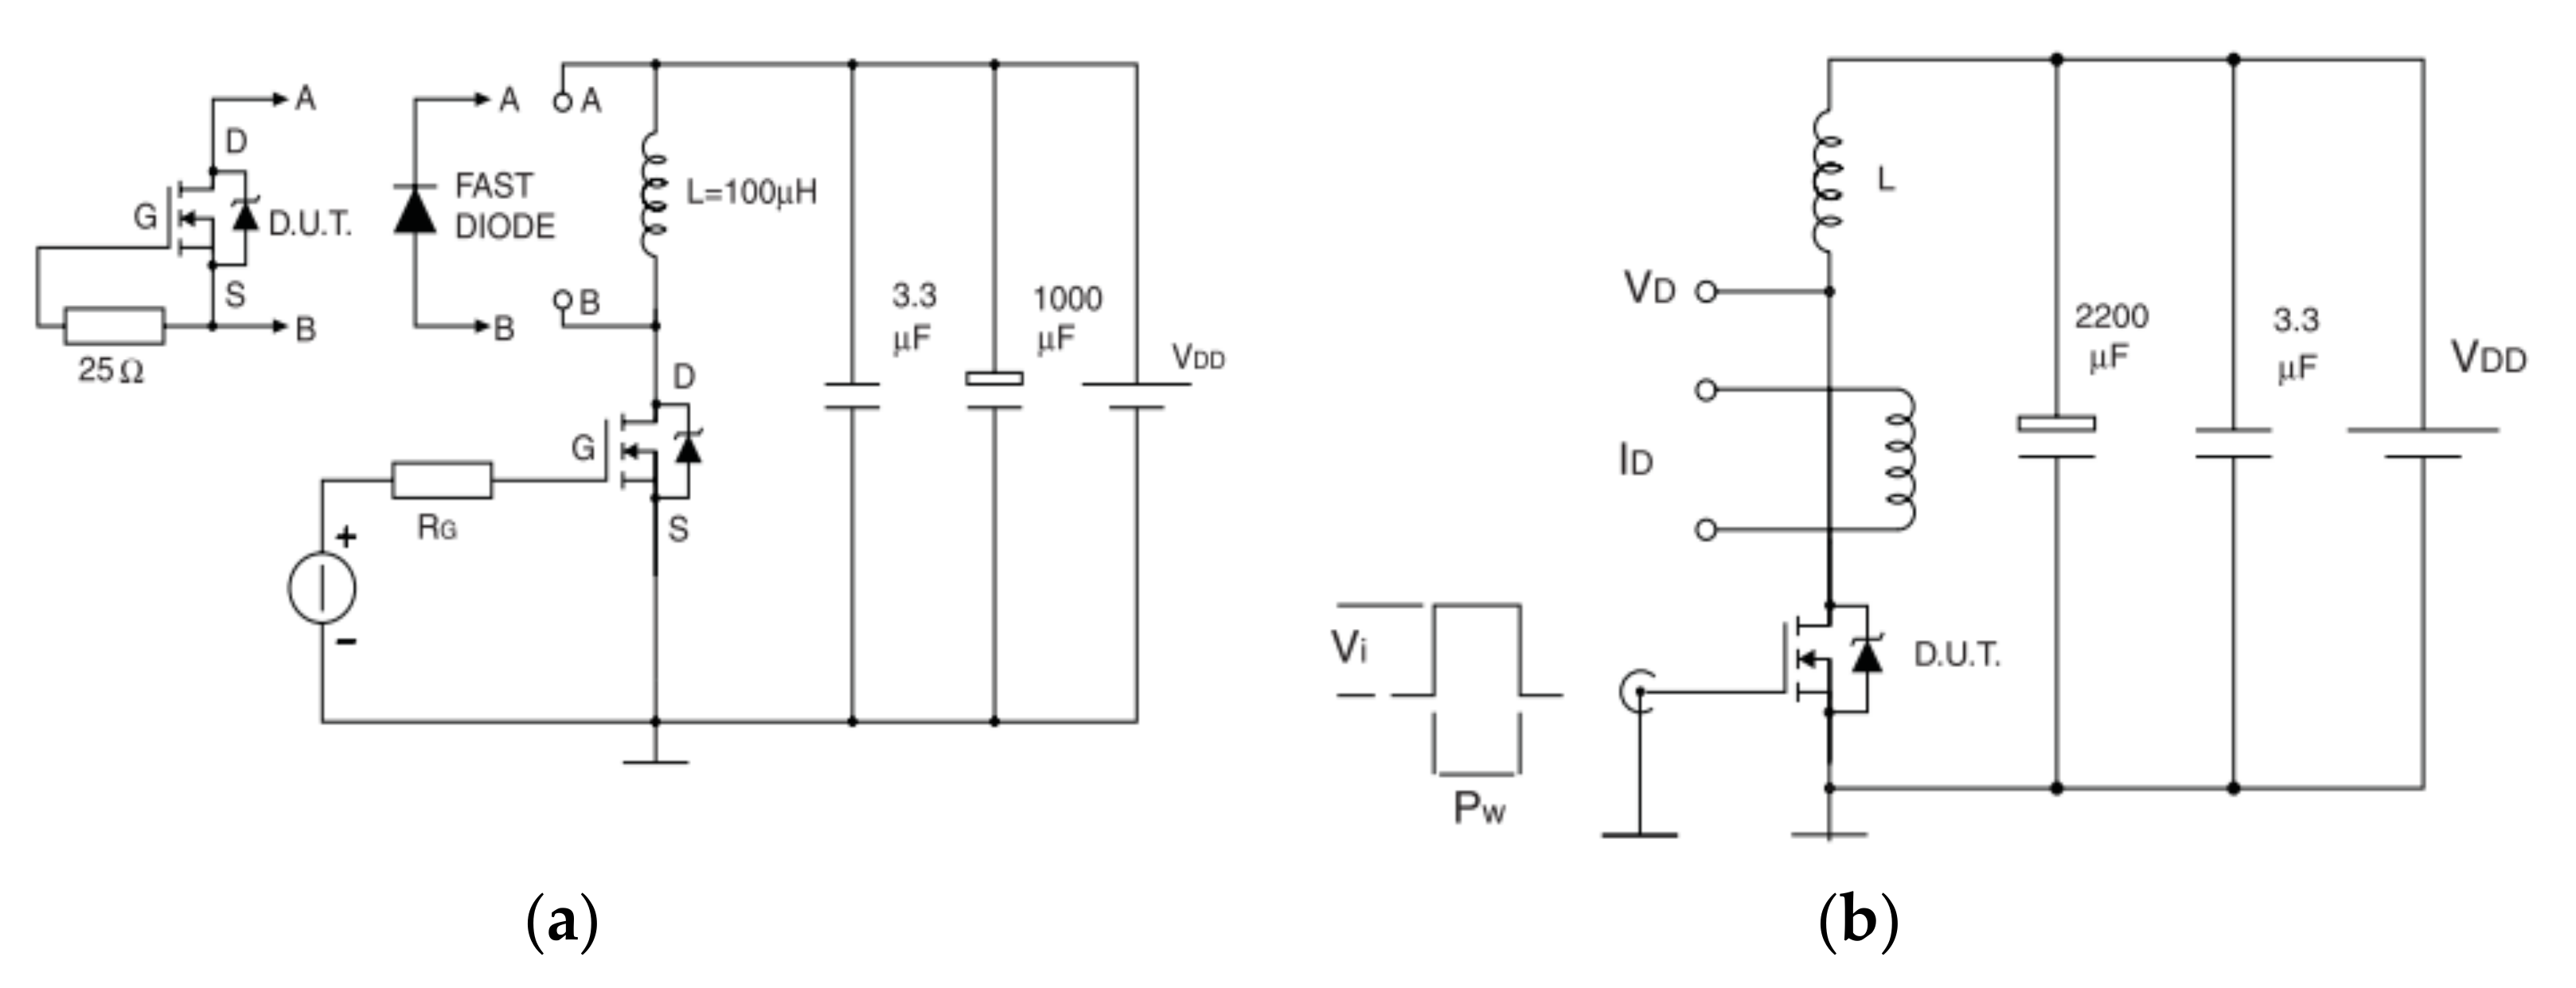
Due to the new gate structure based on the 6th generation of design rule of STs, STripFETTM technology, the resulting power MOSFET exhibits the lowest RDS(on), which makes it suitable for a demanding DC–DC converter application as BMS, where high power density has to be achieved. The switching-time test circuits used for the designing of the improved simulator MTC are shown in Figure 7 and Figure 8. Further details are explained in Appendix A, respectively in Figure A4, Figure A5 and Figure A6 and Table A1, Table A2 and Table A3.

2.3. Applicability

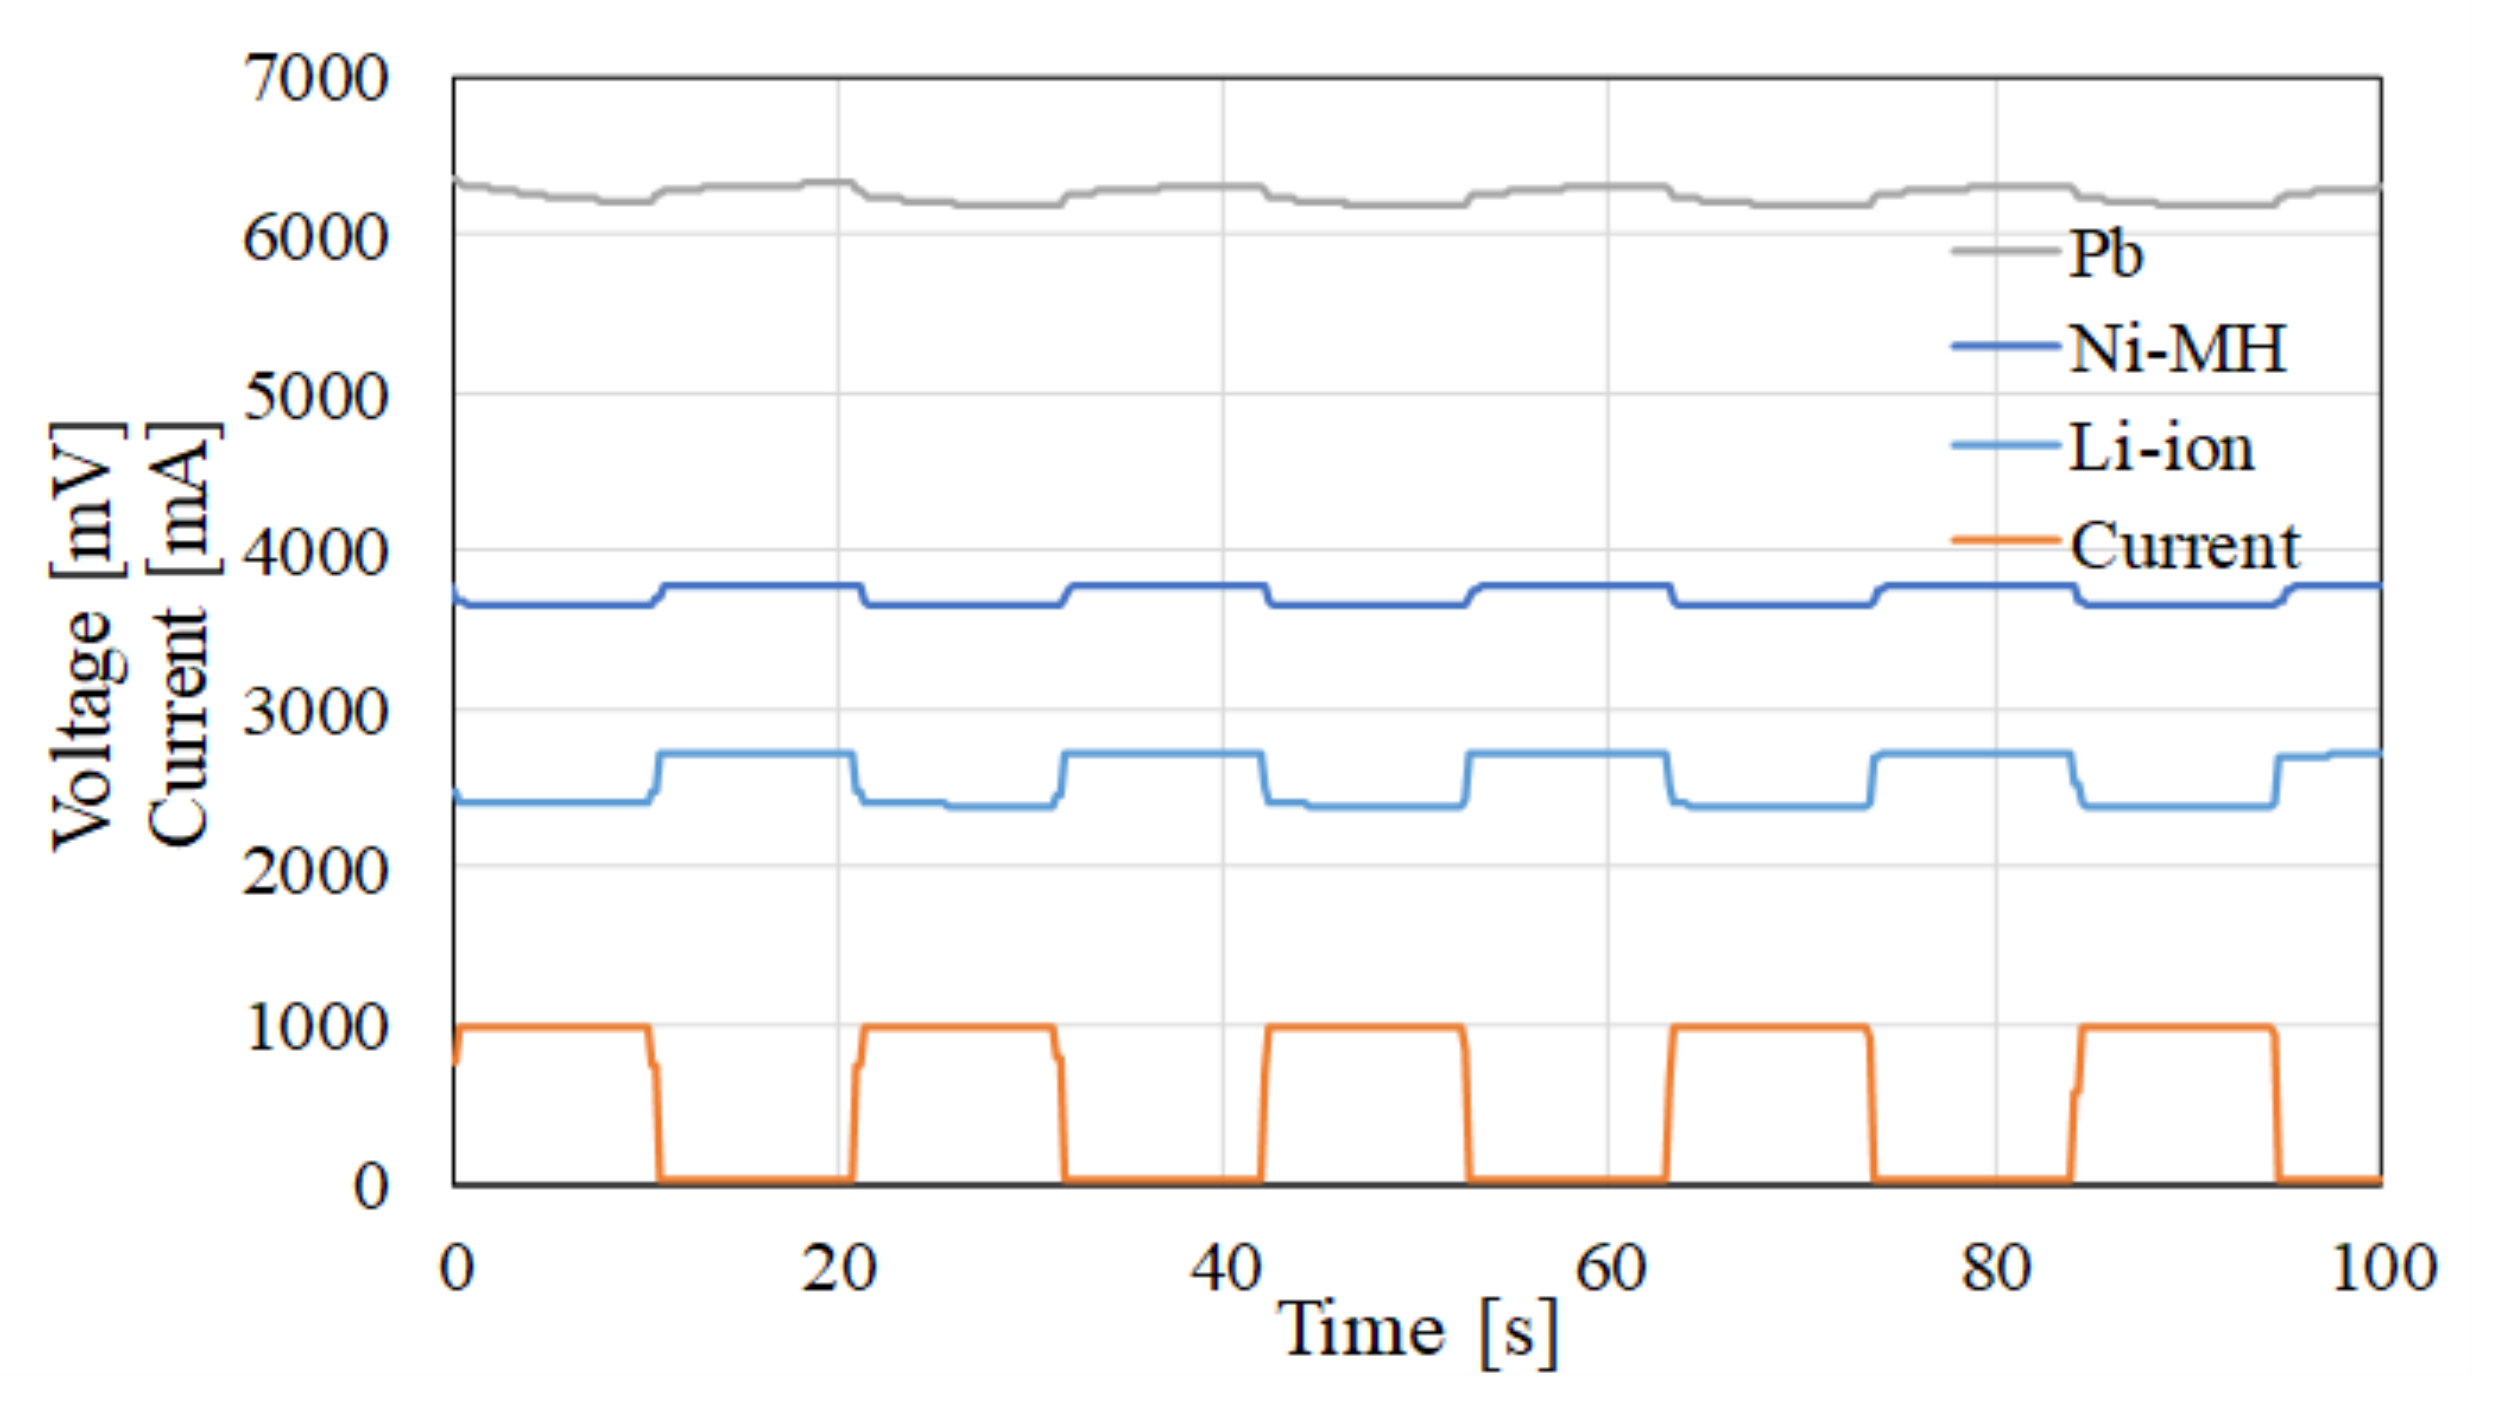
Figure 9 shows an example of the Pb battery characteristics or other chemistry type by a CCCV charging. The proposed system can charge/discharge battery cell/pack with a pulse waveform or any other arbitrary waveform. The proposed system can configure the cycle duty of the pulse waveform from 10% up to 90%. Figure 9 illustrates the voltage responses for three types of batteries by a pulse current discharging.
As a contribution from some of the authors of this paper, pulse waveform charging has been considered to extend battery life in EVs [13,14,15]. It clarifies the differences of the battery characteristics as the transient responses. Figure 10 shows the use of arbitrary waveform based on the sinusoidal waveform.
Figure 11 shows the usage of an arbitrary waveform based on a dynamic discharging operation of the 3 series and 6 parallel configurations with the developed BMS circuit. This model tries to simulate the real behavior of an EV operation through the practical tests carried out using the proposed system.
The capability of the arbitrary waveform operation and the scaled-down battery configuration of the proposed system gives the possibility to study and test the battery pack for the real application using any actual power waveform. The feature is suitable for the investigation of BSS not only for EVs but also for renewable energy generations because the system simulates the dynamic and various characteristics of the generators and loads. In the following section, two simulated examples of the proposed system for renewable generators are explained before the application to EV’s BSS.

2.3.1. Photovoltaic Generator’s Storage System

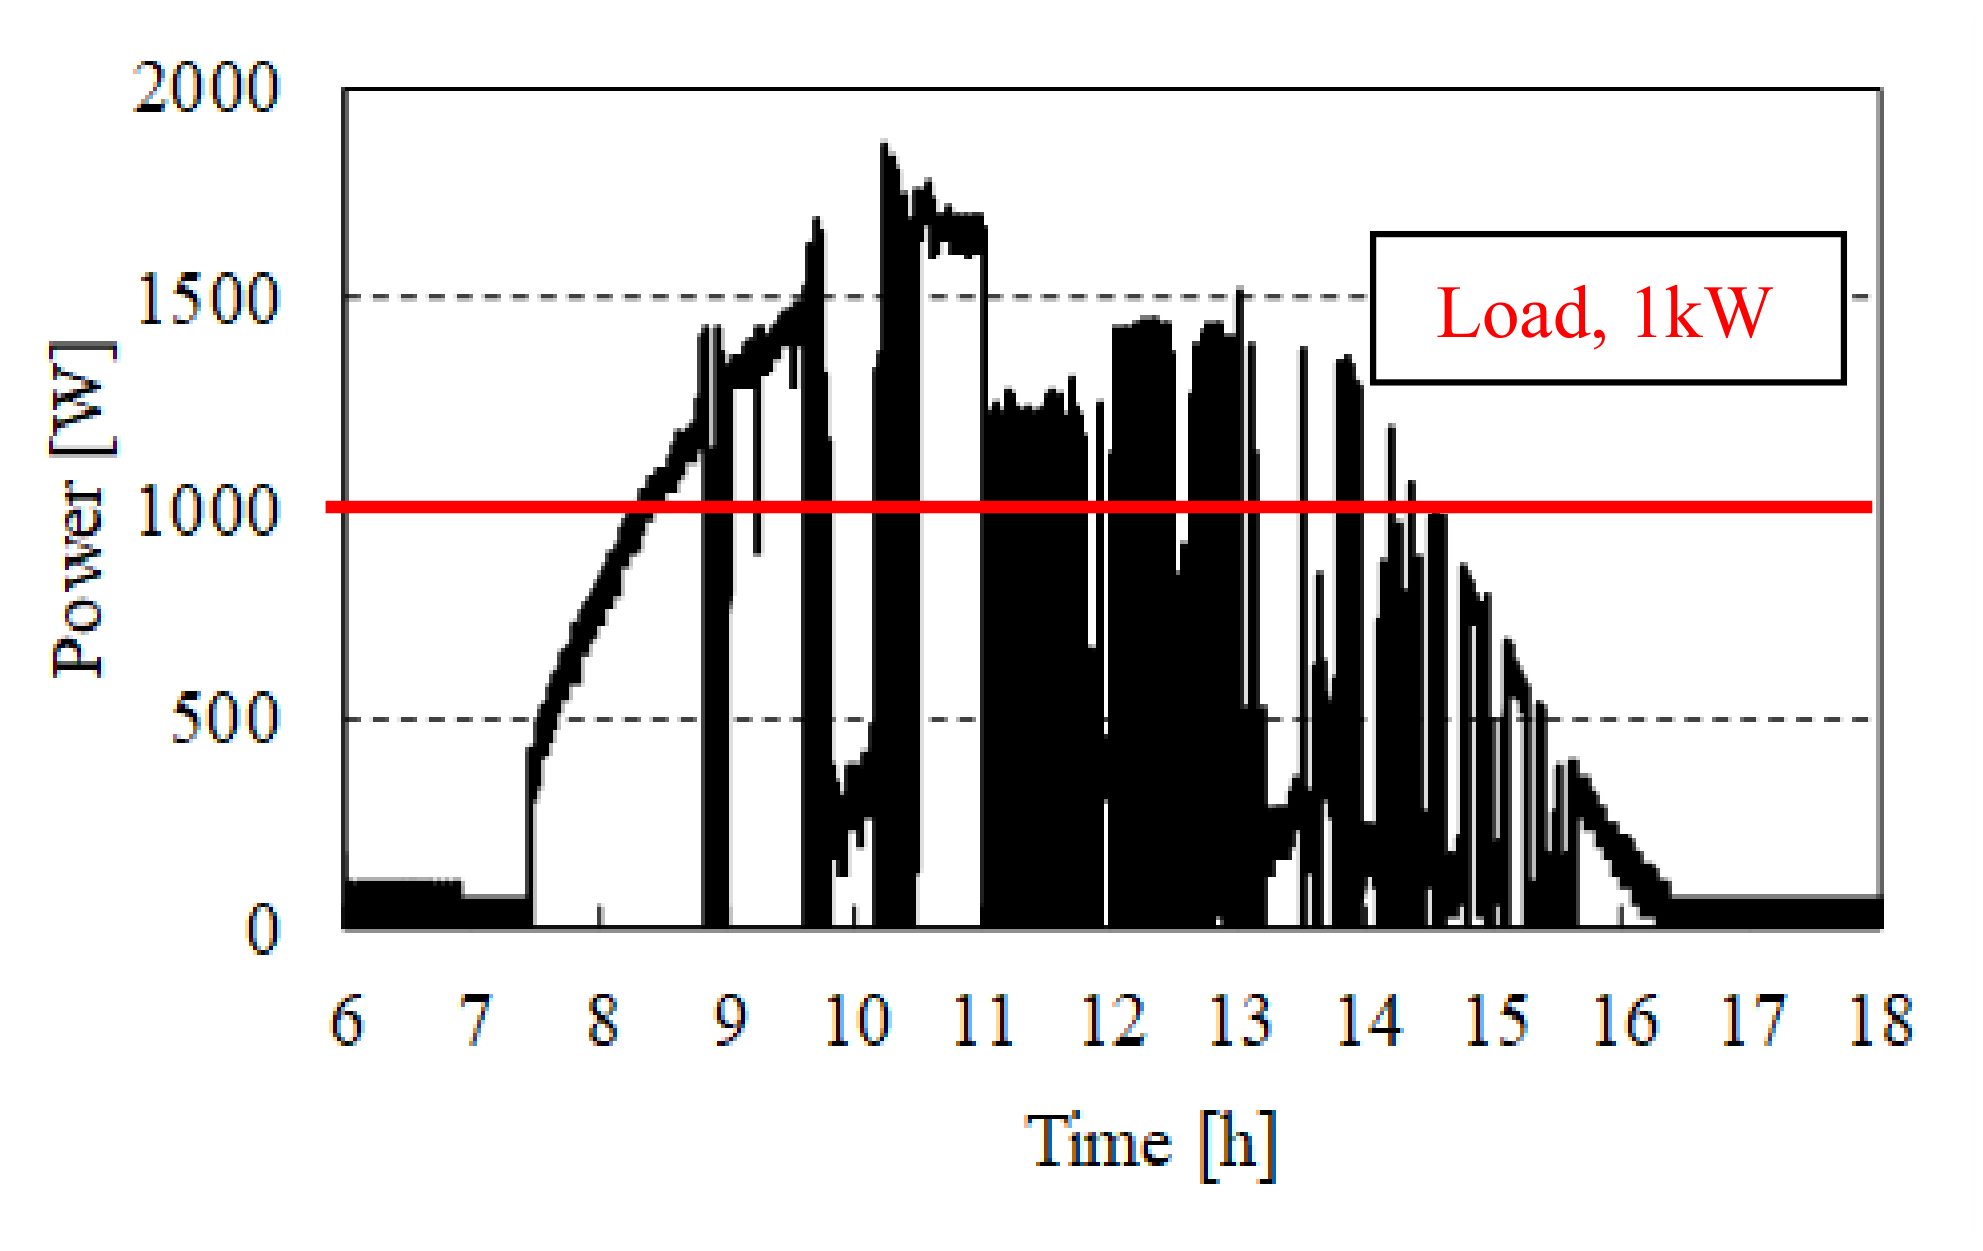
PV power generation converting solar energy directly into electricity has attracted attention due to its renewability and sustainability. PV generation is very positive for daytime applications at a high-power demand; however, it cannot generate at night. Also, its generation depends on the weather and topography, and its power is reduced by shading, etc. To resolve such inconveniences, it needs the usage of rechargeable batteries for storing the generated power during daytime, also for smoothing power production. Below is explained the operational characteristics of an independent PV power station of 2 kW capacity. Figure 12 shows an example of the generated power in winter, including the fluctuations generated due to cloudy weather.
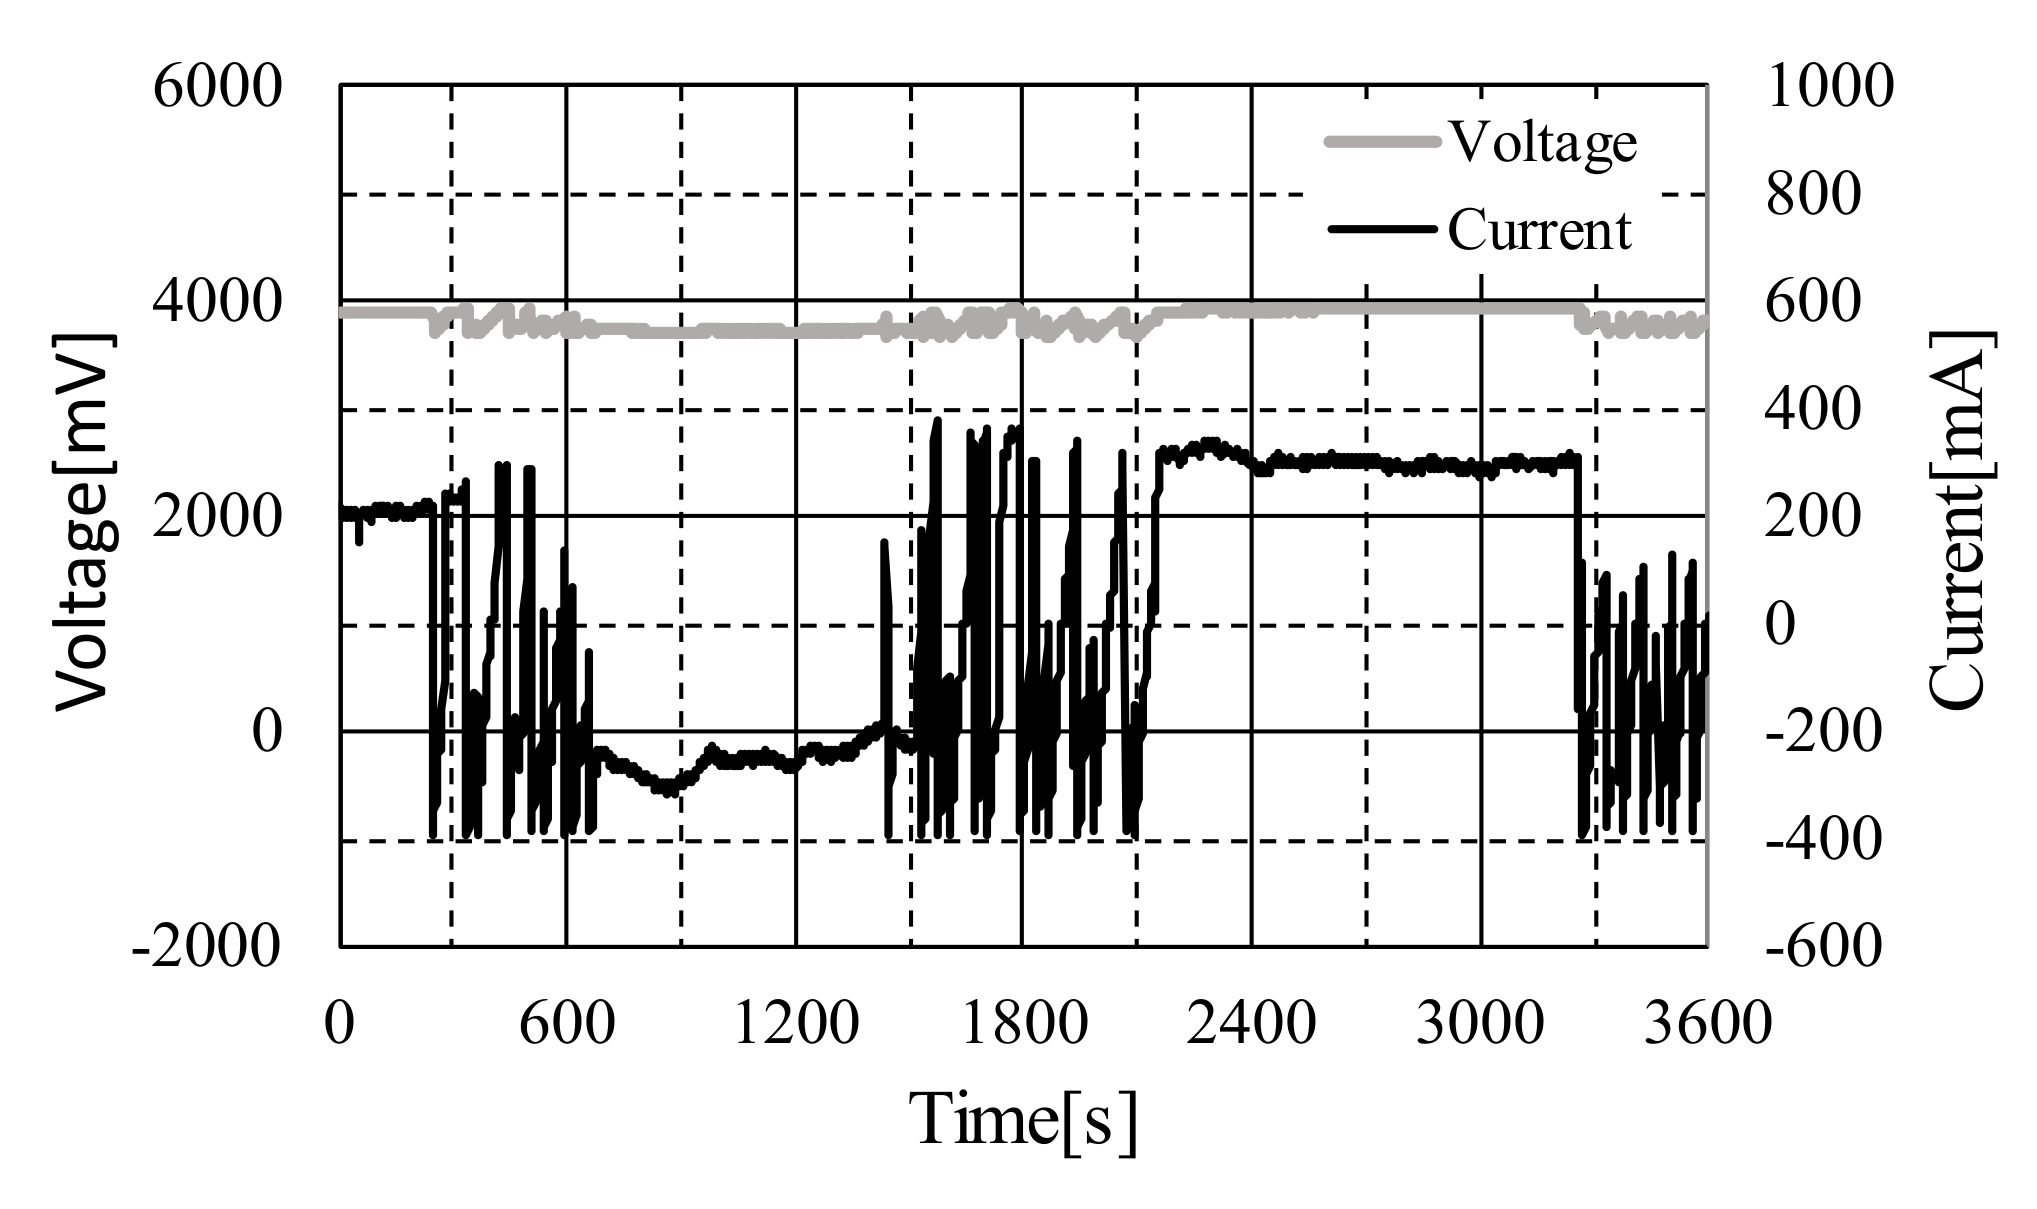
The BSS of 5 kWh capacity was assumed as a storage facility in this simulation and was modeled by two 18650 type Li-Ion cells. The rated voltage of the Li-Ion battery cell was 3.7 V, with rated capacity 2250 mAh (8.325 Wh) and 3250 mAh (12.025 Wh), respectively. The reason for using two different battery capacities was for confirming the generalization ability of the system. The charged or discharged power for the test using the hardware simulation was reduced to 1/625 for 2250 mAh cell and 1/416 for 3250 mAh cell. The characteristics from 9:30 AM to 10:30 AM in Figure 12 were used mainly for the purpose of the hardware simulator test done by the MTC. The peak generated power was approximately 1.8 kW, and the generated power less than 400 W was within 10 min in the period. Figure 13 shows the voltage and current characteristics of the selected battery cell using the MTC.
Its initial SoC of 50% and with the scaled current waveform assuming a constant load of 1 kW. The test was carried out using the measured data sampled at every 1 s.
Figure 13 shows the result for the simulated case when the generated power was larger than the load power of 1 kW, where the waveform fluctuation comes due to the dynamic situation of the charging and discharging process at the same time. Especially during the moments when the generated power was smaller, the insufficient required amount of power was supplied from the battery to the load.

2.3.2. Wind Power Generator’s Storage System

Another type of renewable energy source is wind power. Wind power generation is characterized by a low cost of power generation. In contrast with the PV generation, wind power can generate power at night. Another important characteristic of wind power is the output fluctuation according to the wind speed and the system is usually connected to the high-voltage grid.
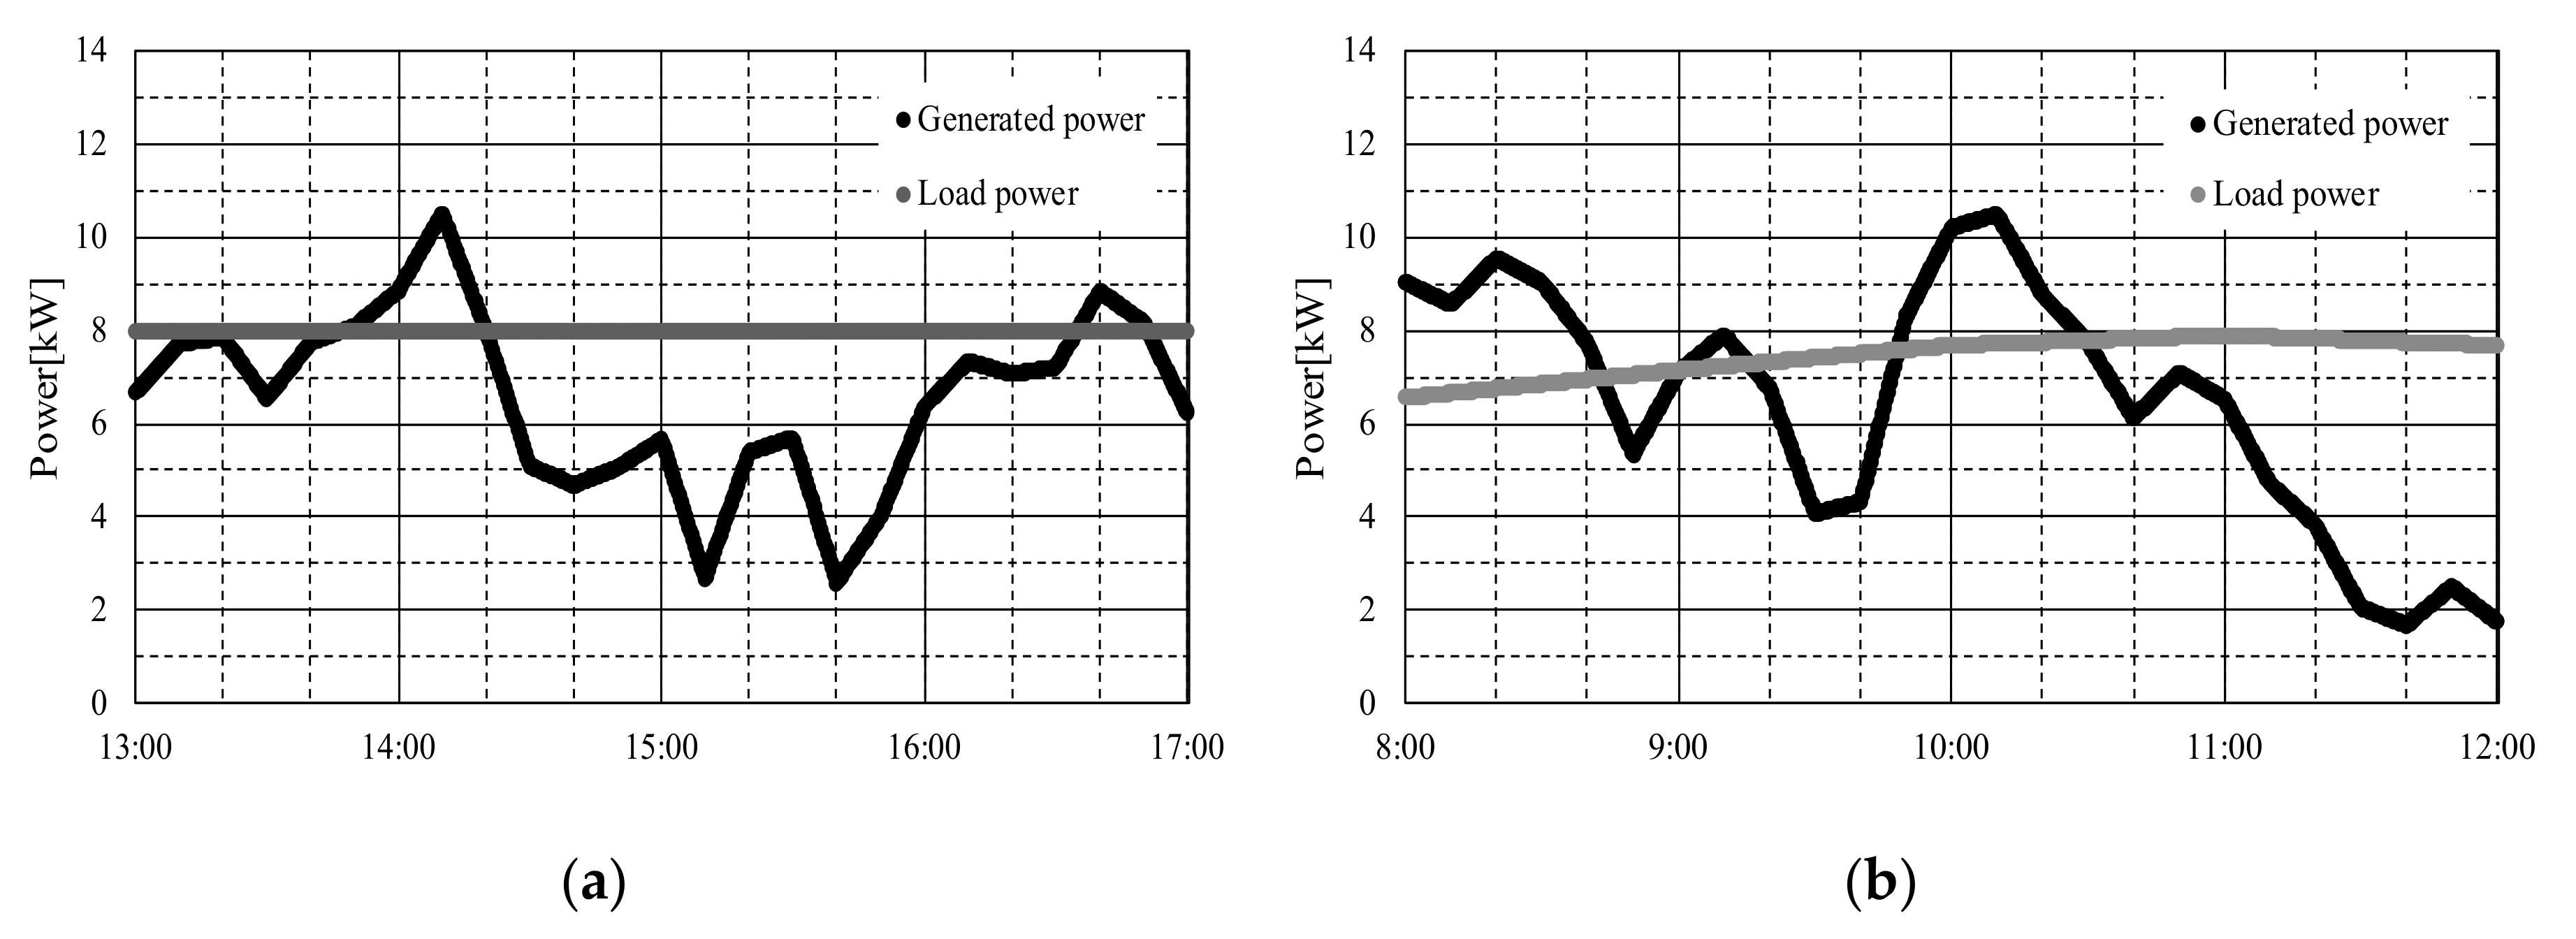
However, in order to use wind power efficiently, a secondary battery is necessary to storage and smooth its generated power. In this section, a test based on a scaled-down model is carried out focusing on the generated power of an independent 22 kW wind power plant based on the real measured wind-generated power obtained during wintertime. The operational characteristics were tested for 4 h using two load patterns as shown in Figure 14.
The dynamic behavior of the generation was included in both figures, for a constant and variable load, where the case of insufficient generation for more than 1 h was included in both patterns. The variable load was assumed based on the standard power system model from the Institute of Electrical Engineers Japan [13]. In the case of the independent grid with the wind power generator, a BSS with 22 kWh capacity was assumed to be installed.
This study was not limited only to the BSS system evaluation, test, and simulation for renewable energy applications. The main focus was the test for the scaled-down capacity model of EV’s BSS applications. In the next chapter, the EV’s BSS is tested during real driving, considering different scenarios of driving.

3. EV’s Storage System

3.1. Driving Test, Measuring and Data Collection

The attention and necessity for the development and improvement of the BSS is one of the main purposes of the researchers of EVs and other power system applications. During the running process of EV or Hybrid Electric Vehicle (HEV), the batteries experience stress from the dynamic operational environment. The EV consists of a storage system, a controller, and an electric motor. Its regenerative energy can be effectively used, and noise and running costs can be reduced compared with the conventional automobile. The charging condition is essential for designing the storage system, while the charging quality of the battery directly contributes to the battery lifetime and EV’s mileage.
BSS models for EV or HEV has been carried out through rigorous analytical procedures. Due to its time-consuming procedure, some assumptions are necessary to make the analysis tractable, which impairs the value of such models. An alternative way is to employ conventional empirical methods, which are variations of the classical regression theme.
In order to solve these issues, the developed simulator is useful for testing the characteristics using one or some cells in the EV battery pack with actual driven data [26,27,28]. In this paper, the experimental data are obtained based on a test made on the Nissan Leaf 2013 model.
The configuration of this battery pack is shown in Figure 15 and it was scaled down for the MTC hardware simulation. The battery pack was composed of 96 modules in total, connected in parallel of two groups each with 48 modules connected in series (48S2P). Each module was configured by 2-series and 2-parallel Li-Ion battery cells. The rated power capacity for the battery pack was 24 kW with a rated current of 65 Ah (1 C = 65 A) and rated voltage of 360 V.
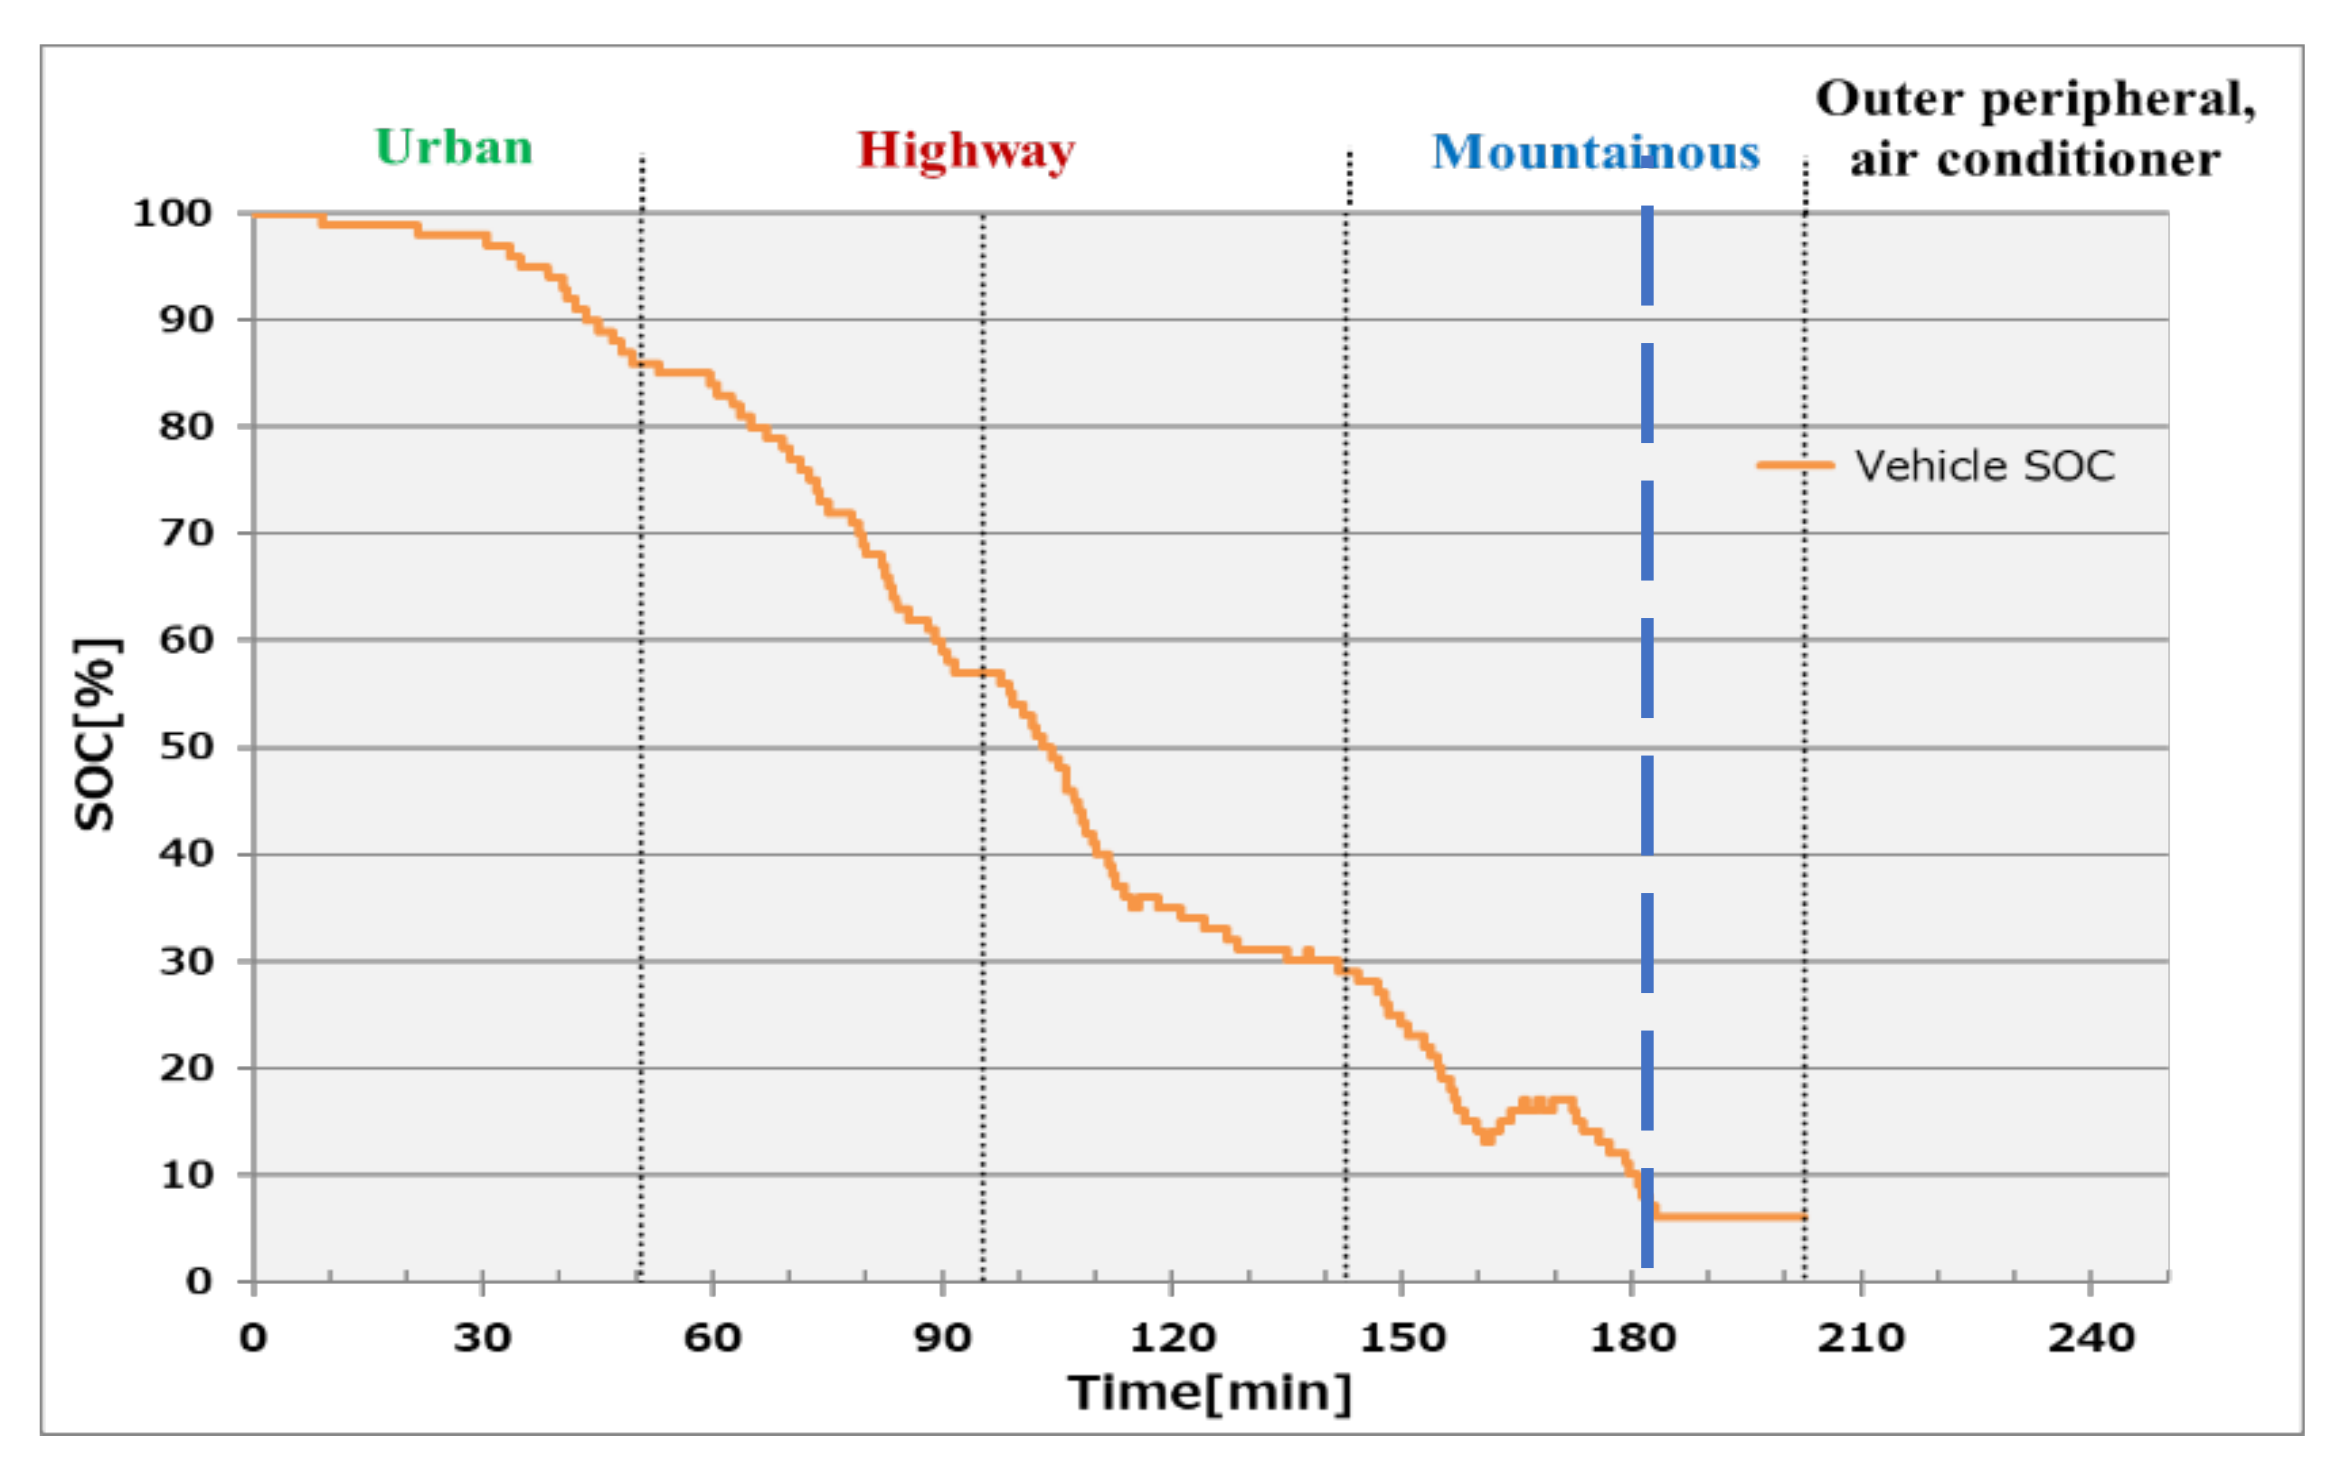
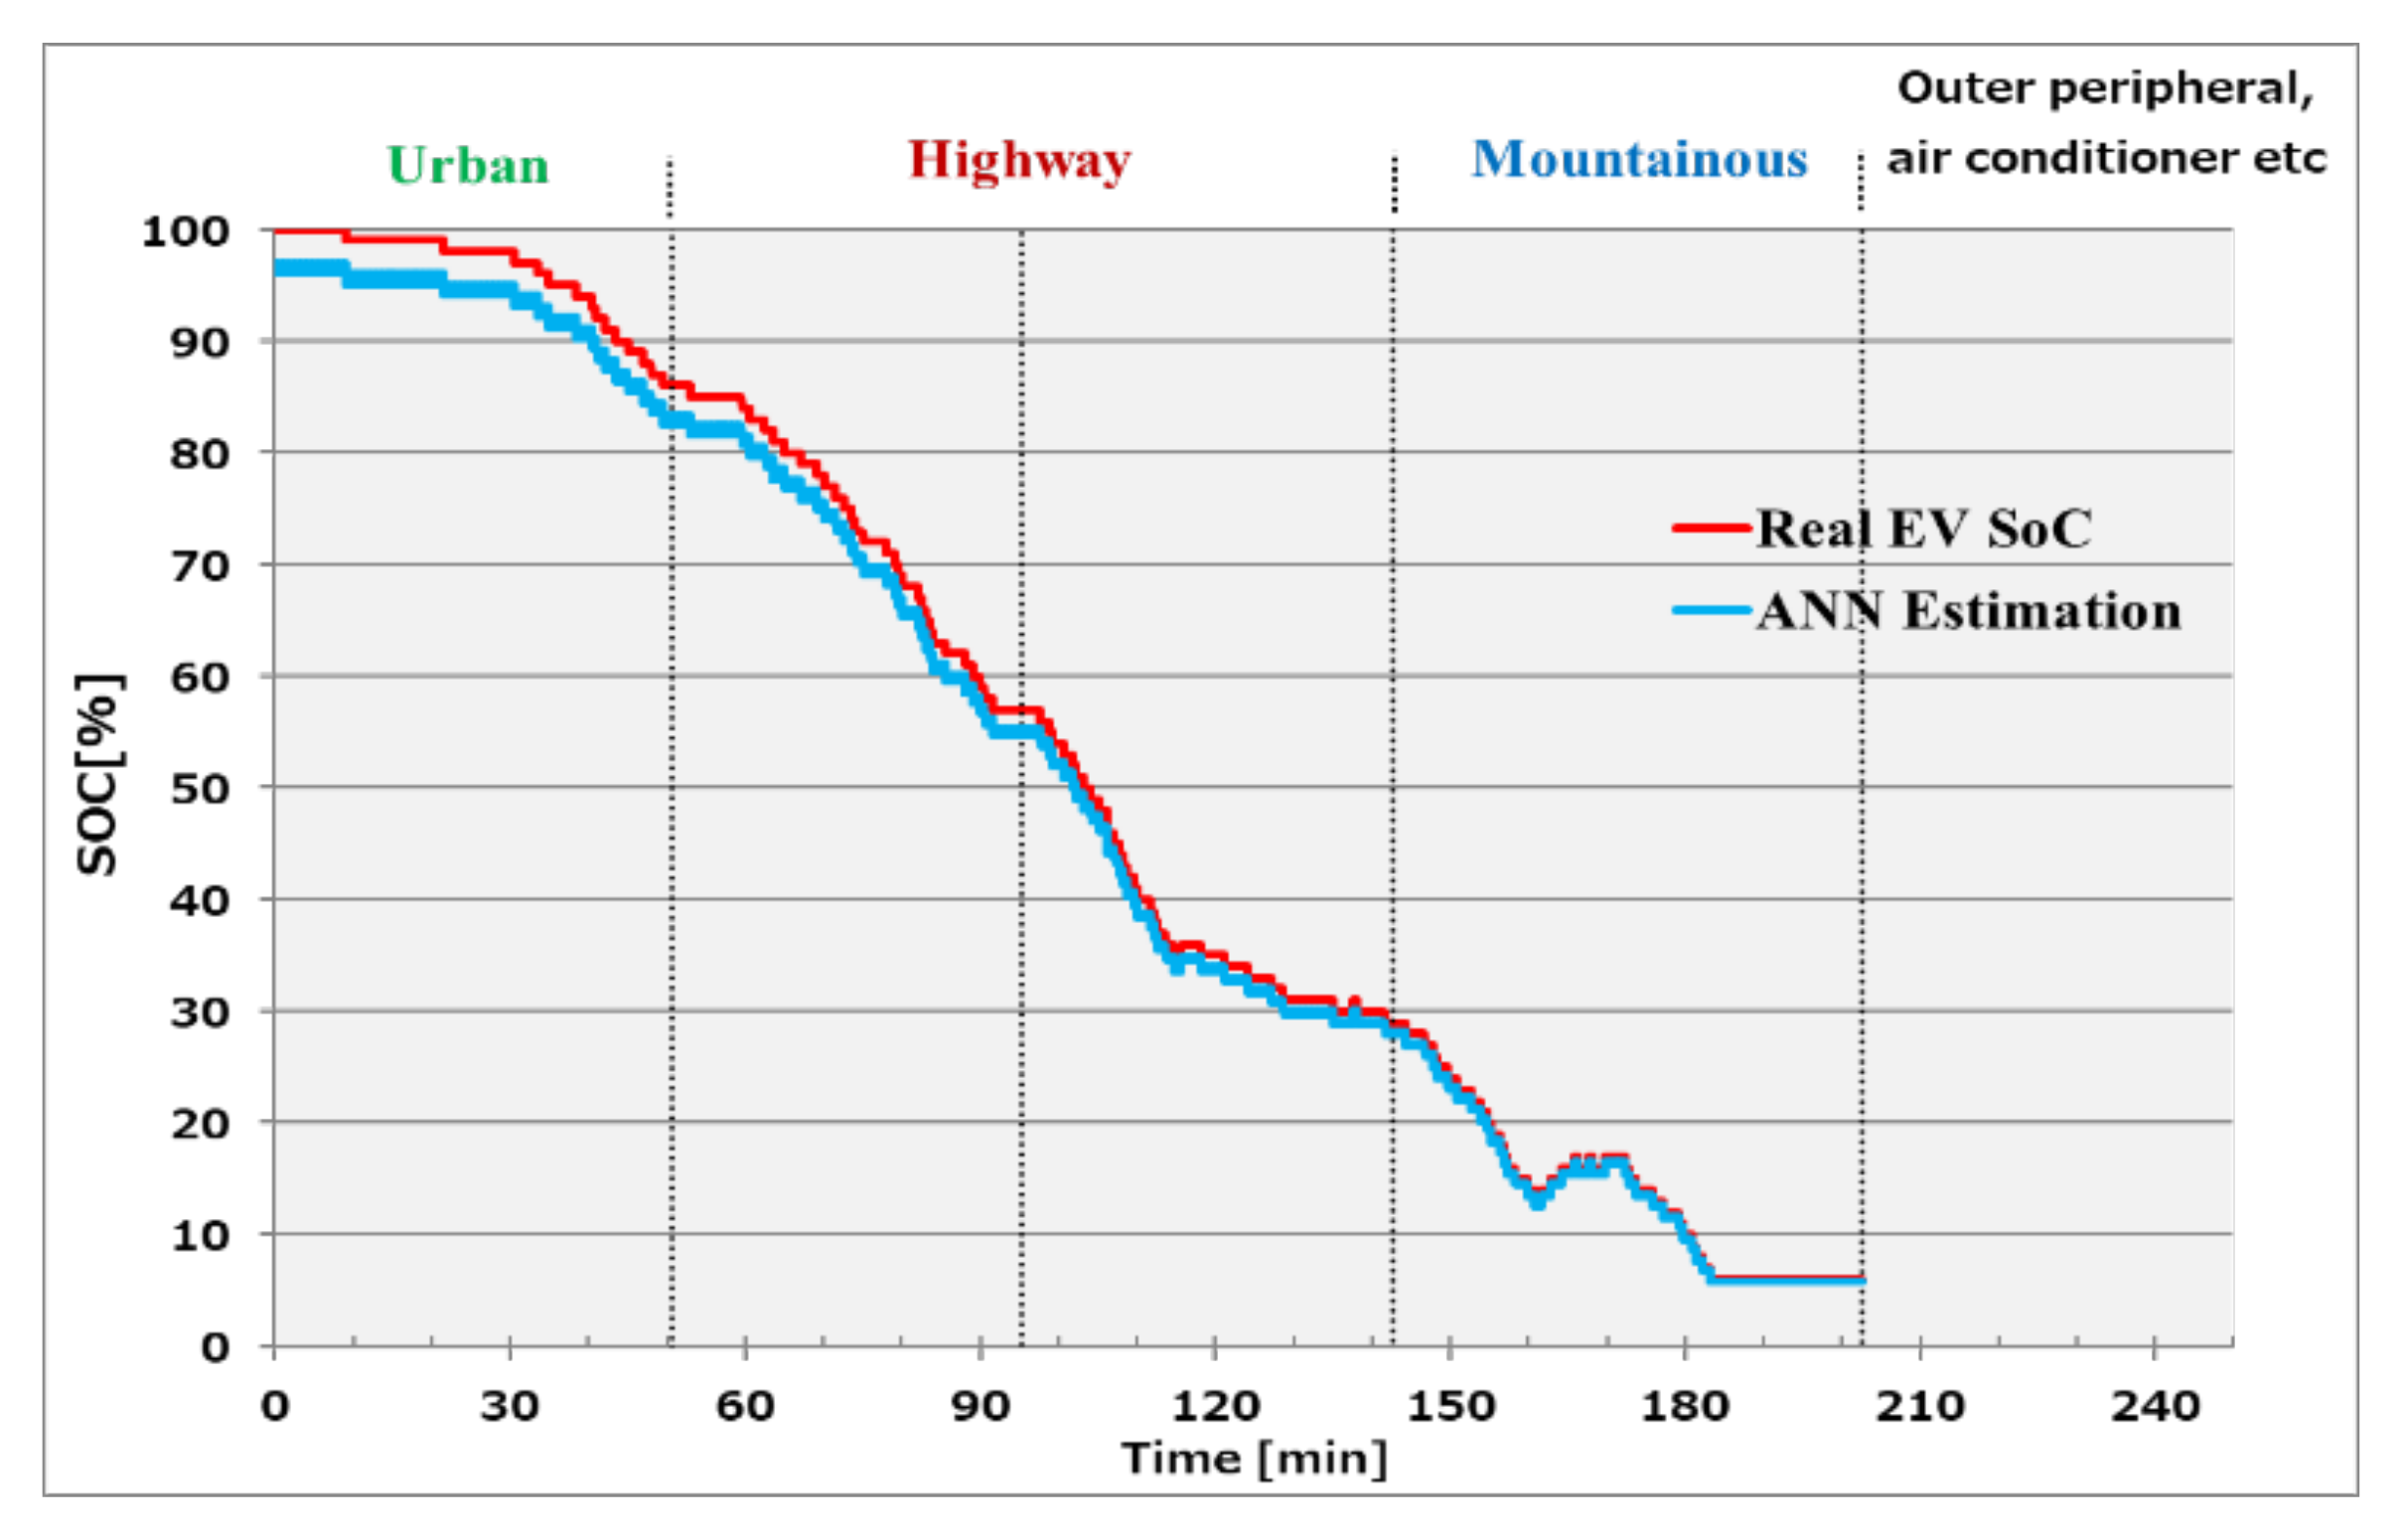
Figure 15 shows a measured SoC curve of the battery pack to be evaluated. This test included all types of scenarios, from fast, slow and average driving speed, and typical terrains. As shown in Figure 15 the test starts in the urban area, and enters to highway driving of about 90 min, followed by a driving in mountainous terrain, until the battery pack SoC reaches 6%. At this moment, the car stopped and could not drive further due to the safety protocols. After that, the battery was fully discharged by using the air conditioner and any other outer peripherals (4th zone). Another important thing to explain is the halt of SoC reading when it reached 6% (blue, dashed line bar), because the device cannot read anymore the value in the stop zone, which means the sensor cannot read further the SoC level.
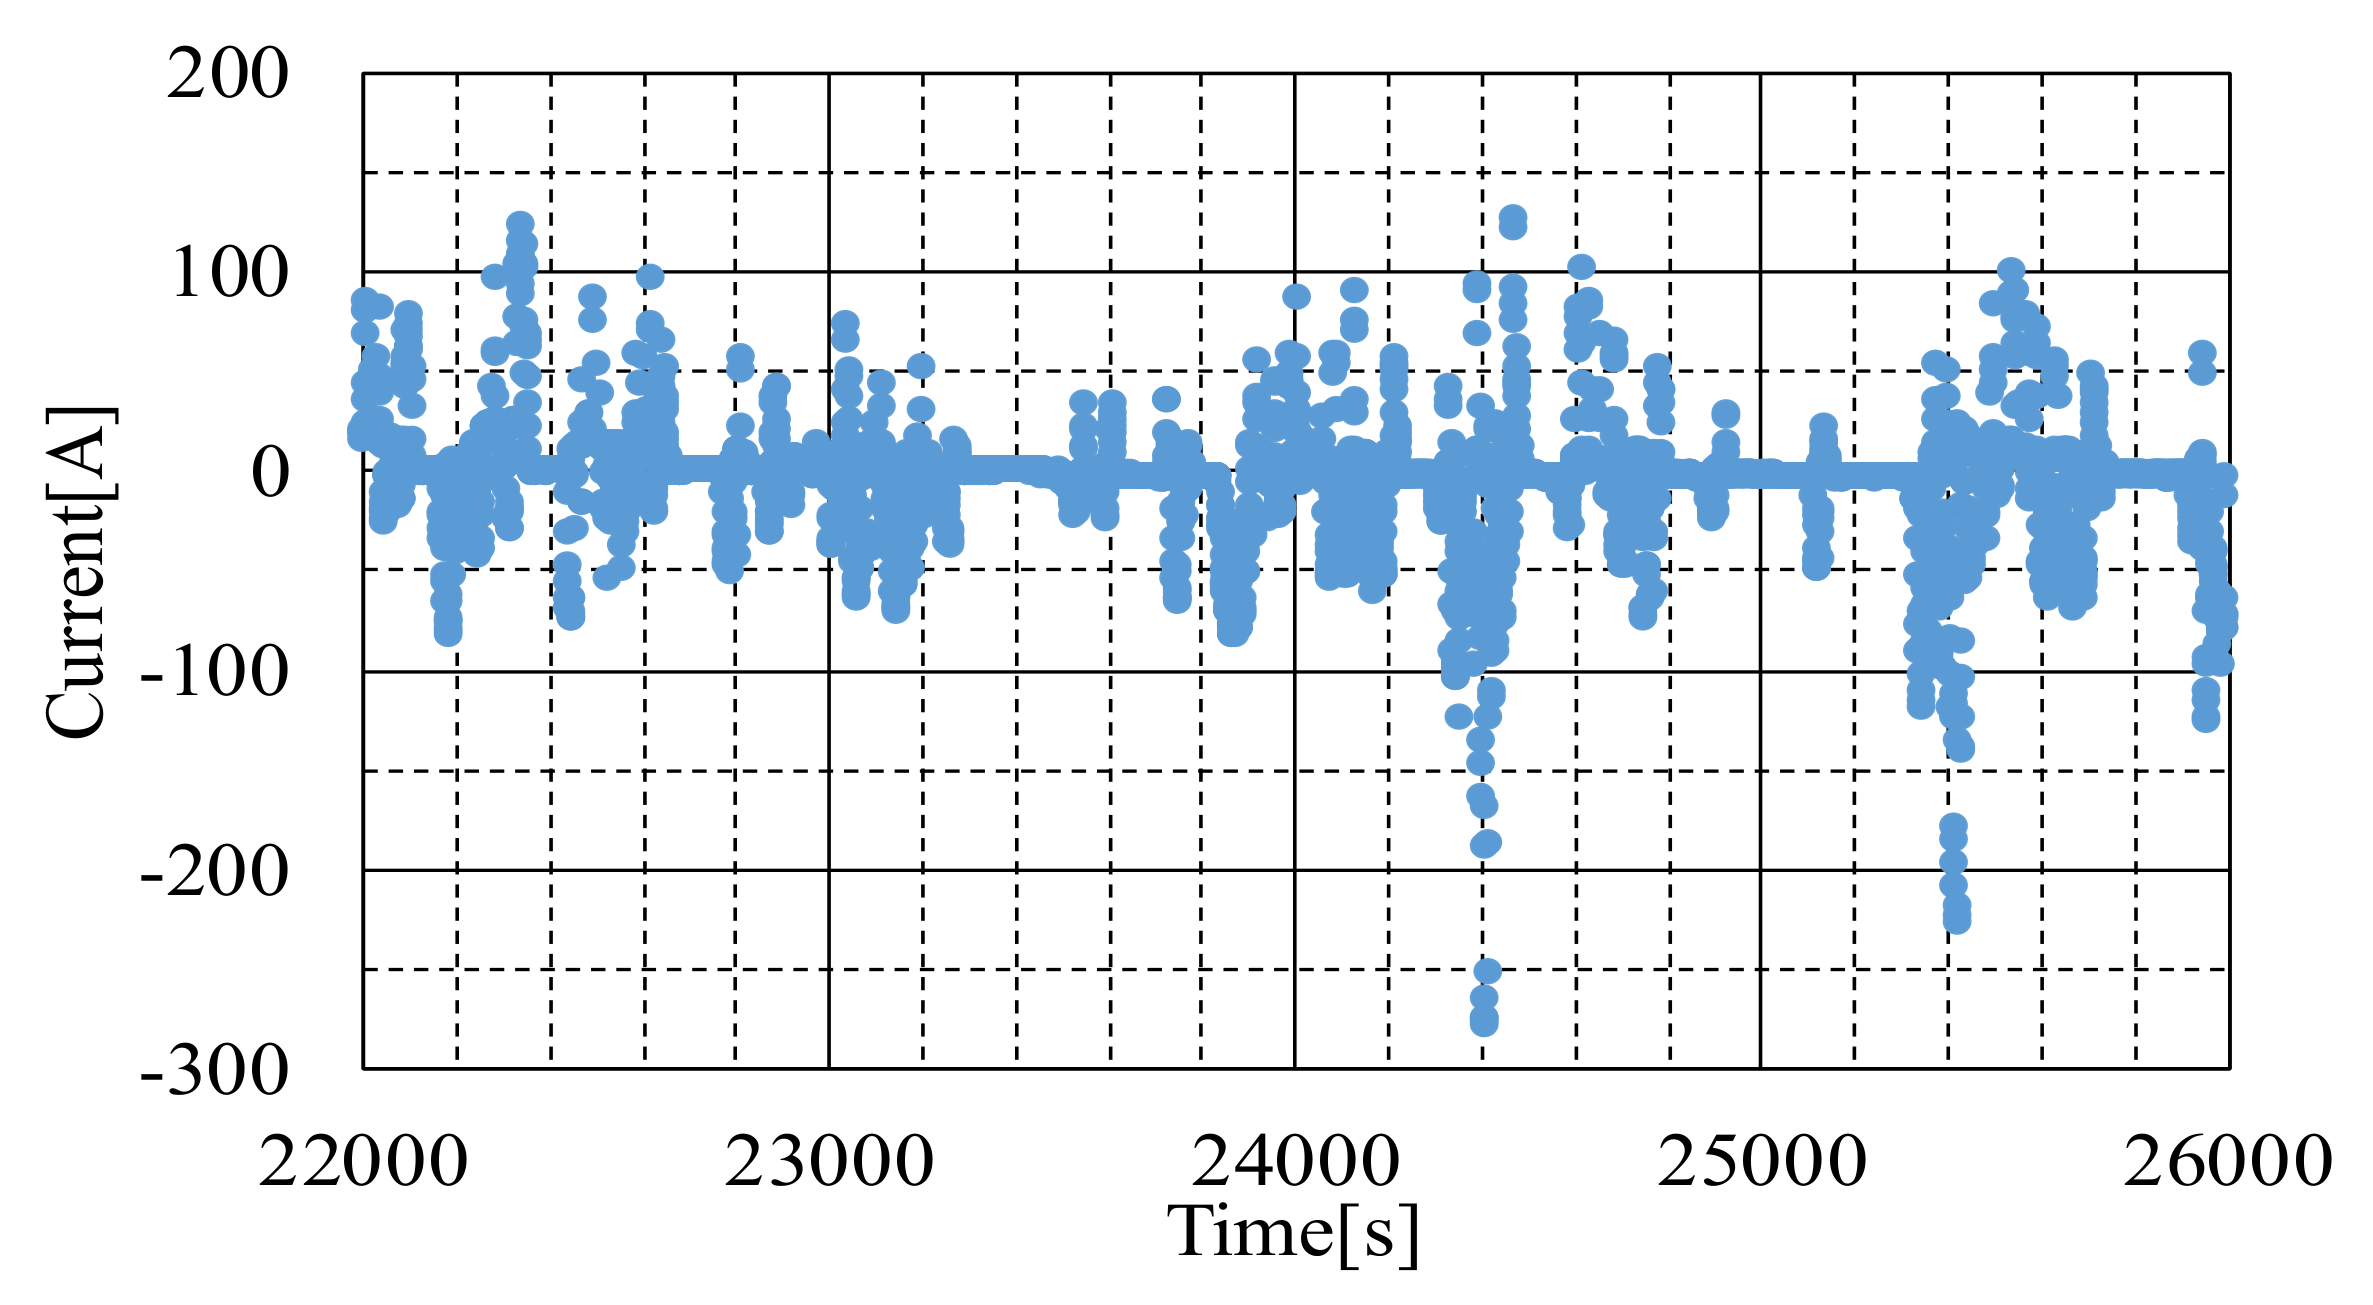
Figure 16 shows the current waveform of the battery pack during the driving test. The current waveform was monitored to understand and monitor the stress of the battery. The negative current means the discharging process of the battery pack, and the positive value means charging due to the regenerative braking system. As shown in Figure 16, the charging current during the urban area test is very low due to the low speed, and the braking cannot charge the battery with enough energy. Figure 17 shows the electric power characteristics of the EV during the driving test.
During the highway test, the braking moments are less due to the driving situation. However, in mountainous terrain, the regenerative braking reaches its peaks due to the necessity to use the brakes more often.
The EV’s test started with SoC of 100%, and the car was not charged from any electric grid or station during the test. All the charging energy comes due to the regenerative braking.

3.2. Scaled-Down Simulation by the Proposed System

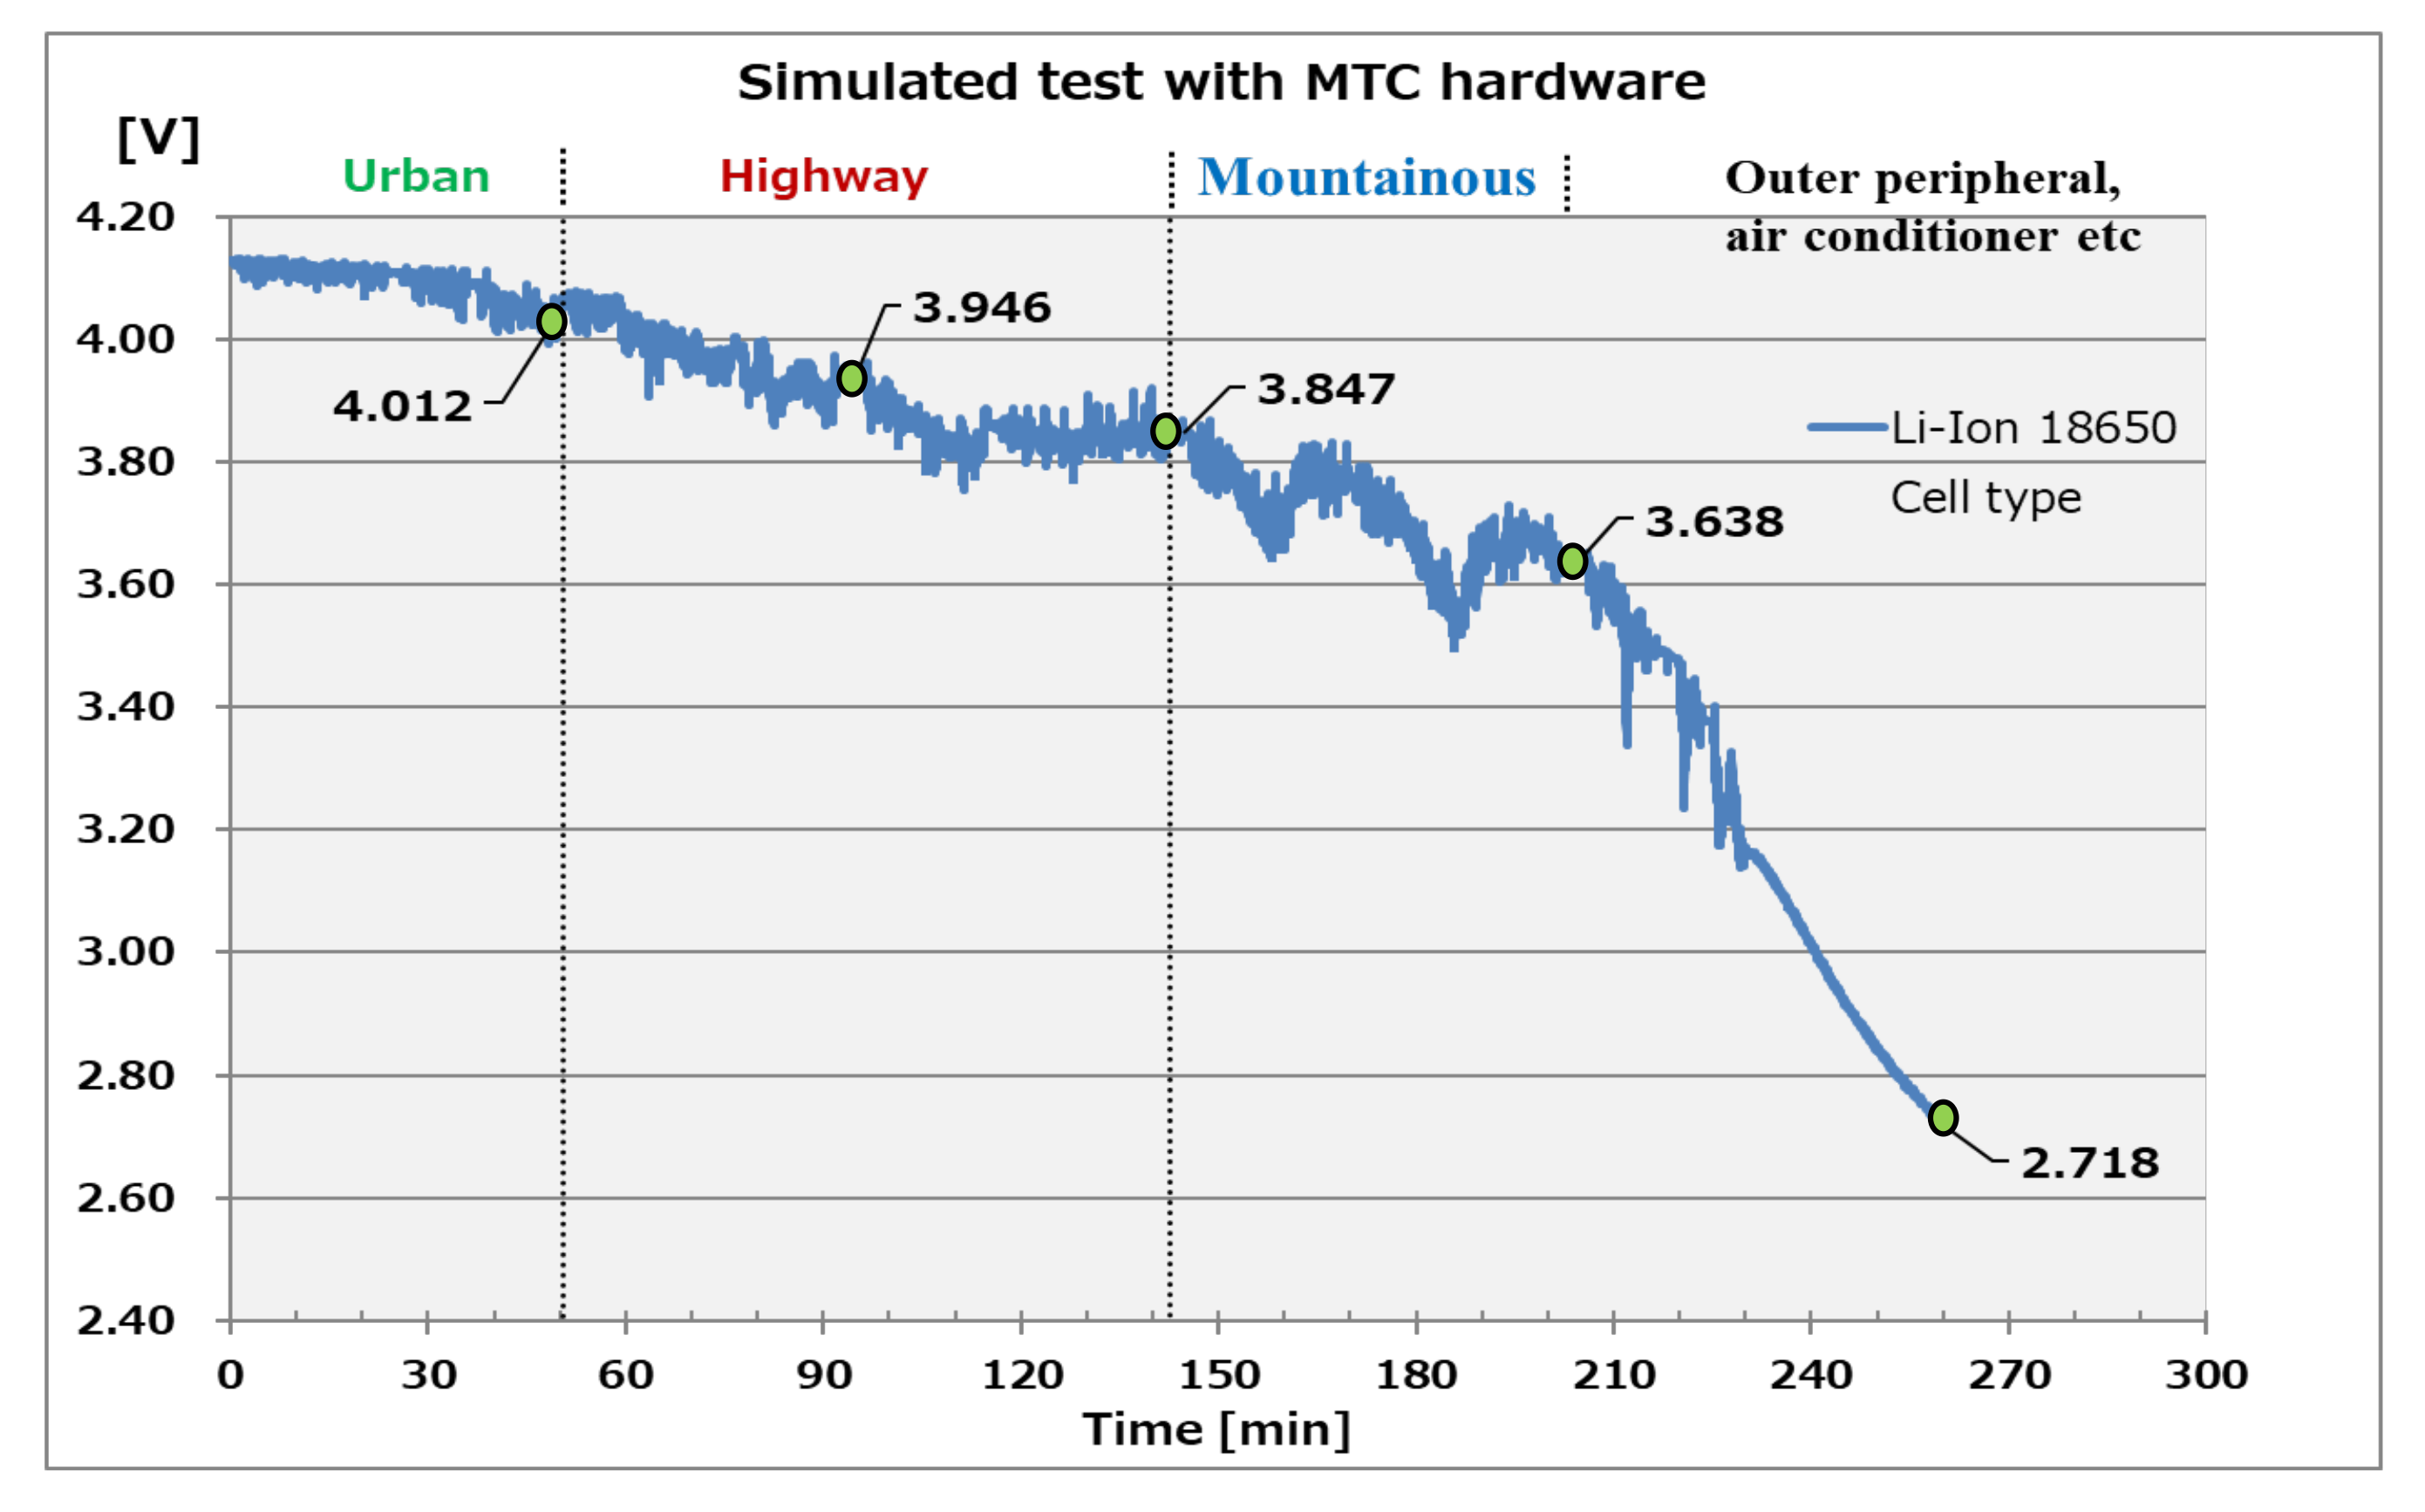
In this section, the charging/discharging characteristics of the practical EV driving are simulated in the scaled-down BSS by the proposed device using the real current of the EV’s battery pack with a 24 kWh capacity. The scaled-down tests are carried out using two types of Li-Ion battery 18.650 cells. The two batteries have different capacity respectively 2250 mAh and 3250 mAh, where the second type can give more current for heavy drain applications. In the simulation, the scaled model is synthesized under an assumption that the capacity ratio is 30, 60 or 90. This ratio is determined from the configuration of the battery pack and based on the capacity of the Li-Ion sample. Figure 18 shows the voltage of the EV’s battery pack during the real driving test. This pattern is used for the comparison and evaluation of the proposed system for the scaled-down test using a single cell. Figure 19 shows the voltage results of a single cell obtained from the scaled-down MTC simulator.
The results are similar to the real EV test as shown in Figure 18. It is easy to understand the similarities between Figure 18 and Figure 19. The total BSS voltage of the EV was possible to be achieved even by scaling down the ratio to a single cell. This ensures the possibility to test a single cell battery based on the advanced algorithm and estimating the behavior of a real BSS of a large capacity. Through this method is possible even to estimate the characteristics of every single cell that composes the BSS, also by analyzing the voltage and current output of each cell. The difference from the proposed scale down simulator with the real EV’s BSS is stably maintained within 1.4% deviation during 97.8% of the total waveform, and the deviation reaches the maximum value of 2.1% differences only in some moments. The testing time of the scaled-down model is the same as that of EV’s driving test, this helps to increase the accuracy of the test and to incorporate the ability for reliable analyses. During the transient moment, the driving pattern change from one terrain to another one of these data collected for further investigation, which helps to understand and predict the behavior of the driving mode. This number is shown specifically to emphasize the importance of this moment as shown in Figure 19. Another important thing and innovation of this scaled-down simulator is the possibility to decide the minimum and maximum voltage level of the cell within the safety level of operation. As a matter of fact, over-charging and over-discharging levels are very severe in the lifetime of the battery which directly affects the SoH and degradation speed. In this study, the minimum voltage is chosen 2.7 V and a maximum voltage of 4.15 V, where these levels give the opportunity to test the full potential of the battery cell and understanding some physical meanings during specific regions of SoC.
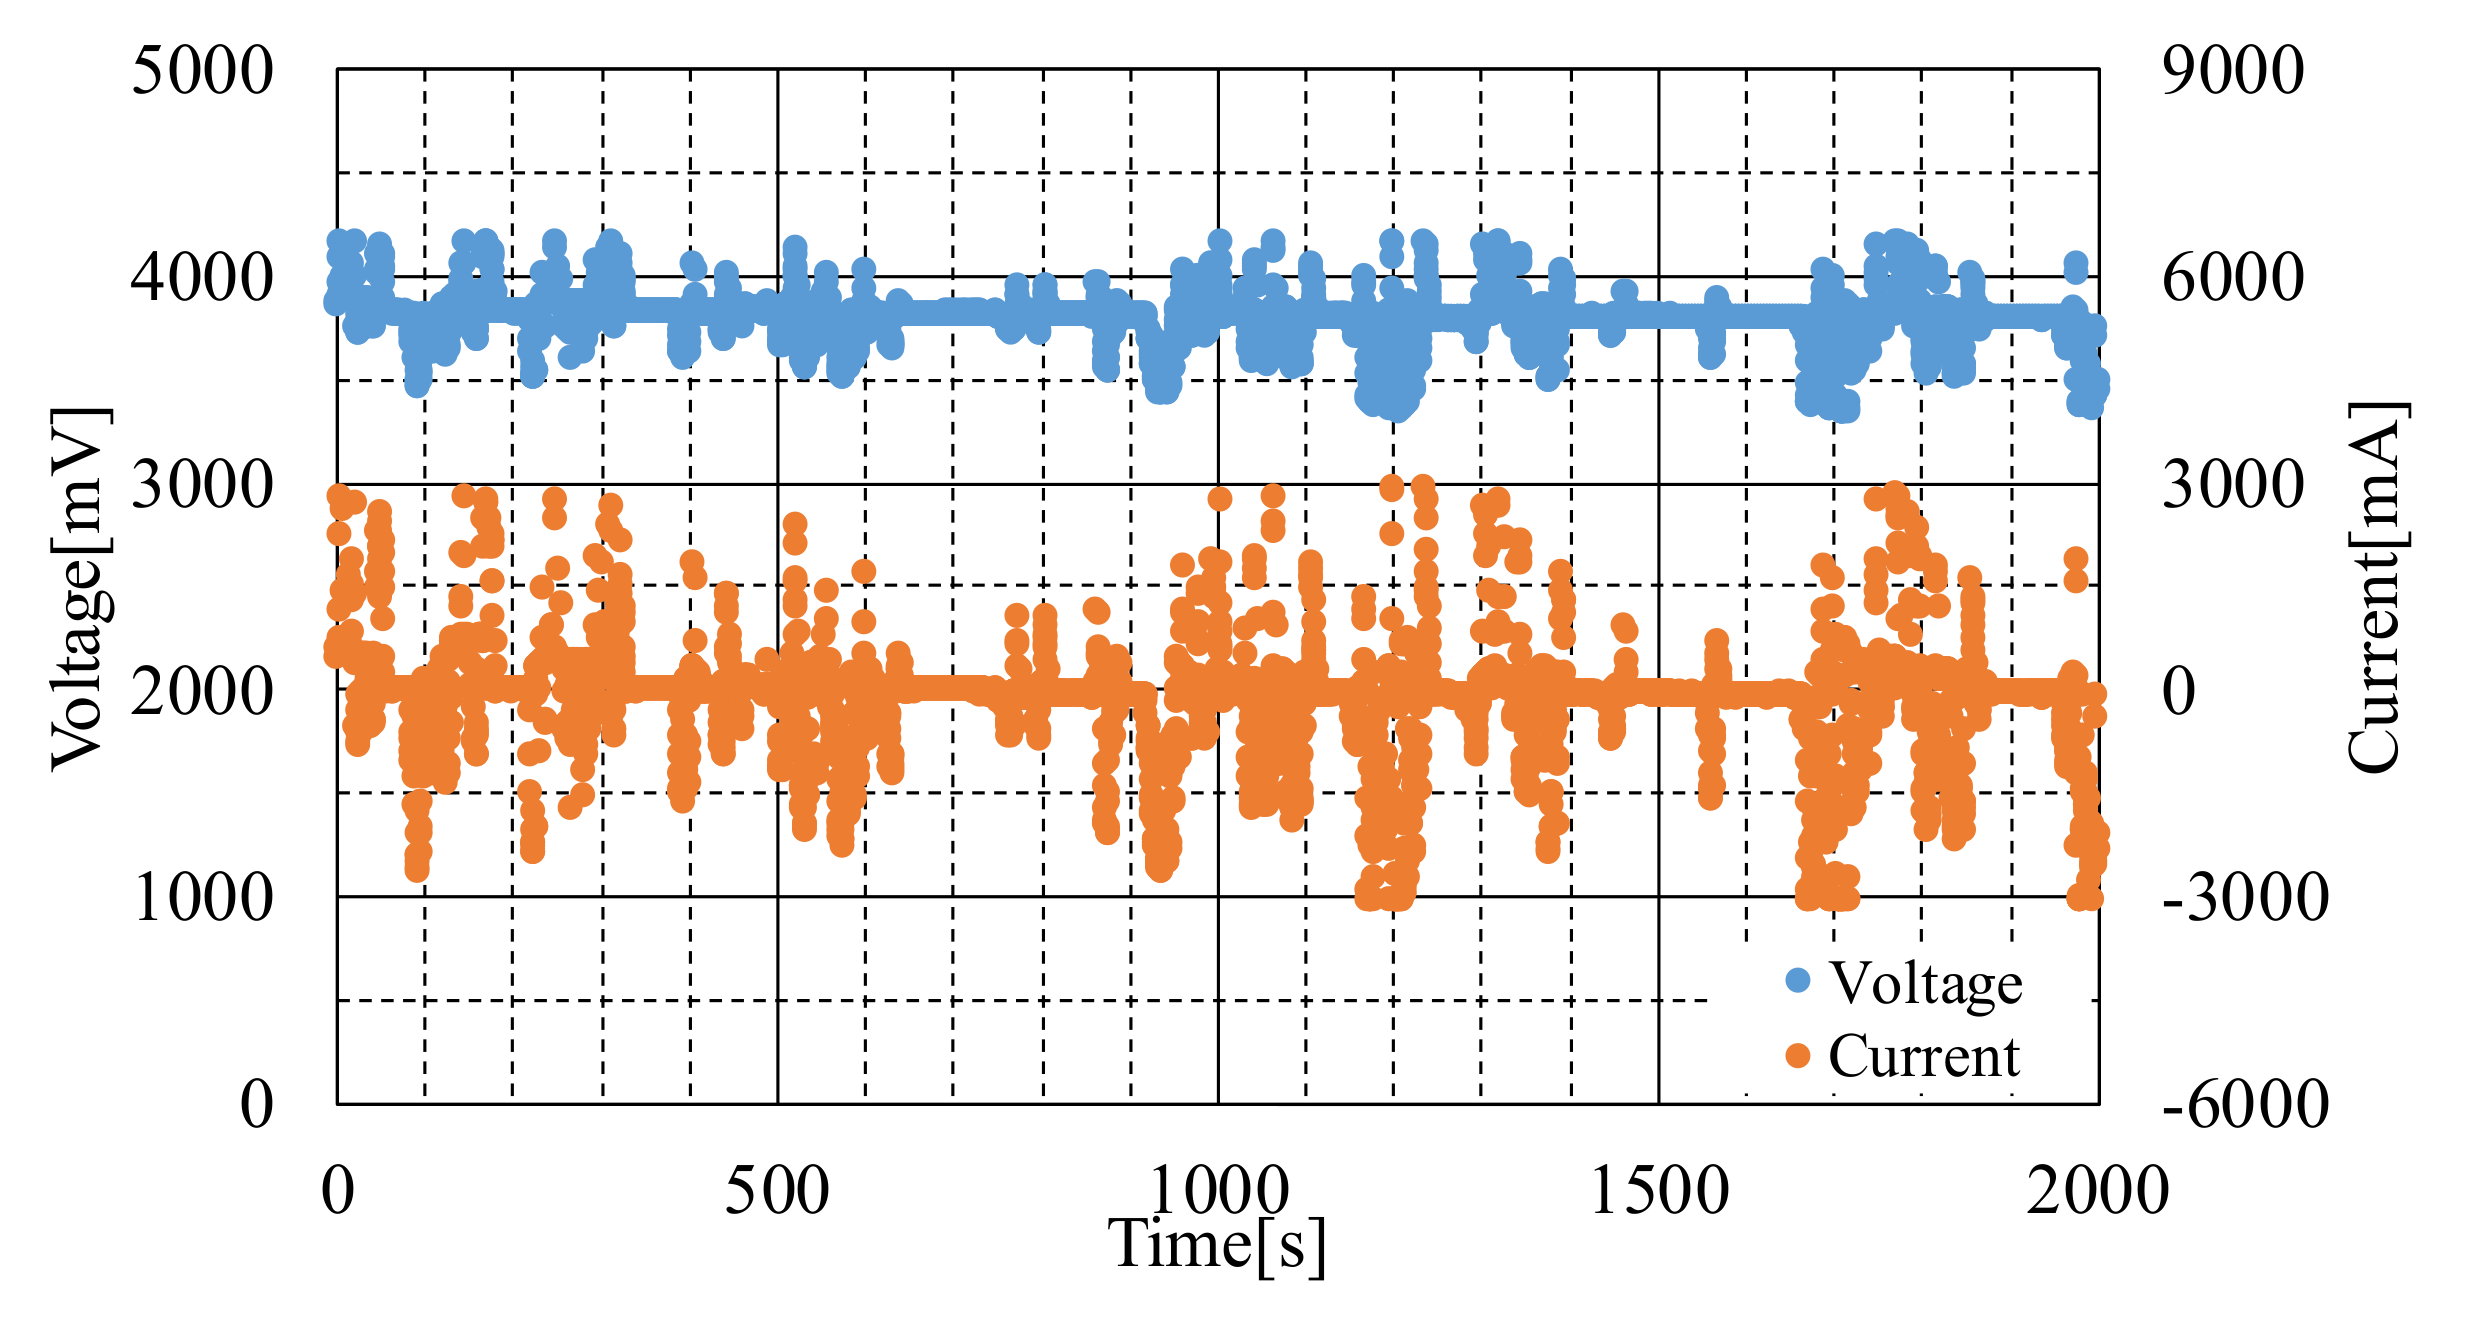
Figure 20 shows a magnified current pattern while EV is driven. The battery voltage obtained from the scaled-down simulator is shown in Figure 21. These figures show the accuracy of the current control of the proposed system. In addition, this feature gives important information to engineers for the development of efficient and better battery operating systems, and for better SoC estimation methods. In simple words, this means that it is possible to learn, use or simulate any practical waveform and patterns and furthermore it is possible to stress a single cell or few cells in a specific ratio and being able to estimate the practical pattern as if the experiment could have been conducted on a real BSS. The similarities of the peaks and the dynamics-fluctuations are maintained the same as shown above. But the most important to highlight is the fact that this system can handle any arbitrary waveform, not just a simple CCCV mode. This helps not only to study the behavior or the BSS before manufacturing but as well it serves as an analytical tool for the applied system itself, which brings the ability to investigate the potential of the system with specific BSS compositions.

3.3. ANN Estimation Model

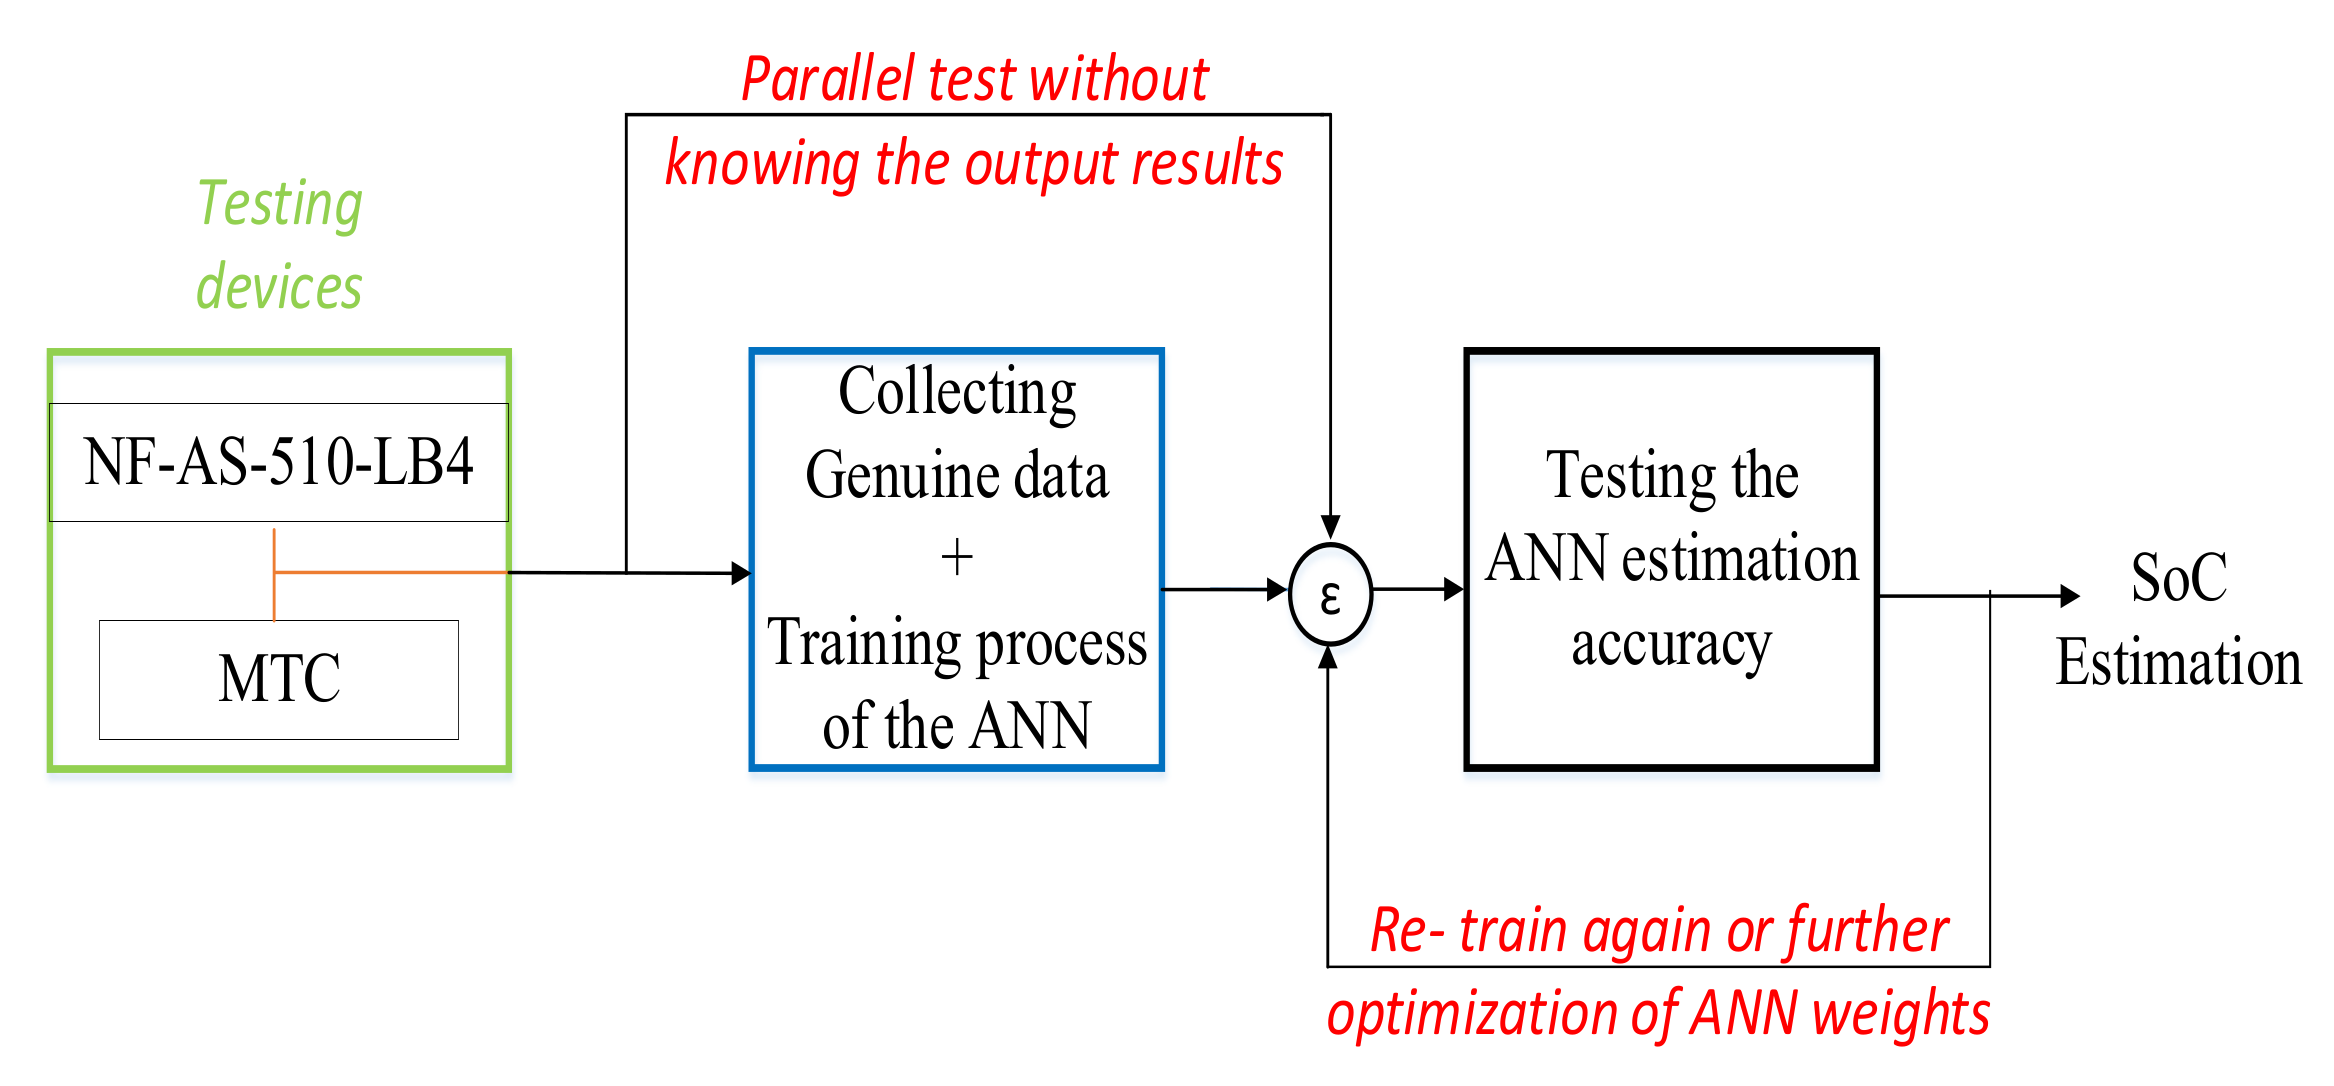
The proposed simulator gives accurate characteristics of the BSS based on the scaled-down cells, and its reliability has confirmed through the comparison of real data. This conclusion opens the door for other developments and tests. By creating a different scenario, it is possible to create various data for training ANN, which estimates SoC or SoH. During estimation, the results are compared at the same time with a practical test based on the unsupervised learning process (UL). If the accuracy is low, then ANN will continue to train and updating its weights until the error is reduced and the structure is finally optimized.
Although the SoH estimation is not the main focus of this manuscript, the authors are under investigation regarding this matter, and some papers are already published using the proposed MTC device as a cost-efficient method of the SoH evaluation method.
In addition, the data can be used for a more advanced ANN model which estimates the internal impedance of the battery as well as SoC and SoH in real-time (during operation) [9,11,12,28].
ANN is one of machine learning (ML) techniques based on reinforcement learning (RL), supervised learning (SL), and unsupervised learning (UL) method, which electronically imitates the neural structure of the brain. This approach consists of three processes, learning, validation, and test. During the training process, the selection of the most appropriate NN composition is very important, and each of the ML techniques has its typical structure and properties depending on the specific problem, as explained in [29,30,31,32,33,34,35]. The typical structure of the ANN is composed of an input layer, a hidden layer, and an output layer. The proposed NN is processed in MATLAB R2019a. For this ANN structure 4 different input sets are used for the training, validation, and testing process, respectively voltage, current, cell’s temperature including ambient temperature and some electronic components inside the hardware simulator. All the data related with SoC value are genuine, which means they are retrieved through practical experiments and test done through MTC and NF-AS-510-LB4. The NF-AS-510-LB4 is a high-end industrial device that will help the study by providing important data with high accuracy, as cole-cole plot, SoC and SoH evaluation, also, will help to do the training of the ANN for the case of static temperature test structure [28]. In Figure 22 is shown the block diagram of the proposed method.
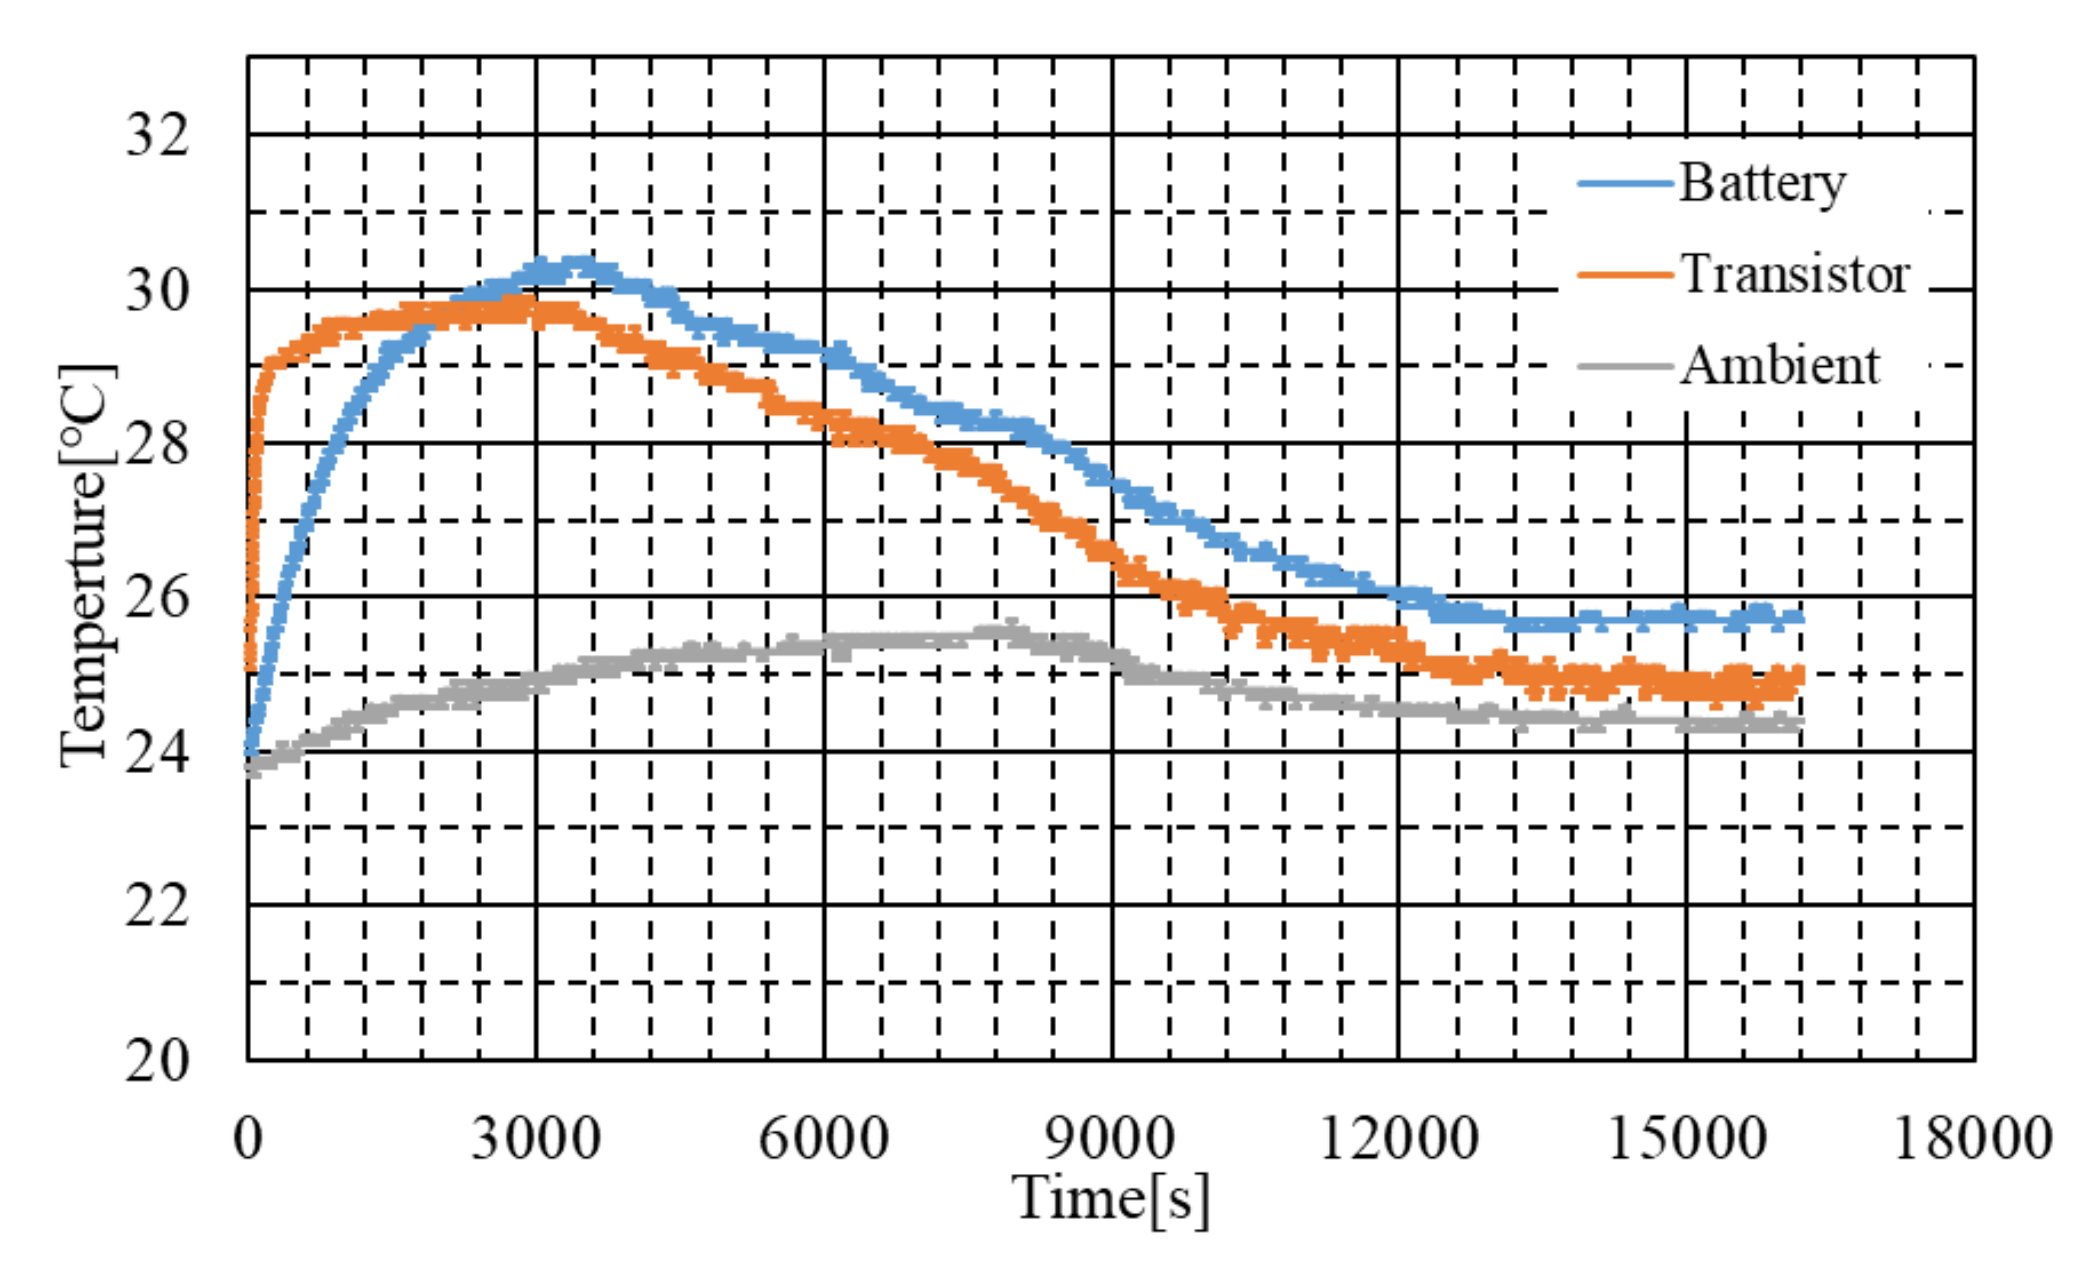
A continuous collection of data and comparison of accuracy between developed MTC device and the confirmed NF-AS-510-LB4. Two sampling scenarios are used for this ANN. The first model has 500 cells for voltage and current, and 50 cells for the temperature. The second sampling is with the double of the first one respectively 1000 cells for voltage and current inputs, and 100 cells for the temperature. Based on the user’s preferences and the required accuracy, it is possible to choose the desired scenario. In Figure 23 is shown the temperature information during an arbitrary charging while monitoring the battery cells, ambient and the MOSFET transistor.
During the first steps of the training, was used a stochastic gradient descent optimizer, which requires that the learning rate should be specified so that we can evaluate different rates. In the beginning the preferred learning rate was set to 0.01, because after the model was fit, the plot of the accuracy of the model on the train and test sets over the training, we could evaluate the performance on each specific learning rate.
After this evaluation was decided to start the learning rate with 0.01 and finally concluding with a learning rate of 0.0015, with batch value of 52. Also, in order to smooth the progression of the learning algorithm, which in turn, can accelerate the training process, it is possible to adapt the momentum value as we did for the learning rate section, but with a fixed learning rate value in this case. After the evaluation of the “momentum” performance, it was decided to use a momentum value of 0.78. Of course, it is necessary to take into mind that specific results may vary given the stochastic nature of the learning algorithm, so the example was performed a few times in order to achieve the best performance. As matter of fact, in all cases where the momentum was used the accuracy of the model on the holdout test dataset seems to be more stable, showing less fluctuation over the training epochs. But one of the targets set by the authors was to define a proper alternative ANN model which can be used for online processing and being handle by the embedded microprocessors which can be supported by its system’s memory. For low memory it is recommended to use batch with a value of 16, which benefits on low cost and with acceptable error.
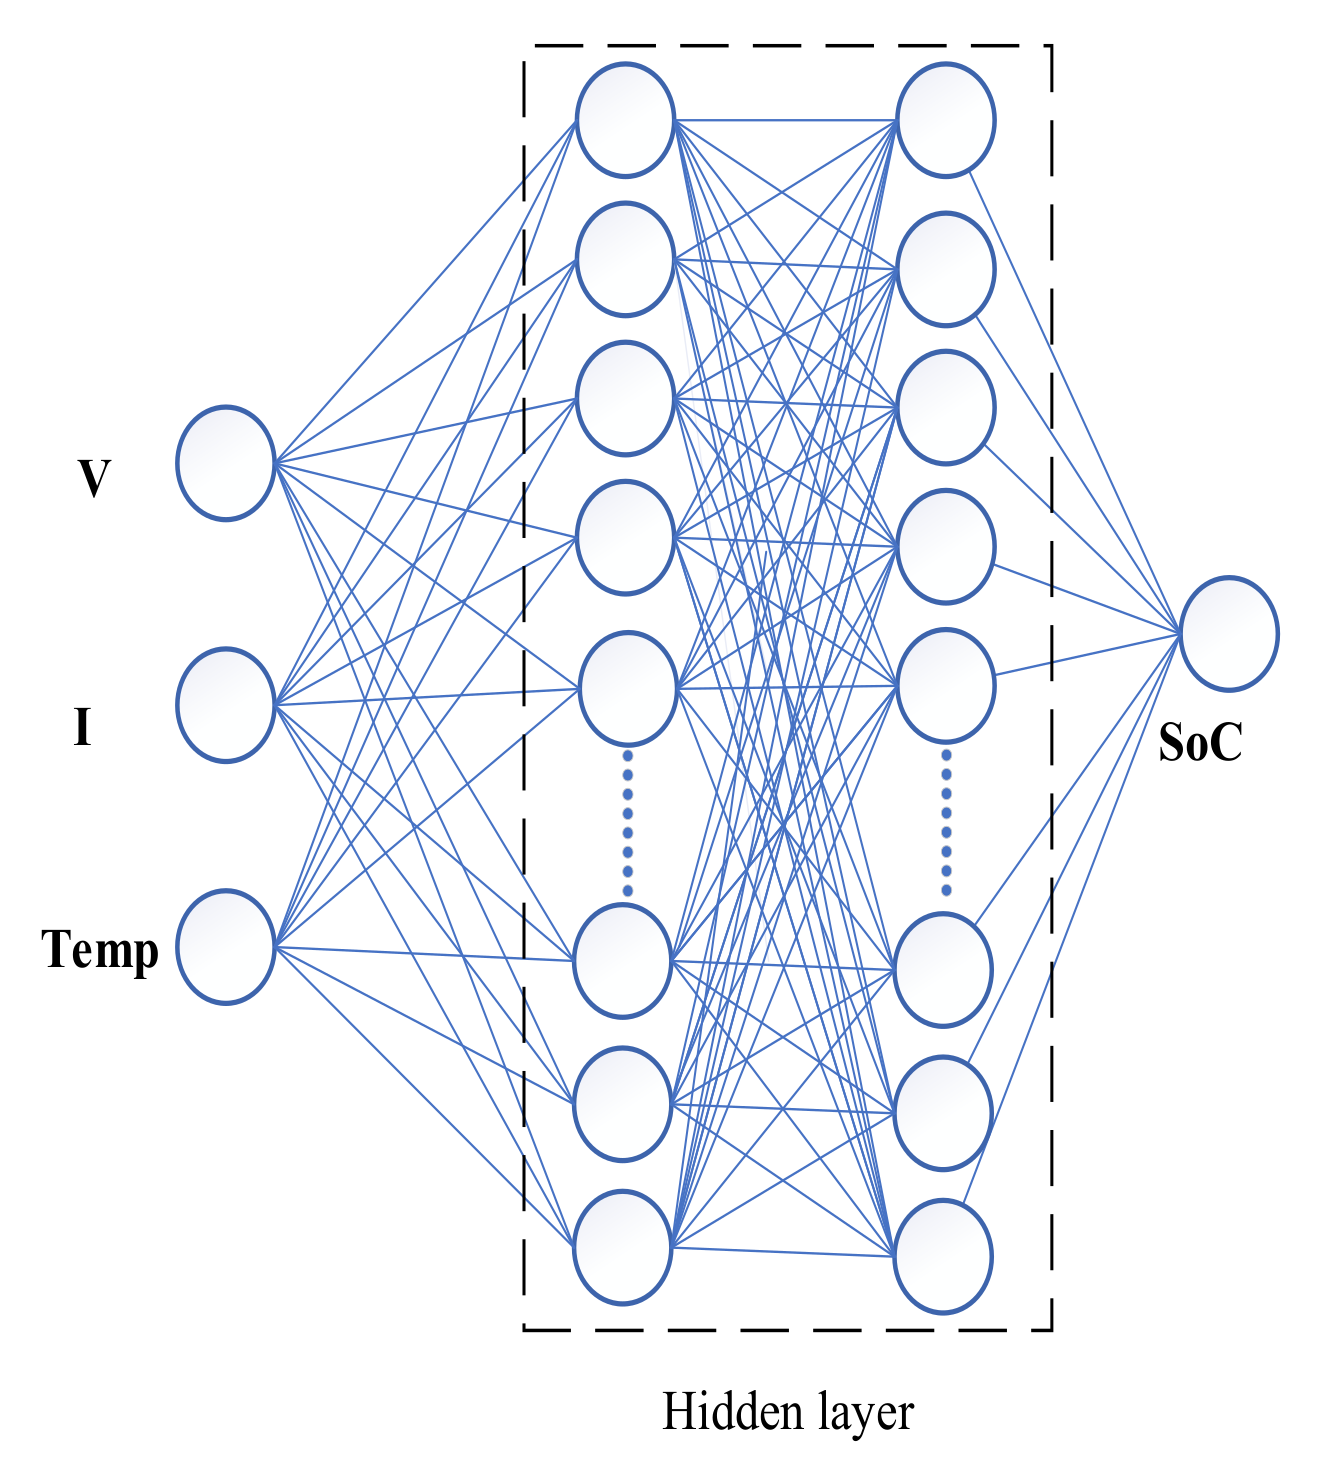
In this study, a dual hidden layer structure is used as shown in Figure 24 which can give and accurate the SoC estimation.
The results of the ANN estimation are shown in Figure 25, and they are compared with the real EV SoC values. The estimation is solid, reliable, and fast during all the tests. The error is maintained stable within the range of 1.1% and within 16.5 s. The dual hidden layer structure with 11 neurons for each layer was selected as the most appropriate one for this study, considering 3 important variables: reliability/stability of the estimation, accuracy, and lower time of calculation.
Few ANN models based on a single hidden layer structure were used in this study. They show very good accuracy within the average error range of 0.9% to 1.1%, however in 6.6% of the estimated cases based on single-layer structure their peak error reaches 4.9% to 5.1%. In addition, the versatility of ANN with the single hidden layer structure is lower compared to that with a dual hidden layer structure. Based on these results, the author decided to choose the dual hidden layer ANN structure, which has 11 neurons for each hidden layer, as the most optimal evaluated model for this study.
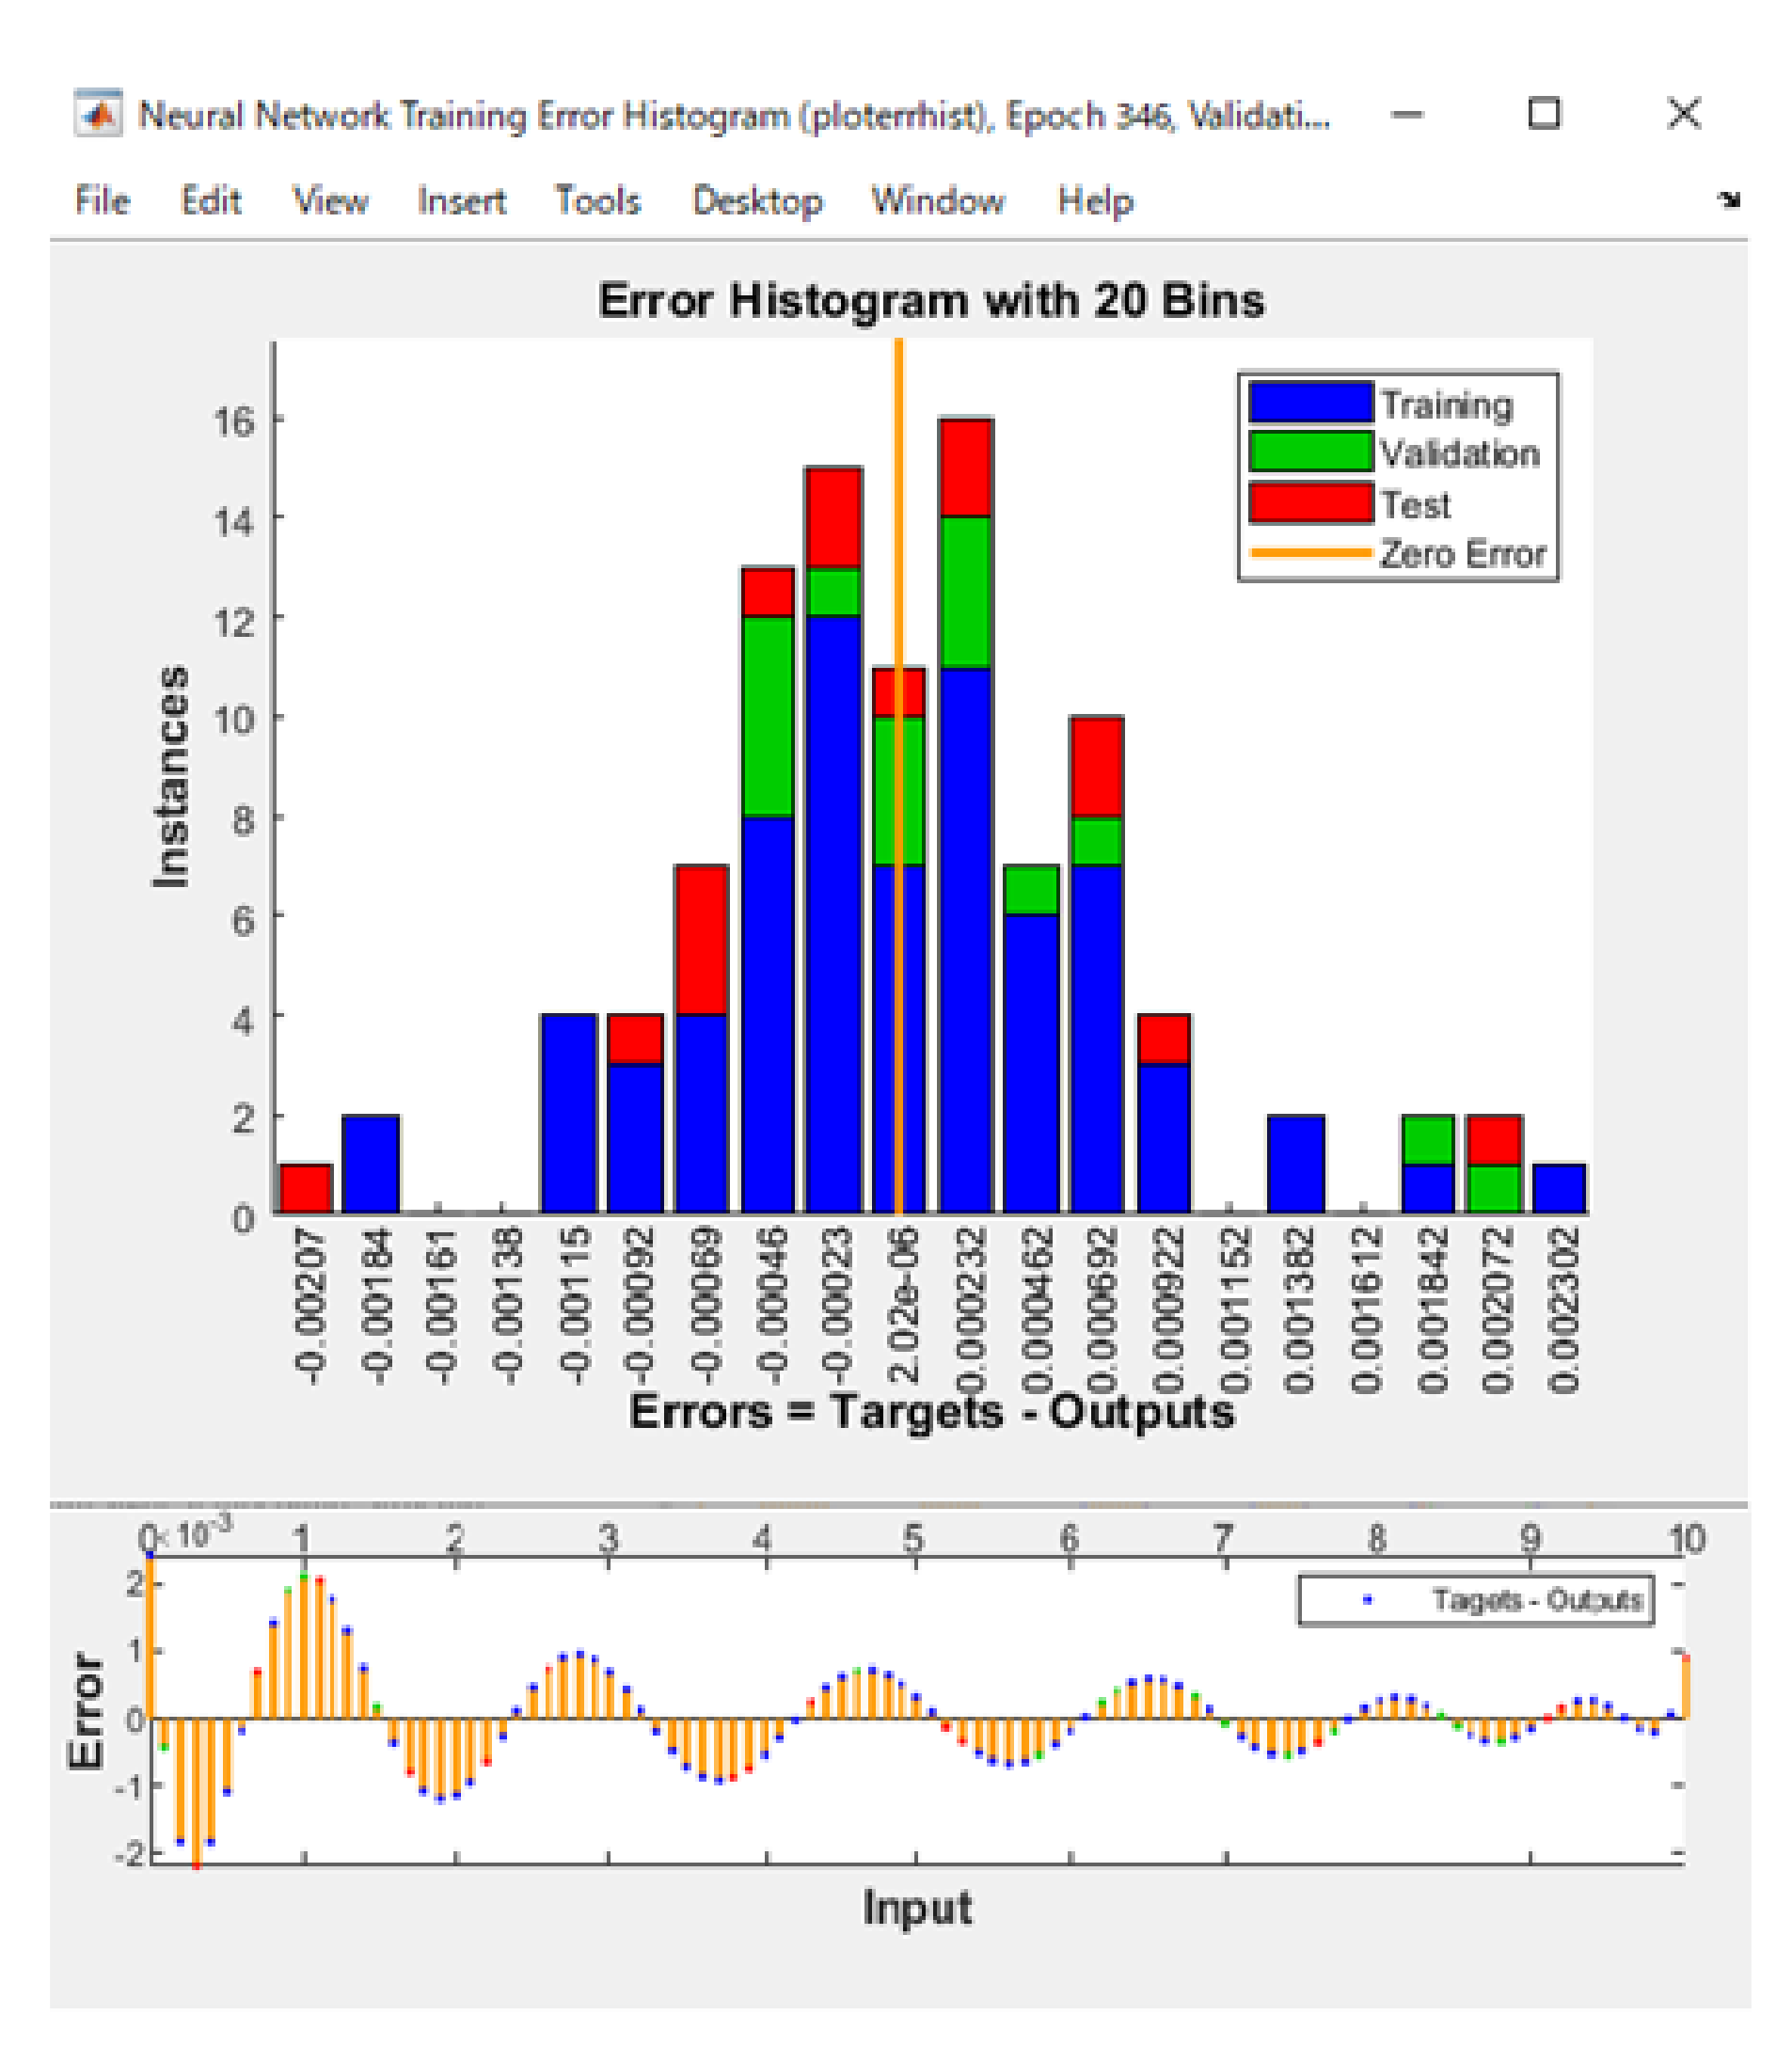
Figure 26 shows the performance and error rate of the ANN. It reaches minimal error value at Epoch 346, after 15 consecutive training sets. The error is maintained stable and less than 2.1% during the testing period.
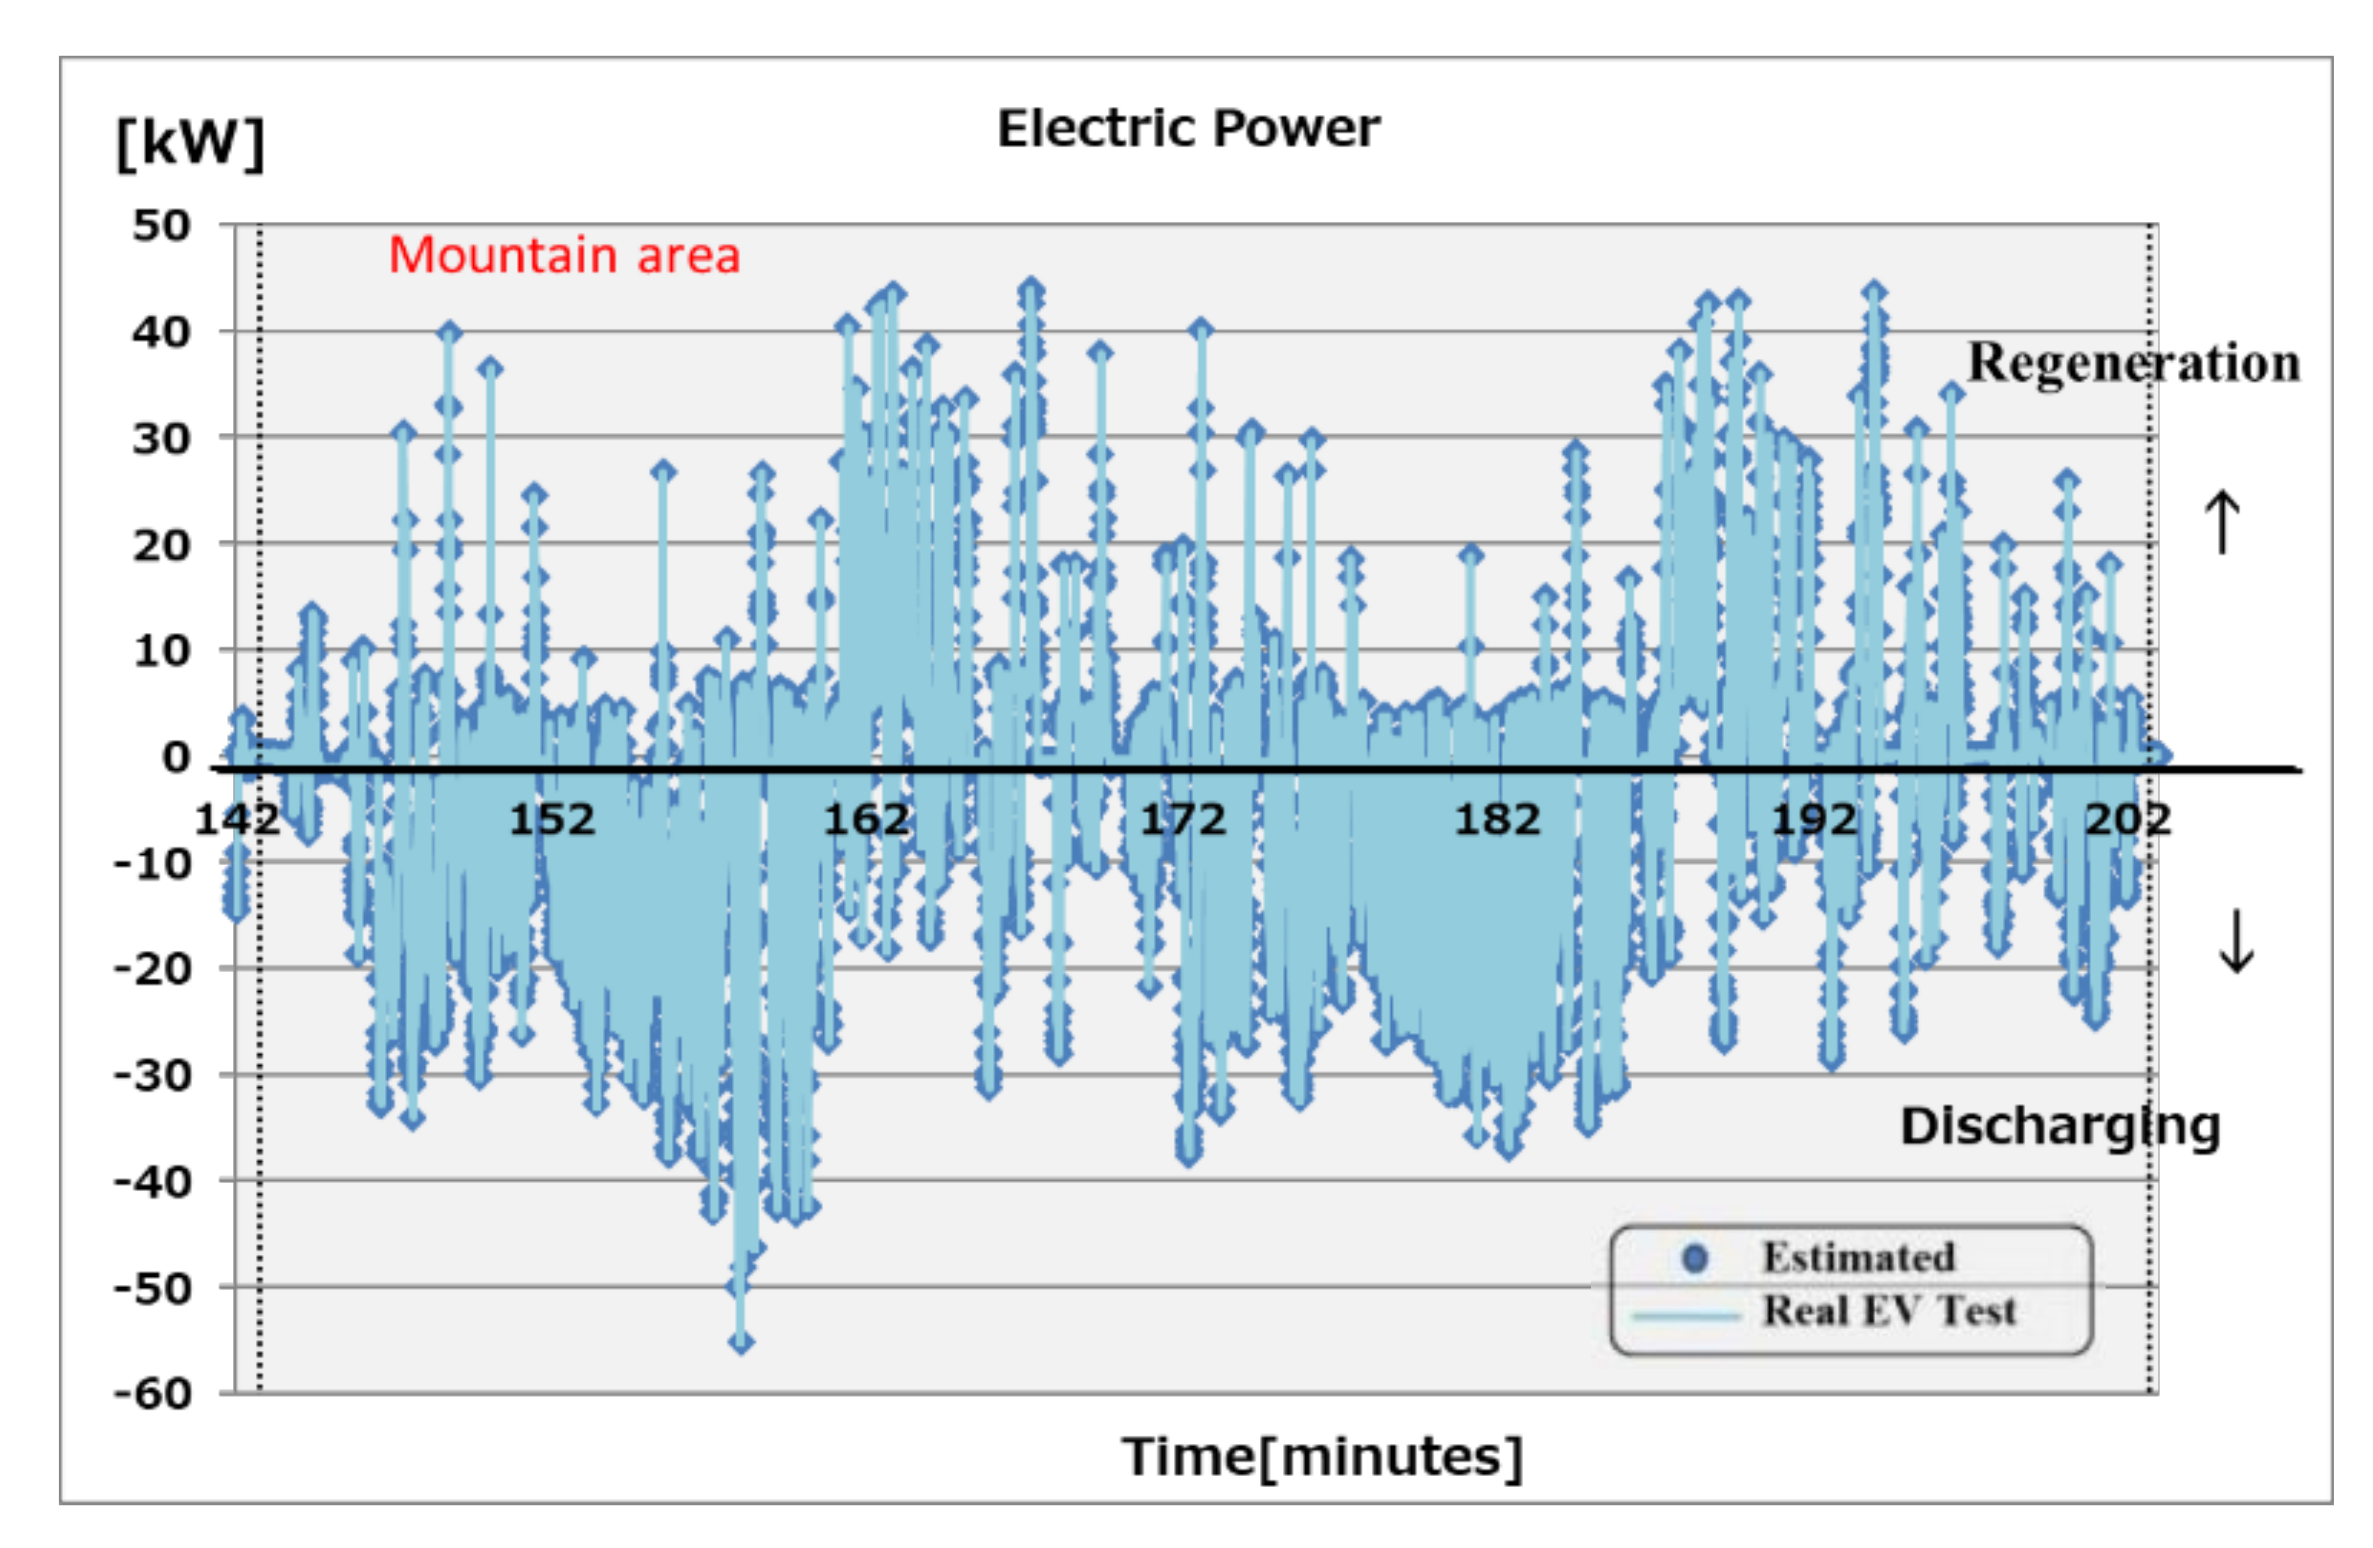
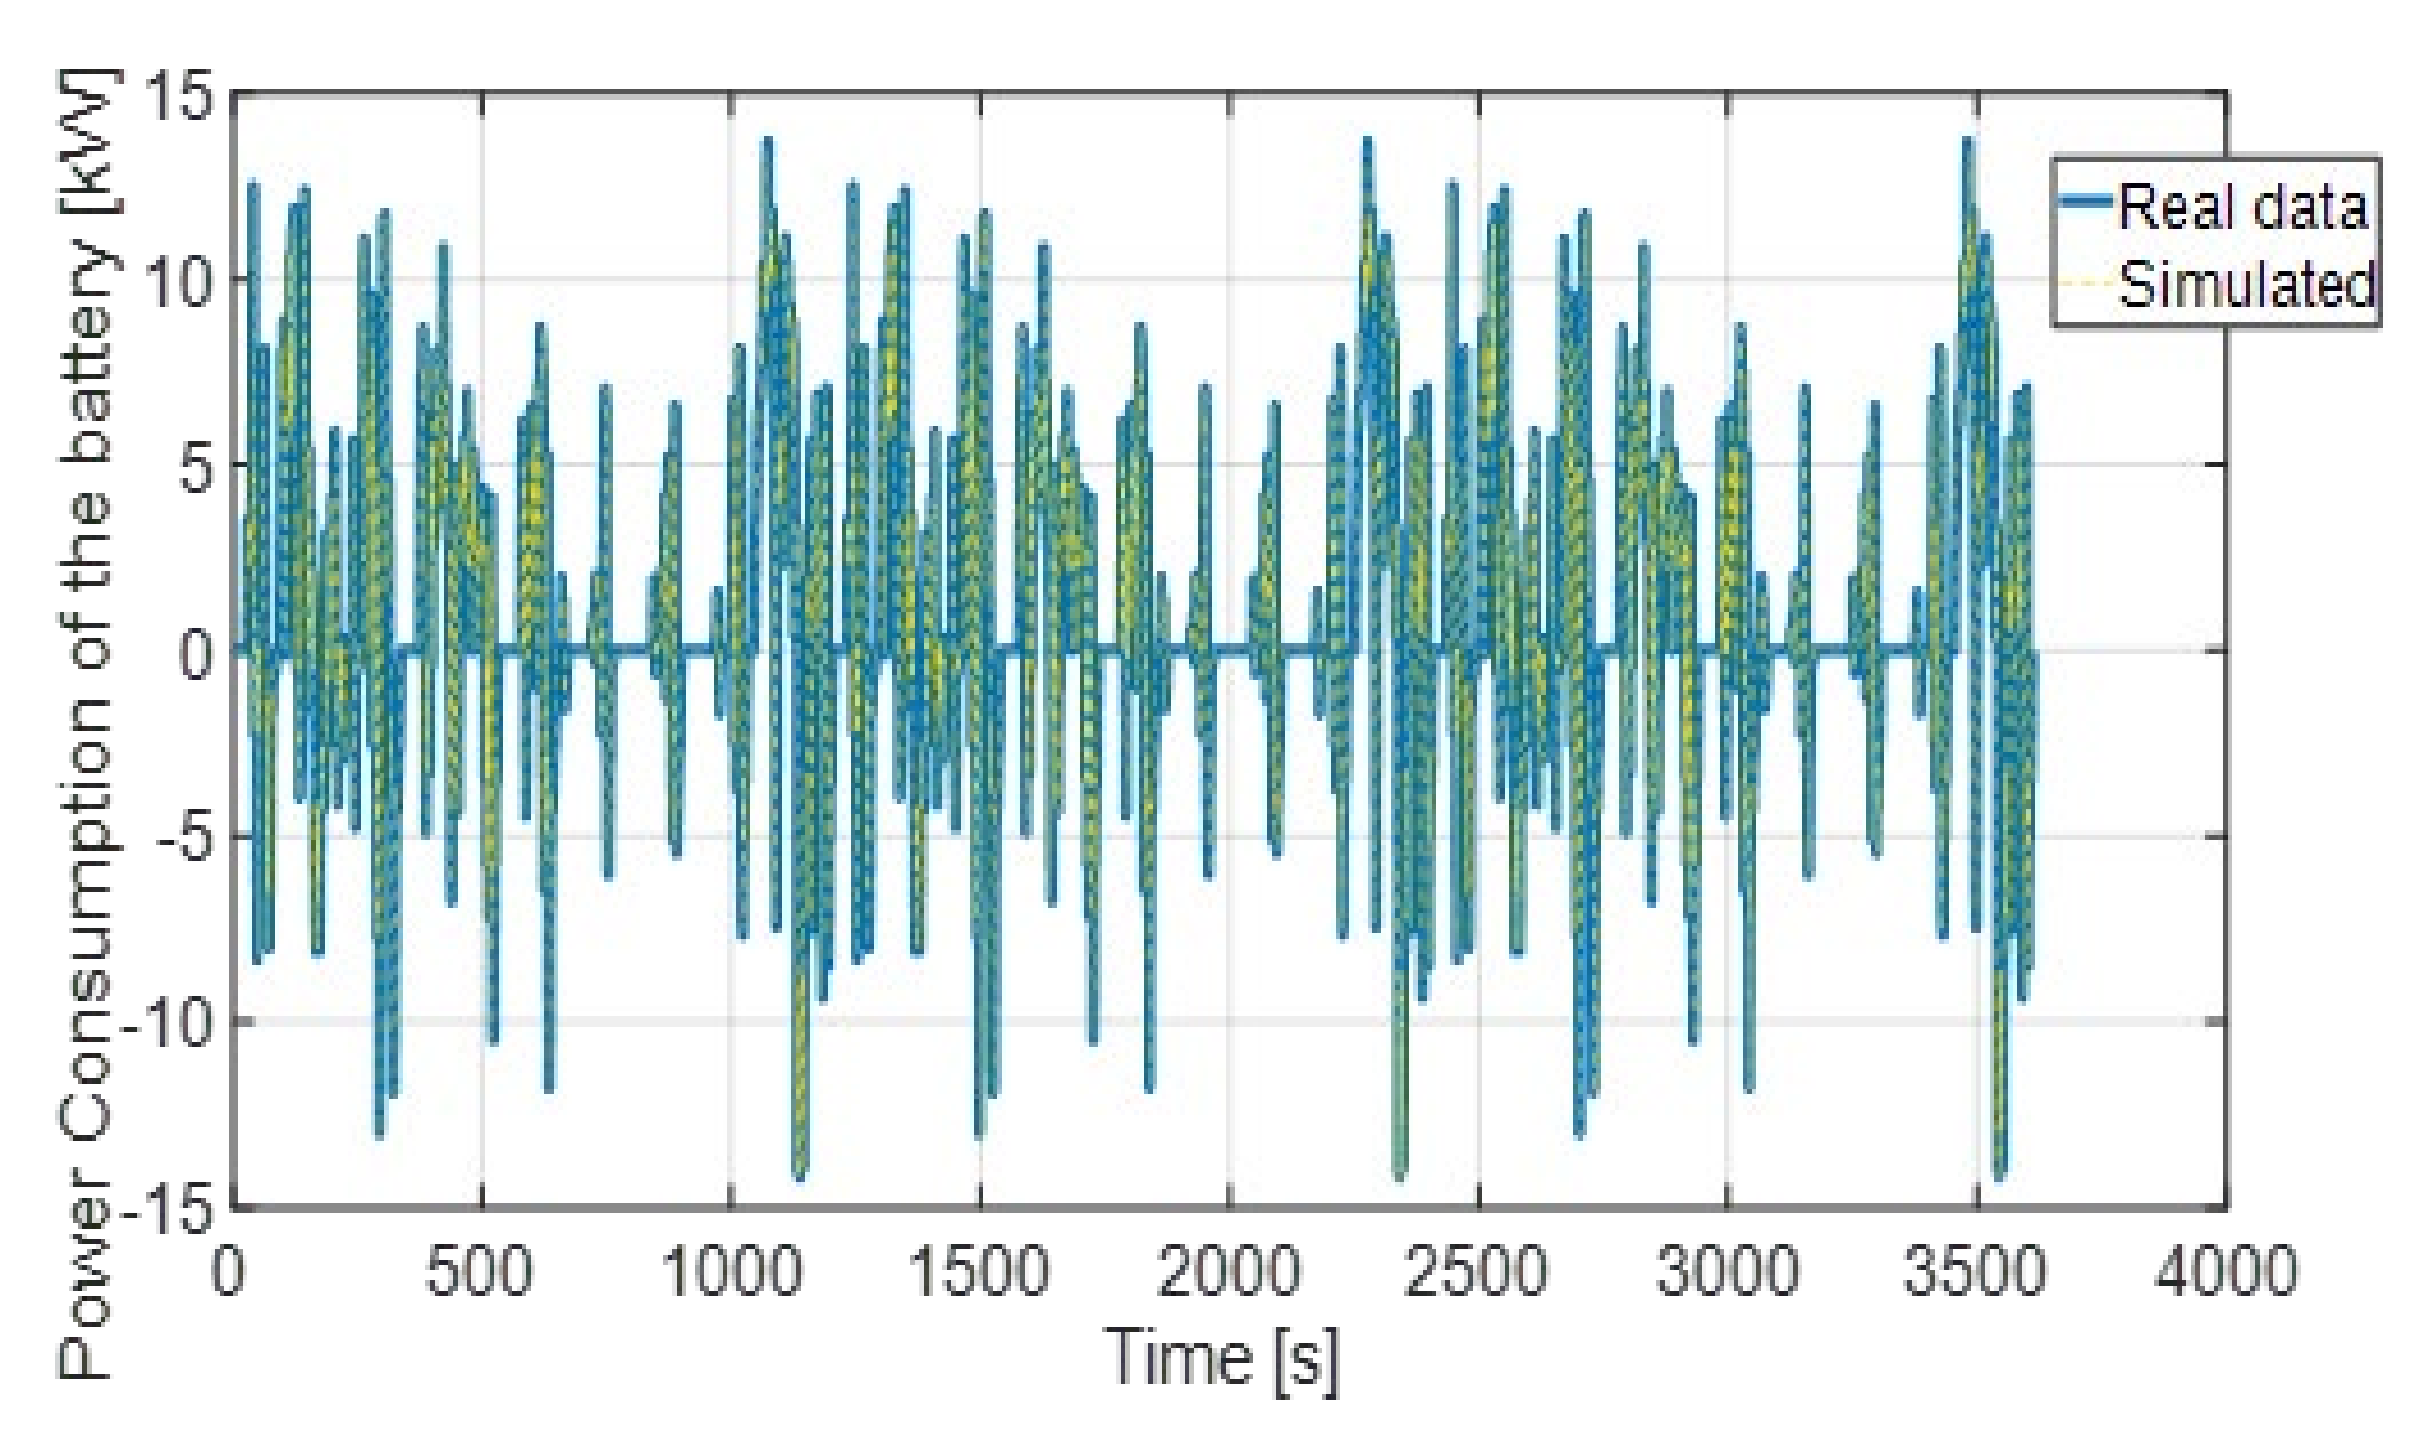
Figure 27 and Figure 28 show another important simulation and estimation of power consumption using the scaled-down simulator. The continuous line in Figure 27 shows measured power consumption during the mountainous area, and the dots are for the estimated values. This plot shows not only the results of the estimation but also the possibility to reduce the sampled data up to 20 times, based on the optimized model, and still maintaining an accurate model. The results show the possibility to make an accurate test for large BSS using the scaled-down simulator. This can drastically decrease the cost of the BSS during the designing and testing phase. As well by incorporating the ability of ANN logic, it is possible to feed the database and increase the analytic procedure of ANN just using the scaled-down simulator. With the power of ANN, it enables not only to reduce the cost but also to make further investigation on faster SoC or SoH estimation. This method does not require a real and costly EV battery and saves time. In addition, the test can be carried out safely, and the test can reduce the stress of a battery pack composed of hundreds of cells.
More the battery gets deteriorated, more power and energy the EV will need in order to finish the test for the same conditions, so it means the power output of the battery will be reduced. By integrating the power vector, it is possible to obtain the energy characteristic, which helps to understand better the effect of the battery deterioration in the mileage autonomy of the EV. For the same test as shown in Figure 28, the effect of nonlinear deterioration is confirmed in Figure 29.
Through time it is possible to calculate how much is the distance covered by the car, also to understand the differences of the mileage in the EV during deterioration. In the region of the highest current peak, the maximum difference from a new battery of 0 cycle to 300 cycles is 11.6% and from the new battery of 0 cycle to 500 cycles is 18.8%. When the Li-Ion cell gets deteriorated at the maximum value of 500 cycles the difference is increased in a nonlinear proportion. Also, the nonlinearity of the characteristic is included in the estimation model as it’s showed during all the energy accumulation period. Although the detailed investigation and analysis of the SoH estimation is not the main focus of this study, significant progress is made through the proposed method, which will be published in future studies.

4. Conclusions

This paper presented an innovative and alternative approach for the BSS test and evaluation by the development of a scaled-down hardware simulator. This method enables accurate simulation of a practical battery pack using single or few cells. This system can include real battery characteristics and behavior in contrast with any numerical simulator. The proposed system can charge/discharge any rechargeable battery. As well, the simulator can use any arbitrary waveform from sinusoidal, pulsive or any dynamic waveform. The system is versatile, portable, and inexpensive. Based on the scaled current, the battery cell tested through the simulator was charged/discharged. As a result, the capacity of the target storage system was considered through the scaling factor.
The ability of the developed simulator to incorporate the practical and overall characteristics of the real BSS into a single cell battery is one of the goals and contribution of this paper.
The usage of the ANN model enables a deep investigation of the reliability of the battery pack during the designing phase and gives important information regarding battery behaviour during different tests. The feature of the SoC estimation is introduced using ANN structure with a stable accuracy of 1.1% and with the maximum error of 2.1% within 16.5 s of calculation, for a BSS with a maximum power of 30 kW. The accuracy is satisfactory for practical applications of BSSs for EV and renewable generation systems. The features and high generalization of the proposed method help the development of the ANN construction.
This study gives the opportunity for more advanced and innovative solutions for cost reduction and simplification of the BSS design. As well it is possible to estimate the SoH with high accuracy, which will be published in further works with useful information for the system design.
Finally, the developed simulator in this paper can contribute to the efficient operation and optimum design of power storage system applications.

Author Contributions

M.B. have investigated the usage of the improved MTC scaled-down simulator, conducted all the test on the single cell, 3 and 4 series configuration battery pack, and all the battery experiments by the NF As-510-LBA, AS-510-B and Thermo-hygrostat HIFLEX KEYLESS TL401E devices. Also developed the MATLAB code for the ANN algorithm with a generalization characteristic, and wrote most of the manuscripts which includes methodology, investigation, formal analysis, visualization and editing; M.I., T.S. and Y.H. conducted the practical experiments during (Nissan Leaf) EV’s driving test and have collected all the data obtained from the real battery; N.N. supervised all process of the development, experiments, and results, also revised and edited the whole manuscript. All authors have read and agreed to the published version of the manuscript.

Funding

This research received no external funding.

Acknowledgments

The author would like to thank YAZAKI Corp. Japan, for their support and collaboration, which made possible to retrieve specific and necessary data for this project. Also, an appreciation and gratitude to the Battery Team of the Power System Analysis Lab Doshisha University, for their support during some experimental tests.

Conflicts of Interest

The authors declare no conflict of interest.

Appendix A

The author is working on the new circuit which will have better performance comparing to improved MTC model, as well most of the experiments were conducted using the improved circuit. The new model with software model v.5.1.0 has higher voltage operation comparing to the old version v.4.2.1 which was limited up to 9 V, where the new one can operate up to 12.6 V, which allows to use the 3S4P BMS up to nominal voltage of 12.6 V. Also, the interface and menu are changed by giving more freedom in term of battery selection, type of operation CCCV, pulse or arbitrary for different combinations of battery connections such as in series or parallel.
Figure A1. Interface of the improved MTC: (a) first page, (b) battery type selection menu and configuration.
Asi 03 00027 g0a1
Figure A2. Interface of the improved MTC: (a) set external resistance, (b) cycle number, (c) charging/discharging protection settings.
Asi 03 00027 g0a2
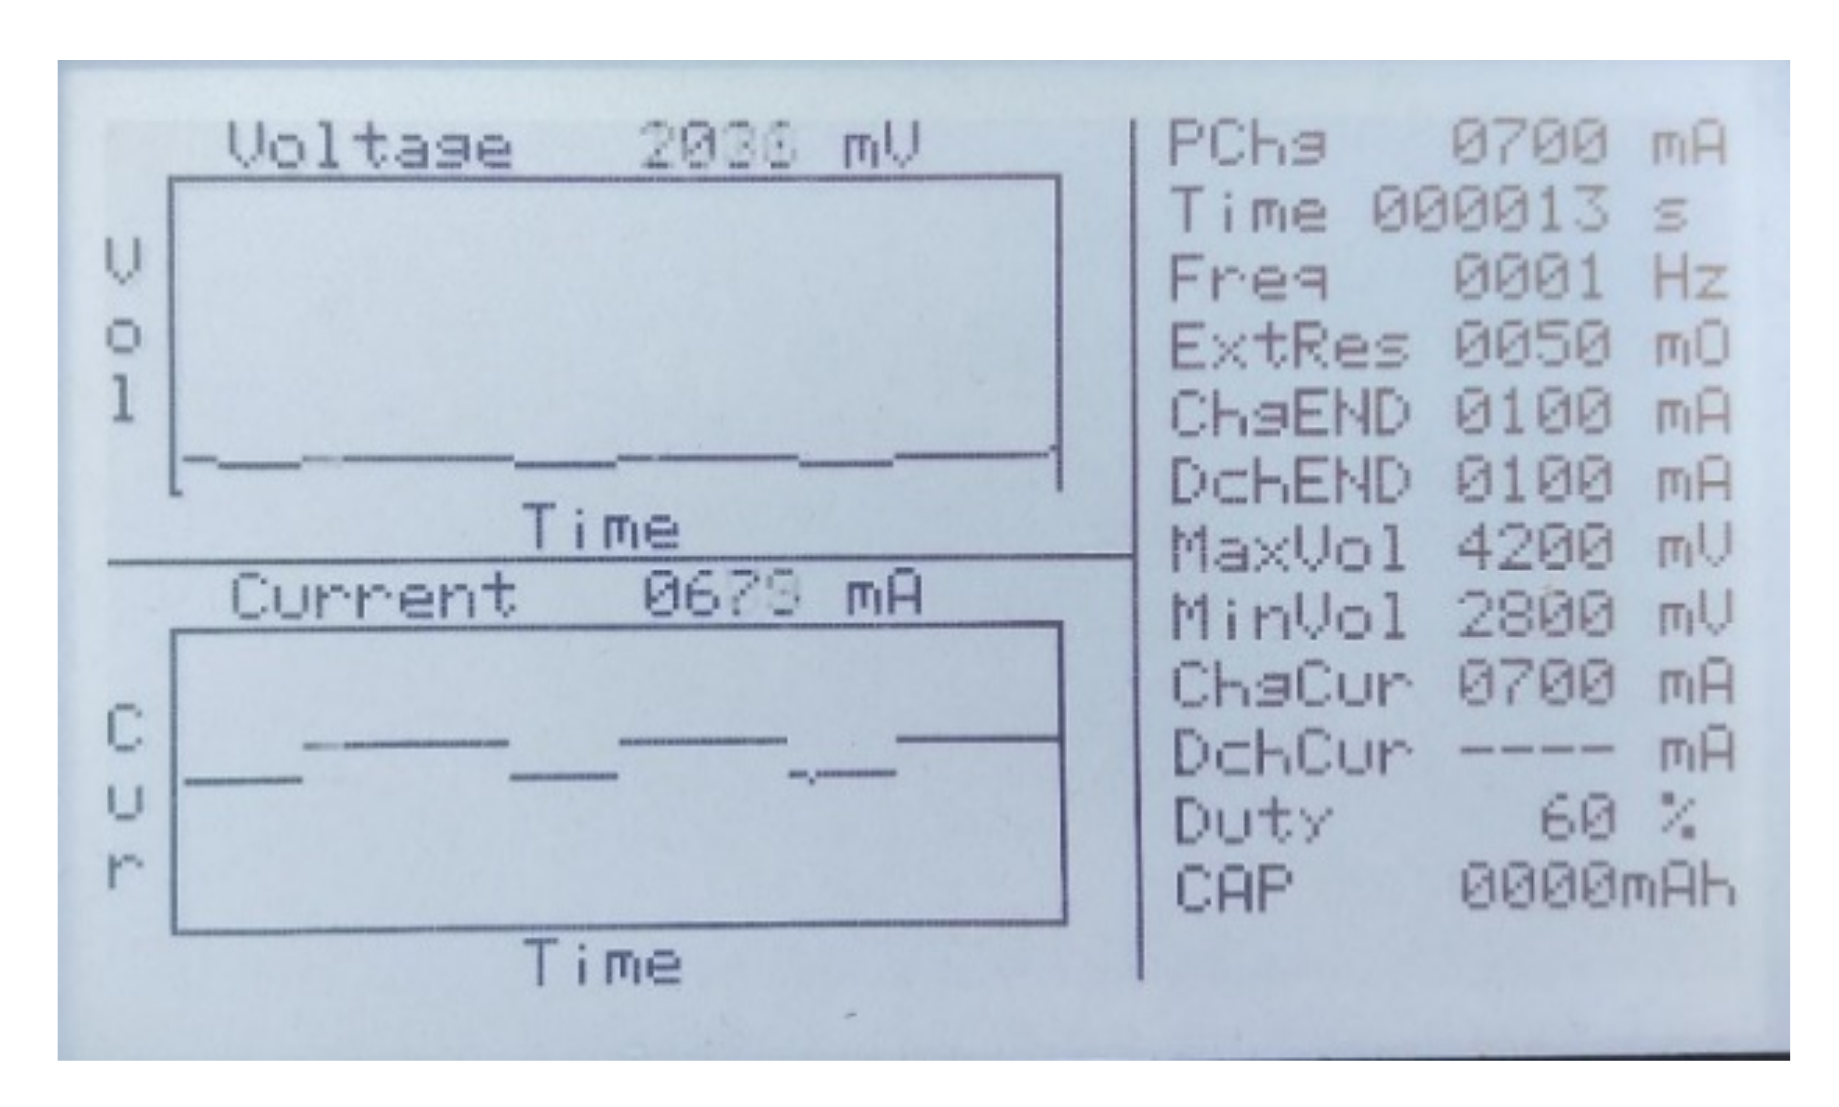
Figure A3. Interface of the MTC at initial pulse charging 60%, 700 mA, for a single cell test at arbitrary settings.
Asi 03 00027 g0a3
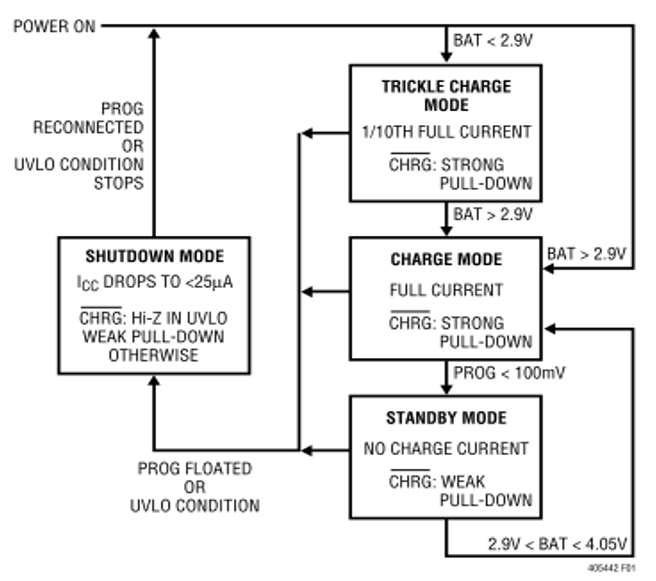
Figure A4. State diagram of a typical charge cycle.
Asi 03 00027 g0a4
Figure A5. Operation Timing chart during Overcharge/Over-discharge Protection with BM3451.
Asi 03 00027 g0a5
Figure A6. Operation Timing chart during Discharge Overcurrent/Short circuit charge/ Overcurrent Protection with BM3451.
Asi 03 00027 g0a6
Table A1. Specification of STD95N3L (LH6) Power MOSFET.
SymbolParameterValueUnit
VDSDrain-source voltage (VGS)30V
VGSGate-source voltage±20V
ID(1)Drain current (continuous) at TC = 25 °C80A
IDDrain current (continuous) at TC = 100 °C61A
IDM(1)Drain current (pulsed)320A
PTOTTotal dissipation at TC = 25 °C70W
Derating factor0.47W/°C
EAS(3)Single pulse avalanche energyTBDmJ
TstgStorage temperature−55 to 175°C
TjMax. operating junction temperature175°C
Table A2. Switching on/off (inductive load) STD95N3L (LH6).
SymbolParameterTest ConditionsTyp.Unit
td(ON)Turn-on delay timeVDD = 15 V, ID = 40 ATBDns
trRise timeRG = 4.7 Ω, VGS = 5 VTBDns
td(OFF)Turn-off delay timeVDD = 15 V, ID = 40 ATBDns
tfFall time RG = 4.7 Ω, VGS = 5 VTBDns
Table A3. Source drain diode STD95N3L (LH6).
SymbolParameterTest ConditionsTyp.MaxUnit
ISDSource-drain current--80A
ISDM(1)Source-drain current (pulsed)--320A
VSD(2)Forward on voltageISD = 40 A, VGS = 0-1.1V
trrReverse recovery timeISD = 80 ATBD-ns
QrrReverse recovery chargedi/dt = 100 A/μsTBD-nC
IRRMReverse recovery currentVDD = 20 VTBD-A
1. Pulse width limited by safe operating area; 2. Pulsed: pulse duration = 300 μs, duty cycle 1.5%.

References

  1. Sioshansi, R.; Short, W. Evaluating the impacts of real time pricing on the usage of wind generation. IEEE Trans. Power Syst. 2009, 24, 516–524. [Google Scholar] [CrossRef]
  2. Ipakchi, A.; Albuyeh, F. Grid of the future. IEEE Power Energy Mag. 2009, 7, 56–62. [Google Scholar] [CrossRef]
  3. Weicker, P. A Systems Approach to Lithium-ion Battery Management; Artech House: Norwood, MA, USA, 2014. [Google Scholar]
  4. Scrosati, B.; Garche, J.; Tillmetz, W. Advances in Battery Technologies for Electric Vehicles; Woodhead Publishing Series in Energy: Number 80; Elsevier: London, UK, 2015. [Google Scholar]
  5. Menictas, C.; Kazacos, M.S.; Lim, T.M. Advances in Batteries for Medium-and Large-Scale Energy Storage; Woodhead Publishing Series in Energy: Number 67; Elsevier: London, UK, 2015. [Google Scholar]
  6. Mohagheghi, E.; Alramlawi, M.; Gabash, A.; Blaabjerg, F.; Li, P. Real-Time-Reactive Optimal Power Flow with Flexible operation of Battery Storage Systems. J. Energies 2020, 13, 1697. [Google Scholar] [CrossRef] [Green Version]
  7. Nagaoka, N. A Numerical Model of Lithium-Ion Battery for a Life Estimation. In Proceedings of the 2013 48th International Universities Power Engineering Conference (UPEC), Dublin, Ireland, 2–5 September 2013. [Google Scholar]
  8. Gondo, R.; Ito, S.; Iifuru, K.; Nagaoka, N. Development of Multi-Type Secondary-Battery Charger/Discharger by Arbitrary Current Waveform. In Proceedings of the 52nd International Universities’ Power Engineering Conference, Crete, Greece, 28–31 August 2017. [Google Scholar]
  9. Bezha, M.; Gondo, R.; Nagaoka, N. A Dual ANN Model for Estimation of Internal Impedance of Rechargeable Cell Battery. In Proceedings of the Universities Power Engineering Conference UPEC 2018, 53rd International, Glasgow, UK, 4–7 September 2018; pp. 1–6. [Google Scholar]
  10. Bezha, M.; Gondo, R.; Nagaoka, N. An Estimation Model with Generalization Characteristics for the Internal Impedance of the Rechargeable Batteries by Means of Dual ANN Model. J. Energies 2019, 12, 948. [Google Scholar] [CrossRef] [Green Version]
  11. Bezha, M.; Nagaoka, N. An ANN Model for Estimating Internal Impedance of Lithium-Ion Battery Cell for Industrial Application. In Proceedings of the 21st International Conference on Electrical Machines and Systems (ICEMS), Jeju, Korea, 7–10 October 2018; pp. 2105–2110. [Google Scholar]
  12. Bezha, M.; Nagaoka, N. Online learning ANN model for SoC estimation of the Lithium-ion battery in case of small amount of data for practical applications. In Proceedings of the 10th International Conference on Power Electronics and ECCE Asia (ICPE 2019-ECCE Asia), IEEE Explore Proceedings, Busan, Korea, 27–30 May 2019. [Google Scholar]
  13. Al-karakchi, A.A.A.; Lacey, G.; Putrus, G. A method of electric vehicle charging to improve battery life. In Proceedings of the 50th International Universities Power Engineering Conference (UPEC), Trent, UK, 1–4 September 2015. [Google Scholar]
  14. Al-karakchi, A.A.A.; Putrus, G.; Das, R.; Binns, R. Smart EV Charging Profiles to Extend Battery life. In Proceedings of the 52nd International Universities Power Engineering Conference (UPEC), Heraklion, Greece, 28–31 August 2017. [Google Scholar]
  15. Nagamitsu, S.; Gondo, R.; Nagaoka, X.N.; Al-Karakchi, A.A.A.; Putrus, G.; Wang, Y. A Novel Battery Diagnostic Method for Smart Electric Vehicle Charger. In Proceedings of the 53rd International University Power Engineering Conference, Glasgow, UK, 4–7 September 2018. [Google Scholar]
  16. Dubbary, M.; Liaw, B.Y. Identity capacity fading mechanism in a commercial LiFePO4 cell. J. Power Sources 2009, 194, 541–549. [Google Scholar] [CrossRef]
  17. Swierczynski, M.; Stroe, D.I.; Stan, A.I.; Teodorescu, R.; Kær, S.K. Lifetime estimation of the nanophosphate LiFePO4/C battery chemistry used in fully electric vehicles. IEEE Trans. Ind. Appl. 2015, 51, 3453–3461. [Google Scholar] [CrossRef]
  18. Yang, Z.; Patil, D.; Fahimi, B. Online Estimation of Capacity Fade and Power Fade of Lithium-Ion Batteries Based on Input-Output Response Technique. IEEE Trans. Transp. Electrif. 2018, 4, 147–156. [Google Scholar] [CrossRef]
  19. Lam, L.; Bauer, P. Practical Capacity Fading Model for Li-Ion Battery Cells in Electric Vehicles. IEEE Trans. Power Electron. 2013, 28, 5910–5918. [Google Scholar] [CrossRef]
  20. Pattipati, B.; Sankavaram, C.; Pattipati, K. System Identification and Estimation Framework for Pivotal Automotive Battery Management System Characteristics. IEEE Trans. Syst. Man Cybern. Part C (Appl. Rev.) 2011, 41, 869–884. [Google Scholar] [CrossRef]
  21. Xiong, B.; Zhao, J.; Su, Y.; Wei, Z.; Skylass-Kazacos, M. State of Charge Estimation of Vanadium Redox Flow Battery Based on Sliding Mode Observer and Dynamic Model Including Capacity Fading Factor. IEEE Trans. Sustain. Energy 2017, 8, 1658–1667. [Google Scholar] [CrossRef]
  22. Hussein, A.A. Capacity Fade Estimation in Electric Vehicle Li-Ion Batteries Using Artificial Neural Networks. IEEE Trans. Ind. Appl. 2015, 51, 2321–2330. [Google Scholar] [CrossRef]
  23. Azis, N.A.; Joelianto, E.; Widyotriatmo, A. State of Charge (SoC) and State of Health (SoH) Estimation of Li-ion Battery Using Dual Extended Kalman Filter Based on Polynomial Battery Model. In Proceedings of the 6th International Conference on Instrumentation, Control, and Automation (ICA), Bandung, Indonesia, 31 July–2 August 2019. [Google Scholar]
  24. Guha, A.; Patra, A. State of Health Estimation of Lithium-Ion Batteries Using Capacity Fade and Internal Resistance Growth Models. IEEE Trans. Transp. Electrif. 2018, 4, 135–146. [Google Scholar] [CrossRef]
  25. Kim, I.-S. A Technique for Estimating the State of Health of Lithium Batteries Through a Dual-Sliding-Mode Observer. IEEE Trans. Power Electron. 2010, 25, 1013–1022. [Google Scholar]
  26. Electric Power System Standardized Model Research Expert Committee: Standardized Model of Electric Power System; Technical Report of the Institute of Electrical Engineers of Japan; IEEJ: Tokyo, Japan, 1999.
  27. Bezha, M.; Nagaoka, N. Improved ANN for Estimation of Power Consumption of EV for Real-Time Battery Diagnosis. IEEJ J. Ind. Appl. 2019, 8, 532–538. [Google Scholar] [CrossRef] [Green Version]
  28. Bezha, M.; Nagaoka, N. Advanced SoC Estimation of Li-Ion Batteries Accelerated through ANN with Adaptive Algorithm. In Proceedings of the IEEE PES Asia-Pacific Power and Energy Engineering Conference (APPEEC), Macao, China, 1–4 December 2019. [Google Scholar]
  29. Tsitsiklis, J.N. Neuro-Dynamic Programming; Athena Scientific: Belmont, MA, USA, 1996. [Google Scholar]
  30. Bertsekas, D.P. Dynamic Programming and Optimal Control: Approximate Dynamic Programming; Athena Scientific: Belmont, MA, USA, 1996; Volume II. [Google Scholar]
  31. Otterlo, V.; Wiering, M. Reinforcement Learning and Markov Decision Processes. Reinf. Learn. 2012, 12, 3–42. [Google Scholar]
  32. Mohri, M.; Rostamizadeh, A.; Talwalkar, A. Foundations of Machine Learning; The MIT Press: Cambridge, MA, USA, 2012. [Google Scholar]
  33. Hinton, G.; Sejnowski, T.J. Unsupervised Learning; MIT Press: Cambridge, MA, USA, 1999. [Google Scholar]
  34. Goodenough, J.B.; Kim, Y. Challenges for rechargeable Li batteries. Chem. Mater. 2014, 22, 587–603. [Google Scholar] [CrossRef]
  35. Girishkumar, G.; Mccloskey, B.; Luntz, A.C.; Swanson, S.; Wilcke, W. Lithium–air battery: Promise and challenges. J. Phys. Chem. Lett. 2010, 1, 2193–2203. [Google Scholar] [CrossRef]
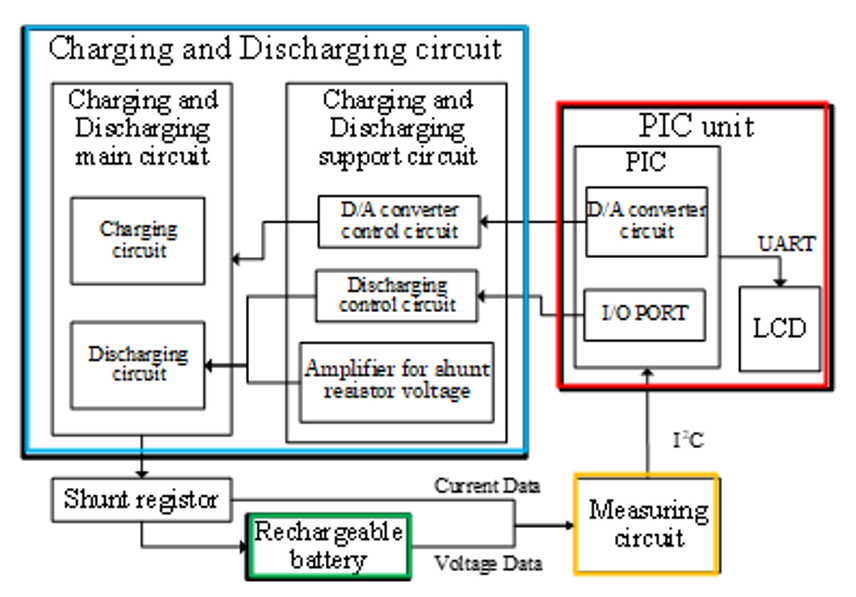
Figure 1. Block diagram of the charging/discharging circuit.
Asi 03 00027 g001
Figure 2. System appearance (during operation for battery pack 3S4P or for single cell test).
Asi 03 00027 g002
Figure 3. Voltage response of a secondary Li-Ion battery based on sinusoidal current.
Asi 03 00027 g003
Figure 4. Voltage response of a Li-ion battery to an arbitrary current of 1 kHz frequency.
Asi 03 00027 g004
Figure 5. Block diagram of BM3451.
Asi 03 00027 g005
Figure 6. BM3451 with three-cell application with balance function.
Asi 03 00027 g006
Figure 7. Switching times test circuit for resistive load (a) and gate charge test circuit composition (b).
Asi 03 00027 g007
Figure 8. Test circuit for inductive load switching and diode recovery times (a) and unclamped Inductive load test circuit (b).
Asi 03 00027 g008
Figure 9. Voltage responses of three type of rechargeable battery based on pulse current discharging of 50 mHz frequency.
Asi 03 00027 g009
Figure 10. Arbitrary waveform charging/discharging (Li-Ion 1 cell): (a) sinusoidal waveform, (b) another example of arbitrary waveform during discharging.
Asi 03 00027 g010
Figure 11. Dynamic arbitrary waveform: (a) during discharging of Li-Ion battery pack 3S6P configuration connected with BMS, (b) magnified current waveform.
Asi 03 00027 g011
Figure 12. Generated power by a solar panel array in February 2016.
Asi 03 00027 g012
Figure 13. Voltage and current waveform during charging/discharging process on the proposed MTC with a constant load.
Asi 03 00027 g013
Figure 14. Estimated generation power of a wind power plant: (a) with a constant load and (b) with a variable load.
Asi 03 00027 g014
Figure 15. SoC evaluation during full discharge test of the EV in dynamic scenario.
Asi 03 00027 g015
Figure 16. Current waveform of the test.
Asi 03 00027 g016
Figure 17. Electric Power of the EV during driving test.
Asi 03 00027 g017
Figure 18. Battery pack voltage during EV’s driving test.
Asi 03 00027 g018
Figure 19. Single Li-Ion cell tested in the proposed scaled down simulator.
Asi 03 00027 g019
Figure 20. Charging current of a battery pack while EV is driven.
Asi 03 00027 g020
Figure 21. Scaled simulation per Li-ion cell by EV driven current.
Asi 03 00027 g021
Figure 22. Block diagram of the data training.
Asi 03 00027 g022
Figure 23. Cell’s temperature during the test on the proposed simulator.
Asi 03 00027 g023
Figure 24. ANN structure for the proposed model with 3 inputs, dual hidden layer and single output.
Asi 03 00027 g024
Figure 25. SoC comparison between Real EV measuring and the estimated one through ANN model.
Asi 03 00027 g025
Figure 26. Evaluation of the training error Histogram for the proposed ANN model.
Asi 03 00027 g026
Figure 27. Estimation of power consumption for a specific terrain.
Asi 03 00027 g027
Figure 28. Comparison of a short estimation test for the power consumption.
Asi 03 00027 g028
Figure 29. Required energy for different number of cycle operation [27].
Asi 03 00027 g029
Table 1. Specification of the MTC (multi type chemistry charging/discharging).
ItemMinTyp.Max
Supply voltage (ACV)100-240
Operating voltage (V)-12-
Operating current (A)--2
Battery voltage (V)2-12.6
Battery current (A)−4-4
Frequency range (Hz)0.01-100
External DAC (V)0-2
Temperature range (°C)0-50