Article

Hydraulic and Sedimentological Reconstruction of a Middle/Late Pleistocene Boundary Superflood (Ebro River, NE Iberian Peninsula)


by
Francesc Xavier Castelltort Aiguabella
1,*,
Josep Carles Balasch
1,* and
Frank Preusser
2
1
Department of Chemistry, Physics, and Environmental and Soil Sciences, Universitat de Lleida, Av. Rovira Roure, 191, 25198 Lleida, Spain
2
Institute of Earth and Environmental Sciences, University of Freiburg, Albertstraße 23b, 79104 Freiburg, Germany
*
Authors to whom correspondence should be addressed.
Quaternary 2026, 9(4), 52; https://doi.org/10.3390/quat9040052
Submission received: 6 March 2026 / Revised: 20 June 2026 / Accepted: 6 July 2026 / Published: 10 July 2026

Abstract

Fluvial superfloods are geomorphologically significant episodes due to their enormous energy and extremely low recurrence in the geological record. Their rarity is particularly notable in areas far from the major continental glacial masses. Hydraulic constrictions in the Lower Ebro River gorges caused the accumulation of fluvial deposits, as floodwaters from the Ebro River were forced upstream into the tributary valleys of the Móra Basin. The most illustrative example is the Comte Creek, where two depositional units of different ages show upstream flood accumulations (extending up to ~4 km) with very high-energy sedimentary structures, followed by downstream reworking during backflow. Two-dimensional hydraulic simulations indicate that peak discharges reaching 385,000 m3·s−1, with water depths of approximately 28 m in the confluence area, would have been required to transport sediments to the observed outcrop positions. Luminescence dating of the slackwater deposits indicates that the formative processes occurred during the latest Middle Pleistocene or the Last Interglacial (Eemian).

1. Introduction

The debate between uniformitarianism and catastrophism is a longstanding theme in the history of geology. The principle of uniformitarianism [1] does not imply that Earth’s changes occur at a constant or uniform rate, nor does it exclude localized catastrophic events. Historically, geologists have approached catastrophic explanations with nuanced and reasoned caution, avoiding speculation due to insufficient evidence, particularly in more recent contexts. A paradigmatic case is that of J Harlen Bretz (1882–1981), who, in the 1920s, proposed that the large canyons of what he termed the Channeled Scabland, east of Washington State (USA), were formed by a catastrophic flood [2,3]. Bretz’s struggle for recognition lasted nearly 50 years [4,5].
Subsequent studies demonstrated that the Channeled Scabland megafloods were not a single event but recurred multiple times during the Pleistocene, with peak discharges reaching ~20 × 106 m3·s−1 in some episodes [6]. These floods were generated by the failure of the Pleistocene Glacial Lake Missoula, which stored approximately 2600 km3 of water [7]. The outburst floods carved an intricate system of anastomosing channels, waterfalls, scoured basins, massive gravel deposits, and immense gravel dunes. They breached drainage divides and inundated preexisting valleys. Today, the Pleistocene floods of the Channeled Scabland are universally recognized as megafloods [8,9,10]. Such floods generate stream power and shear stress one to two orders of magnitude greater than those observed in the world’s largest rivers, such as the Amazon or the Mississippi.
Recently, similar processes have been documented worldwide [11]: in Iceland [12,13,14,15], due to the superposition of an ice cap over an active volcanic zone; in North America, as a consequence of glacial meltwater lakes; in Central Asia, for reasons comparable to those in North America [16,17,18]; and in South America [19]. On the European continent, some megafloods have been linked to the drainage of paleolakes during the retreat of the Fennoscandian Ice Sheet [10], but there is no mention of these processes in the southern half of Europe, the Alps, or the Mediterranean basins prior to the Last Glacial Cycle.
These observations fostered the development of paleoflood hydrology as a distinct discipline [20]. Early studies employed the Chezy–Manning formula for approximate discharge estimations based on paleo-water level indicators and/or slackwater flood deposits (SWD), combined with channel cross-section reconstructions [21]. Advances in computing enabled the use of one-dimensional (1D) flow models, which simulate flow through consecutive channel sections under the assumptions of one-dimensionality, steady or gradually varied flow, and conservation of mass and energy. Today, two-dimensional (2D) flow models are widely used because of their superior performance. Unlike 1D models, 2D models incorporate directional variations in flow, allowing for the analysis of paleoflood dynamics at river confluences [22], where the interactions of tributaries can be explicitly assessed. Furthermore, 2D approaches integrate sediment transport modeling—both bedload and suspended load—as well as other processes of broad relevance. Importantly, paleo-water levels are no longer the sole reference for discharge estimation; grain size distributions, shear stress, and related parameters can also be incorporated. The transition from 1D to 2D thus represents a conceptual shift from a solely vertical reference framework to one that also includes lateral variability, such as facies transitions, sedimentary structures, and textural changes. This shift strengthens the sedimentological perspective of hydraulics, aligning paleohydrological analysis more closely with geological approaches.
In the Ebro River, the largest floods of the last 500 years have been reconstructed [23]. The most significant event occurred in autumn 1787, with a reconstructed peak discharge of ~13,000 m3·s−1 and a water depth of 18 m [24]. These values fall within the upper range of extreme floods recorded in major Mediterranean and Central European rivers such as the Rhône, Po, Rhine, and Danube. However, beyond the historical record, little is known about Ebro floods over the last millennia, which fall fully within the scope of palaeohydrology. Sedimentary evidence from the Upper Pleistocene and Holocene has been identified at sites such as the Segre River’s entrance into the Mu Strait at Alòs de Balaguer (Lleida) [25] and along the Ebro River itself [26]. Yet the reconstructed discharges of these events appear comparable to those produced by rainfall and snowmelt.
Recently, however, exceptional deposits have been identified that are linked to highly energetic ancient floods of the Ebro River. These fluvial units, distinct from classical terraces, are preserved outside the main valley, several kilometers within tributary valleys, and record catastrophic events. Although the use of paleostages and SWD in tributaries is not new [27,28], what is novel here is the hydraulic and sedimentological reconstruction of flood inflow and backflow processes between a main channel and its tributaries.
The objective of the study is to identify and characterize these fluvial deposits of an old Ebro superflood preserved in small tributary valleys of the Ebro River within the Móra Basin (Tarragona), with the Comte Creek as a representative case study. We employ 2D flow modeling to estimate the hydrodynamic conditions that produced these deposits and luminescence methods for dating the flood remnants. For the first time in a large Mediterranean river of the Iberian Peninsula, we propose a hypothesis for the generation of catastrophic hydraulic events.

2. Study Area

The Ebro River, one of the principal rivers of the Iberian Peninsula, drains an approximately triangular basin of ~85,000 km2 before discharging into the Mediterranean Sea (Figure 1). To the north, its headwaters capture much of the Pyrenean Range, with peaks exceeding 3000 m a.s.l. To the south, the Iberian System rises slightly above 2000 m, while the Catalan Coastal Ranges bound the basin to the east, parallel to the coastline. During several stages of the Pleistocene, large valley glaciers extended across the Axial Pyrenees, from the Aragón to the Ter headwaters [29], whereas smaller glaciers developed in the Iberian System [30]. The Cinca and Segre basins, whose headwaters lie ~300 km upstream from the Ebro Delta, were particularly influential.
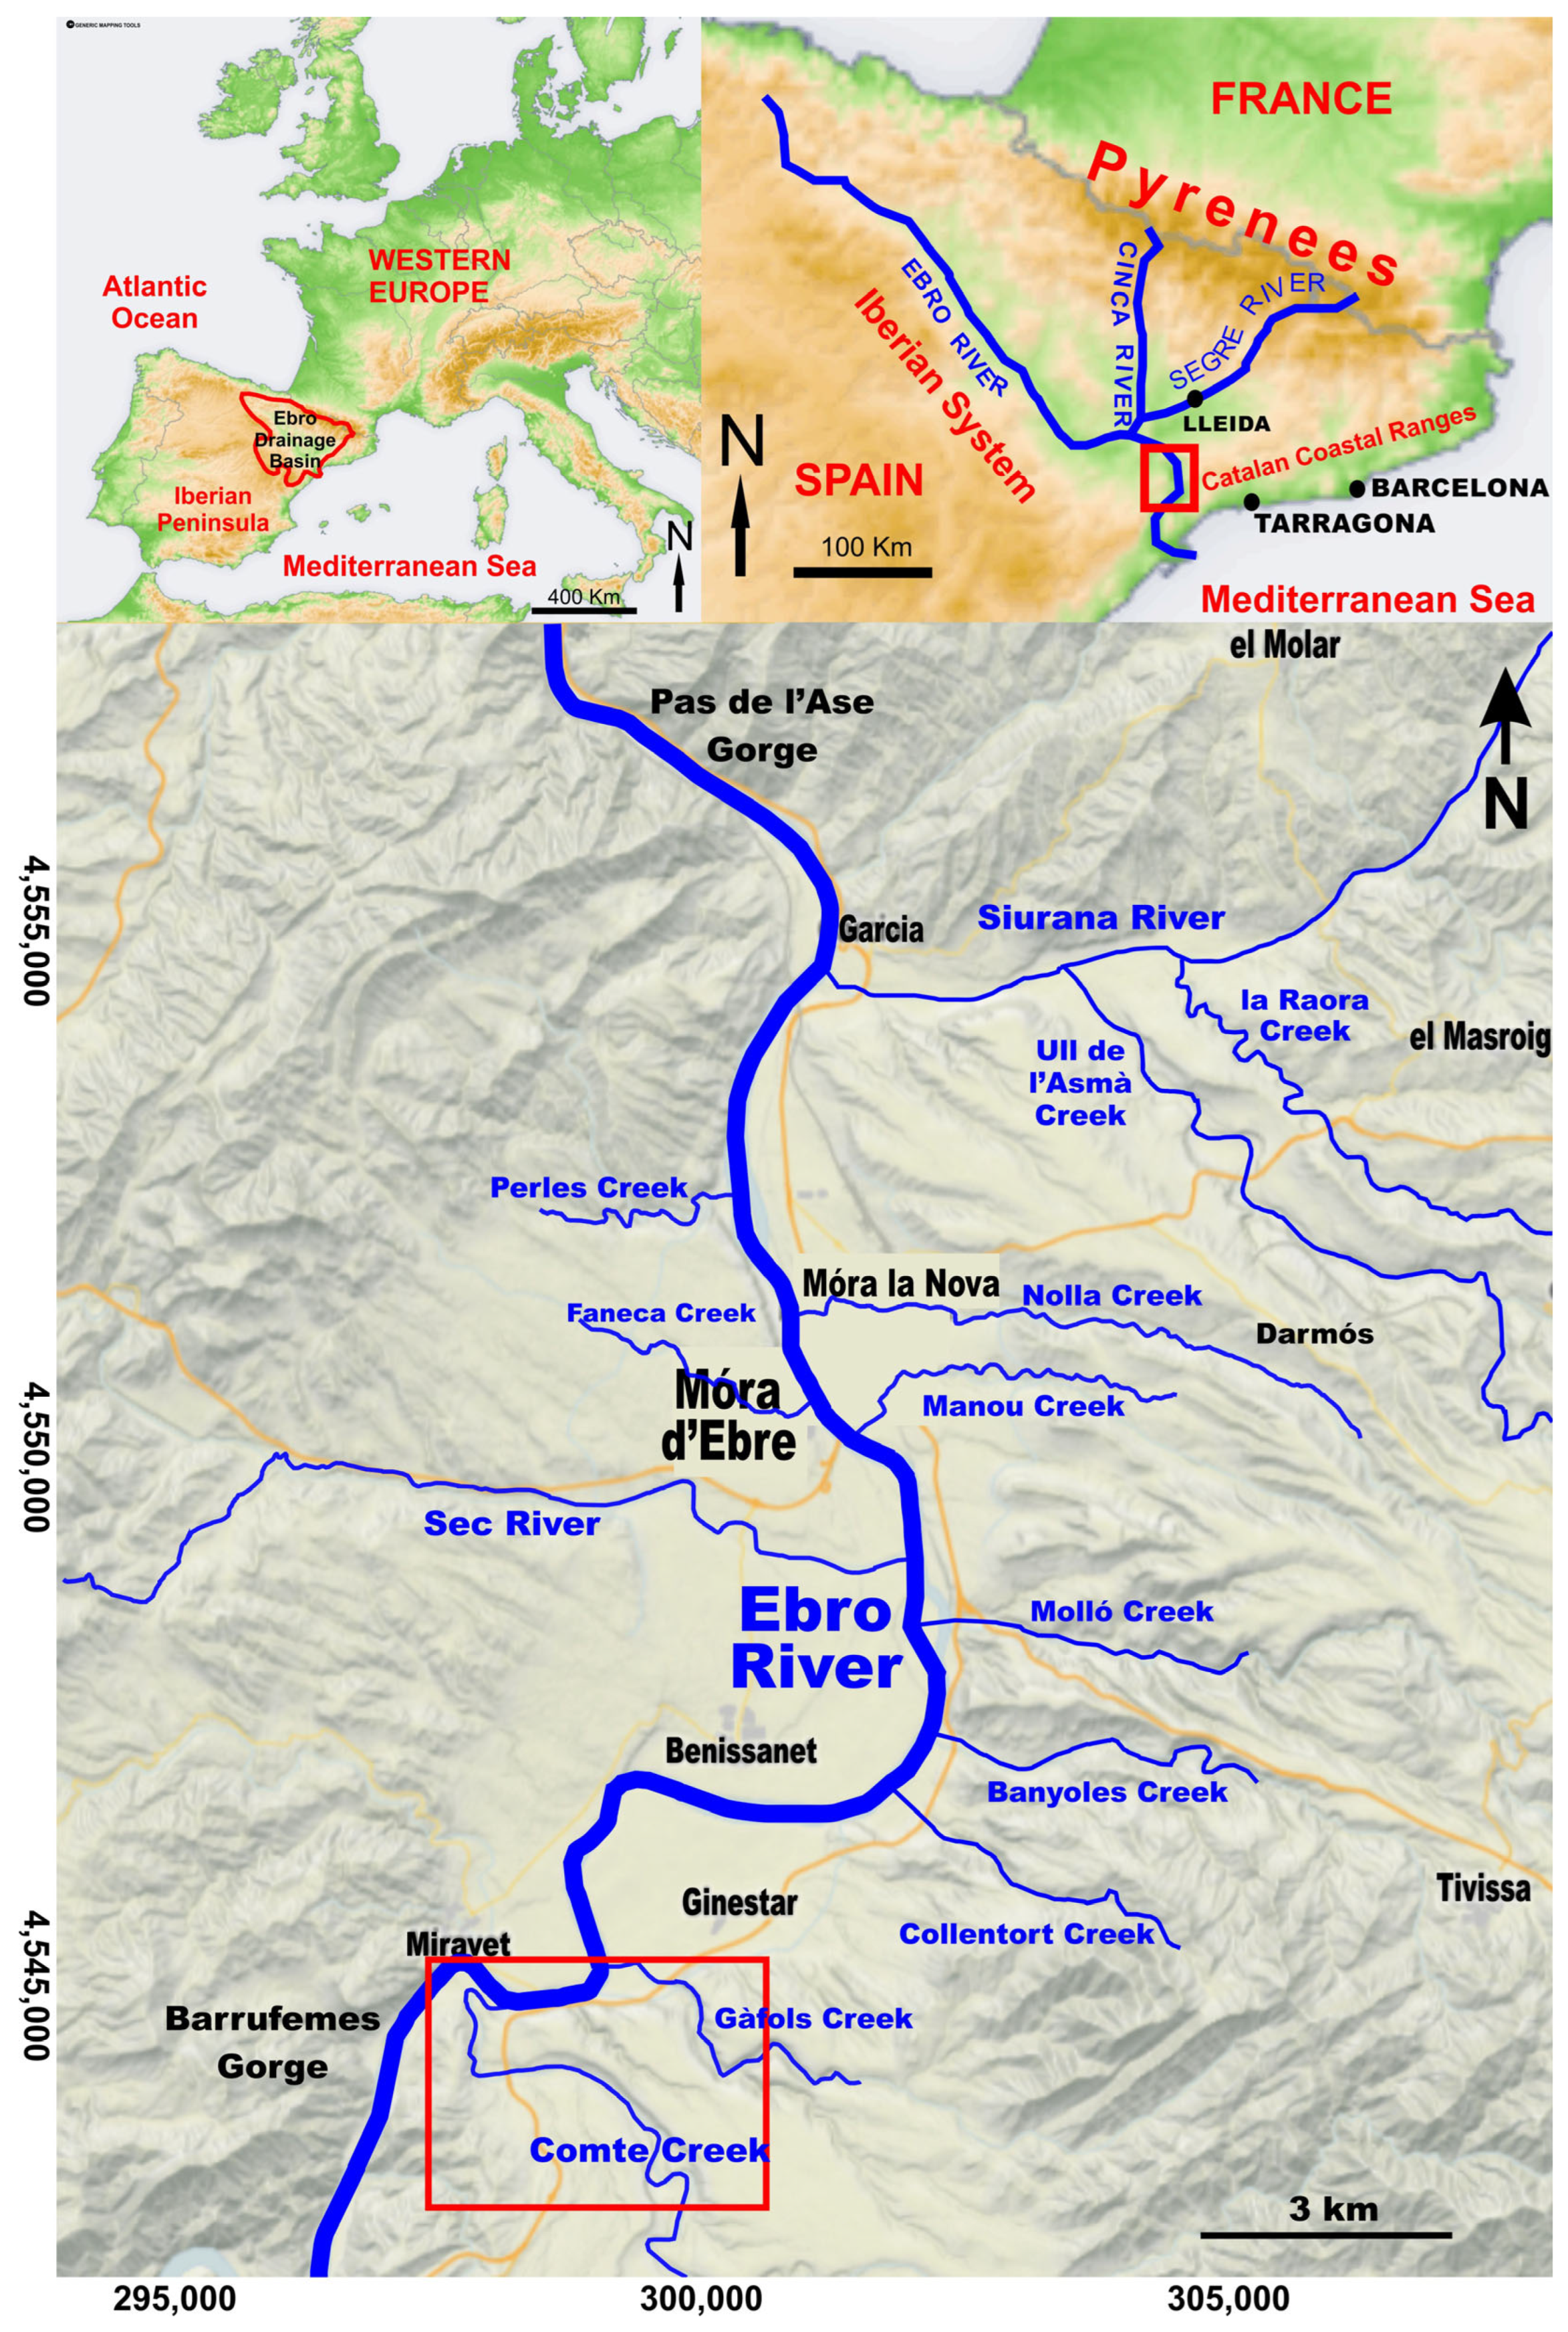
In the final 100 km of its course, the Ebro River crosses two significant lithological constrictions: the Pas de l’Ase Gorge to the north and the Barrufemes Gorge to the south (Figure 1). These gorges define the Móra Basin (MB), through which the river flows north to south. In the MB, the Ebro River runs between 25 and 15 m a.s.l. At Garcia, just downstream of the Pas de l’Ase Gorge, the mean discharge of the Ebro River is 318 m3·s−1. Within the MB, the Ebro receives multiple tributaries. On the left bank, the Siurana River is followed by the creeks of Nolla, Manou, Molló, Banyoles, Collentort, Gàfols, and Comte. On the right bank, the most prominent tributary is the ephemeral Sec River, alongside Perles and Faneca Creeks.
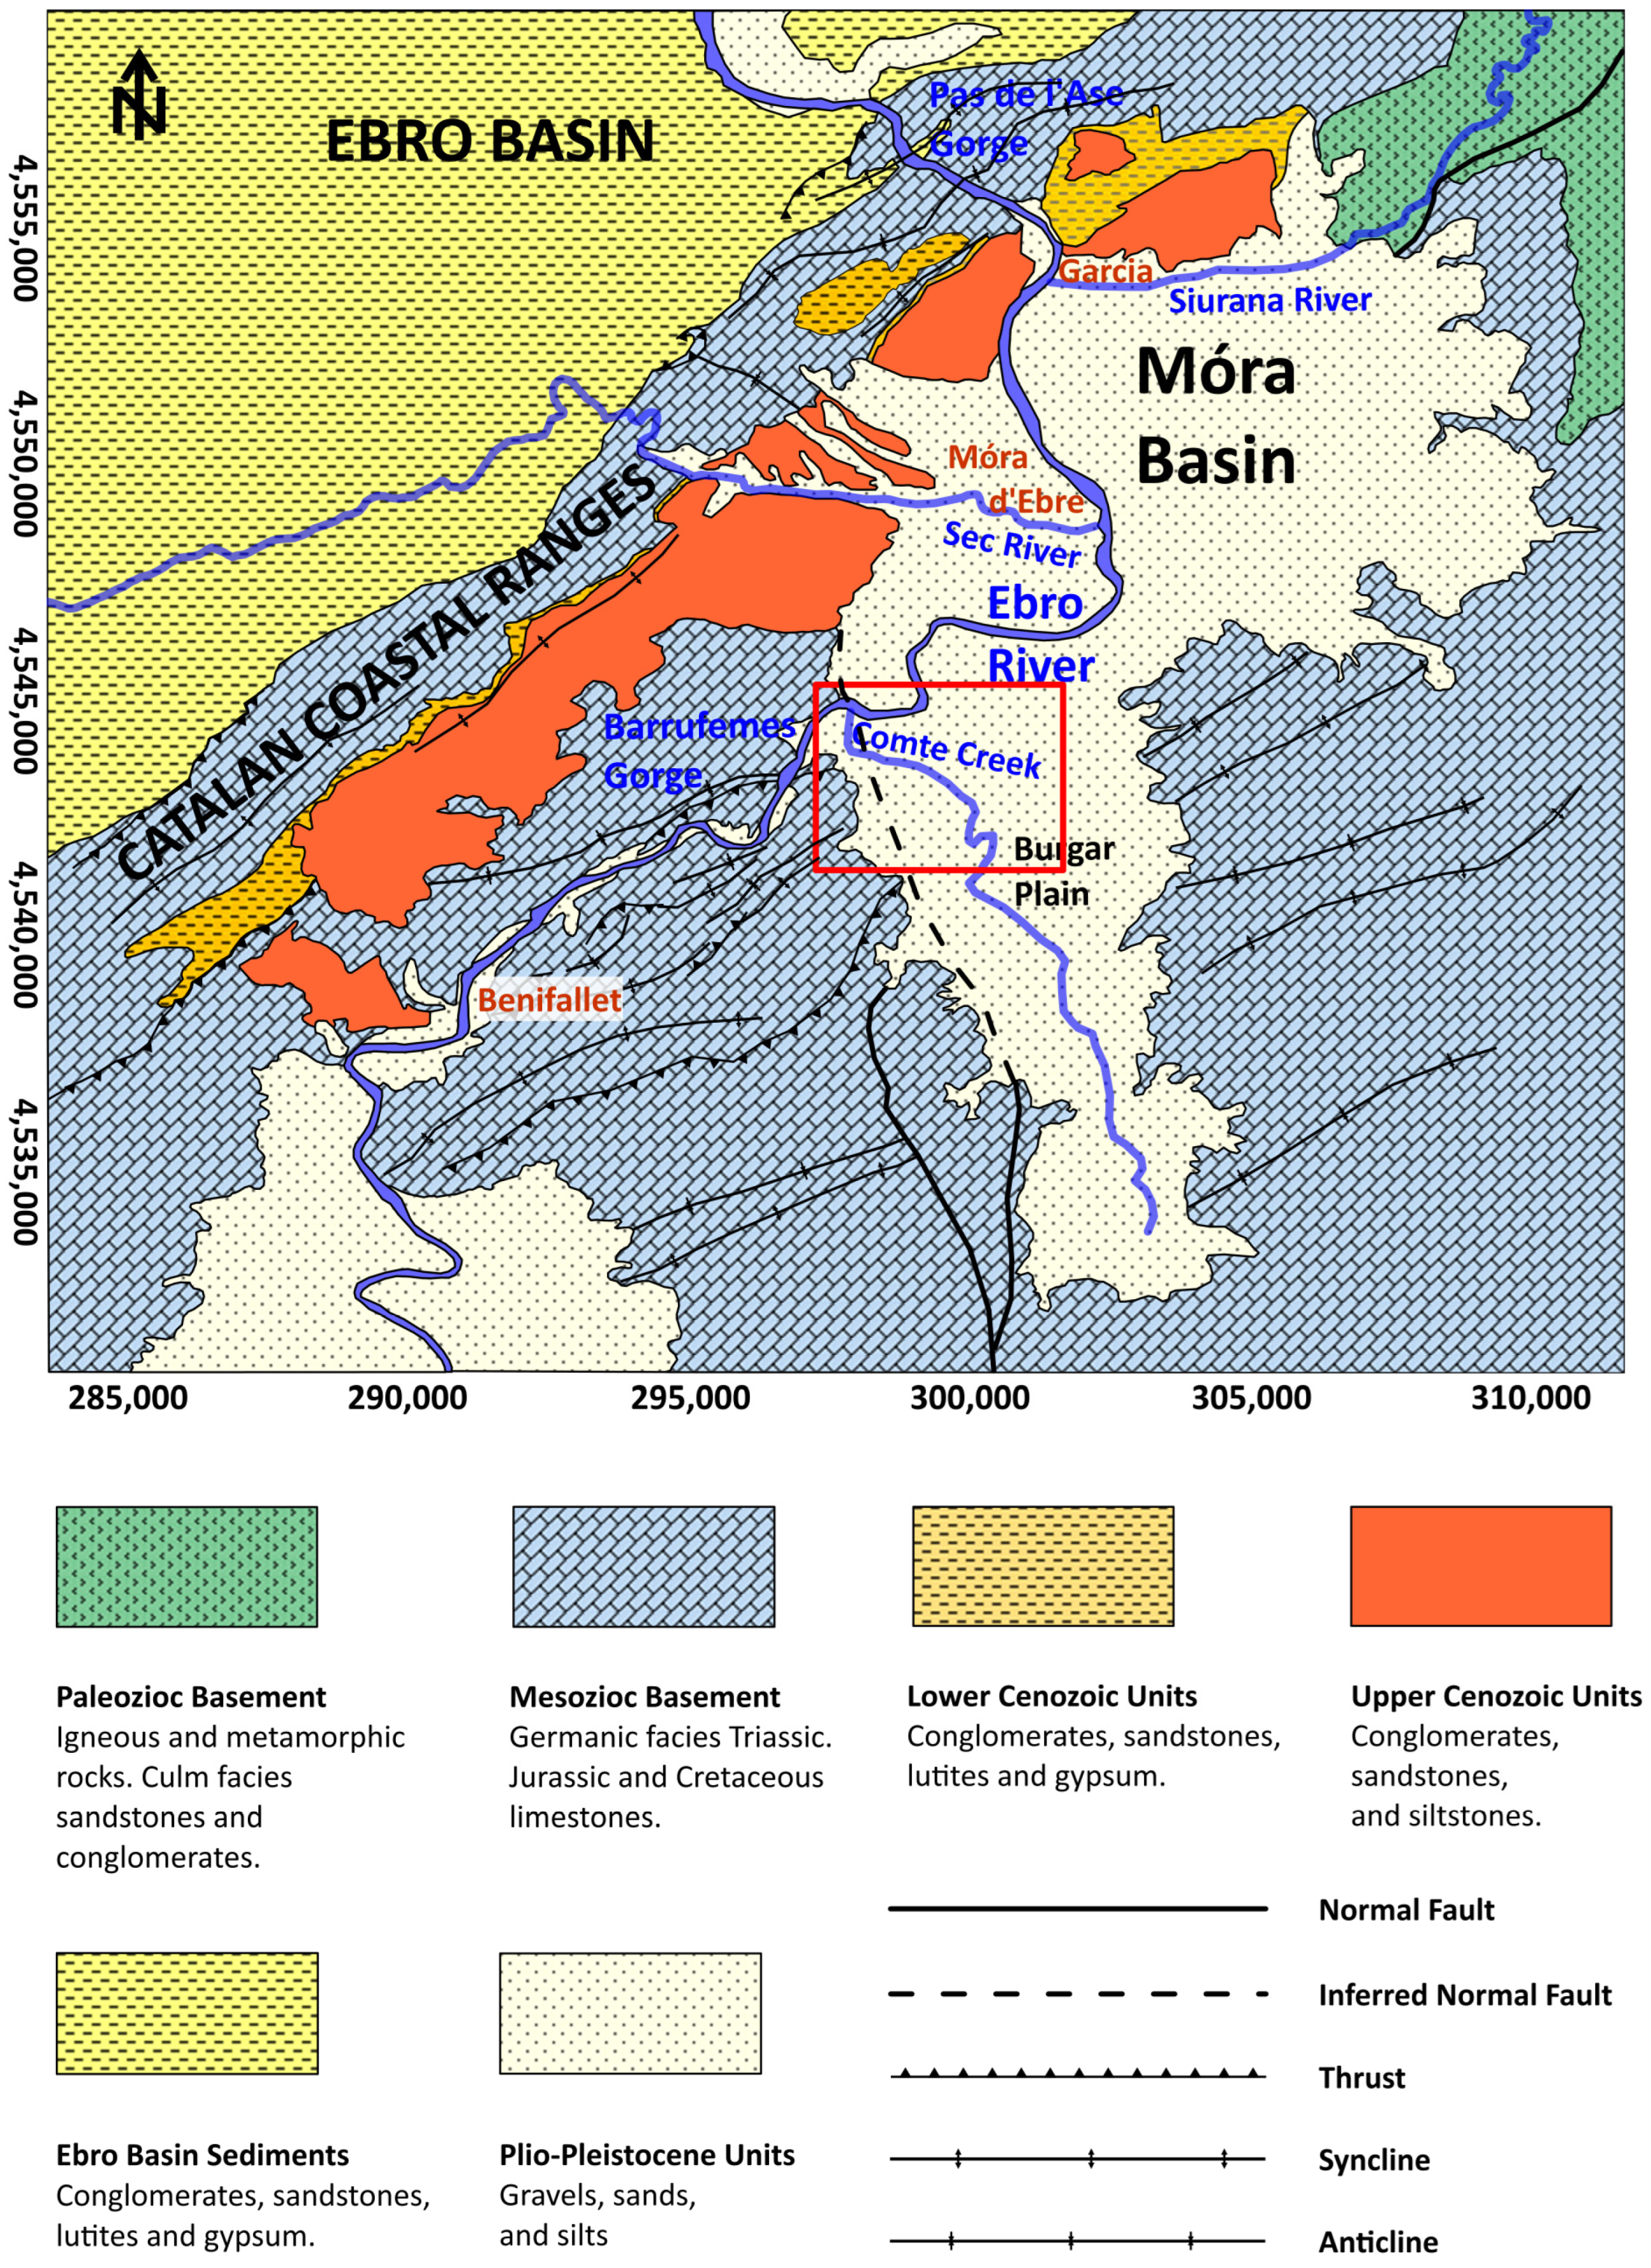
The MB was part of the primitive Ebro Basin from the beginning of the Cenozoic until the end of the Eocene-Oligocene, when the folding of an anticline of the Catalan Coastal Ranges left it as an isolated marginal basin (Figure 2). In the south of the basin, the limits of the Burgar Plain sub-basin are the only ones that can be the result of normal faults. From this moment and during the Neogene and Quaternary, it was filled with detrital sediments [31]. The Neogene and Quaternary sedimentary record of the Lower Ebro is related to the transition to exorheism of the Ebro Basin, which produced scarce deposition and a dominant incision in the way of opening the fluvial passage towards the Mediterranean Sea.
The sedimentary fill is a bedrock-alluvial mixed incised valley with a mainly degradational stacking architecture developed during its Late Miocene to Holocene history, probably controlled by an isostatic rebound in NE Iberia and sea level changes, accelerating or attenuating the paleo-valley entrenchment and sediment retention. There is no agreement on the moment of the opening of the endorheic Ebro Basin towards the Mediterranean Sea, with proposals that vary between 13 and 5.5 Ma [32].
The MB constitutes part of, and represents the terminal expression of, an incised-valley complex sensu Dalrymple et al. [33]. Within this framework, sediments are best classified as a fill terraces [34]. Such terraces are characterized by substantial sediment thicknesses—reaching as much as 50 m in the case of the MB—that infill a valley previously incised during a phase of relative sea-level fall.
The Comte Creek is of particular geomorphological significance: near its confluence with the Ebro River, just upstream of the Barrufemes Gorge, its valley reaches ~220 m in width and is generally dry. It drains ~120 km2 of the Burgar Plain, a depression filled with Neogene and Quaternary calcareous and marl detritus eroded from surrounding Mesozoic limestone slopes.
The Quaternary alluvial deposits of the Burgar Plain form several stepped terraces, whose textures indicate deposition by torrential, short-lived floods. Recent floods have produced a small alluvial fan at the Comte–Ebro confluence [35]. Notably, within the tributary valleys of the MB, fluvial units containing well-rounded clasts of Pyrenean origin—diagnostic of Ebro transport and provenance—have been identified. These deposits occur up to 4 km upstream of confluences, clearly distinguishing them from terrace deposits along the Ebro itself. Geomorphological and stratigraphic evidence suggests a Pleistocene age, with the most representative outcrops located in the Comte Creek valley, near the entrance of the Barrufemes Gorge.

3. Materials and Methods

To characterize the anomalous fluvial deposits in tributary valleys of the MB, three approaches were adopted:
  • Detailed mapping and description of the fluvial units in the lower section of the Comte Creek, including lithological compositions, sedimentary structures, bed thickness, and grain size distributions.
  • Hydraulic reconstruction using 2-dimensional (2D) flow modeling is designed to test hypotheses about formative hydrodynamic conditions. Modeling was performed both for the Ebro River valley within the MB and in detail for the Comte Creek.
  • Numerical dating of the deposits by optical luminescence.

3.1. Mapping and Description of Fluvial Units

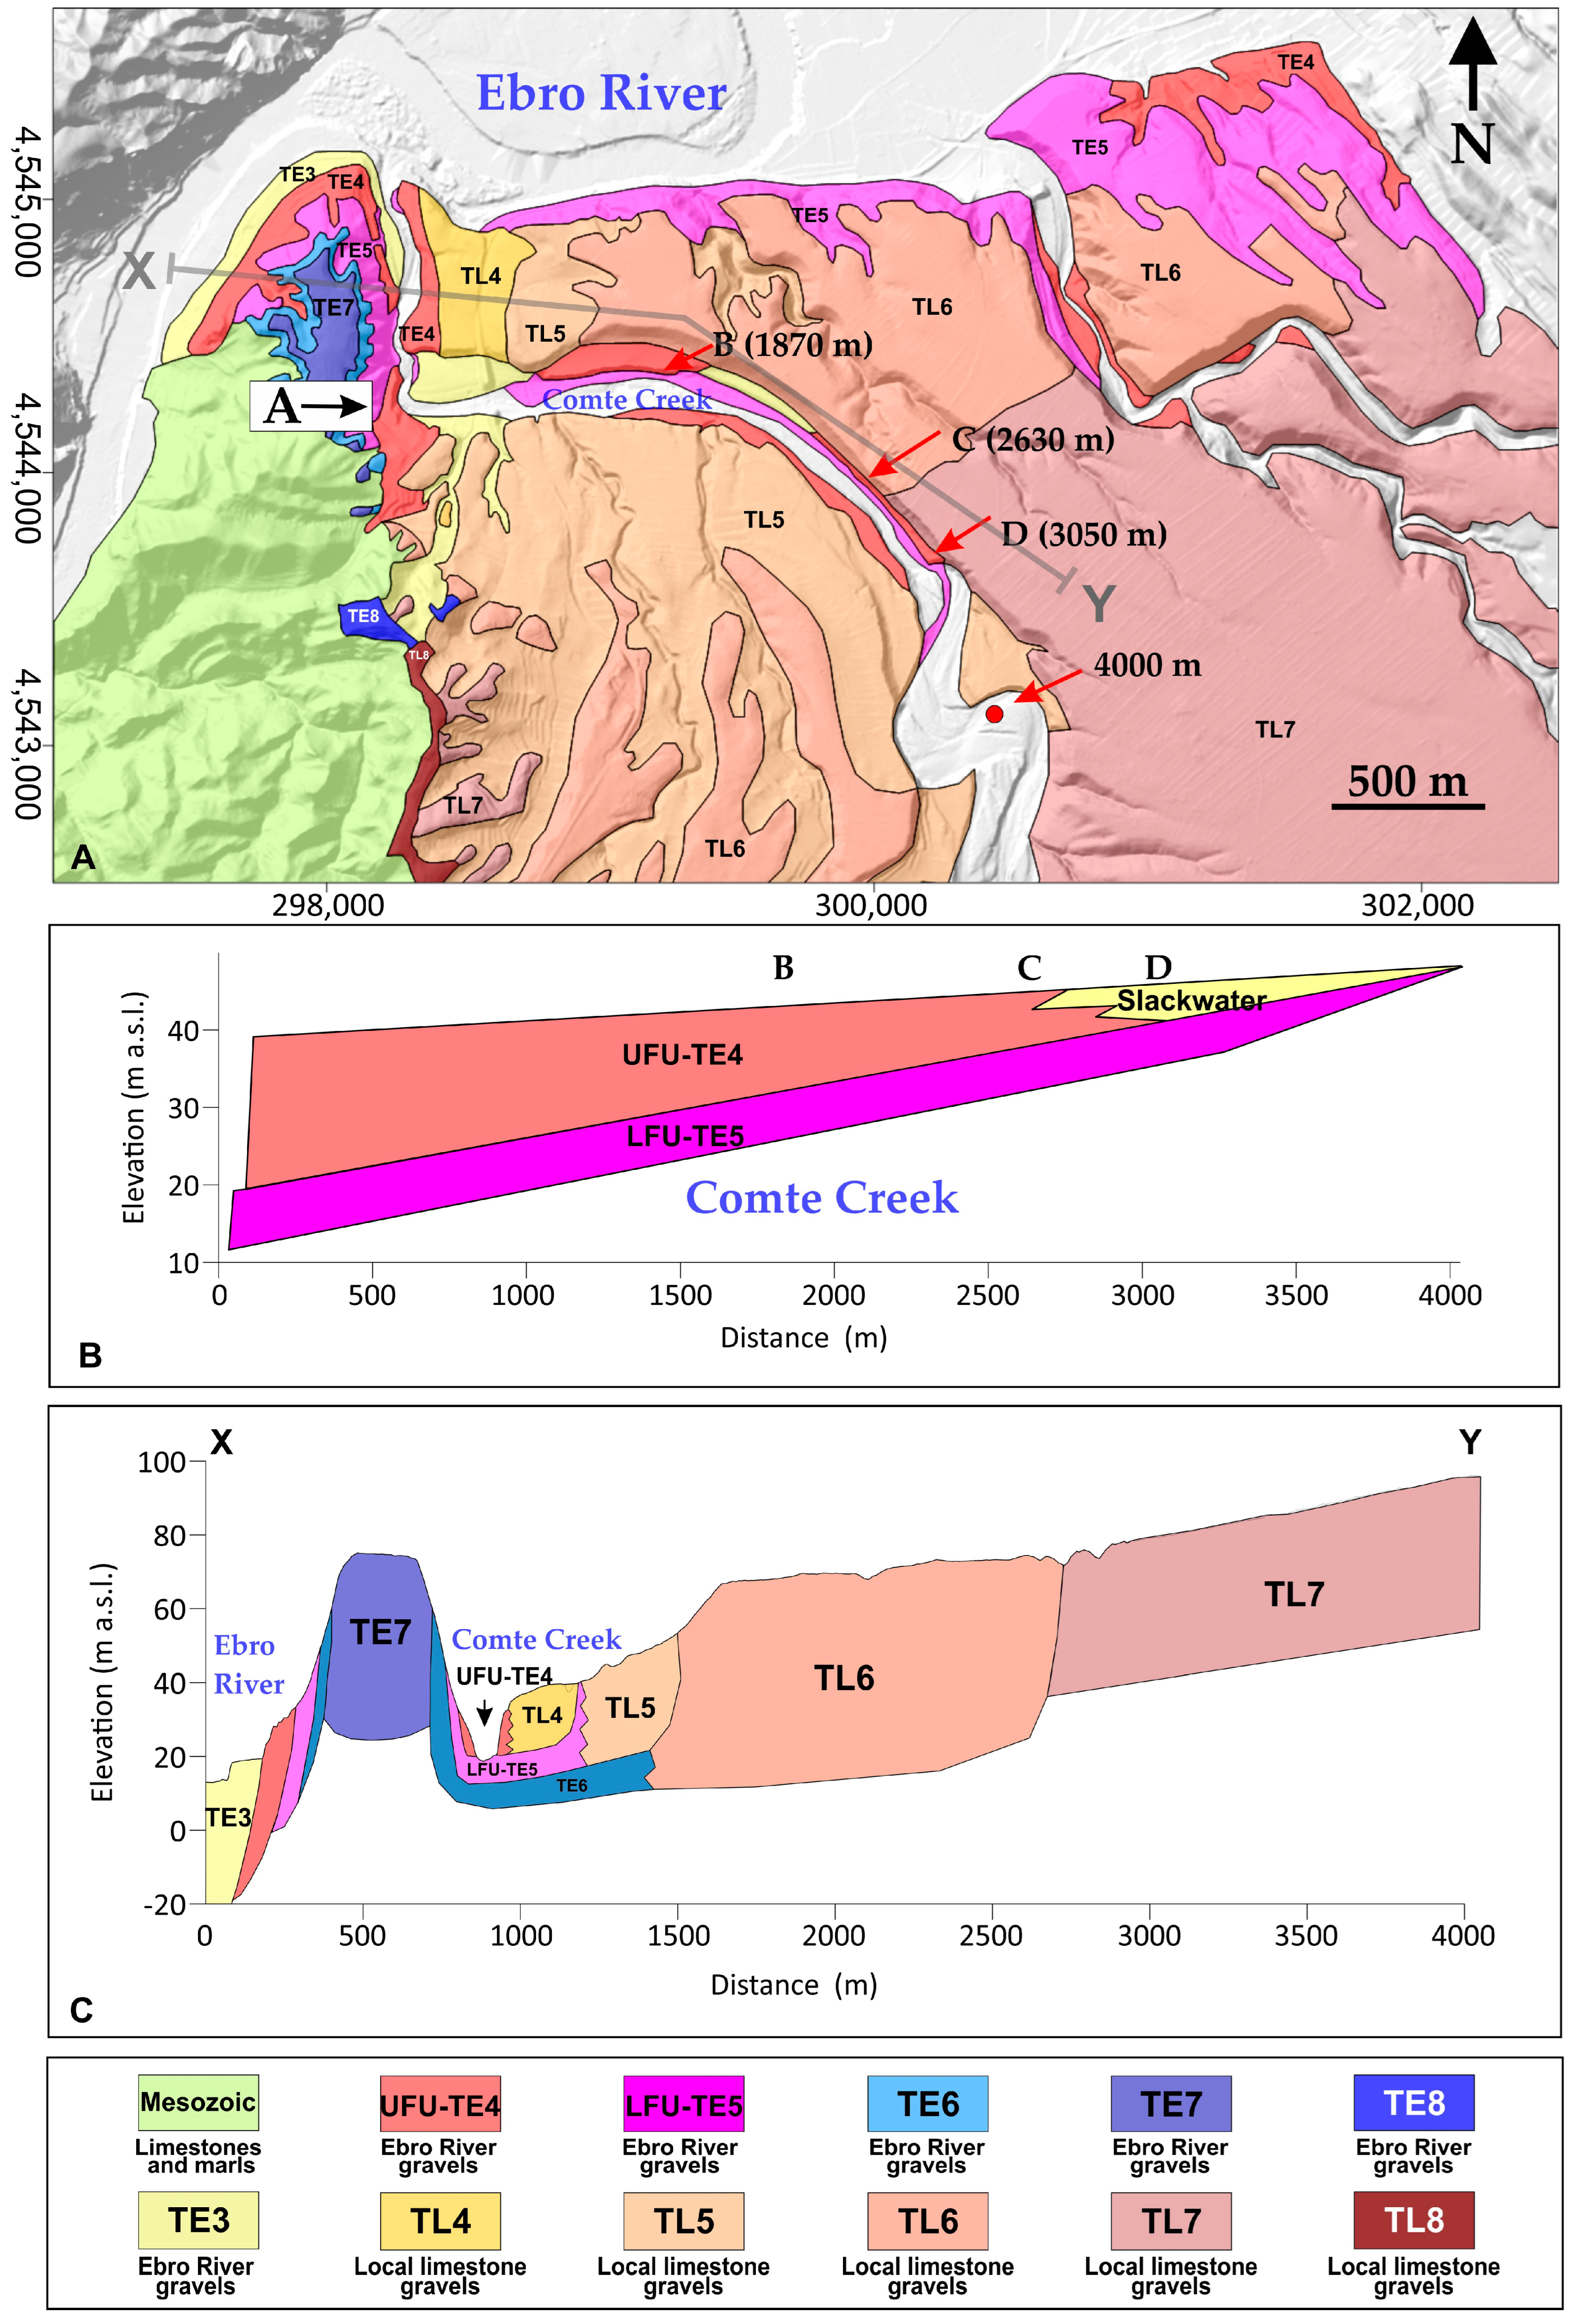
Field mapping and sedimentological descriptions were undertaken in the Comte Creek (Figure 3), while in other tributaries, only the maximum upstream extent and mean elevation above sea level (m a.s.l.) of deposits were recorded.
Mapping of sedimentary bodies allowed the recognition of stratigraphic sequences composed of multiple units and the identification of sedimentary structures and paleocurrent indicators. These provide insights into depositional dynamics and flow directions.

3.2. Hydraulic Modeling

The aim of the hydraulic reconstruction is to obtain the order of magnitude of the maximum discharge that has flowed through the Ebro River, assuming that the degree of uncertainty here is higher than in other simulations, where the scenario is better defined and on a smaller scale.
Two-dimensional hydraulic simulations were performed using IBER v. 2.5, an open-source software developed by the Universitat Politècnica de Catalunya and CEDEX [36]. The program solves shallow water equations via a finite-volume approach [37] with Roe’s numerical scheme [38]. The objective was to reproduce the upstream flow heights and shear stresses necessary to transport the characterized sediments.
The modeling strategy involved iterative simulations within a meander-shaped channel based on the dimensions of Comte Creek’s terminal reach and the slope of the surface contact between its two fluvial units. Model calibration was achieved by comparing modeled shear stresses with observed grain sizes (D50) at key points: (i) ~2630 m upstream, where coarse gravels are present, and (ii) ~3050 m upstream, where only fine-grained SWD occur (see Section 3.2.1). The Comte Creek discharge results were subsequently applied to simulations of the whole MB between the two gorges: Pas de l’Ase and Barrufemes (Section 3.2.2).
A systematic sensitivity analysis for two scenarios: the Comte Creek valley and the complete MB from Garcia, has been developed to quantify the model uncertainty and to evaluate the influence of the hydraulic parameters.

3.2.1. Hydraulic Modeling in the Comte Creek Channel

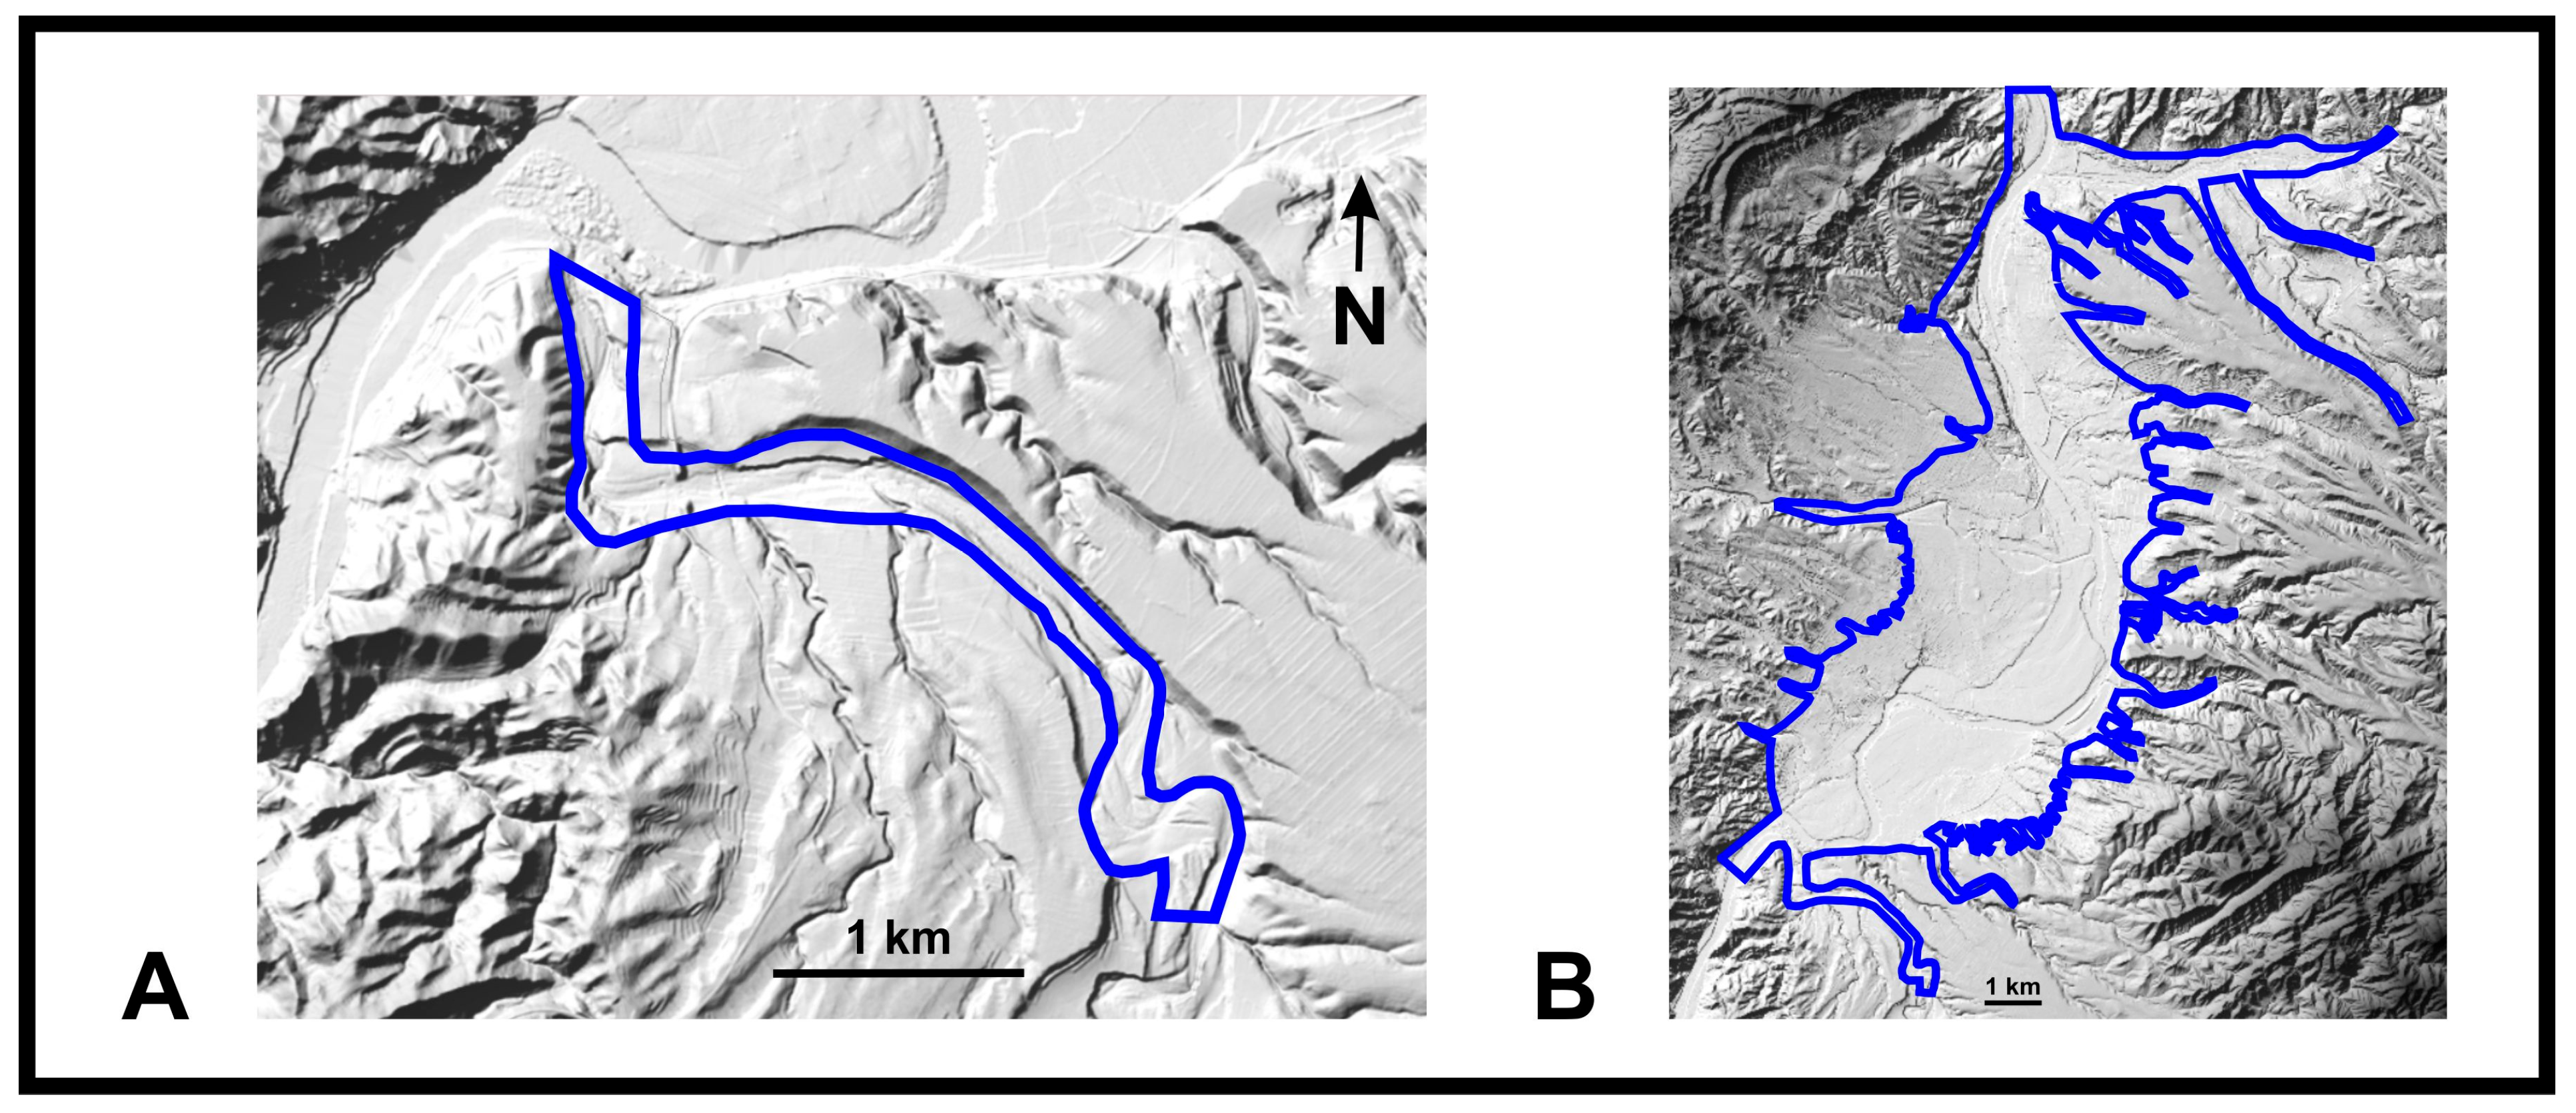
The hydraulic scenario of Comte Creek has been designed following the sinuous modeling of the valley’s current geometry (Figure 3). It follows the boundaries of the base of the Upper Fluvial Unit with widths ranging between 135 and 370 m and a total length of about 4000 m until reaching the maximum height of the anomalous deposits (48 m a.s.l.) encompassing the final meander (Figure 4A). A paleoslope of 0.007 has been assigned to this surface, derived from the bottom elevations of the Upper Fluvial Unit, corresponding to the surface over which the catastrophic flow deposited these sediments in Comte Creek. Based on this geometry, a 148-point grid with a mesh of 50 m triangular elements was constructed.
Given that the water flow depth over the thalweg reaches about 35 m according to the most extreme sediment remnants introduced in Comte Creek, the roughness coefficient should be more representative of the floodplain and lateral inundation areas than of the channel itself, and therefore should represent the obstacles of tree and shrub vegetation found in this area. The selected overall coefficient is thus 0.06.
Because the Comte Creek is an ephemeral stream, no initial conditions of water surface elevation or depth were imposed. Into this domain, a triangular hydrograph under critical/subcritical clean-water flow conditions was introduced at the downstream end to reproduce the upstream flow.
The model was configured to calculate water elevation and depth, velocity, Froude number, critical grain diameter, and shear stress, the latter being necessary for estimating bedload transport. Hydraulic modeling is inherently iterative, requiring trial-and-error adjustments of the hydrograph’s duration and peak discharge until the imposed conditions (paleostage indicators and transported grain sizes) are satisfied. In this case, the upstream flood extent could not exceed the highest meander’s deposits (l = 4000 m), while the modeled shear stress had to be sufficient to transport a given grain size (D50) to the identified outcrops.
The same Comte Creek scenario used to study the incoming flow has been employed to understand the characteristics of the backflow to the Ebro River. However, this simulation has a hard-to-solve problem. Only part of the sediment volume that has filled part of the channel in Comte Creek during the incoming flow is known. Thus, the topography of the initial scenario for the backflow is inaccurate, and the hydraulic reconstruction is only indicative. Its interest lies in the information it provides about the ranges of transported grain size and the flow’s ability to reshape sedimentary structures that were previously deposited.
At the start, with the valley full of water up to 4000 m in length, the water level at the end of the valley is 48 m a.s.l., while at the confluence it is only 20 m a.s.l. Therefore, there is an initial water height of 28 m that must be slowly drained as the flow in the main valley of the Ebro begins to decrease, allowing Comte Creek to empty.
The same slope (s = 0.007) and roughness coefficient (n = 0.06) assigned for the incoming flow were kept. Finally, a supercritical/critical outflow condition was imposed at the opposite end to simulate the water reflux.

3.2.2. Hydraulic Modeling of the Ebro River in the Entire Móra Basin

For the model of the entire MB, an ad hoc geometry of the Ebro River was extended from the Pas de l’Ase Gorge to Barrufemes Canyon, including lower reaches of the most significant tributaries (62 valley confluences) that could have influenced flood attenuation within the MB. It has a length of about 25 km and a width ranging from nearly 1 to 4 km. The lithological constriction at the Barrufemes Canyon was kept at its present width (450 m), as this feature has remained stable since the Pleistocene, being bounded by higher Ebro terrace deposits. Similarly, the confluence angle between the Comte Creek and Ebro River channels was maintained, as it is preserved in the stratigraphic record of the affected units.
The scenario geometry for the Ebro River was needed to encompass the outcrops of the Upper Fluvial Unit in the floodplain and its slope prior to the Barrufemes constriction and includes 1569 points (Figure 4B). The boundaries of the MB geometry have been defined in XY coordinates (ETRS−TM31, EPSG 6258), while the Z-axis corresponds to the base of the Upper Fluvial Unit deposit in the MB. From this irregular geometry, an unstructured triangular mesh with 50 m elements was generated.
As in the case of Comte Creek, the overall roughness coefficient selected is 0.06, more representative of the forested floodplain areas than of the channel itself, and therefore should represent the obstacles of trees and shrub vegetation found in this extended area.
A triangular hydrograph under critical/subcritical clean-water flow conditions was applied at the northern boundary of the mesh, with supercritical/critical outflow conditions at both the Barrufemes Strait and the inner end of each tributary.
Calibration of results required comparison with observed sedimentological data, particularly the mean grain size (D50) and its spatial distribution along the longitudinal profile of the Comte Creek.
Finally, the flood hydrograph in the Ebro River had to be designed to reproduce the same hydraulic conditions reached in the Comte Creek. The hydrograph and sediment transport results from the Ebro River/Comte Creek confluence and the Ebro River across the entire MB must be interpreted jointly.

3.3. Luminescence Dating

The timing of deposition of the fine-grained sediments from the Comte Creek was determined using Optically Stimulated Luminescence (OSL) dating. Two samples were collected from the sands of slackwater deposits of the Upper Fluvial Unit, representing the top and base of the level, separated vertically by approximately 5.5 m. The samples were processed and analyzed at the luminescence laboratory of the Institute of Earth and Environmental Sciences, University of Freiburg (Germany).
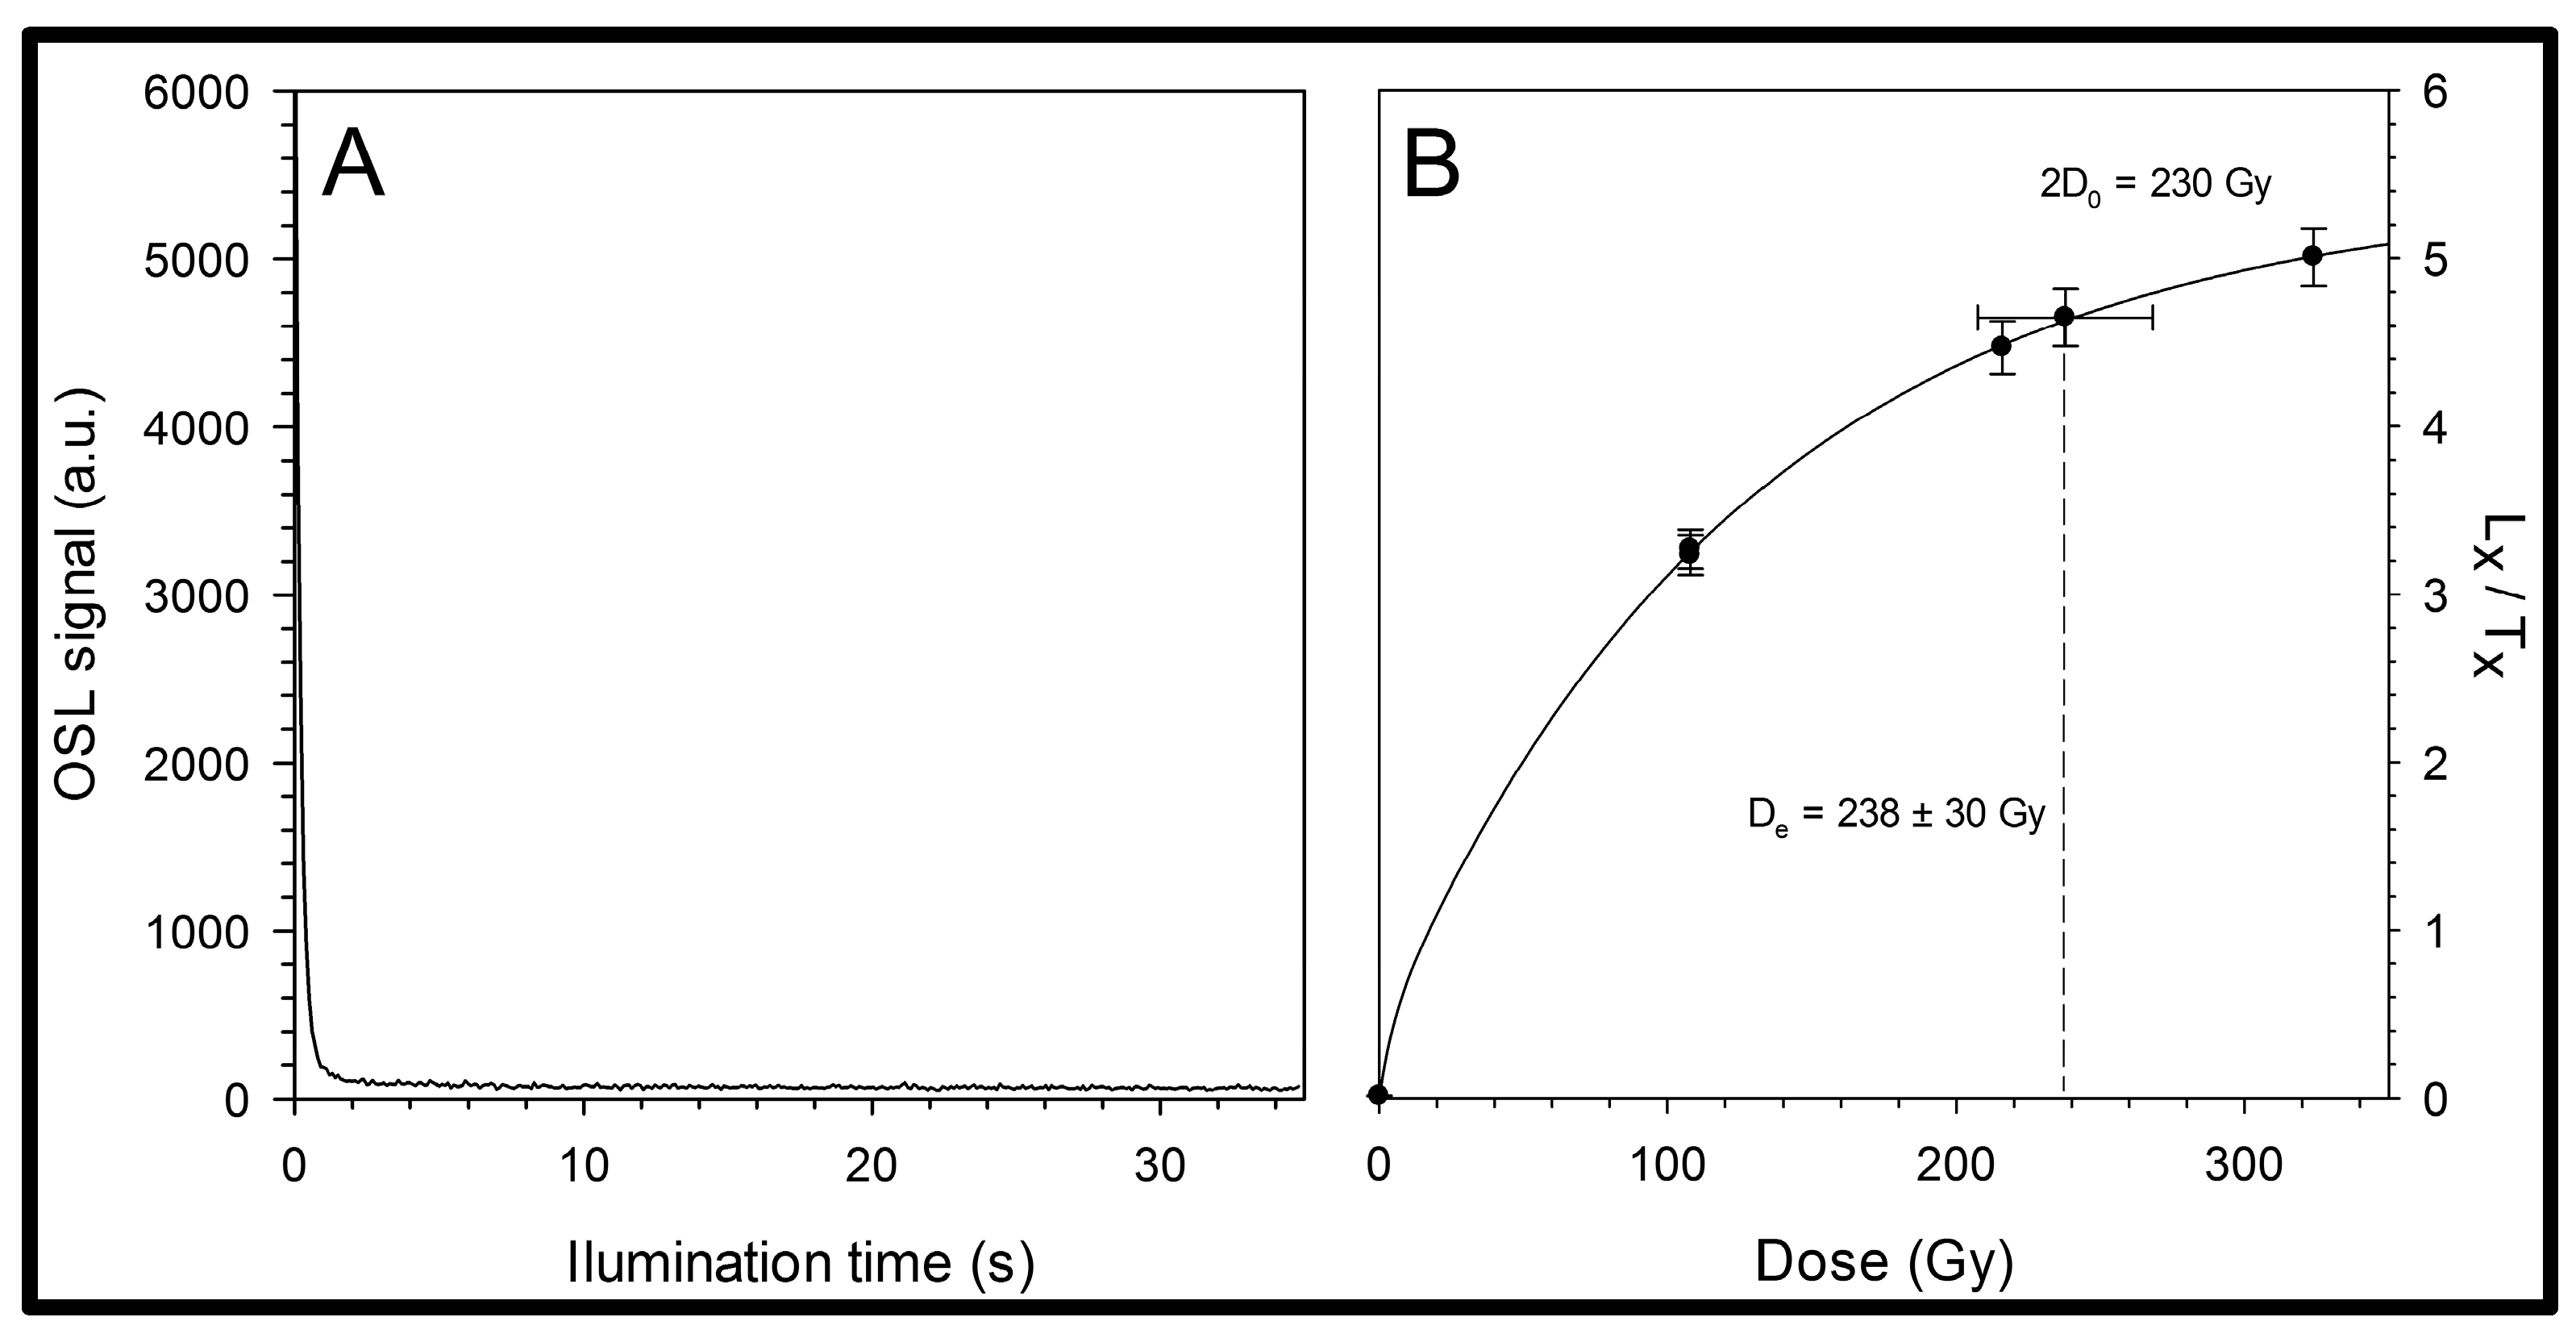
Equivalent dose (De) was measured on quartz grains (100–200 µm) after chemical pretreatments (10% HCl, 30% H2O2, Na-oxalate) and density separation using LST Fastfloat (ρ < 2.70 g cm−3; >2.58 g cm−3), followed by HF etching (40% for 60 min). Purified quartz grains were mounted on stainless steel discs (2 mm silicone stamp) and measured using a Freiberg Instruments Lexsyg Smart [39] with the combination of a Hoya U-340 and Delta-BP 365/50 EX filter. The Single Aliquot Regenerative Dose protocol [40] was applied using a preheat of 230 °C for 10 s prior to all OSL measurements. The OSL signals are quite bright, dominated by the fast component (Figure 5A), and show no response to IR stimulation (no feldspar contamination). Growth of the OSL signal with increasing laboratory radiation was best expressed by a sum of exponential saturating functions (Figure 5B). It must be noted that several of the aliquots approach the 2D0 limit [41] when using a single exponential function (see discussion below). A total of 25 aliquots were measured, the majority of which passed the rejection criteria [41]. For both samples, symmetric De distributions of repetitive measurements with relatively low overdispersion values (0.22 and 0.30) were observed. As a consequence, the average De for each of the samples was calculated using the Central Age Model [42].
The activity of dose rate-relevant elements (K, Th, U) was determined using high-resolution gamma spectrometry [43]. A burial moisture content of 6 ± 2% was assumed based on grain size and considering the climatic setting. Ages were calculated with ADE-Lev2017 software [44] using present-day depth for the determination of the cosmic dose rate.

4. Results

4.1. Fluvial Deposits in the Ebro River and Tributary Valleys

The overall valley-fill sequence (TE) in the MB is composed of two members: the basal and the superior. The basal member consists of the stacking of between five and ten sequences, each a few meters thick (2 to 5 m), formed by materials transported along the axial river channel of the Ebro during individual flood events. They consist of medium to coarse gravel, usually without sedimentary structures, on erosional bases, and are capped by a sandy, and occasionally silty, layer of metric thickness. It is common to find metric-sized blocks of gley soil fragments and local Mesozoic limestones on the erosional bases. They may incorporate local detrital inputs from tributaries that are added to the Ebro’s detrital assemblage. The upper member consists of sands and silts arranged in large-scale cross-bedded strata and is highly altered by pedogenic processes. They correspond to low-energy meander-type transport because the initial depositional system is filling in and losing slope and energy. The incised valley widens, and lateral local detrital inputs are preserved without integrating into the Ebro’s axial detrital system (TL).
In particular, on the upper member of the incised valley of the TE4 fill terrace, two very high-energy deposits (superfloods) are emplaced laterally into most tributaries of the Ebro in the MB. In the axial trunk, these sediments reach up to 15 m in thickness. In the paradigmatic case of Comte Creek, the two superflood deposits reach up to about 10–12 m in thickness at KP 1870 and KP 2630 (points B and C in Figure 3A,B) in the valley. These deposits are described in the following sections as the Upper Fluvial Unit (UFU of Section 4.1.1) correlated with terrace 4 of the Ebro River axis (TE4) and the Lower Fluvial Unit (LFU of Section 4.1.2), which can be correlated with terrace 5 of the Ebro River axis (TE5). The UFU deposits overlie the LFU throughout the entire Comte Creek Valley.
Lithological and textural features of deposits in tributaries confirm their provenance from the Ebro River: gravels of Pyrenean origin include quartzites with quartz veins, granitoids, sandstones, Permo-Triassic conglomerates, Mesozoic limestones, dolomites, and Eocene limestones with Alveolina. This composition clearly distinguishes them from locally derived alluvial gravels of unsorted, subrounded calcareous clasts.
Table 1 summarizes the tributary valleys of the Móra Basin where Ebro-derived deposits have been identified near confluences. On the left bank, deposits occur in the Nolla, Manou, Gàfols, and Comte Creeks; on the right bank, in the Perles and Faneca Creeks, as well as the Sec River. The most extensive and best-preserved deposits are found in Comte Creek.
Sedimentary structures such as medium-scale planar cross-stratification and clast imbrication are commonly observed. The degree of consolidation varies; older deposits often appear as coherent conglomerates and sandstones, whereas younger units remain unconsolidated. Ebro-derived fluvial deposits are frequently overlain or interbedded with unsorted, matrix-rich, subrounded limestone and dolomite clasts deposited by local tributary floods of Comte Creek. These sediments are characteristic of flash-flood dynamics typical of small Mediterranean basins.
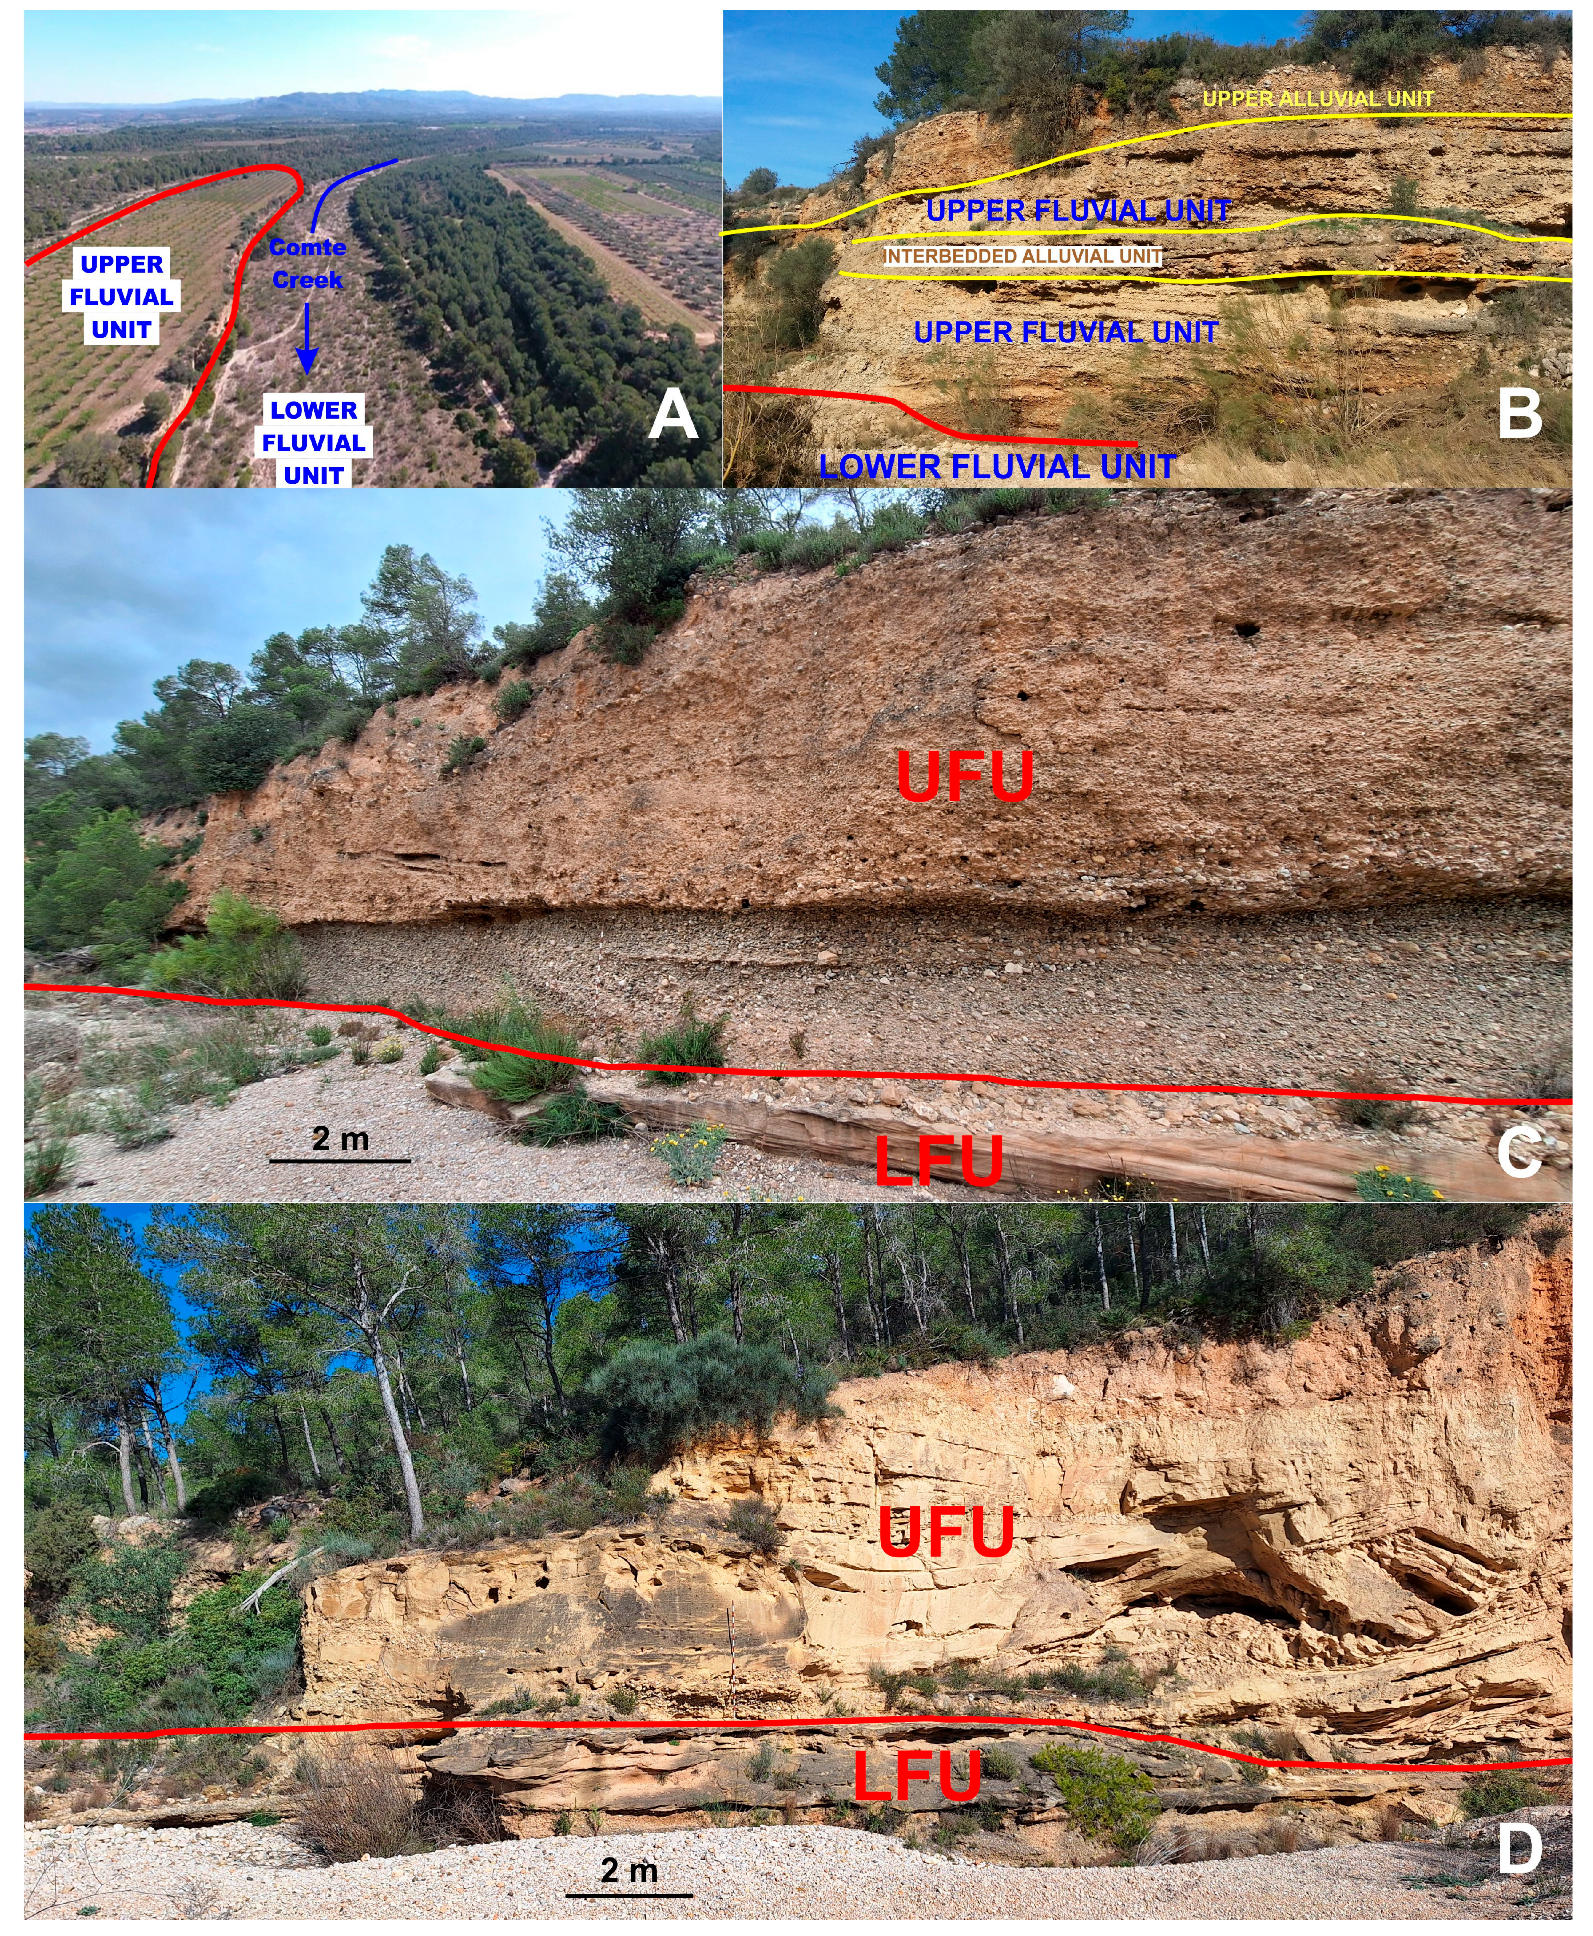
In the final reach of Comte Creek, two distinct Ebro-derived fluvial units were identified (Figure 3 and Figure 6):
  • A basal, consolidated conglomeratic unit (Lower Fluvial Unit), traceable between ~1.0 and 3.55 km upstream, correlates with the TE5 fill terrace of the Ebro River.
  • An overlying, poorly consolidated gravel unit (Upper Fluvial Unit) was observed immediately above the lower unit and correlated with the TE4 fill terrace of the Ebro River.
The two units are separated by a disconformity with a measurable slope of 0.007 between 1400 m upstream (28 m a.s.l.) and 3050 m upstream (40 m a.s.l.), lower than the modern channel gradient (0.0095). Their stratigraphic relationships indicate that after incision of the valley, two successive phases of sediment aggradation occurred: (i) upstream transport and deposition of Ebro sediments within the Comte Creek valley, and (ii) subsequent interbedding with locally derived alluvium. A later phase of valley re-incision produced modern morphology.

4.1.1. The Lower Fluvial Unit

The Lower Fluvial Unit, partly buried beneath Holocene terrace deposits, crops out between 1000 and 3550 m upstream (Figure 6A). It consists of rounded gravels of Pyrenean provenance, including quartzites with quartz veins, granitoids, Permo-Triassic conglomerates, and limestones. Beds contain well-sorted clasts ranging from centimeter to decimeter scale. Local alluvial intercalations of unsorted limestone gravels testify to the ephemeral flash floods from the Burgar Plain, alternating with Ebro-driven upstream flood deposits.

4.1.2. The Upper Fluvial Unit

The Upper Fluvial Unit forms a 15–20 m-thick multistory deposit, composed of meter-scale beds of sorted gravels dominated by quartzites, granitoids, limestones, and Permo-Triassic conglomerates of Pyrenean origin. In its basal reaches, boulders of reworked gleyic paleosols are incorporated, having been eroded and transported upstream by Ebro floodwaters. Imbricated clasts and sedimentary structures consistently indicate flow polarity toward the Ebro confluence, although contradictory directions are sometimes present, suggesting alternating flow and backflow.
The principal accumulation occurs 1.3–1.9 km upstream on the right bank, where up to nine gravel beds separated by erosional surfaces are present (Figure 6B). Interbedded sands and silty sands, often poorly structured, record deposition in fluctuating flow conditions. Local alluvial inputs of unsorted calcareous gravels are also intercalated. Farther upstream (~2.5 km), two stacked gravel deposits appeared (D50 = 0.08–0.1 m). The overlying one, a planar cross-bedding in a 2 m-thick gravel deposit, documents unequivocal upstream transport, a key feature for hydraulic reconstruction (Figure 6C).
At ~3.05 km upstream, gravels laterally grade into two sandy ~8 m-thick deposits with medium- to small-scale cross-stratification, interpreted as SWD (Figure 6D). These mark the inner limit of the Upper Fluvial Unit within Comte Creek. Beyond this point, the valley meanders, and only the conglomerates of the Lower Fluvial Unit remain exposed.

4.2. Hydraulic Modeling

4.2.1. Hydraulic Modeling of the Comte Creek

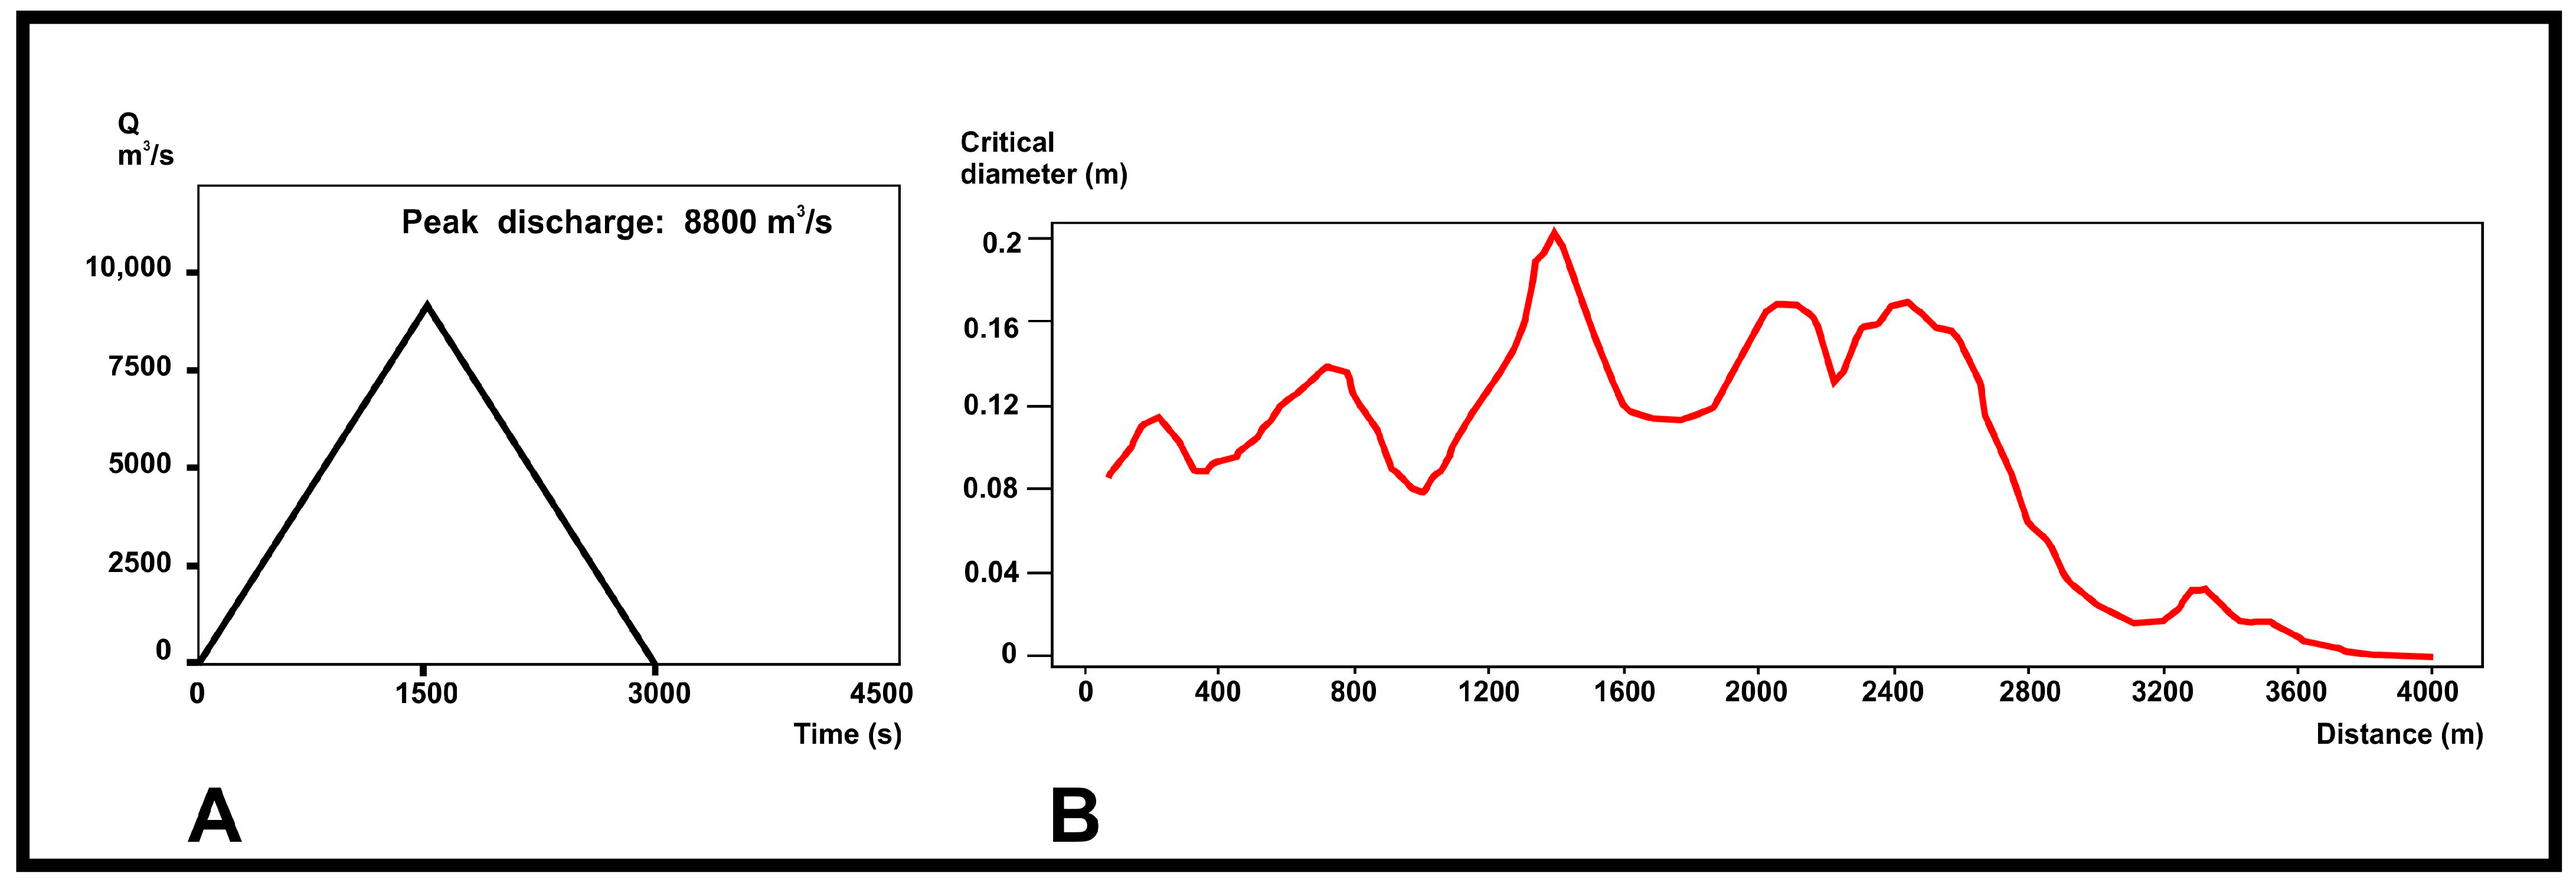
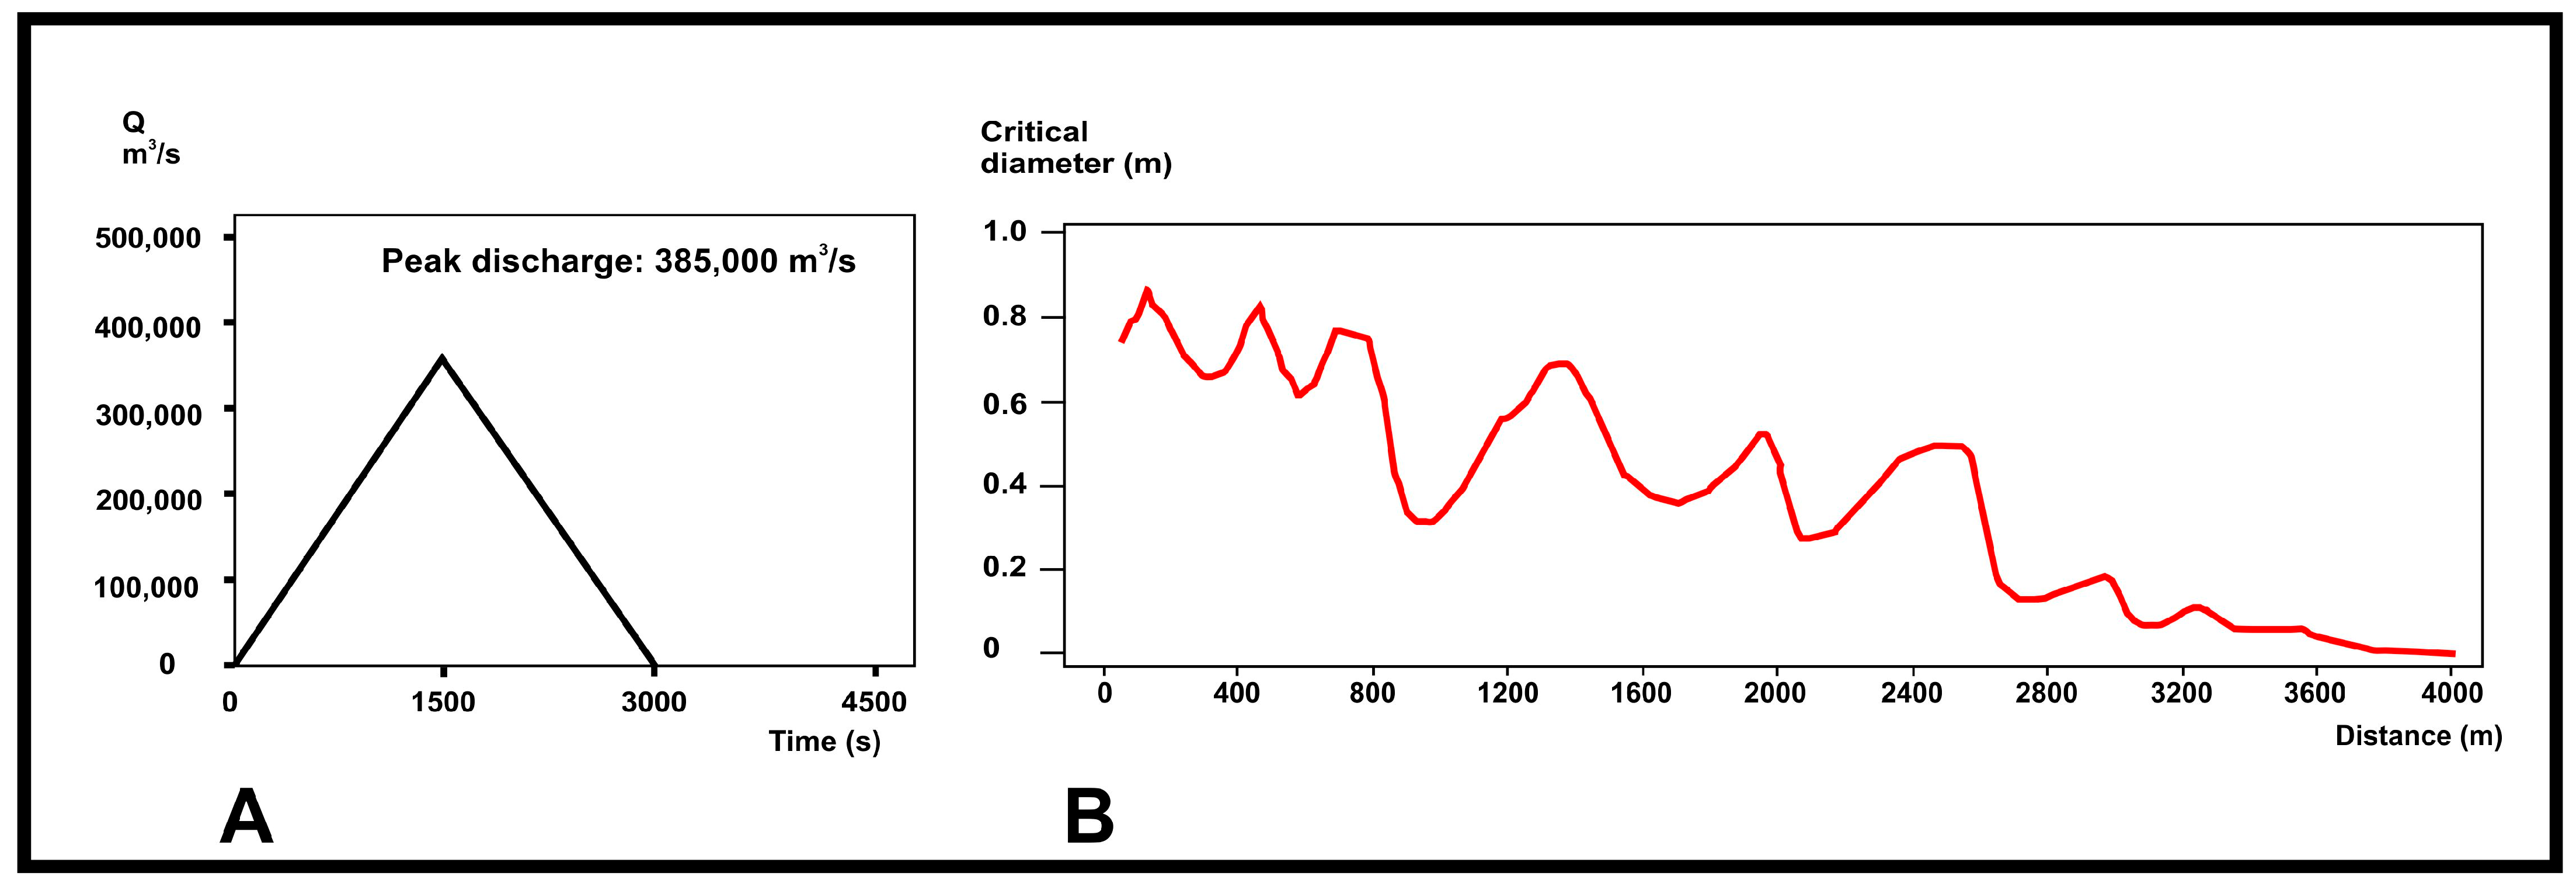
The upstream flow along the Comte Creek channel was modeled using a 50 min triangular hydrograph with a peak discharge of 8800 m3·s−1 (Figure 7A). Under these conditions, the flood wave propagated 4000 m upstream, producing a water depth of 27.8 m at the confluence. In addition, the flow could transport a critical grain size of 0.16 m upstream to 2700 m, where it abruptly lost competence and was only able to move finer sediment to the channel terminus (Figure 7B).
Calibration of the sediment transport model relied on two key criteria: the sedimentary structure (planar cross-bedding) of the Upper Fluvial Unit exposed at 2630 m (Figure 6C) and the dominant grain size (D50 = 0.08 m), together with the stratigraphic position where gravels interfinger with sands and silts at 3050 m. The simulations demonstrate that the upstream-directed hydrograph was able to transport a D50 of 8–15 cm as bedload across straight or oblique crest dunes, producing the corresponding sediment graph. At 3050 m, the flow competence decreases, transporting only sand and silt to the end of the meander (4000 m). This point marks the onset of slackwater flood deposition, where standing water and fine sediment filled the entire meander up to the upstream limit.
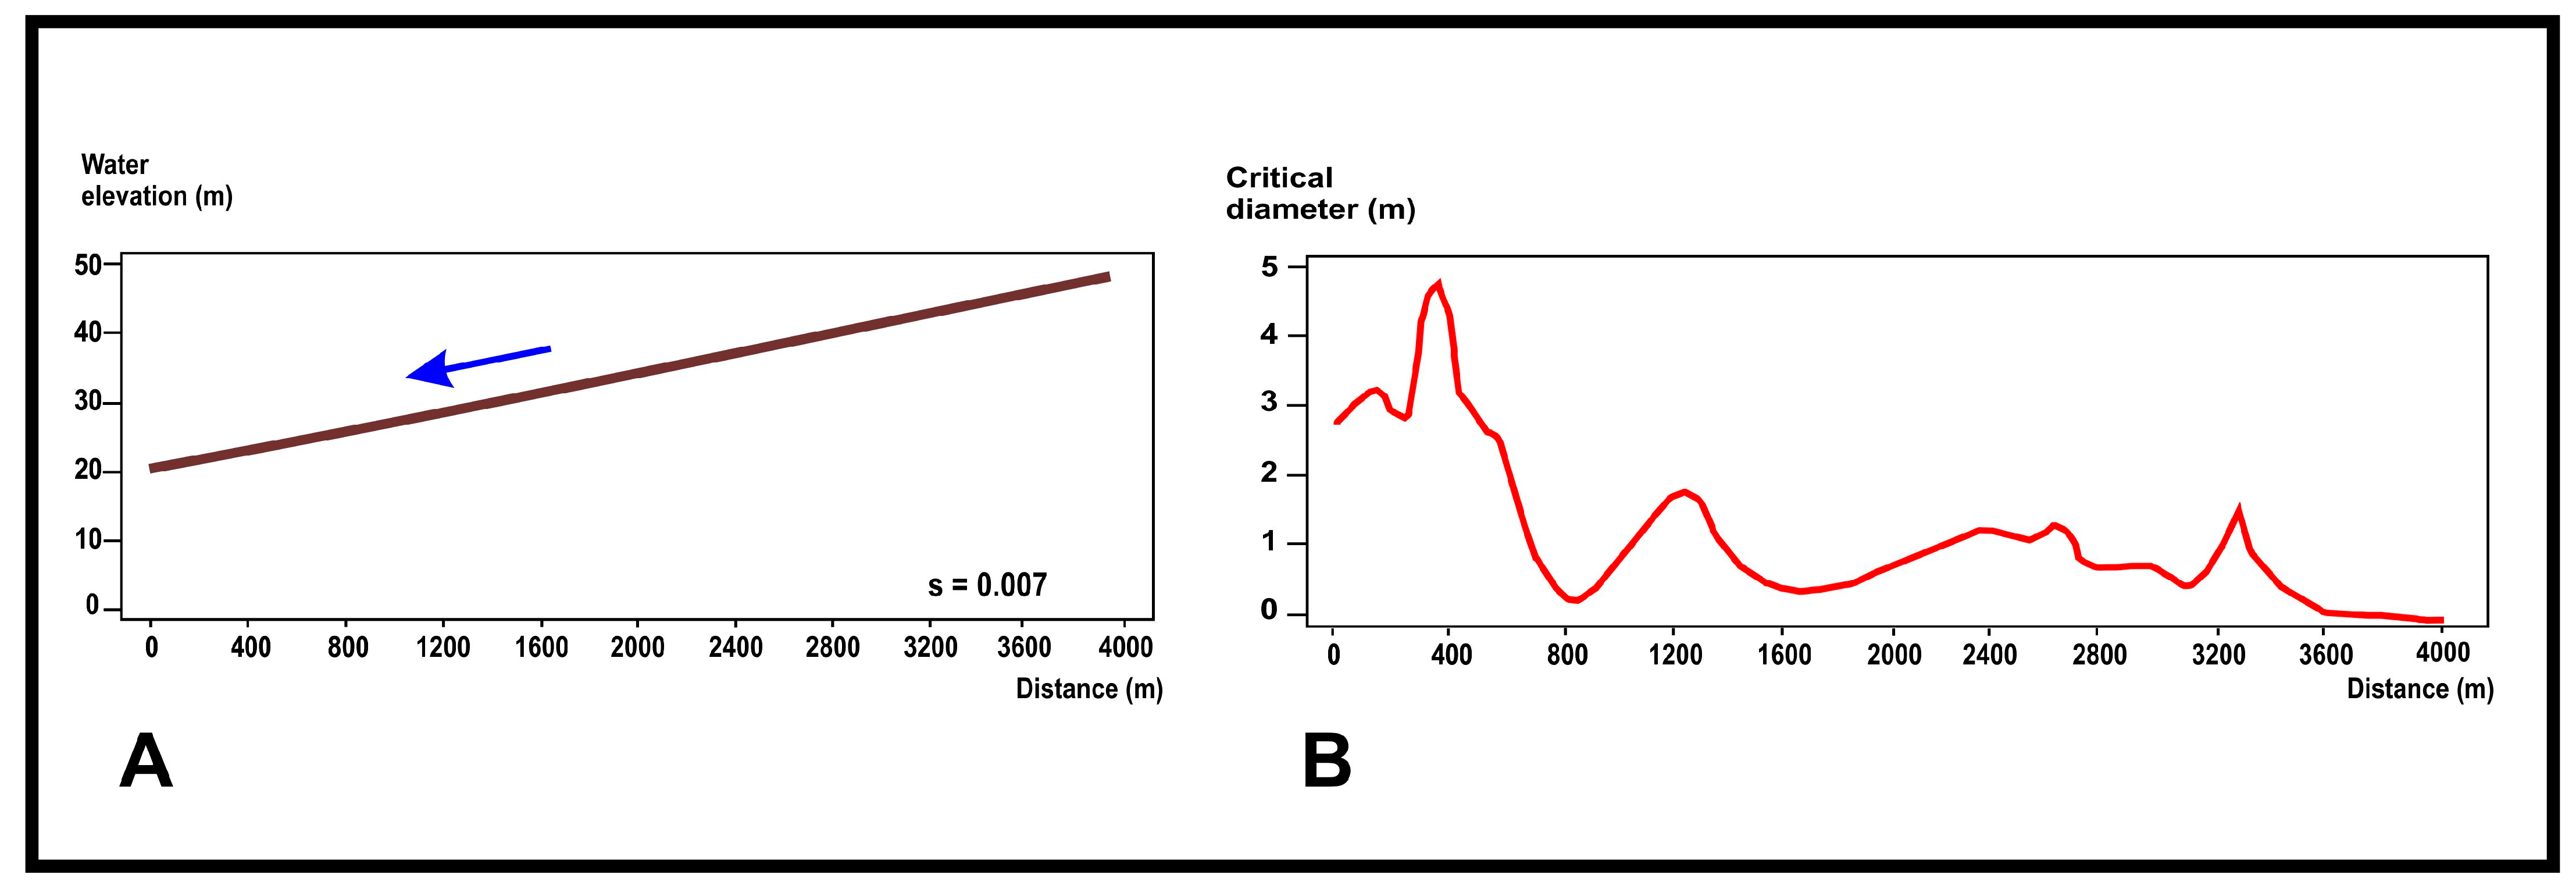
Finally, backflow within the tributary was simulated after the passage of the peak discharge. In this case, it was assumed that outflow through the confluence and the lithological constriction was no longer restricted, and that the system functioned as a weir under supercritical/critical flow conditions. Modeling drainage from a water level of 48 m a.s.l. (Figure 8A) produced the sediment diagram shown in Figure 8B. The results of the backflow model should be merely indicative. In the first 500 m of the valley (between 3500 and 4000 m from the confluence), the bedload transport competence is very low, and floodwater within the tributary becomes stagnant and drains under very low-energy conditions. From here, bedload transport increases noticeably, and the gravel bars can be remobilized, migrating downstream, as can be seen in some outcrops of the valley. The maximum critical grain size was reached at ~400 m, near the confluence with the Ebro River.

4.2.2. Hydraulic Modeling of the Ebro River in the Entire MB

In the mesh designed for the Ebro River in the entire MB (Figure 4B), a 50 min triangular hydrograph with a peak discharge of 385,000 m3·s−1 was introduced (Figure 9A). This simulation resulted in upstream flooding 4000 m into the Comte Creek, with a water depth of 26.3 m at the confluence. The resulting sediment transport diagram was irregular, but it nevertheless met the condition of bedload competence up to 3000 m (Figure 9B).
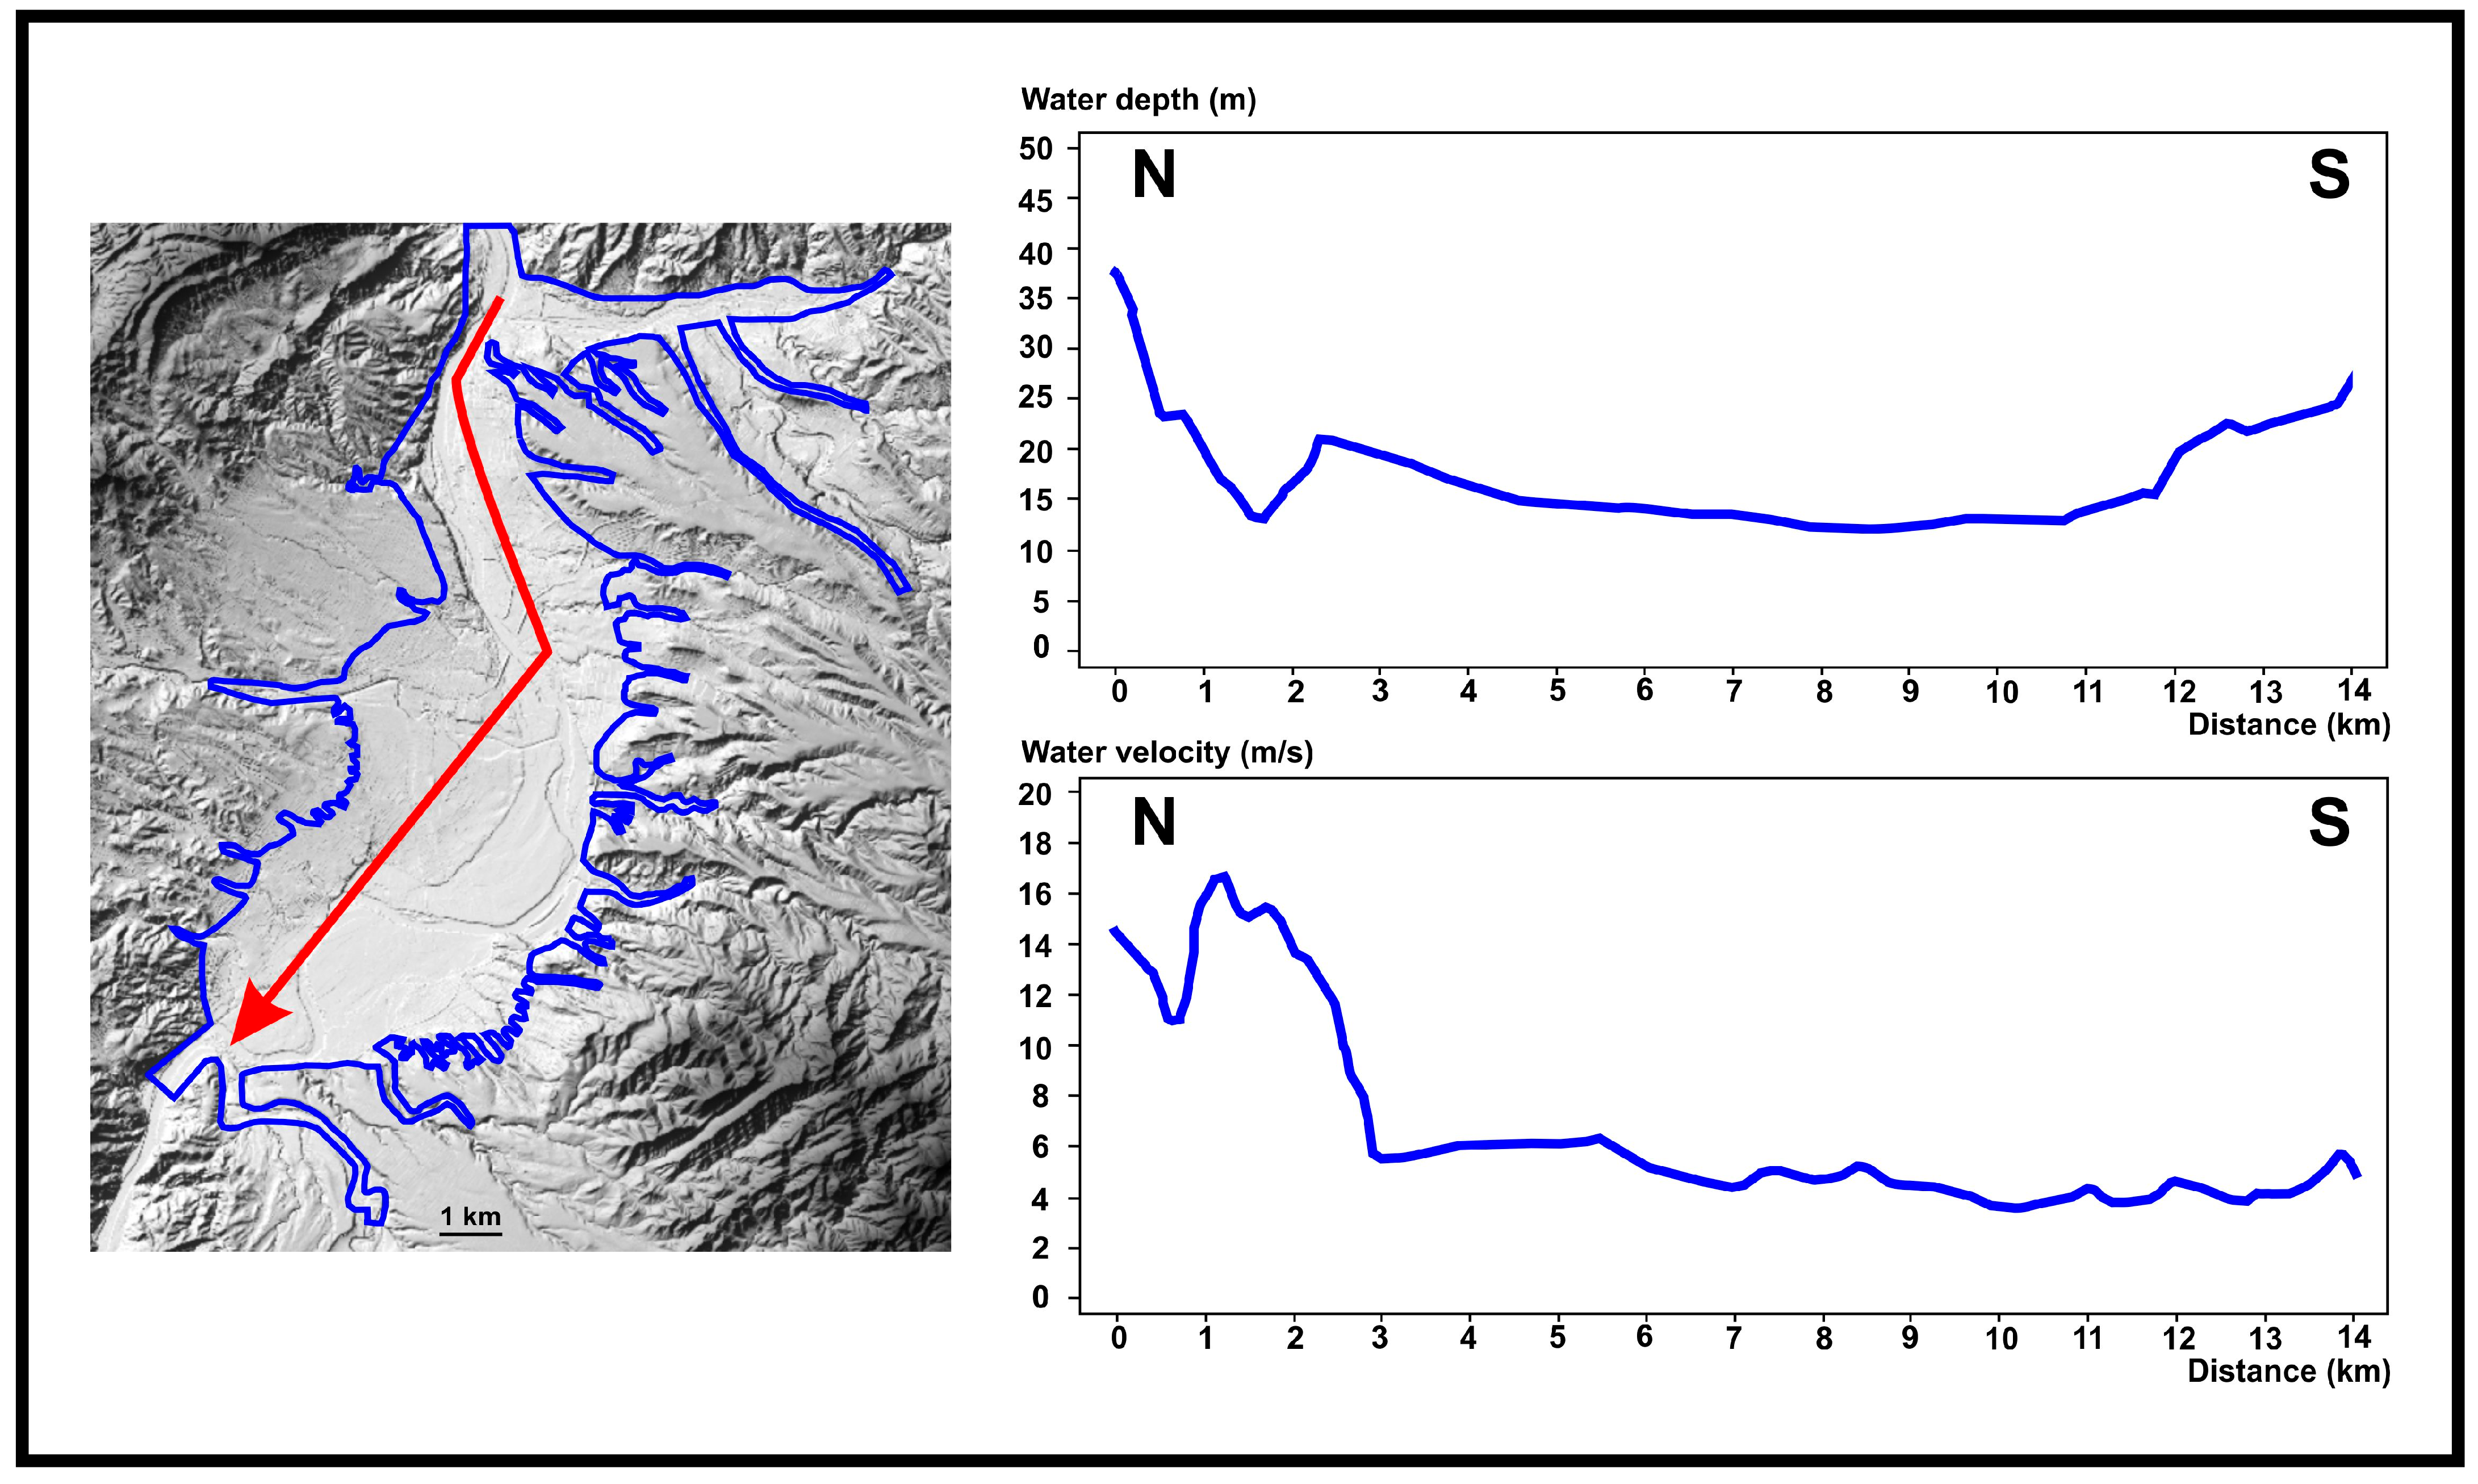
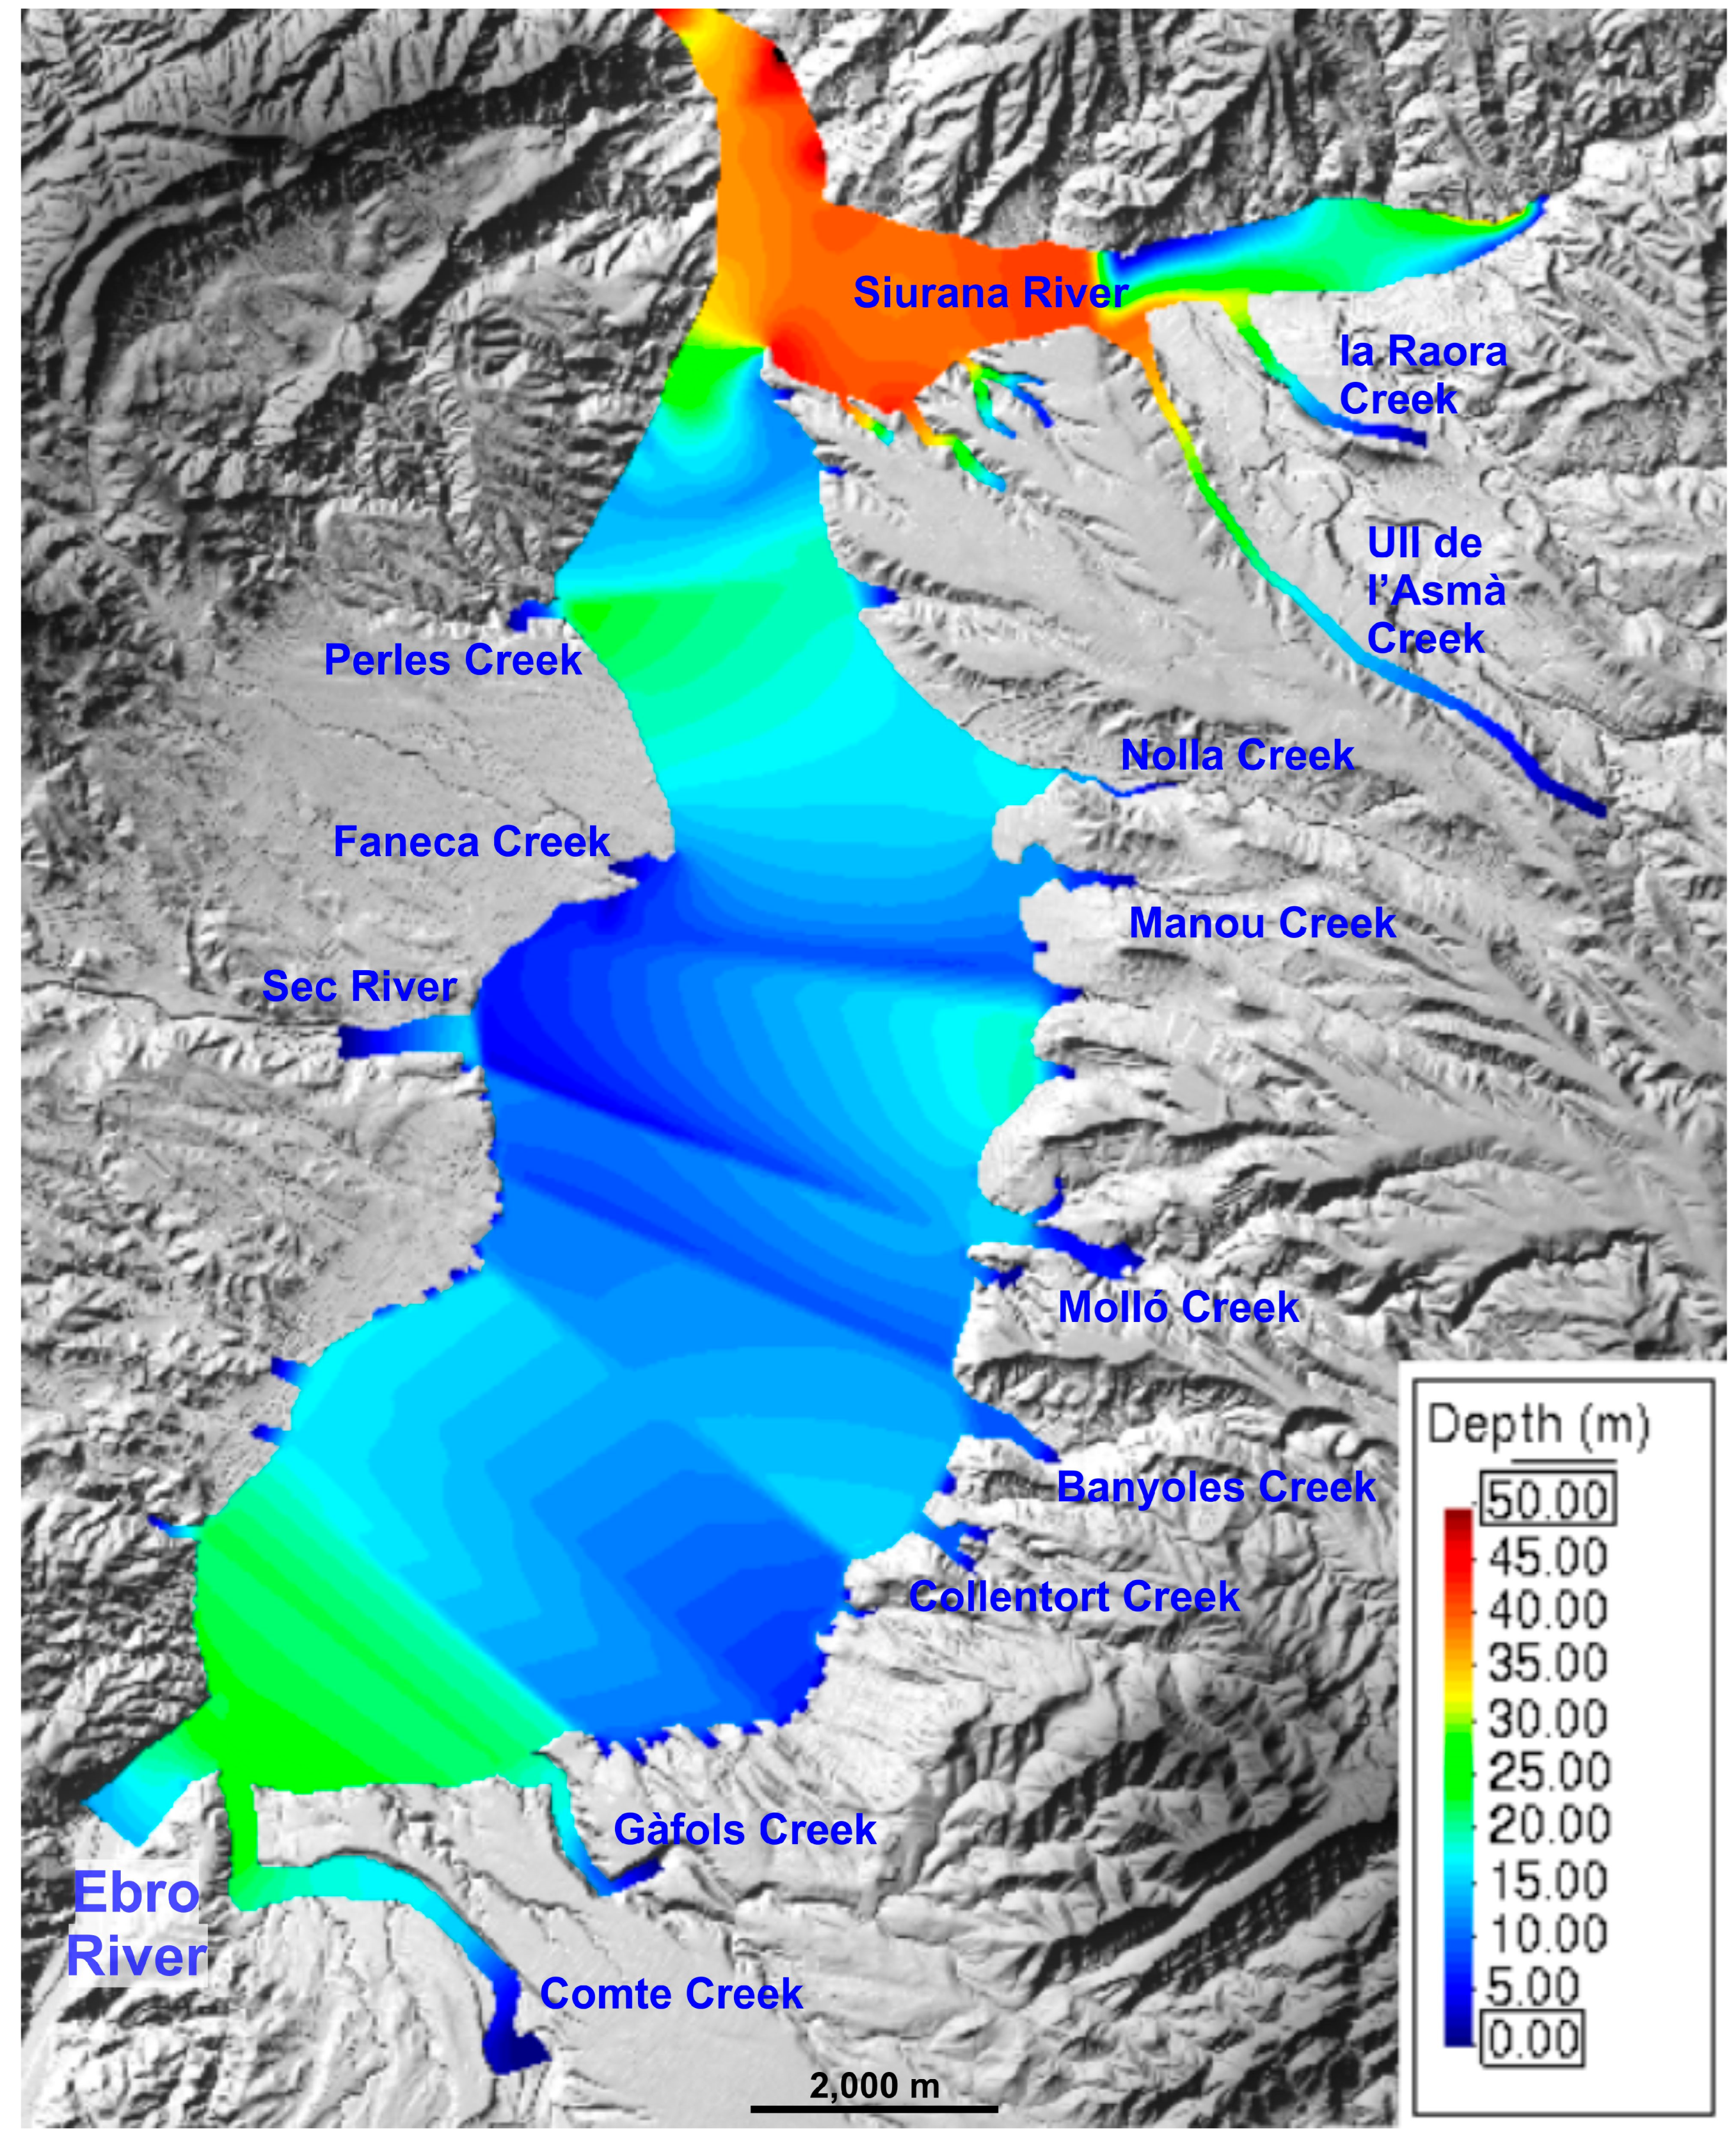
The distribution of water depth and velocities along a longitudinal profile of the MB is shown in Figure 10. The average water height is very high (between 15 and 35 m) in the first few kilometers. From km 3 onwards, it ranges between 12 and 20 m. The highest velocities (from 12 to 16 m·s−1) correspond to the reach located at the confluence of the Ebro and Siurana Rivers. After this reach and up to Barrufemes Canyon, the Ebro River velocities range between 4 and 6 m·s−1. The map in Figure 11 shows the spatial water depth variability of the MB flooded area. The model simulation indicates that the greatest depths are reached in the northern part at the confluence of the Ebro and Siurana Rivers (where the depth exceeds 40 m) and then at the arrival at the Barrufemes Canyon, where Comte Creek is located (with about 25–30 m depth).
Table 2 summarizes the hydraulic and sedimentological variables obtained from the modeling. Values are compared at a calibration point located 2630 m upstream from the confluence. The results indicate that a discharge of 8800 m3·s−1 in the Comte Creek and a discharge of 385.000 m3·s−1 in the entire MB entrance are required to reproduce the upstream flow distance and sediment-size distribution observed in the Comte Creek.

4.3. OSL Dating of the Deposits

Table 3 presents the results of the OSL dating analyses. The symmetric De distributions with low overdispersion values are interpreted to indicate complete resetting of the OSL signal prior to burial. The two sand samples, taken from the slackwater deposits of the Upper Fluvial Unit, have OSL ages of 116 ± 8 ka and 118 ± 10 ka, overlapping within uncertainties, suggesting that the unit was deposited during several closely spaced events in time. The fact that several of the aliquots are close to the 2D0 boundary may indicate that a slight underestimation of the De cannot be excluded. Hence, deposition occurred either during the Last Interglacial (Eemian) or during the latest Middle Pleistocene.

5. Discussion

The course of the Ebro River across the MB runs through a valley that alternates between bedrock-controlled and alluvial reaches. The substrate consists of continental Cenozoic materials overlain by a substantial succession of Quaternary alluvial deposits, exceeding 100 m in thickness. This valley can be classified as an incised valley in the sense of Dalrymple et al. [33], or as a paleovalley following Blum et al. [45].
At the downstream end of the MB, the lithological constriction of the Barrufemes Gorge (Figure 1) introduces a backwater effect that acts as hydraulic control. This effect forced the Ebro River to generate accommodation space within the MB for both water and sediment during extreme events. The result is a broad floodplain across the MB, where a flight of fill terraces developed during the Pleistocene. The terminal reaches of tributaries were incorporated into this floodplain. Of particular significance is the Siurana River, which enters just downstream of the Pas de l’Ase Gorge (Figure 1). Its final 5 km is affected by major trunk-river floods (Figure 11), forming part of the incised valley of the Ebro River.
Floodplains aggrade primarily during periods of rising sea level [45,46,47]. This process reduces the longitudinal gradient of the river profile and increases the likelihood of flooding into lateral tributaries.
In contrast, up to eight episodes have been documented within the aggradational stacking zone, whereas only two (UFU and LFU) have been identified further upstream. This distribution indicates a gradation in the magnitude of events propagating along Comte Creek. Most of these episodes were confined to the mid-reach of the channel, and only two extended up to 4 km.
A systematic sensitivity analysis has been developed to describe the uncertainty of the results and the influence of the variables and hydraulic parameters introduced into the IBER 2D model. This analysis was carried out for the two most prominent scenarios: that of the Comte Creek valley and that of the complete MB from Garcia to Barrufemes Canyon.
Analyzing the whole set of data and comparing the two modeled cases, it can be seen how parameter changes have bigger consequences for the entire MB than in the small-scale case of Comte Creek. The hydrograph duration is the variable that has the greatest influence on the upstream extent of the inflow.
At the Comte Creek, a decrease or increase (changes of 50%) in the roughness coefficient does not really cause dramatic changes in the upstream inflow extent. On the other hand, reducing the hydrograph duration to 30 min means the inflow only penetrates about 3000 m into the tributary valley. In contrast, for Comte Creek, the most influential variable or parameter on the mean grain size at a specific point in the paleo-valley is roughness. The rest of the factors play a secondary role.
Regarding the entire Ebro in the MB set, the mean grain size and the upstream extent of the inflow are much more affected by the hydrograph duration values than by roughness. In this way, a shortening of the hydrograph time by about half reduces the inflow to Comte Creek to just 2000 m. As for roughness, if a very low roughness (0.025) is introduced, the model gives similar results regarding the extent of the flow in Comte Creek and the critical size of the transported sediments. The role of solid load has not been evaluated in the hydraulic model due to the difficulties this poses in very high-energy flows.
The maximum modeled discharge indicates the order of magnitude that a catastrophic flood, such as that described in the Ebro River, could involve. The occurrence of high-energy flows, catastrophic floods or superfloods—with the term megaflood reserved for those exceeding 1 × 10⁶ m3·s−1 [10]—produces profound morphogenetic effects and intense erosive capacity. Physical simulations demonstrate that the geomorphic effectiveness of superfloods in valley excavation surpasses that of conventional fluvial dynamics [48]. At the base of the Upper Fluvial Unit, at the entrance to Comte Creek, meter-scale boulders derived from a gleyic paleosol are present. On the other hand, in the town of Flix, located about 25 km upstream from Comte Creek, there is a gravel and boulder deposit about 10 m thick and raised roughly 34 m above the current Ebro River bed. Near the base, it presents blocks of limestone and sandstone from the bedrock that have been ripped out and even flipped upside down (as suggested by some giant potholes). These features are consistent with the erosive energy of catastrophic floods, such as those analyzed here.
The SWD ages and their uncertainty (118–116 ±10 ka) place us in a paleoclimatic scenario right at the boundary between the final retreat and thawing of the ice sheets of the MIS-6 episode and the beginning of the warming of the MIS 5e (Eemian) interglacial, without being able to specify more. Therefore, the superflooding episode is related to the end of the Penultimate Glacial Cycle. Most catastrophic flows are attributed to the sudden failure of large paleolakes impounded by glacial barriers (glacial lake outburst floods, or GLOFs), often occurring at glacier confluences during retreat phases of deglaciation at the end of glacial cycles [49,50]. Other potential alternative mechanisms to originate the superfloods are mentioned in the literature [10,17] such as (i) the rupture of paleolakes behind accumulations formed by terminal glacial moraines [51], (ii) the rupture of dams formed by headwater landslides which retain paleoreservoirs then eroded and collapsed by piping or spillwater, or also (iii) the occurrence of very high-intensity earthquakes which produce large landslides that move as very energetic flows downstream [52], but the volume of the related trapped paleolakes is smaller than the GLOFs. In the case of the Pyrenees, Pleistocene subglacial volcanism has been discarded as the cause of the release of large volumes of water (jokulhlaups) [14]. The high-energy floods would have flowed from the glacial Pyrenean headwater valleys to the MB over a distance of about 250 km. No other sedimentary remains have been found so far, either in the Southern Pyrenean tributaries (Segre, Cinca, Gállego) or in the Ebro River upstream of the MB. This could be due to the effectiveness of the MB as a sedimentary trap.

6. Conclusions

Around the Middle/Late Pleistocene boundary, the Móra Basin functioned as a storage area, retaining and preserving fluvial deposits transported by the Ebro River that flooded into tributary valleys, leaving behind anomalous sedimentary accumulations. At least two multistory sequences of Ebro-derived deposits have been identified in the Comte Creek, interbedded with and overlain by alluvial sediments of local origin. The estimated peak discharges (~385,000 m3·s−1) capable of transporting coarse detrital material and generating high-energy sedimentary structures—such as meter-scale gravel dunes (backwater or SWD)—indicate exceptional floods, further intensified by hydraulic transfer restrictions imposed by the Barrufemes Gorge and the low regional slope of the Ebro River. The most plausible origin of these high-energy floods lies in the sudden failure of glacial lake outburst floods (GLOFs), likely formed along the outer margins of the Pyrenean glaciers.
This represents the first description of deposits attributed to high-energy or catastrophic floods in southern Europe and the Mediterranean region. Comparable deposits elsewhere are typically associated with major glacial systems, such as the Himalayas and Andes, or with the margins of continental ice sheets (e.g., Missoula floods, Laurentide ice sheet). Such flows display exceptional hydrodynamic and geomorphic capacity, at least an order of magnitude greater than floods of purely meteorological origin.

Author Contributions

Conceptualization: F.X.C.A. and J.C.B.; field surveys: F.X.C.A. and J.C.B.; model simulations: F.X.C.A.; formal analyses: F.P.; writing: F.X.C.A. and J.C.B.; review and editing: F.X.C.A., J.C.B. and F.P. All authors have read and agreed to the published version of the manuscript.

Funding

This research received no external funding.

Data Availability Statement

The original contributions presented in this study are included in the article. Further inquiries can be directed to the corresponding authors.

Acknowledgments

The authors would like to thank David Pino of the Polytechnic University of Catalonia—Barcelona Tech for his support in the preparation of the article. The authors would also like to thank Irene Balasch for reviewing and improving the final English draft. We appreciate the editor’s enormous kindness and patience, and we also want to acknowledge that the three reviewers’ comments have strongly contributed to making the work more accurate and intelligible.

Conflicts of Interest

The authors declare no conflicts of interest.

References

  1. Lyell, C. Principles of Geology; John Murray: London, UK, 1830; Volume I. [Google Scholar]
  2. Bretz, J.H. The channeled Scablands of the Columbia Plateau. J. Geol. 1923, 31, 617–649. [Google Scholar] [CrossRef] [Scilit]
  3. Bretz, J.H. The Channeled Scabland of Eastern Washington; Special Collections; Eastern Washington University: St. Louis, MO, USA, 1928; Volume 2. [Google Scholar]
  4. Ager, D. The New Catastrophism, 1st ed.; Cambridge University Press: Cambridge, UK, 1993; 231p. [Google Scholar]
  5. Soennichsen, J. Bretz’s Flood: The Remarkable Story of a Rebel Geologist and the World’s Greatest Flood; Sasquatch Books: Seattle, WA, USA, 2008; 304p. [Google Scholar]
  6. Benito, G.; O’Connor, J.E. Number and size of last-glacial Missoula floods in the Columbia River valley between Pasco Basin, Washington, and Portland, Oregon. Geol. Soc. Am. Bull. 2003, 115, 624–638. [Google Scholar] [CrossRef] [Scilit]
  7. Pardee, J.T. Unusual currents in glacial Lake Missoula. Geol. Soc. Am. Bull. 1942, 53, 1569–1600. [Google Scholar] [CrossRef] [Scilit]
  8. Baker, V.R. High-energy megafloods: Planetary settings and sedimentary dynamics. In Flood and Megaflood Processes and Deposits: Recent and Ancient Examples, 1st ed.; Martini, I., Baker, V., Garzon, G., Eds.; IAS Special Publication 32; Blackwell Science: Oxford, UK, 2002; pp. 3–16. [Google Scholar]
  9. Baker, V.R. The Channeled Scabland: A Retrospective. Annu. Rev. Earth Planet. Sci. 2009, 37, 393–411. [Google Scholar] [CrossRef] [Scilit]
  10. Baker, V.R. Global megaflood paleohydrology. In Palaeohydrology: Traces, Tracks and Trails of the Extreme Events, 1st ed.; Herget, J., Fontana, A., Eds.; Springer Nature: Cham, Switzerland, 2020; pp. 3–28. [Google Scholar]
  11. Baker, V.R. Global late Quaternary fluvial paleohydrology: With special emphasis on paleofloods and megafloods. In Treatise on Geomorphology: Fluvial Geomorphology, 1st ed.; Shroder, J., Wohl, E., Eds.; Academic Press: San Diego, CA, USA, 2013; Volume 9, pp. 511–527. [Google Scholar]
  12. Gudmundsson, M.T.; Bjornsson, H.; Palsson, F. Changes in jökulhlaup sizes in Grimsvötn, Vatnajökull, Iceland, 1934–1991, deduced from in-situ measurements of subglacial lake volume. J. Glaciol. 1995, 41, 263–272. [Google Scholar] [CrossRef] [Scilit]
  13. Tómasson, H. The jökulhlaup from Katla in 1918. Ann. Glaciol. 1996, 22, 249–254. [Google Scholar] [CrossRef] [Scilit]
  14. Snorrason, Á.; Jónsson, P.; Sigurðsson, O.; Pálsson, S.; Árnason, S.; Víkingsson, S.; Kaldal, I. November 1996 jökulhlaup on Skeiðarársandur outwash plain, Iceland. In Flood and Megaflood Processes and Deposits: Recent and Ancient Examples, 1st ed.; Martini, I., Baker, V., Garzon, G., Eds.; IAS Special Publication 32; Blackwell Science: Oxford, UK, 2002; pp. 55–65. [Google Scholar]
  15. Waitt, R.B. Great Holocene floods along Jökulsá á Fjöllum, north Iceland. In Flood and Megaflood Processes and Deposits: Recent and Ancient Examples, 1st ed.; Martini, I., Baker, V., Garzon, G., Eds.; IAS Special Publication 32; Blackwell Science: Oxford, UK, 2002; pp. 53–71. [Google Scholar]
  16. Baker, V.R.; Benito, G.; Rudoy, A.N. Paleohydrology of Late Pleistocene superflooding, Altay Mountains, Siberia. Science 1993, 259, 348–350. [Google Scholar] [CrossRef] [Scilit] [PubMed]
  17. Rudoy, A.N.; Baker, V.R. Sedimentary effects of cataclysmic late Pleistocene glacial outburst flooding, Altay Mountains, Siberia. Sediment. Geol. 1993, 85, 53–62. [Google Scholar] [CrossRef] [Scilit]
  18. Carling, P.; Kirkbride, A.; Parnachov, S.; Borodavko, P.; Berger, G. Late Quaternary catastrophic flooding in the Altai Mountains of south-central Siberia: A synoptic overview and introduction to flood deposit sedimentology. In Flood and Megaflood Processes and Deposits: Recent and Ancient Examples, 1st ed.; Martini, I., Baker, V., Garzon, G., Eds.; IAS Special Publication 32; Blackwell Science: Oxford, UK, 2002; pp. 17–36. [Google Scholar]
  19. Benito, G.; Thorndycraft, V.R. Catastrophic glacial-lake outburst flooding of the Patagonian Ice Sheet. Earth-Sci. Rev. 2020, 200, 102996. [Google Scholar] [CrossRef] [Scilit]
  20. Baker, V.R. Paleoflood hydrology: Origin, progress, prospects. Geomorphology 2008, 101, 1–13. [Google Scholar] [CrossRef] [Scilit]
  21. Baker, V.R. Paleoflood hydrology and extraordinary flood events. J. Hydrol. 1987, 96, 79–99. [Google Scholar] [CrossRef] [Scilit]
  22. Castelltort, F.X.; Bladé, E.; Balasch, J.C.; Ribé, M. The backwater effect as a tool to assess formative long-term flood regimes. Quarter. Inter. 2020, 538, 29–43. [Google Scholar] [CrossRef] [Scilit]
  23. Balasch, J.C.; Pino, D.; Ruiz-Bellet, J.L.; Tuset, J.; Barriendos, M.; Castelltort, F.X.; Peña, J.C. The extreme floods in the Ebro River basin since 1600 CE. Sci. Total Environ. 2019, 646, 645–660. [Google Scholar] [CrossRef] [Scilit] [PubMed]
  24. Ruiz-Bellet, J.L.; Balasch, J.C.; Tuset, J.; Monserrate, A.; Sánchez, A. Improvement of flood frequency analysis with historical information in different types of catchments and data series within the Ebro River basin (NE Iberian Peninsula). Z. Geomorphol. 2015, 59, 127–157. [Google Scholar] [CrossRef] [Scilit]
  25. Rico, M.T. Las paleocrecidas en la Cuenca medio del río Segre durante el Pleistoceno Superior-Holoceno: Registros morfosedimentarios y análisis hidrológico. Ph.D. Thesis, Universidad de Zaragoza, Zaragoza, Spain, 2004. [Google Scholar]
  26. Gutiérrez, F.; Zarroca, M.; Castañeda, C.; Carbonel, D.; Guerrero, J.; Linares, R.; Roqué, C.; Lucha, P. Paleoflood records from sinkholes using an example from the Ebro River floodplain, northeastern Spain. Quat. Res. 2017, 88, 71–88. [Google Scholar] [CrossRef] [Scilit]
  27. Kochel, R.C.; Baker, V.R. Paleoflood hydrology. Science 1982, 215, 353–361. [Google Scholar] [CrossRef] [Scilit] [PubMed]
  28. Kochel, R.C.; Baker, V.R.; Patton, P.C. Paleohydrology of Southwestern Texas. Water Resour. Res. 1982, 18, 1165–1183. [Google Scholar] [CrossRef] [Scilit]
  29. Calvet, M.; Delmas, M.; Gunnell, Y.; Braucher, R.; Bourlès, D. Recent advances in research on Quaternary glaciations in the Pyrenees. In Developments in Quaternary Sciences; Ehlers, J., Gibbard, P., Hughes, P., Eds.; Elsevier: Amsterdam, The Netherlands, 2011; Volume 15, pp. 127–139. [Google Scholar]
  30. García-Ruiz, J.; Ortigosa, L.; Pellicer, F.; Arnáez, J. Geomorfología glaciar del Sistema Ibérico. In Las Huellas Glaciares de las Montañas Españolas; Gómez-Ortiz, A., Pérez Alberti, A., Eds.; Servizo de Publicacións de Universidade de Santiago: Santiago de Compostela, Spain, 1998; pp. 349–381. [Google Scholar]
  31. Teixell, A. Desarrollo de un anticlinorio por transpresión aislando una cuenca sedimentaria marginal. Borde oriental de la cuenca del Ebro, Tarragona. Rev. Soc. Geológica Esp. 1998, 11, 229–238. [Google Scholar]
  32. Arasa, A.; Cabrera, L. Neogene-Quaternary onshore record in the lower Ebro rive incised palaeovalley (Ebro margin, Catalan Coastal Range, NE Iberia). Geol. Acta 2018, 16, 265–292. [Google Scholar] [CrossRef] [Scilit]
  33. Dalrymple, R.; Boyd, R.; Zaitlin, B. History of research, types and internal organization of incised-valley systems: Introduction to the Volume. In Incised-Valley Systems: Origin and Sedimentary Sequences; Special Publication of Society of Economic Paleontologists and Mineralogists; Dalrymple, R., Boyd, R., Zaitlin, A., Eds.; Society for Sedimentary Geology: Tulsa, OK, USA, 1994; Volume 51, pp. 3–10. [Google Scholar]
  34. Pazzaglia, F.J. Fluvial Terraces. In Treatise on Geomorphology: Fluvial Geomorphology, 1st ed.; Shroder, J., Wohl, E., Eds.; Academic Press: San Diego, CA, USA, 2013; Volume 9, pp. 511–527. [Google Scholar]
  35. Roset, J. Dinàmica fluvial del riu Ebre entre Móra d’Ebre i el Pas de Barrufemes. Miscel Lània Cent. Estudis Recer. Ebre 2007, 18, 209–246. [Google Scholar]
  36. Bladé, E.; Cea, L.; Corestein, G.; Escolano, E.; Puertas, J.; Vázquez-Cendón, E.; Dolz, J.; Coll, A. Iber: Herramienta de simulación numérica del flujo en ríos. Rev. Int. Metodos Numer. Calc. Diseno Ing. 2014, 30, 1–10. [Google Scholar] [CrossRef] [Scilit]
  37. Vázquez-Cendón, M.E. Improved treatment of source terms in upwind schemes for the shallow water equations in channels with irregular geometry. J. Comput. Phys. 1999, 148, 497–526. [Google Scholar] [CrossRef] [Scilit]
  38. Roe, P.L. Discrete models for the numerical analysis of time-dependent multidimensional gas dynamics. J. Comput. Phys. 1986, 63, 458–476. [Google Scholar] [CrossRef] [Scilit]
  39. Richter, D.; Richter, A.; Dornich, K. Lexsyg smart—A luminescence detection system for dosimetry, material research and dating application. Geochronometria 2015, 42, 202–209. [Google Scholar] [CrossRef] [Scilit]
  40. Murray, A.S.; Wintle, A.G. Luminescence dating of quartz using an improved single-aliquot regenerative-dose protocol. Radiat. Meas. 2000, 32, 57–73. [Google Scholar] [CrossRef] [Scilit]
  41. Wintle, A.G.; Murray, A.S. A review of quartz optically stimulated luminescence characteristics and their relevance in single-aliquot regeneration dating protocols. Radiat. Meas. 2006, 41, 369–391. [Google Scholar] [CrossRef] [Scilit]
  42. Galbraith, R.F.; Roberts, R.G.; Laslett, G.M.; Yoshida, H.; Olley, J.M. Optical dating of single and multiple grains of quartz from Jinmium rock shelter, northern Australia: Part I, experimental design and statistical models. Archaeometry 1999, 41, 339–364. [Google Scholar] [CrossRef] [Scilit]
  43. Preussser, F.; Degering, D.; Fülling, A.; Miocic, J. Complex dose rate calculations in luminescence dating of lacustrine and palustrine sediments from Niederweningen, northern Switzerland. Geochronometria 2023, 50, 28–49. [Google Scholar] [CrossRef] [Scilit]
  44. Degering, D.; Degering, A. Change is the only constant—Time-dependent dose rates in luminescence dating. Quat. Geochronol. 2020, 58, 101074. [Google Scholar] [CrossRef] [Scilit]
  45. Blum, M.D.; Martin, J.M.; Milliken, K.T.; Garvin, M. Paleovalley systems: Insights from Quaternary analogs and experimental studies. Earth-Sci. Rev. 2013, 116, 128–169. [Google Scholar] [CrossRef] [Scilit]
  46. Shanley, K.W.; McCabe, P.J. Perspectives on the sequence stratigraphy of continental strata. Am. Assoc. Pet. Geol. Bull. 1994, 78, 544–568. [Google Scholar] [CrossRef] [Scilit]
  47. Strong, N.; Paola, C. Valleys that never were: Time Surfaces versus Stratigraphic Surfaces. J. Sediment. Res. 2008, 78, 579–593. [Google Scholar] [CrossRef] [Scilit]
  48. Garcia-Castellanos, D.; O’Connor, J.E. Outburst floods provide erodability estimates consistent with long-term landscape evolution. Sci. Rep. 2018, 8, 10573. [Google Scholar] [CrossRef] [Scilit] [PubMed]
  49. O’Connor, J.E.; Baker, V.R. Magnitudes and implications of peak discharges from glacial lake Missoula. Geol. Soc. Amer. Bull. 1992, 104, 267–279. [Google Scholar] [CrossRef] [Scilit]
  50. O’Connor, J.E.; Costa, J.E. The world’s largest floods, past and present: Their causes and magnitudes. USGS Circ. 2004, 1254, 13. [Google Scholar]
  51. Monegato, G.; Mozzi, P.; Paiero, G.; Rossato, S. Sedimentary evidence of glacial lake outburst floods (GLOFs) during the last glacial maximum in the Venetian–Friulian plain (NE Italy). Quat. Int. 2020, 538, 44–52. [Google Scholar] [CrossRef] [Scilit]
  52. Schwanghart, W.; Bernhardt, A.; Stolle, A.; Hoelzmann, P.; Adhikari, B.R.; Andermann, C.; Tofelde, S.; Merchel, S.; Rugel, G.; Fort, M.; et al. Repeated catastrophic valley infill following medieval earthquakes in the Nepal Himalaya. Science 2016, 351, 147–150. [Google Scholar] [CrossRef] [Scilit] [PubMed]
Figure 1. Topographic map of the Ebro River in the Móra Basin with the Pas de l’Ase and Barrufemes Gorges and the lateral streams affected by the inflows of fluvial sediments. The red box delineates the portion of the study area encompassing Comte Creek.
Quaternary 09 00052 g001
Figure 2. Geological map of the Móra d’Ebre Basin and the Burgar Plain at the boundary between the Ebro Basin and the Catalan Coastal Ranges. The main tectonic accidents (in black) and the trace of the Ebro River and Comte Creek (in blue) are indicated. Modified from the data of the Cartographic and Geological Institute of Catalonia (ICGC) and the Geological and Mining Institute of Spain (IGME). The red box delineates the portion of the study area encompassing Comte Creek.
Quaternary 09 00052 g002
Figure 3. (A) Map of the Pleistocene deposits in the confluence area between Comte Creek and the Ebro River at the downstream end of the MB. Up to eight fill-terrace systems have been distinguished, comprising axial members and deposits introduced into the tributary and characterized by lithologies external to the MB (Pyrenean, TE), as well as members formed by accumulations of local calcareous detrital elements (TL). The spatial relationship between the two members corresponds to a lateral facies transition. Checkpoints B, C, and D are points for comparing the water depth and the critical particle diameter obtained in the model. The map also indicates the location of the X–Y trace of the cross-section in (C). (B) Virtual section illustrating the introduction of sediments from the Ebro River into the lower reach of Comte Creek. The accumulation is represented by a coarse-grained unit, UFU−TE4, together with its associated upstream slackwater deposit, resting on a substrate corresponding to an older, likewise allochthonous deposit previously introduced into the tributary (LFU−TE5). (C) X–Y-oriented section (see (A)) showing the nested arrangement of incised-valley systems along the main axis of the Ebro River and in the lower reach of Comte Creek. The section also illustrates the lateral relationship between the members composed of Ebro detrital elements (TE) and those composed of local detrital elements (TL) within each incised-valley system.
Quaternary 09 00052 g003
Figure 4. (A) Plan view of the meandering channel scenario for the Comte Creek hydraulic modeling (Section 3.2.1). (B) Plan view of the topographic scenario for the hydraulic modeling of the entire Ebro River from the Pas de l’Ase Canyon to the Barrufemes Gorge, with the lower reach of the tributaries (Section 3.2.2).
Quaternary 09 00052 g004
Figure 5. (A) Typical OSL decay curve indicating the dominance of the fast component in the samples. (B) Representative dose–response curve using the sum of two exponential saturating functions for fitting. The 2D0 value determined using a single exponential saturating function is in the range of the De determined.
Quaternary 09 00052 g005
Figure 6. (A) Oblique aerial view from the west of the final reach of the Comte Creek valley. (B) Longitudinal cross-section of the Upper Fluvial Unit (UFU) overlying the Lower Fluvial Unit (LFU) at 1850 m upstream. (C) Longitudinal cross-section of the Upper Fluvial Unit at 2630 m upstream, showing a gravel dune migrating upstream (to the right) over another gravel bed of the Lower Fluvial Unit. (D) Cross-section of slackwater flood deposits at 3050 m upstream, where the asymmetric meander begins.
Quaternary 09 00052 g006
Figure 7. Hydraulic modeling of the Comte Creek with a peak discharge of 8.800 m3·s−1. (A) Triangular flood hydrograph was introduced in the model. (B) In-channel distribution of the critical diameter of transported particles (m) in Comte Creek. On the abscissa, distance from the Ebro River confluence (m).
Quaternary 09 00052 g007
Figure 8. Hydraulic modeling of the Comte Creek backflow. (A) Initial condition with water elevation at 48 m a.s.l. (B) In-channel distribution of the critical diameter of transported particles (m) in Comte Creek. On the abscissa, distance from the Ebro River confluence (m).
Quaternary 09 00052 g008
Figure 9. Hydraulic modeling of the Ebro River in the entire Móra Basin, with a 50 min flood wave and a peak discharge of 385,000 m3·s−1. (A) Triangular flood hydrograph. (B) In-channel distribution of the critical diameter of transported particles (m) in Comte Creek. On the abscissa, distance from the Ebro River confluence (m).
Quaternary 09 00052 g009
Figure 10. Hydraulic modeling of the Ebro in the entire MB, (Top right) Distribution of water depth (m) of the Ebro River along the red line profile. (Bottom right) Distribution of mean water velocities (m·s−1) of the Ebro River following the red line profile.
Quaternary 09 00052 g010
Figure 11. Hydraulic modeling of the Ebro River between Pas de l’Ase and Barrufemes Gorges, using a 50 min flood wave with a peak discharge of 385,000 m3·s−1. Map of maximum water depths in the flooded area of the Móra Basin showing maximum water depth at the Ebro-Siurana confluence and at the Barrufemes Gorge entrance.
Quaternary 09 00052 g011
Table 1. Tributary valleys of the Móra Basin containing Ebro-derived deposits, showing maximum upstream penetration from the confluence and average elevation above sea level.
StreamDeposit Extent (m)Average Elevation (m a.s.l.)
Nolla350065
Manou290065
Gàfols175055
Comte305040 *
Perles115068
Faneca80065
Sec550065
* Elevation corresponds to the base of the deposit at the onset of slackwater sediments (see Figure 3A).
Table 2. Hydraulic and sedimentological parameters at the calibration point (2630 m upstream from the Comte Creek confluence) obtained from the different modeled hydrographs.
Modeled ScenarioWater Depth
(m)
Mean Flow
Velocity
(m s−1)
Critical Sediment
Diameter
(m)
Maximum
Shear
Stress
(N m−2)
50 min triangular hydrograph with a peak discharge of 8800 m3 s−1 in Comte Creek (Figure 7A)14.401.580.08575.00
Backflow into Comte Creek (Figure 10)14.403.500.23210.00
50 min triangular hydrograph with a peak discharge of 385,000 m3 s−1 at the MB entrance (Figure 9A)14.503.000.20170.00
Table 3. Summary data of luminescence dating, including sampling depth, concentration of dose rate–relevant elements (K, Th, U), number of measured/accepted aliquots (n/N), observed overdispersion (od.), equivalent dose (De), and resulting age.
SampleDepth
(cm)
K
(%)
Th
(ppm)
U
ppm)
Dose Rate (Gy·ka−1)n/Nod.De
(Gy)
Age
(ka)
BAWA-17001.13 ± 0.127.20 ± 0.471.59 ± 0.221.98 ± 0.1725/230.30233.5 ± 17.0118 ± 10
BAWA-21501.25 ± 0.138.23 ± 0.531.88 ± 0.242.31 ± 0.1725/230.22267.7 ± 14.4116 ± 8
Disclaimer/Publisher’s Note: The statements, opinions and data contained in all publications are solely those of the individual author(s) and contributor(s) and not of MDPI and/or the editor(s). MDPI and/or the editor(s) disclaim responsibility for any injury to people or property resulting from any ideas, methods, instructions or products referred to in the content.