The Asian Summer Monsoon: Teleconnections and Forcing Mechanisms—A Review from Chinese Speleothem δ18O Records

 ,
,  ,
,  ,
,
Abstract
1. Introduction
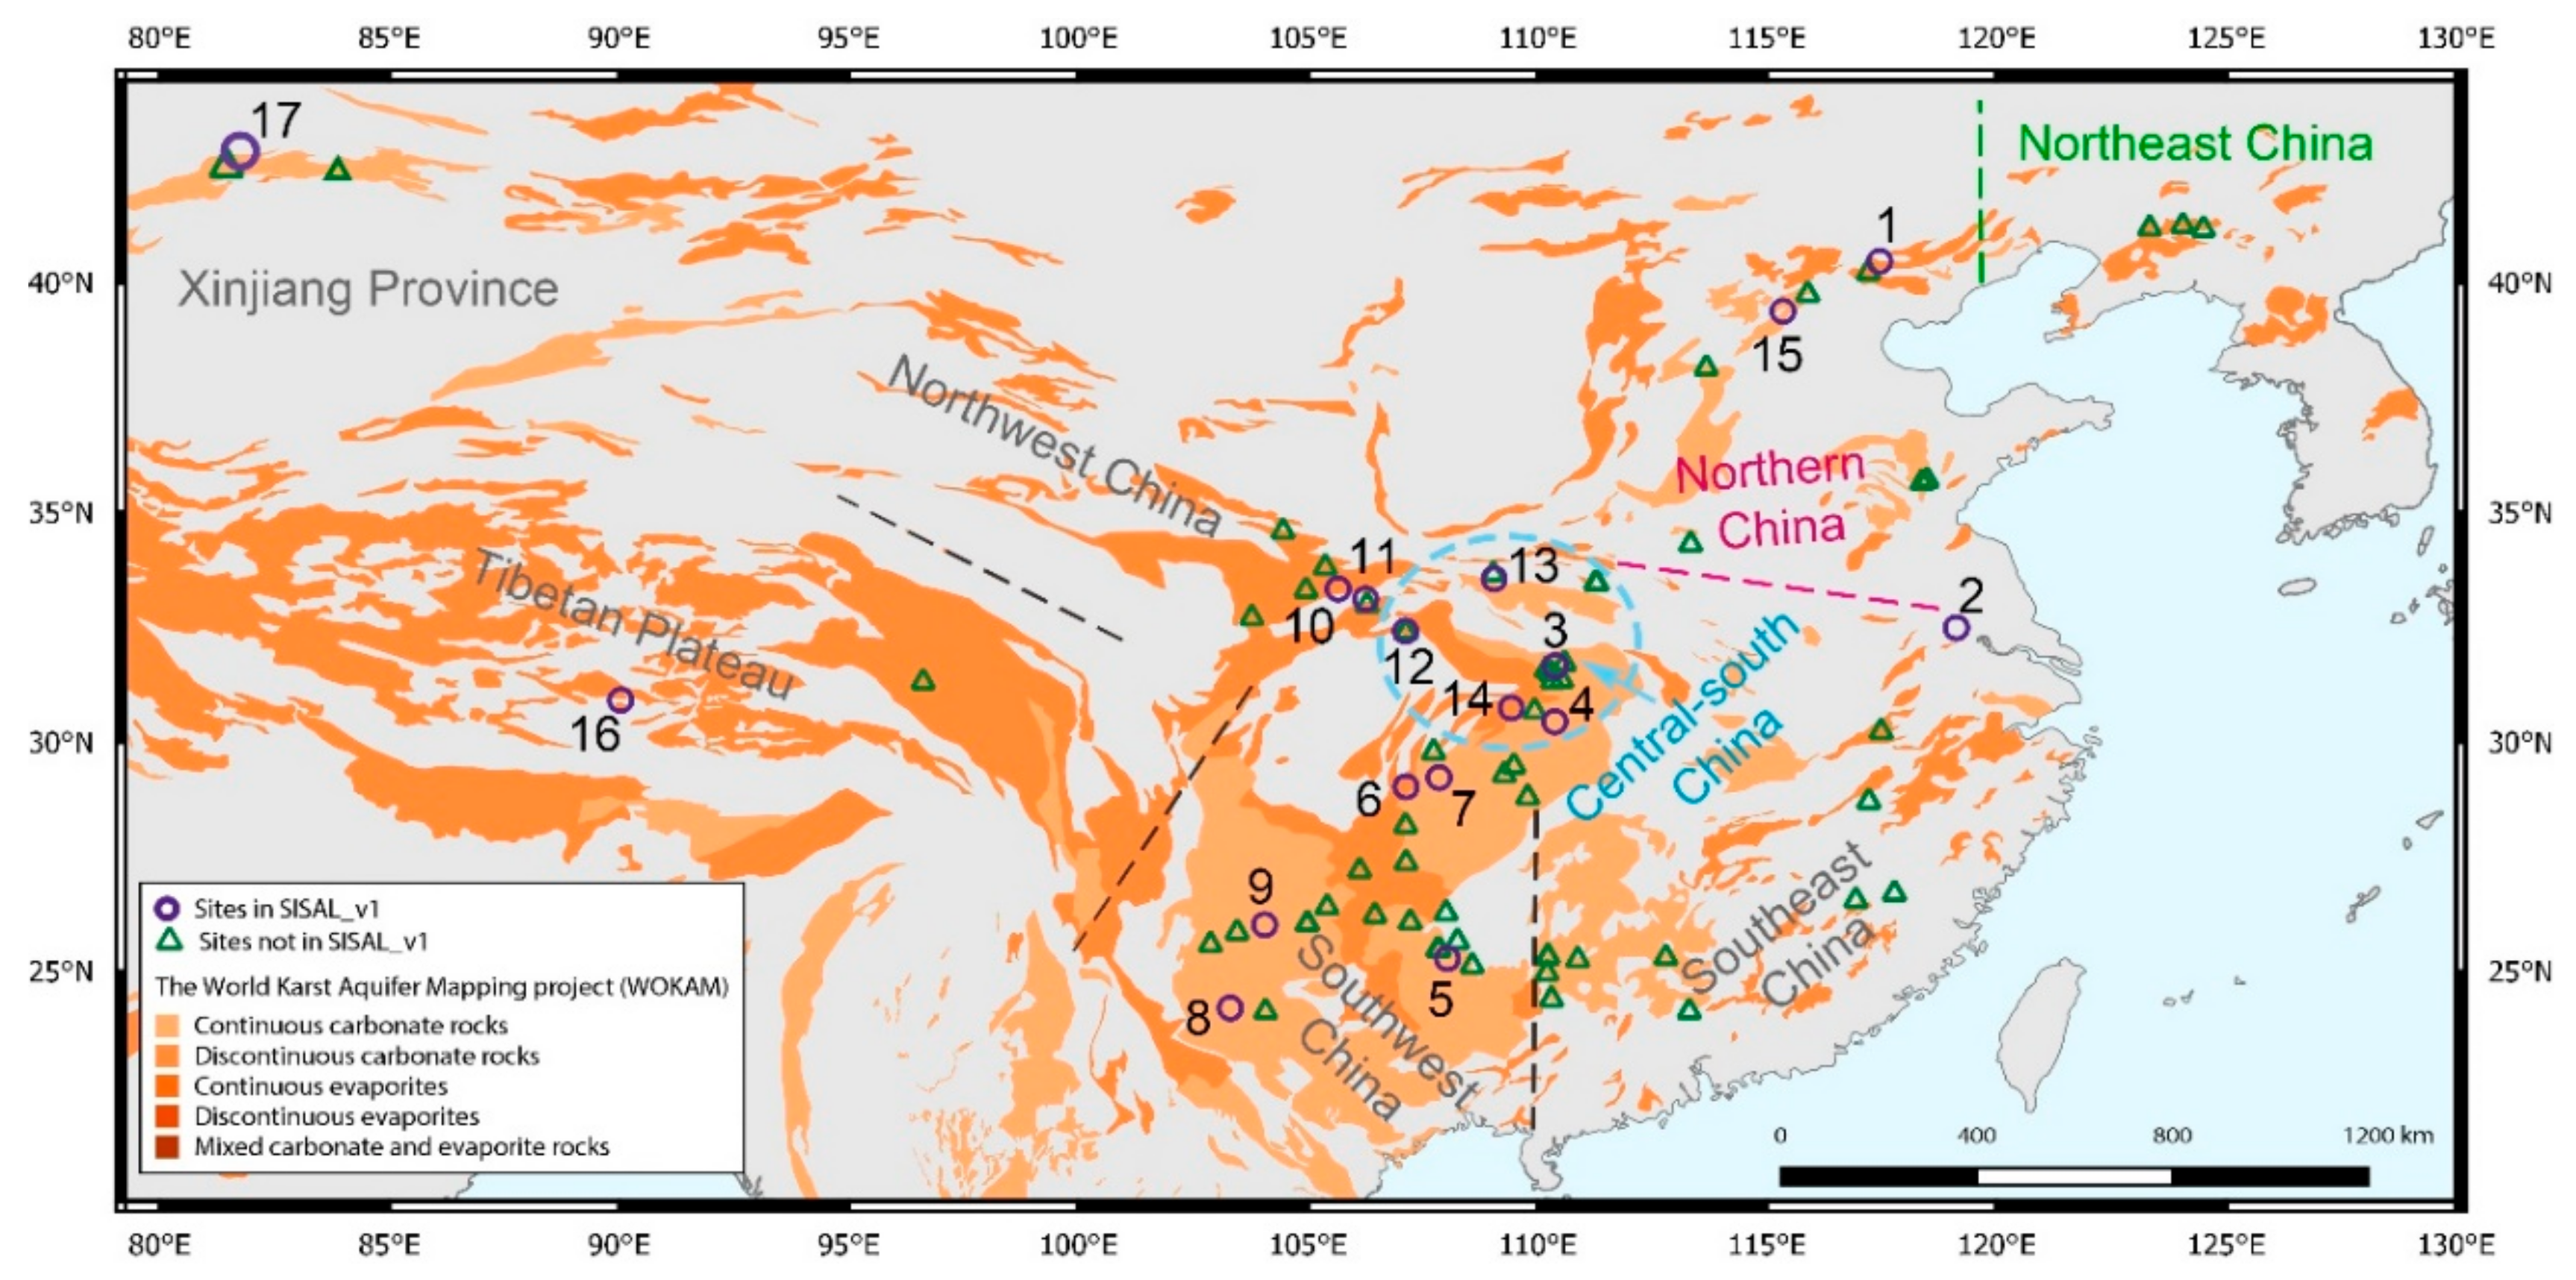
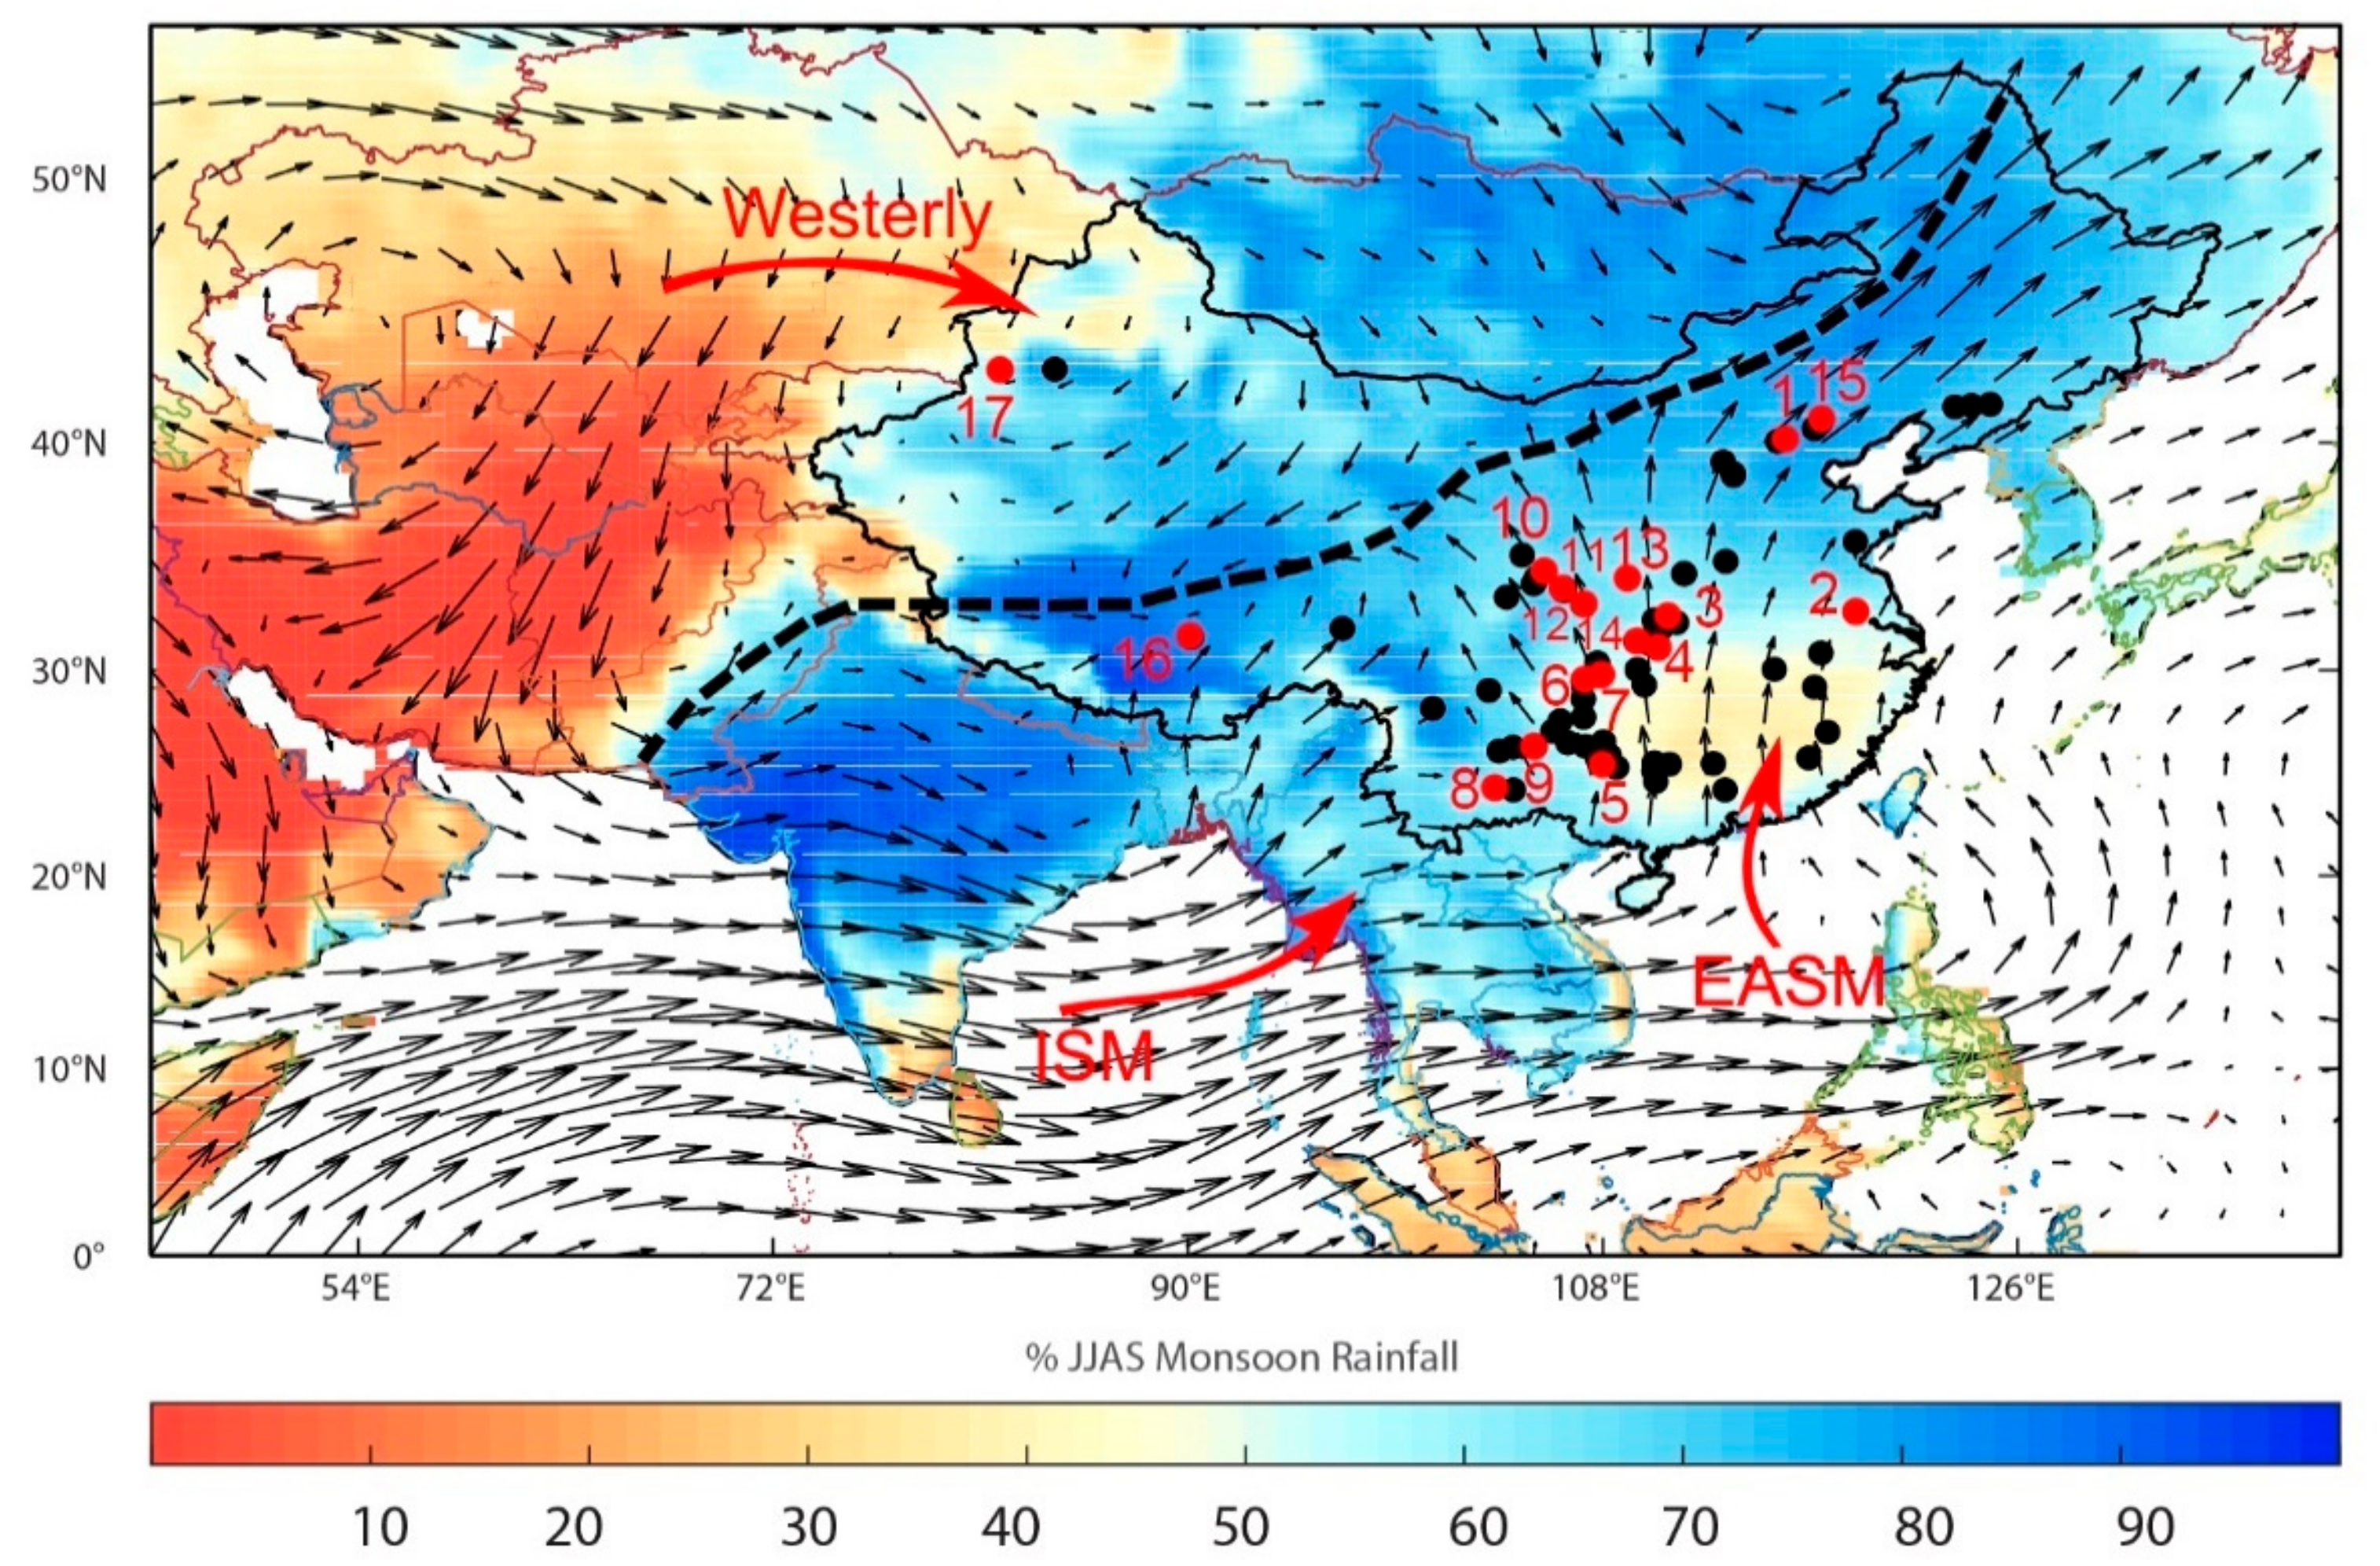
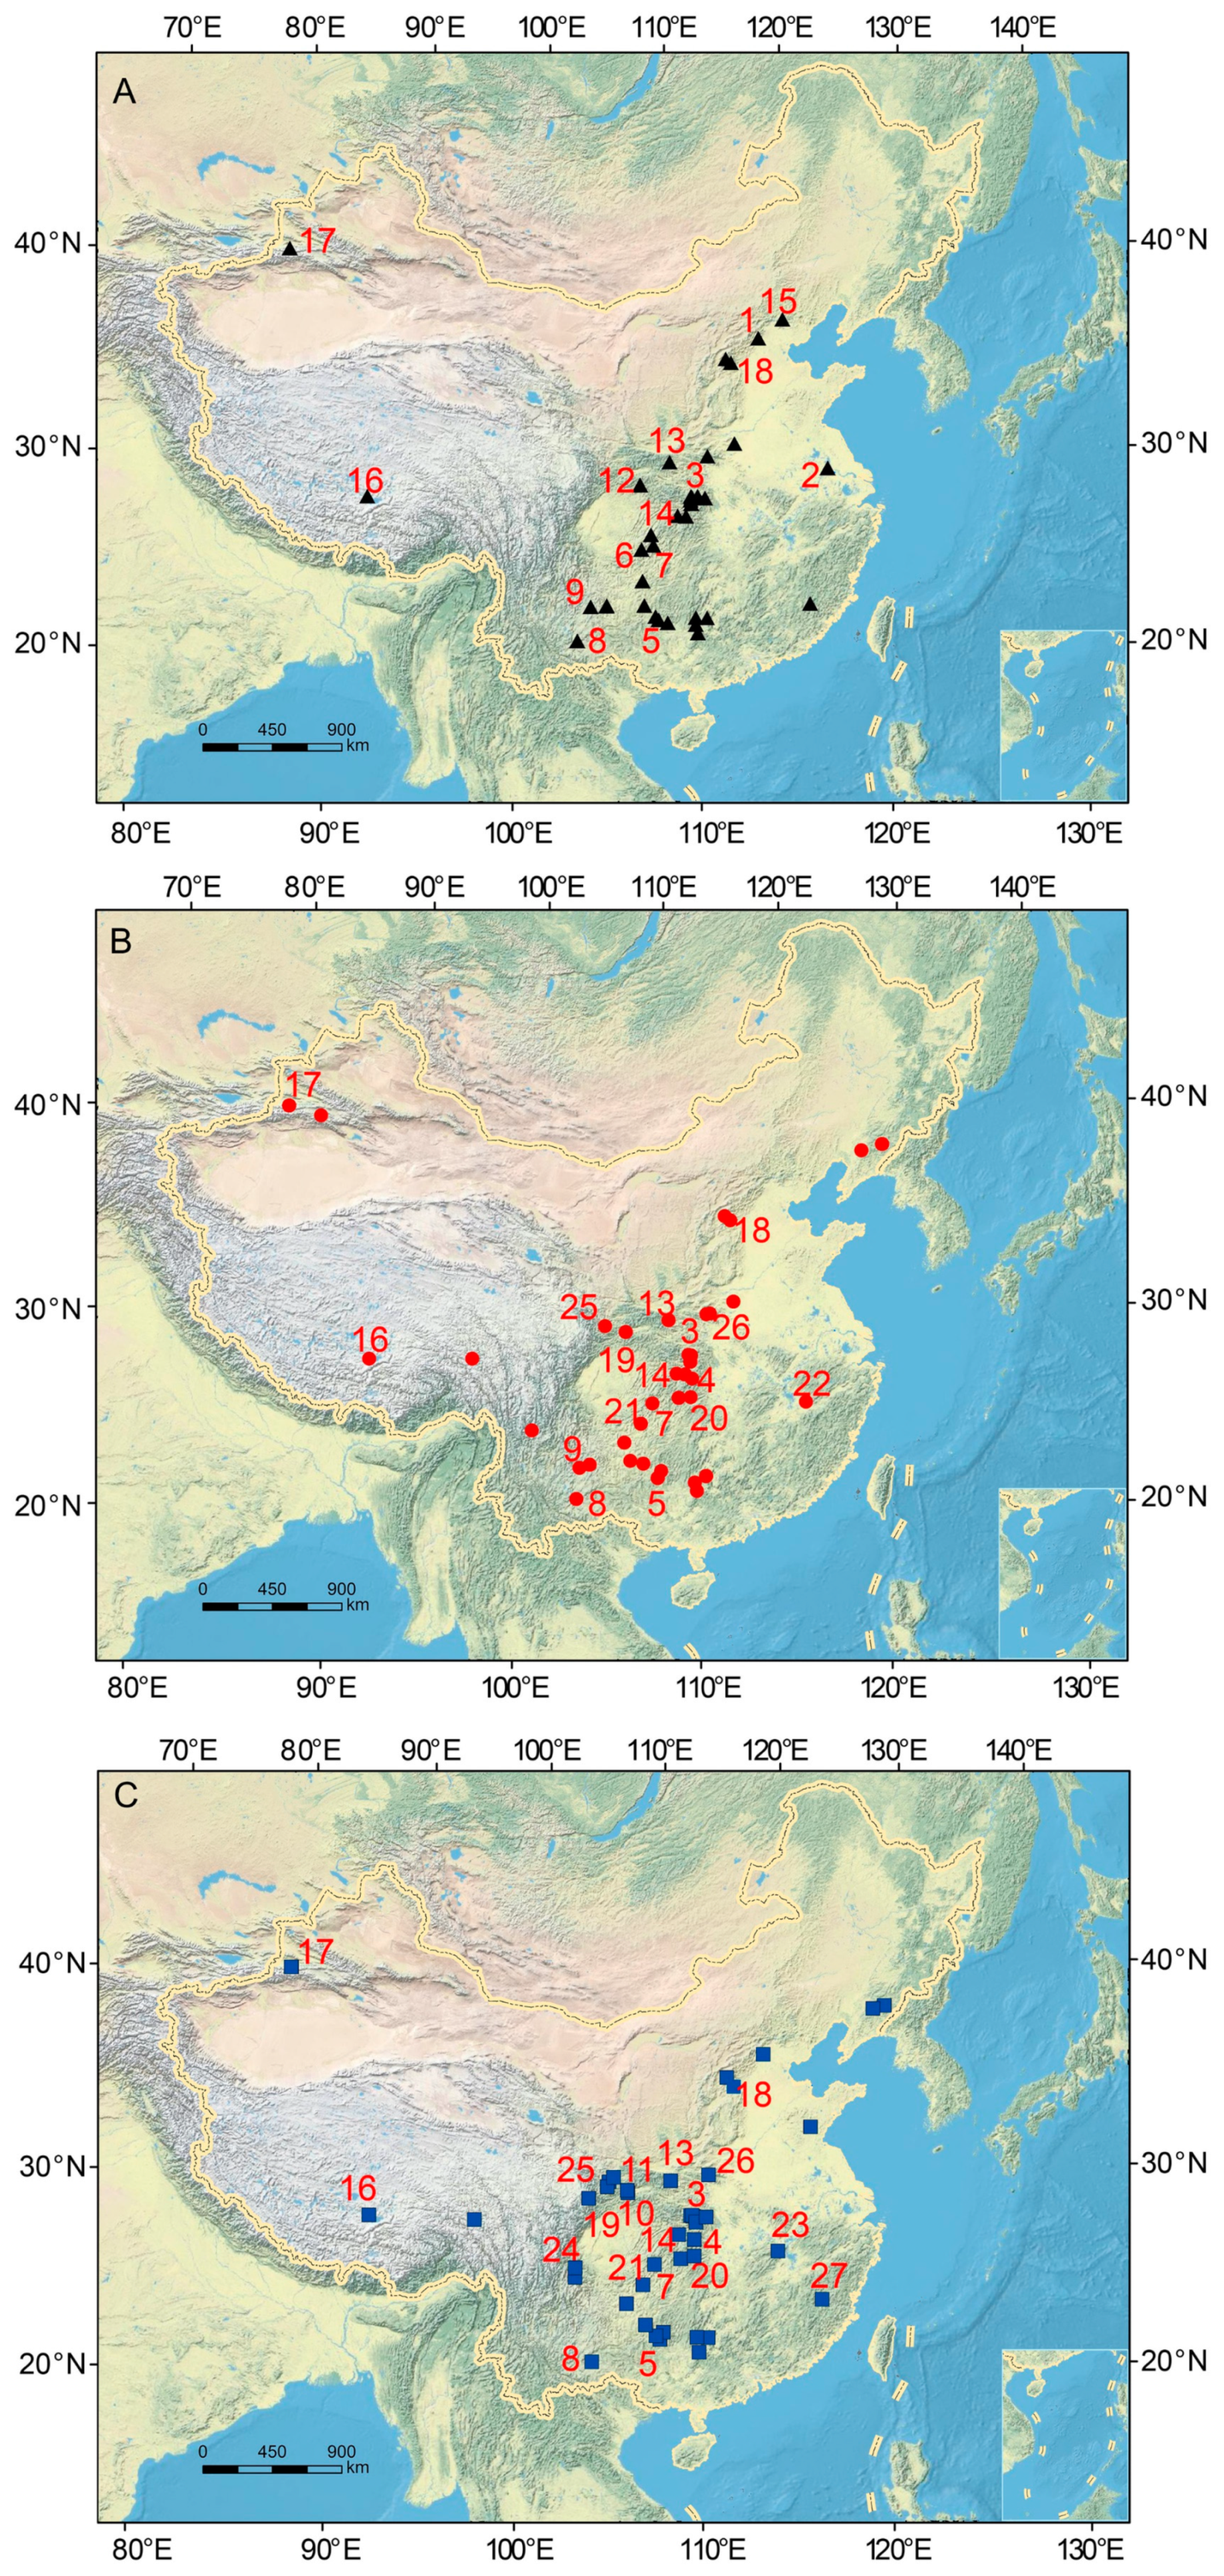
2. Cave Locations and Climatic Characteristics in China
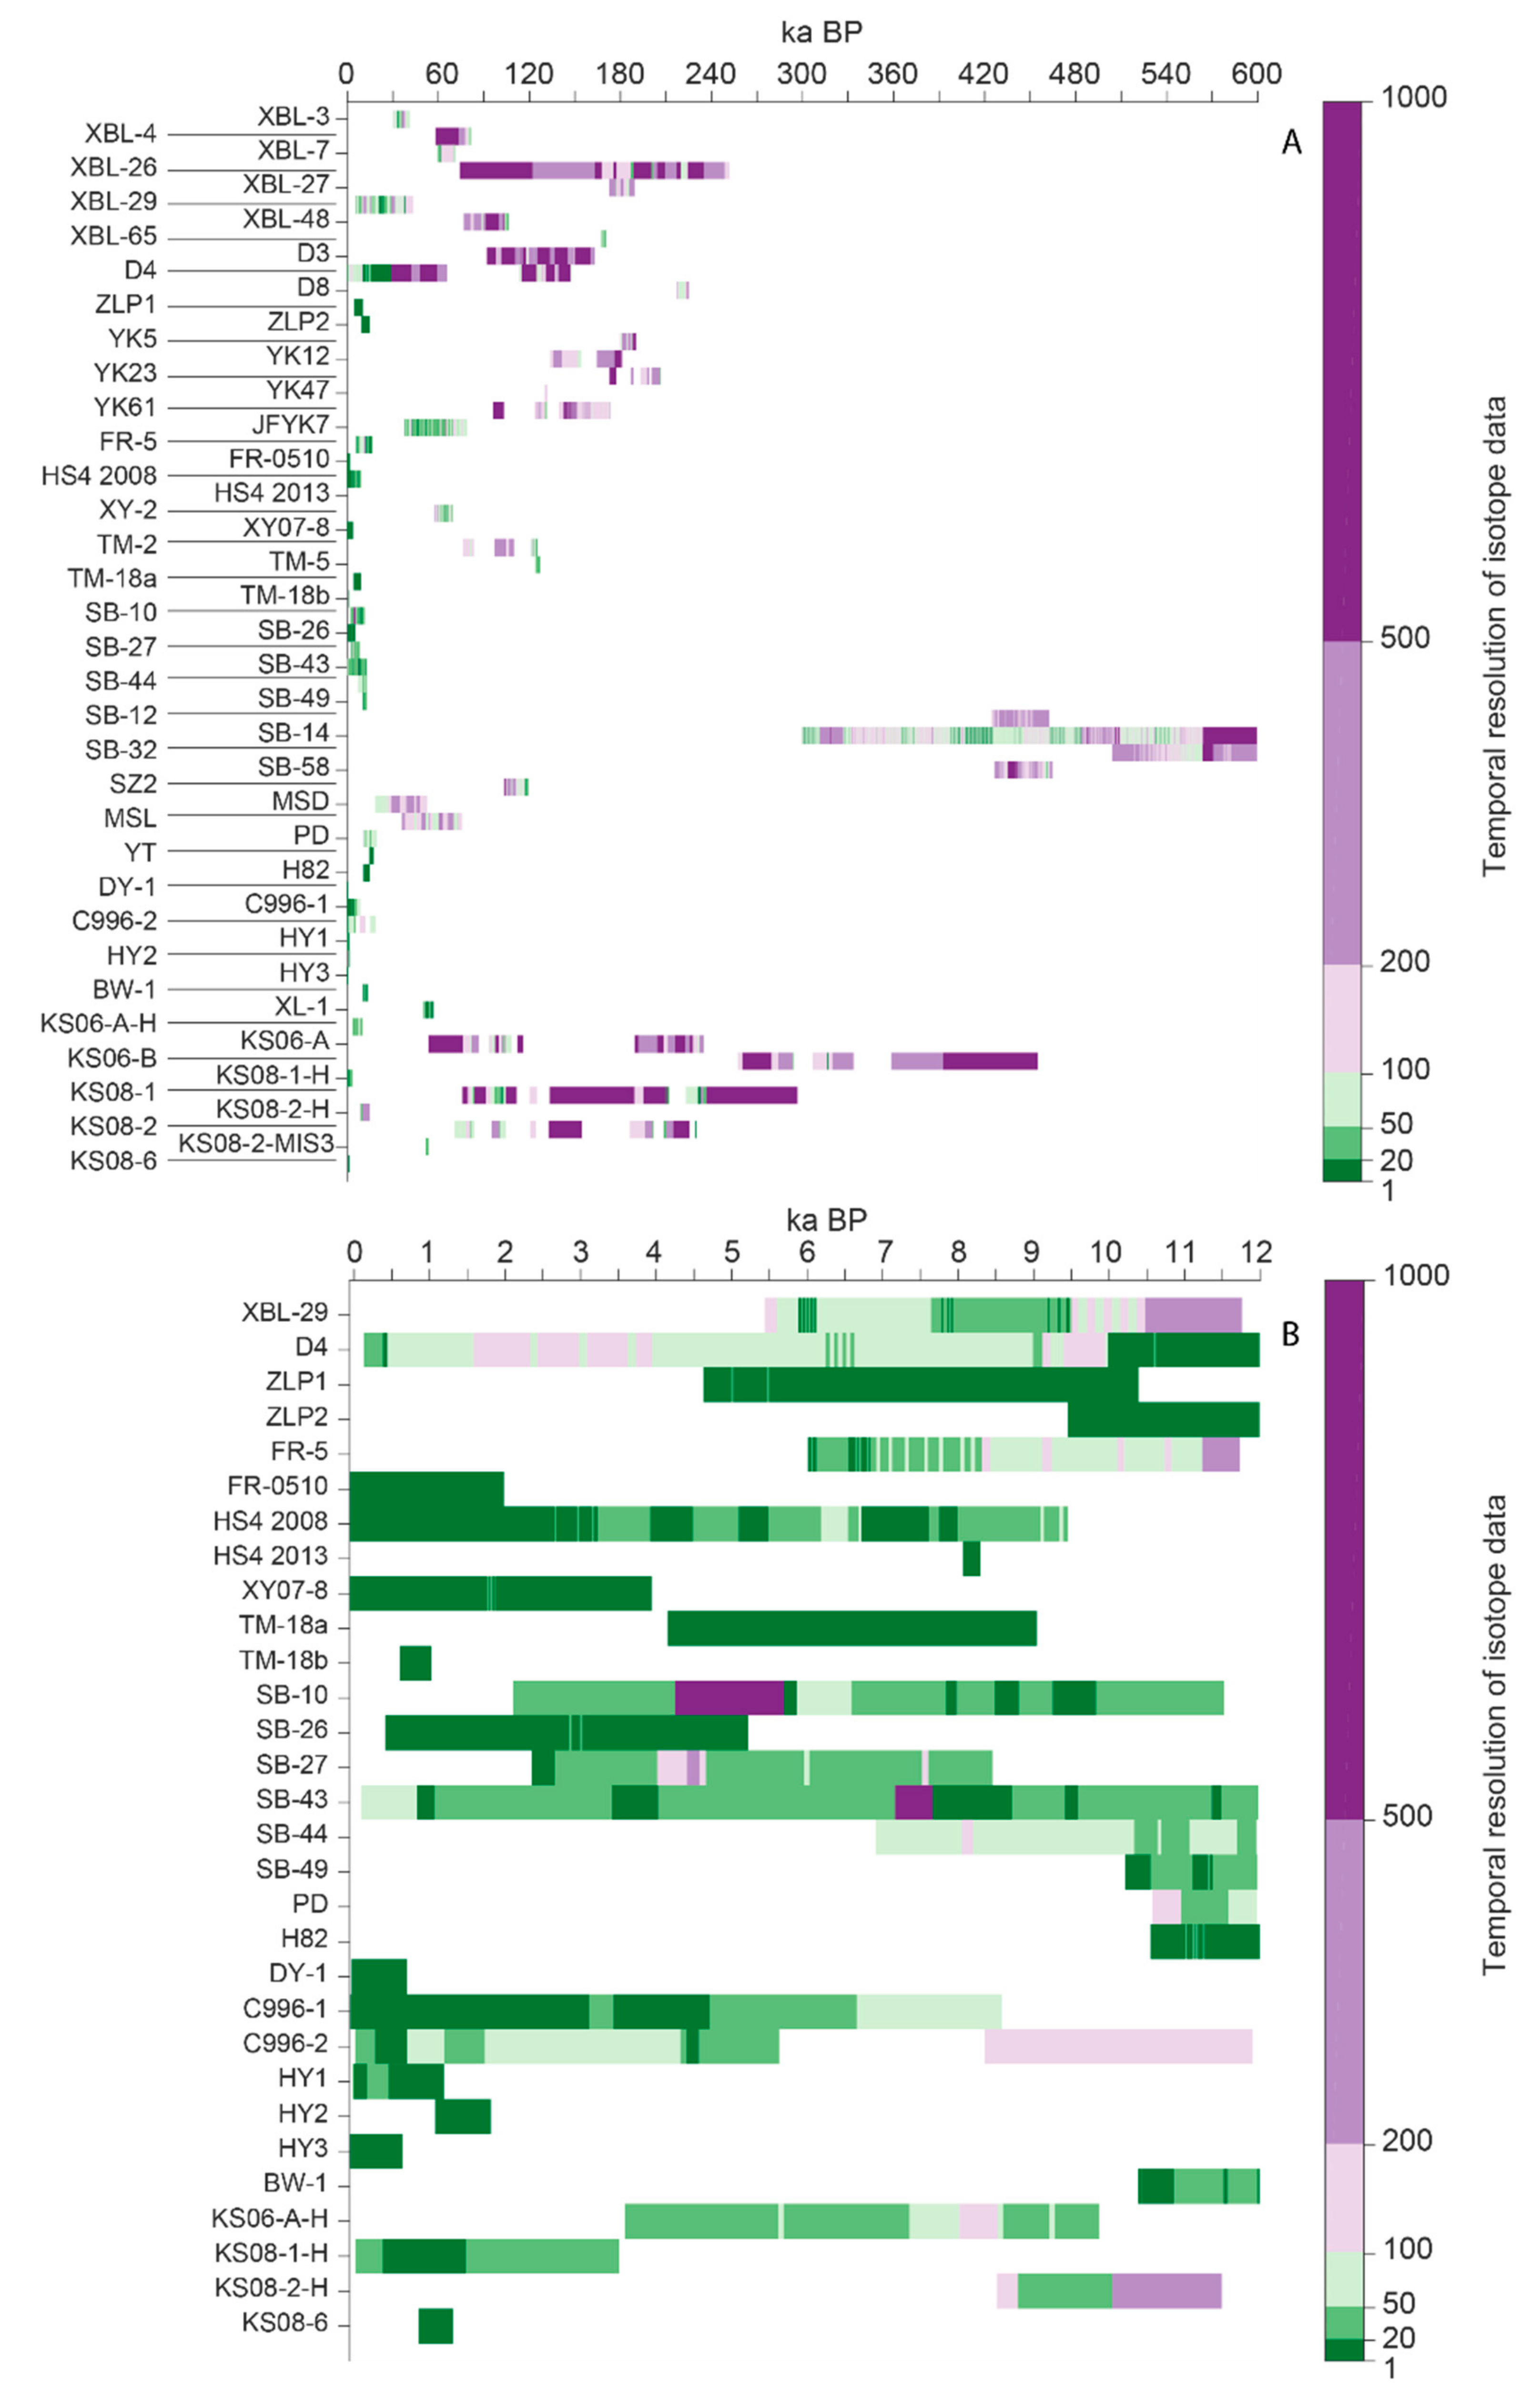
3. Chinese δ18O Records in SISAL_v1
4. Results and Discussion
4.1. Significance of Speleothem δ18O as a Climate Proxy in the EASM Area
4.2. Late Pleistocene Variations of the ASM and Westerly Climates Recorded by Speleothem δ18O Records
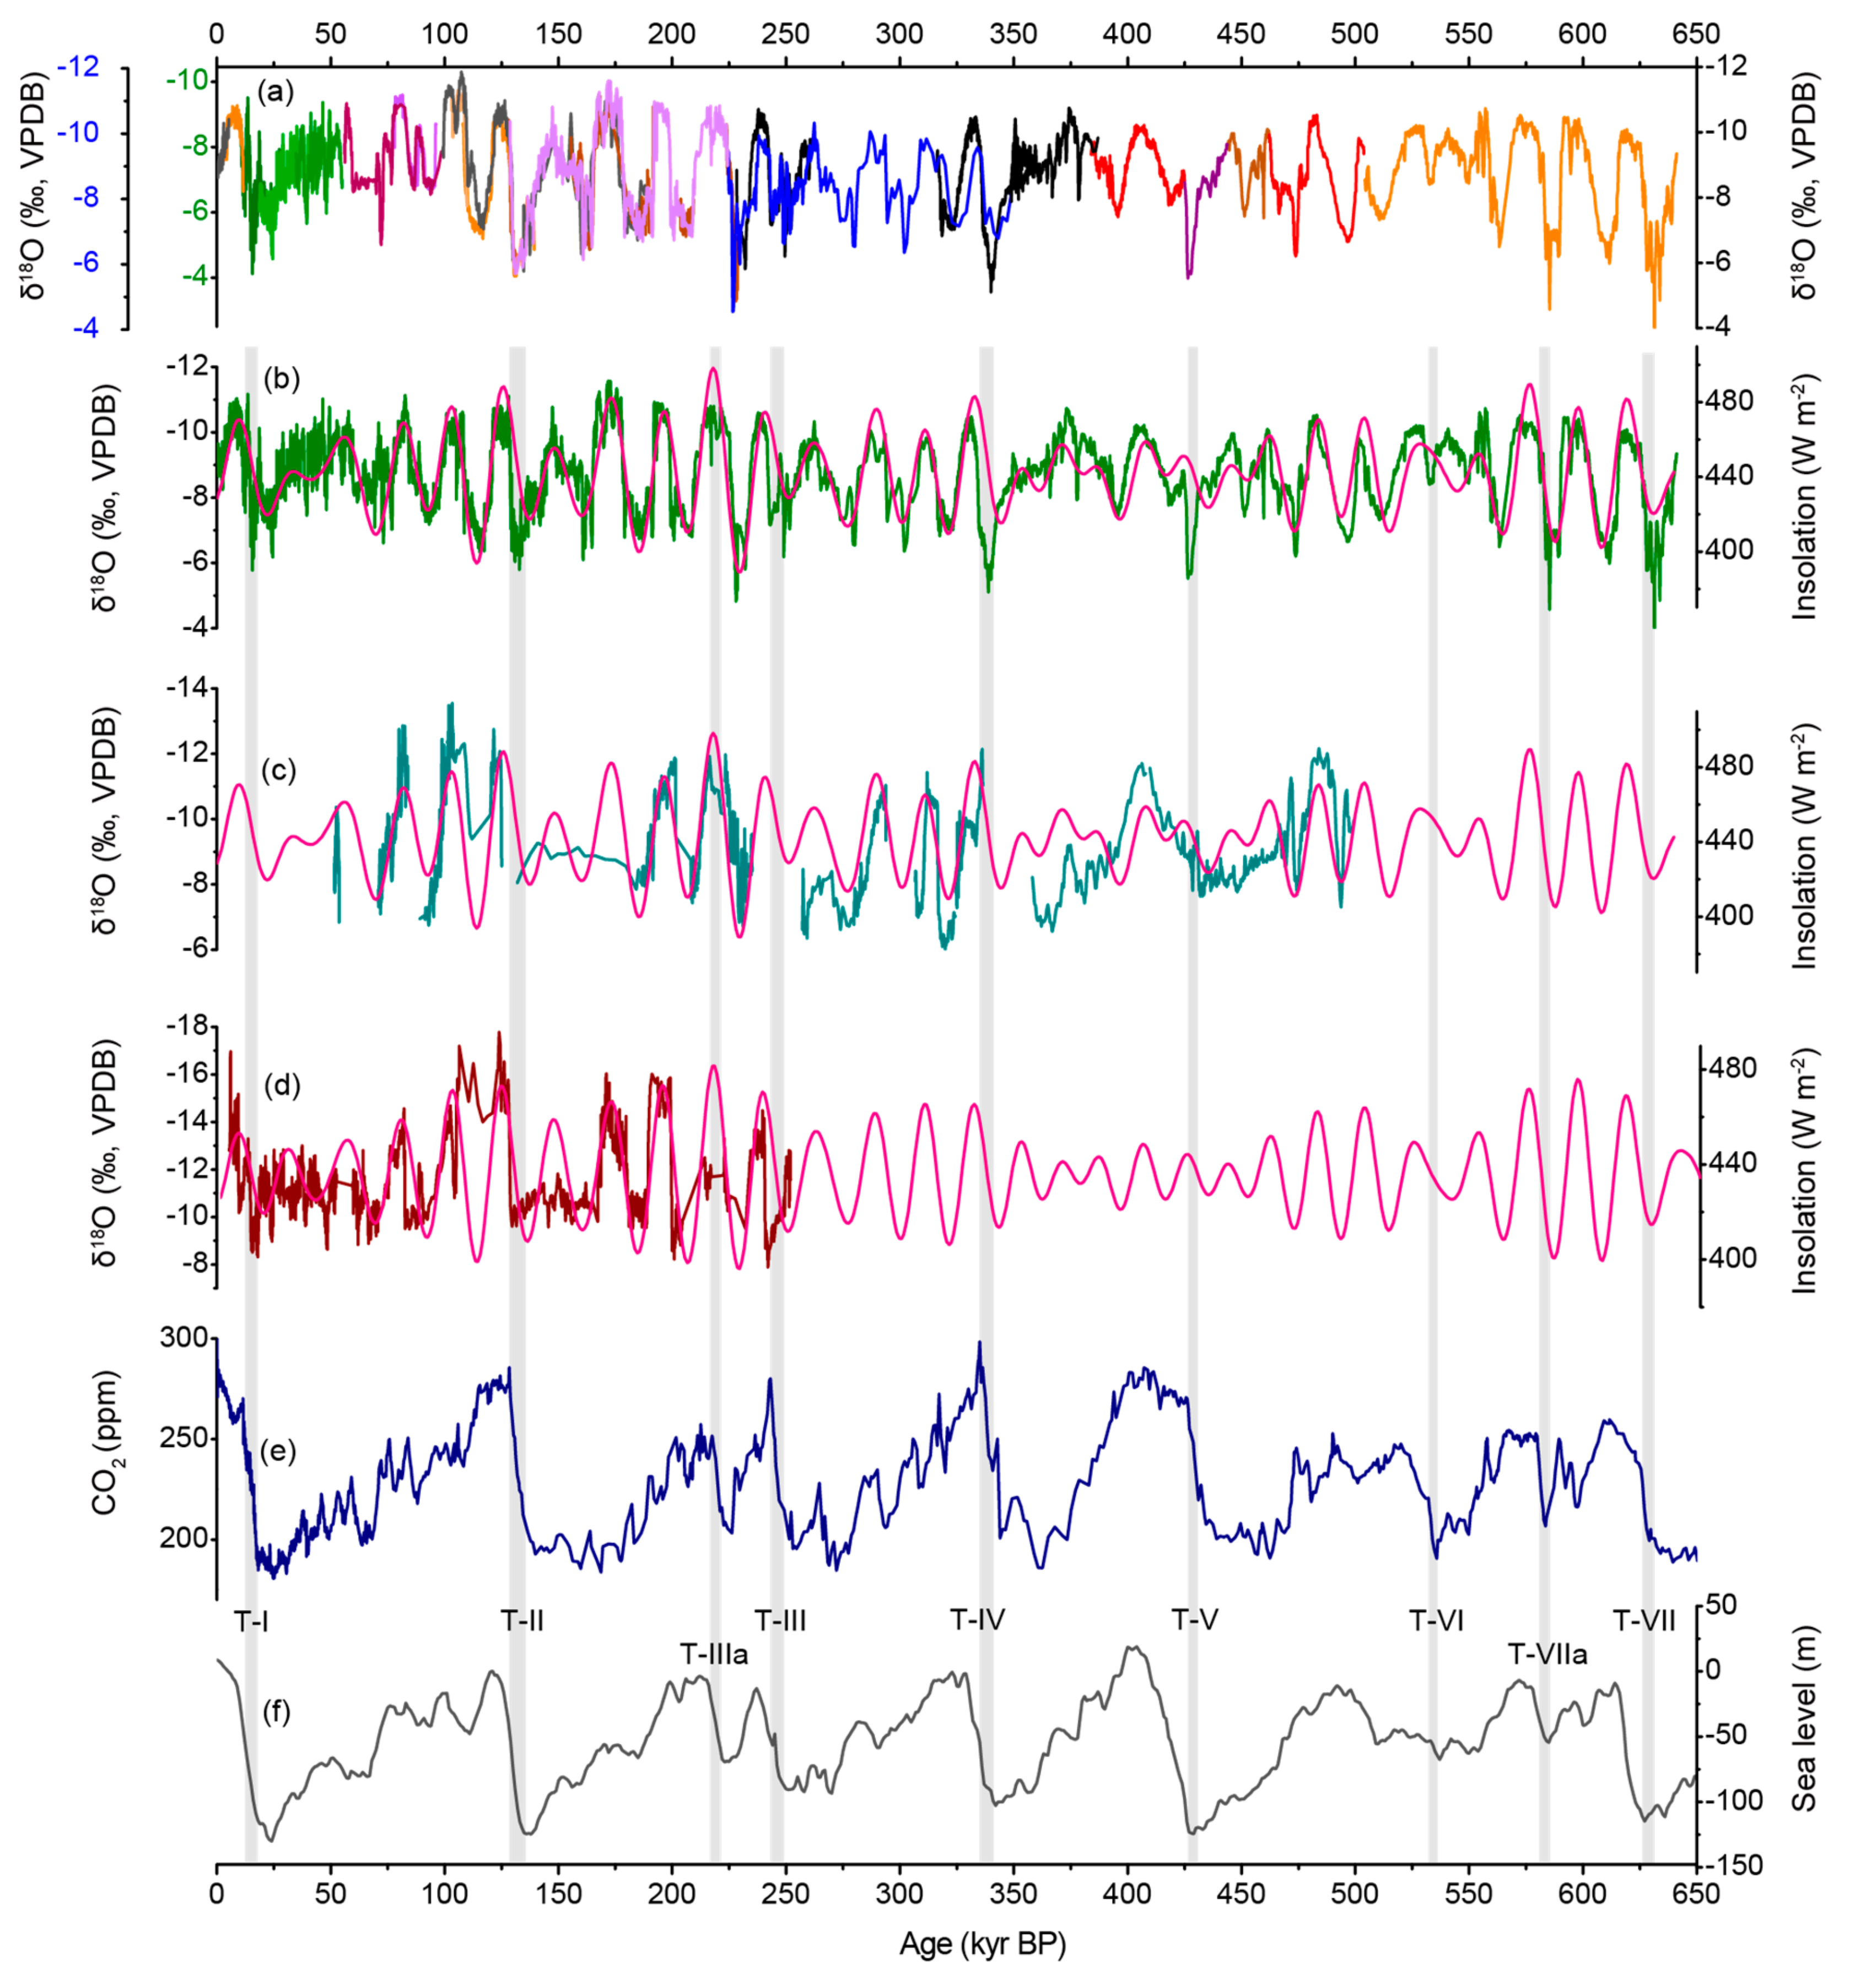
4.2.1. Orbital-Scale Changes
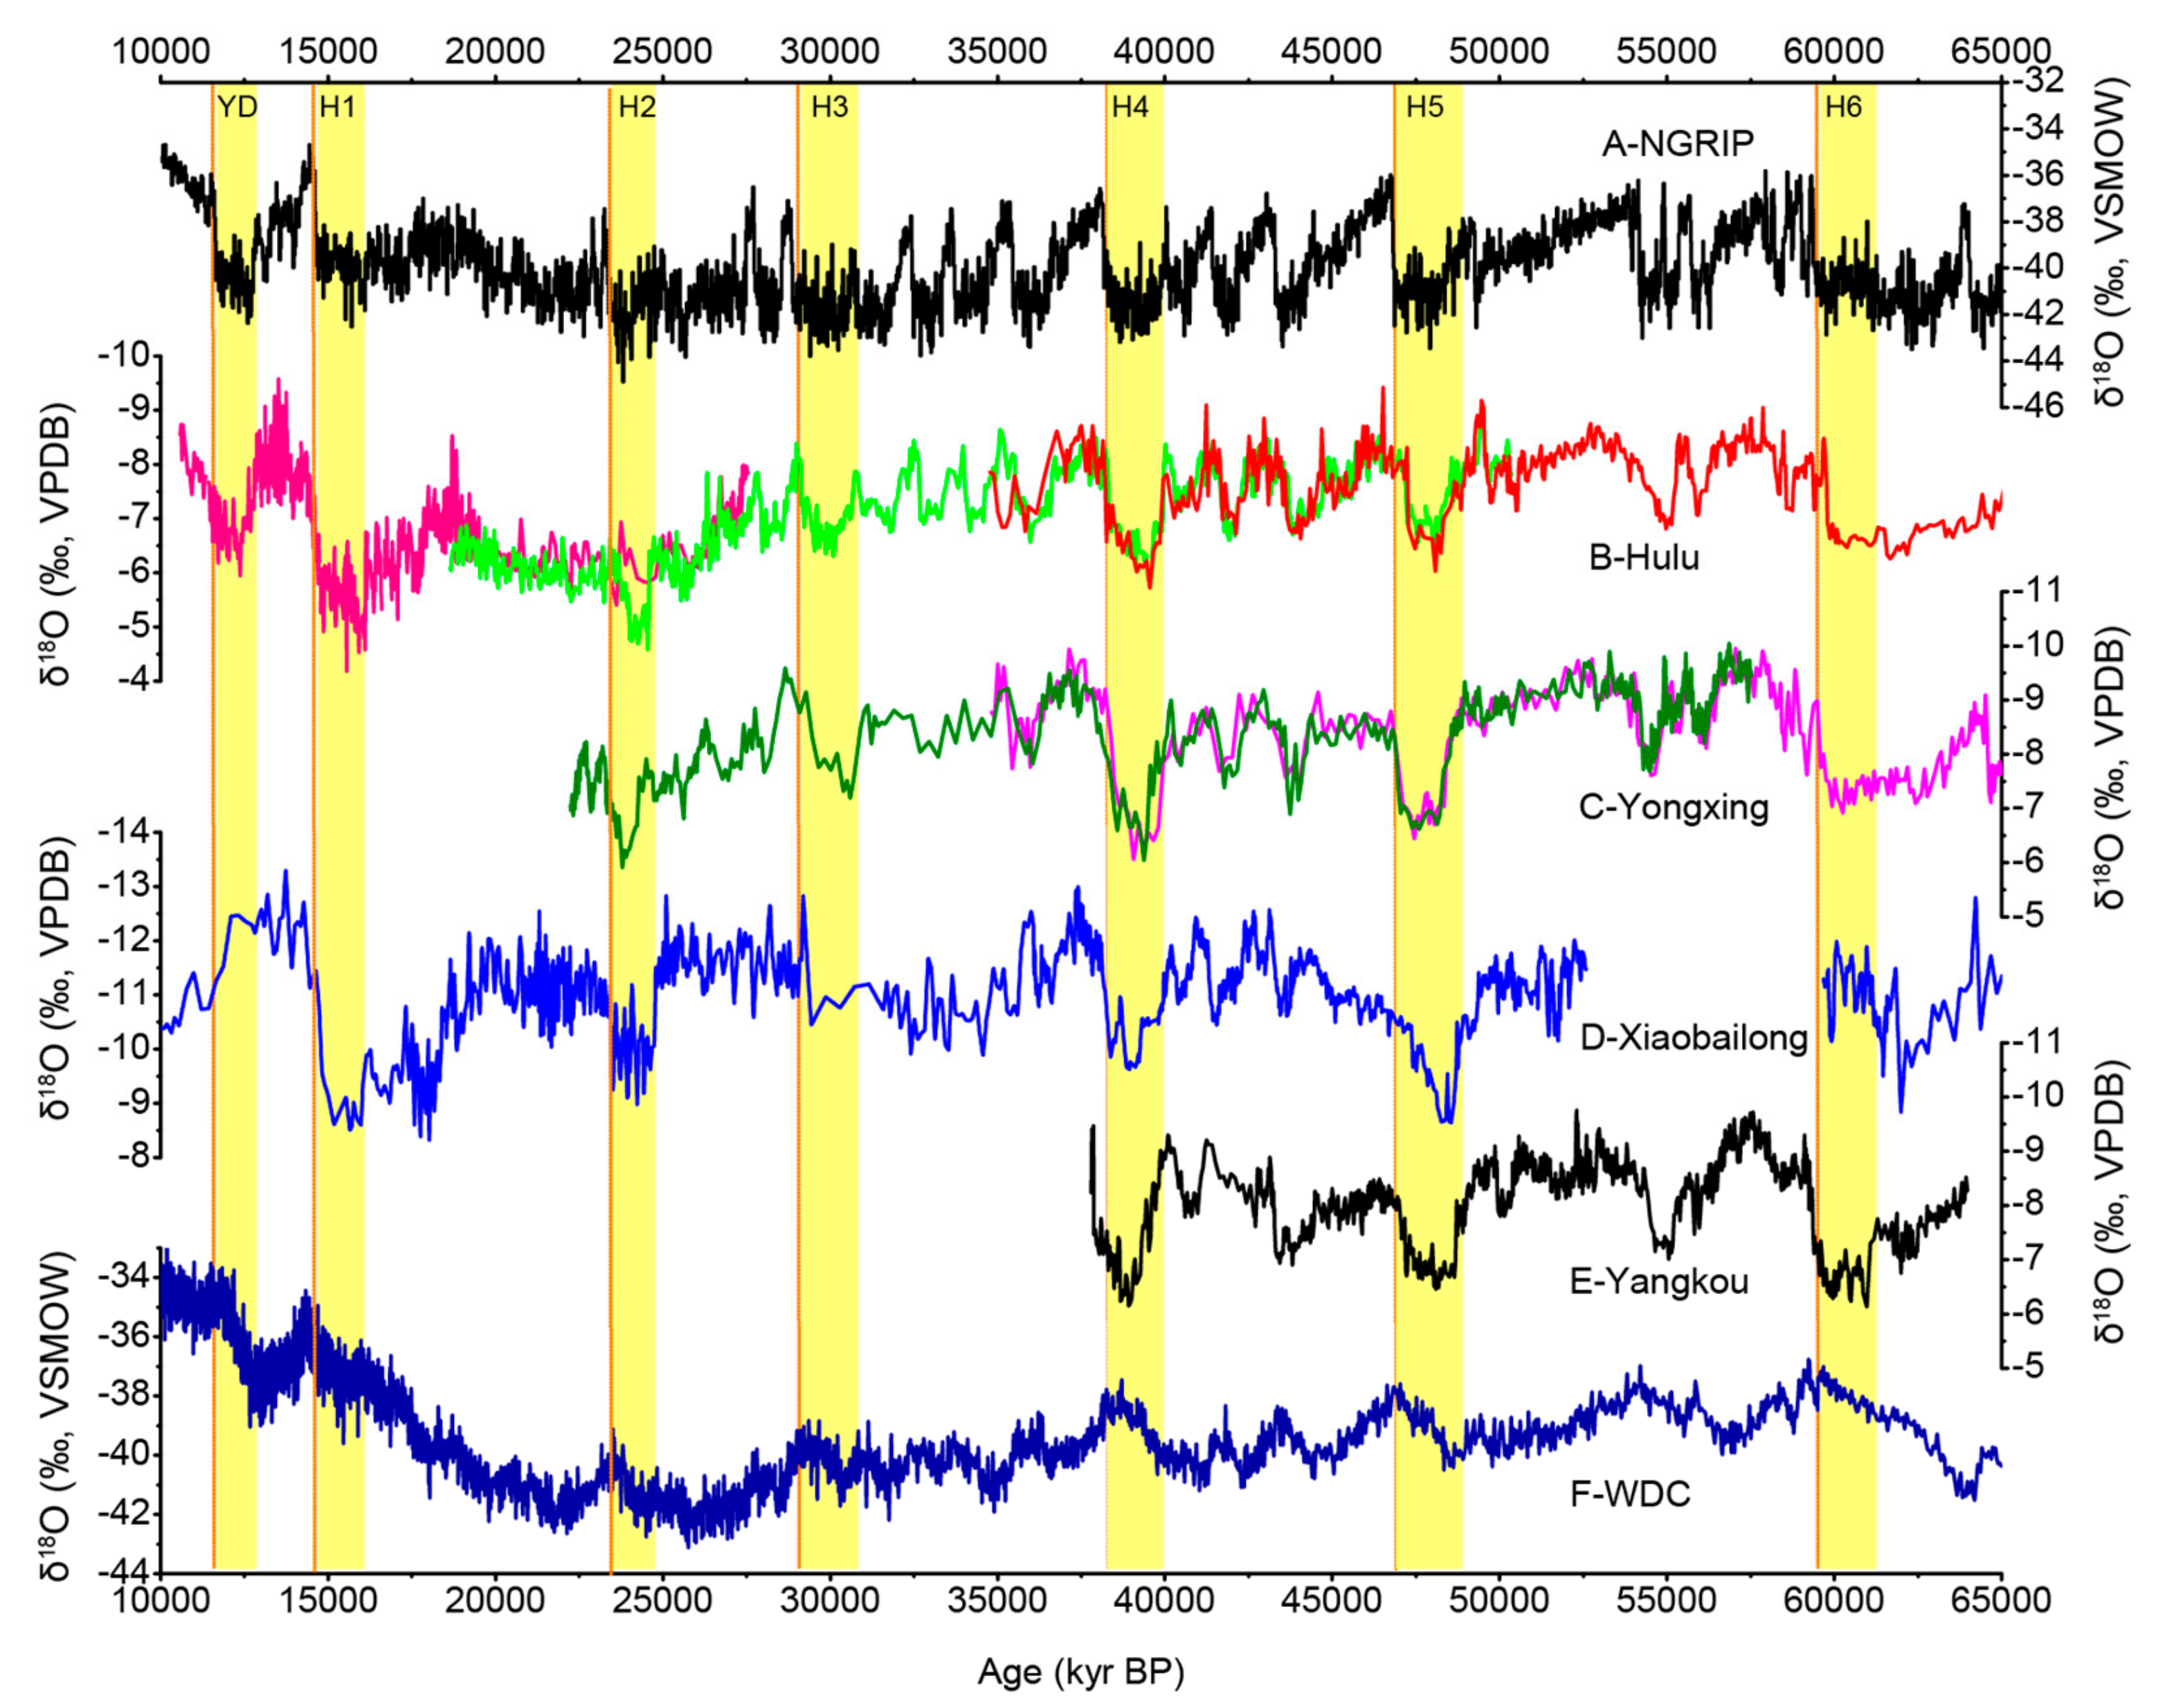
4.2.2. Millennial-Scale Climate Events
4.3. Stalagmite δ18O Records During the Holocene
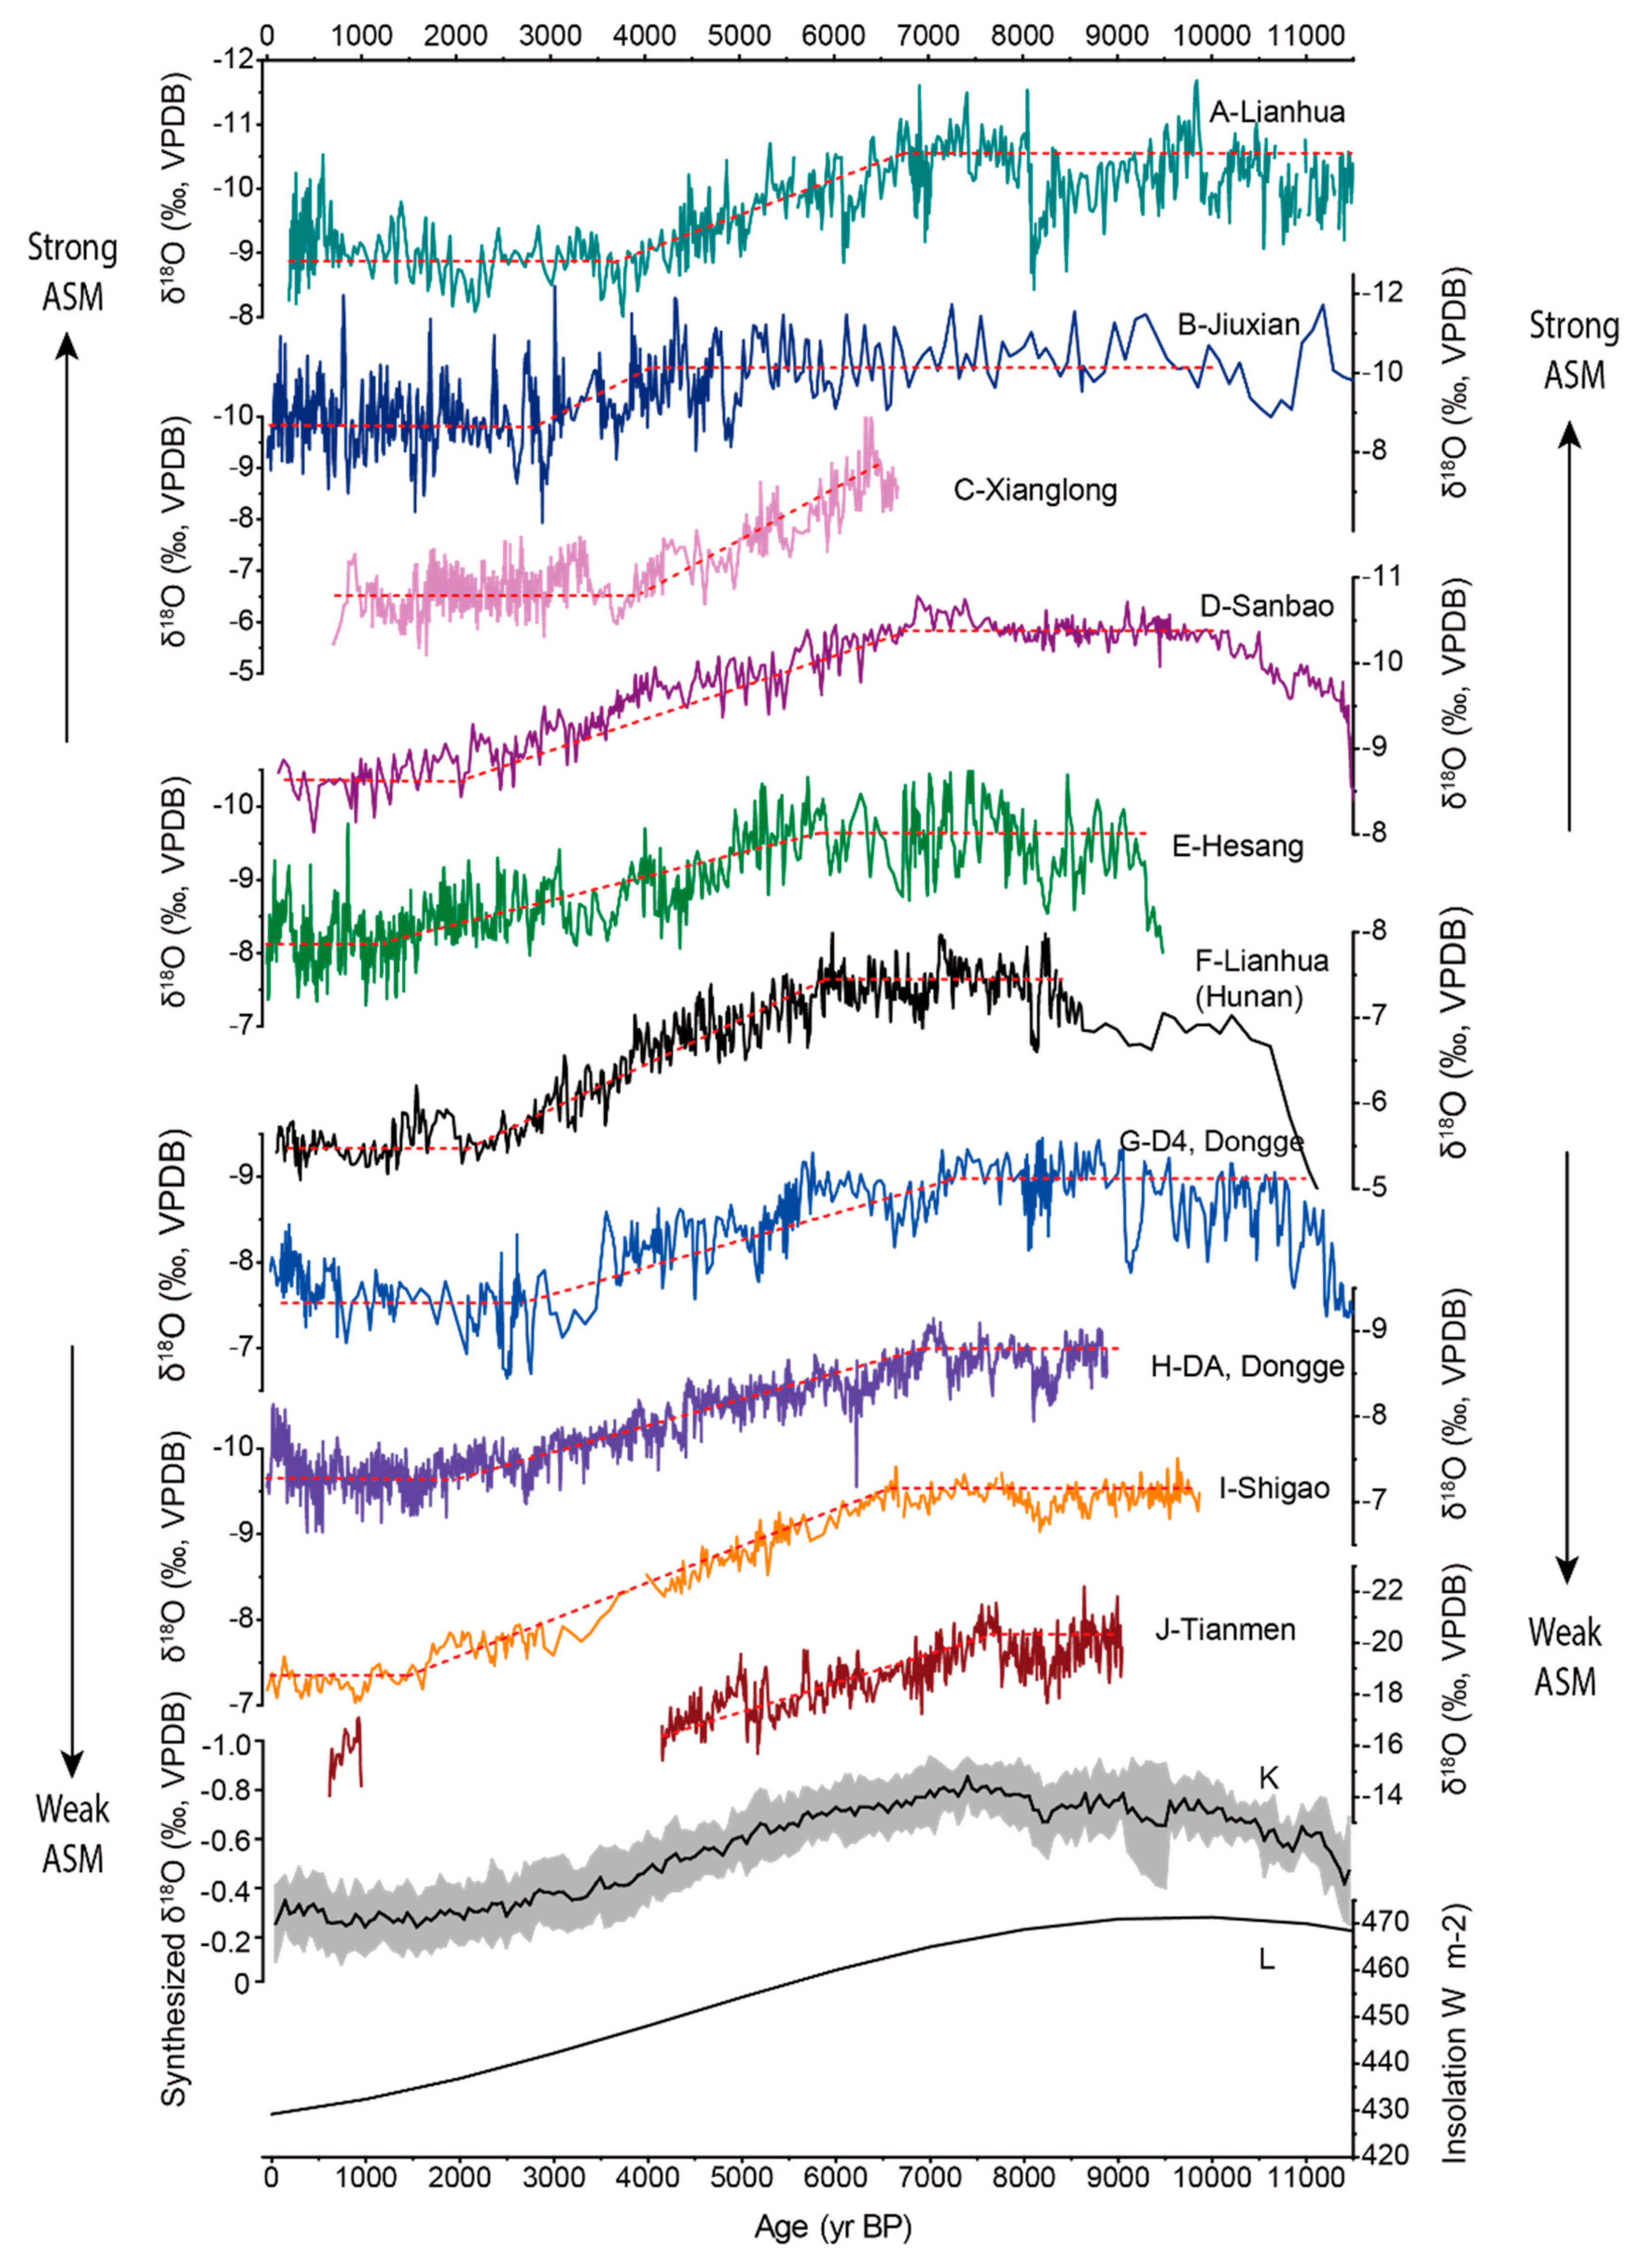
4.3.1. Holocene δ18O Records Forced by Insolation
4.3.2. Spatio-Temporal Distribution of δ18O Records During the Holocene
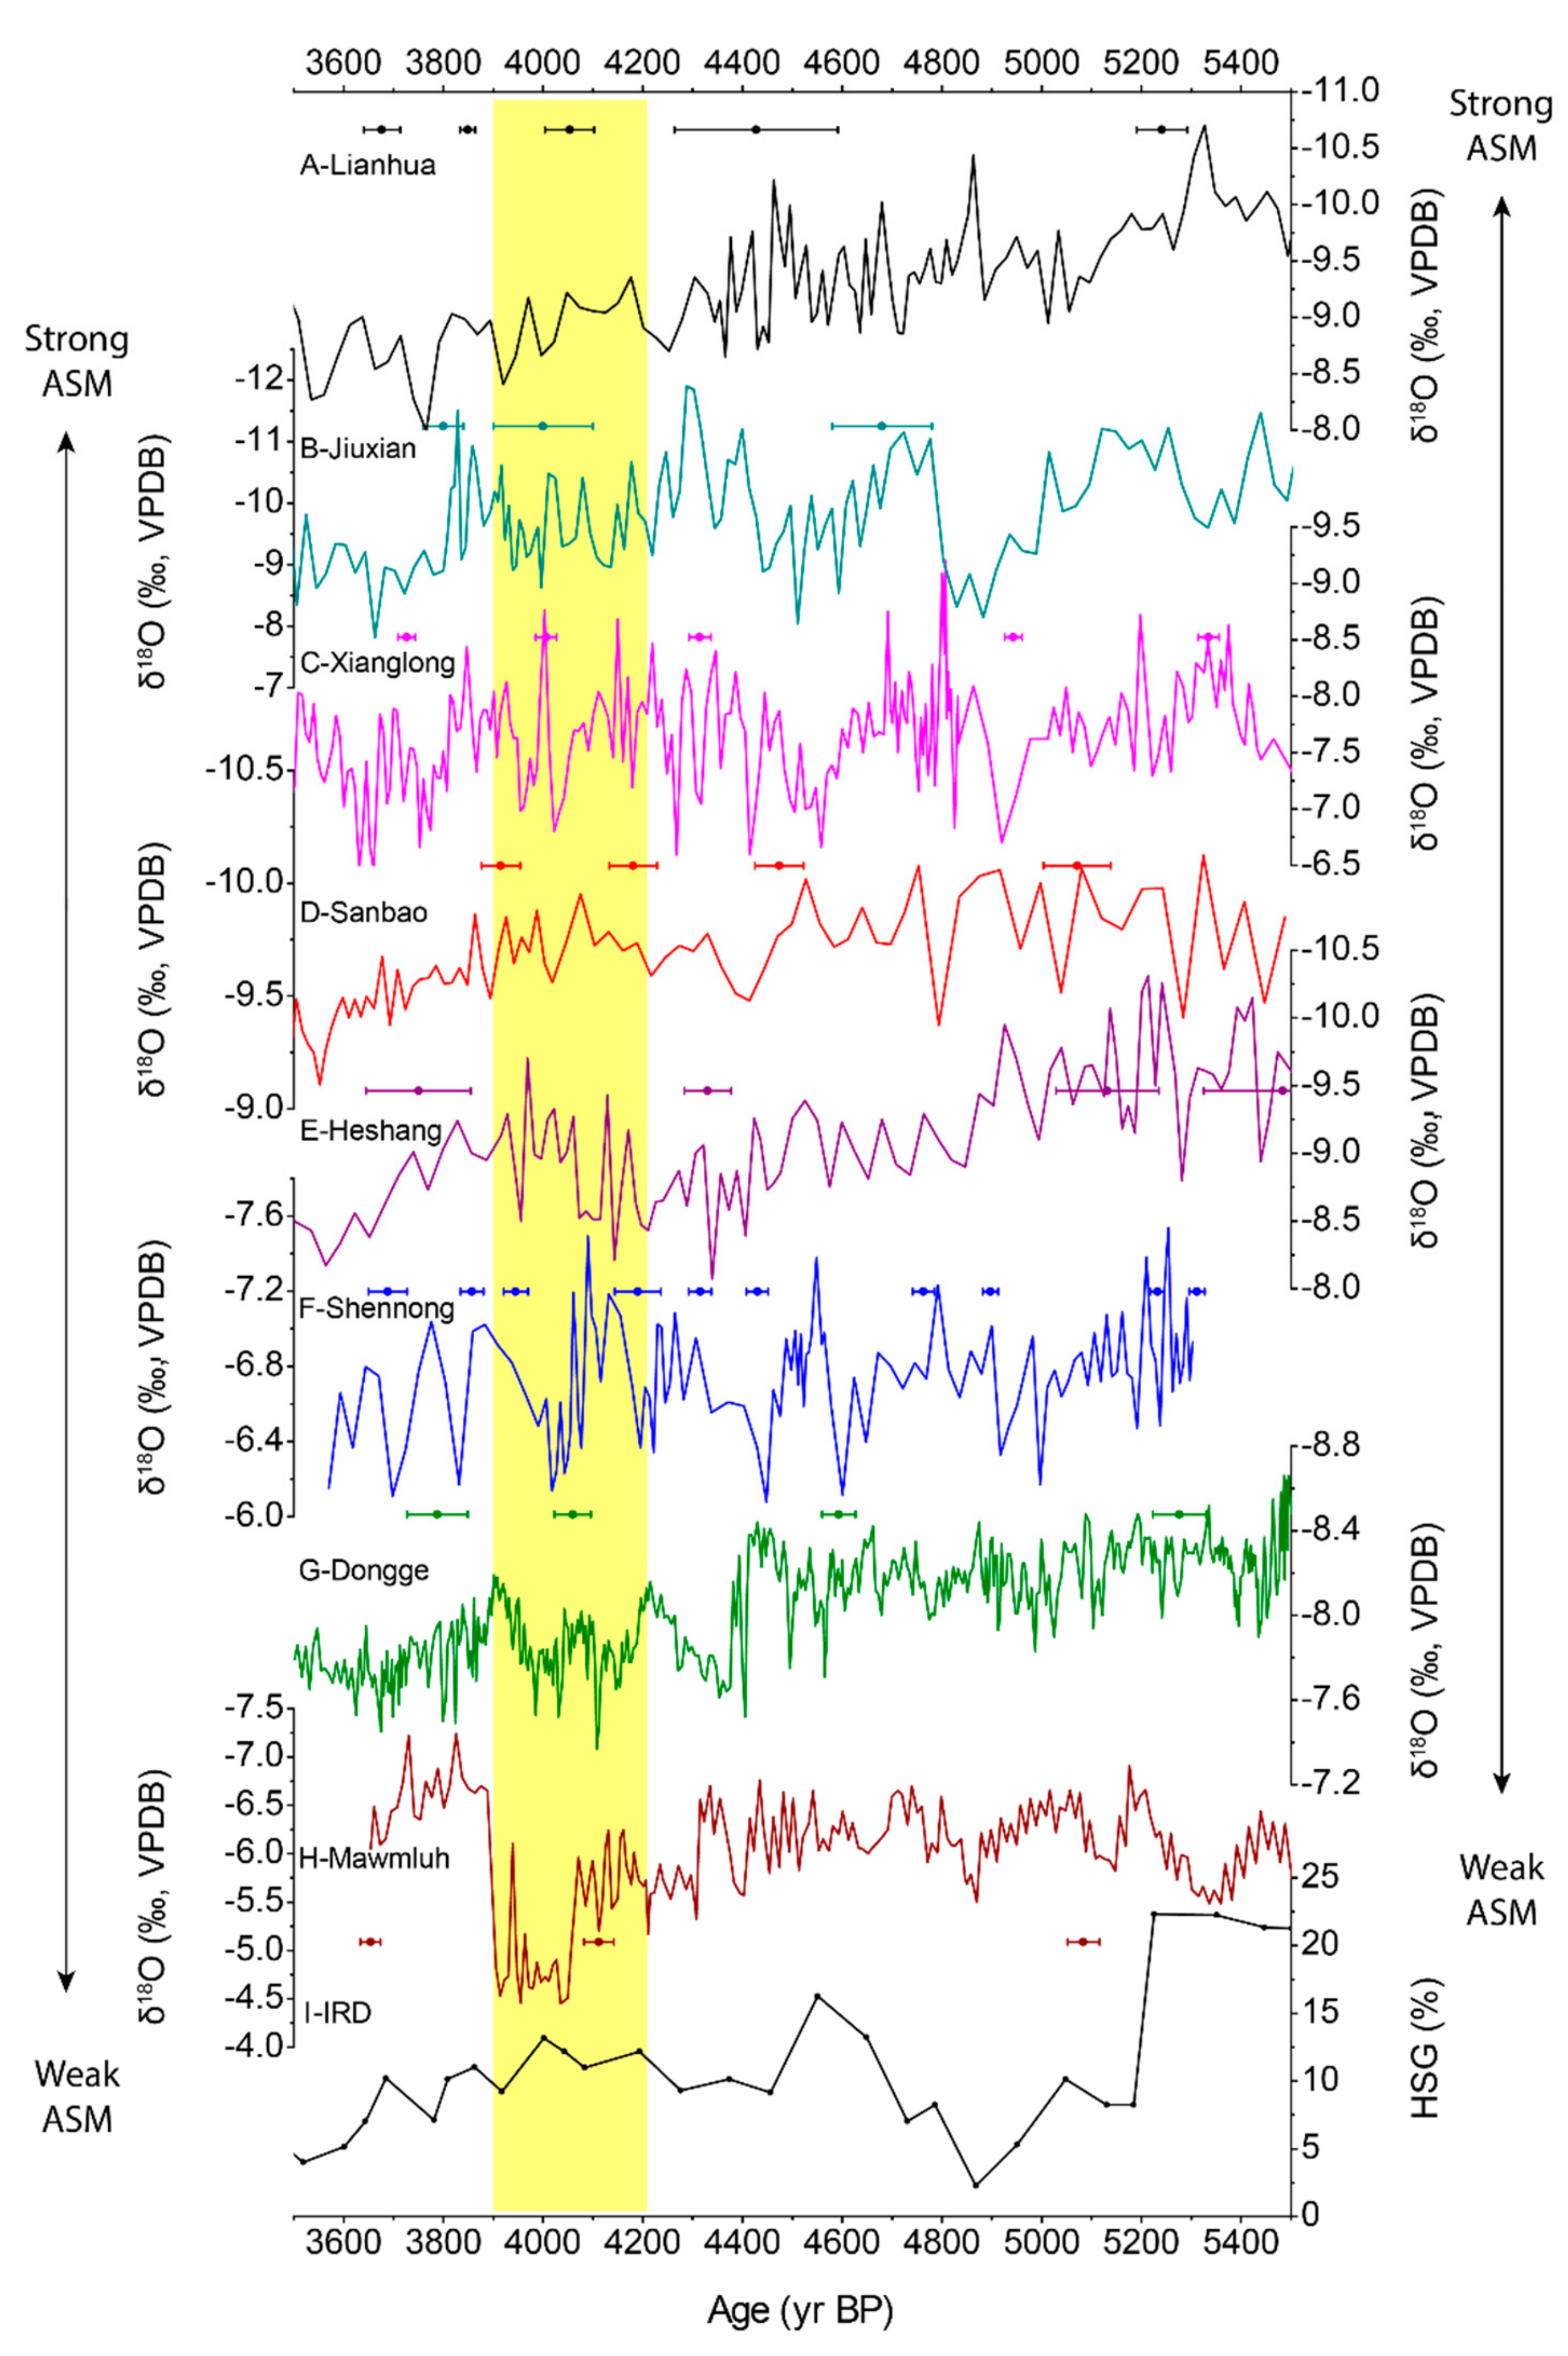
4.3.3. Millennial-Scale Events During the Holocene
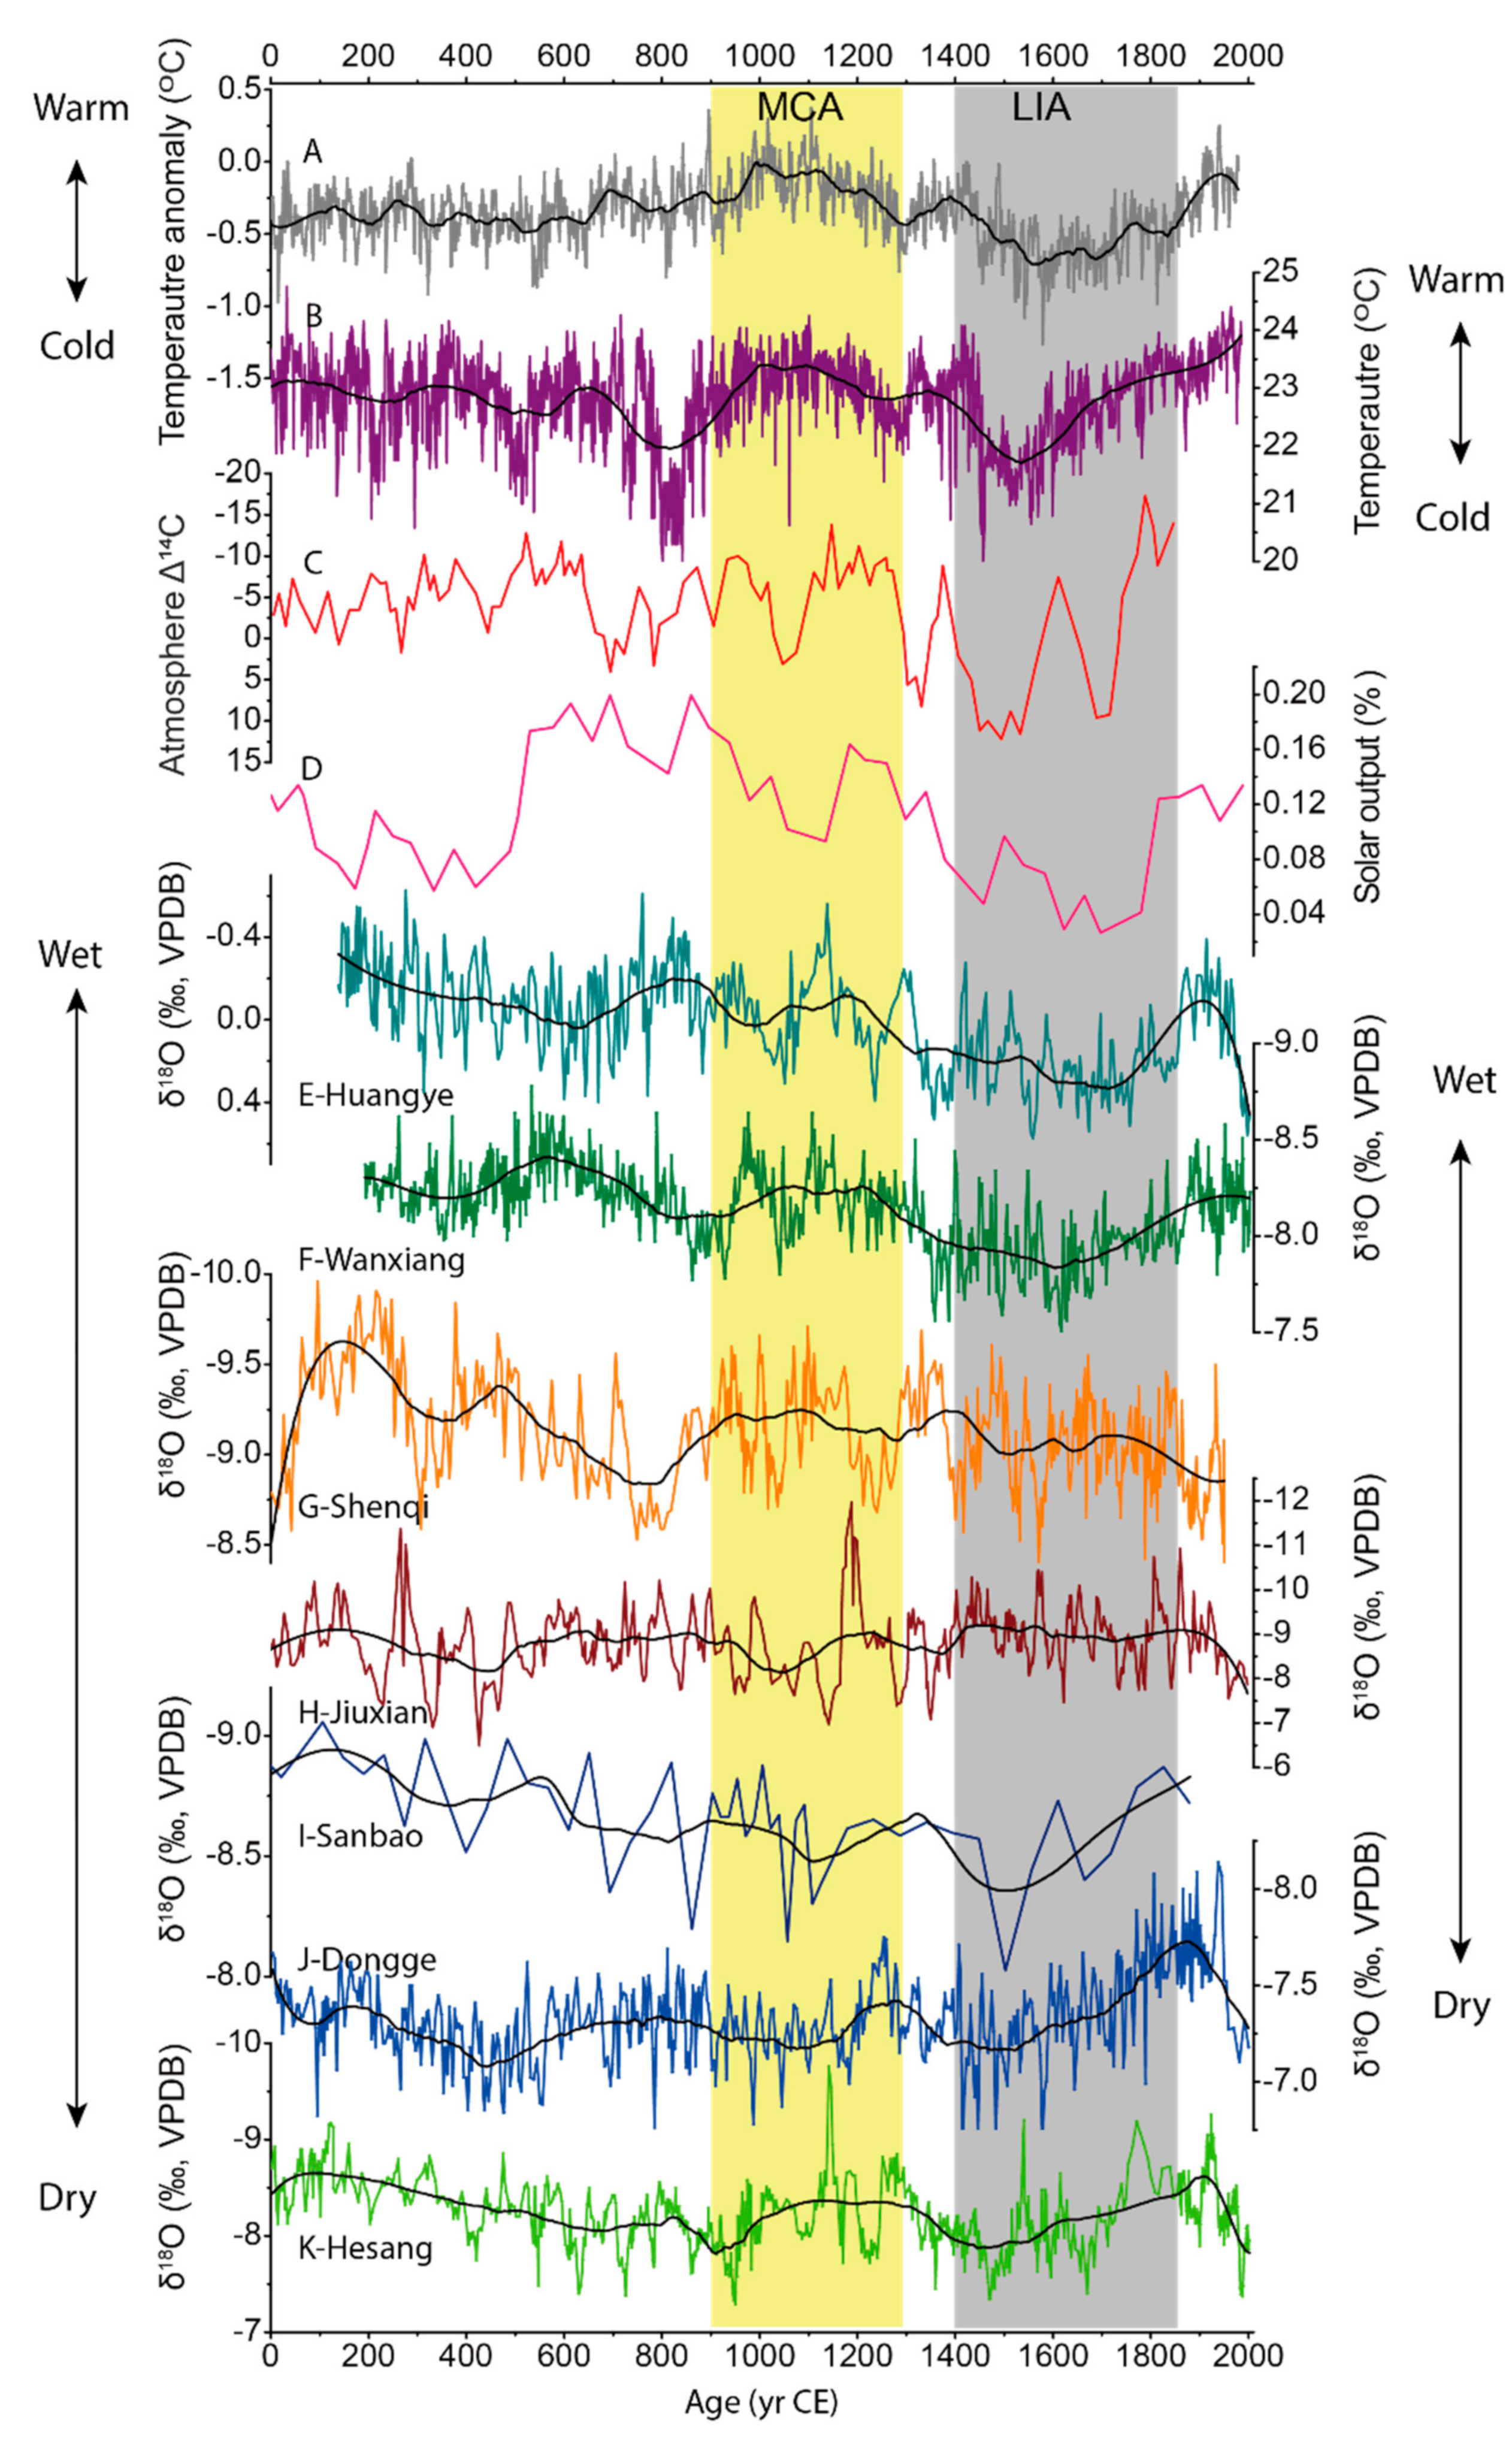
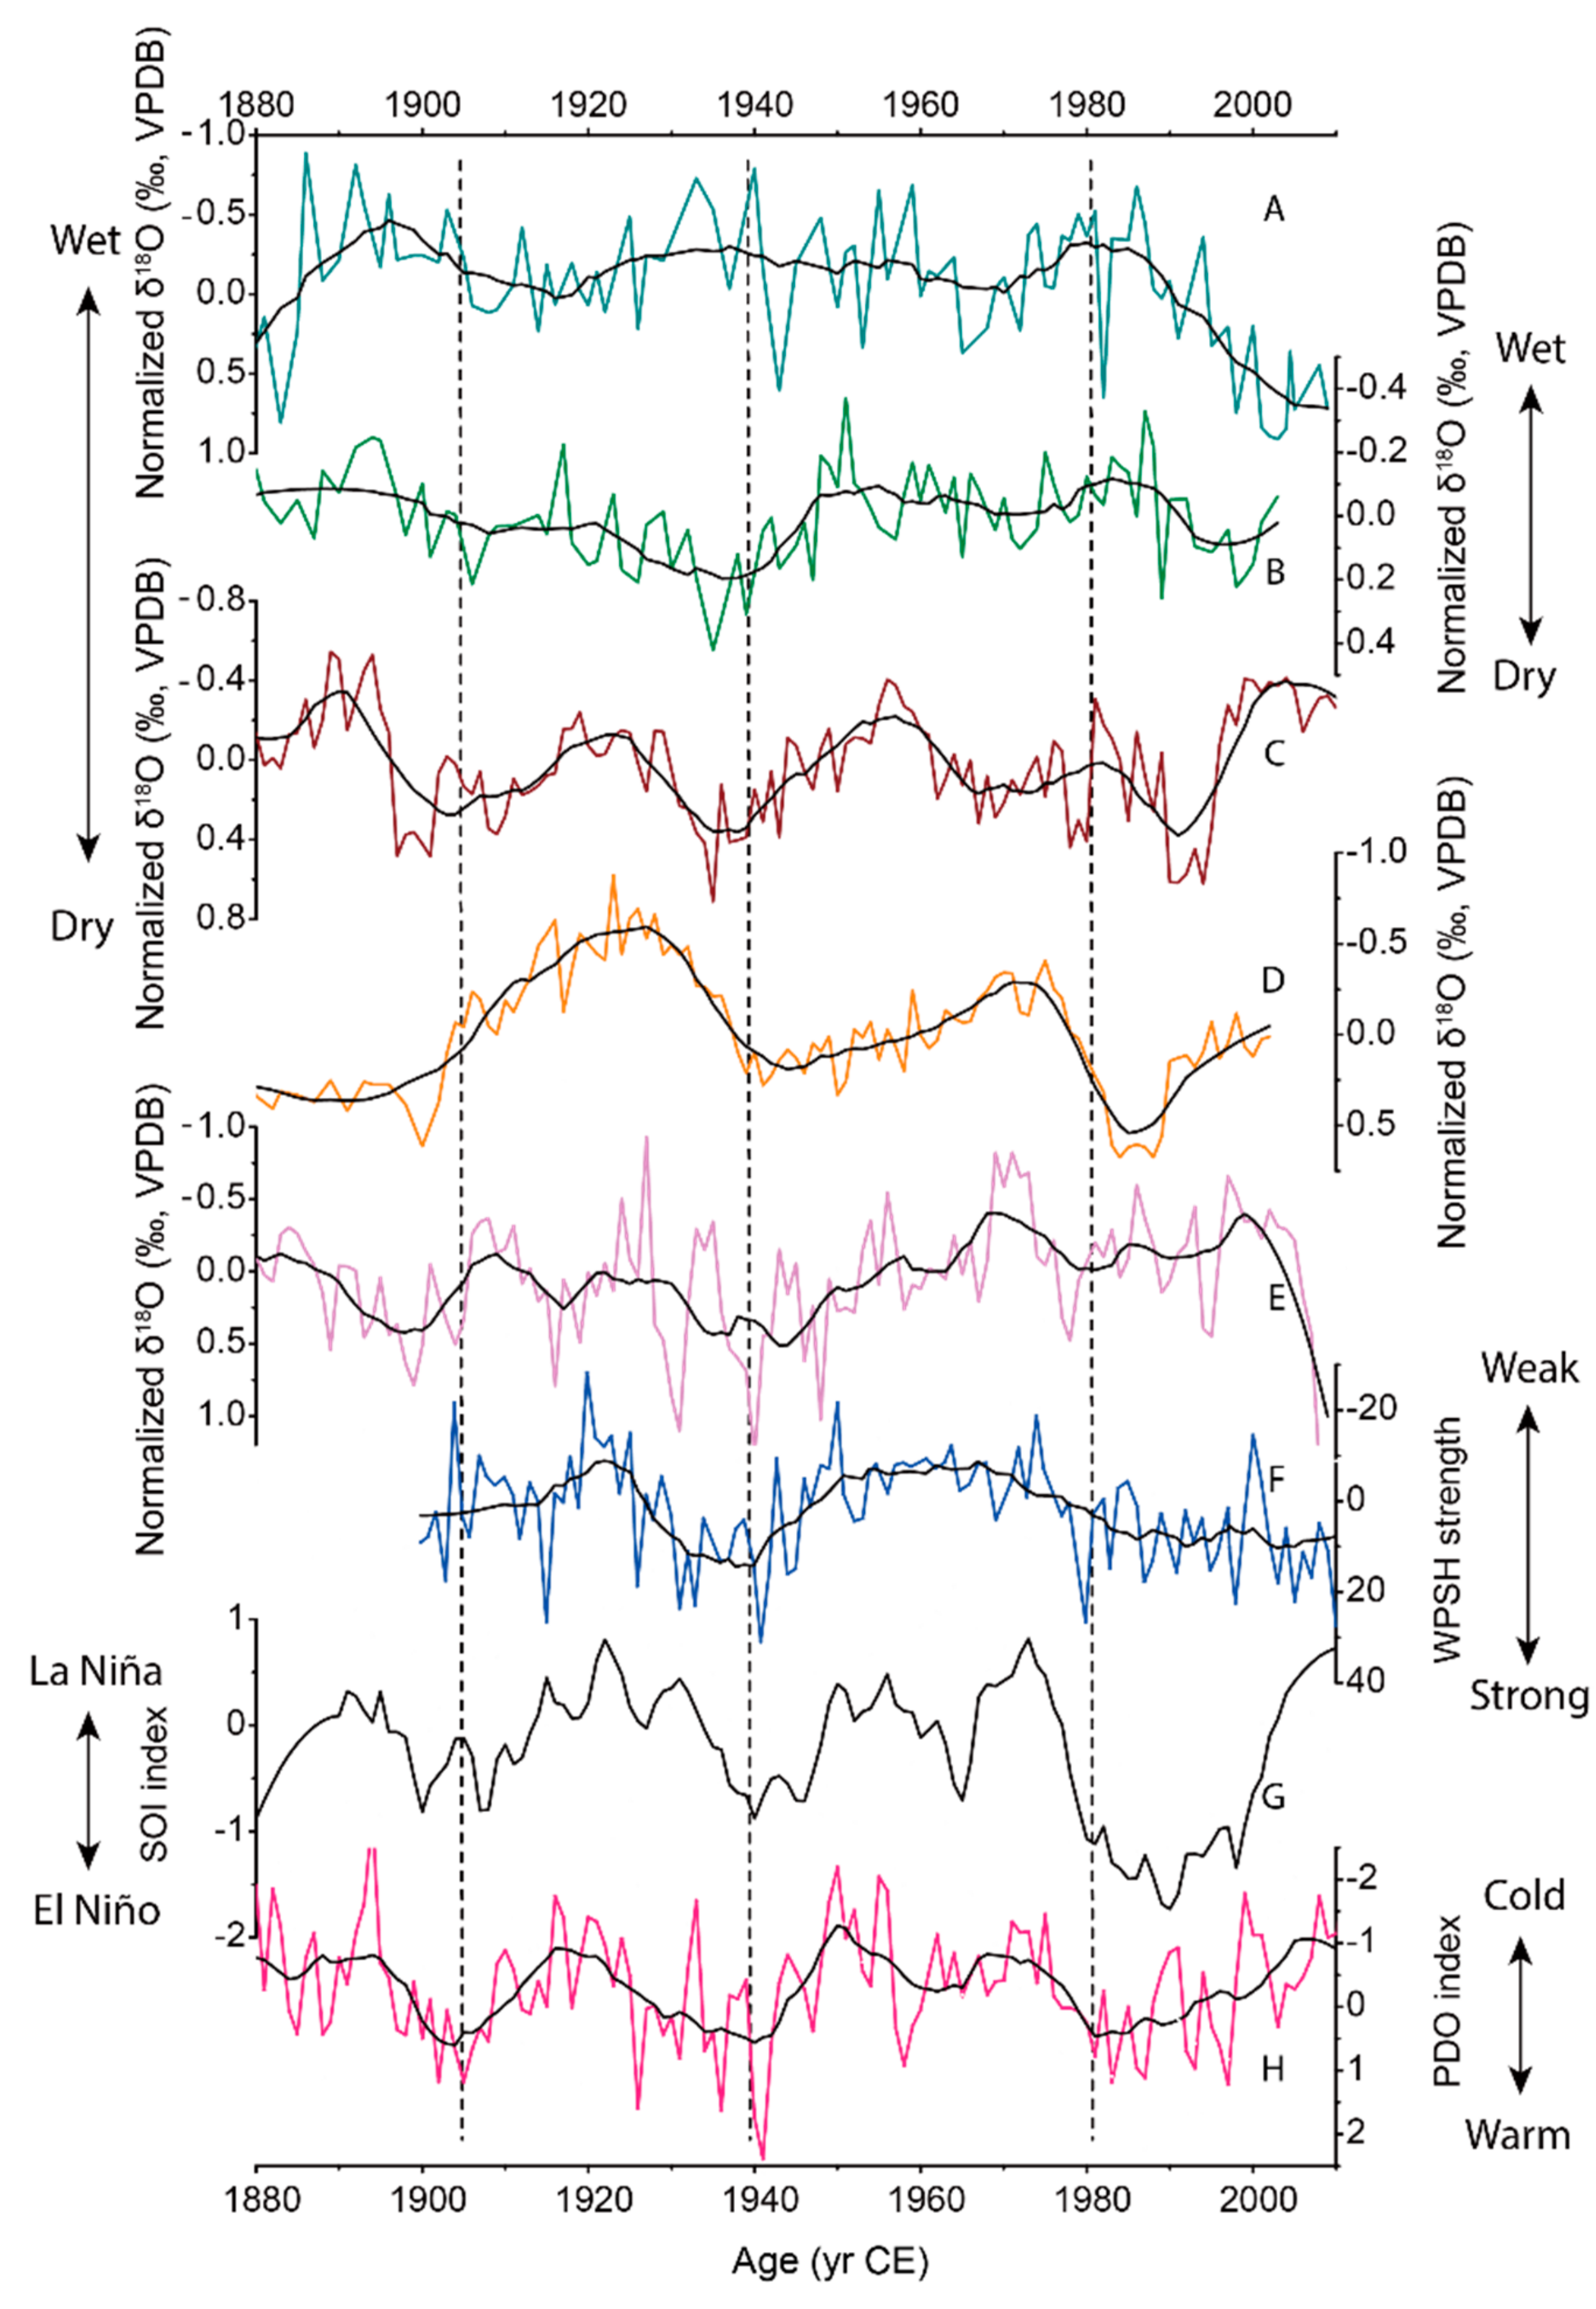
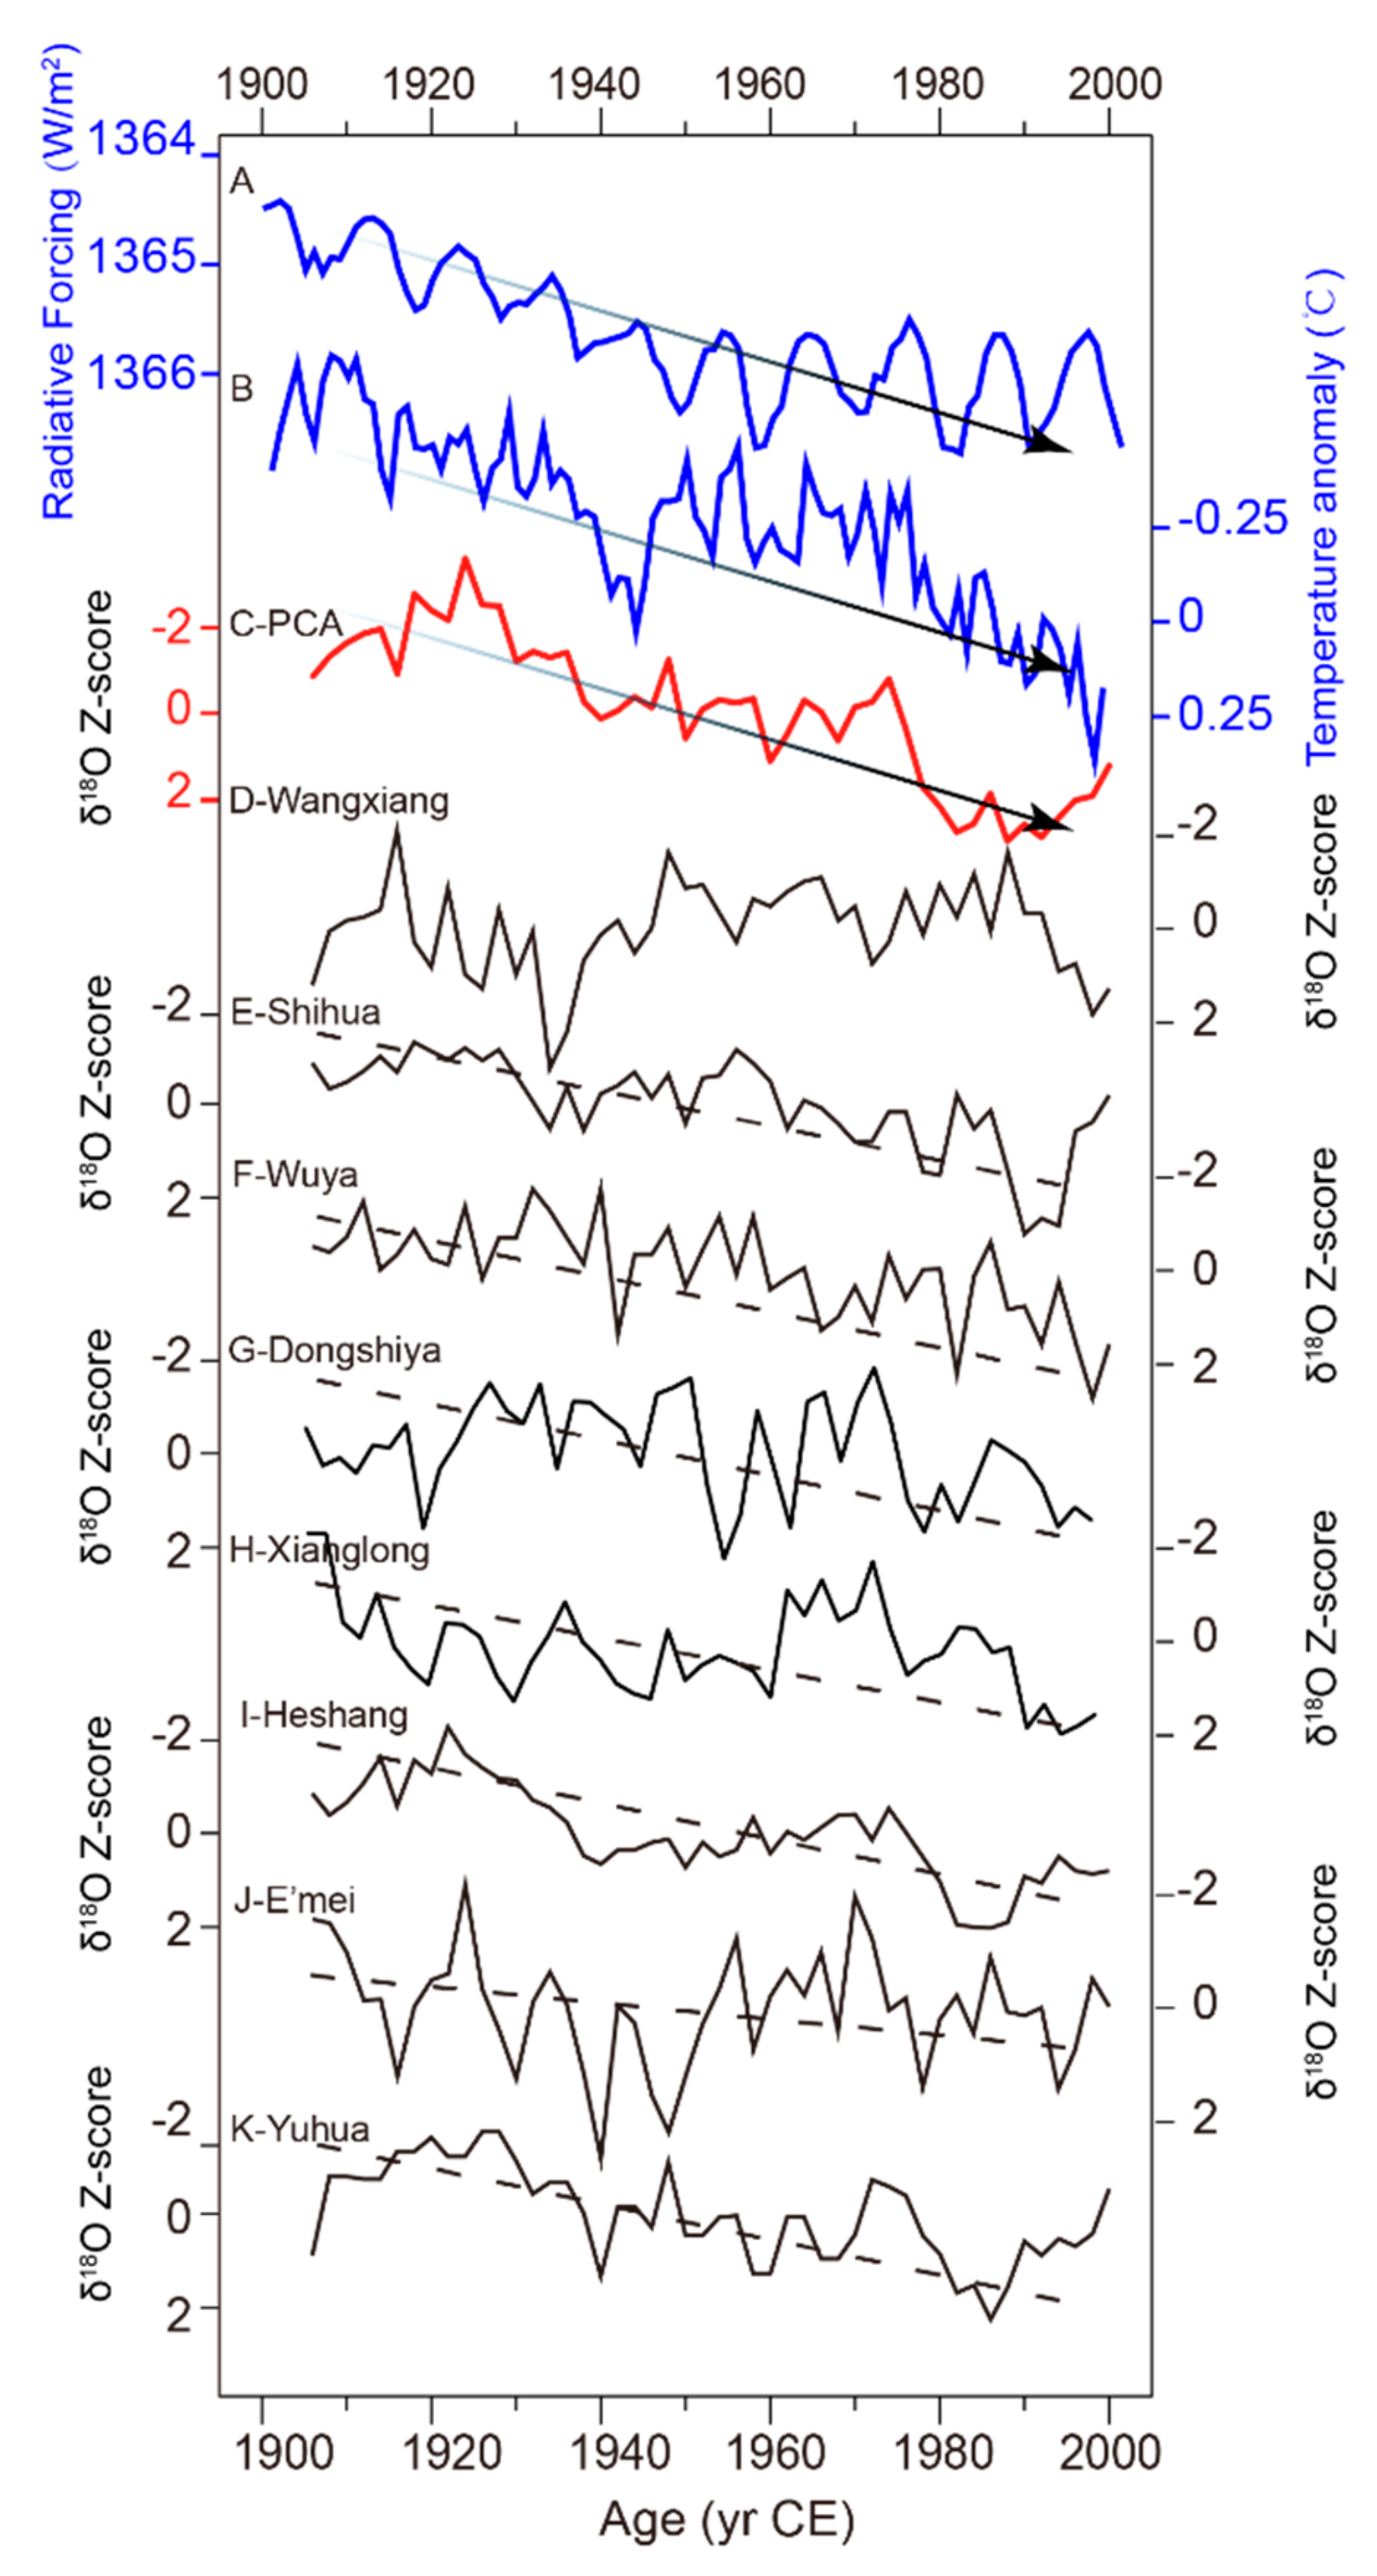
4.4. Climate Variability During the Last 2000 Years
5. Conclusions
Author Contributions
Funding
Acknowledgments
Conflicts of Interest
References
- Cheng, H.; Edwards, R.L.; Sinha, A.; Spötl, C.; Yi, L.; Chen, S.; Kelly, M.; Kathayat, G.; Wang, X.; Li, X.; et al. The Asian monsoon over the past 640,000 years and ice age terminations. Nature 2016, 534, 640–646. [Google Scholar] [CrossRef] [PubMed]
- Cheng, H.; Sinha, A.; Wang, X.; Cruz, F.W.; Edwards, R.L. The Global Paleomonsoon as seen through speleothem records from Asia and the Americas. Clim. Dyn. 2012, 39, 1045–1062. [Google Scholar] [CrossRef]
- Edwards, R.L.; Chen, J.; Wasserburg, G. 238U234U230Th232Th systematics and the precise measurement of time over the past 500,000 years. Earth Planet. Sci. Lett. 1987, 81, 175–192. [Google Scholar] [CrossRef]
- Cheng, H.; Edwards, R.L.; Shen, C.-C.; Polyak, V.J.; Asmerom, Y.; Woodhead, J.; Hellstrom, J.; Wang, Y.; Kong, X.; Spötl, C. Improvements in 230Th dating, 230Th and 234U half-life values, and U-Th isotopic measurements by multi-collector inductively coupled plasma mass spectrometry. Earth Planet. Sci. Lett. 2013, 371, 82–91. [Google Scholar] [CrossRef]
- Wang, Y.; Cheng, H.; Edwards, R.; An, Z.; Wu, J.; Shen, C.; Dorale, J. A high-resolution absolute-dated late Pleistocene monsoon record from Hulu Cave, China. Science 2001, 294, 2345. [Google Scholar] [CrossRef]
- Cruz, F.W., Jr.; Burns, S.J.; Jercinovic, M.; Karmann, I.; Sharp, W.D.; Vuille, M. Evidence of rainfall variations in Southern Brazil from trace element ratios (Mg/Ca and Sr/Ca) in a Late Pleistocene stalagmite. Geochim. Cosmochim. Acta 2007, 71, 2250–2263. [Google Scholar] [CrossRef]
- Cheng, H.; Sinha, A.; Verheyden, S.; Nader, F.; Li, X.; Zhang, P.; Yin, J.; Yi, L.; Peng, Y.; Rao, Z. The climate variability in northern Levant over the past 20,000 years. Geophys. Res. Lett. 2015, 42, 8641–8650. [Google Scholar] [CrossRef]
- Wang, Y.; Cheng, H.; Edwards, R.; He, Y.; Kong, X.; An, Z.; Wu, J.; Kelly, M.; Dykoski, C.; Li, X. The Holocene Asian monsoon: Links to solar changes and North Atlantic climate. Science 2005, 308, 854–857. [Google Scholar] [CrossRef] [PubMed]
- Wang, Y.; Cheng, H.; Edwards, R.; Kong, X.; Shao, X.; Chen, S.; Wu, J.; Jiang, X.; Wang, X.; An, Z. Millennial-and orbital-scale changes in the East Asian monsoon over the past 224,000 years. Nature 2008, 451, 1090–1093. [Google Scholar] [CrossRef]
- Zhang, P.; Cheng, H.; Edwards, R.; Chen, F.; Wang, Y.; Yang, X.; Liu, J.; Tan, M.; Wang, X. A test of climate, sun, and culture relationships from an 1810-year Chinese cave record. Science 2008, 322, 940–942. [Google Scholar] [CrossRef]
- Cheng, H.; Edwards, R.L.; Broecker, W.S.; Denton, G.H.; Kong, X.; Wang, Y.; Zhang, R.; Wang, X. Ice age terminations. Science 2009, 326, 248–252. [Google Scholar] [CrossRef] [PubMed]
- Yuan, D.; Cheng, H.; Edwards, R.; Dykoski, C.; Kelly, M.; Zhang, M.; Qing, J.; Lin, Y.; Wang, Y.; Wu, J. Timing, duration, and transitions of the last interglacial Asian monsoon. Science 2004, 304, 575–577. [Google Scholar] [CrossRef] [PubMed]
- Cai, Y.; Fung, I.Y.; Edwards, R.L.; An, Z.; Cheng, H.; Lee, J.-E.; Tan, L.; Shen, C.-C.; Wang, X.; Day, J.A. Variability of stalagmite-inferred Indian monsoon precipitation over the past 252,000 y. Proc. Natl. Acad. Sci. USA 2015, 112, 2954–2959. [Google Scholar] [CrossRef] [PubMed]
- Zhang, H.; Griffiths, M.L.; Chiang, J.C.; Kong, W.; Wu, S.; Atwood, A.; Huang, J.; Cheng, H.; Ning, Y.; Xie, S. East Asian hydroclimate modulated by the position of the westerlies during Termination I. Science 2018, 362, 580–583. [Google Scholar] [CrossRef] [PubMed]
- Hu, C.; Henderson, G.; Huang, J.; Xie, S.; Sun, Y.; Johnson, K. Quantification of Holocene Asian monsoon rainfall from spatially separated cave records. Earth Planet. Sci. Lett. 2008, 266, 221–232. [Google Scholar] [CrossRef]
- Comas-Bru, L.; Harrison, S.P. SISAL: Bringing added value to speleothem research. Quaternary 2019, 2, 7. [Google Scholar] [CrossRef]
- Comas-Bru, L.; Harrison, S.P.; Werner, M.; Rehfeld, K.; Scroxton, N.; Veiga-Pires, C.; Members, S.W.G. Evaluating model outputs using integrated global speleothem records of climate change since the last glacial. Clim. Past Discuss. 2019, 2019, 1–53. [Google Scholar] [CrossRef]
- Atsawawaranunt, K.; Harrison, S.; Comas Bru, L. SISAL (Speleothem Isotopes Synthesis and Analysis Working Group) Database Version 1.0; University of Reading: Redding, UK, 2018. [Google Scholar] [CrossRef]
- Atsawawaranunt, K.; Comas-Bru, L.; Amirnezhad Mozhdehi, S.; Deininger, M.; Harrison, S.P.; Baker, A.; Boyd, M.; Kaushal, N.; Ahmad, S.M.; Ait Brahim, Y. The SISAL database: A global resource to document oxygen and carbon isotope records from speleothems. Earth Syst. Sci. Data 2018. [Google Scholar] [CrossRef]
- Kaushal, N.; Breitenbach, S.F.; Lechleitner, F.A.; Sinha, A.; Tewari, V.C.; Ahmad, S.M.; Berkelhammer, M.; Band, S.; Yadava, M.; Ramesh, R. The Indian Summer Monsoon from a Speleothem δ18O Perspective—A Review. Quaternary 2018, 1, 29. [Google Scholar] [CrossRef]
- Cheng, H.; Zhang, P.; Spötl, C.; Edwards, R.; Cai, Y.; Zhang, D.; Sang, W.; Tan, M.; An, Z. The climatic cyclicity in semiarid-arid central Asia over the past 500,000 years. Geophys. Res. Lett. 2012, 39. [Google Scholar] [CrossRef]
- Cai, Y.; Chiang, J.C.; Breitenbach, S.F.; Tan, L.; Cheng, H.; Edwards, R.L.; An, Z. Holocene moisture changes in western China, Central Asia, inferred from stalagmites. Quat. Sci. Rev. 2017, 158, 15–28. [Google Scholar] [CrossRef]
- Liu, X.; Rao, Z.; Shen, C.C.; Liu, J.; Chen, J.; Chen, S.; Wang, X.; Chen, F. Holocene solar activity imprint on centennial-to multidecadal-scale hydroclimatic oscillations in arid central Asia. J. Geophys. Res. Atmos. 2019, 124, 2562–2573. [Google Scholar] [CrossRef]
- Cai, Y.; Cheng, H.; An, Z.; Edwards, R.; Wang, X.; Tan, L.; Wang, J. Large variations of oxygen isotopes in precipitation over south-central Tibet during Marine Isotope Stage 5. Geology 2010, 38, 243. [Google Scholar] [CrossRef]
- Cai, Y.; Zhang, H.; Cheng, H.; An, Z.; Edwards, R.L.; Wang, X.; Tan, L.; Liang, F.; Wang, J.; Kelly, M. The Holocene Indian monsoon variability over the Southern Tibetan Plateau and its teleconnections. Earth Planet. Sci. Lett. 2012, 335, 135–144. [Google Scholar] [CrossRef]
- Han, J.; Shao, Z.; Cheng, H.; Meng, X.; Wang, J.; Yu, J.; Yang, C.; Meng, Q.; Xu, B. Climate change since 7ka BP revealed by a high-resolution stalagmite δ18O and δ13C record from Benle Cave in Chamdo, Tibet. Acta Geol. Sin. 2017, 91, 2545–2556. [Google Scholar]
- Bai, Y.; Zhang, P.; Gao, T.; Yu, R.; Zhou, P.; Cheng, H. The 5400 a BP extreme weakening event of the Asian summer monsoon and cultural evolution. Sci. China Earth Sci. 2017, 60, 1171–1182. [Google Scholar] [CrossRef]
- Tan, L.; Cai, Y.; An, Z.; Cheng, H.; Shen, C.-C.; Breitenbach, S.F.; Gao, Y.; Edwards, R.L.; Zhang, H.; Du, Y. A Chinese cave links climate change, social impacts, and human adaptation over the last 500 years. Sci. Rep. 2015, 5, 12284. [Google Scholar] [CrossRef] [PubMed]
- Tan, L.; Shen, C.-C.; Cai, Y.; Cheng, H.; Edwards, R.L. Great flood in the middle-lower Yellow River reaches at 4000 a BP inferred from accurately-dated stalagmite records. Sci. Bull. 2018, 63, 206–208. [Google Scholar] [CrossRef]
- Chen, Z.; Auler, A.S.; Bakalowicz, M.; Drew, D.; Griger, F.; Hartmann, J.; Jiang, G.; Moosdorf, N.; Richts, A.; Stevanovic, Z. The World Karst Aquifer Mapping project: Concept, mapping procedure and map of Europe. Hydrogeol. J. 2017, 25, 771–785. [Google Scholar] [CrossRef]
- Ding, Y.; Chan, J.C. The East Asian summer monsoon: An overview. Meteorol. Atmos. Phys. 2005, 89, 117–142. [Google Scholar]
- Wang, B.; Lin, H. Rainy season of the Asian–Pacific summer monsoon. J. Clim. 2002, 15, 386–398. [Google Scholar] [CrossRef]
- Tao, S.Y.; Chen, L. A review of recent research on the East Asian summer monsoon in China. In Monsoon Meteorology; Chang, C., Krishnamurti, T., Eds.; Oxford University Press: London, UK, 1987; pp. 60–92. [Google Scholar]
- Chiang, J.C.; Fung, I.Y.; Wu, C.-H.; Cai, Y.; Edman, J.P.; Liu, Y.; Day, J.A.; Bhattacharya, T.; Mondal, Y.; Labrousse, C.A. Role of seasonal transitions and westerly jets in East Asian paleoclimate. Quat. Sci. Rev. 2015, 108, 111–129. [Google Scholar] [CrossRef]
- Kong, W.; Swenson, L.M.; Chiang, J.C. Seasonal transitions and the westerly jet in the Holocene East Asian summer monsoon. J. Clim. 2017, 30, 3343–3365. [Google Scholar] [CrossRef]
- Li, Y.; Morrill, C. A Holocene East Asian winter monsoon record at the southern edge of the Gobi Desert and its comparison with a transient simulation. Clim. Dyn. 2015, 45, 1219–1234. [Google Scholar] [CrossRef]
- Kurita, N.; Yoshida, N.; Inoue, G.; Chayanova, E.A. Modern isotope climatology of Russia: A first assessment. J. Geophys. Res. Atmos. 2004, 109. [Google Scholar] [CrossRef]
- Becker, A.; Finger, P.; Meyer-Christoffer, A.; Rudolf, B.; Ziese, M. GPCC full data reanalysis version 6.0 at 1.0°: Monthly land-surface precipitation from rain-gauges built on GTS-based and historic data. Glob. Precip. Climatol. Cent. (Gpcc) Berl. Ger. 2011. [Google Scholar] [CrossRef]
- Rienecker, M.M.; Suarez, M.J.; Gelaro, R.; Todling, R.; Bacmeister, J.; Liu, E.; Bosilovich, M.G.; Schubert, S.D.; Takacs, L.; Kim, G.-K. MERRA: NASA’s modern-era retrospective analysis for research and applications. J. Clim. 2011, 24, 3624–3648. [Google Scholar] [CrossRef]
- Chen, F.-H.; Chen, J.-H.; Holmes, J.; Boomer, I.; Austin, P.; Gates, J.B.; Wang, N.-L.; Brooks, S.J.; Zhang, J.-W. Moisture changes over the last millennium in arid central Asia: A review, synthesis and comparison with monsoon region. Quat. Sci. Rev. 2010, 29, 1055–1068. [Google Scholar] [CrossRef]
- Wu, J.; Wang, Y.; Kong, X. Evolution and abrupt changes of the Holocene Asian monsoon climate recorded by stalagmite in Baigu Cave in Guizhou. Mar. Geol. Quat. Geol. 2006, 26, 55–60. [Google Scholar]
- Jiang, X.; He, Y.; Shen, C.-C.; Li, Z.; Lin, K. Replicated stalagmite-inferred centennial-to decadal-scale monsoon precipitation variability in southwest China since the mid Holocene. Holocene 2013, 23, 841–849. [Google Scholar] [CrossRef]
- Zhao, K.; Wang, Y.; Edwards, R.L.; Cheng, H.; Liu, D. High-resolution stalagmite δ18O records of Asian monsoon changes in central and Southern China spanning the MIS 3/2 transition. Earth Planet. Sci. Lett. 2010, 298, 191–198. [Google Scholar] [CrossRef]
- Tan, L.; Cai, Y.; Cheng, H.; An, Z.; Edwards, R.L. Summer monsoon precipitation variations in central China over the past 750 years derived from a high-resolution absolute-dated stalagmite. Palaeogeogr. Palaeoclimatol. Palaeoecol. 2009, 280, 432–439. [Google Scholar] [CrossRef]
- Dykoski, C.A.; Edwards, R.L.; Cheng, H.; Yuan, D.; Cai, Y.; Zhang, M.; Lin, Y.; Qing, J.; An, Z.; Revenaugh, J. A high-resolution, absolute-dated Holocene and deglacial Asian monsoon record from Dongge Cave, China. Earth Planet. Sci. Lett. 2005, 233, 71–86. [Google Scholar] [CrossRef]
- Zhao, K.; Wang, Y.; Edwards, R.L.; Cheng, H.; Liu, D.; Kong, X. A high-resolved record of the Asian Summer Monsoon from Dongge Cave, China for the past 1200 years. Quat. Sci. Rev. 2015, 122, 250–257. [Google Scholar] [CrossRef]
- Duan, F.; Wang, Y.; Shen, C.-C.; Wang, Y.; Cheng, H.; Wu, C.-C.; Hu, H.-M.; Kong, X.; Liu, D.; Zhao, K. Evidence for solar cycles in a late Holocene speleothem record from Dongge Cave, China. Sci. Rep. 2014, 4, 5159. [Google Scholar] [CrossRef] [PubMed]
- He, Y.; Wang, Y.; Kong, X.; Cheng, H. High resolution stalagmite δ18O records over the past 1000 years from Dongge Cave in Guizhou. Chin. Sci. Bull. 2005, 50, 1003. [Google Scholar] [CrossRef]
- Zhu, X.; Zhang, M.; Lin, Y.; Qin, J.; Yang, Y. Carbon isotopic records from stalagmites and the signification of paleo-ecological environment in the area of Guangxi—Guizhou, China. Environ. Geol. 2006, 51, 267–273. [Google Scholar] [CrossRef]
- Zhao, J.; Cheng, H.; Yang, Y.; Tan, L.; Spötl, C.; Ning, Y.; Zhang, H.; Cheng, X.; Sun, Z.; Li, X. Reconstructing the western boundary variability of the Western Pacific Subtropical High over the past 200 years via Chinese cave oxygen isotope records. Clim. Dyn. 2019, 52, 3741–3757. [Google Scholar] [CrossRef]
- Zhang, N.; Yang, Y.; Cheng, H.; Zhao, J.; Yang, X.; Liang, S.; Nie, X.; Zhang, Y.; Edwards, R.L. Timing and duration of the East Asian summer monsoon maximum during the Holocene based on stalagmite data from North China. Holocene 2018, 28, 1631–1641. [Google Scholar] [CrossRef]
- Dong, J.; Shen, C.-C.; Kong, X.; Wang, Y.; Duan, F. Asian monsoon dynamics at Dansgaard/Oeschger events 14–8 and Heinrich events 5–4 in Northern China. Quat. Geochronol. 2018, 47, 72–80. [Google Scholar] [CrossRef]
- Wan, N.; Chung, W.; Li, H.-C.; Lin, H.; Ku, T.-L.; Shen, C.-C.; Yuan, D.; Zhang, M.; Lin, Y. Comparison of speleothem δ18O records from eastern China with solar insolation, ice core and marine records: Similarities and discrepancies on different time scales. J. Asian Earth Sci. 2011, 40, 1151–1163. [Google Scholar] [CrossRef]
- Zhang, H.; Cheng, H.; Spötl, C.; Cai, Y.; Sinha, A.; Tan, L.; Yi, L.; Yan, H.; Kathayat, G.; Ning, Y.; et al. A 200-year annually laminated stalagmite record of precipitation seasonality in southeastern China and its linkages to ENSO and PDO. Sci. Rep. 2018, 8, 12344. [Google Scholar] [CrossRef] [PubMed]
- Li, H.-C.; Bar-Matthews, M.; Chang, Y.-P.; Ayalon, A.; Yuan, D.-X.; Zhang, M.-L.; Lone, M.A. High-resolution δ18O and δ13C records during the past 65 ka from Fengyu Cave in Guilin: Variation of monsoonal climates in south China. Quat. Int. 2017, 441, 117–128. [Google Scholar] [CrossRef]
- Li, T.-Y.; Shen, C.-C.; Li, H.-C.; Li, J.-Y.; Chiang, H.-W.; Song, S.-R.; Yuan, D.-X.; Lin, C.D.-J.; Gao, P.; Zhou, L. Oxygen and carbon isotopic systematics of aragonite speleothems and water in Furong Cave, Chongqing, China. Geochim. Cosmochim. Acta 2011, 75, 4140–4156. [Google Scholar] [CrossRef]
- Li, H.-C.; Lee, Z.-H.; Wan, N.-J.; Shen, C.-C.; Li, T.-Y.; Yuan, D.-X.; Chen, Y.-H. The δ18O and δ13C records in an aragonite stalagmite from Furong Cave, Chongqing, China: A-2000-year record of monsoonal climate. J. Asian Earth Sci. 2011, 40, 1121–1130. [Google Scholar] [CrossRef]
- Zhang, H.; Griffiths, M.L.; Huang, J.; Cai, Y.; Wang, C.; Zhang, F.; Cheng, H.; Ning, Y.; Hu, C.; Xie, S. Antarctic link with East Asian summer monsoon variability during the Heinrich Stadial–Bølling interstadial transition. Earth Planet. Sci. Lett. 2016, 453, 243–251. [Google Scholar] [CrossRef]
- Jiang, W.; Zhao, K.; Chen, S.; Wang, Y.; Cheng, H.; Ning, Y. Decadal climate oscillations during the Little Ice Age of stalagmite record from Heizhugou Cave, Sichuan. Quat. Sci. 2017, 37, 118–129. [Google Scholar]
- Cui, Y.; Wang, Y.; Cheng, H.; Zhao, K.; Kong, X. Isotopic and lithologic variations of one precisely-dated stalagmite across the Medieval/LIA period from Heilong Cave, central China. Clim. Past 2012, 8, 1541–1550. [Google Scholar] [CrossRef]
- Liu, Y.; Henderson, G.; Hu, C.; Mason, A.; Charnley, N.; Johnson, K.; Xie, S. Links between the East Asian monsoon and North Atlantic climate during the 8200 year event. Nat. Geosci. 2013, 6, 117–120. [Google Scholar] [CrossRef]
- Yang, X.; Zhang, P.; Chen, F.; Huh, C.; Li, H.; Cheng, H.; Johnson, K.R.; Liu, J.; An, C. Modern stalagmite oxygen isotopic composition and its implications of climatic change from a high-elevation cave in the eastern Qinghai-Tibet Plateau over the past 50 years. Chin. Sci. Bull. 2007, 52, 1238–1247. [Google Scholar] [CrossRef][Green Version]
- Tan, L.; Cai, Y.; An, Z.; Edwards, R.L.; Cheng, H.; Shen, C.C.; Zhang, H. Centennial-to decadal-scale monsoon precipitation variability in the semi-humid region, Northern China during the last 1860 years: Records from stalagmites in Huangye Cave. Holocene 2010, 21, 287–296. [Google Scholar]
- Cheng, H.; Edwards, R.L.; Southon, J.; Matsumoto, K.; Feinberg, J.M.; Sinha, A.; Zhou, W.; Li, H.; Li, X.; Xu, Y. Atmospheric 14C/12C changes during the last glacial period from Hulu Cave. Science 2018, 362, 1293–1297. [Google Scholar] [CrossRef] [PubMed]
- Wang, Y.; Wu, J.; Liu, D.; Wu, J.; Cai, Y.; Cheng, H. A quick cooling event of the East Asian monsoon responding to heinrich event 1: Evidence from stalagmite δ18O records. Sci. China Ser. D Earth Sci. 2002, 45, 88. [Google Scholar] [CrossRef]
- Kong, X.; Wang, Y.; Wu, J.; Cheng, H. A continuous 3000-year precipitation record of ENSO variability during LGM from a stalagmite in Nanjing. Chin. Sci. Bull. 2003, 48, 480–484. [Google Scholar] [CrossRef]
- Zhang, W.; Wang, Y.; Wu, J.; Duan, F. Last deglacial climate variations inferred from trace elements in a stalagmite from Hulu Cave, Nanjing. Quat. Sci. 2014, 34, 1227–1237. [Google Scholar]
- Wu, J.; Wang, Y.; Cheng, H.; Edwards, R.L. An exceptionally strengthened East Asian summer monsoon event between 19.9 and 17.1 ka BP recorded in a Hulu stalagmite. Sci. China Ser. D Earth Sci. 2009, 52, 360–368. [Google Scholar] [CrossRef]
- Wang, Q.; Wang, Y.; Shao, Q.; Liang, Y.; Zhang, Z.; Kong, X. Millennial-scale Asian monsoon variability during the late Marine Isotope Stage 6 from Hulu Cave, China. Quat. Res. 2018, 90, 394–405. [Google Scholar] [CrossRef]
- Cheng, H.; Edwards, R.; Wang, Y.; Kong, X.; Ming, Y.; Kelly, M.; Wang, X.; Gallup, C.; Liu, W. A penultimate glacial monsoon record from Hulu Cave and two-phase glacial terminations. Geology 2006, 34, 217. [Google Scholar] [CrossRef]
- Duan, F.; Wu, J.; Wang, Y.; Edwards, R.L.; Cheng, H.; Kong, X.; Zhang, W. A 3000-yr annually laminated stalagmite record of the Last Glacial Maximum from Hulu Cave, China. Quat. Res. 2015, 83, 360–369. [Google Scholar] [CrossRef]
- Wu, J.; Shao, X.; Kong, X.; Wang, Y. Imprint of solar activity on Nanjing stalagmite annual layer thickness sequence during the Last Glacial Maximum. Chin. Sci. Bull. 2006, 51, 441–447. [Google Scholar] [CrossRef]
- Xia, Z.; Wang, Y.; Wu, J. The Evolution of ENSO during LGM from Precipitation Record in Nanjing. J. Nanjing Norm. Univ. (Nat. Sci.) 2006, 29, 106–110. [Google Scholar]
- Cosford, J.; Qing, H.; Lin, Y.; Eglington, B.; Mattey, D.; Chen, Y.G.; Zhang, M.; Cheng, H. The East Asian monsoon during MIS 2 expressed in a speleothem δ18O record from Jintanwan Cave, Hunan, China. Quat. Res. 2010, 73, 541–549. [Google Scholar] [CrossRef]
- Cai, Y.; Tan, L.; Cheng, H.; An, Z.; Edwards, R.L.; Kelly, M.J.; Kong, X.; Wang, X. The variation of summer monsoon precipitation in central China since the last deglaciation. Earth Planet. Sci. Lett. 2010, 291, 21–31. [Google Scholar] [CrossRef]
- Wang, Q.; Zhou, H.; Cheng, K.; Chi, H.; Shen, C.-C.; Wang, C.; Ma, Q. The climate reconstruction in Shandong Peninsula, Northern China, during the last millennium based on stalagmite laminae together with a comparison to δ18O. Clim. Past 2016, 12, 871–881. [Google Scholar] [CrossRef]
- Ma, Z.-B.; Cheng, H.; Tan, M.; Edwards, R.L.; Li, H.-C.; You, C.-F.; Duan, W.-H.; Wang, X.; Kelly, M.J. Timing and structure of the Younger Dryas event in Northern China. Quat. Sci. Rev. 2012, 41, 83–93. [Google Scholar] [CrossRef]
- Duan, W.; Tan, M.; Ma, Z.; Cheng, H. The palaeoenvironmental significance of δ13C of stalagmite BW-1 from Beijing, China during Younger D ryas intervals inferred from the grey level profile. Boreas 2014, 43, 243–250. [Google Scholar] [CrossRef]
- Li, S.; Yang, Y.; Li, T.; Ma, R.; Guo, Y. Asian Monsoonal Climate Variability at Orbital Scales during the MIS8—MIS9: Based on Stalagmite Data from Laomu Cave, Henan Province, China. Geol. Rev. 2011, 57, 754–760. [Google Scholar]
- Yin, J.-J.; Yuan, D.-X.; Li, H.-C.; Cheng, H.; Li, T.-Y.; Edwards, R.; Lin, Y.-S.; Qin, J.-M.; Tang, W.; Zhao, Z.-Y. Variation in the Asian monsoon intensity and dry-wet conditions since the Little Ice Age in central China revealed by an aragonite stalagmite. Clim. Past 2014, 10, 1803–1816. [Google Scholar] [CrossRef]
- Zhang, H.-L.; Yu, K.-F.; Zhao, J.-X.; Feng, Y.-X.; Lin, Y.-S.; Zhou, W.; Liu, G.-H. East Asian Summer Monsoon variations in the past 12.5 ka: High-resolution δ18O record from a precisely dated aragonite stalagmite in central China. J. Asian Earth Sci. 2013, 73, 162–175. [Google Scholar] [CrossRef]
- Dong, J.; Shen, C.-C.; Kong, X.; Wang, H.-C.; Jiang, X. Reconciliation of hydroclimate sequences from the Chinese Loess Plateau and low-latitude East Asian Summer Monsoon regions over the past 14,500 years. Palaeogeogr. Palaeoclimatol. Palaeoecol. 2015, 435, 127–135. [Google Scholar] [CrossRef]
- Li, Q.; Li, G.; Chen, M.-T.; Cheng, H.; Xu, J.; Ding, D.; Ma, Y.; Qiao, L.; Zhang, Q.; Zhang, Y. East Asian summer monsoon variations during the last deglaciation, recorded from a stalagmite at Linyi, Northern China. Quat. Int. 2017, 464, 327–335. [Google Scholar] [CrossRef]
- Zhao, C.; Wang, Z.; Tao, K.; Wang, J.; Lin, Y.; Zhang, M. Reconstruction of the Paleoclimate and Paleoenvironment of a Stalagmite from Longuan Cave, Guizhou between 1600~250 a. 2004, 26, 209–2014. [Google Scholar]
- Wang, L.; Zhao, K.; Huang, W.; Zhang, W.; Shao, Q.; Wang, Y. Centennial-scale monsoon failure during the Younger Dryas event record in a high-resolution stalagmite from Longfugong Cave, central China. J. Nanjing Norm. Univ. (Nat. Sci.) 2017, 40, 134–143. [Google Scholar]
- Mao, R.; Cai, Y.; Ma, L.; Cheng, X. Early to mid-Holocene paleoclimatic changes recorded by the stalagmites from the Madou Cave, Henan Provience. J. Earth Environ. 2016, 7, 254–268. [Google Scholar]
- Yin, J.; Tng, W. The Relationship between Local Climate/Large Scale Circulation and δ18O Recorded by Stalagmite in the Past 50 Years from Maomaotou Big Cave, Guilin. Acta Geol. Sin. 2016, 90, 2035–2042. [Google Scholar]
- Zhao, K.; Wang, Y.; Edwards, R.L.; Cheng, H.; Liu, D.; Kong, X.; Ning, Y. Contribution of ENSO variability to the East Asian summer monsoon in the late Holocene. Palaeogeogr. Palaeoclimatol. Palaeoecol. 2016, 449, 510–519. [Google Scholar] [CrossRef]
- Wu, J.; Wang, Y.; Dong, J. Changes in East Asian summer monsoon during the Holocene recorded by stalagmite δ18O records from Liaoning province. Quat. Sci. 2011, 31, 990–998. [Google Scholar]
- Zhang, W.; Wu, J. Ecological response of δ13C to Holocene climate changes from stalagmite record in Nuanhe Cave, Liaoning. Mar. Geol. Quat. Geol. 2012, 32, 147–154. [Google Scholar] [CrossRef]
- Dong, J. Summer monsoon precipitation variations and abrupt climate events during the 3000 years: Records from stalagmites in China. J. Arid Land Resour. Environ. 2012, 26, 36–41. [Google Scholar]
- Gu, N.; Wu, J. Paleoclimate significance of δ13C in stalagmite from Nuanhe Cave, Liaoning. Carsologica Sin. 2012, 31, 107–114. [Google Scholar]
- Guo, Y.; Wu, J.; Wang, Y.; Dong, J. Early Holocene laminated stalagmite records from Nunehe Cave, Benxi, China. Mar. Geol. Quat. Geol. 2012, 32, 135–141. [Google Scholar] [CrossRef]
- Qin, J.; Yuan, D.; Lin, Y.; Zhang, M.; Li, B. Isotopic records of stalagmites from Guilin since 44 ka BP and their environmental interpretation. Acta Geosci. Sin. 2000, 21, 407–416. [Google Scholar]
- Li, M.; Wang, Y.; Qiu, Q. High Resolution Stalagmite Records of East Asian Monsoon from 7 to 6 ka BP in Mid-Holocene. Sci. Geogr. Sin. 2007, 27, 519–524. [Google Scholar]
- Liang, Y.; Kong, X.; Wang, Y. The relationship between annual laminae and stable isotopes in two stalagmites in Shennongjia, Hubei. Carsologica Sin. 2008, 27, 371–376. [Google Scholar]
- Xie, Y.; Wang, Y.; Jiang, X. Decadal-scale climate change of east asian monsoon during the Last Glacial Maximum from stalagimte record. Mar. Geol. Quat. Geol. 2008, 28, 43–49. [Google Scholar]
- Zhang, W.; Wu, J.; Wang, Y.; Wang, Y.; Cheng, H.; Kong, X.; Duan, F. A detailed East Asian monsoon history surrounding the ‘Mystery Interval’derived from three Chinese speleothem records. Quat. Res. 2014, 82, 154–163. [Google Scholar] [CrossRef]
- Liu, D.; Wang, Y.; Cheng, H.; Edwards, R.; Kong, X.; Wang, X.; Wu, J. A detailed comparison of Asian Monsoon intensity and Greenland temperature during the Aller d and Younger Dryas events. Earth Planet. Sci. Lett. 2008, 272, 691–697. [Google Scholar] [CrossRef]
- Liu, D.; Wang, Y.; Cheng, H.; Kong, X.; Chen, S. Centennial-scale Asian monsoon variability during the mid-Younger Dryas from Qingtian Cave, central China. Quat. Res. 2013, 80, 199–206. [Google Scholar] [CrossRef]
- Wang, Q.; Liu, D.; Wang, Y.; Deng, C. Transitional patterns of YD and 8.2 ka event recorded by annually-laminated stalagmites from Qingtian Cave, Mt. Shennongjia. Acta Sedimentol. Sin. 2015, 33, 1140–1148. [Google Scholar]
- Zhang, Z.; Liu, D.; Wang, Y.; Wagn, Q. Annual-to decadal-scale variability of Asian monsoon climates during Mid-Holocene: Evidence from proxies of annual bands and geochemical behaviors of a speleothem from 5.56 ka BP to 4.84 ka BP in Qingtian Cave, central China. Quat. Sci. 2014, 34, 1246–1255. [Google Scholar]
- Wang, Q.; Wang, Y.; Liu, D.; Zhao, K.; Shao, Q.; Cheng, H.; Huang, W. The DO3 event in Asian monsoon climates evidenced by an annually laminated stalagmite from Qingtian Cave, Mt. Shennongjia. Quat. Sci. 2017, 37, 108–117. [Google Scholar]
- Qiu, Q.; Wang, Y. The characteristics of climatic transition from Allerød to early Younger Dryas. Mar. Geol. Quat. Geol. 2007, 27, 107–112. [Google Scholar]
- Liu, D.; Wang, Y.; Cheng, H.; Edwards, R.; Kong, X. Cyclic changes of Asian monsoon intensity during the early mid-Holocene from annually-laminated stalagmites, central China. Quat. Sci. Rev. 2015, 121, 1–10. [Google Scholar] [CrossRef]
- Deng, C.; Wang, Y.; Liu, D.; Zhang, Z. The Asian monsoon variability around 8.2 ka recorded by an annually-laminated stalagmite from Mt. Shennongjia, central China. Quat. Sci. 2013, 33, 945–953. [Google Scholar]
- Liu, D.; Wang, Y.; Cheng, H.; Edwards, R.; Kong, X.; Chen, S.; Liu, S. Contrasting patterns in abrupt Asian summer monsoon changes in the last glacial period and the Holocene. Paleoceanogr. Paleoclimatol. 2018. [Google Scholar] [CrossRef]
- Cai, Y.; Peng, Z.; An, Z.; Zhang, Z.; Cao, Y. The δ18O variation of a stalagmite from Qixing Cave, Guizhou Province and indicated climate change during the Holocene. Chin. Sci. Bull. 2001, 46, 1904–1908. [Google Scholar] [CrossRef]
- Ma, L.; Cai, Y.; Qin, S. A high resolution paleoclimate record of the last 2300 years in stalagmite QX-3 from the Qixing Cave, Guizhou Province. J. Earth Environ. 2015, 6, 135–144. [Google Scholar]
- Qin, J.; Lin, Y.; Zhang, M.; Wang, H.; Feng, Y.; Tu, L. Change of the East-Asian monsoon climate during the Last Glaciation: δ18O record of stalagmites in Qixing Cave, Duyun city, Guizhou Province. Carsologica Sin. 2003, 22, 167–173. [Google Scholar]
- Qin, J.; Yuan, D.; Cheng, H.; Lin, Y.; Zhang, M.; Zhang, C.; Wang, F.; Wang, H.; Feng, Y.; Tu, L. A millennial scale climatic changes of eastern Asian monsoon in the past 250,000 years in Guizhou and Guangxi, China. Carsologica Sin. 2004, 23, 261–266. [Google Scholar]
- Zhang, Z.-Q.; Wang, Y.-J.; Liu, D.-B.; Cheng, H.; Huang, W.; Wang, Q.; Liang, Y.-J. Multi-scale variability of the Asian monsoon recorded in an annually-banded stalagmite during the Neoglacial from Qixing Cave, Southwestern China. Quat. Int. 2018, 487, 78–86. [Google Scholar] [CrossRef]
- Dong, J.; Wang, Y.; Cheng, H. A high-resolution stalagmite record of the Holocene East Asian monsoon from Mt Shennongjia, central China. Holocene 2010, 20, 257–264. [Google Scholar] [CrossRef]
- Shao, X.; Wang, Y.; Cheng, H.; Kong, X.; Wu, J.; Edwards, R.L. Long-term trend and abrupt events of the Holocene Asian monsoon inferred from a stalagmite δ18O record from Shennongjia in Central China. Chin. Sci. Bull. 2006, 51, 221–228. [Google Scholar] [CrossRef]
- Dong, J.; Diao, W.; Kong, X. Variation in uranium isotopes of stalagmites from Sanbao Cave, Hubei province: Implications for palaeoclimate. Mar. Geol. Quat. Geol. 2013, 33, 129–135. [Google Scholar] [CrossRef]
- Dong, J.; Kong, X.; Wang, Y. The East Asian monsoon clilmate changes at Mt. Shennongjia and its relation to shift of Intertropical Convergence Zone during the Holocene. Quat. Sci. 2006, 827–834. [Google Scholar]
- Xia, Z.; Kong, X.; Jiang, X.; Cheng, H. Precise dating of East-Asian-Monsoon D/O events during 95–56 ka BP: Based on stalagmite data from Shanbao Cave at Shennongjia, China. Sci. China Ser. D Earth Sci. 2007, 50, 228–235. [Google Scholar] [CrossRef]
- Jiang, X.; Kong, X.; Wang, Y.; Cheng, H.; Wu, J.; Chen, S. Orbital-and millennial-scale variability of the Asian monsoon during MIS8 from Sanbao Cave at Mount Shennongjia, central China. Chin. Sci. Bull. 2010, 55, 1041–1046. [Google Scholar] [CrossRef]
- Jiang, X.; Wang, X.; He, Y.; Hu, H.-M.; Li, Z.; Spötl, C.; Shen, C.-C. Precisely dated multidecadally resolved Asian summer monsoon dynamics 113.5–86.6 thousand years ago. Quat. Sci. Rev. 143, 1–12. [CrossRef]
- Jiang, X.; He, Y.; Shen, C.-C.; Lee, S.-Y.; Yang, B.; Lin, K.; Li, Z. Decoupling of the East Asian summer monsoon and Indian summer monsoon between 20 and 17 ka. Quat. Res. 2014, 82, 146–153. [Google Scholar] [CrossRef]
- Jiang, X.; He, Y.; Wang, X.; Dong, J.; Li, Z.; Lone, M.A.; Shen, C.-C. Sub-decadally-resolved Asian monsoon dynamics during Chinese interstadial 21 in response to northern high-latitude climate. J. Asian Earth Sci. 2018, 172, 243–248. [Google Scholar] [CrossRef]
- Zhang, H.; Cheng, H.; Cai, Y.; Spötl, C.; Kathayat, G.; Sinha, A.; Edwards, R.L.; Tan, L. Hydroclimatic variations in southeastern China during the 4.2 ka event reflected by stalagmite records. Clim. Past 2018, 14, 1805–1817. [Google Scholar] [CrossRef]
- Zhang, H.; Cai, Y.; Tan, L.; Cheng, H.; Qin, S.; An, Z.; Edwards, R.L.; Ma, L. Large variations of δ13C values in stalagmites from southeastern China during historical times: Implications for anthropogenic deforestation. Boreas 2015, 44, 511–525. [Google Scholar] [CrossRef]
- Zhang, H.; Cai, Y.; Tan, L.; Qin, S.; An, Z. Stable isotope composition alteration produced by the aragonite-to-calcite transformation in speleothems and implications for paleoclimate reconstructions. Sediment. Geol. 2014, 309, 1–14. [Google Scholar] [CrossRef]
- Jiang, X.; He, Y.; Shen, C.; Kong, X.; Li, Z.; Chang, Y. Stalagmite-inferred Holocene precipitation in Northern Guizhou Province, China, and asynchronous termination of the Climatic Optimum in the Asian monsoon territory. Chin. Sci. Bull. 2012, 57, 795–801. [Google Scholar] [CrossRef]
- Yang, B.; Lei, G.; Jiang, X. 9.9~4.2 ka BP stalagmite trace elements records from Shigao Cave, Northern Guizhou province and its environmental significance. Mar. Geol. Quat. Geol. 2014, 34, 143–148. [Google Scholar]
- Tan, M.; Liu, T.; Hou, J.; Qin, X.; Zhang, H.; Li, T. Cyclic rapid warming on centennial-scale revealed by a 2650-year stalagmite record of warm season temperature. Geophys. Res. Lett. 2003, 30, 1617–1620. [Google Scholar] [CrossRef]
- Li, X.; Cheng, H.; Tan, L.; Ban, F.; Sinha, A.; Duan, W.; Li, H.; Zhang, H.; Ning, Y.; Kathayat, G. The East Asian summer monsoon variability over the last 145 years inferred from the Shihua Cave record, North China. Sci. Rep. 2017, 7, 7078. [Google Scholar] [CrossRef] [PubMed]
- Li, H.; Gu, D.; Ku, T.; Stott, L.; Chen, W. Applications of interannual-resolution stable isotope records of speleothem: Climatic changes in Beijing and Tianjin, China during the past 500 years—The δ18O record. Sci. China Ser. D Earth Sci. 1998, 41, 362–368. [Google Scholar] [CrossRef]
- Hou, J.; Tan, M.; Cheng, H.; Liu, T. Stable isotope records of plant cover change and monsoon variation in the past 2200 years: Evidence from laminated stalagmites in Beijing, China. Boreas 2003, 32, 304–313. [Google Scholar] [CrossRef]
- Huang, J.; Chen, L.; Chen, Q.; Liu, S.; Yang, L.; Mi, X.; Deng, X.; Peng, X.; Li, H.; Zhou, H. The high-resolution speleothem δ13C record during 54~46 ka from the Shizi Cave in NE Sichuan, Central China and influencing factors. Geochimica 2016, 4, 8. [Google Scholar]
- Zhou, H.; Zhao, J.; Qing, W.; Feng, Y.; Tang, J. Speleothem-derived Asian summer monsoon variations in Central China, 54–46 ka. J. Quat. Sci. 2011, 26, 781–790. [Google Scholar] [CrossRef]
- Zhang, M.; Lin, Y. Ages and stable isotopic measurements of No.1 stalagmite from Shuihan Cave in Guilin and their paleoclimatic inplications. Geol. Geochem. 2000, 28, 41–47. [Google Scholar]
- Hou, J.; Tan, M.; Liu, D. Counting chronology and climate records with about 1000 annual layers of a Holocene stalagmite from the Water Cave in Liaoning Province, Chinaannual layers of a Holocene stalagmite from the Water Cave in Liaoning Province, China. Sci. China Ser. D Earth Sci. 2002, 45, 385–391. [Google Scholar] [CrossRef]
- Liu, S.; Yang, L.; Huang, J.; Chen, L.; Chen, Q.; Mi, X.; He, H.; Zhou, H. A high-resolution speleothem δ13C record from Songjia Cave in NE Sichuan, Central China and D/O event 5 to 10. Geochimica 2015, 44, 413–420. [Google Scholar]
- Cao, Y.; Li, J.; Tang, J. Abrupt change analyses of oxygen, carbon isotope values and Sr contents in a stalagmite retrieved from Songjia Cave, NE Sichuan. J. Anqing Teach. Coll. (Nat. Sci. Ed.) 2012, 18, 88–90, 103. [Google Scholar]
- Tang, J.; Cao, Y.; Zhou, H. Periodicity analyses of oxygen and carbon isotopes of a stalagmite retrieved from Songjia Cave, NE Sichuan in Central China. J. Anqing Teach. Coll. (Nat. Sci. Ed.) 2012, 18, 91–92, 97. [Google Scholar]
- Mi, X.; Liu, S.; Chen, Q.; Zhao, J.; Zhou, H. High-resolution paleoclimate records of MIS9 in northeastern Sichuan, Central China. Mar. Geol. Quat. Geol. 2017, 37, 102–106. [Google Scholar]
- Zhou, H.; Zhao, J.; Feng, Y.; Gagan, M.K.; Zhou, G.; Yan, J. Distinct climate change synchronous with Heinrich event one, recorded by stable oxygen and carbon isotopic compositions in stalagmites from China. Quat. Res. 2008, 69, 306–315. [Google Scholar] [CrossRef]
- Liu, S.; Huang, J.; Chen, L.; Yang, L.; Chen, Q.; Mi, X.; He, H.; Deng, X.; Li, H.; Zhou, H. A Speleothem δ13C Record and Control Mechanism during 120~103ka BP from NE Sichuan, Central China. Acta Geol. Sin. 2016, 90, 334–340. [Google Scholar]
- Zhao, J.X.; Wang, Y.J.; Collerson, K.D.; Gagan, M.K. Speleothem U-series dating of semi-synchronous climate oscillations during the last deglaciation. Earth Planet. Sci. Lett. 2003, 216, 155–161. [Google Scholar] [CrossRef]
- Jiang, X.; Li, Z.; Shen, C.; Li, J. 2100~590 aBP stalagmite stable isotope records from Tian’e cave and their regional climate significance. Mar. Geol. Quat. Geol. 2011, 3, 019. [Google Scholar] [CrossRef]
- Chen, S.; Wang, Y.; Wu, J.; Liu, D. An event of the East Asian monsoon responding to Heinrich Event 2: Evidence from high-resolution stalagmite record. Geochimica 2006, 35, 586–592. [Google Scholar]
- Liu, D.; Wang, Y.; Chen, S. DO events during 76~58 ka BP from a stalagmite in Tian’e Cave, Shennongjia area. Acta Sedimentol. Sin. 2007, 25, 131–138. [Google Scholar]
- Dong, J.; Zhang, F. The Mid-Holcene climate variation inferred from a dated stalagmite record from Wangjiawei Cave, northeast China. Mar. Geol. Quat. Geol. 2012, 32, 119–125. [Google Scholar] [CrossRef]
- Duan, F.; Liu, D.; Cheng, H.; Wang, X.; Wang, Y.; Kong, X.; Chen, S. A high-resolution monsoon record of millennial-scale oscillations during Late MIS 3 from Wulu Cave, south-west China. J. Quat. Sci. 2014, 29, 83–90. [Google Scholar] [CrossRef]
- Liu, D.; Wang, Y.; Cheng, H.; Edwards, R.L.; Kong, X.; Wang, X.; Hardt, B.; Wu, J.; Chen, S.; Jiang, X. Sub-millennial variability of Asian monsoon intensity during the early MIS 3 and its analogue to the ice age terminations. Quat. Sci. Rev. 2010, 29, 1107–1115. [Google Scholar] [CrossRef]
- Liu, D.; Wang, Y.; Cheng, H.; Edwards, R. High-resolution stalagmite δ13C record of soil processes from southwestern China during the early MIS 3. Chin. Sci. Bull. 2013, 58, 796–802. [Google Scholar] [CrossRef][Green Version]
- Wang, J.; Kong, X.; Cheng, H.; Wang, Y.; Edwards, R.L. Asian summer monsoon record over 61~50 ka BP from two stalagmites from southwestern Guizhou province. Mar. Geol. Quat. Geol. 2008, 28, 85–92. [Google Scholar]
- Tan, L.; An, Z.; Huh, C.-A.; Cai, Y.; Shen, C.-C.; Shiau, L.-J.; Yan, L.; Cheng, H.; Edwards, R.L. Cyclic precipitation variation on the western Loess Plateau of China during the past four centuries. Sci. Rep. 2014, 4, 6381. [Google Scholar] [CrossRef]
- Tan, L.; Cai, Y.; Cheng, H.; Edwards, L.R.; Gao, Y.; Xu, H.; Zhang, H.; An, Z. Centennial-to decadal-scale monsoon precipitation variations in the upper Hanjiang River region, China over the past 6650 years. Earth Planet. Sci. Lett. 2018, 482, 580–590. [Google Scholar] [CrossRef]
- Li, D.; Tan, L.; Cai, Y.; Jiang, X.; Ma, L.; Cheng, H.; Edwards, R.L.; Zhang, H.; Gao, Y.; An, Z. Is Chinese stalagmite δ18O solely controlled by the Indian summer monsoon? Clim. Dyn. 2019. [Google Scholar] [CrossRef]
- Zhang, M.; Yuan, D.X.; Lin, Y.; Qin, J.; Bin, L.; Cheng, H.; Edwards, R.L. A 6000-year high-resolution climatic record from a stalagmite in Xiangshui Cave, Guilin, China. Holocene 2004, 14, 697–702. [Google Scholar] [CrossRef]
- Duan, W.; Cai, B.; Tan, M.; Liu, H.; Zhang, Y. The growth mechanism of the aragonitic stalagmite laminae from Yunnan Xianren Cave, SW China revealed by cave monitoring. Boreas 2012, 41, 113–123. [Google Scholar] [CrossRef]
- Zhang, M.; Qin, J.; Zhang, H.; Cheng, H.; Lin, Y.; Yang, Y.; Edwards, R.L.; Zhu, X. Cooling event in isotope records from a stalagmite during the middle Holcene in Xundian area, Yunnan. Earth Environ. 2005, 33, 16–22. [Google Scholar]
- Zhang, H.; Pu, X. Stalagmite Records of Climate Change and Cold-Dry Events during the Middle Holocene in Xundian, Yunnan. Acta Geosci. Sin. 2011, 32, 95–100. [Google Scholar]
- Zhang, M.; Lin, Y.; Zhu, X.; Qin, J.; Yang, Y.; Luo, G. The records of climatic change from a stalagmite during the late time of the middle Holocene in Ninglang area, Yunnan. Mar. Geol. Quat. Geol. 2006, 26, 35–40. [Google Scholar]
- Che, Y.; Xiao, H.; Cui, M.; Jiang, X.; Cai, B. Timing and structure of the Heinrich 2 abrupt event inferred from a speleothem record from xianyun cave, western Fujian province. Acta Sedimentol. Sin. 2018, 36, 1139–1147. [Google Scholar]
- Cui, M.; Xiao, H.; Sun, X.; Hong, H.; Jiang, X.; Cai, B. Characteristics of the Heinrich 1 abrupt climate event inferred from a speleothem record from Xianyun Cave, Fujian Province. Chin. Sci. Bull. 2017, 62, 3078–3088. [Google Scholar] [CrossRef]
- Cai, Y.; An, Z.; Cheng, H.; Edwards, R.L.; Kelly, M.J.; Liu, W.; Wang, X.; Shen, C.-C. High-resolution absolute-dated Indian Monsoon record between 53 and 36 ka from Xiaobailong Cave, southwestern China. Geology 2006, 34, 621. [Google Scholar] [CrossRef]
- Duan, W.; Cheng, H.; Tan, M.; Edwards, R.L. Onset and duration of transitions into Greenland Interstadials 15.2 and 14 in Northern China constrained by an annually laminated stalagmite. Sci. Rep. 2016, 6, 20844. [Google Scholar] [CrossRef]
- Li, P.; Zhang, M.; Kong, X.; Zhang, C.; Wang, Y.; Zhao, K. A stalagmite record of East Asian summer monsoon in the last 2000 years and its correlation with historical records. Mar. Geol. Quat. Geol. 2010, 30, 201–208. [Google Scholar] [CrossRef]
- Li, T.; Yuan, D.; Li, H.; Yang, Y.; Wang, J.; Wang, X.; Li, Y.; Qin, J.; Zhang, M.; Lin, Y. High-resolution climate variability of southwest China during 57-70 ka reflected in a stalagmite δ18O record from Xinya Cave. Sci. China Ser. D Earth Sci. 2007, 50, 1202–1208. [Google Scholar] [CrossRef]
- Li, J.-Y.; Li, H.-C.; Li, T.-Y.; Mii, H.-S.; Yu, T.-L.; Shen, C.-C.; Xu, X. High-resolution δ18O and δ13C records of an AMS 14C and 230Th/U dated stalagmite from Xinya Cave in Chongqing: Climate and vegetation change during the late Holocene. Quat. Int. 2017, 447, 75–88. [Google Scholar] [CrossRef]
- Yang, Y.; Yuan, D.; Cheng, H.; Zhang, M.; Qin, J.; Lin, Y.; Zhu, X.; Edwards, R.L. Precise dating of abrupt shifts in the Asian Monsoon during the last deglaciation based on stalagmite data from Yamen Cave, Guizhou Province, China. Sci. China Earth Sci. 2010, 53, 633–641. [Google Scholar] [CrossRef]
- Li, T.-Y.; Shen, C.-C.; Huang, L.-J.; Jiang, X.-Y.; Yang, X.-L.; Mii, H.-S.; Lee, S.-Y.; Lo, L. Stalagmite-inferred variability of the Asian summer monsoon during the penultimate glacial-interglacial period. Clim. Past 2014, 10, 1211–1219. [Google Scholar] [CrossRef]
- Han, L.-Y.; Li, T.-Y.; Cheng, H.; Edwards, R.L.; Shen, C.-C.; Li, H.-C.; Huang, C.-X.; Li, J.-Y.; Yuan, N.; Wang, H.-B. Potential influence of temperature changes in the Southern Hemisphere on the evolution of the Asian summer monsoon during the last glacial period. Quat. Int. 2016, 392, 239–250. [Google Scholar] [CrossRef]
- Li, T.-Y.; Han, L.-Y.; Cheng, H.; Edwards, R.L.; Shen, C.-C.; Li, H.-C.; Li, J.-Y.; Huang, C.-X.; Zhang, T.-T.; Zhao, X. Evolution of the Asian summer monsoon during Dansgaard/Oeschger events 13–17 recorded in a stalagmite constrained by high-precision chronology from southwest China. Quat. Res. 2017, 88, 121–128. [Google Scholar] [CrossRef]
- Zhang, T.-T.; Li, T.-Y.; Cheng, H.; Edwards, R.L.; Shen, C.-C.; Spötl, C.; Li, H.-C.; Han, L.-Y.; Li, J.-Y.; Huang, C.-X. Stalagmite-inferred centennial variability of the Asian summer monsoon in southwest China between 58 and 79 ka BP. Quat. Sci. Rev. 2017, 160, 1–12. [Google Scholar] [CrossRef]
- Huang, F.; Yang, X.; Lv, C.H.; Li, C.; Zhang, Y. A high-resolution stalagmite δ13C record about 65-90 ka BP from Yangzi cave Chongqing. Southwest Univ. (Nat. Sci. Ed.) 2014, 36, 166–173. [Google Scholar]
- Sun, X.; Yang, X.; Shi, Z.; Cui, G.; Fang, M.; Wang, B. The evolution of summer monsoon in Southwest China during MIS 4 as revealed by stalagmite δ18O record. Quat. Sci. 2017, 37, 1370–1380. [Google Scholar]
- Zhao, M.; Li, H.-C.; Shen, C.-C.; Kang, S.-C.; Chou, C.-Y. δ18O, δ13C, elemental content and depositional features of a stalagmite from Yelang Cave reflecting climate and vegetation changes since late Pleistocene in central Guizhou, China. Quat. Int. 2016, 452, 102–115. [Google Scholar] [CrossRef]
- Chen, S.; Wang, Y.; Cheng, H.; Edwards, R.L.; Wang, X.; Kong, X.; Liu, D. Strong coupling of Asian Monsoon and Antarctic climates on sub-orbital timescales. Sci. Rep. 2016, 6, 32995. [Google Scholar] [CrossRef] [PubMed]
- Zhao, K.; Chen, S.; Cui, Y.; Wang, Y.; Cheng, H. East Asian monsoon changes and its ENSO response revealed by a 200-year stalagmite record from Yongxing Cave on the Mountain Shengnonjia. Geogr. Res. 2015, 34, 74–84. [Google Scholar]
- Liu, D.; Wang, Y.; Chen, S.; Cheng, H.; Edwards, R.L. Sub-dansgaard-oeschger events of East Asian monsoon and their global significance. Quat. Sci. 2008, 28, 169–176. [Google Scholar]
- Liang, Y.; Chen, S.; Zhang, Z.; Yang, S.; Li, M.; Cheng, H.; Wang, Y. Abrupt monsoonal shifts over the precessional cycles documented in Yongxing Cave in China during the antepenultimate glacial period. Environ. Earth Sci. 2018, 77, 228. [Google Scholar] [CrossRef]
- Jiang, X.; Wang, Y.; Kong, X.; Chen, S.; Li, M.; Cheng, H. Climate Variability in Shennongjia during the Last Interglacial Inferred from a High-resolution Stalagmite Record. Acta Sedimentol. Sin. 2008, 26, 139–143. [Google Scholar]
- Jiang, X.; Li, Z.; Li, J.; Kong, X.; Guo, Y. Stalagmite δ18O record from yunhua cave over the past 500 years and its regional climate significance. Sci. Geogr. Sin. 2012, 32, 207–212. [Google Scholar]
- Huang, W.; Wang, Y.; Cheng, H.; Edwards, R.L.; Shen, C.-C.; Liu, D.; Shao, Q.; Deng, C.; Zhang, Z.; Wang, Q. Multi-Scale Holocene Asian monsoon variability deduced from a twin-stalagmite record in southwestern China. Quat. Res. 2016, 86, 34–44. [Google Scholar] [CrossRef]
- Yin, J.-J.; Li, H.-C.; Rao, Z.-G.; Shen, C.-C.; Mii, H.-S.; Pillutla, R.K.; Hu, H.-M.; Li, Y.-X.; Feng, X. Variations of monsoonal rain and vegetation during the past millennium in Tiangui Mountain, North China reflected by stalagmite δ18O and δ13C records from Zhenzhu Cave. Quat. Int. 2017, 447, 89–101. [Google Scholar] [CrossRef]
- Maher, B.A. Holocene variability of the East Asian summer monsoon from Chinese cave records: A re-assessment. Holocene 2008, 18, 861–866. [Google Scholar] [CrossRef]
- Maher, B.A. Palaeoclimatic records of the loess/palaeosol sequences of the Chinese Loess Plateau. Quat. Sci. Rev. 2016, 154, 23–84. [Google Scholar] [CrossRef]
- Dayem, K.E.; Molnar, P.; Battisti, D.S.; Roe, G.H. Lessons learned from oxygen isotopes in modern precipitation applied to interpretation of speleothem records of paleoclimate from Eastern Asia. Earth Planet. Sci. Lett. 2010, 295, 219–230. [Google Scholar] [CrossRef]
- Clemens, S.C.; Prell, W.L.; Sun, Y. Orbital-scale timing and mechanisms driving Late Pleistocene Indo-Asian summer monsoons: Reinterpreting cave speleothem δ18O. Paleoceanography 2010, 25, PA4207. [Google Scholar] [CrossRef]
- Clemens, S.; Holbourn, A.; Kubota, Y.; Lee, K.; Liu, Z.; Chen, G.; Nelson, A.; Fox-Kemper, B. Precession-band variance missing from East Asian monsoon runoff. Nat. Commun. 2018, 9, 3364. [Google Scholar] [CrossRef] [PubMed]
- Pausata, F.S.; Battisti, D.S.; Nisancioglu, K.H.; Bitz, C.M. Chinese stalagmite δ18O controlled by changes in the Indian monsoon during a simulated Heinrich event. Nat. Geosci. 2011, 4, 474. [Google Scholar] [CrossRef]
- Caley, T.; Roche, D.M.; Renssen, H. Orbital Asian summer monsoon dynamics revealed using an isotope-enabled global climate model. Nat. Commun. 2014, 5, 5371. [Google Scholar] [CrossRef] [PubMed]
- Chen, F.; Xu, Q.; Chen, J.; Birks, H.J.B.; Liu, J.; Zhang, S.; Jin, L.; An, C.; Telford, R.J.; Cao, X. East Asian summer monsoon precipitation variability since the last deglaciation. Sci. Rep. 2015, 5, 11186. [Google Scholar] [CrossRef]
- Liu, J.; Chen, J.; Zhang, X.; Li, Y.; Rao, Z.; Chen, F. Holocene East Asian summer monsoon records in Northern China and their inconsistency with Chinese stalagmite δ18O records. Earth Sci. Rev. 2015, 148, 194–208. [Google Scholar] [CrossRef]
- Rao, Z.; Liu, X.; Hua, H.; Gao, Y.; Chen, F. Evolving history of the East Asian summer monsoon intensity during the MIS5: Inconsistent records from Chinese stalagmites and loess deposits. Environ. Earth Sci. 2015, 73, 3937–3950. [Google Scholar] [CrossRef]
- Kutzbach, J.E. Monsoon Climate of the Early Holocene: Climate Experiment with the Earth’s Orbital Parameters for 9000 Years Ago. Science 1981, 214, 59–61. [Google Scholar] [CrossRef]
- Baker, A.J.; Sodemann, H.; Baldini, J.U.; Breitenbach, S.F.; Johnson, K.R.; Hunen, J.; Zhang, P. Seasonality of westerly moisture transport in the East Asian summer monsoon and its implications for interpreting precipitation δ18O. J. Geophys. Res. Atmos. 2015, 120, 5850–5862. [Google Scholar] [CrossRef]
- Chen, J.; Rao, Z.; Liu, J.; Huang, W.; Feng, S.; Dong, G.; Hu, Y.; Xu, Q.; Chen, F. On the timing of the East Asian summer monsoon maximum during the Holocene—Does the speleothem oxygen isotope record reflect monsoon rainfall variability? Sci. China Earth Sci. 2016, 59, 2328–2338. [Google Scholar] [CrossRef]
- Liu, Z.; Lu, Z.; Wen, X.; Otto-Bliesner, B.; Timmermann, A.; Cobb, K. Evolution and forcing mechanisms of El Niño over the past 21,000 years. Nature 2014, 515, 550–553. [Google Scholar] [CrossRef] [PubMed]
- LeGrande, A.; Schmidt, G. Sources of Holocene variability of oxygen isotopes in paleoclimate archives. Clim. Past 2009, 5, 441–455. [Google Scholar] [CrossRef]
- Cheng, H.; Spötl, C.; Breitenbach, S.F.; Sinha, A.; Wassenburg, J.A.; Jochum, K.P.; Scholz, D.; Li, X.; Yi, L.; Peng, Y. Climate variations of Central Asia on orbital to millennial timescales. Sci. Rep. 2016, 5. [Google Scholar] [CrossRef] [PubMed]
- Li, X.; Liu, X.; Qiu, L.; An, Z.; Yin, Z.Y. Transient simulation of orbital-scale precipitation variation in monsoonal East Asia and arid central Asia during the last 150 ka. J. Geophys. Res. Atmos. 2013, 118, 7481–7488. [Google Scholar] [CrossRef]
- Kutzbach, J.; Liu, X.; Liu, Z.; Chen, G. Simulation of the evolutionary response of global summer monsoons to orbital forcing over the past 280,000 years. Clim. Dyn. 2008, 30, 567–579. [Google Scholar] [CrossRef]
- Liu, J.; Zhang, P.; Cheng, H.; Chen, F.; Yang, X.; Zhang, D.; Zhou, J.; Jia, J.; An, C.; Sang, W.; et al. Asian summer monsoon precipitation recorded by stalagmite oxygen isotopic composition in the western Loess Plateau during AD1875-2003 and its linkage with ocean-atmosphere system. Chin. Sci. Bull. 2008, 53, 2041–2049. [Google Scholar] [CrossRef]
- Tan, L.; Cai, Y.; An, Z.; Cheng, H.; Shen, C.-C.; Gao, Y.; Edwards, R.L. Decreasing monsoon precipitation in southwest China during the last 240 years associated with the warming of tropical ocean. Clim. Dyn. 2017, 48, 1769–1778. [Google Scholar] [CrossRef]
- He, L.; Hu, C.; Huang, J.; Xie, S.; Wang, Y. Characteristics of largescale circulation of east asian monsoon indicated by oxygen isotope of stalagmites. Quat. Sci. 2009, 29, 950–956. [Google Scholar]
- Tan, M. Circulation effect: Climatic significance of the short term variability of the oxygen isotopes in stalagmites. Quat. Sci. 2009, 29, 851–862. [Google Scholar]
- Tan, M. Circulation effect: Response of precipitation δ18O to the ENSO cycle in monsoon regions of China. Clim. Dyn. 2014, 42, 1067–1077. [Google Scholar] [CrossRef]
- Tan, M. Circulation background of climate patterns in the past millennium: Uncertainty analysis and re-reconstruction of ENSO-like state. Sci. China Earth Sci. 2016, 59, 1225–1241. [Google Scholar] [CrossRef]
- Zhang, H.; Cheng, H.; Cai, Y.; Spötl, C.; Sinha, A. Effect of precipitation seasonality on annual oxygen isotopic composition in the area of spring persistent rain in Southeastern China and its palaeoclimatic implication. Clim. Past Discuss. 2018, 2018, 1–22. [Google Scholar] [CrossRef]
- Berger, A. Long-term variations of caloric insolation resulting from the Earth’s orbital elements. Quat. Res. 1978, 9, 139–167. [Google Scholar] [CrossRef]
- Bereiter, B.; Eggleston, S.; Schmitt, J.; Nehrbass-Ahles, C.; Stocker, T.F.; Fischer, H.; Kipfstuhl, S.; Chappellaz, J. Revision of the EPICA Dome C CO2 record from 800 to 600 kyr before present. Geophys. Res. Lett. 2015, 42, 542–549. [Google Scholar] [CrossRef]
- Spratt, R.M.; Lisiecki, L.E. A Late Pleistocene sea level stack. Clim. Past 2016, 12, 1079–1092. [Google Scholar] [CrossRef]
- Hays, J.D.; Imbrie, J.; Shackleton, N.J. Variations in the Earth’s orbit: Pacemaker of the ice ages. Science 1976, 194, 1121–1132. [Google Scholar] [CrossRef]
- Chiang, J.; Swenson, L.; Kong, W. Role of seasonal transitions and the westerlies in the interannual variability of the East Asian summer monsoon precipitation. Geophys. Res. Lett. 2017, 44. [Google Scholar] [CrossRef]
- Li, Y.; Rao, Z.; Cao, J.; Jiang, H.; Gao, Y. Highly negative oxygen isotopes in precipitation in southwest China and their significance in paleoclimatic studies. Quat. Int. 2016, 440, 64–71. [Google Scholar] [CrossRef]
- Maher, B.A.; Thompson, R. Oxygen isotopes from Chinese caves: Records not of monsoon rainfall but of circulation regime. J. Quat. Sci. 2012, 27, 615–624. [Google Scholar] [CrossRef]
- Kathayat, G.; Cheng, H.; Sinha, A.; Spötl, C.; Edwards, R.L.; Zhang, H.; Li, X.; Yi, L.; Ning, Y.; Cai, Y. Indian monsoon variability on millennial-orbital timescales. Sci. Rep. 2016, 6, 24374. [Google Scholar] [CrossRef] [PubMed]
- Dansgaard, W.; Johnsen, S.; Clausen, H.; Dahl-Jensen, D.; Gundestrup, N.; Hammer, C.; Hvidberg, C.; Steffensen, J.; Sveinbjörnsdottir, A.; Jouzel, J. Evidence for general instability of past climate from a 250-kyr ice-core record. Nature 1993, 364, 218. [Google Scholar] [CrossRef]
- Peterson, L.C.; Haug, G.H.; Hughen, K.A.; Röhl, U. Rapid changes in the hydrologic cycle of the tropical Atlantic during the last glacial. Science 2000, 290, 1947–1951. [Google Scholar] [CrossRef] [PubMed]
- Zhou, H.; Zhao, J.; Zhang, P.; Shen, C.-C.; Chi, B.; Feng, Y.; Lin, Y.; Guan, H.; You, C.-F. Decoupling of stalagmite-derived Asian summer monsoon records from North Atlantic temperature change during marine oxygen isotope stage 5d. Quat. Res. 2008, 70, 315–321. [Google Scholar] [CrossRef]
- Broecker, W.S. Paleocean circulation during the last deglaciation: A bipolar seesaw? Paleoceanography 1998, 13, 119–121. [Google Scholar] [CrossRef]
- Stocker, T.F.; Johnsen, S.J. A minimum thermodynamic model for the bipolar seesaw. Paleoceanography 2003, 18, 1078. [Google Scholar] [CrossRef]
- Rasmussen, S.O.; Andersen, K.K.; Svensson, A.; Steffensen, J.P.; Vinther, B.M.; Clausen, H.B.; Siggaard-Andersen, M.L.; Johnsen, S.J.; Larsen, L.B.; Dahl-Jensen, D. A new Greenland ice core chronology for the last glacial termination. J. Geophys. Res. Atmos. 2006, 111, D06102. [Google Scholar] [CrossRef]
- Members, W.D.P.; Buizert, C.; Adrian, B.; Ahn, J.; Albert, M.; Alley, R.B.; Baggenstos, D.; Bauska, T.K.; Bay, R.C.; Bencivengo, B.B.; et al. Precise interpolar phasing of abrupt climate change during the last ice age. Nature 2015, 520, 661. [Google Scholar] [CrossRef]
- Stuiver, M.; Grootes, P.M. GISP2 oxygen isotope ratios. Quat. Res. 2000, 53, 277–284. [Google Scholar] [CrossRef]
- Cosford, J.; Qing, H.; Eglington, B.; Mattey, D.; Yuan, D.; Zhang, M.; Cheng, H. East Asian monsoon variability since the Mid-Holocene recorded in a high-resolution, absolute-dated aragonite speleothem from Eastern China. Earth Planet. Sci. Lett. 2008, 275, 296–307. [Google Scholar] [CrossRef]
- Tan, M.; Cai, B. Preliminary calibration of stalagmite oxygen isotopes from Eastern Monsoon China with Northern Hemisphere temperatures. Pages News 2005, 13, 16–17. [Google Scholar] [CrossRef]
- Yang, X.; Yang, H.; Wang, B.; Huang, L.-J.; Shen, C.-C.; Edwards, R.L.; Cheng, H. Early-Holocene monsoon instability and climatic optimum recorded by Chinese stalagmites. Holocene 2019, 29, 1059–1067. [Google Scholar] [CrossRef]
- Mudelsee, M. Ramp function regression: A tool for quantifying climate transitions. Comput. Geosci. 2000, 26, 293–307. [Google Scholar] [CrossRef]
- Liu, Y.; Hu, C. Quantification of southwest China rainfall during the 8.2 ka BP event with response to North Atlantic cooling. Clim. Past 2016, 12, 1583–1590. [Google Scholar] [CrossRef]
- Jin, G.; Liu, D. Mid-Holocene climate change in North China, and the effect on cultural development. Chin. Sci. Bull. 2002, 47, 408–413. [Google Scholar] [CrossRef]
- Cheng, H.; Fleitmann, D.; Edwards, R.L.; Wang, X.; Cruz, F.W.; Auler, A.S.; Mangini, A.; Wang, Y.; Kong, X.; Burns, S.J. Timing and structure of the 8.2 kyr BP event inferred from δ18O records of stalagmites from China, Oman, and Brazil. Geology 2009, 37, 1007. [Google Scholar] [CrossRef]
- Perșoiu, A.; Ionita, M.; Weiss, H. Atmospheric blocking induced by the strengthened Siberian High led to drying in west Asia during the 4.2 ka BP event—A hypothesis. Clim. Past 2019, 15, 781–793. [Google Scholar]
- Berkelhammer, M.; Sinha, A.; Stott, L.; Cheng, H.; Pausata, F.S.; Yoshimura, K. An abrupt shift in the Indian monsoon 4000 years ago. Geophys. Monogr. Ser 2012, 198, 75–87. [Google Scholar]
- Bond, G.; Kromer, B.; Beer, J.; Muscheler, R.; Evans, M.N.; Showers, W.; Hoffmann, S.; Lotti-Bond, R.; Hajdas, I.; Bonani, G. Persistent solar influence on North Atlantic climate during the Holocene. Science 2001, 294, 2130–2136. [Google Scholar] [CrossRef]
- Yin, J.; Qin, J.; Lin, Y.; Yang, Y.; Tang, W. Research progress on the recent 2000 years’ climate change revealed by stalagmite record in China. Carsologica Sin. 2010, 29, 258–266. [Google Scholar]
- Li, C.; Ku, T.; Dorte, P.; Wang, F.; Chen, W.; Yin, G.; Cheng, H.; Edwards, R.L. Paleoclimatic and paleomonsoonal variations in central china recorded by stable isotopic records of stalagmites from Buddha cave, South Shaanxi. Seismol. Geol. 2000, 22, 63–78. [Google Scholar]
- Zhang, C.; Zhang, M.; Li, P.; Kong, X.; Zhu, Z.; Jiang, X.; Wang, Y. Stalagmite δ18O record 2592-1225 yr BP from Mt. Shennongjia and its regional climate significance. Sci. Geogr. Sinca 2010, 30, 950–954. [Google Scholar]
- Tan, L.; Cai, Y.; Cheng, H.; Edwards, L.R.; Lan, J.; Zhang, H.; Li, D.; Ma, L.; Zhao, P.; Gao, Y. High resolution monsoon precipitation changes on Southeastern Tibetan Plateau over the past 2300 years. Quat. Sci. Rev. 2018, 195, 122–132. [Google Scholar] [CrossRef]
- Moberg, A.; Sonechkin, D.M.; Holmgren, K.; Datsenko, N.M.; Karlén, W. Highly variable Northern Hemisphere temperatures reconstructed from low-and high-resolution proxy data. Nature 2005, 433, 613. [Google Scholar] [CrossRef] [PubMed]
- Knudsen, M.F.; Riisager, P.; Jacobsen, B.H.; Muscheler, R.; Snowball, I.; Seidenkrantz, M.S. Taking the pulse of the Sun during the Holocene by joint analysis of 14C and 10Be. Geophys. Res. Lett. 2009, 36. [Google Scholar] [CrossRef]
- Perry, C.A.; Hsu, K.J. Geophysical, archaeological, and historical evidence support a solar-output model for climate change. Proc. Natl. Acad. Sci. USA 2000, 97, 12433–12438. [Google Scholar] [CrossRef] [PubMed]
- Mann, M.E.; Zhang, Z.; Rutherford, S.; Bradley, R.S.; Hughes, M.K.; Shindell, D.; Ammann, C.; Faluvegi, G.; Ni, F. Global signatures and dynamical origins of the Little Ice Age and Medieval Climate Anomaly. Science 2009, 326, 1256. [Google Scholar] [CrossRef]
- Yang, H.; Johnson, K.; Griffiths, M.; Yoshimura, K. Interannual controls on oxygen isotope variability in Asian monsoon precipitation and implications for paleoclimate reconstructions. J. Geophys. Res. Atmos. 2016, 121, 8410–8428. [Google Scholar] [CrossRef]
- Yan, H.; Sun, L.; Wang, Y.; Huang, W.; Qiu, S.; Yang, C. A record of the Southern Oscillation Index for the past 2000 years from precipitation proxies. Nat. Geosci. 2011, 4, 611. [Google Scholar] [CrossRef]
- Lean, J.L.; Wang, Y.M.; Sheeley, N. The effect of increasing solar activity on the Sun’s total and open magnetic flux during multiple cycles: Implications for solar forcing of climate. Geophys. Res. Lett. 2002, 29, 71. [Google Scholar] [CrossRef]
- Li, W.; Li, L.; Ting, M.; Liu, Y. Intensification of Northern Hemisphere subtropical highs in a warming climate. Nat. Geosci. 2012, 5, 830. [Google Scholar] [CrossRef]
- Change, I.C. Synthesis Report Summary for Policymakers. 2014. Available online: https://www. ipcc. ch/pdf/assessment-report/ar5/syr/AR5_SYR_FINAL_SPM. pdf (accessed on 10 July 2019).
- Li, Z.; Lau, W.M.; Ramanathan, V.; Wu, G.; Ding, Y.; Manoj, M.; Liu, J.; Qian, Y.; Li, J.; Zhou, T. Aerosol and monsoon climate interactions over Asia. Rev. Geophys. 2016, 54, 866–929. [Google Scholar] [CrossRef]
- Tan, L.; Cai, Y.; Cheng, H.; Edwards, R.L.; Shen, C.-C.; Gao, Y.; An, Z. Climate significance of speleothem δ18O from central China on decadal timescale. J. Asian Earth Sci. 2015, 106, 15. [Google Scholar] [CrossRef]


| Site_Name | Site_ID | Latitude ° N | Longitude ° E | Entity_Name | Entity_ID | Min. Year BP | Max. Year BP | Reference |
|---|---|---|---|---|---|---|---|---|
| Baigu | 26.22 | 106.5 | BG1 | 3300 | 12,800 | [41] * | ||
| Baluk | 84.73 | 42.43 | BLK12A | 2061 | 9308 | [23] | ||
| BLK12B | 2698 | 8287 | [23] | |||||
| Bengle | 31.32 | 96.66 | 14BL-1 | 388 | 3855 | [26] * | ||
| Dark | 27.2 | 106.17 | D1 | 325 | 5486 | [42] | ||
| D2 | 1166 | 6127 | [42] | |||||
| Dashibao | 26.08 | 105.05 | DSB3 | 26,590 | 32,790 | [43] | ||
| Dayu | 36 | 33.13 | 106.3 | DY-1 | 111 | −33 | 720 | [28,44] |
| Dongge | 39 | 25.28 | 108.08 | D3 | 114 | 91,200 | 163,500 | [12] |
| D8 | 324 | 217,202 | 225,258 | [1] | ||||
| D4 | 115 | 116 | 148,400 | [12] | ||||
| D4 | −16.5 | 15,810 | [45] | |||||
| DX1 | 800 | 2000 | [46] | |||||
| DX2 | 1600 | 2000 | [46] | |||||
| DAS | 70 | 4200 | [47] | |||||
| DA | −50 | 8880 | [8,48] | |||||
| D15 | 0 | 885 | [48] | |||||
| D4 | 130 | 15,470 | [49] | |||||
| Dongshiya | 33.77 | 111.57 | DSY1201 | −62 | 139 | [50] | ||
| DSY1 | −6 | 8700 | [51] | |||||
| Dragon | 38.77 | 113.27 | L30 | 1263.1 | 53,260 | [52] | ||
| Dragon spring | 25.65 | 108.3 | L12 | 750 | 2000 | [53] | ||
| L12 | 9000 | 9600 | [53] | |||||
| E’mei | 29.5 | 115.5 | EM1 | −59 | 140 | [54] | ||
| Fengyu | 24.5 | 110.33 | F-1 | 4397 | 64,930 | [55] | ||
| F-4 | −50 | 653 | [49,55] | |||||
| Furong | 80 | 29.23 | 107.9 | FR-5 | 171 | 6001.4 | 16,991 | [56] |
| FR-0510 | 172 | −55 | 1989 | [57] | ||||
| Golden lion | 25.12 | 108.62 | JSD-01 | 87,900 | 88,200 | [53] | ||
| JSD-02 | 93,800 | 95,200 | [53] | |||||
| Haozhuzi | 30.68 | 109.98 | HZZ11 | 9000 | 30,000 | [14,58] | ||
| HZZ27 | 9000 | 53,000 | [14,58] | |||||
| Heizhugou | 28.56 | 103.05 | EB1 | 140 | 500 | [59] * | ||
| Heilong | 31.67 | 110.43 | BD | 170 | 1090 | [60] | ||
| Heshang | 122 | 30.45 | 110.42 | HS4 | 253 | −52 | 9470 | [15] |
| HS4 | 254 | 8061 | 8295 | [61] | ||||
| Huanglong | 32.72 | 103.82 | HL021 | 1951 CE | 2002 CE | [62] | ||
| HL022 | 1951 CE | 2002 CE | [62] | |||||
| Huangye | 17 | 33.58 | 105.12 | HY1 | 76 | −32 | 1190 | [63] |
| HY2 | 77 | 1073 | 1812 | [63] | ||||
| HY3 | 78 | −51.8 | 642 | [63] | ||||
| Hulu | 6 | 32.5 | 119.17 | MSD | 40 | 18,310 | 53,001 | [5,64] |
| MSL | 41 | 35,900 | 75,646 | [5,64] | ||||
| PD | 42 | 10,495 | 19,338 | [5] | ||||
| YT | 43 | 14,389 | 17,234 | [5,65,66,67] * | ||||
| H82 | 44 | 10,540 | 22,100 | [5,68] | ||||
| HL162 | 134,511 | 159,096 | [69] | |||||
| MSP | 133,130 | 154,970 | [70] | |||||
| MSX | 128,030 | 154,520 | [70] | |||||
| MSH | 161,720 | 178,050 | [70] | |||||
| H98 | 21,345 | 24,124 | [71,72,73] * | |||||
| Jintanwan | 29.48 | 109.53 | J1 | 11,000 | 12,900 | [74] | ||
| J1 | 14,700 | 29,500 | [74] | |||||
| Jiuxian | 154 | 33.57 | 109.1 | C996-1 | 329 | −48 | 8614 | [75] |
| C996-2 | 330 | −8 | 18,958 | [75] | ||||
| Kaiyuan | 35.72 | 118.53 | KY1 | 58 | 733 | [76] | ||
| Kesang | 2 | 42.87 | 81.75 | KS06-A-H | 11 | 3570 | 9890 | [21] |
| KS06-A | 12 | 53,270 | 235,118 | [21] | ||||
| KS06-B | 13 | 257,190 | 456,456 | [21] | ||||
| KS08-1-H | 14 | 5 | 3520 | [21] | ||||
| KS08-1 | 15 | 75,375 | 298,325 | [21] | ||||
| KS08-2-H | 16 | 8429 | 15,009 | [21] | ||||
| KS08-2 | 17 | 70,873 | 230,103 | [21] | ||||
| KS08-2-MIS3 | 18 | 51,607 | 53,727 | [21] | ||||
| KS08-6 | 19 | 852 | 1318 | [21] | ||||
| CNKS-2 | 235 | 1098 | [22] | |||||
| CNKS-3 | 130 | 1158 | [22] | |||||
| CNKS-7 | 2523 | 71,710 | [22] | |||||
| CNKS-9 | −71 | 73,551 | [22] | |||||
| Kulishu | 45 | 39.68 | 115.65 | BW-1 | 121 | 10,378 | 13,971 | [77,78] |
| Laomu | 33.77 | 111.56 | LM1 | 257,000 | 324,000 | [79] * | ||
| LM2 | 8439 | 10,947 | [51] | |||||
| Lianhua (Hunan) | 29.48 | 109.53 | LHD1 | −61 | 402 | [80] | ||
| LHD5 | 8030 | 11,918 | [81] | |||||
| Lianhua (Shanxi) | 29.48 | 109.53 | LH4 | 229 | 14,594 | [82] | ||
| LH5 | 1444 | 4176 | [82] | |||||
| LH9 | 229 | 14,594 | [82] | |||||
| Linyi | 35.68 | 118.42 | LY | 11,400 | 16,400 | [83] | ||
| Linzhu | 31.52 | 110.32 | LZ15 | 224,630 | 348,950 | [11] | ||
| LZ36 | 348,850 | 361,880 | [11] | |||||
| Longquan | 25.48 | 107.87 | LQ2 | 200 | 1550 | [84] * | ||
| Longfugong | 31.72 | 110.78 | LFG21 | 10,687.4 | 12,457.6 | [85] * | ||
| Magou | 34.32 | 113.38 | MG-1 | 4900 | 13,100 | [86] * | ||
| MG-40 | 7100 | 13,100 | [86] * | |||||
| Maomaotou Dayan | 25.31 | 110.27 | DY-2 | −59 | −18 | [87] * | ||
| Niudong | 31.7 | 110.27 | N1 | 82 | 9888 | [88] | ||
| Nuanhe | 41.33 | 124.92 | NH5 | 4210 | 10,144 | [89,90] * | ||
| NH12 | 374 | 1057 | [89,91] * | |||||
| NH13 | 1167 | 4729 | [89] * | |||||
| NH20 | 1720 | 7804 | [89] * | |||||
| NH33 | 7748 | 8638 | [92] * | |||||
| NH6 | 7050 | 8630 | [93] * | |||||
| NH7 | 200 | 3500 | [91] * | |||||
| Panlong | 24.96 | 110.25 | PL-1 | 0 | 36,400 | [94] * | ||
| Qingtian | 31.33 | 110.37 | QT9 | 6100 | 6700 | [95,96] * | ||
| Qingtian | 31.33 | 110.37 | QT20 | 16,105 | 17,564 | [96,97] * [98] | ||
| QT29 | 17,890 | 18,216 | [97] * [98] | |||||
| YT | 14,400 | 18,300 | [97] * | |||||
| QT | 12,080 | 13,480 | [99] | |||||
| QT16 | 10,850 | 13,420 | [100,101] * | |||||
| QT33 | 4840 | 5570 | [102] * | |||||
| QT15 | 29,400 | 27,400 | [103] * | |||||
| QT17 | 12,100 | 13,500 | [104] * | |||||
| QT24 | 7362 | 7748 | [105] | |||||
| QT40 | 7625 | 8782 | [101,105,106] * | |||||
| QT41 | 6507 | 7378 | [105] | |||||
| QT9 | 6082 | 7020 | [105] | |||||
| QT25 | 7297 | 10,832 | [105] | |||||
| QT1 | 22,412 | 28,659 | [107] | |||||
| Qixing | 26.07 | 107.27 | QX-1 | 150 | 7700 | [108] | ||
| QX3 | 50 | 2312 | [109] * | |||||
| Q4 | 12,400 | 44,330 | [110,111] * | |||||
| Q6 | 11,290 | 59,680 | [110,111] * | |||||
| Q1 | 65,900 | 85,500 | [110,111] * | |||||
| Q2 | 38,500 | 60,400 | [110,111] * | |||||
| QX1 | 2284 | 3574 | [112] | |||||
| Sanbao | 140 | 31.67 | 110.43 | SB-10 | 295 | 2089 | 11,532 | [113,114,115] * |
| SB-6 | 1273 | 3243 | [116] * | |||||
| SB-22 | 56,600 | 95,000 | [115,117] * | |||||
| SB-25 | 78,100 | 132,500 | [115,117] * | |||||
| SB-60 | 240,000 | 284,000 | [118] | |||||
| SB-46 | 16,930 | 32,300 | [43] | |||||
| Sanbao | 140 | 31.67 | 110.43 | SB-26 | 296 | 403 | 5229.12 | [116] * [113] |
| SB-27 | 297 | 2351 | 8475.98 | [116] * [113] | ||||
| SB-43 | 298 | 70 | 12,863 | [113] | ||||
| SB-44 | 299 | 6860 | 13,179 | [113] | ||||
| SB-49 | 300 | 10,206 | 13,185 | [113] | ||||
| SB3 | 11,100 | 17,700 | [115] * | |||||
| SB11 | 129,300 | 184,500 | [115] * | |||||
| SB23 | 98,900 | 127,200 | [115] * | |||||
| SB24 | 155,500 | 182,400 | [115] * | |||||
| SB34 | 103,600 | 109,400 | [115] * | |||||
| SB41 | 108,100 | 138,200 | [115] * | |||||
| SB42 | 133,700 | 167,600 | [115] * | |||||
| SB-12 | 301 | 424,300 | 462,800 | [1] | ||||
| SB-14 | 302 | 299,200 | 624,400 | [1] | ||||
| SB-32 | 303 | 503,800 | 641,300 | [1] | ||||
| SB-58 | 304 | 426,300 | 464,900 | [1] | ||||
| Sanxing | 27.37 | 107.18 | SX7 | 86,600 | 108,200 | [119] | ||
| SX24 | 92,800 | 103,700 | [119] | |||||
| SX29 | 106,300 | 113,500 | [119] | |||||
| SX2 | 30,900 | 11,200 | [120] | |||||
| SX3 | 3500 | 9700 | [120] | |||||
| SX3 | 11,600 | 12,500 | [120] | |||||
| SX5 | 14,900 | 17,500 | [120] | |||||
| SX10 | 75,740 | 78,949 | [121] | |||||
| SX16 | 68,774 | 77,001 | [121] | |||||
| Shennong | 28.71 | 117.26 | SN17 | 3643 | 5300 | [122] | ||
| SN4 | −53 | 2500 | [123] | |||||
| SN20 | −53 | 2200 | [123] | |||||
| SN3 | 8138 | 9239 | [124] | |||||
| SN15 | 5617 | 7526 | [124] | |||||
| Shigao | 28.18 | 107.17 | SG1 | 4171 | 9811 | [125,126] * | ||
| SG2 | 209 | 5663 | [125] | |||||
| Shihua | 39.78 | 115.93 | TS9501 | 665 BC | 1985 CE | [127] | ||
| XMG-1 | −65 | 80 | [128] | |||||
| S312 | 1520 CE | 1994 CE | [129] | |||||
| TS9701 | 200 BC | 2000 CE | [130] | |||||
| LS9602 | 1000 CE | 2000 CE | [130] | |||||
| Shizi | 32.4 | 107.17 | SI3 | 46,000 | 54,000 | [131] * [132] | ||
| Shuinan | 25.33 | 110.27 | SU | 147,900 | 245,200 | [133] * | ||
| Shuidong | 41.28 | 124.1 | TW9801 | 139 | 929 | [134] | ||
| Songjia | 32.41 | 107.18 | SJ1 | 14,000 | 43,000 | [135] * | ||
| SJ3 | 14,800 | 19,800 | [136,137] | |||||
| SJ5-6 | 320,000 | 334,000 | [138] * | |||||
| Suozi | 59 | 32.43 | 107.17 | SZ2 | 143 | 102,810 | 119,340 | [139] * [140] |
| Tangshan | 32.06 | 119.04 | 996182 | 10,500 | 16,800 | [141] | ||
| Tianmen | 142 | 30.92 | 90.07 | TM-2 | 306 | 76,398 | 125,146 | [24] |
| TM-5 | 307 | 123,227 | 127,215 | [24] | ||||
| TM-18a | 308 | 4148 | 9045 | [25] | ||||
| TM-18b | 309 | 611 | 1026 | [25] | ||||
| Tian’e | 31.72 | 110.37 | TE2 | 590 | 2100 | [142] * | ||
| SW4 | 22,000 | 28,500 | [107,143] * | |||||
| SW5 | 26,500 | 33,852 | [107] | |||||
| SL | 11,670 | 22,200 | [143] * | |||||
| SW12 | 58,810 | 76,100 | [144] * | |||||
| Wangjiawei | 41.22 | 123.38 | W6 | 5848 | 8082 | [145] | ||
| W4 | 5069 | 10,269 | [145] | |||||
| Wanxiang | 33.32 | 105 | WX42B | −53 | 1758 | [10] | ||
| WXB07-4 | 4920 | 6420 | [27] | |||||
| Wulu | 26.05 | 105.03 | Wu3 | 29,220 | 39,170 | [146] | ||
| Wu32 | 20,800 | 29,000 | [43] | |||||
| Wu23 | 26970 | 59,800 | [147,148] * [149] | |||||
| Wu26 | 51,560 | 61,190 | [147,148] * [149] | |||||
| Wu30 | 33,852 | 50,521 | [107] | |||||
| Wuya | 33.82 | 105.42 | WY27 | 1641 CE | 2010 CE | [150] | ||
| WY33 | 1749 CE | 2011 CE | [150] | |||||
| Xianglong | 33 | 106.33 | XL16 | 653 | 4291 | [151] | ||
| XL2 | 1972 | 4200 | [151] | |||||
| XL26 | 2984 | 6651 | [151] | |||||
| XL15 | 10,900 | 25,500 | [152] | |||||
| Xiangshui | 25.25 | 110.92 | XU | 3800 | 6000 | [153] | ||
| X1 | 3100 | 44,000 | [94] * | |||||
| X1 | 490 | 6000 | [49] | |||||
| Xianren | 24.12 | 104.12 | YPXR-5 | 192 | 292 | [154] | ||
| Xianren | 25.85 | 103.5 | XR1 | 2100 | 7985 | [155,156] * | ||
| Xianren | 27.76 | 100.6 | LX1 | 2100 | 4200 | [157] * | ||
| Xianyun | 25.55 | 117 | XY III-28 | 26,330 | 22,980 | [158] * | ||
| XY IV-3 | 15,200 | 16,800 | [159] | |||||
| Xiaobailong | 127 | 24.2 | 103.35 | XBL-1 | 36,000 | 53,000 | [160] | |
| XBL-3 | 263 | 30,140 | 41,420 | [13] | ||||
| XBL-4 | 264 | 57,418 | 81,951 | [13] | ||||
| XBL-7 | 265 | 59,670 | 71,000 | [13] | ||||
| XBL-26 | 266 | 73,060 | 251,960 | [13] | ||||
| XBL-27 | 267 | 172,340 | 189,460 | [13] | ||||
| XBL-29 | 268 | 5340 | 43,630 | [13] | ||||
| XBL-48 | 269 | 76,610 | 106,540 | [13] | ||||
| XBL-65 | 270 | 167,250 | 170,730 | [13] | ||||
| Xinglong | 69 | 40.5 | 117.5 | XL-1 | 153 | 50,137 | 56,834 | [161] |
| Xiniu | 31.35 | 110.57 | SN | 180 | 2220 | [162] * | ||
| Xinya | 112 | 30.75 | 109.47 | XY-2 | 221 | 57,617 | 69,553 | [163] |
| XY07-8 | 222 | −55.46 | 3944.47 | [164] | ||||
| Yamen | 25.48 | 107.9 | Y1 | 73,000 | 162,000 | [165] | ||
| Yangkou | 5 | 29.03 | 107.18 | YK5 | 34 | 179,643 | 190,358 | [166] |
| YK12 | 35 | 133,508 | 181,866 | [166] | ||||
| YK23 | 36 | 172,620 | 206,839 | [166] | ||||
| YK47 | 37 | 129,990 | 132,020 | [166] | ||||
| YK61 | 38 | 95,506 | 173,089 | [166] | ||||
| JFYK7 | 39 | 37,793 | 78,874 | [167,168,169] | ||||
| Yangzi | 29.78 | 107.78 | Y02 | 65,000 | 90,000 | [170,171] * | ||
| Yelang | 26.04 | 105.74 | YLD15 | −58 | 700 | [172] | ||
| YLD15 | 4500 | 5800 | [172] | |||||
| YLD15 | 7400 | 13,400 | [172] | |||||
| YLD15 | 33,700 | 35,050 | [172] | |||||
| Yongxing | 31.58 | 111.23 | NO.YXB | 243,400 | 250,100 | [173] | ||
| YX92 | 1780 | 1960 | [174] * | |||||
| YX46 | 61,620 | 87,330 | [173] | |||||
| YX51 | 22,320 | 57,270 | [173,175] * | |||||
| YX55 | 29,610 | 64,460 | [173] | |||||
| YX15 | 279,000 | 322,600 | [176] | |||||
| YX21 | 127,320 | 124,950 | [177] * | |||||
| Yuhua | 26.7 | 117.82 | YH1 | −59 | 477 | [178] * | ||
| Zhuliuping | 174 | 26.02 | 104.1 | ZLP1 | 379 | 4620 | 10,395 | [179] |
| ZLP2 | 380 | 9447 | 14,659 | [179] | ||||
| Zhenzhu | 38.25 | 113.7 | ZZ12 | −50 | 800 | [180] |
© 2019 by the authors. Licensee MDPI, Basel, Switzerland. This article is an open access article distributed under the terms and conditions of the Creative Commons Attribution (CC BY) license (http://creativecommons.org/licenses/by/4.0/).
Share and Cite
Zhang, H.; Ait Brahim, Y.; Li, H.; Zhao, J.; Kathayat, G.; Tian, Y.; Baker, J.; Wang, J.; Zhang, F.; Ning, Y.; et al. The Asian Summer Monsoon: Teleconnections and Forcing Mechanisms—A Review from Chinese Speleothem δ18O Records. Quaternary 2019, 2, 26. https://doi.org/10.3390/quat2030026
Zhang H, Ait Brahim Y, Li H, Zhao J, Kathayat G, Tian Y, Baker J, Wang J, Zhang F, Ning Y, et al. The Asian Summer Monsoon: Teleconnections and Forcing Mechanisms—A Review from Chinese Speleothem δ18O Records. Quaternary. 2019; 2(3):26. https://doi.org/10.3390/quat2030026
Chicago/Turabian StyleZhang, Haiwei, Yassine Ait Brahim, Hanying Li, Jingyao Zhao, Gayatri Kathayat, Ye Tian, Jonathan Baker, Jian Wang, Fan Zhang, Youfeng Ning, and et al. 2019. "The Asian Summer Monsoon: Teleconnections and Forcing Mechanisms—A Review from Chinese Speleothem δ18O Records" Quaternary 2, no. 3: 26. https://doi.org/10.3390/quat2030026
APA StyleZhang, H., Ait Brahim, Y., Li, H., Zhao, J., Kathayat, G., Tian, Y., Baker, J., Wang, J., Zhang, F., Ning, Y., Edwards, R. L., & Cheng, H. (2019). The Asian Summer Monsoon: Teleconnections and Forcing Mechanisms—A Review from Chinese Speleothem δ18O Records. Quaternary, 2(3), 26. https://doi.org/10.3390/quat2030026