Article

Thermoresponsive Starch Nanoparticles for the Extraction of Bitumen from Oil Sands

Department of Chemistry, Institute for Polymer Research and Waterloo Institute for Nanotechnology, University of Waterloo, 200 University Avenue West, Waterloo, ON N2L 3G1, Canada
*
Author to whom correspondence should be addressed.
Colloids Interfaces 2022, 6(4), 67; https://doi.org/10.3390/colloids6040067
Submission received: 30 August 2022 / Revised: 14 October 2022 / Accepted: 3 November 2022 / Published: 9 November 2022

Abstract

:
Starch nanoparticles (SNPs) useful for the extraction of bitumen from oil sands were obtained by modification with thermoresponsive poly(di(ethylene glycol) methyl ether methacrylate) (PMEO2MA) segments through RAFT (Reversible Addition–Fragmentation chain Transfer) grafting. Since PMEO2MA exhibits a Lower Critical Aggregation Temperature (LCAT), the polymer-grafted SNPs are amphiphilic above the LCAT of the thermoresponsive polymer and can interact efficiently with bitumen in the oil sands, facilitating its extraction. The PMEO2MA-grafted SNPs form micellar aggregates that remain dispersed in water but can shuttle the bitumen component out of the sand and silt mixture in the extraction process above the LCAT. Upon cooling, the hydrophobic PMEO2MA domains become hydrophilic again and the grafted SNPs remain in the water phase, while the extracted oil floats on the aqueous phase and can be skimmed off. The aqueous polymer solution may be reused in other extraction cycles. Extraction by tumbling of the oil-water-SNP mixtures in vials at 45 °C reached over 80% efficiency. The synthetic methods used provide easy control over the characteristics of the grafted SNPs (number and length of grafted PMEO2MA segments), and therefore over their hydrophilic-lipophilic balance (HLB). The SNP-g-PMEO2MA samples were characterized by 1H NMR, UV-visible spectroscopy and dynamic light scattering analysis, and the grafted PMEO2MA chains were cleaved from the starch substrates for analysis by gel permeation chromatography.

Graphical Abstract

1. Introduction

Oil or tar sands are loose, incoherent deposits of sand containing petroleum in the form of bitumen. The oil sand deposits in Canada are among the largest in the world, with about 175–300 billion barrels of bitumen covering over 141,000 km2 in the province of Alberta [1,2]. The formation of petroleum is an extremely lengthy process involving the accumulation of dead organisms on the Earth’s surface, and sedimentary rock deposits creating extreme heat and pressure. Over thousands and millions of years, these organic deposits were transformed into bitumen which can be processed into oil today. Most of the Athabasca bitumen is in the McMurray Formation, deposited about 110 million years ago [3].
Bitumen is a dense, viscoelastic material mixed with quartz sand, clay, and water. It is the heaviest form of petroleum, needing to be purified, treated, and upgraded to obtain gasoline, jet fuel, heating oil, and diesel fuel [2]. It has a color that varies from dark brown to black, a high molecular weight, and a low hydrogen-to-carbon ratio, in addition to nitrogen, oxygen, sulfur, trace metals, and organometallic compounds [2]. Rich oil sands can contain up to 18% bitumen by weight, but the average for Alberta’s Athabasca oil sands is 12% [3]. An oil content of 5–10% is considered intermediate, while 2–5% oil is lean [3]. Bitumen forms a continuous phase in oil-rich sands and the sand forms the bulk phase, while lean oil sands tend to have more water than bitumen in their continuous phase [4].
There are currently two main methods used to extract bitumen from oil sands. The open-pit mining strategy involves transporting the oil sands from the deposit to the processing plant, where a large amount of hot water is added to allow the bitumen to float on the water, and the quartz sand to settle by gravity. This process, known as the Clark hot water extraction (CHWE) process, was commercialized by Karl Clark in the 1920s. It involves crushing lumps of the mined ore into smaller aggregates, followed by mixing with water and sodium hydroxide in rotatory drums at 50–80 °C [5]. Strong hydration forces acting at the surface of the sand grains result in the release of bitumen from the sand particles. Chemical additives such as polymers, and air are introduced into the slurry to separate the bitumen by floatation. Separation vessels with a conical shape are used to allow the sand to settle at the bottom, while the aerated bitumen floats to the top to be skimmed off [2,6]. The slurry, still containing a lower amount of bitumen (middling), is collected from the vessel to be mixed with coke naphtha and centrifuged to separate the remaining bitumen from minerals and water. The sand, clay, and water are disposed of in a tailing pond, and the water is partly recycled [6]. This extraction method is only suitable for oil sands close to the ground surface. When they are located deep underground, transporting the oil sands to the surface becomes inefficient and a steam-assisted gravity-drainage (SAGD) process was implemented [5]. This in situ method can extract bitumen from underground deposits by injecting high-temperature steam into the sand, causing the bitumen to melt. The melted bitumen and the hot water rise to the ground surface, while the heavy quartz sand remains deep underground [5].
The CHWE is typically operated at 75–80 °C to reduce the viscosity of the bitumen, which favors the separation of sand from bitumen [7]. NaOH is commonly used to neutralize organic acids and to improve the wettability of the bitumen. This releases natural surfactants acting at the water-bitumen interface. It can also prevent the attachment of air bubbles to the bitumen particles, however, which is necessary for separation by floatation. Clay minerals, especially fines, also hinder the separation of bitumen from the sand [3]. They bind to the surface of the bitumen droplets and prevent the attachment of air bubbles, thus impeding bitumen floatation. Poor clay flocculation is the primary reason for reduced bitumen recovery. For that reason, the addition of 0.01–0.2 wt% NaOH is required to achieve an optimal pH, around 8.5, for efficient bitumen recovery [8].
While the extraction processes described above have been applied broadly to oil extraction, they cause significant environmental issues. The CHWE and SAGD techniques use large volumes of water heated to over 50 °C, resulting in the consumption of large amounts of energy to produce the crude oil. As the bitumen is separated from the water and quartz sand components in the processing plant, large volumes of residual water contaminated with extremely fine sand particles and oil residues are produced. The fine particles (fines), in particular, can take 30–40 years to settle. The contaminated water is dumped into large engineered dams (tailing ponds), in the form of an oil-in-water emulsion [9] containing large amounts of sodium hydroxide, in addition to other harmful chemicals including ammonia, mercury, and naphthenic acids, which have detrimental effects on wildlife, especially marine organisms [10]. The water consumption can be reduced in oil extraction, but this involves using large amounts of paraffinic and naphthenic solvents to reduce the viscosity of the bitumen and separate it from the sand component, which is even less environmentally friendly and further complicates water treatment [11]. Beyond the CHWE and SAGD processes which are dominant in the oil sands industry, bitumen extraction using ionic liquids [12], organic solvents [13], absorbants [14], and modified floatation techniques [14] have also been explored.
Furthermore, it was shown that the above-mentioned issues could be alleviated with surfactant molecules exhibiting stimuli-responsive behavior. For example, Lu et al. prepared ionic surfactants from ethanolamine and long-chain fatty acid molecules [15]. These ionic surfactants formed micelles that stabilized the oil droplets in aqueous solutions. Upon introduction of CO2, a decrease in pH led to protonation of the carboxyl group of the fatty acid, causing dissociation of the micelles and the release of the oil particles. While these ionic surfactants were shown to allow efficient bitumen recovery, the process involved CO2, a greenhouse gas with environmental impacts. Another type of surfactant with stimuli-responsive behavior is thermoresponsive block polymers, which exhibit a lower critical solubility temperature (LCST) or lower critical aggregation temperature (LCAT). These polymers become hydrophobic and form aggregated species at temperatures above the LCAT. Han et al. were thus able to extract bitumen from oil sands with the block copolymer methoxy poly(ethylene glycol)-b-poly(N-isopropylacrylamide) (MPEG-b-PNIPAM) [16]. Below the LCST of PNIPAM, the block copolymers are freely soluble in water. Upon heating above the LCST, however, the PNIPAM segment becomes hydrophobic and the block copolymer forms micelles that can stabilize bitumen droplets. Unfortunately, this technique requires very intense and extended agitation making the process energy-intensive. Additionally, PNIPAM is toxic, which poses significant environmental hazards [16]. Using a similar principle, Yang et al. demonstrated that block copolymers of poly(ethylene glycol) and poly(di(ethylene glycol) methyl ether methacrylate) (PEG-b-PMEO2MA) could also serve to extract bitumen from oil sands [17]. It was suggested that since PEG-b-PMEO2MA becomes amphiphilic above the LCAT of PMEO2MA, the PEG component favors the formation of micelles in water, while PMEO2MA can interact with bitumen, facilitating its extraction [17]. Unfortunately, this system was only effective for low clay oil sand samples. The PEG-b-PMEO2MA copolymer was also relatively expensive to synthesize. In the current investigation, the hydrophilic PEG component of PEG-b-PMEO2MA was replaced with starch, by grafting starch nanoparticles (SNPs) with PMEO2MA, such that the graft polymer would be soluble in water below the LCAT. Above the LCAT, the hydrophobic PMEO2MA domains should interact with bitumen, in analogy to the PEG-b-PMEO2MA system, while maintaining sufficient water dispersibility [2]. It will be shown that these characteristics can be exploited for the efficient extraction of bitumen from oil sands at relatively low temperatures.
Different techniques were used to regulate the characteristics of the PMEO2MA-grafted SNPs synthesized by RAFT, and the hydrophilic-lipophilic balance (HLB) was controlled by varying the degree of substitution (DS) and the monomer content. A hydrophilic polymer block can be added to improve the colloidal stability of these modified SNPs in water if required.

2. Materials and Methods

2.1. Chemicals and Materials

Research-grade starch nanoparticles (SNPs), with Mn = 102,000 g/mol and Mw = 304,000 g/mol, were provided by EcoSynthetix (Burlington, ON, Canada). Methanol (ACS reagent, ≥99.8%), N,N-dimethylformamide (DMF, HPLC, ≥99.9%), LiCl (≥99%), tetrahydrofuran (THF, HPLC grade, ≥99.9%), toluene (ACS reagent, ≥99%), NaCl (ACS reagent, ≥99%), deuterium oxide (99.9% atom), deuterated DMSO (99.9% atom), CS2 (ACS reagent, ≥99.9%), potassium persulfate (KPS, ACS reagent, ≥99.0%), NaOH pellets (ACS reagent, ≥98%), methyl 2-bromopropionate (98%), di(ethylene glycol) methyl ether methacrylate (MEO2MA, 95%), 2-hydroxyethyl acrylate (2-HEA, 96%), hydrogen peroxide (30% w/w in H2O), aluminium oxide and inhibitor remover cartridges were purchased from Sigma-Aldrich (Oakville, ON, Canada). Spectra/Por dialysis tubing with 50 kDa molecular weight cut-off (MWCO) was purchased from Spectrum Laboratories Inc. (Shewsbury, MA, USA). The inhibitors in MEO2MA and 2-HEA were removed with neutral alumina and inhibitor remover columns. Oil sand samples, labelled as SBos and IOos, were obtained from the Alberta Innovate Technology Futures Sample Bank (Edmonton, AB, Canada) and from Imperial Oil (Edmonton, AB, Canada), respectively.

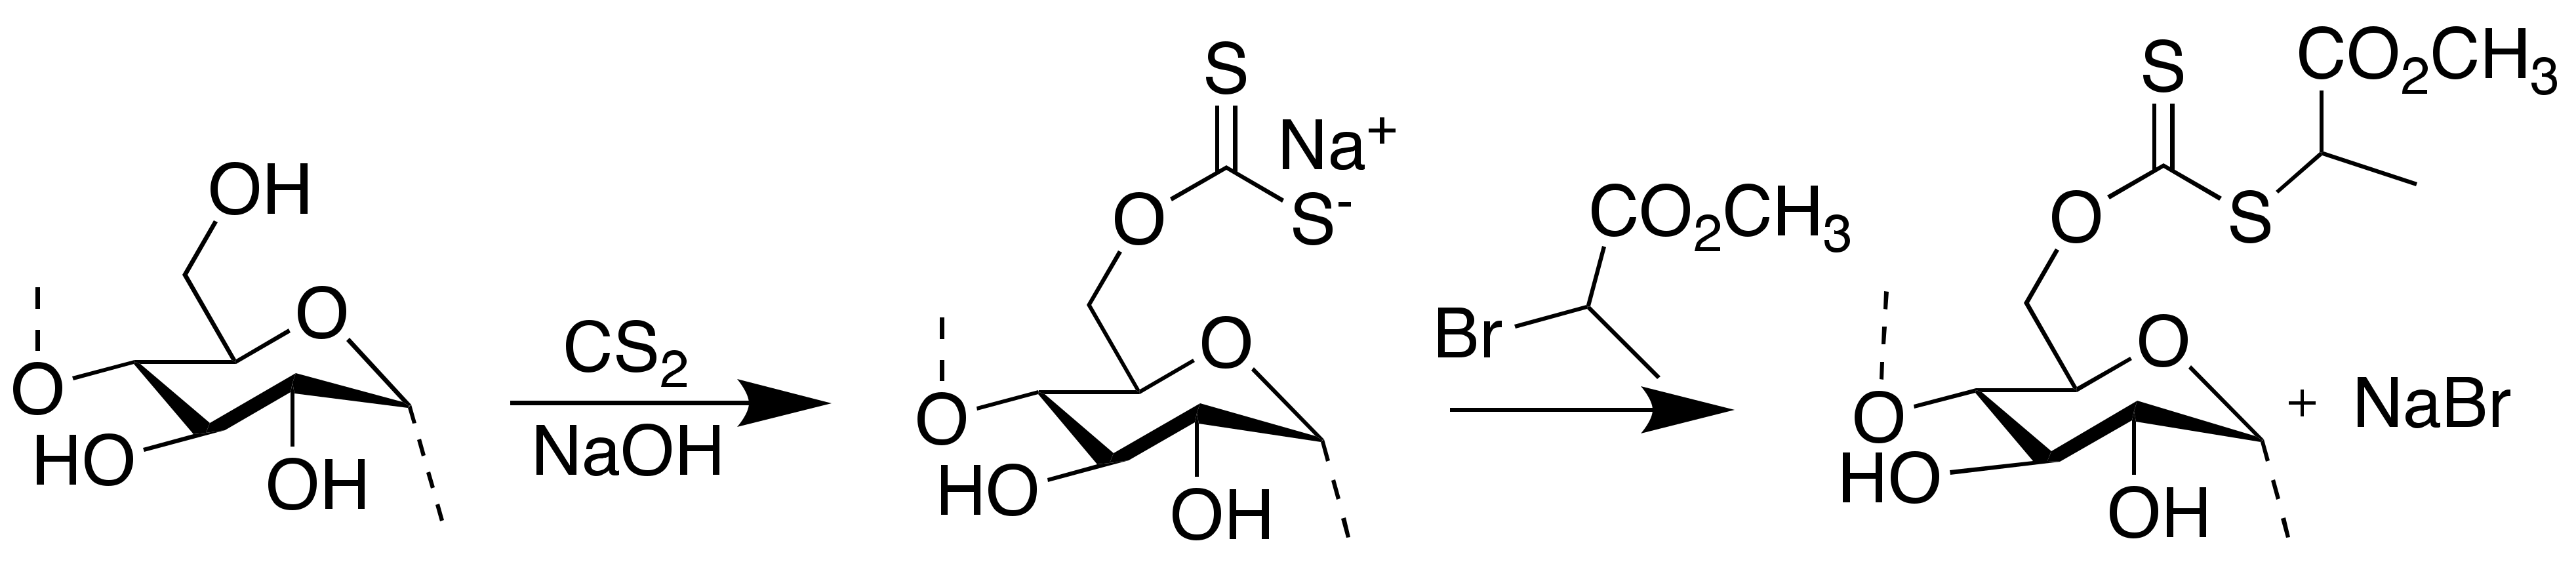
2.2. Synthesis of Xanthanted SNPs

Starch nanoparticles (7.2 g, 6.15 g dry weight, or 38 mmol of glucopyranose units) were dispersed in water (18 mL) in a 50-mL round-bottom flask (RBF). The mixture was vortexed for 15 min and stirred with a magnetic stir bar for 30 min to disperse the nanoparticles. A 2 M NaOH solution (4.5 mL, 9.0 mmol) was then added, and the dispersion was stirred for 30–60 min. CS2 (0.24 mL, 3.97 mmol, for a target DS = 0.105) was then added dropwise and the flask was placed in a water bath at 35 °C. The solution, which turned reddish-orange after 2 h, was allowed to cool to room temperature and was precipitated in methanol. The precipitate was collected by suction filtration, left to dry in a fume hood overnight, and dried in a 60 °C vacuum oven overnight.

2.3. Synthesis of Starch-Based RAFT Agent

The xanthated SNPs (6.14 g, 37.5 mmol glucopyranose units) were added to deionized (DI) water (19.2 mL) in a 50-mL RBF. The solution was vortexed for 15 min and stirred for 60 min, until the polymer was fully dispersed. Methyl 2-bromopropionate (1.20 mL, 10.8 mmol) was then added dropwise and the flask was placed in a water bath at 80 °C for 40 min. The dispersion turned light yellow by the end of the reaction. The product was collected by precipitation in methanol and suction filtration to obtain a powder that was dried further in a vacuum oven overnight at 60 °C.

2.4. Synthesis of SNP-g-PMEO2MA

The starch-based RAFT agent (1.0 g, 5.44 mmol, DS 0.022, 0.12 mmol initiating sites) was added to 9.5 mL of DI water in a 25-mL RBF. The solution was vortexed for 15 min and stirred for 30 min until the solid was fully dispersed in water. Potassium persulfate (19 mg, 0.069 mmol) and MEO2MA (176 mg, 0.935 mmol, for a target PMEO2MA content of 15%) were added to the solution, which was then degassed with gentle N2 bubbling for 30 min and placed in an 80 °C water bath for 60 min. The solution turned milky white by the end of the polymerization reaction but became transparent again upon cooling to room temperature. The crude product was purified against water with a 50 kD MWCO Spectra/Por dialysis bag overnight. The polymer was dried under an N2 stream, and then in a vacuum oven at 60 °C overnight. The yield was 1.11 g (94%), with a PMEO2MA content of 14 wt% by 1H NMR analysis. PMEO2MA contents of 7.5 and 30 wt% were also targeted by varying the amount of MEO2MA added in the reactions. The products were characterized by 1H NMR, UV-visible spectroscopy, and dynamic light scattering (DLS) analysis.

2.5. Synthesis of SNP-g-PMEO2MA-b-PHEA

The starch-based RAFT agent (1.0 g, DS 0.022, 0.12 mmol initiating sites) was added to 9.5 mL of DI water in a 25-mL RBF. The solution was vortexed for 15 min and stirred for 30 min until the solid was fully dispersed in water. Potassium persulfate (19 mg, 0.069 mmol) and 2-HEA (176 mg, 1.52 mmol, for a target PHEA content of 15 wt%) were added to the solution, which was then degassed with gentle N2 bubbling for 30 min and placed in an 80 °C water bath for 60 min. The crude product was purified against water in a Spectra/Por dialysis bag with a 50 kD MWCO overnight. The polymer was dried under an N2 stream, and then in a vacuum oven at 60 °C overnight. SNP-g-PHEA (309 mg, 15 wt% PHEA) was then mixed in 4 mL of water with MEO2MA (54.5 mg, 0.28 mmol, for a target PMEO2MA content of 15 wt%) in a 10-mL RBF by stirring with a magnetic stir bar for 15 min. Potassium persulfate (6.6 mg, 0.024 mmol) was added, the flask was capped and the solution was degassed by bubbling N2 gently for 30 min. The flask was then placed in a water bath at 80 °C for 60 min. The solution turned milky white by the end of the reaction but became clear again upon cooling. The mixture was purified against water in a Spectra/Por dialysis bag (50 kD MWCO) overnight. After dialysis, the polymer solution was first air-dried, and the solid residue was placed in an oven at 60 °C overnight. The product was characterized by 1H NMR and UV-visible spectroscopy. A sample denoted as SNP(DS 0.022)-g-PMEO2MA(30%)-b-PHEA(15%) was prepared and characterized by the same procedures.

2.6. Cleavage of PMEO2MA from SNP-g-PMEO2MA

A 400-mg sample of SNP-g-PMEO2MA (15%, DS 0.022) was dispersed in 4 mL of DI water in a 10-mL RBF. A 1-mL aliquot of H2O2 (30 wt% H2O2, 32 mmol) was added and the reaction was stirred at 70 °C for 48 h. A white precipitate formed, while the supernatant changed from cloudy to clear as the reaction proceeded. The precipitate was separated from the supernatant and both fractions were air-dried in a fume hood, and then in a vacuum oven at 60 °C overnight. The supernatant and precipitate fractions were analyzed by 1H NMR. The precipitate was also dispersed in DMF for GPC characterization.

2.7. Characterization Techniques

The modified SNPs were characterized by 1H NMR, UV-visible spectroscopy, DLS, and TEM. GPC analysis was used to characterize the grafted polymer chains. The bitumen content of the oil sand samples was determined by Soxhlet extraction.

2.7.1. 1H NMR

The samples (20 mg) were dispersed in 1 mL of deuterated solvent. Most spectra were recorded at 25 °C on a 300 MHz Bruker instrument with 128 scans averaged, but a 500 MHz Bruker spectrometer was also used for temperature-dependent measurements. The polymer-grafted SNPs and the cleaved SNPs were dispersed in D2O, and the cleaved polymer chains were dissolved in DMSO-d6 for analysis. The reported chemical shifts are relative to the solvent protons at 4.74 ppm for H2O and 2.50 ppm for DMSO-d6.

2.7.2. UV-Visible Spectroscopy

Polymer-grafted SNP samples were prepared in water at a concentration of 1 mg/mL for SNP-g-PMEO2MA and SNP-g-PMEO2MA-b-PHEA and loaded in a 1 cm path length cuvette. The lower critical aggregation temperature (LCAT) of the samples was determined on a Carry 4000 spectrometer at 500 nm wavelength, using a temperature ramp of 1 °C/min. The LCAT was taken as the temperature at which aggregation started, depicted by an initial drop in % transmittance.

2.7.3. DLS Analysis

Dynamic light scattering measurements were conducted on a Malvern Zetasizer Nano S instrument with Non-Invasive Back Scatter (NIBS) technology. An aqueous solution of SNP-g-PMEO2MA (15%, DS 0.022) was prepared at a concentration of 1 mg/mL and loaded in a 1 cm path-length cuvette. A concentration of 1 mg/mL was selected (to obtain a count rate over 100 kcounts/s) and the samples were filtered at 25 °C through 0.45 μm polytetrafluoroethylene (PTFE) membrane filters with a syringe prior to the measurements, taken at 5 °C intervals.

2.7.4. Transmission Electron Microscopy (TEM)

The SNP and SNP-g-PMEO2MA (15%, DS 0.022) samples were diluted to 0.1 mg/mL in DI water. An 8-μL aliquot of the solution was deposited onto a 400-mesh grid coated with carbon-formvar and was allowed to dry overnight. On the following day, 5 mg of iodine was placed with the TEM grid in a covered petri dish to stain the SNPs overnight. The sample was then imaged at 60 kV on a CM10 Philips microscope with a charge-coupled device (CCD) camera.

2.7.5. Gel Permeation Chromatography

The number-average molecular weight (Mn) and polydispersity index (PDI = Mw/Mn) of the grafted polymer chains were determined on a Hewlett Packard 1100 high-performance liquid chromatography (HPLC) system with a refractive index (RI) detector and two Jordi Resolve columns (model number R15076, with 5 μm bead size), each with 300 mm length × 7.8 mm internal diameter. The instrument used DMF with 0.1% LiCl as the mobile phase at a flow rate of 0.9 mL/min and 40 °C, and the samples were injected at a concentration of 3 mg/mL after filtration through 0.2 μm PTFE membrane filters. Polystyrene standards were used to calibrate the instrument.

2.7.6. Measurement of Fines and Bitumen Contents in IOos and SBos

A 1.00 g oil sand sample was loaded in a 20-mL vial and toluene (10 mL) was added. The vial was vortexed for 5 min to dissolve the bitumen and suction filtration was used to separate the dissolved bitumen from the quartz sand and clay components. The solid residue was air-dried for 30 min, water (10 mL) was added and the sample was vortexed for 5 min. The mixture was then allowed to settle on the benchtop for 7 h for a qualitative analysis based on the turbidity of the solution.
Soxhlet extraction was used to determine the bitumen content of the oil sand samples. Filter paper was wrapped around the 1 g oil sand sample and loaded in the Soxhlet extractor. The extraction was performed with refluxing THF in a 50 mL tared round bottom flask for 3 h. After extraction the THF was evaporated under a nitrogen stream, leaving a film of bitumen in the flask. The sample was dried in a vacuum oven at 70 °C. The mass of bitumen recovered divided by the mass of the oil sand sample was used to estimate its bitumen content. The experiments were repeated three times to determine the oil content of each type of oil sand. The remaining solid residue of sand particles, passed through a sieve with a mesh size of 44 μm after bitumen extraction, was used to distinguish fine particles from coarse sand particles.

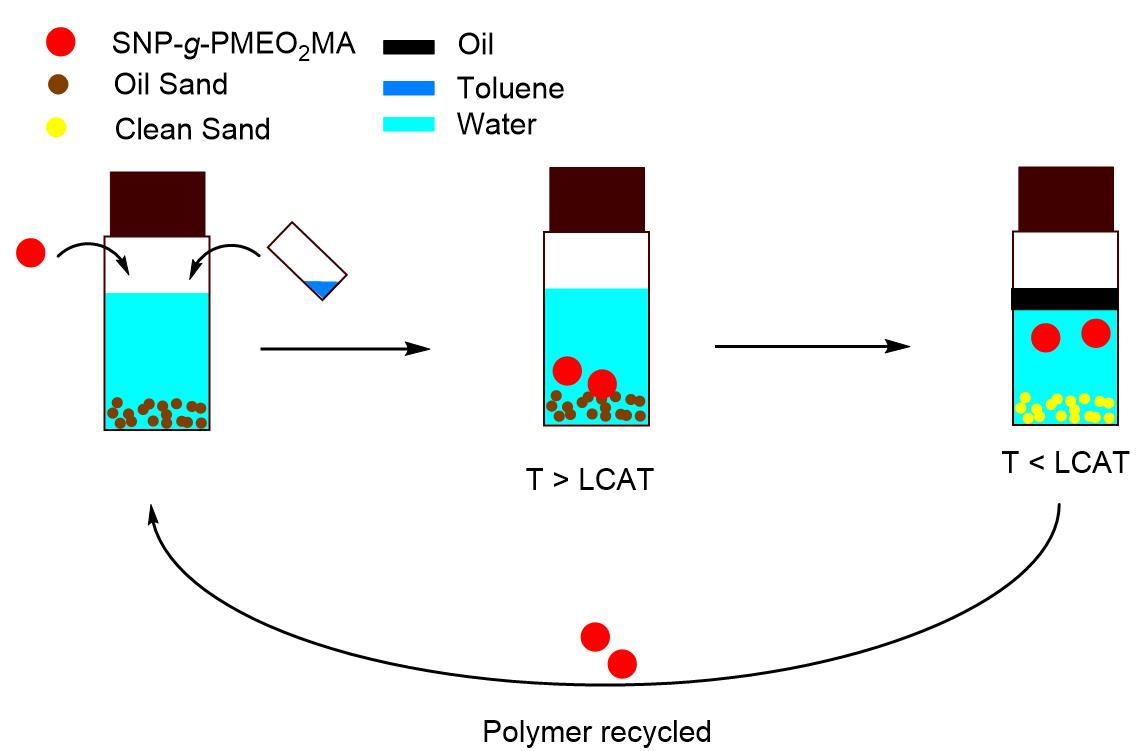
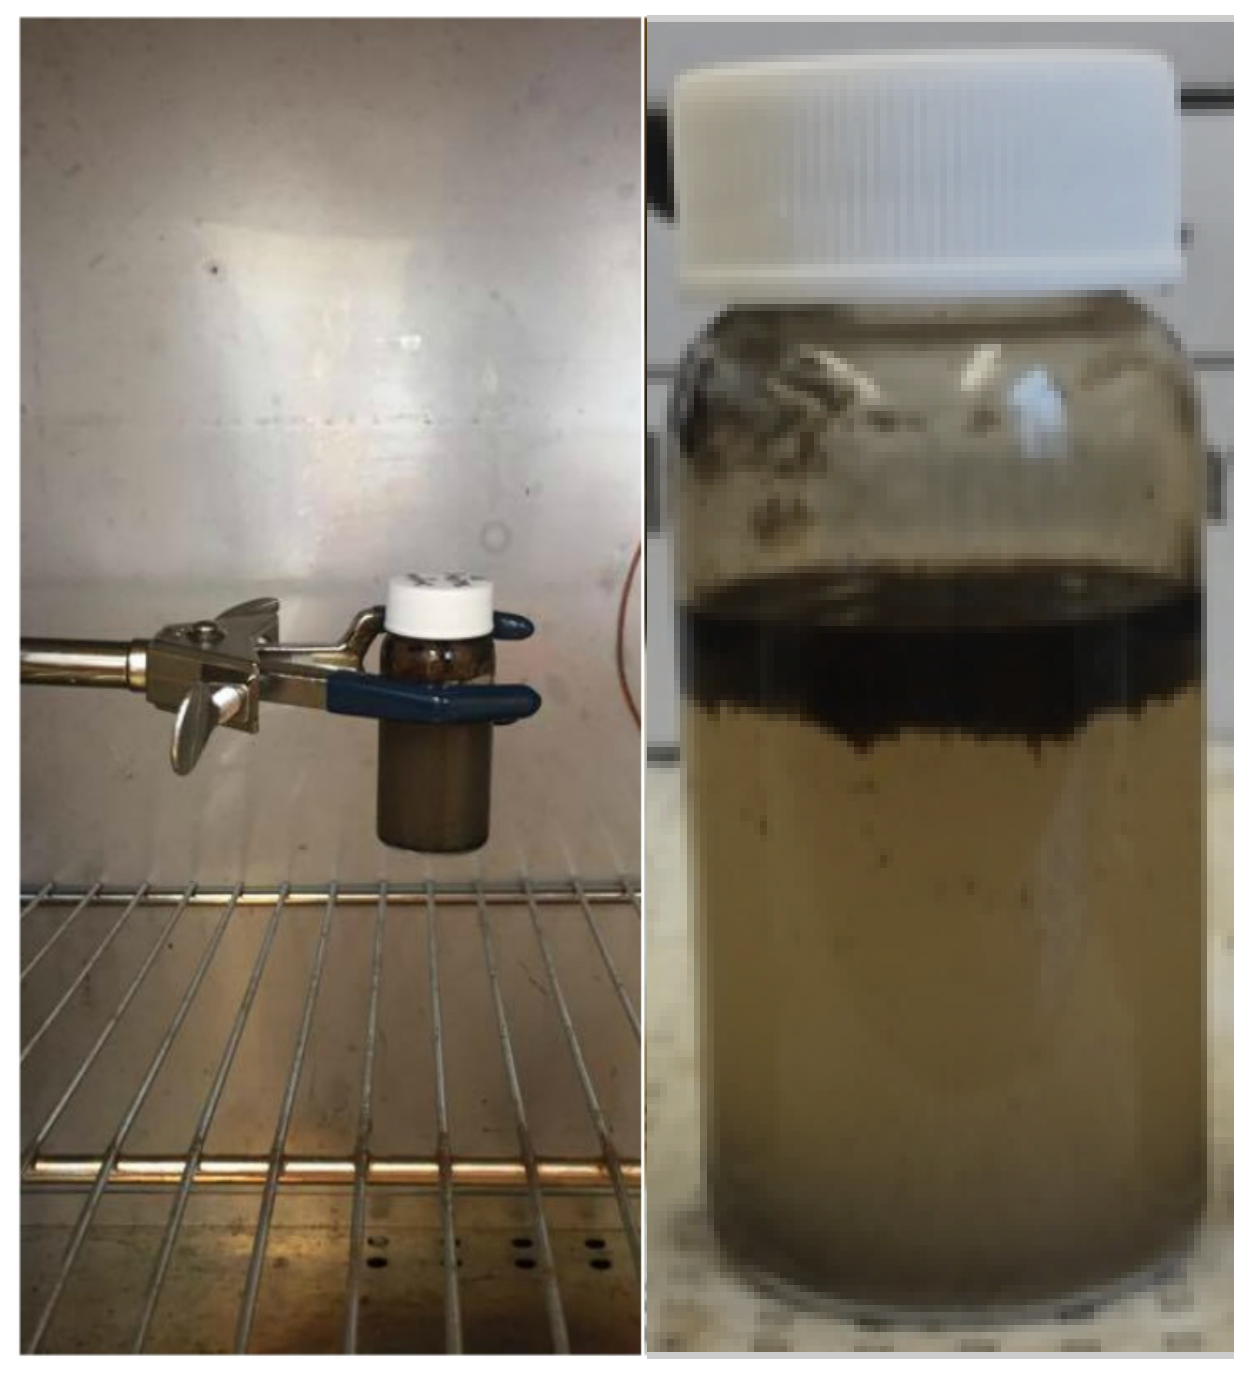
2.8. Bitumen Extraction Procedure

In a typical extraction experiment, 15 mg of SNP-g-PMEO2MA or SNP-g-PMEO2MA-b-PHEA was dispersed in water (15 mL) in a beaker by stirring for 30 min. When used, NaCl (0.44 g, 7.53 mmol) was added to the solution, and stirring was continued for 5 min. An oil sand sample (1.00 ± 0.01 g) was loaded in a 61 mm × 28 mm screwcap vial, after removing large stones and debris by hand. The SNP-g-PMEO2MA solution was then added to the vial, followed by toluene (60 mg). The amounts of polymer and toluene used were varied to investigate the effects of these parameters on the extraction process. Triplicate samples were prepared for each experiment and the vials were mounted on a mechanical rotating arm in an oven at 45 °C. The vials were tumbled in the oven for 24 h at 53 rotations/min. The vials were then removed and left to stand on the bench to allow the sand, bitumen, and water to separate for 24 h.
After the mixture settled, drops of toluene were added with a Pasteur pipette to remove the bitumen on the walls of the vial and the cap. The bitumen layer at the top was removed with a Pasteur pipette, a mixture of THF and toluene (1:4 ratio by volume) was used to extract the bitumen remaining in the top and middle (emulsified) layers with a Pasteur pipette, and the two sample fractions were combined in a clean tared vial for quantification. Residual bitumen in the bottom layer, mixed with the quartz sand, was extracted with THF, and transferred to a clean tared vial for quantification. The bitumen solutions in the collection vials were dried on a hot plate at 120 °C overnight and weighed. The bitumen extraction efficiency was calculated as the mass of bitumen from the top and middle layers over the total amount of bitumen collected (Equation (1)). For the recycling experiments discussed in Section 3.8.3, a gentle stream of nitrogen was used to evaporate residual toluene from the surface of the aqueous phase prior to the next extraction cycle, to avoid introducing additional amounts of toluene in the extraction process.
Extraction   Efficiency = m top   layer +   m middle   layer m top   layer + m bottom   layer + m middle   layer × 100 %

3. Results

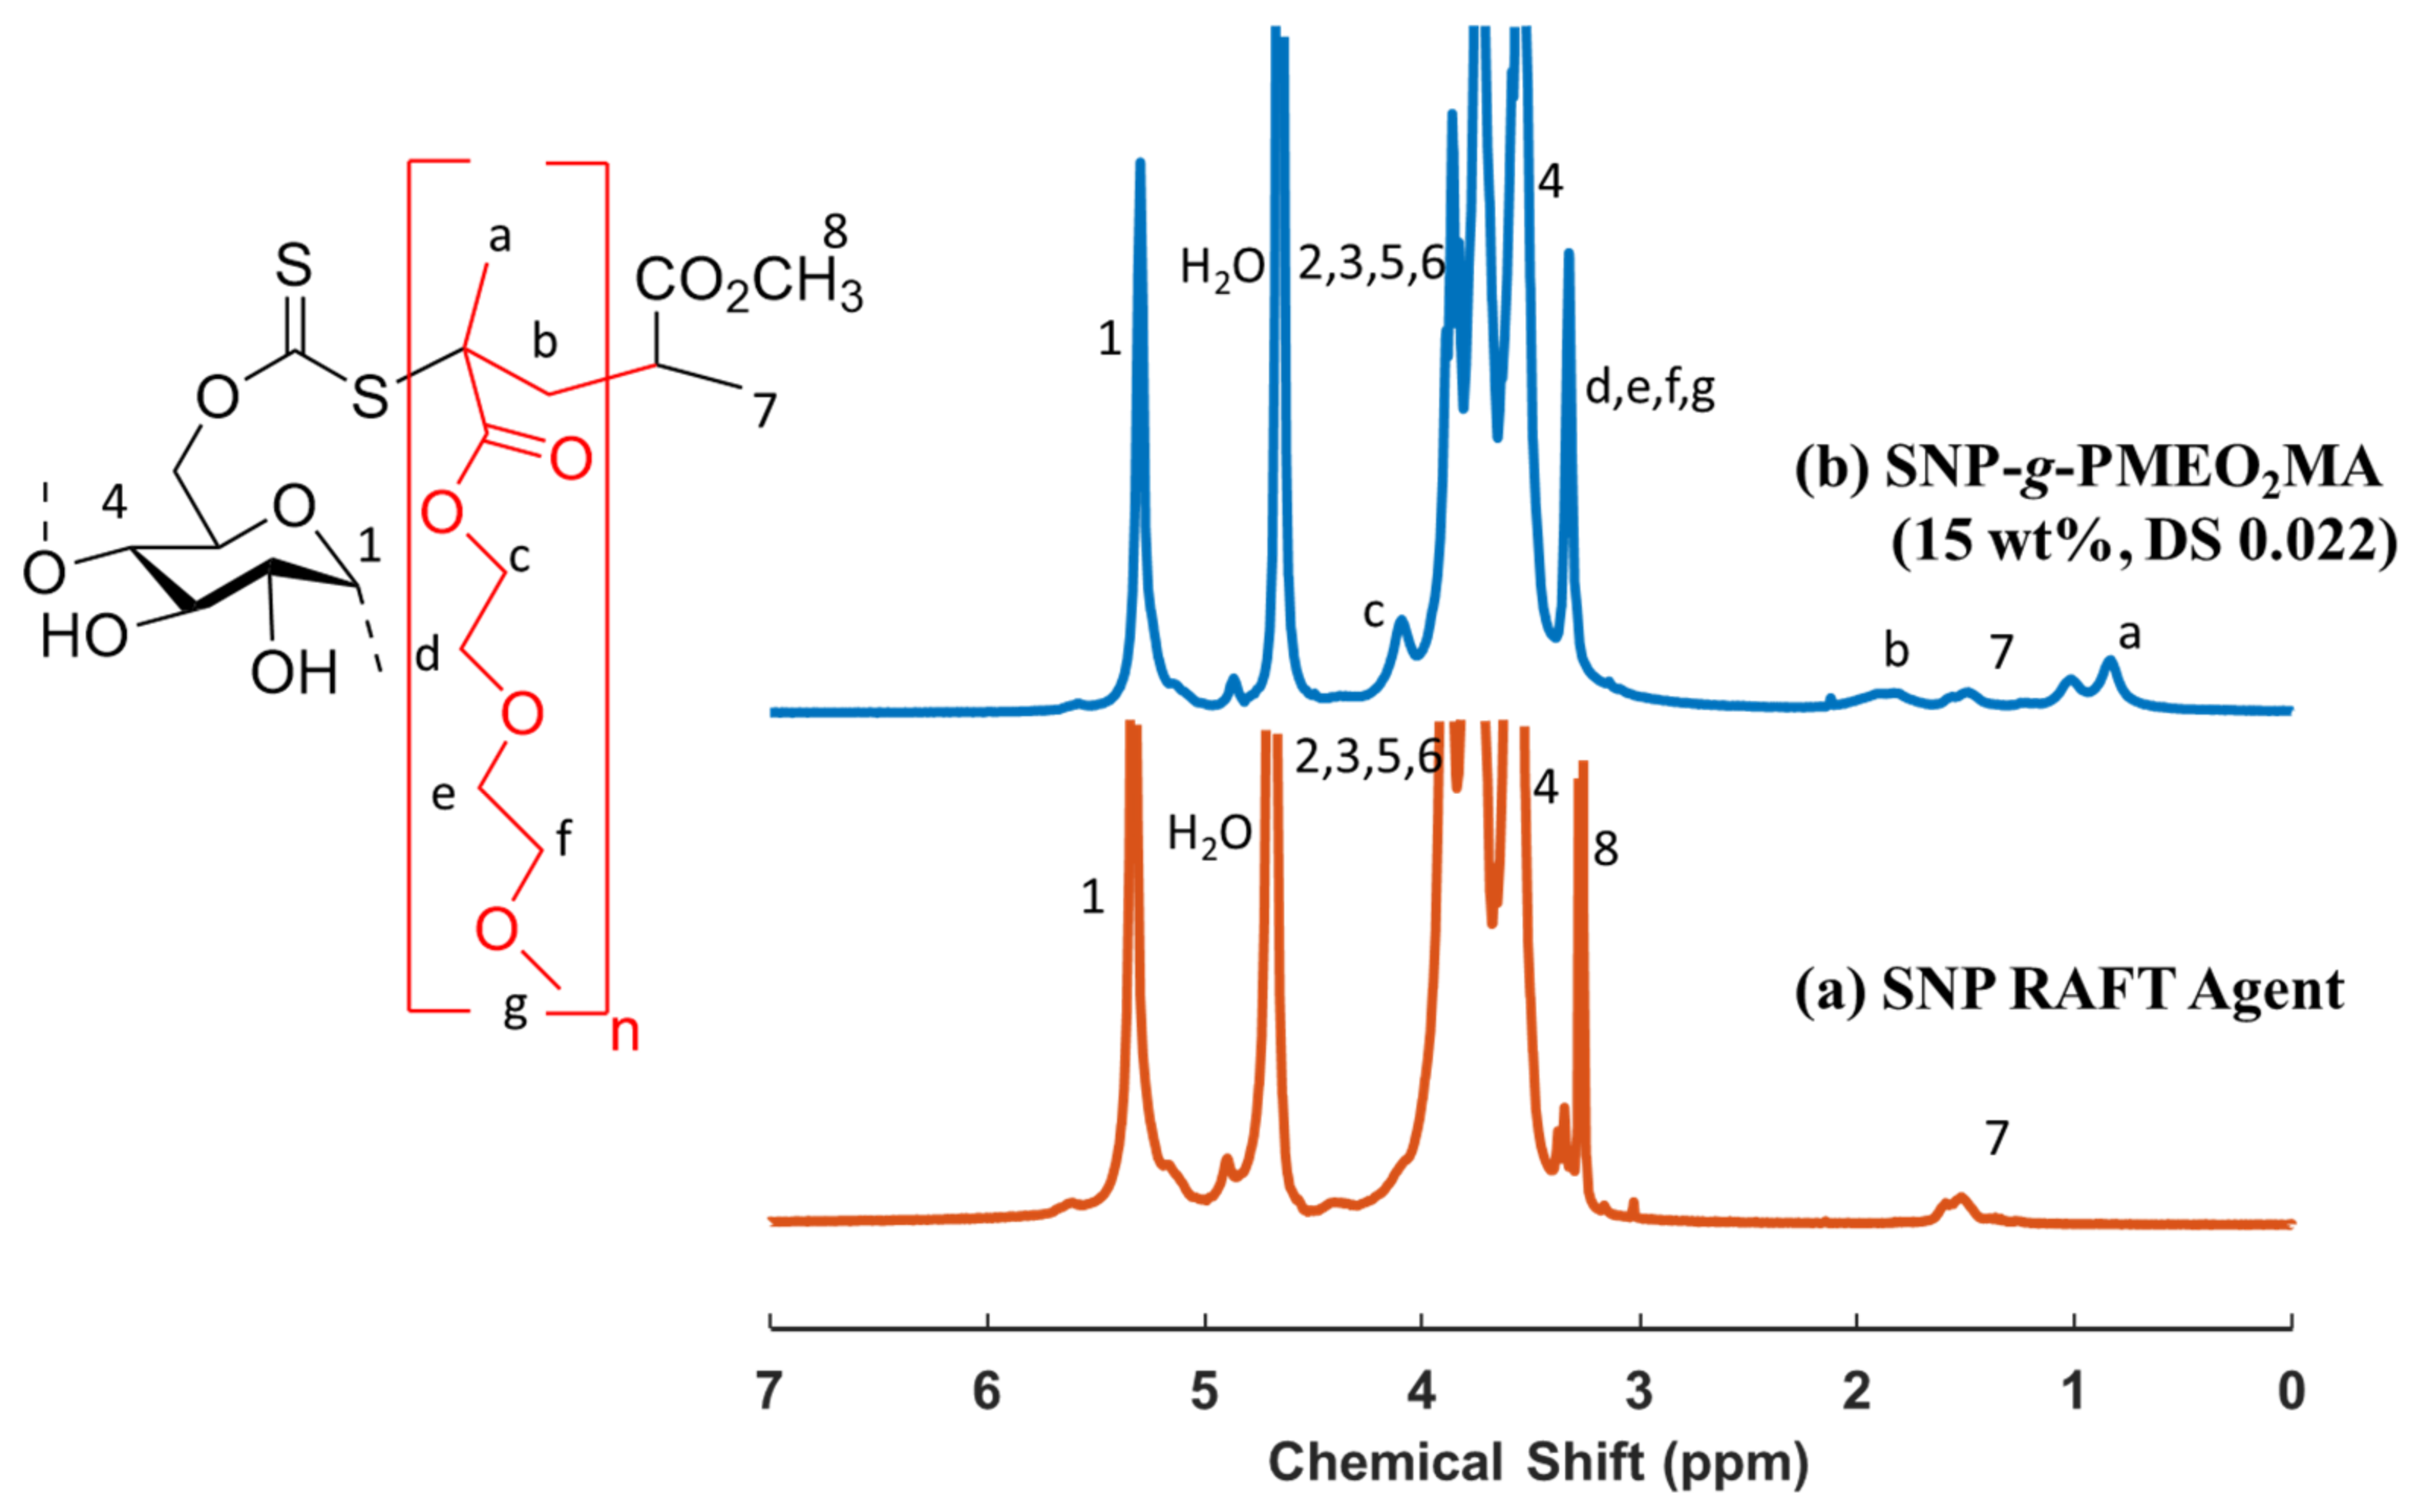
3.1. Synthesis of the RAFT Agent and SNP-g-PMEO2MA

The first step in the synthesis involved the modification of the SNPs to introduce thiocarbonylthio groups, serving as RAFT initiating sites. This was done by first reacting the hydroxyl groups of the glucopyranose units with carbon disulfide in the presence of sodium hydroxide. The resulting xanthated starch was then reacted with methyl 2-bromopropionate to obtain the RAFT agent (Scheme 1). Methyl 2-bromopropionate was selected because the methyl 2-propionyl group is known to be an efficient free radical homolytic-leaving group in RAFT agents [18,19]. It is polar due to the presence of carbon-oxygen bonds and is less bulky than aromatic substituents. It generates a secondary radical, which provides good control over methacrylate monomer polymerization. It is also comparable in structure to the methacrylate propagating radical centers, and thus should be capable of initiating the polymerization efficiently [20].
The number of sodium xanthate groups introduced on the SNPs in the first step was controlled by varying the concentration of CS2 in the reaction. The DS was determined in the second step, after reacting the xanthated SNP with methyl 2-bromopropionate. The DS achieved in the second reaction step, corresponding to the number of thiocarbonylthio groups per glucopyranose unit, was calculated by integrating the signal for the anomeric C-1 proton (1H, 5.0–5.5 ppm) of starch and the three methyl protons (3H, 1.4–1.7 ppm) of the methyl 2-propionate fragment, as shown in Figure 1a. The peak at 4.5–4.8 ppm is from residual water in the D2O used as solvent [21]. RAFT agents with different DS were synthesized by varying the amount of CS2 used in the first step of the reaction, while keeping all other variables constant. Using the spectrum provided in Figure 1a as an example, the DS of the RAFT agent was calculated from the equation.
DS = Area   of   methyl   peak / 3 Area   of   anomeric   proton   peak   = 0.066 / 3 1.000 = 0.022
The weight fraction of PMEO2MA in the samples was calculated by integrating the methyl protons (3H, 0.71–1.14 ppm) and the anomeric proton peak for the SNP (1H, 5.00–5.55 ppm) (Figure 1b). An example of PMEO2MA weight fraction (wt%) calculation is provided below.
Wt %   PMEO 2 MA = Area   of   PMEO 2 MA   peak 3 × MW MEO 2 MA MW glucopyranose   unit + Area   of   PMEO 2 MA   peak 3 × MW MEO 2 MA × 100 %
Wt %   PMEO 2 MA = 0.42 3 × 188.2 162.16 + 0.42 3 × 188.2 × 100 % = 14.0   %
The monomer conversion in the RAFT reaction was calculated as follows:
Monomer   convesion   % = Experimental   wt %   PMEO 2 MA Theoretical   wt %   PMEO 2 MA = 14.0 % 15 % = 93 .   3 %

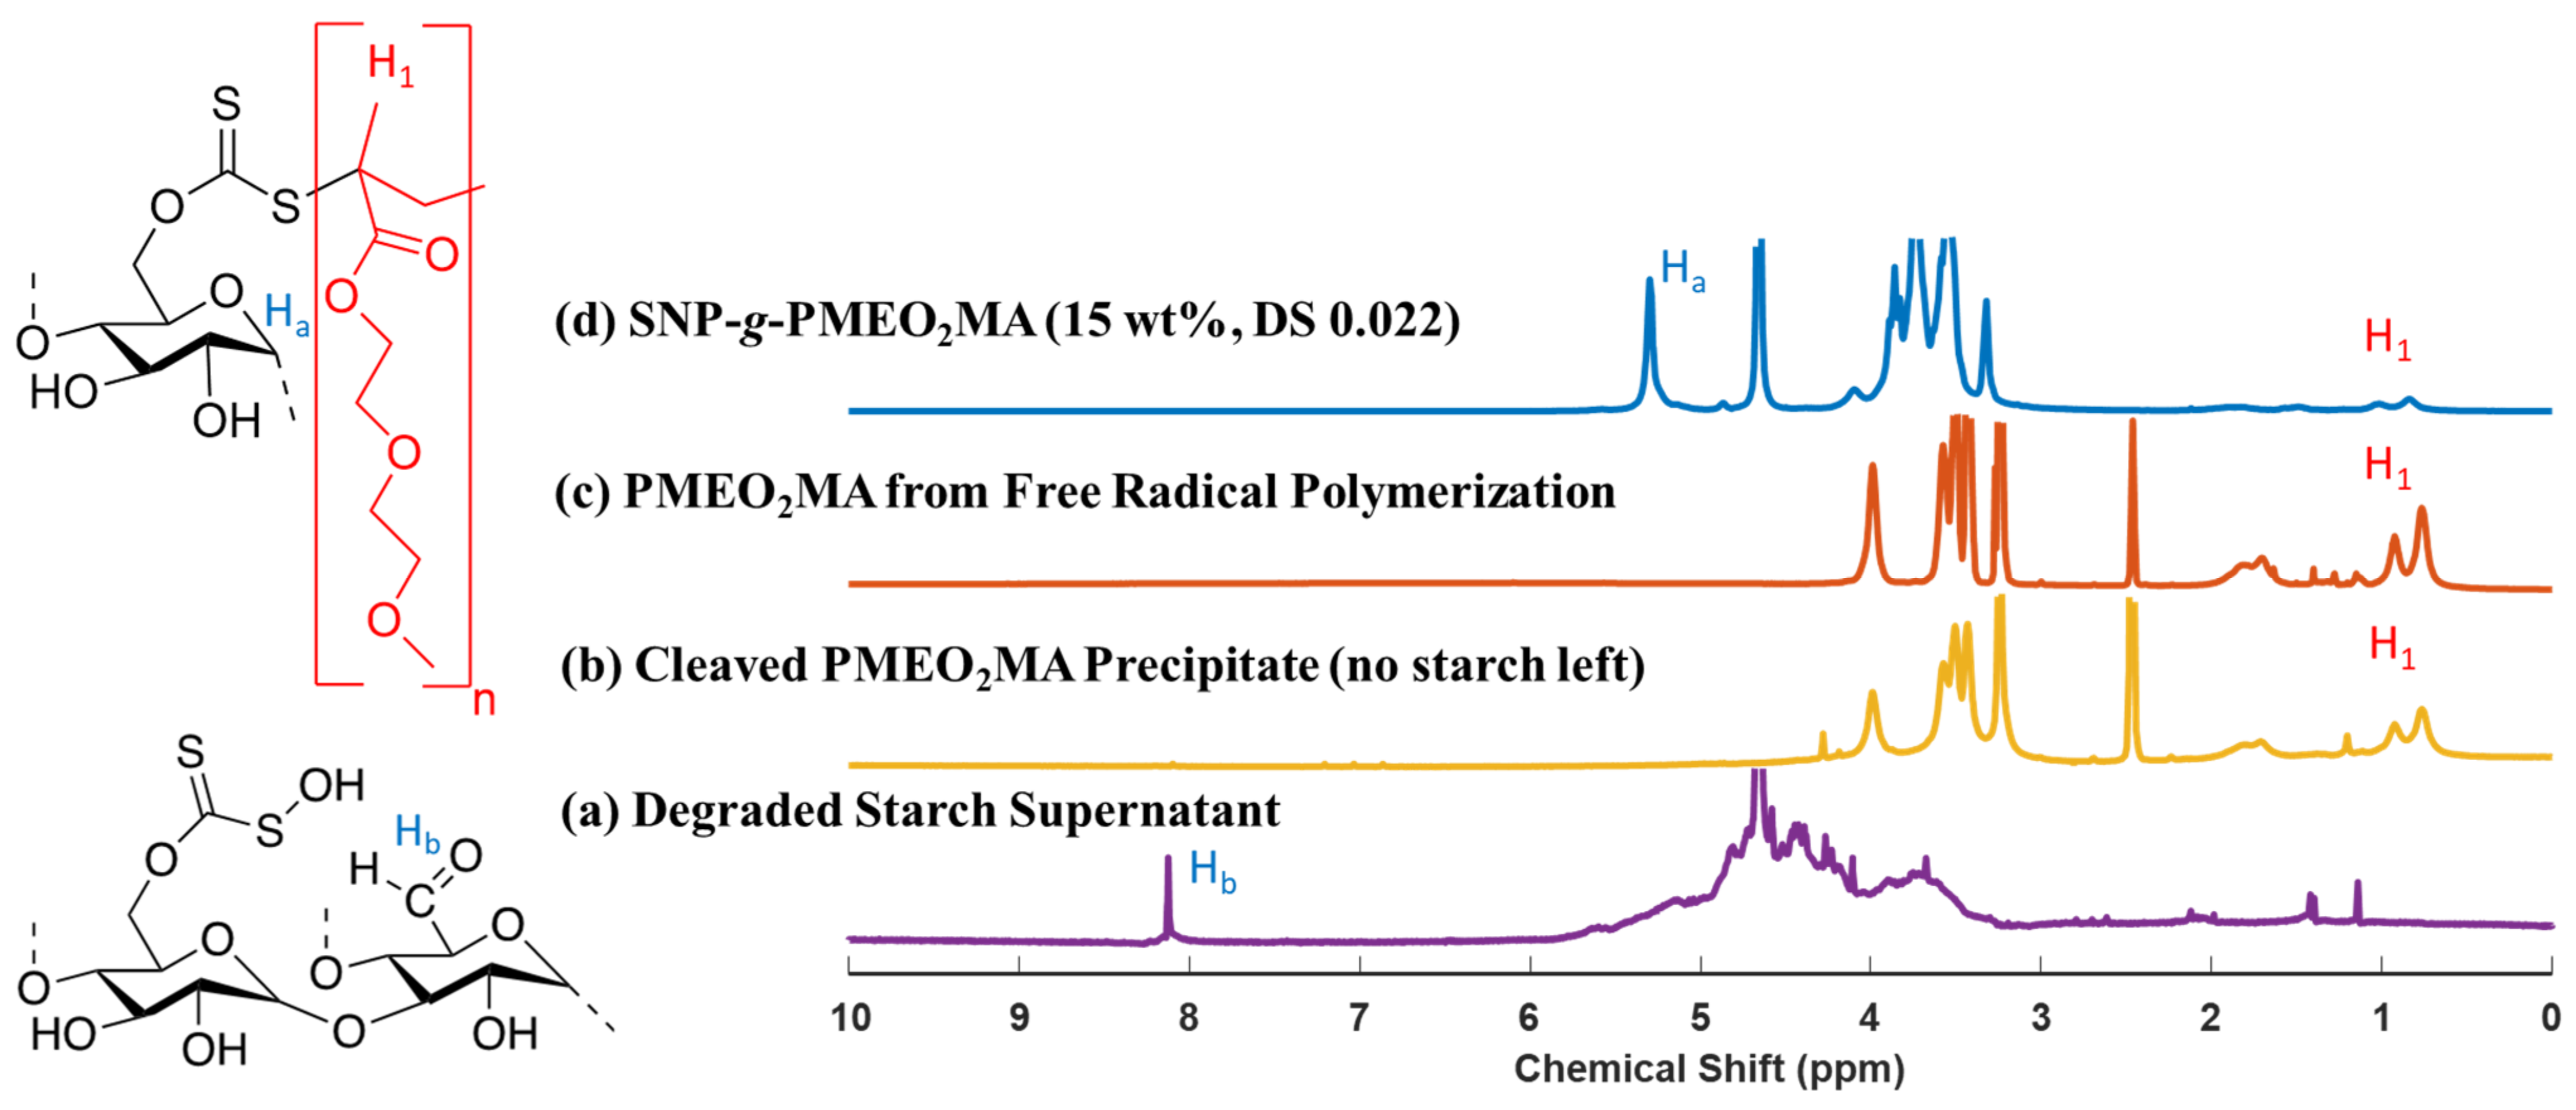
3.2. Cleavage of PMEO2MA from SNP-g-PMEO2MA

The RAFT polymerization mechanism involves the addition of monomer units at the C-S bond of the RAFT agent connected to the starch substrate. The resulting polymer, therefore, retains the thiocarbonylthio group, derived from the xanthated SNPs in this case. The thiocarbonylthio group can be cleaved from the attached polymer chain [22], however, such that characterization of the grafted PMEO2MA chains by GPC analysis would be possible after cleavage from the starch substrate. Thiocarbonylthio groups can undergo different reactions such as nucleophilic addition, aminolysis, ozonolysis, thermolysis, and cleavage through the addition of excess initiator [22]. It should also be considered that the ether (C-O-C) and ester linkages in the glycol side chains of PMEO2MA can be cleaved in the presence of a strong acid and/or nucleophile. Consequently, radical-induced cleavage was selected to isolate the PMEO2MA chains from the starch substrate, using H2O2 as a water-soluble reagent. In the presence of heat and/or UV light, the peroxide breaks down to ·OH radicals that can penetrate the grafted SNPs and degrade the thiocarbonylthio groups, inducing the cleavage reaction. These conditions are also mildly acidic, since H2O2 solutions are maintained slightly acidic to improve their stability. The use of H2O2 is interesting because water and oxygen are the only by-products generated in the reaction [23,24]. The polymer-grafted SNP samples were thus heated to 70 °C in the presence of H2O2 for 48 h to cleave the thiocarbonylthio moieties in SNP-g-PMEO2MA (15%, DS 0.022). Two fractions were visible at the end of the reaction: a white sticky precipitate was formed at the bottom, while the supernatant was a clear liquid that did not exhibit an LCST upon heating. Analysis by 1H NMR spectroscopy in D2O of the sample fraction remaining soluble in water at 70 °C (Figure 2a), well above the LCST of PMEO2MA, showed that the SNPs underwent oxidative degradation to shorter chains and/or oxidized saccharide derivatives. Since the ·OH radicals are also strong oxidants, they are indeed capable of oxidizing the primary and secondary alcohol moieties in starch to carbonyl groups, more specifically aldehydes for primary alcohols and ketones for secondary alcohols [25]. The intensity of the anomeric proton signal (1H, 5.0–5.5 ppm) was strongly decreased, and the Hb proton peak at 8.0–8.3 ppm likely corresponds to an aldehyde group [26]. The sample fraction insoluble in water at 70 °C was only partially soluble at room temperature, so it was analyzed by 1H NMR spectroscopy in DMSO-d6 (Figure 2b) and corresponded to cleaved PMEO2MA chains: the methyl protons (0.71–1.14 pm) and the diethylene glycol groups (3.25–3.50 ppm) from PMEO2MA are clearly visible, while there is no peak at 5.0–5.5 ppm, confirming that the polymer was cleaved from the SNPs.
SNP-g-PMEO2MA, DS 0.022, with 7.5, 15, and 30 wt% target PMEO2MA contents, and SNP-g-PMEO2MA, DS 0.012, with 15 wt% target PMEO2MA content, were analyzed to demonstrate control over the molecular weight of the grafted PMEO2MA chains as a function of the reaction conditions used. The apparent (polystyrene-equivalent) Mn of the cleaved PMEO2MA chains for SNP-g-PMEO2MA at 7.5–30 wt% target PMEO2MA and DS 0.022 increased from 30.8–57.5 kg/mol, with polydispersity index (PDI) values of 1.59–1.64 (Table 1). The SNPs had a comparatively high PDI of 3.0. A PDI of 1.3 was reported by Pfukwa et al. when the Z group was removed by heating a RAFT-synthesized poly(N-vinylpyrrolidone) with H2O2 [24]. Nevertheless, the grafted PMEO2MA chains obviously increased in length when more monomer was added at constant DS in our system. The cleaved PMEO2MA chains of SNP-g-PMEO2MA (15%, DS 0.012) had an Mn = 58.6 kg/mol (PDI = 1.86), as compared with Mn = 43.3 kg/mol (PDI = 1.64) for SNP-g-PMEO2MA (15%, DS 0.022) (Table 1). The PMEO2MA chains were therefore shorter for the DS 0.022 substrate as compared to DS 0.012. This is expected, as a RAFT SNP substrate with a higher DS should generate more shorter polymer chains due to its numerous reaction sites, while a lower DS will produce fewer longer polymer chains due to its decreased number of reaction sites.
The theoretical Mn values estimated from NMR analysis, by considering the DS of the substrate and the amount of monomer added in the reactions, were much lower than the apparent Mn values obtained by GPC analysis with a polystyrene standards calibration curve. The theoretical Mn calculations assumed that all the RAFT-initiating sites participated in the polymerization reaction (initiation efficiency = 1). This was clearly not the case, as the experimental Mn (from GPC) was much higher than the theoretical Mn in all cases. The large (up to 50-fold) Mn differences simply cannot be explained by the use of a polystyrene calibration curve in the GPC analysis, but more likely by the fact that very few RAFT sites on starch initiated the polymerization. The ratio of experimental to theoretical Mn values corresponds to initiator efficiencies of 0.020–0.055 (2.0–5.5%), indicating that polymerization only involved a small fraction of the RAFT sites on starch (Table 1). This could be due to the inability of the MEO2MA monomer to reach the RAFT sites present within the SNPs. Since the reaction was carried out at 80 °C, monomers added to the hydrophobic PMEO2MA chains on the surface of the SNPs would have favored their growth, while RAFT sites buried within the SPN substrates would have become increasingly inaccessible.

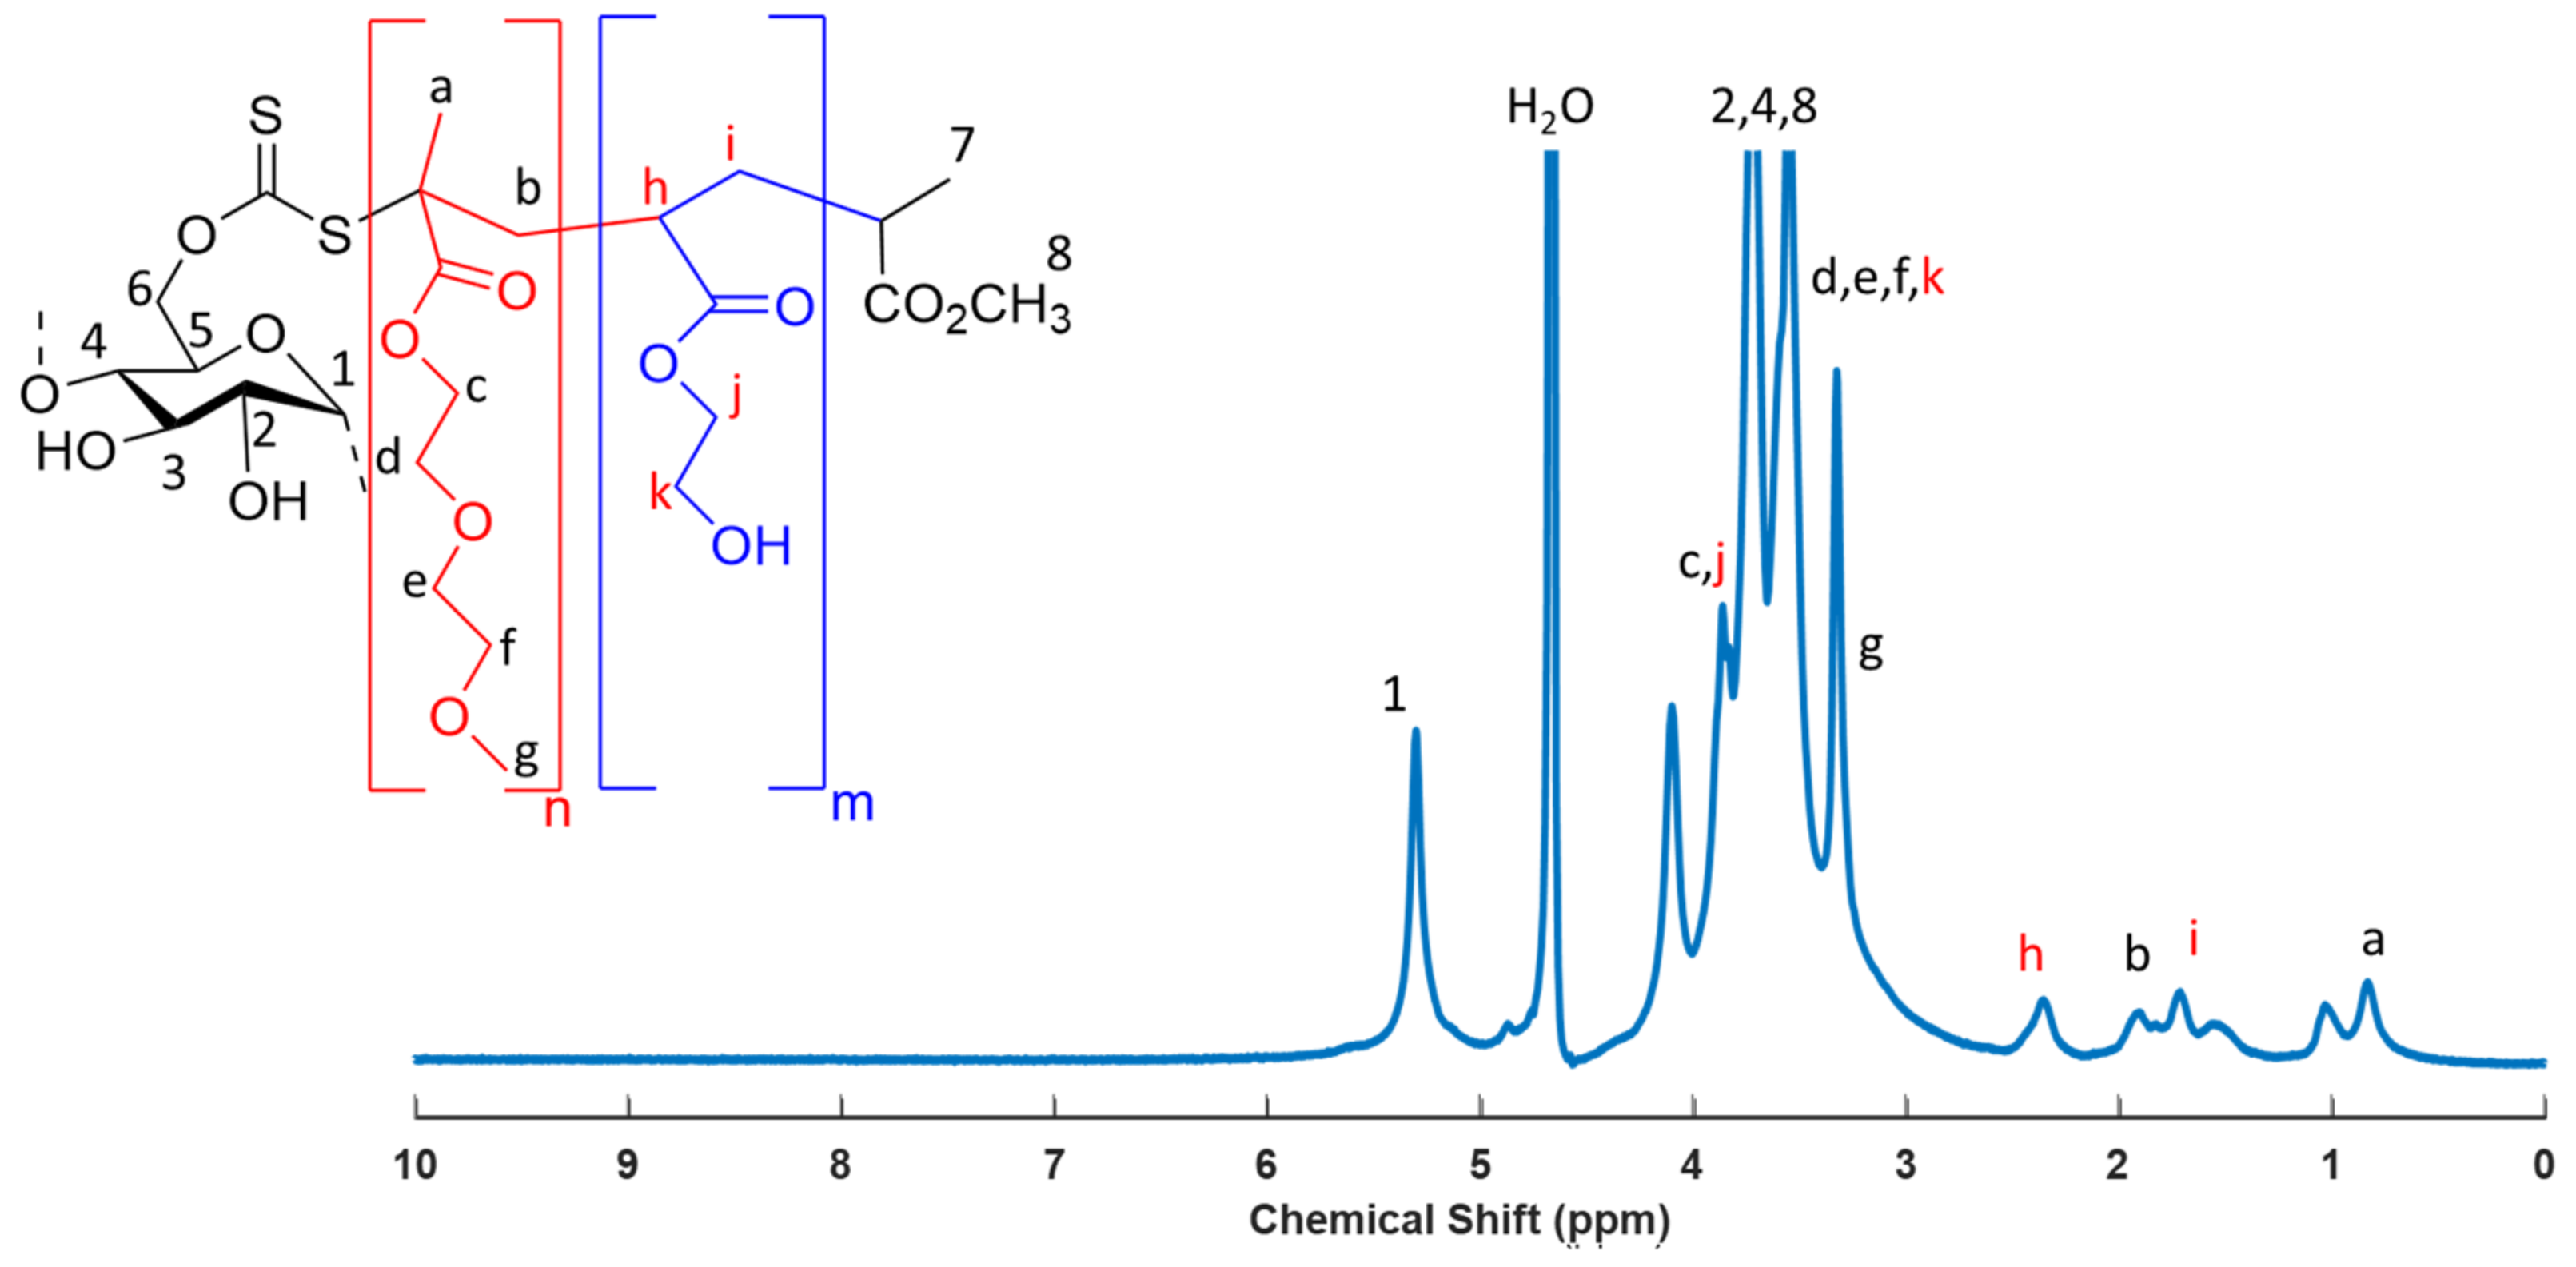
3.3. Synthesis of SNP-g-PMEO2MA-b-PHEA

Since RAFT polymerization involves the insertion of monomer units at the C-S bond connected to the starch substrate, SNP-g-PHEA had to be synthesized first, so as to insert the PMEO2MA block between the SNP and the PHEA chain segment. The idea was indeed to produce nanoparticles with an SNP core, PMEO2MA chains attached to it, and a shell of hydrophilic PHEA segments.
Sample SNP-g-PMEO2MA-PHEA (30 wt% PMEO2MA, 15 wt% PHEA), derived from the RAFT substrate with DS 0.022, was analyzed by 1H NMR. The grafted PHEA content was determined after dialysis, by integration of the CH signal from the PHEA backbone (1H, 2.3 ppm) and the anomeric proton (1H, 5.0–5.5 ppm, Figure 3).
An example of PHEA weight fraction calculation is provided below:
Wt %   PHEA = Area   of   PHEA   peak × MW HEA MW glucopyranose   unit + Area   of   PHEA × MW HEA + PMEO 2 MA 3 × MW PMEO 2 MA × 100 %
Wt %   PHEA = 0.35 × 116.12 162.16 + 0.35 × 116.12 + 0.90 / 3 * 188.2 × 100 % = 15.6 %
The monomer conversion in the polymerization reaction, calculated as follows, corresponds to full conversion within experimental error limits:
Monomer   convesion   % = Experimental   wt %   PHEA Target   Theoretical   wt %   PHEA = 15.6 % 15 % = 104 %

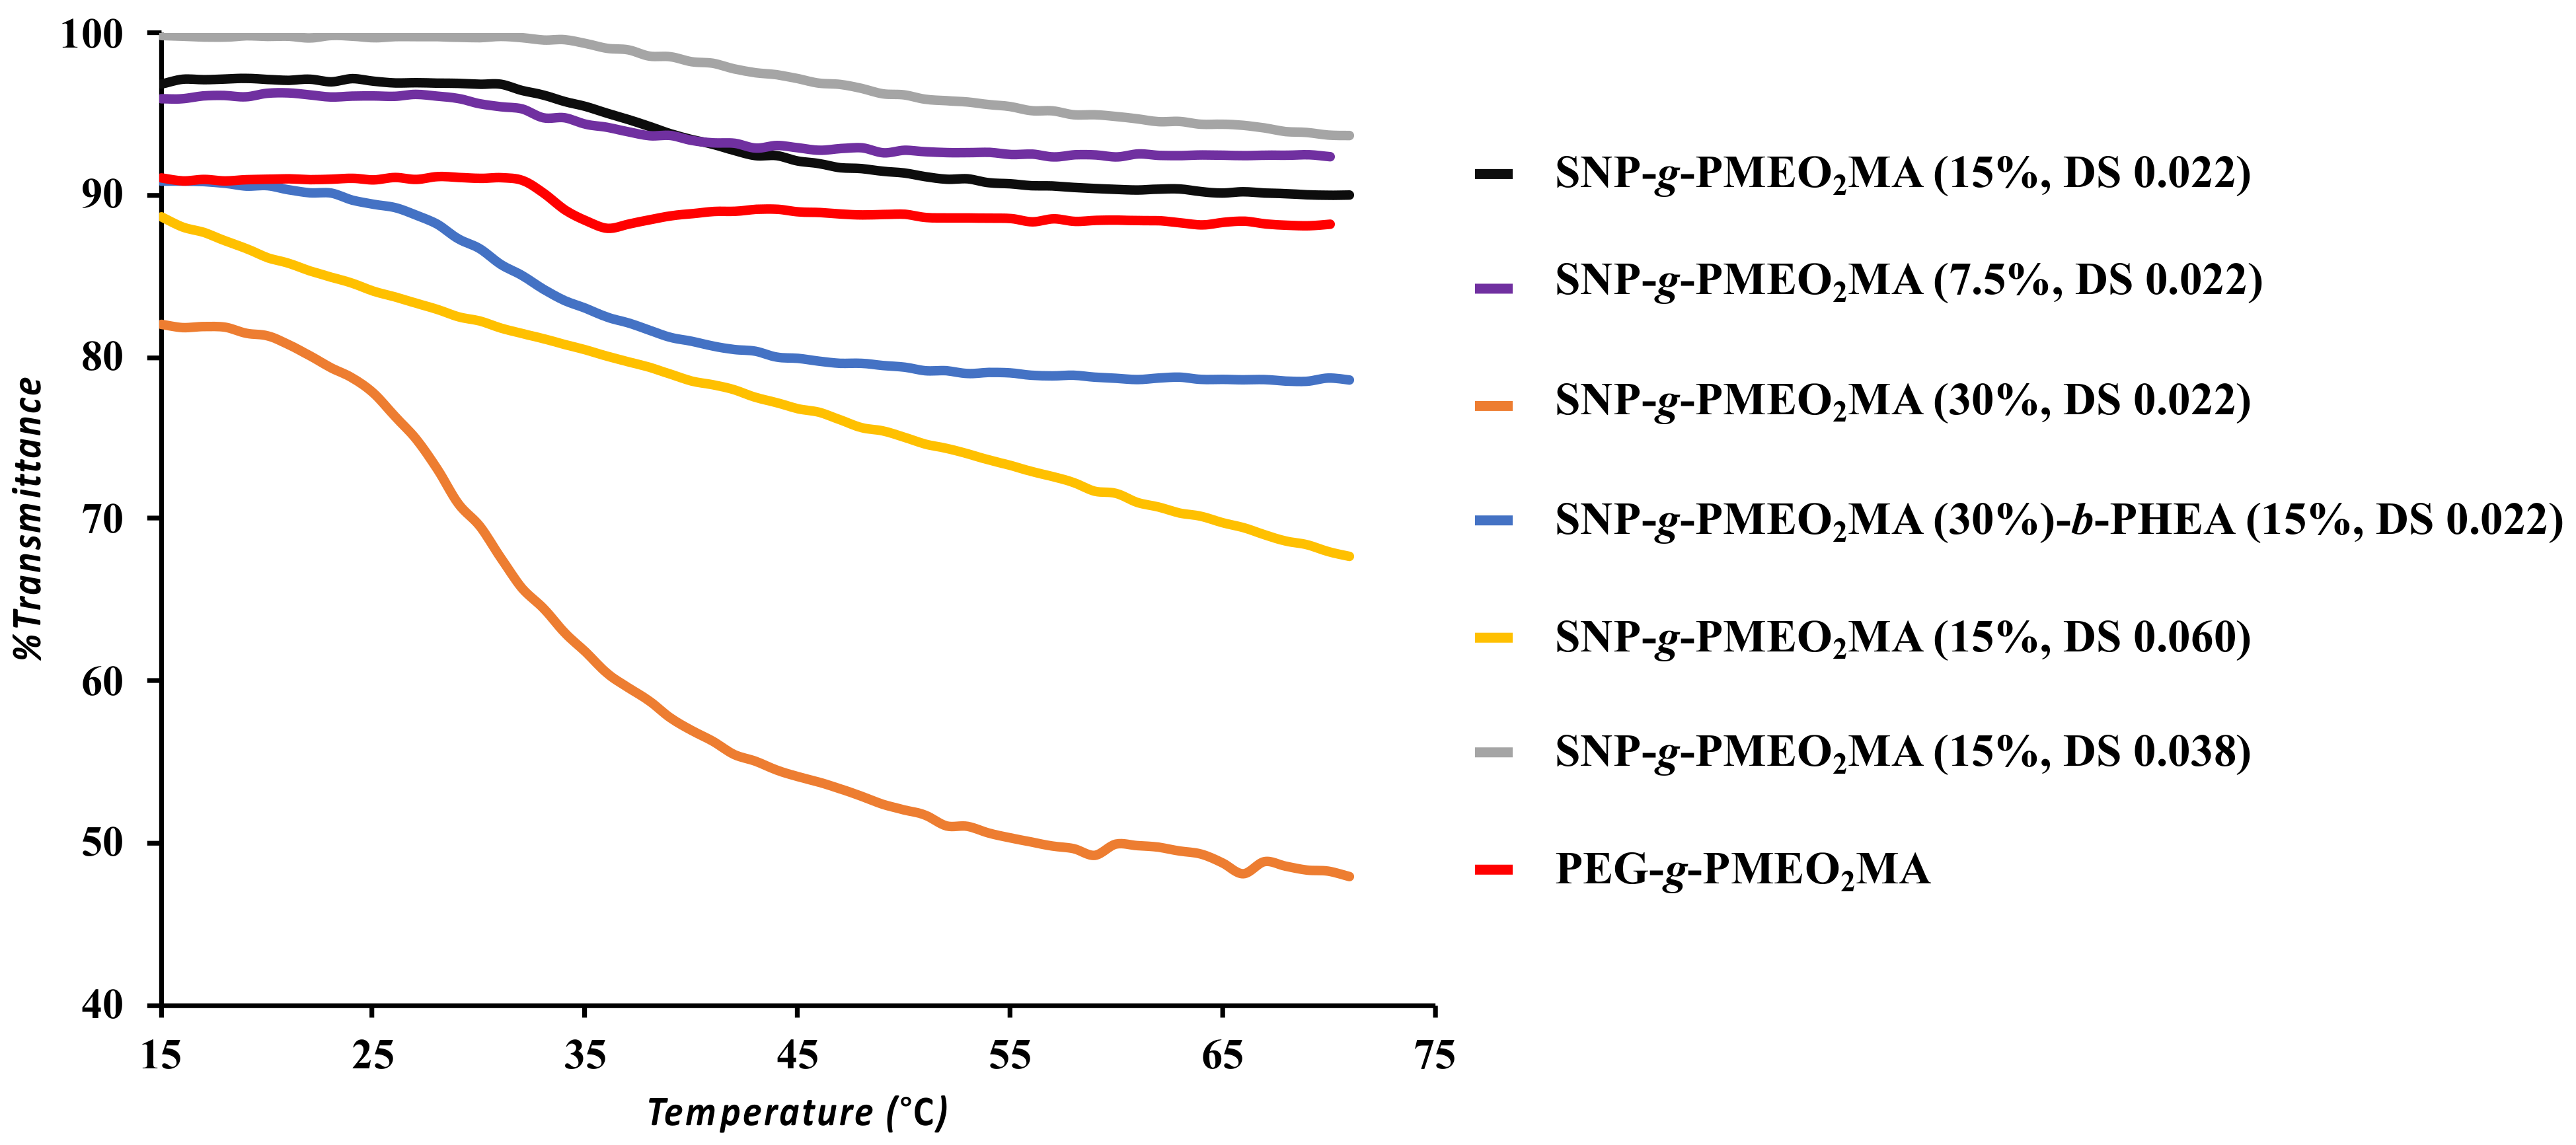
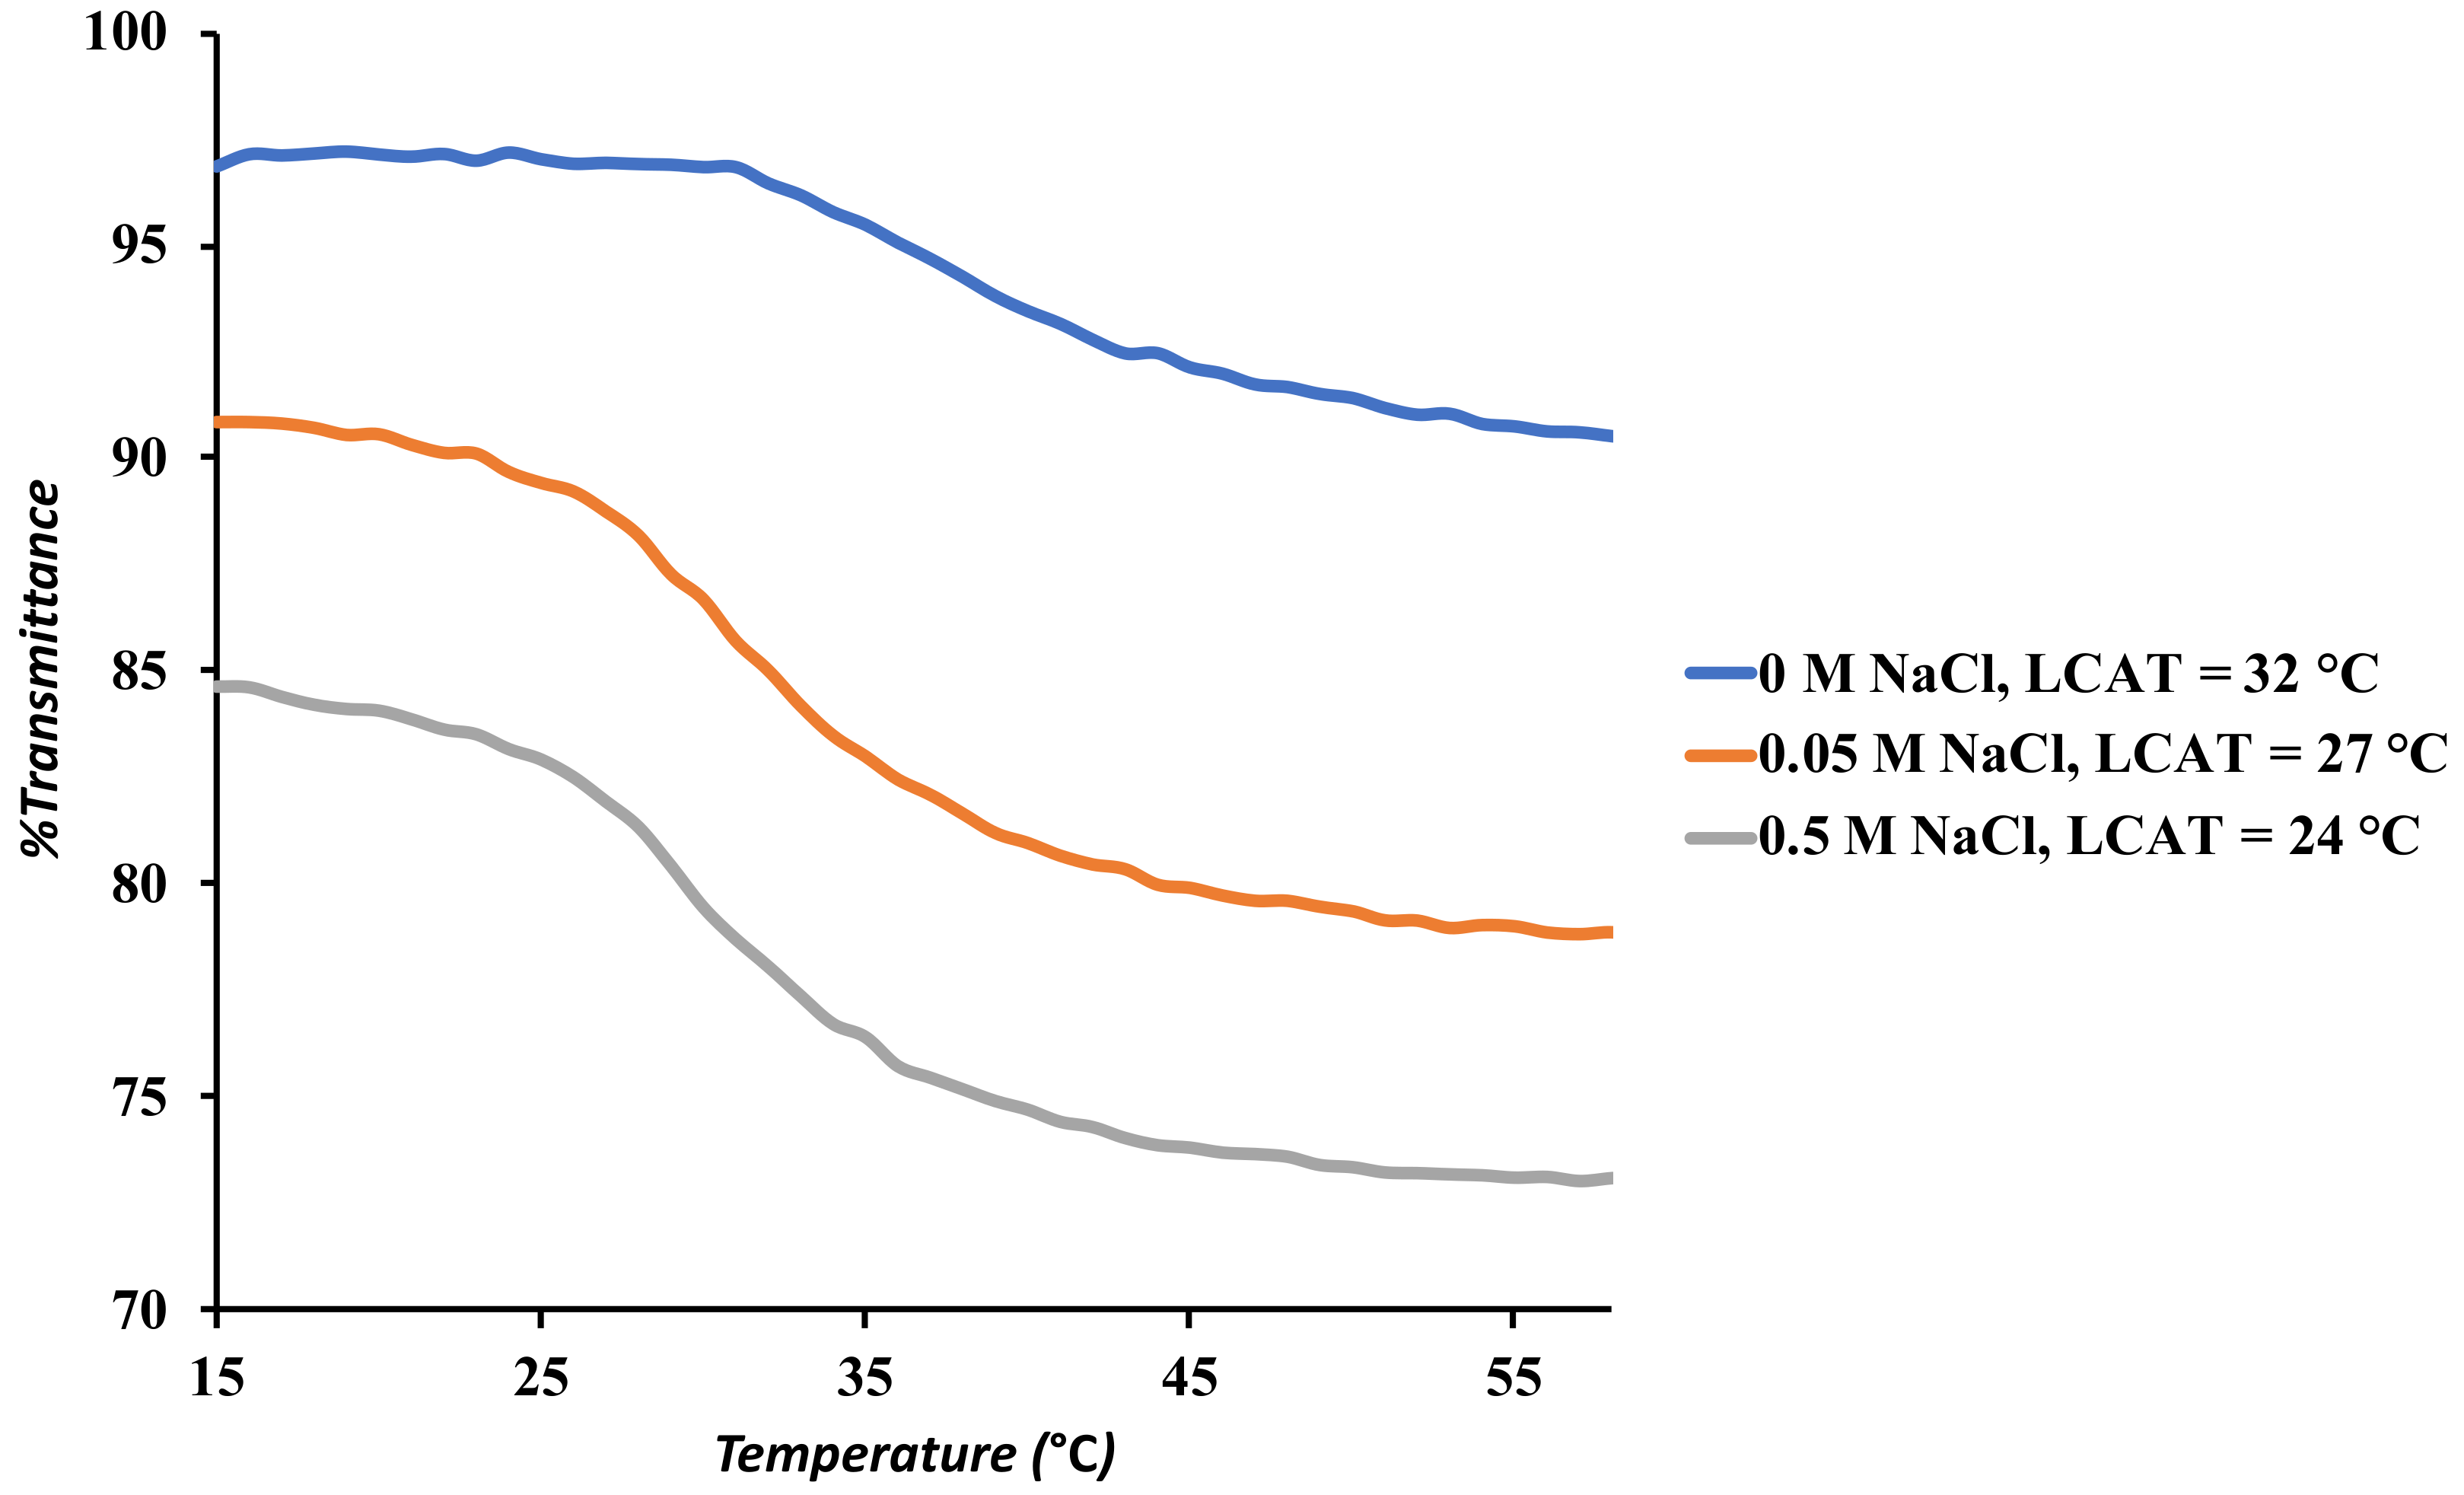
3.4. UV-Visible Spectroscopy
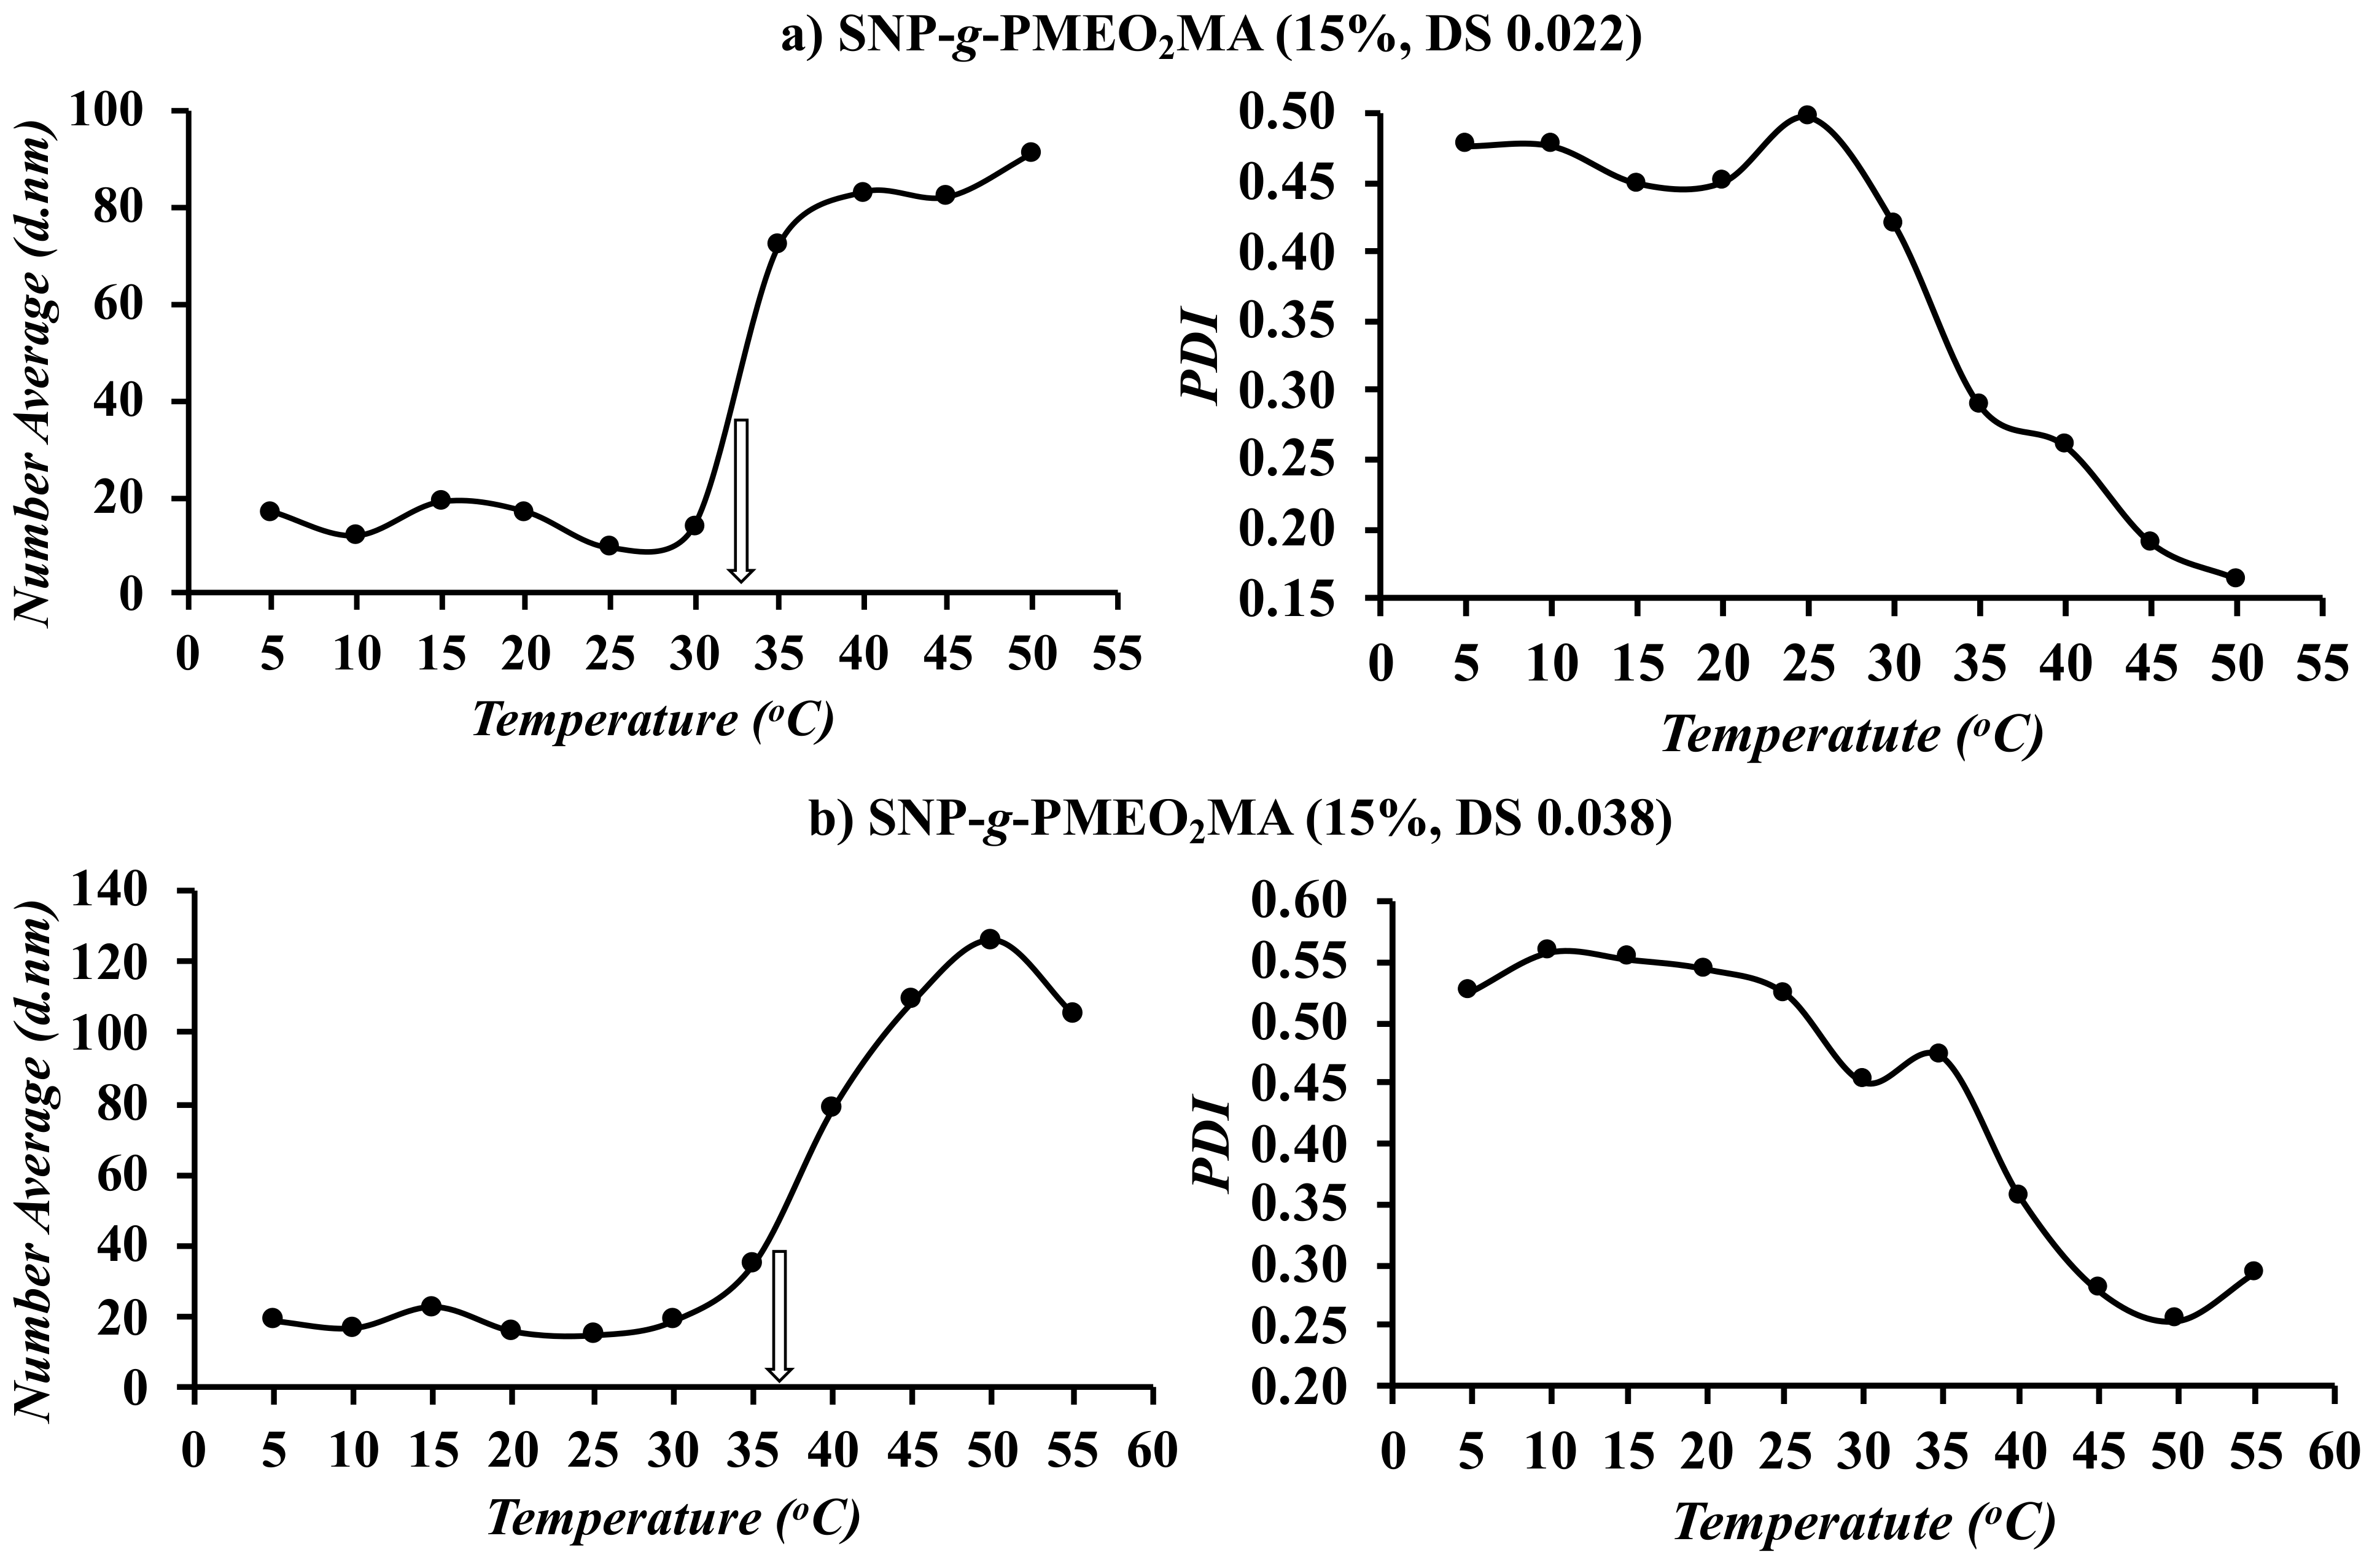
The polymer-grafted SNPs were characterized by UV-visible spectroscopy to determine their lower critical aggregation temperature (LCAT), corresponding to the temperature at which aggregation of the thermoresponsive particles begins.
The LCAT (or more accurately the cloud point of the system) is the temperature above which the polymer becomes insoluble and precipitates out of the solution. This involves a steep decrease in transmittance for a thermoresponsive polymer solution. The LCAT, and more generally the lower critical solution temperature (LCST) of a polymer solution typically depends upon H-bonding between the polymer and water molecules. The water molecules bind to the polymer chains below the LCST, which results in a decrease in enthalpy of mixing (ΔHmix negative) favorable to solubility, but the ΔSmix (entropy of mixing) also becomes negative due to enhanced ordering of the water molecules [27]. The Gibbs free energy of mixing, ΔGmix = ΔHmix − TΔSmix, is favorable (negative) below the LCST because the ΔHmix term is dominant, such that the polymer remains dispersed. As the temperature increases above the LCST, ΔHmix becomes less negative due to the disruption of hydrogen bonding between the polymer and water molecules, such that ΔGmix becomes positive (unfavorable) overall, inducing the collapse of the polymer chains [27].
For the current polymer-grafted SNPs, the thermoresponsive PMEO2MA segments covalently bound to hydrophilic starch should confer thermoresponsive character to the starch. A drop in transmittance is indeed observed for the PMEO2MA-grafted SNPs (Figure 4), albeit the transition is different from the sharp transitions observed for thermoresponsive homopolymers such as PNIPAM, likely due to the presence of the hydrophilic SNP component [28]. The LCAT, reflecting changes in the LCST of the materials, was defined as the temperature at which particle aggregation was initiated, leading to an initial drop in transmittance.
Since the LCAT is concentration-dependent, all the measurements were performed at 1 mg/mL, which is the same concentration at which the DLS analysis was conducted [29]. The weight fraction of PMEO2MA and the DS of the substrates were varied to determine their influence on the LCAT of the samples. The influence of a hydrophilic PHEA block forming a shell on the aggregation of SNP-g-PMEO2MA (15%, DS 0.022) was also investigated. The LCAT values indeed varied with the structure and composition of the grafted SNPs (Table 2). For example, as the PMEO2MA content increased from 15 to 30 wt% at DS 0.022 (or as the PMEO2MA chains became longer), the LCAT decreased from 32 to 20 °C. Interestingly, the LCAT or LCST of thermoresponsive polymers is usually only Mn-dependent in the low Mn range. For example, Lessard et al. observed a mere 2 °C decrease in LCST (from 32.9 to 30.9 °C) as the Mw of poly(N,N-diethylacrylamide) increased from 13 to 58 kg/mol [30]. The change in LCST was even less significant as the molecular weight was increased further, with no change observed from 593 to 1300 kg/mol [30]. As the PMEO2MA content was increased from 7.5 to 15 wt%, the LCAT increased from 28 to 32 °C, which could be due to the ability of these longer chains to hide within the SNPs, delaying the onset of hydrophobic interactions between the chains; but, as the temperature was further increased, SNP-g-PMEO2MA (15 wt%) had a larger drop in transmittance than SNP-g-PMEO2MA (7.5 wt%).
Comparisons can be done among the samples, for example at constant PMEO2MA content while the DS is varied, to understand the influence of the number of PMEO2MA segments grafted on the LCAT: The LCAT increased from 32 to 36 °C when the DS was increased from 0.022 to 0.038. This is expected since shorter PMEO2MA chains formed at DS 0.038 than 0.022 due to the larger number of initiating sites. Shorter chains should take longer to aggregate through intramolecular hydrophobic interactions, but the extent of aggregation above the LCAT was also lower (or the transmittance higher) for SNP-g-PMEO2MA (15%, DS 0.038; Figure 4). Furthermore, no clear LCAT was observed for SNP-g-PMEO2MA (15%, DS 0.06), but rather a gradual increase in turbidity. This is attributed to the presence of a larger number of initiating sites on that substrate, forming shorter chains. Aggregation of the shorter PMEO2MA segments through intramolecular hydrophobic interactions is expected to be more difficult, as these can rearrange more easily to hide within the SNPs above the LCAT. Finally, the addition of a PHEA block to SNP-g-PMEO2MA (30%, DS 0.022) decreased aggregation significantly above the LCST. This is inferred from the corresponding curves in Figure 4, as the transmittance above the LCST increased by over 30% for the sample including the PHEA shell relative to the SNP-g-PMEO2MA substrate. It was observed that PEG-b-PMEO2MA previously used for oil extraction had the same LCAT as SNP-g-PMEO2MA (15%, DS 0.022), although the latter had much better dispersibility in the solution above its LCST.

3.5. DLS Analysis

The hydrodynamic diameter of the SNP-g-PMEO2MA samples was monitored as a function of temperature, to explore the use of DLS as an alternate method to determine the LCAT. In contrast to the UV-vis measurements, where the temperature was ramped continuously at 1 °C/min, it was necessary to set a temperature and wait for equilibration before the DLS measurements, which made that method much more time-consuming, such that measurements were only carried out at 5 °C intervals. In spite of the rather crude approach used, a sharp increase in the number-average diameter was observed (Figure 5) at temperatures comparable to the LCAT determined in the UV-vis measurements. This is understandable, as the polymers become hydrophobic at their LCAT, which promotes aggregation. For example, the transition temperatures between 35–40 °C for SNP-g-PMEO2MA (15%, DS 0.038) and 30–35 °C for SNP-g-PMEO2MA (15%, DS 0.022) determined by DLS are consistent with the LCAT obtained by UV-visible spectroscopy (36 and 32 °C, respectively). As expected, the DS 0.022 sample, with longer PMEO2MA chains, began aggregating at a lower temperature than the DS 0.038 sample. In addition, the size distribution of the aggregated thermoresponsive SNPs was narrower than below the LCAT, as shown in Figure 5: The PDI values decreased to 0.16 for the DS 0.022 sample and 0.25 for the DS 0.038 sample, indicating the formation of micellar aggregates of more uniform size. It, therefore, appears that DLS measurements are equivalent to the UV-visible method for the determination of the LCAT, albeit the technique would be much more time-consuming if comparably accurate results were desired, which would require carrying out DLS measurements at less than 5 °C intervals.

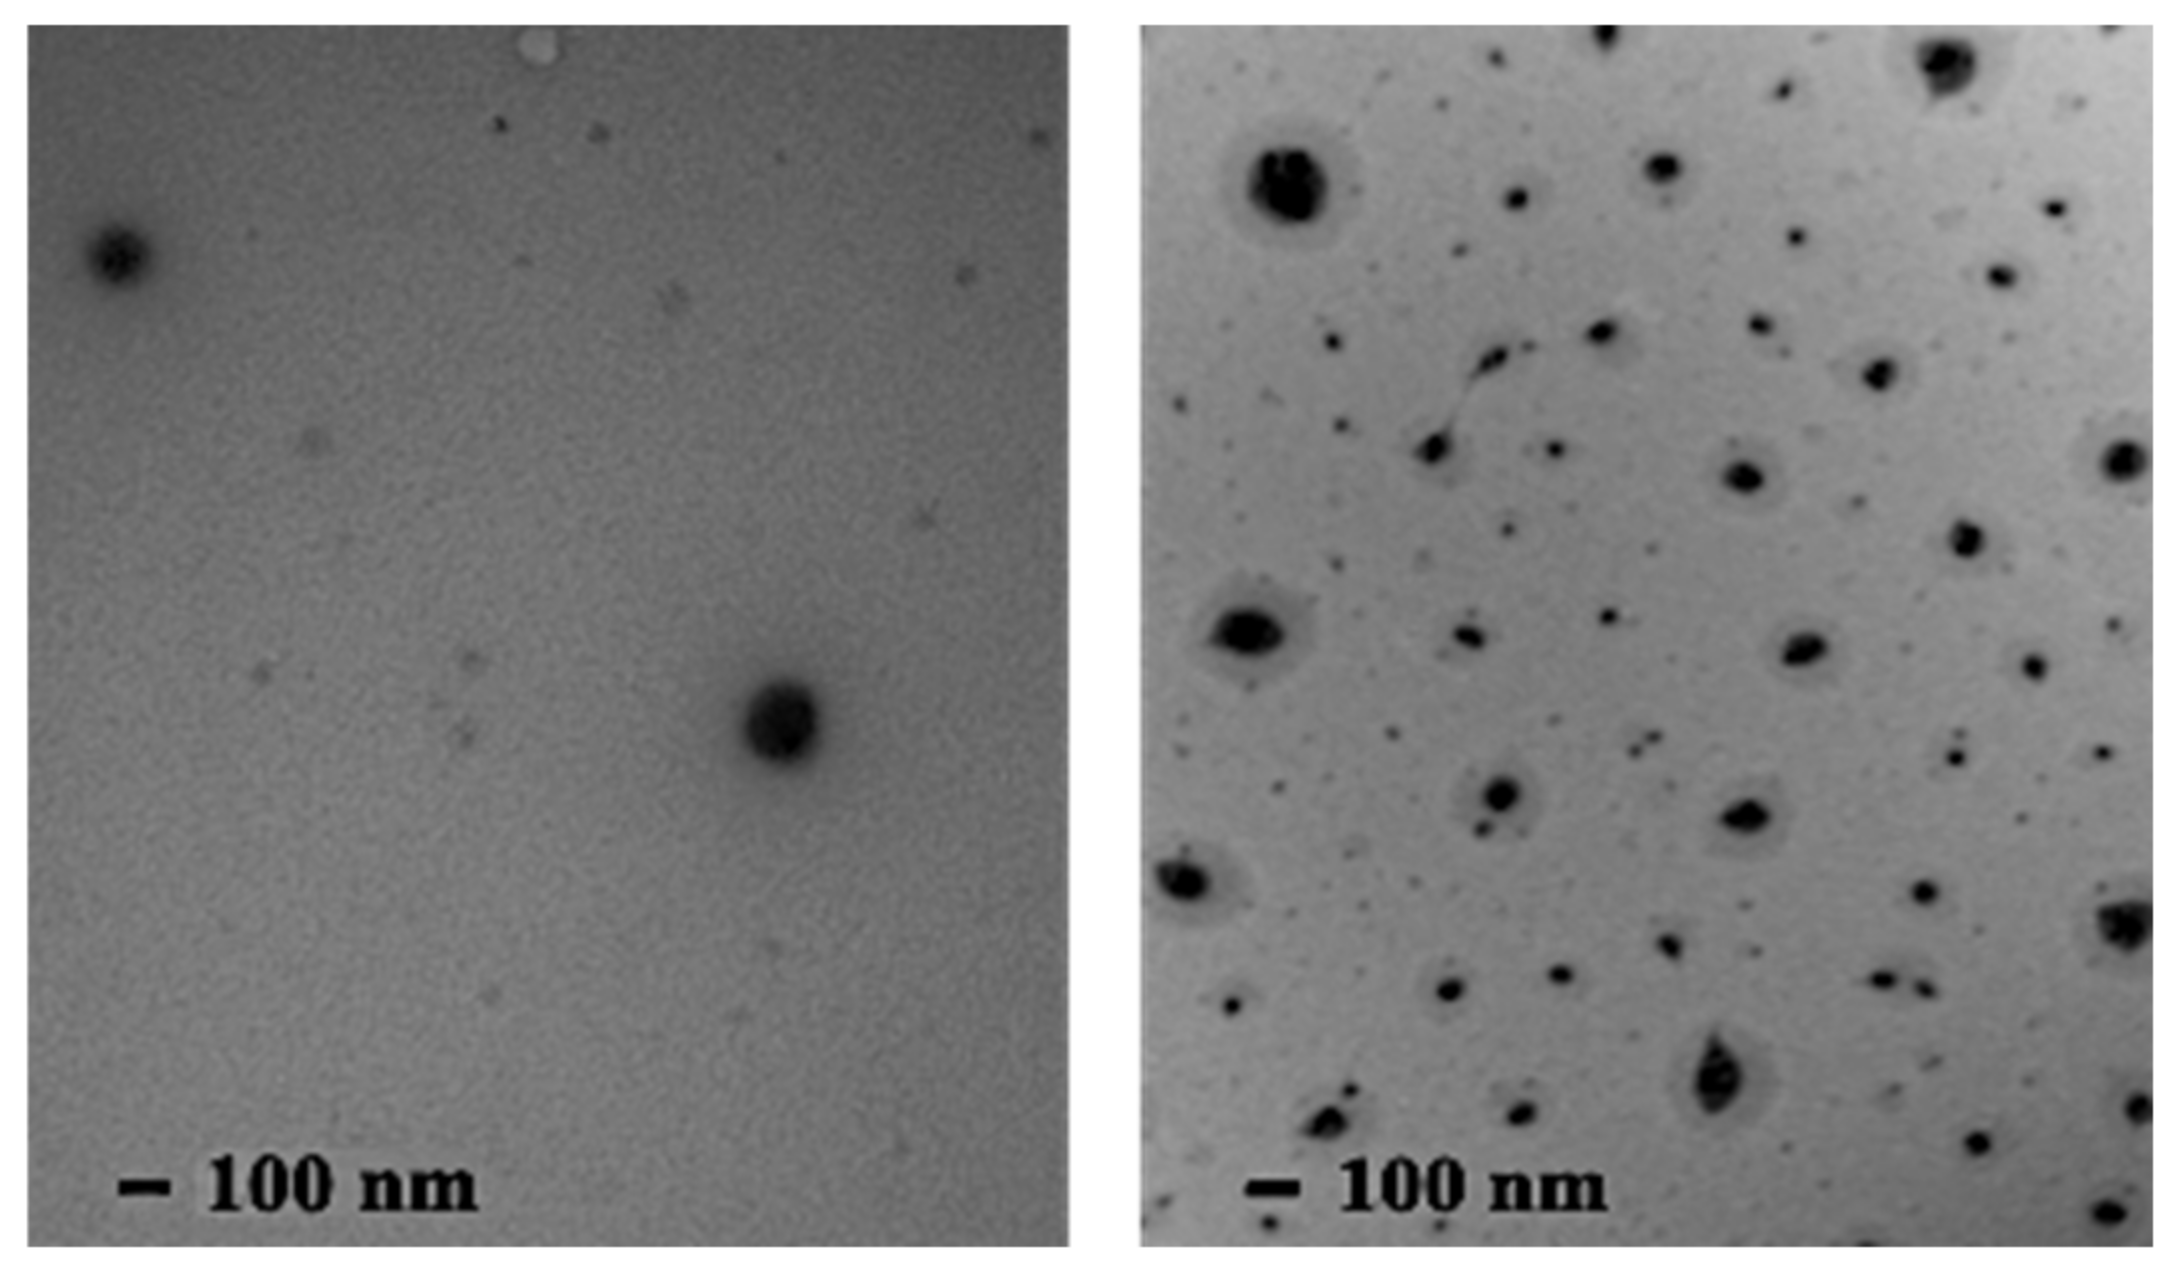
3.6. Transmission Electron Microscopy

The structure of unmodified SNPs and the SNP-g-PMEO2MA (15%, DS 0.022) sample was visualized after staining the starch component with iodine (Figure 6). It is clear that the dark core, corresponding to the SNPs, is surrounded by a lighter shell of PMEO2MA chains.

3.7. Determination of Bitumen and Fines Contents of IOos and SBos

Fines are defined as clay particles smaller than 44 μm in the water-bitumen interfacial layer [31]. They form a layer around the sand particles and are embedded within the bitumen droplets. Due to their strong interactions with bitumen, the fine solids can affect the extraction process adversely, among others by making it difficult for air bubbles to attach to the bitumen droplets. The presence of fines thus hinders bitumen floatation and decreases the consistency of the froth [31]. The two available samples, namely the Imperial Oil oil sand (IOos) and the Athabasca Sand Bank oil sand (SBos), were tested for their fines contents after the removal of the bitumen component.
Soxhlet extraction [32] yielded bitumen contents in IOos and SBos of 11.1 (±0.1) and 10.5 (±0.2) wt%, respectively. The two samples were therefore comparable in terms of bitumen contents. Separation of the solid sample on a sieve with a mesh size of 44 μm yielded a fines content of 2% by weight for the SBos sample, while the amount measured for the IOos sample was negligible (<0.05%). Most of the fines consist of clay particles that can impact the extraction of bitumen from oil sands [33].
After the extraction of the bitumen, the solid component was redispersed by vortex mixing with water and allowed to settle on the benchtop for 7 h. After that time, the supernatant of the IOos sample was comparatively clear, since much of the quartz sand and clay settled at the bottom of the vial, while the SBos supernatant remained much more turbid.

3.8. Bitumen Extraction

Established extraction methodologies include using high-temperature water (about ∼80 °C) to extract the bitumen from oil sands [5]. These are the CHWE and SAGD methods, which consume huge quantities of energy and water, and are also responsible for tailing pond formation. At a much lower temperature (45 °C), the thermoresponsive polymer-grafted SNPs were able to extract efficiently bitumen from oil sands, so they could represent an alternative to traditional methods.
Yang et al. used a shaker to extract bitumen from the IOos sample with PEG-b-PMEO2MA [17]. Since IOos did not contain fines it was relatively easy to extract the bitumen, but PEG-b-PMEO2MA was unable to extract bitumen from SBos. Moreover, the synthesis of PEG-b-PMEO2MA is not commercially viable, and that compound is not biodegradable. We wanted to develop a more environment-friendly and economical system for the extraction of bitumen from oil sands with high fines contents. For example, the SNP-g-PMEO2MA (15%, DS 0.022) used for the extraction contained 85% starch by weight. Furthermore, a tumbler system was used to carry out the bitumen extraction, which is closer to the commercial process being used. A clamp attached to a motor served to tumble the oil sand mixtures in the vials at 53 rotations per minute in an oven maintained at 45 °C (Figure 7). Tumbling ensured better mixing of the polymeric surfactant, the organic solvent, and the aqueous phase for a more efficient extraction process. Extraction with the shaker was also investigated and while the influence of the polymer could be noted, the overall extraction efficiency with the shaker was much lower than by tumbling.

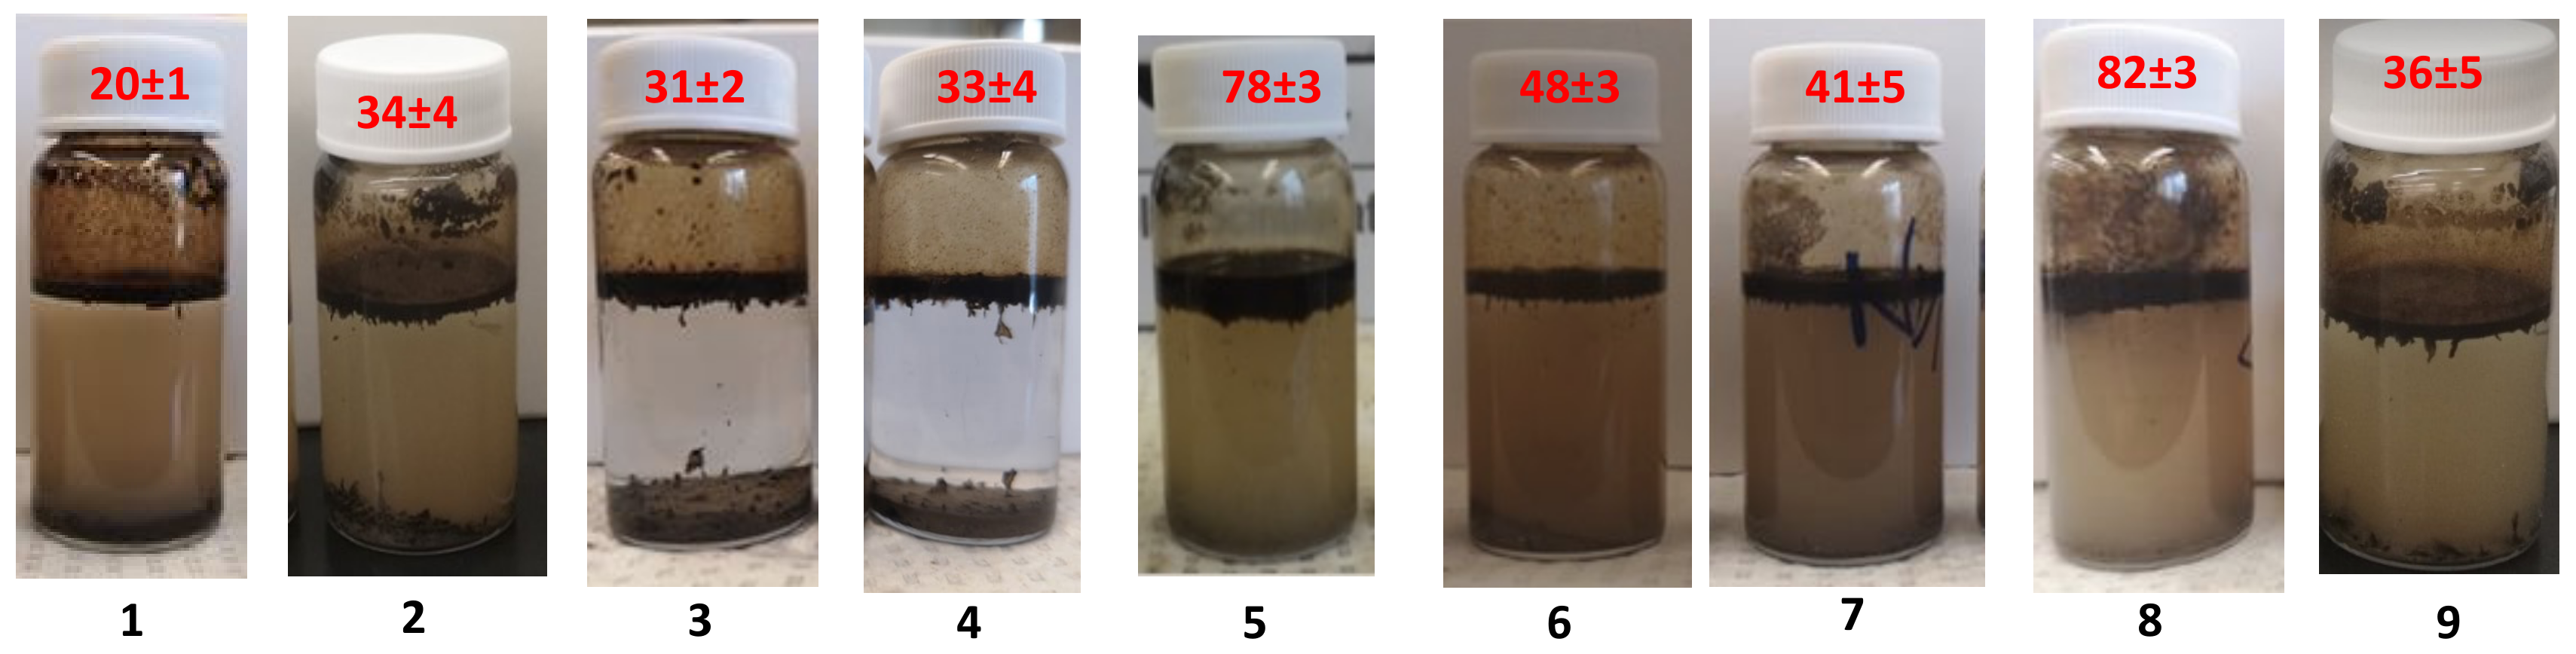
3.8.1. Controls for Efficient Bitumen Extraction

In this set of experiments, modifications to the standard procedure were employed to examine the influence of the polymer-grafted SNPs, toluene and NaCl, on the bitumen extraction efficiency, to determine the optimal extraction conditions.
Preliminary controls were done by comparing 0.05 and 0.5 M NaCl solutions in the separation of the SBos sample. Accelerated settling of the sand and fines was observed in the presence of NaCl. The addition of NaCl clearly helped to flocculate the fines, which should favor interactions between the bitumen particles and the polymer. While in the absence of NaCl the fines tended to remain suspended in the water, 0.5 M NaCl led to the settling of most of the fines after 20 min, and partial settling was observed with 0.05 M NaCl. Consequently, 0.5 M NaCl was selected as the preferred condition for bitumen extraction from oil sands.
UV-visible spectroscopy was used to evaluate the LCAT of SNP-g-PMEO2MA (15%, DS 0.022) at 1 mg/mL and varying NaCl concentrations. As the concentration of NaCl was increased, the LCAT decreased (Figure 8). When NaCl is present in a solution, the LCAT of thermoresponsive polymers generally shifts to a lower temperature [34]. Because the Na+ cations have a greater affinity for binding to the polymer than the Cl- anions, direct contact between the Na+ ions and PMEO2MA plays an essential role in the LCST change. The ions are known to impact the hydration shell closest to the polymer, not the bulk water structure around it [34]. Indeed, it was shown in a study of PNIPAM with different salts by Du et al. [28] that cations had a significant affinity for the oxygen atom in amide groups, while the anions had no contact with the polymer. The anions of salts are classified as kosmotropic or chaotropic, based on their influence on the LCAT [35]. Kosmotropic anions reduce the LCAT of a thermoresponsive polymer substantially by interacting with water strongly, while reducing polymer-water interactions and hence polymer stability in solution [35]. Chaotropic anions are less efficient than kosmotropic anions at lowering the LCAT, and can occasionally stabilize thermoresponsive polymers in solution. Some examples of kosmotropic anions include CH3CO2, F, OH, HPO4, CO32−, and SO42−, while examples of chaotropic anions are Cl, I, Br, SCN, and ClO4 [35]. Thus, the decrease in LCAT from 32 °C in pure water to 24 °C in 0.5 M NaCl observed for sample SNP-g-PMEO2MA (15%, DS 0.022) is attributed to decreased hydration of the PMEO2MA chains in the presence of the Na+ ions.
In the absence of both NaCl and modified SNPs, the extraction efficiency was limited to 20% with 60 mg toluene (Trial #1, Table 3), improving to 34% when the amount of toluene was increased to 70 mg (Trial #2). In the absence of modified SNPs, but utilizing 60 mg of toluene and 0.5 M NaCl, the extraction efficiency was 31% (Trial #3). Adding unmodified SNPs did not improve the efficiency of bitumen extraction (Trial #4). Even with the addition of modified SNPs and NaCl, reducing the amount of toluene to 25 mg led to a very low extraction efficiency of 12%. After investigating a range of polymer-grafted SNP compositions (discussed later), a high bitumen extraction efficiency of 78% was eventually achieved with 60 mg toluene and 15 mg of SNP-g-PMEO2MA (15%, DS 0.022) in 15 mL of 0.5 M NaCl (Trial #5). These were the optimized conditions for bitumen extraction at a modified SNP concentration of 1 mg/mL and on a 1 g scale. These results show that the addition of SNP-g-PMEO2MA (15%, DS 0.022) improved the extraction performance markedly.
To examine the influence of temperature the extraction process was attempted at 22 °C, below the LCAT (24 °C) of SNP-g-PMEO2MA (15%, DS 0.022) in the presence of 0.5 M NaCl (Figure 9). The extraction efficiency dropped to 41% at 22 °C (Trial #7), a 37% decrease in efficiency from extraction at 45 °C. This is presumably the result of reduced interactions between PMEO2MA and the bitumen phase, as the grafted PMEO2MA chains should remain hydrophilic below the LCAT; so their ability to interact with, solubilize, and shuttle bitumen droplets to the surface of water would be limited.
For bitumen extraction from oil sands in the presence of toluene, surfactants are expected to orient their polar component to be in contact with water, and their non-polar component with toluene and bitumen, so as to minimize the surface tension [36]. This can also result in the creation of stable bitumen-in-water emulsions. Salts are known to increase the interfacial tension in the case of non-ionic surfactants, but to decrease it for ionic surfactants [36]. While oil sand mixtures can have salt concentrations reaching > 2000 mg/L [37], this is clearly insufficient to destabilize emulsions, besides the fact that the salts can also participate in flocculating the clay particles. Bitumen also contains asphaltenes, decreasing the surface tension by acting as natural ionic surfactants favoring the formation of emulsions. Because SNP-g-PMEO2MA essentially acts like a non-ionic surfactant above its LCAT, increased interfacial tension in the presence of salt may be a dominant driving force for the coalescence of bitumen droplets, resulting in improved bitumen separation from the aqueous phase [36]. Furthermore, it was confirmed that PEG-b-PMEO2MA, previously used to extract bitumen from IOos, did not perform well with SBos (Trial #9).

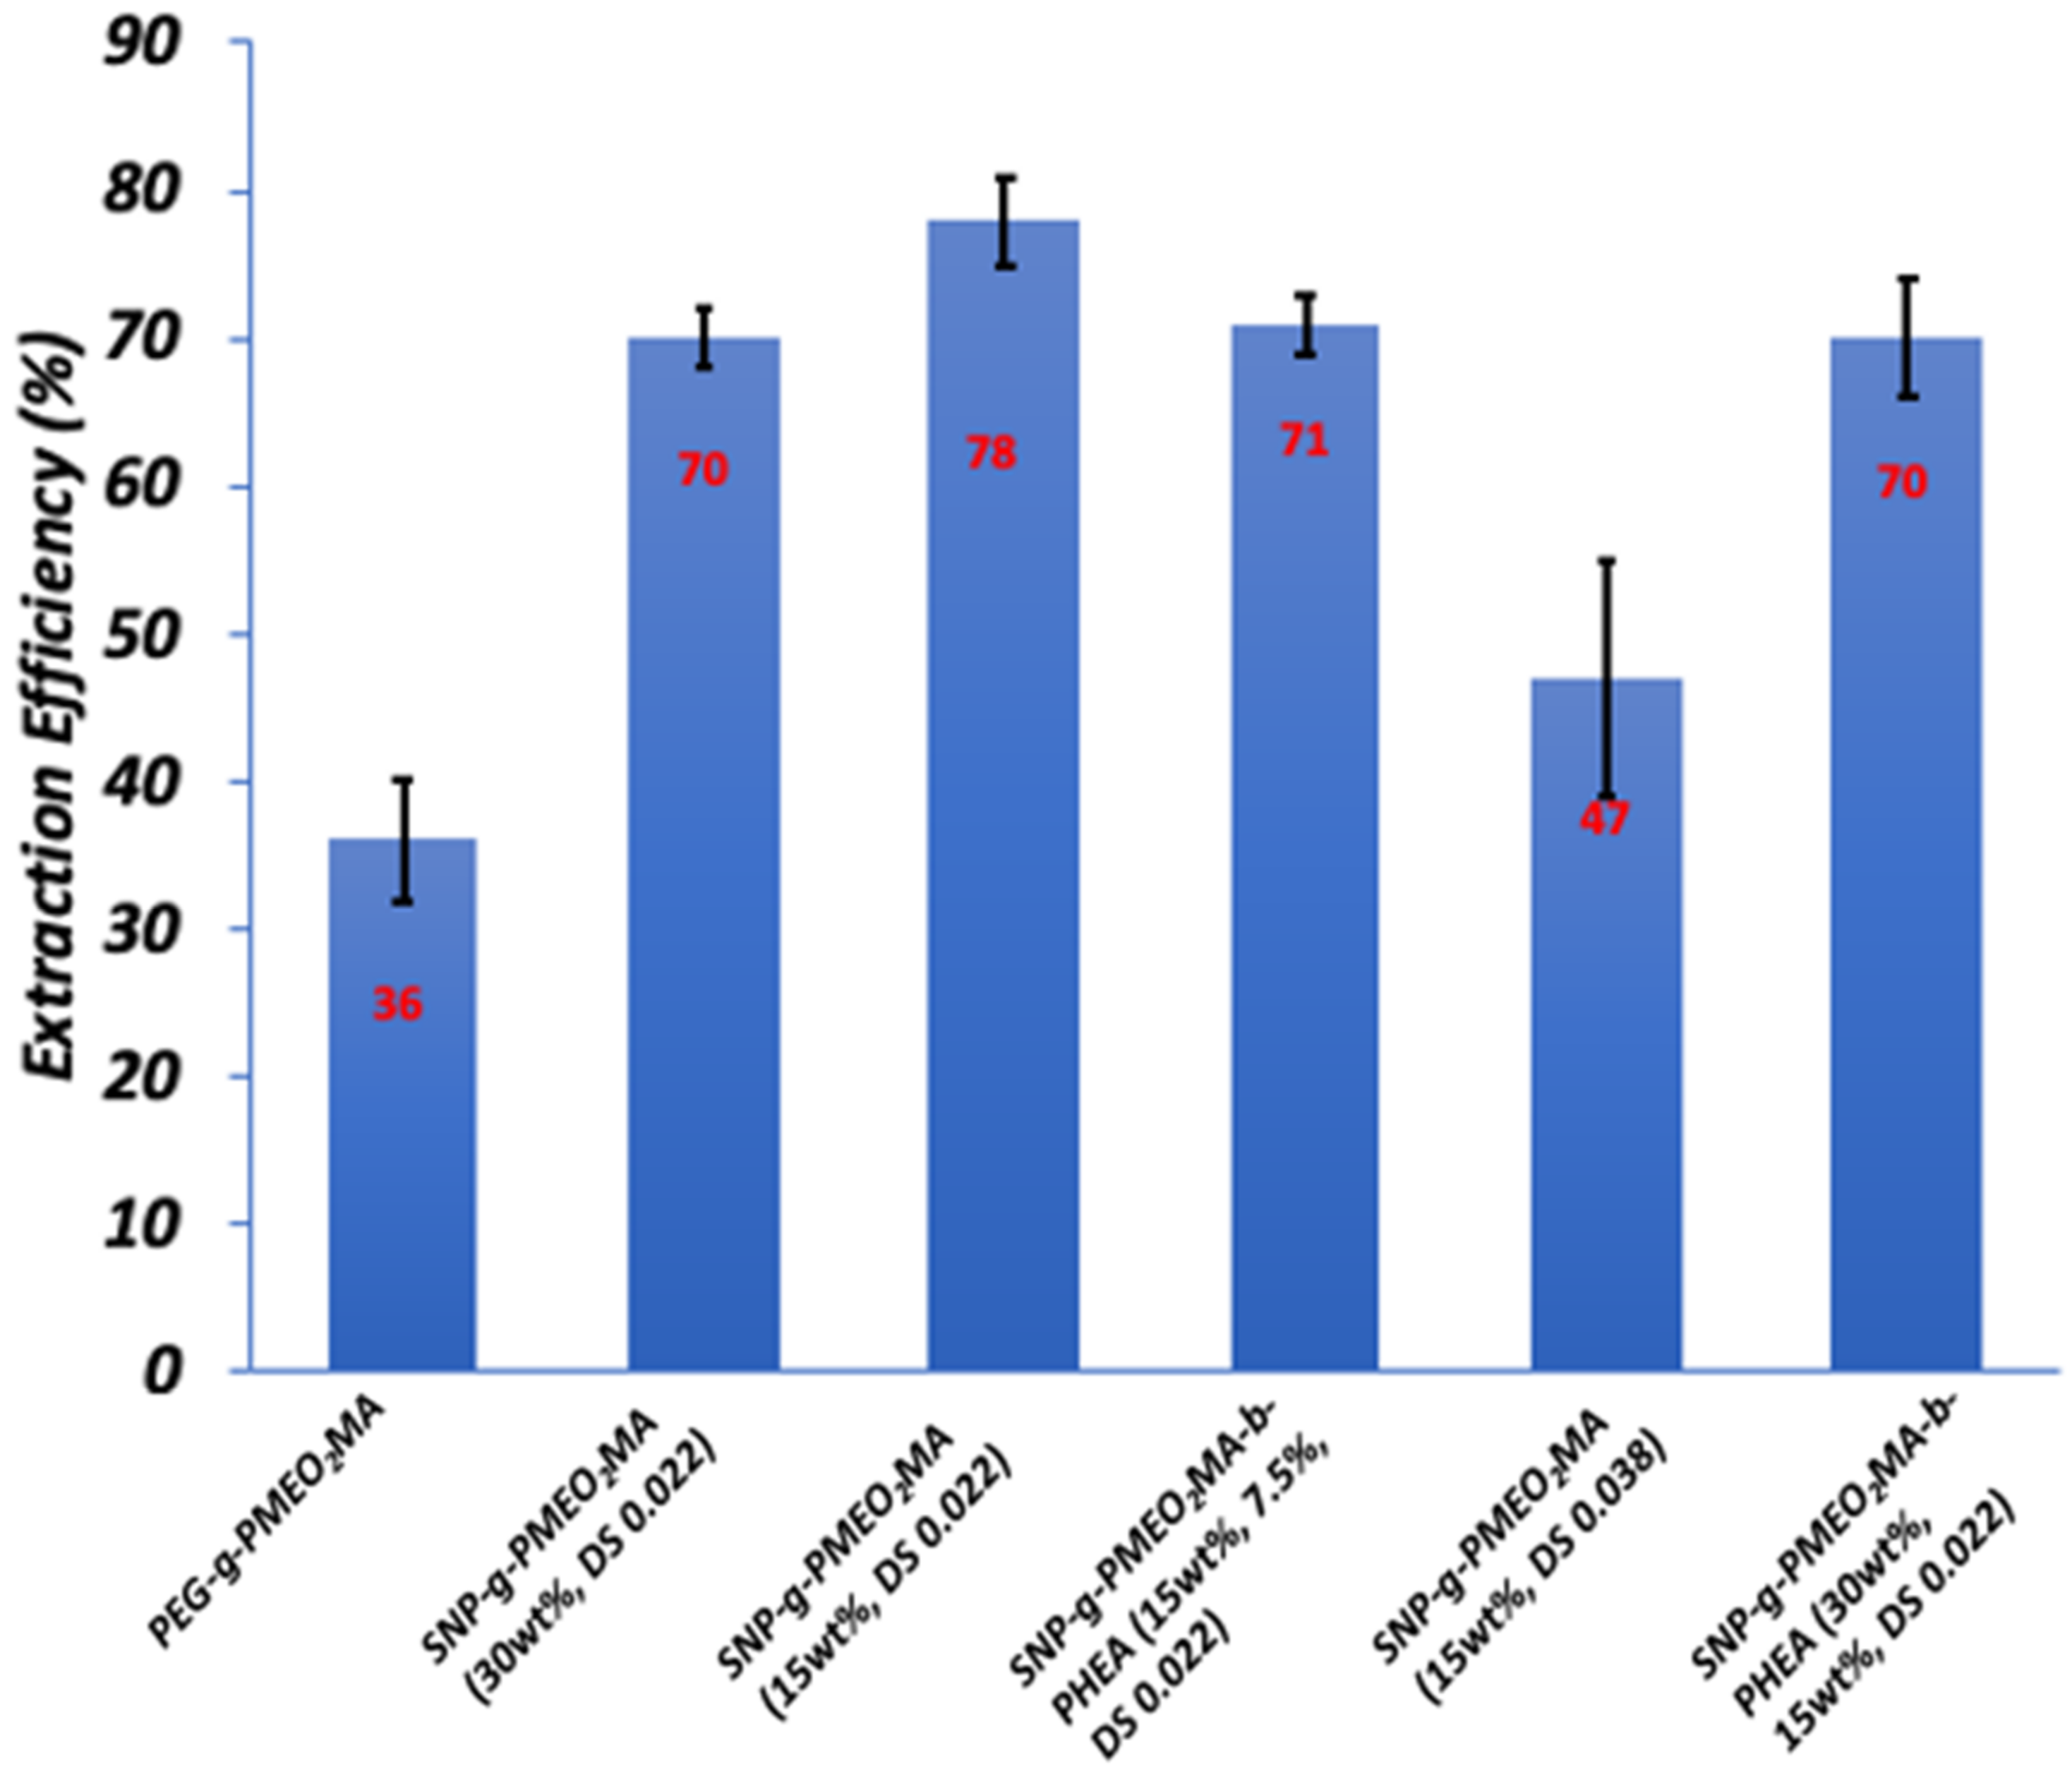
3.8.2. Optimal SNP-g-PMEO2MA Composition and Structure

In this series of experiments, 15 mg of modified SNPs were tested with 0.5 M NaCl, 60 mg of toluene, and 15 mL of water at 45 °C for SNPs with various characteristics (PMEO2MA contents and SNP substrate DS) as listed in Table 2. It was assumed that an optimal hydrophilic-lipophilic balance (HLB) would lead to more efficient bitumen extraction from the oil sands, and that the copolymer would redisperse in the water phase upon cooling. The results obtained for the different samples are compared in Figure 10. Overall, SNP-g-PMEO2MA (15%, DS 0.022) performed best. It also had a UV-visible LCAT profile similar to PEG-b-PMEO2MA synthesized by Yang et al. to extract bitumen from IOos [17]. The poor extraction performance for SNP-g-PMEO2MA (15%, DS 0.038) demonstrates that the PMEO2MA chain length is critical in achieving a high bitumen extraction efficiency. That sample also exhibited the highest LCAT among all the samples investigated, at 36 °C (Table 2), but still significantly below the extraction temperature (45 °C). Because of the larger number of chains on the DS 0.038 vs. the DS 0.022 additive, the starch nanoparticles should be more rigid, resulting in poorer interaction with the bitumen droplets at 45 °C. While the addition of PHEA to PMEO2MA (30%, DS 0.022) to obtain SNP-g-PMEO2MA (15%)-b-PHEA (7.5%, DS 0.022) considerably reduced the LCAT and stabilized the material in the solution, as shown in Figure 4, it did not improve the extraction efficiency. This further confirms that the PMEO2MA chain length is a critical parameter controlling the interactions with bitumen, while also maintaining suitable water dispersibility during the extraction. Even though sample SNP-g-PMEO2MA (30%, DS 0.038) was synthesized for comparison with SNP-g-PMEO2MA (15%, DS 0.038), it was not dispersible in water at the required concentration of 1 mg/mL. This may be due to the increased number and length of the PMEO2MA chains attached to the SNPs, which made the rearrangement of the whole structure difficult. The addition of PHEA segments to SNP-g-PMEO2MA (30%, DS 0.022) to obtain SNP-g-PMEO2MA (30%)-b-PHEA (15%, DS 0.022) did not improve the extraction efficiency either.

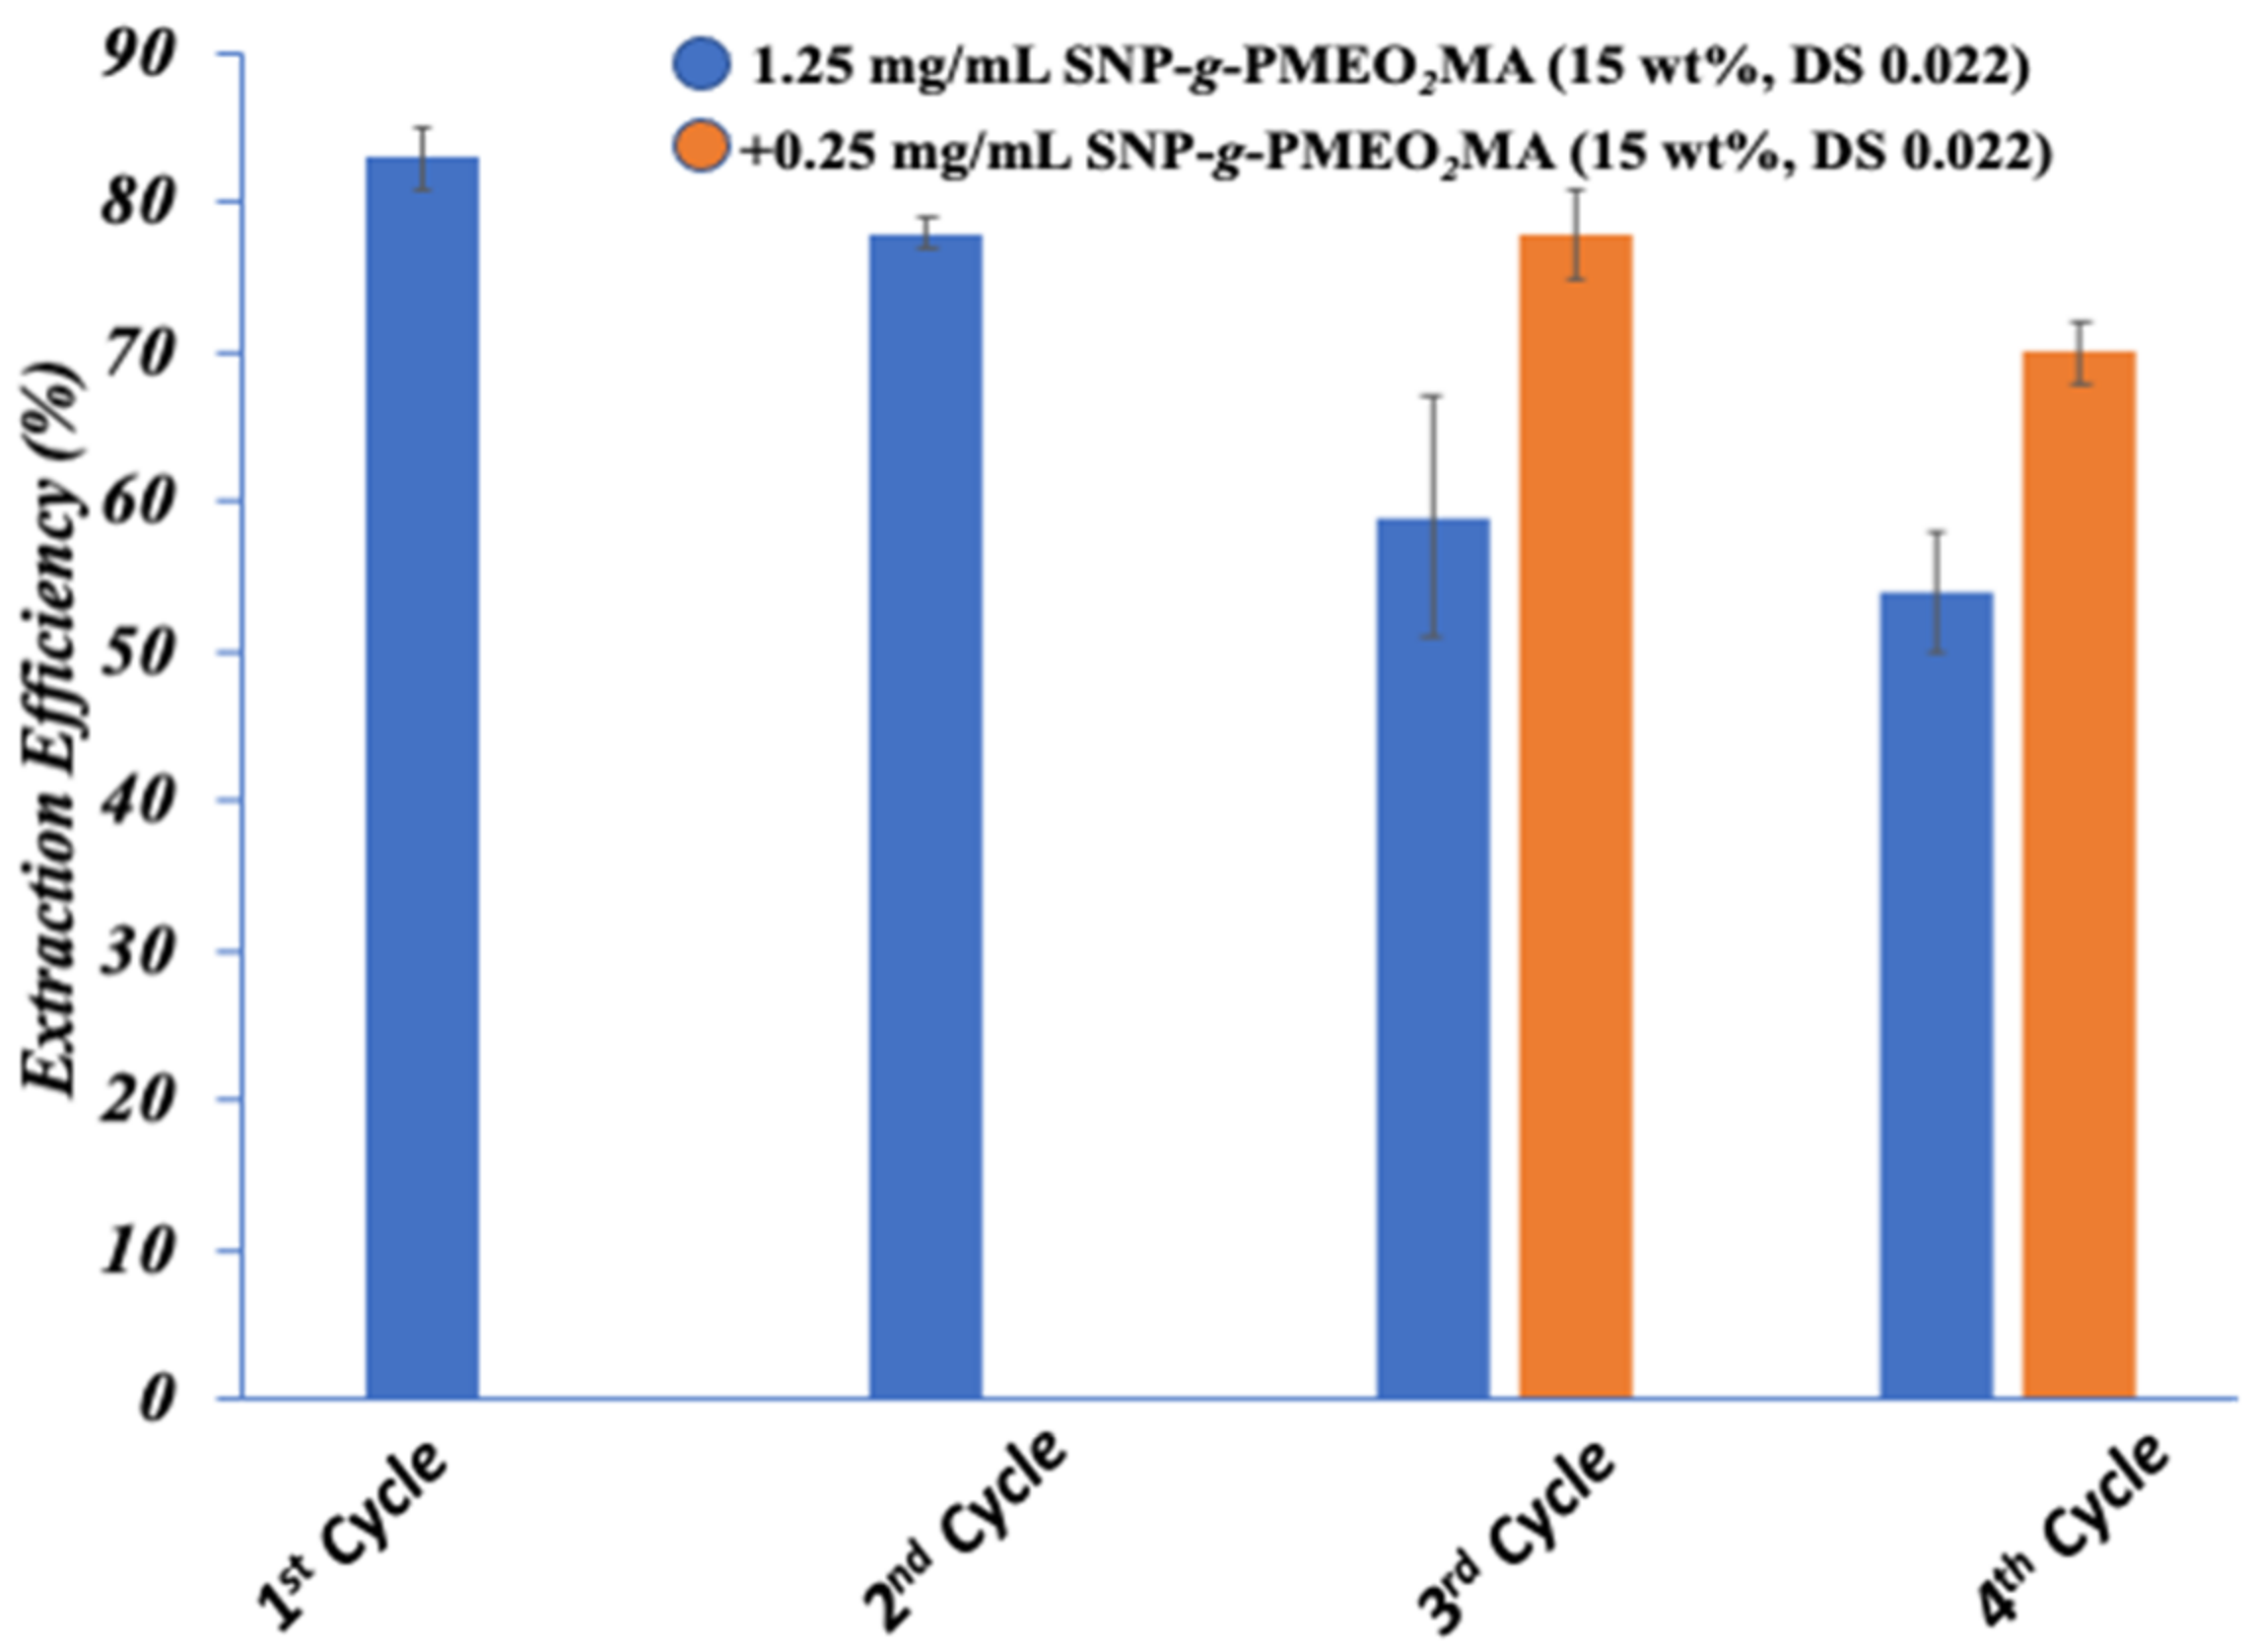
3.8.3. Recycling of Polymer-Grafted SNPs for Bitumen Extraction

SNP-g-PMEO2MA (15%, DS 0.022) was found to perform best among the polymer-grafted SNP samples investigated. While a large volume of toluene can essentially extract all the bitumen from oil sands by itself, 60 mg of toluene was conservatively selected for that purpose. It was also observed that the extraction efficiency increased to ~80% at SNP-g-PMEO2MA concentrations up to 1.25 mg/mL. It would be still essential to recycle and reuse the aqueous polymer solution to make the extraction economically viable and environmentally sustainable. The optimized conditions for bitumen extraction from 1 g of oil sands, using 15 mL of 1.25 mg/mL SNP-g-PMEO2MA (15%, DS 0.022), 0.5 M NaCl and 60 mg toluene, were used in four successive cycles of bitumen extraction, reusing the aqueous phase recovered in the process. The extraction efficiency was found to decrease to 59% for the 3rd cycle, and further to 54% for the 4th cycle under these conditions (Figure 11). This was attributed to the loss of polymer-grafted SNPs in successive extraction cycles. This hypothesis was confirmed, as less pronounced decreases in extraction efficiency were observed when the equivalent of 0.25 mg/mL of SNP-g-PMEO2MA (15%, DS 0.022) was added to the aqueous polymer solution for the 3rd and 4th cycles.

3.8.4. Oil Extraction from IOos

As expected, it was much simpler to recover bitumen from the IOos sample, which did not contain detectable amounts of fines. In the presence of 15 mL of SNP-g-PMEO2MA (15%, DS 0.022) at 1 mg/mL concentration, and using only 50 mg of toluene for 1 g of IOos, an extraction efficiency of 86 ± 4% was achieved. It should be noted that not only was the addition NaCl to flocculate fines unnecessary, but it also only required 50 mg of toluene, as compared with 60 mg for the SBos sample. This clearly demonstrates that the presence of fines in oil sands has a significant negative impact on the recovery of bitumen from oil sands.

4. Conclusions

RAFT polymerization was successfully applied to the synthesis of thermoresponsive polymer-grafted SNPs, providing easy control over the characteristics of the modified SNPs in terms of the number and length of the PMEO2MA segments and the hydrophilic-lipophilic balance (HLB) of the nanoparticles. Due to the hydrophobicity of PMEO2MA and the hydrophilic nature of the SNPs, these materials were found to form micellar aggregates above their LCAT. The LCAT of the particles was controlled by adjusting either the DS of the RAFT macroinitiator or the PMEO2MA content. Hydrophilic PHEA segments also increased the LCAT of SNP-g-PMEO2MA and stabilized the nanoparticles in solution. The bitumen extraction efficiency with these SNP-g-PMEO2MA and SNP-g-PMEO2MA-PHEA additives was investigated. The best-performing modified SNPs had an LCAT similar to PEG-b-PMEO2MA, previously used to extract bitumen from IOos. For lower clay samples like IOos, the extraction was more simple and more efficient (86 ± 4%). The SBos sample was most difficult to handle due to the presence of stones, clay, and fines. The addition of 0.5 M NaCl caused efficient flocculation of the fines in SBos and increased the extraction efficiency with PMEO2MA-grafted SNPs at 45 °C. While a larger amount of toluene resulted in higher extraction efficiency, good performance (ca. 80 percent) was achieved with 60 mg of toluene per g of oil sands when using SNP-g-PMEO2MA (15%, DS 0.022) in 15 mL of water and 0.5 M NaCl. Most significantly, the aqueous phase could be reused over at least three extraction cycles, thereby minimizing the consumption of water and thermoresponsive SNPs in the process.
Thermoresponsive polymers are suitable for applications such as bitumen extraction, by taking advantage of their ‘on–off’ reversible switching and ‘on-demand’ controllable and reproducible properties in response to temperature changes. Beyond bitumen extraction, thermoresponsive polymers are being investigated in areas including drug and gene delivery, tissue adhesion prevention, and wound dressings, to name but a few [38]. Since every application has its own requirements, the ability to tailor the polymer properties also may make PMEO2MA-grafted SNPs a smart material of choice for these applications.

Author Contributions

Conceptualization, M.G.; methodology, M.G., N.D. and V.T.A.N.; validation, N.D., J.-Z.O.W. and V.T.A.N.; formal analysis, N.D.; investigation, N.D., J.-Z.O.W. and V.T.A.N.; resources, M.G.; writing—original draft preparation, N.D. and J.-Z.O.W.; writing—review and editing, M.G. and N.D.; supervision, M.G.; project administration, M.G.; funding acquisition, M.G. All authors have read and agreed to the published version of the manuscript.

Funding

This research was funded by the Natural Sciences and Engineering Research Council of Canada (NSERC).

Data Availability Statement

No additional data available.

Acknowledgments

The authors thank Jasmine Zhang for determining the bitumen content of the two oil sand samples, and for some of the UV-visible characterization.

Conflicts of Interest

The authors declare no conflict of interest.

References

  1. Tenenbaum, D.J. Oils Sands Development: A Health Risk Worth Taking? Environ. Health Perspect. 2009, 117, A150–A156. [Google Scholar] [CrossRef] [PubMed] [Green Version]
  2. Masliyah, J.; Zhou, Z.J.; Xu, Z.; Czarnecki, J.; Hamza, H. Understanding Water-Based Bitumen Extraction from Athabasca Oil Sands. Can. J. Chem. Eng. 2008, 82, 628–654. [Google Scholar] [CrossRef]
  3. Takamura, K. Microscopic Structure of Athabasca Oil Sand. Can. J. Chem. Eng. 1982, 60, 538–545. [Google Scholar] [CrossRef]
  4. Czarnecki, J.; Radoev, B.; Schramm, L.L.; Slavchev, R. On the Nature of Athabasca Oil Sands. Adv. Colloid Interface Sci. 2005, 114, 53–60. [Google Scholar] [CrossRef] [PubMed]
  5. Rao, F.; Liu, Q. Froth Treatment in Athabasca Oil Sands Bitumen Recovery Process: A Review. Energy Fuels 2013, 27, 7199–7207. [Google Scholar] [CrossRef]
  6. Miller, J.D.; Misra, M. Hot Water Process Development for Utah Tar Sands. Fuel Process. Technol. 1982, 6, 27–59. [Google Scholar] [CrossRef]
  7. Choung, J.; Walker, J.; Xu, Z.; Masliyah, J. Effect of Temperature on the Stability of Froth Formed in the Recycle Process Water of Oil Sands Extraction. Can. J. Chem. Eng. 2008, 82, 801–806. [Google Scholar] [CrossRef]
  8. Flury, C.; Afacan, A.; Tamiz Bakhtiari, M.; Sjoblom, J.; Xu, Z. Effect of Caustic Type on Bitumen Extraction from Canadian Oil Sands. Energy Fuels 2014, 28, 431–438. [Google Scholar] [CrossRef]
  9. Kotlyar, L.S.; Deslandes, Y.; Sparks, B.D.; Kodama, H.; Schutte, R. Characterization of Colloidal Solids from Athabasca Fine Tails. Clays Clay Miner. 1993, 41, 341–345. [Google Scholar] [CrossRef]
  10. Lo, C.C.; Brownlee, B.G.; Bunce, N.J. Mass Spectrometric and Toxicological Assays of Athabasca Oil Sands Naphthenic Acids. Water Res. 2006, 40, 655–664. [Google Scholar] [CrossRef]
  11. Long, Y.; Dabros, T.; Hamza, H. Stability and Settling Characteristics of Solvent-Diluted Bitumen Emulsions. Fuel 2002, 81, 1945–1952. [Google Scholar] [CrossRef]
  12. Joshi, V.; Kundu, D. Ionic liquid promoted extraction of bitumen from oil sand: A review. J. Pet. Sci. Eng. 2021, 199, 108232. [Google Scholar] [CrossRef]
  13. Lin, F.; Stoyanov, S.R.; Xu, Y. Recent advances in nonaqueous extraction of bitumen from mineable oil sands: A review. Org. Process. Res. Dev. 2017, 21, 492–510. [Google Scholar] [CrossRef]
  14. Zhou, J.Z. Role of mineral flotation technology in improving bitumen extraction from mined Athabasca oil sands III. Next generation of water-based oil sands extraction. Can. J. Chem. Eng. 2021, 99, 755–777. [Google Scholar] [CrossRef]
  15. Lu, Y.; Sun, D.; Ralston, J.; Liu, Q.; Xu, Z. CO2-responsive surfactants with tunable switching pH. J. Colloid Interface Sci. 2019, 557, 185–195. [Google Scholar] [CrossRef]
  16. Han, C.; Li, R.; Lu, Y. Study on synthesized thermoresponsive block copolymer for water-based oil sands extraction. Energy Fuels 2020, 34, 9473–9482. [Google Scholar] [CrossRef]
  17. Yang, B.; Duhamel, J. Extraction of Oil from Oil Sands Using Thermoresponsive Polymeric Surfactants. ACS Appl. Mater. Interfaces 2015, 7, 5879–5889. [Google Scholar] [CrossRef] [Green Version]
  18. Góis, J.R.; Popov, A.V.; Guliashvili, T.; Serra, A.C.; Coelho, J.F.J. Synthesis of Functionalized Poly(Vinyl Acetate) Mediated by Alkyne-Terminated RAFT Agents. RSC Adv. 2015, 5, 91225–91234. [Google Scholar] [CrossRef]
  19. Keddie, D.J.; Moad, G.; Rizzardo, E.; Thang, S.H. RAFT Agent Design and Synthesis. Macromolecules 2012, 45, 5321–5342. [Google Scholar] [CrossRef]
  20. Moad, G.; Rizzardo, E.; Thang, S.H. A RAFT Tutorial. Strem Chem. 2011, 25, 2–10. [Google Scholar]
  21. Gottlieb, H.E.; Kotlyar, V.; Nudelman, A. NMR Chemical Shifts of Common Laboratory Solvents as Trace Impurities. J. Org. Chem. 1997, 62, 7512–7515. [Google Scholar] [CrossRef] [PubMed]
  22. Moad, G.; Rizzardo, E.; Thang, S.H. End-Functional Polymers, Thiocarbonylthio Group Removal/Transformation and Reversible Addition-Fragmentation-Chain Transfer (RAFT) Polymerization. Polym. Int. 2011, 60, 9–25. [Google Scholar] [CrossRef]
  23. Jesson, C.P.; Pearce, C.M.; Simon, H.; Werner, A.; Cunningham, V.J.; Lovett, J.R.; Smallridge, M.J.; Warren, N.J.; Armes, S.P. H2O2 Enables Convenient Removal of RAFT End-Groups from Block Copolymer Nano-Objects Prepared via Polymerization-Induced Self- Assembly in Water. Macromolecules 2017, 50, 182–191. [Google Scholar] [CrossRef] [PubMed]
  24. Pfukwa, R.; Pound, G.; Klumperman, B. Facile End Group Modification of Raft Made Polymers, by Radical Exchange with Hydrogen Peroxide. Polym. Prepr. 2008, 49, 117–118. [Google Scholar]
  25. Masina, N.; Choonara, Y.E.; Kumar, P.; du Toit, L.C.; Govender, M.; Indermun, S.; Pillay, V. A Review of the Chemical Modification Techniques of Starch. Carbohydr. Polym. 2017, 157, 1226–1236. [Google Scholar] [CrossRef]
  26. Tomasik, P.; Schilling, C.H. Chemical Modification of Starch. Adv. Carbohydr. Chem. Biochem. 2004, 59, 175–403. [Google Scholar]
  27. Somcynsky, T. The Lower Critical Solution Temperature (LCST) of Non-polar Polymer Solutions: An Introduction. Polym. Eng. Sci. 1982, 22, 58–63. [Google Scholar] [CrossRef]
  28. Du, H.; Wickramasinghe, R.; Qian, X. Effects of Salt on the Lower Critical Solution Temperature of Poly (N-Isopropylacrylamide). J. Phys. Chem. B 2010, 114, 16594–16604. [Google Scholar] [CrossRef]
  29. Lutz, J.F.; Akdemir, Ö.; Hoth, A. Point by Point Comparison of Two Thermosensitive Polymers Exhibiting a Similar LCST: Is the Age of Poly(NIPAM) Over? J. Am. Chem. Soc. 2006, 128, 13046–13047. [Google Scholar] [CrossRef]
  30. Lessard, D.G.; Ousalem, M.; Zhu, X.X. Effect of the Molecular Weight on the Lower Critical Solution Temperature of Poly(N,N-Diethylacrylamide) in Aqueous Solutions. Can. J. Chem. 2001, 79, 1870–1874. [Google Scholar] [CrossRef]
  31. Zhou, Z.A.; Li, H.; Chow, R.; Adeyinka, O.B.; Xu, Z.; Masliyah, J. Impact of Fine Solids on Mined Athabasca Oil Sands Extraction II. Effect of Fine Solids with Different Surface Wettability on Bitumen Recovery. Can. J. Chem. Eng. 2017, 95, 120–126. [Google Scholar] [CrossRef]
  32. Luque de Castro, M.D.; Priego-Capote, F. Soxhlet Extraction: Past and Present Panacea. J. Chromatogr. A 2010, 1217, 2383–2389. [Google Scholar] [CrossRef]
  33. Chen, Q.; Liu, Q. Bitumen coating on oil sands clay minerals: A review. Energy Fuels 2019, 33, 5933–5943. [Google Scholar] [CrossRef]
  34. Kunz, W.; Henle, J.; Ninham, B.W. About the Science of the Effect of Salts. Curr. Opin. Colloid Interface Sci. 2004, 9, 19–37. [Google Scholar] [CrossRef]
  35. Eeckman, F.; Amighi, K.; Moës, A.J. Effect of some physiological and non-physiological compounds on the phase transition temperature of thermoresponsive polymers intended for oral controlled-drug delivery. Int. J. Pharm. 2001, 222, 259–270. [Google Scholar] [CrossRef]
  36. Rocha, J.A.; Baydak, E.N.; Yarranton, H.W.; Sztukowski, D.M.; Ali-Marcano, V.; Gong, L.; Shi, C.; Zeng, H. Role of Aqueous Phase Chemistry, Interfacial Film Properties, and Surface Coverage in Stabilizing Water-in-Bitumen Emulsions. Energy Fuels 2016, 30, 5240–5252. [Google Scholar] [CrossRef] [Green Version]
  37. Leung, S.S.C.; MacKinnon, M.D.; Smith, R.E.H. Aquatic Reclamation in the Athabasca, Canada, Oil Sands: Naphthenate and Salt Effects on Phytoplankton Communities. Environ. Toxicol. Chem. 2001, 20, 1532–1543. [Google Scholar] [CrossRef]
  38. Akimoto, J.; Ito, Y. Thermoresponsive Biodegradable Polymeric Materials for Biomedical Application. In Sustainability & Green Polymer Chemistry Volume 1; American Chemical Society: Washington, DC, USA, 2020; Volume 1372, pp. 159–172. [Google Scholar]
Scheme 1. Synthesis of the SNP RAFT agent.
Colloids 06 00067 sch001
Figure 1. 1H NMR spectra in D2O at 25 °C for (a) starch-based RAFT agent, (b) SNP-g-PMEO2MA (15%, DS 0.022). The labels in the spectra identify the different types of protons in the structure on the left.
Colloids 06 00067 g001
Figure 2. 1H NMR spectra for (a) oxidized and degraded starch supernatant at 25 °C, (b) cleaved PMEO2MA precipitate, (c) PMEO2MA, (d) SNP-g-PMEO2MA (15%, DS 0.022). The labels in the spectra identify the different types of protons in the structures on the left.
Colloids 06 00067 g002
Figure 3. 1H NMR spectrum for SNP-g-PMEO2MA-PHEA in D2O at 25 °C. The labels in the spectrum identify the different types of protons in the structure on the left.
Colloids 06 00067 g003
Figure 4. Transmittance curves as a function of temperature for the polymer-grafted SNPs.
Colloids 06 00067 g004
Figure 5. Temperature-dependent variations in size and polydispersity of SNP-g-PMEO2MA (15%) at DS (a) 0.022 and (b) 0.038.
Colloids 06 00067 g005
Figure 6. TEM pictures corresponding to the unmodified SNPs (left) and SNP-g-PMEO2MA (15%, DS 0.02, (right)) stained with iodine.
Colloids 06 00067 g006
Figure 7. (Left): Vial containing 1 g of SBos oil sand (10 ± 1% bitumen content), 15 mg SNP-g-PMEO2MA (15%, DS 0.022), 0.5 M NaCl, 60 mg toluene, and 15 mL water attached to a tumbler arm in an oven at 45 °C. (Right): Bitumen floating to the surface 24 h after the extraction.
Colloids 06 00067 g007
Figure 8. Transmittance curves as a function of temperature for 1 mg/mL solutions of SNP-g-PMEO2MA (15%, DS 0.022) at different NaCl concentrations.
Colloids 06 00067 g008
Figure 9. Appearance of bitumen extractions corresponding to Table 3 after 24 h settling.
Colloids 06 00067 g009
Figure 10. Bitumen extraction efficiency with 15 mg of polymer-grafted SNPs, 0.5 M NaCl, 15 mL of water, and 60 mg of toluene at 45 °C for various polymer-grafted SNP samples.
Colloids 06 00067 g010
Figure 11. Polymer solution recycling in four cycles of bitumen extraction with SNP-g-PMEO2MA (15%, DS 0.022), with and without polymer addition in the 3rd and 4th cycles.
Colloids 06 00067 g011
Table 1. Comparison of the number-average molecular weights (Mn) obtained from GPC and NMR analyses.
SampleMn from GPC (kg/mol)PDITheoretical Mn (kg/mol) Initiator Efficiency
SNP-g-PMEO2MA (30%, DS 0.022)57.51.603.210.056
SNP-g-PMEO2MA (15%, DS 0.022)43.31.641.330.031
SNP-g-PMEO2MA (7.5%, DS 0.022)30.81.590.610.020
SNP-g-PMEO2MA (15%, DS 0.012)58.61.862.410.041
Table 2. LCAT values obtained from the transmittance curves in Figure 4.
PMEO2MA-Grafted SamplesLCAT (°C)
SNP-g-PMEO2MA (15%, DS 0.022)32
SNP-g-PMEO2MA (7.5%, DS 0.022)28
SNP-g-PMEO2MA (30%, DS 0.022)20
SNP-g-PMEO2MA (30%)-b-PHEA (15%, DS 0.022)26
SNP-g-PMEO2MA (15%, DS 0.060)-
SNP-g-PMEO2MA (15%, DS 0.038)36
PEG-b-PMEO2MA32
Table 3. Bitumen extraction under different conditions.
#TrialsExtraction ConditionsExtraction Efficiency (%)
13No Salt, no polymer, 15 mL water, 60 mg toluene, 45 °C 20 ± 1
23No Salt, no polymer, 15 mL water, 70 mg toluene, 45 °C 34 ± 4
330.5 M NaCl, no polymer, 15 mL water, 60 mg toluene, 45 °C 31 ± 2
430.5 M NaCl, 15 mg SNP, 15 mL water, 60 mg toluene, 45 °C 33 ± 4
5120.5 M NaCl, SNP-g-PMEO2MA (15%, DS 0.022), 15 mL water, 60 mg toluene, 45 °C 78 ± 3
63No Salt, SNP-g-PMEO2MA (15%, DS 0.022), 15 mL water, 60 mg toluene, 45 °C 48 ± 3
730.5 M NaCl, SNP-g-PMEO2MA (15%, DS 0.022), 15 mL water, 60 mg toluene, 22 °C 41 ± 5
8615 mL recycled SNP-g-PMEO2MA (15%, DS 0.022) solution, 60 mg toluene, 45 °C 82 ± 3
930.5 M NaCl,15 mL PEG-b-PMEO2MA solution, 60 mg toluene, 45 °C 36 ± 5
Publisher’s Note: MDPI stays neutral with regard to jurisdictional claims in published maps and institutional affiliations.

