Article

Direct Resolution of the Interactions of a Hydrocarbon Gas with Adsorbed Surfactant Monolayers at the Water/Air Interface Using Neutron Reflectometry

by
Richard A. Campbell
1,2,*,
Talmira Kairaliyeva
3,
Svetlana Santer
3,
Emanuel Schneck
4 and
Reinhard Miller
4,*
1
Institut Laue-Langevin, 71 Avenue des Martyrs, CEDEX 09, 38042 Grenoble, France
2
Division of Pharmacy and Optometry, University of Manchester, Manchester M13 9PT, UK
3
Institute for Physics and Astronomy, University of Potsdam, 14476 Potsdam, Germany
4
Physics Department, Technical University Darmstadt, 64289 Darmstadt, Germany
*
Authors to whom correspondence should be addressed.
Colloids Interfaces 2022, 6(4), 68; https://doi.org/10.3390/colloids6040068
Submission received: 23 September 2022 / Revised: 13 October 2022 / Accepted: 2 November 2022 / Published: 14 November 2022

Abstract

:
We have directly resolved in the present work the interfacial composition during and after the interactions of a saturated atmosphere of oil vapor with soluble surfactant solutions at a planar water/air interface for the first time. Experiments were conducted on interactions of hexane vapor with solutions of alkyltrimethylammonium bromides and sodium dodecyl sulfate to observe the balance between cooperativity and competition of the components at the interface. In all cases, hexane adsorption was strongly enhanced by the presence of the surfactant, even at bulk surfactant concentrations four orders of magnitude below the critical micelle concentration. Cooperativity of the surfactant adsorption was observed only for sodium dodecyl sulfate at intermediate bulk concentrations, yet for all four systems, competition set in at higher concentrations, as hexane adsorption reduced the surfactant surface excess. The data fully supported the complete removal of hexane from the interface following venting of the system to remove the saturated atmosphere of oil vapor. These results help to identify future experiments that would elaborate and could explain the cooperativity of surfactant adsorption, such as on cationic surfactants with short alkyl chains and a broader series of anionic surfactants. This work holds relevance for oil recovery applications with foam, where there is a gas phase saturated with oil vapor.

Graphical Abstract

1. Introduction

We use surfactants in almost any situation of daily life, as cosmetics or medicine or as stabilizers in foamed or emulsified food. In many industrial technologies, surfactants are essential for highly efficient coatings or in the processing of mineral resources [1]. The selection of the most suitable surfactants or their mixtures requires a broad knowledge of their properties at the corresponding interface. Surfactants have been known for thousands of years [2]. The first synthetic surfactant was invented and patented almost one century ago by Bertsch [3], who was also the main person in the formulation of the first fully synthetic detergent FEWA, still being marketed by Henkel AG & Co. KGaA. There are, however, still many open questions in the understanding of the principles of surfactant actions [4]. In particular, at water/oil interfaces, the structure of the interfacial layers is not yet very clear. The main idea of these interfaces consists of a layer of adsorbed surfactants penetrated by oil molecules [5,6] with a much higher interfacial roughness, even than that implied by thermal broadening from the low interfacial tension [7,8]. This picture was recently revised when it was demonstrated that at the water/oil interface, the surfactant molecules self-assemble with the molecules of the oil phase and form a mixed interfacial layer [9]. The number of oil molecules structured at the interface compete with the number of adsorbed surfactants. Due to the competition, with the increased amount of surfactants, the number of oil molecules in the interfacial layer decreases. At a low surfactant concentration, however, there are even cooperative effects observed; i.e., the oil molecules assembled in a certain structure at the water/oil interface attract the surfactants and incorporate them into the interfacial layer [9], which is observed in many water/oil systems. In comparison to the water/air interface, the change in interfacial tension starts at much lower surfactant bulk concentrations [10].
The interface between water (or aqueous surfactant solution) and oil vapor is an intermediate situation between that of the water/air and water/oil interfaces. Of course, a lot of research has been conducted to further understand surfactant design, both in bulk emulsions [11,12] and at planar water/oil interfaces [13]. Even so, the interactions of oil vapor with aqueous surfactant solutions require further work. It was shown recently that the surface tension isotherm, for example, of dodecyltrimethylammonium bromide (C12TAB) adsorbed at the solution/hexane vapor interface, is located between those measured at the water/air and water/liquid hexane interfaces [10]. The slopes of these isotherms close to the critical micelle concentration are the largest for the water/air interface and lowest for the water/liquid hexane interface; i.e., the adsorbed amount of surfactant is largest at the water/air and lowest at the water/liquid hexane interface.
In early experiments at the water/hexane vapor interface in the absence of surfactants, a surface tension decrease was observed, which could only be described by the adsorption of hexane molecules from the vapor phase [10]. Moreover, it was shown that in the presence of surfactants in the water phase, surfactants adsorb from the aqueous phase and oil molecules from the vapor phase. A cooperativity between the adsorbing molecules was evidenced: in the presence of hexane vapor in the gas phase, more surfactant molecules were adsorbed so that the measured surface tensions were much lower than those for the water/air but much higher than the respective values for the water/liquid oil interface. This obviously intermediate situation between the water/air and the water/liquid oil interfaces was studied for many different surfactants, including sodium dodecyl sulfate (SDS) and C12TAB in [10], and for the series of alkyltrimethylammonium bromides (CnTABs) for n = 10, 12, 14, and 16 in [14]. A general overview for these and other surfactants adsorbed at the water/alkane vapor interface and a comparison with the situation at the water/liquid alkane interface was given in [9]. In all cases, a transition from a cooperative adsorption of surfactant and alkane molecules at very low bulk surfactant concentrations to a competitive adsorption between these two components at higher bulk surfactant concentrations was observed.
Surface and interfacial tensiometry methods are most frequently used in studies of the influence of various factors on interfacial phenomena, including the impact of additional compounds such as added salts or co-surfactants. Among these tensiometry methods, those based on single drops or bubbles are most suited for the present situation [15], i.e., to investigate the adsorption process of surfactants at the solution/hexane vapor interface [10]. The same methods allow additional studies of the dilatational interfacial viscoelasticity, which provides insight into relaxation mechanisms in the interfacial layer.
An alternative tensiometry approach is to use force measurements at a planar interface, which itself has the bonus of being a platform that is amenable to the application of reflectometry techniques [16]. Even so, tensiometry cannot be used to resolve the surface coverage of a multi-component system, so other complementary techniques are needed. Despite the high precision of interfacial ellipsometry, the technique is limited in accuracy to quantify thin interfacial layers, especially of ionic surfactants, due to their complex dielectric profile [17]; it also lacks the ability to distinguish different components in interfacial mixtures [18]. Hence, by itself, ellipsometry is not suitable for understanding the composition of adsorbed layers at the water/air interface of surfactant molecules from the aqueous phase and hexane molecules from the gas phase [19].
An additional experimental approach is the application of neutron reflectometry (NR) based on isotopically labelled molecules, such as deuterated oils or surfactants [20,21]. Even though NR is traditionally known as a powerful but slow technique, recent significant improvements in instrumentation have opened the technique to time-resolved studies [22]. Indeed, over the last few years, kinetic studies on the interactions of peptides with lipid monolayers have successfully resolved the interfacial composition of binary mixtures on the minute time scale [23], and it is now even possible to resolve the 3D structural dynamics of polymer/surfactant mixtures [24]. Most relevant to the present work, the first quantitative assessment was published last year on the time-resolved interactions of fluorocarbon oil vapor with lipid monolayers, thanks to the combined application of ellipsometry and NR [25].
The aim of the present work is to directly resolve the interactions of a hydrocarbon gas with adsorbed surfactant monolayers, for the first time, using NR. The objectives are to gain direct evidence for cooperativity versus competition between the surfactant and the oil vapor, with respect to the surfactant chain length, surfactant headgroup charge, and bulk surfactant concentration, and to identify additional experiments that would help to elaborate and explain the nature of the interaction in future works. Experiments were conducted using sealed adsorption troughs on a leading neutron reflectometer by pre-forming a surfactant monolayer at a planar water/air interface, then saturating the atmosphere with hexane, followed by venting the hexane from the system. Measurements were recorded repeatedly on the minute time scale, and the surfactant and oil were quantified in sequential experiments, where that component alone was deuterated. While the relative surface excesses of surfactants and oil vapor have been inferred from surface tension analysis in previous works [14], such analysis is subject to certain assumptions and systematic errors. Hence, the present work represents the first direct resolution of the surface excesses of the interfacial components before the new results are discussed in the context of the previous tensiometry data.

2. Materials and Methods

2.1. Materials

SDS, C12TAB, C14TAB, C16TAB, hexane, ethanol (≥99.8%), and D2O were purchased from Sigma Aldrich, while d25-sodium dodecyl sulfate (d-SDS), chain-deuterated d25-dodecyltrimethylammonium bromide (d-C12TAB), chain-deuterated d29-tetradecyltrimethylammonium bromide (d-C14TAB), and chain-deuterated d33-hexadecyltrimethylammonium bromide (d-C16TAB) were purchased from CDN Isotopes. All materials were used as received, except that SDS, which is highly susceptible to surface-active impurities. Before experiments, it was recrystallized twice in ethanol, followed by drying under a vacuum. Ultra-pure water was generated by passing deionized water through a Milli-Q unit (total organic content ≤ 4 ppb, resistivity = 18 MΩ·cm).

2.2. NR Experiments

Neutron reflectivity measurements were performed on the FIGARO time-of-flight reflectometer at the Institut Laue-Langevin (Grenoble, France). Choppers were used to generate neutron pulses with a wavelength resolution of 7% dλ/λ over the range 2–16 Å, and the angle of incidence used was θ = 0.62°. Surfactant solutions of 20 mL were loaded into the 6-position adsorption trough assembly belonging to the instrument, and 0.5 mL of oil was injected into miniature dishes made from aluminium foil. Samples were sealed tightly in an assembly involving o-rings and measured in 10-min kinetic slices for at least 3 h; longer measurements were conducted for the samples with the lowest bulk surfactant concentrations to ensure sample equilibration.
An objective of the experiments was to saturate the gas phase with hexane vapor. We can estimate the volume of hexane required to saturate the sealed chamber from the equation for an ideal gas. At 100 kPa and 25 °C, the molar volume of a gas is 0.0248 m³. The partial pressure of hexane in air at the same conditions is about 2 × 10⁴ Pa [14], which in turn corresponds to a molar volume of 0.124 m³. For a cell with about 200 cm³ of air volume, we would need 8 × 10⁻⁴ mole hexane. With a molecular mass of 86.178 g/mol and a density of 0.66 g/cm³, we get about 0.14 g or 0.2 mL hexane to saturate each measuring unit. Hence, the 0.5 mL hexane liquid used in each experiment was more than sufficient to establish the required saturated air phase.
For every sample, four measurements were made of the surfactant solutions prior to exposure to hexane vapor, and another four measurements were made after the venting of the hexane vapor by removing the sealed lids. For each of the 4 surfactant systems, 9 measurements were made of the surfactant surface excess and 5 of the hexane surface excess over 4 orders of magnitude in the bulk surfactant concentration covering the approximate range of 0.0005 to 5 times the critical micelle concentration [26]. Several measurements were repeated to validate the reproducibility of the data.
All measurements were conducted at a room temperature of 21 ± 1 °C.

2.3. NR Principles

The specular neutron reflectivity, R, is defined as the number of neutrons reflected from the interface divided by that in the incident beam and is typically recorded as a function of the momentum transfer normal to the interface, Qz, defined as:
Qz = 4π.sinθ/λ
where λ is the wavelength and θ the incident angle. Neutron scattering from a molecule depends on its scattering length, b, which is defined as the ratio of the sum of the coherent scattering lengths of its atoms. The scattering lengths of the materials in this work are listed in Table 1.
For neutron reflectivity measurements at the water/air interface, it is usual to exploit the opposite signs of the scattering lengths of H2O and D2O by mixing the two liquids in a ratio of 8.1% v/v D2O in H2O called air contrast matched water (ACMW), which has a scattering length of zero and provides no contribution to the specular reflectivity. While it is also a commonly used approach to contrast-match individual components in bulk measurements using small-angle neutron scattering [27,28], it is less common to do so explicitly at the water/air interface. Nevertheless, to facilitate the simplest and most direct method of data treatment, the same principle was applied to prepare contrast-matched hexane (8.6% v/v d-hexane in hexane; cm-hexane), assuming as a first approximation equivalent vapor pressures of d-hexane and hexane, and stock solutions of contrast-matched surfactant (4.3% v/v d-surfactant in surfactant; cm-surf). Two different types of measurements were conducted for each system. For the interaction of hexane with cationic surfactants: (1) cm-hexane and d-surfactant were combined where only the surfactant contributed to the specular reflectivity, and (2) d-hexane and cm-surfactant were combined where only hexane contributed to the specular reflectivity. For the interaction of hexane with SDS, it was not possible to prepare contrast-matched surfactant because the scattering lengths of both hydrogenous and deuterated SDS have the same sign, and therefore: (1) cm-hexane and d-SDS were combined, where only the surfactant contributed to the specular reflectivity, and (2) d-hexane and SDS were combined, where both components contributed to the specular reflectivity.

2.4. NR Data Treatment

Data were reduced using bespoke software developed by the institution called COSMOS and were normalized with respect to the total reflection of a measurement of pure D2O. A tight low-Qz range was used of 0.015–0.025 Å–2, using a restricted range of the measured wavelengths to minimize sensitivity of the analysis to the interfacial structure. Use of a broader Qz-range in the data analysis would have reduced precision in the resolved interfacial composition without any tangible gain in sensitivity to the interfacial structure. The data were then analyzed using the batch fit function of the data analysis software Motofit [29], which is based on the Parratt formulism for the reflection of light at stratified media [30]. Six measurements of pure ACMW were made to determine the background scattering value of 3.20 × 10⁻⁵. Data were analyzed according to the principles of the low-Qz analysis approach [22]. A single-layer of arbitrary scattering length density, ρ, equal to 6 × 10⁻⁶ Å–2 (close to the value for deuterated hexane or surfactant) was fixed, and the layer thickness, d, was fitted. This approach was demonstrated to be independent of the interfacial structure to an uncertainty of just a few percent [25]. Further, although the value of the capillary wave roughness used had a minimal effect on the results, to minimize systematic errors, it was estimated as ~4 Å and applied at all interfaces from the inverse square root dependence of the known surface tension at limiting coverage, with respect to the measured value of pure water [31,32]. For any measurement involving a contrast-matched interfacial component, only the other interfacial component contributes to the specular reflectivity, with its surface excess calculated using:
Γsurf = ρ.d/NA.bsurf
Γhexane = ρ.d/NA.bhexane
where NA is Avogadro’s number. For measurements of d-hexane and SDS, where both components contributed to the specular reflectivity, the hexane surface excess was calculated using:
Γhexane = (ρ.d − Γsurf. NA.bsurf)/NA.bhexane
where Γsurf was resolved using the parallel measurement in the complementary contrast.

3. Results and Discussion

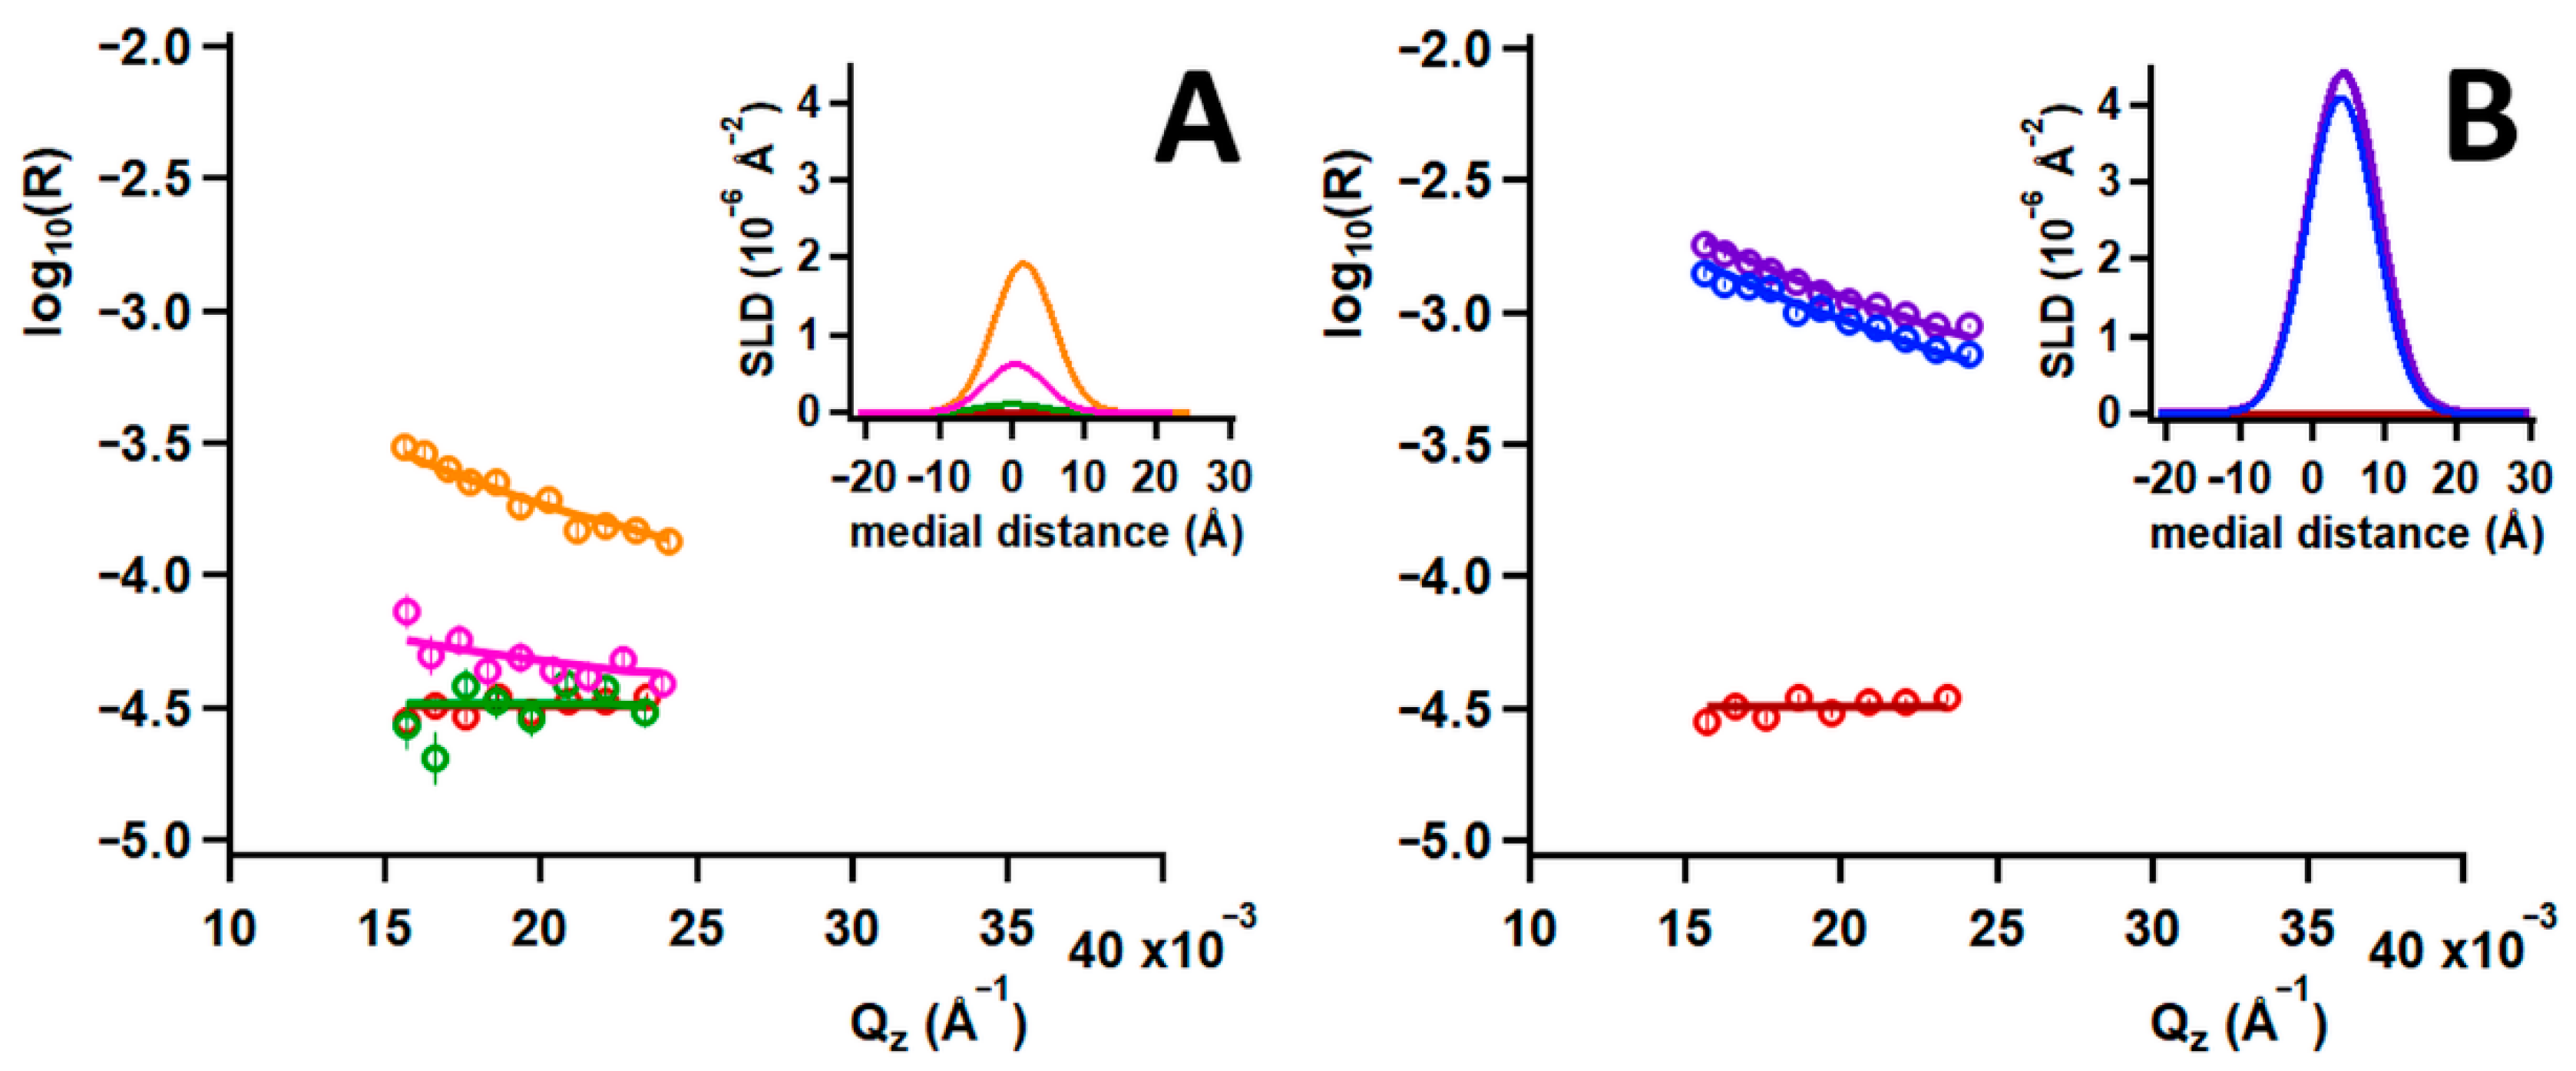
3.1. Contrast Matching Demonstration

The contrast-matching approach adopted in the present work is illustrated in Figure 1, which shows data from the interaction of hexane with 60 mM C12TAB, as well as the measurement of the bare ACMW interface for reference. Panel A shows that 60 mM cm-C12TAB (green) had a minimal signal that was almost superimposed on the measurement of the bare ACMW interface (red). However, following the exposure of the adsorbed layer to d-hexane from the vapor phase, the signal increased substantially (orange). Here, we may bear in mind that the product of scattering length density (SLD) and fitted layer thickness, i.e., the area under the curve shown in the inset, was directly proportional to the surface excess of the single component that was measured in deuterated form, in this case the hexane surface excess. Panel B shows that 60 mM d-C12TAB had a strong signal (purple) in comparison with the bare ACMW interface (red) yet following exposure of the adsorbed layer to cm-hexane from the vapor phase, the signal decreased, which reveals the mechanism of competitive adsorption, as the surfactant surface excess has reduced. It may be noted from a fit to data following the exposure of d-hexane to d-hexane-infused ACMW (panel A; pink) that the surface excess of hexane at a bare water/air interface can be directly quantified as 0.57 μmol/m2.

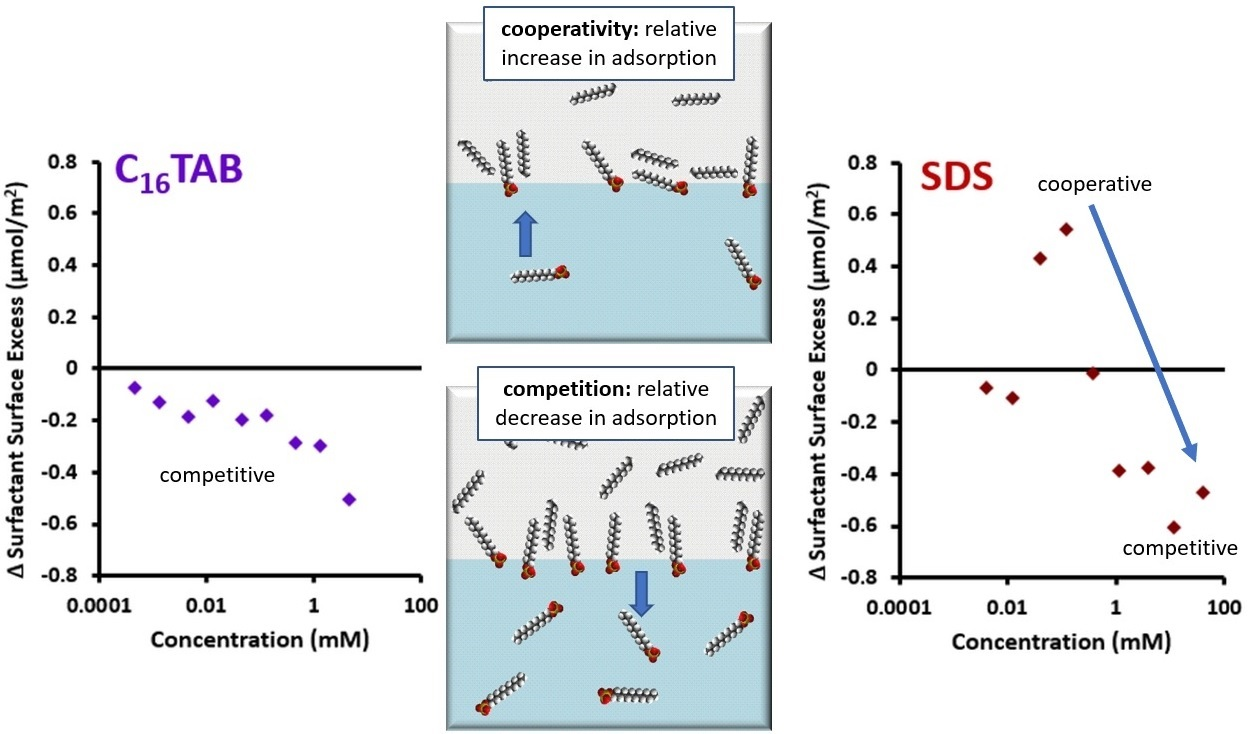
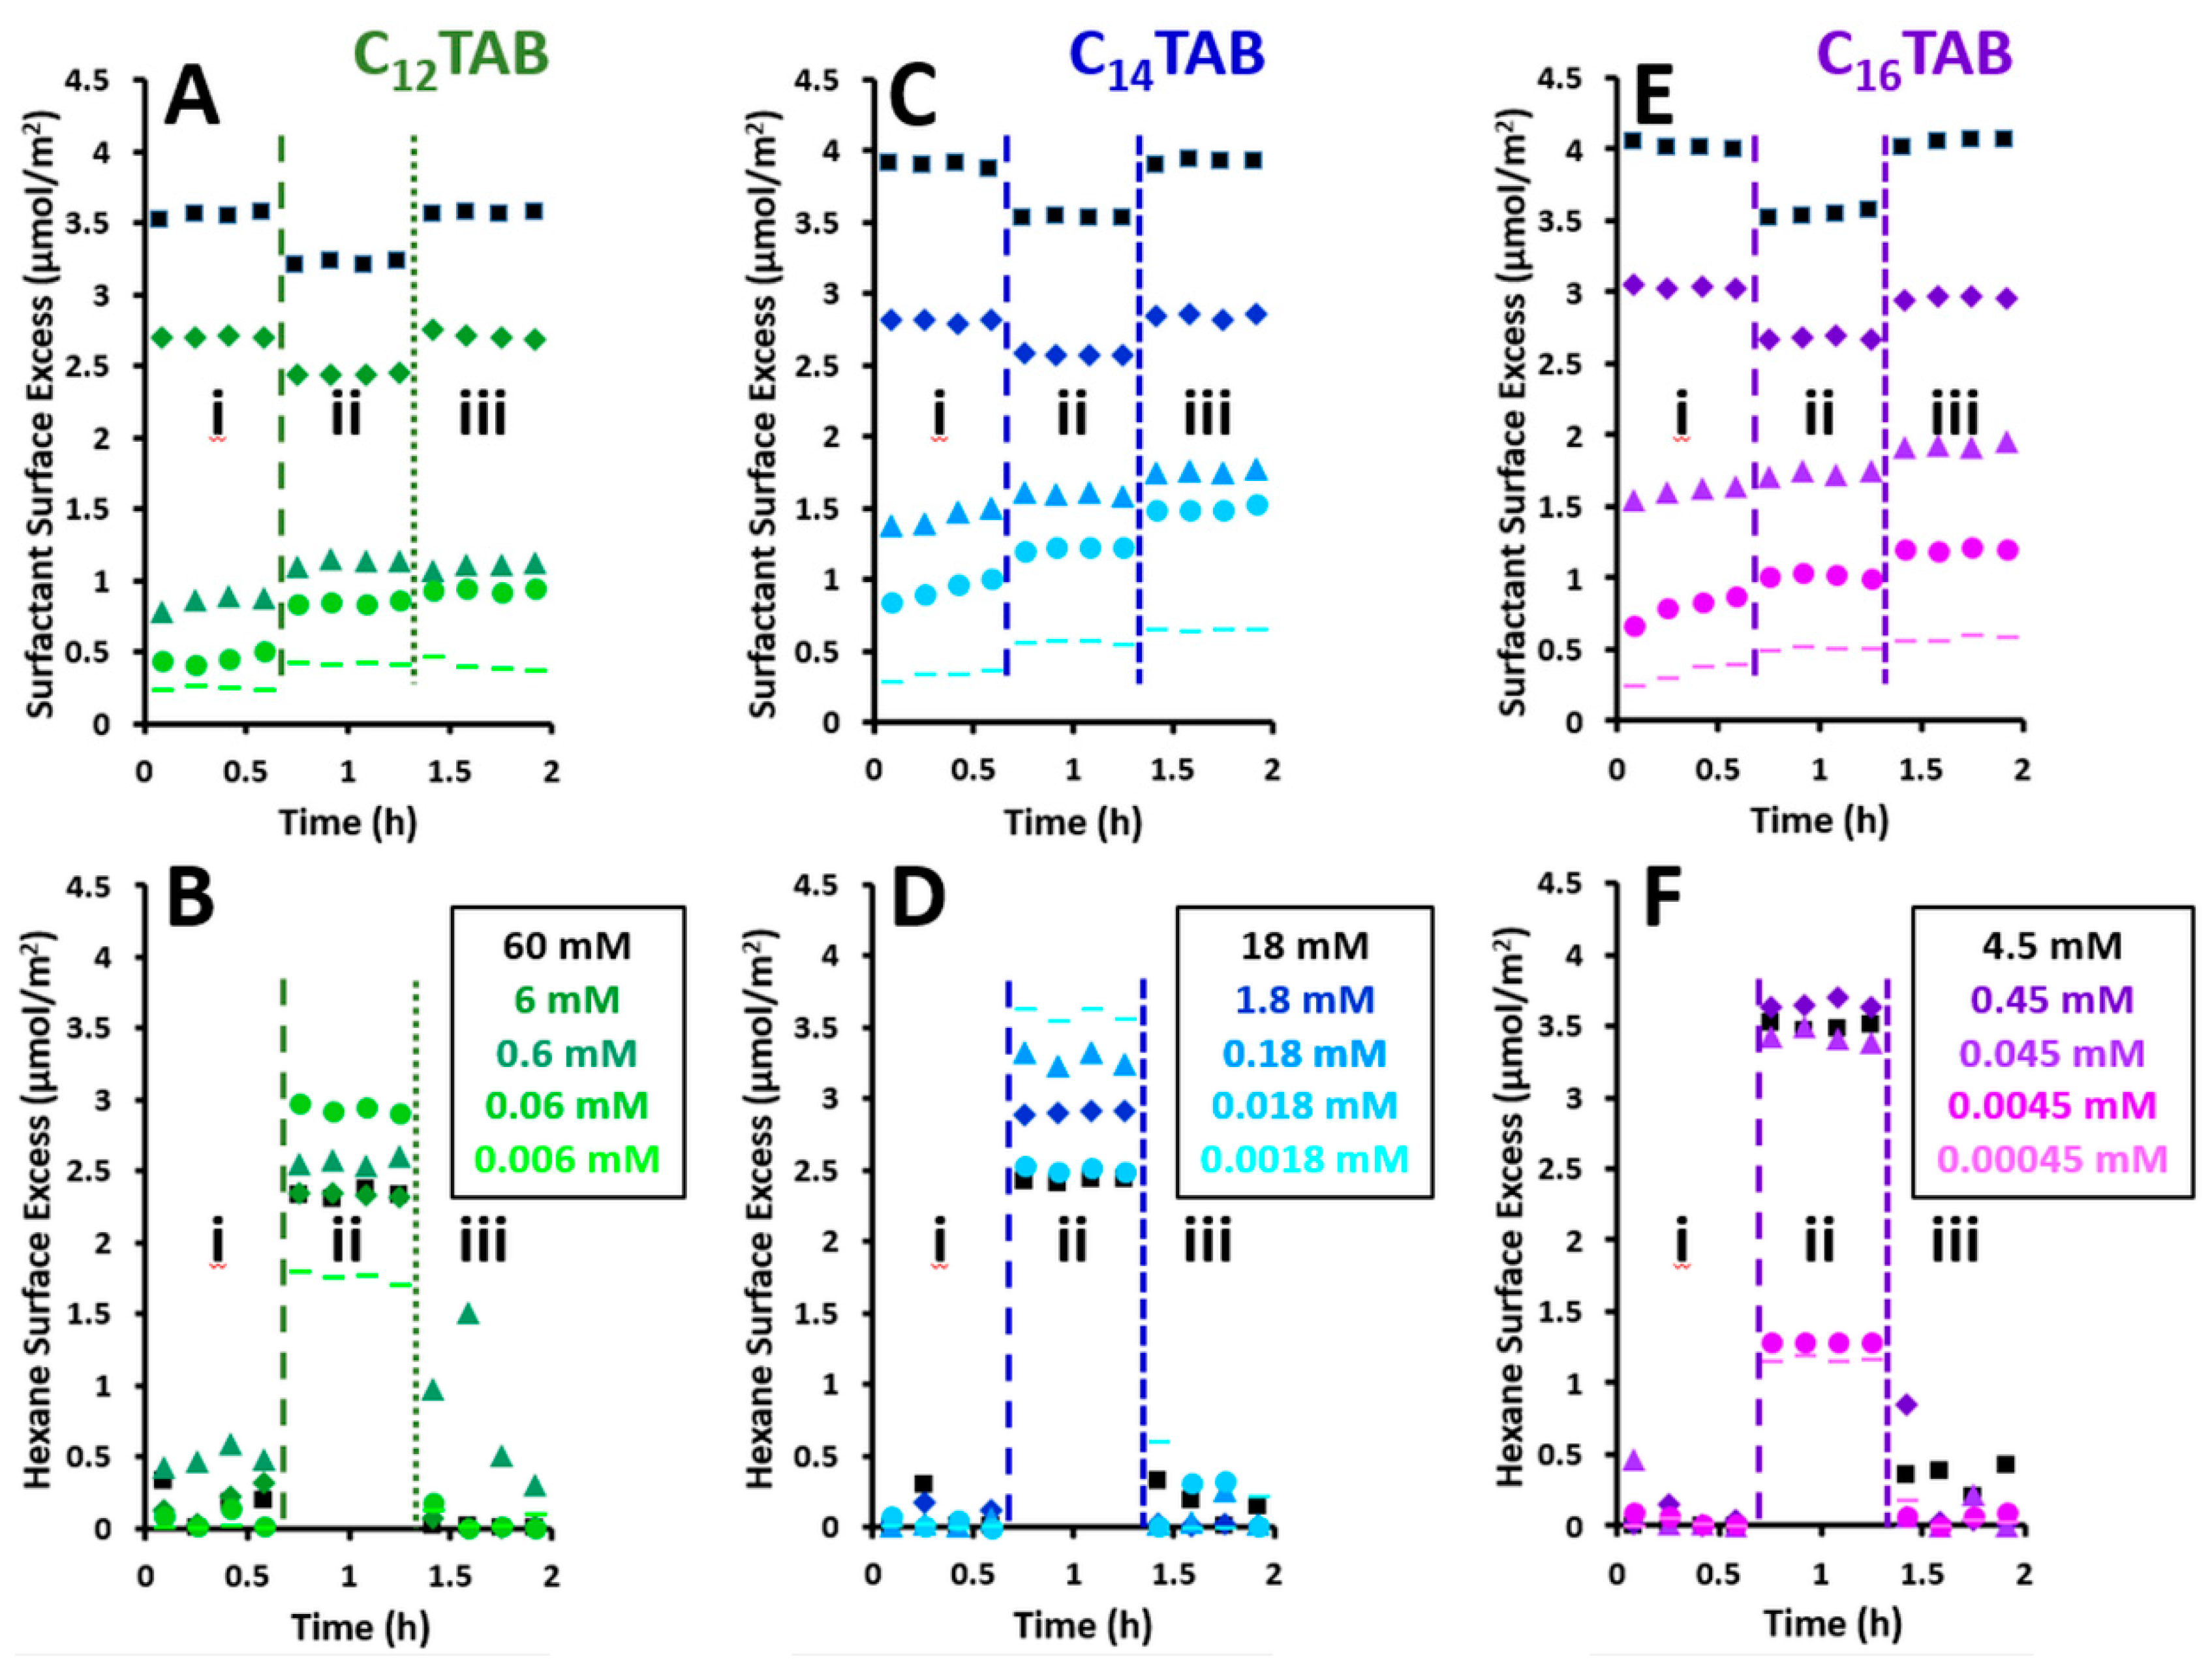
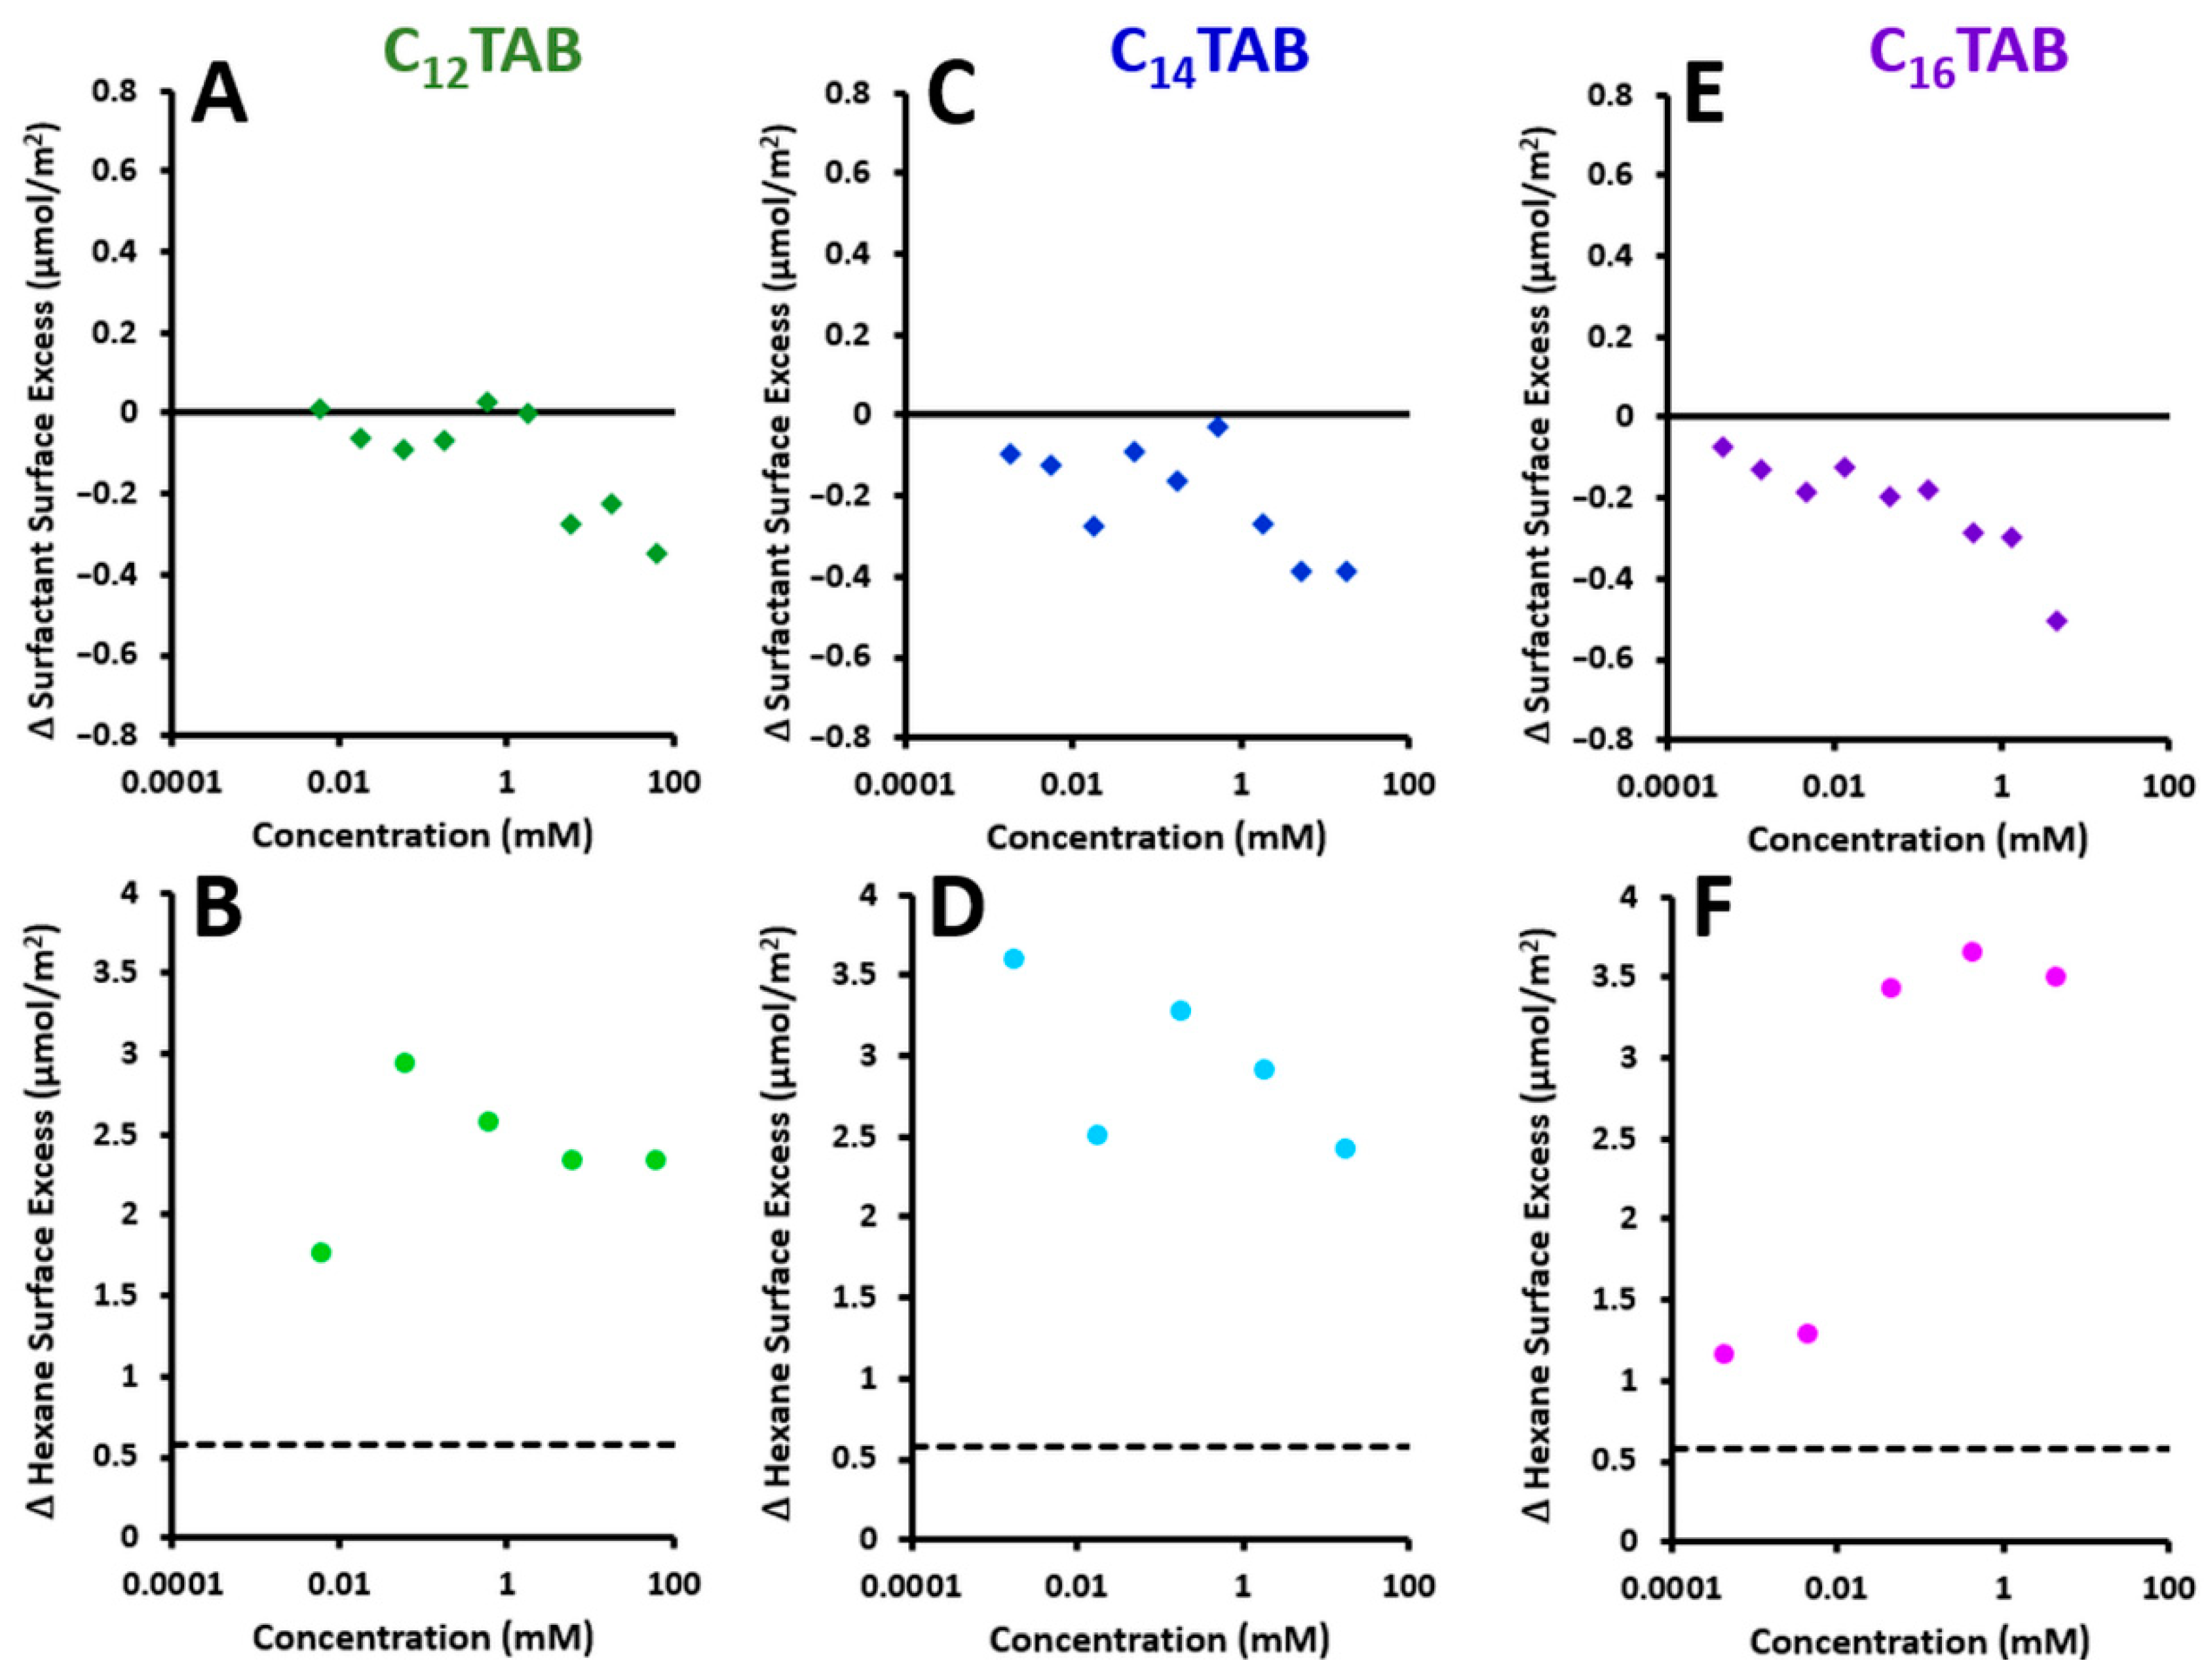
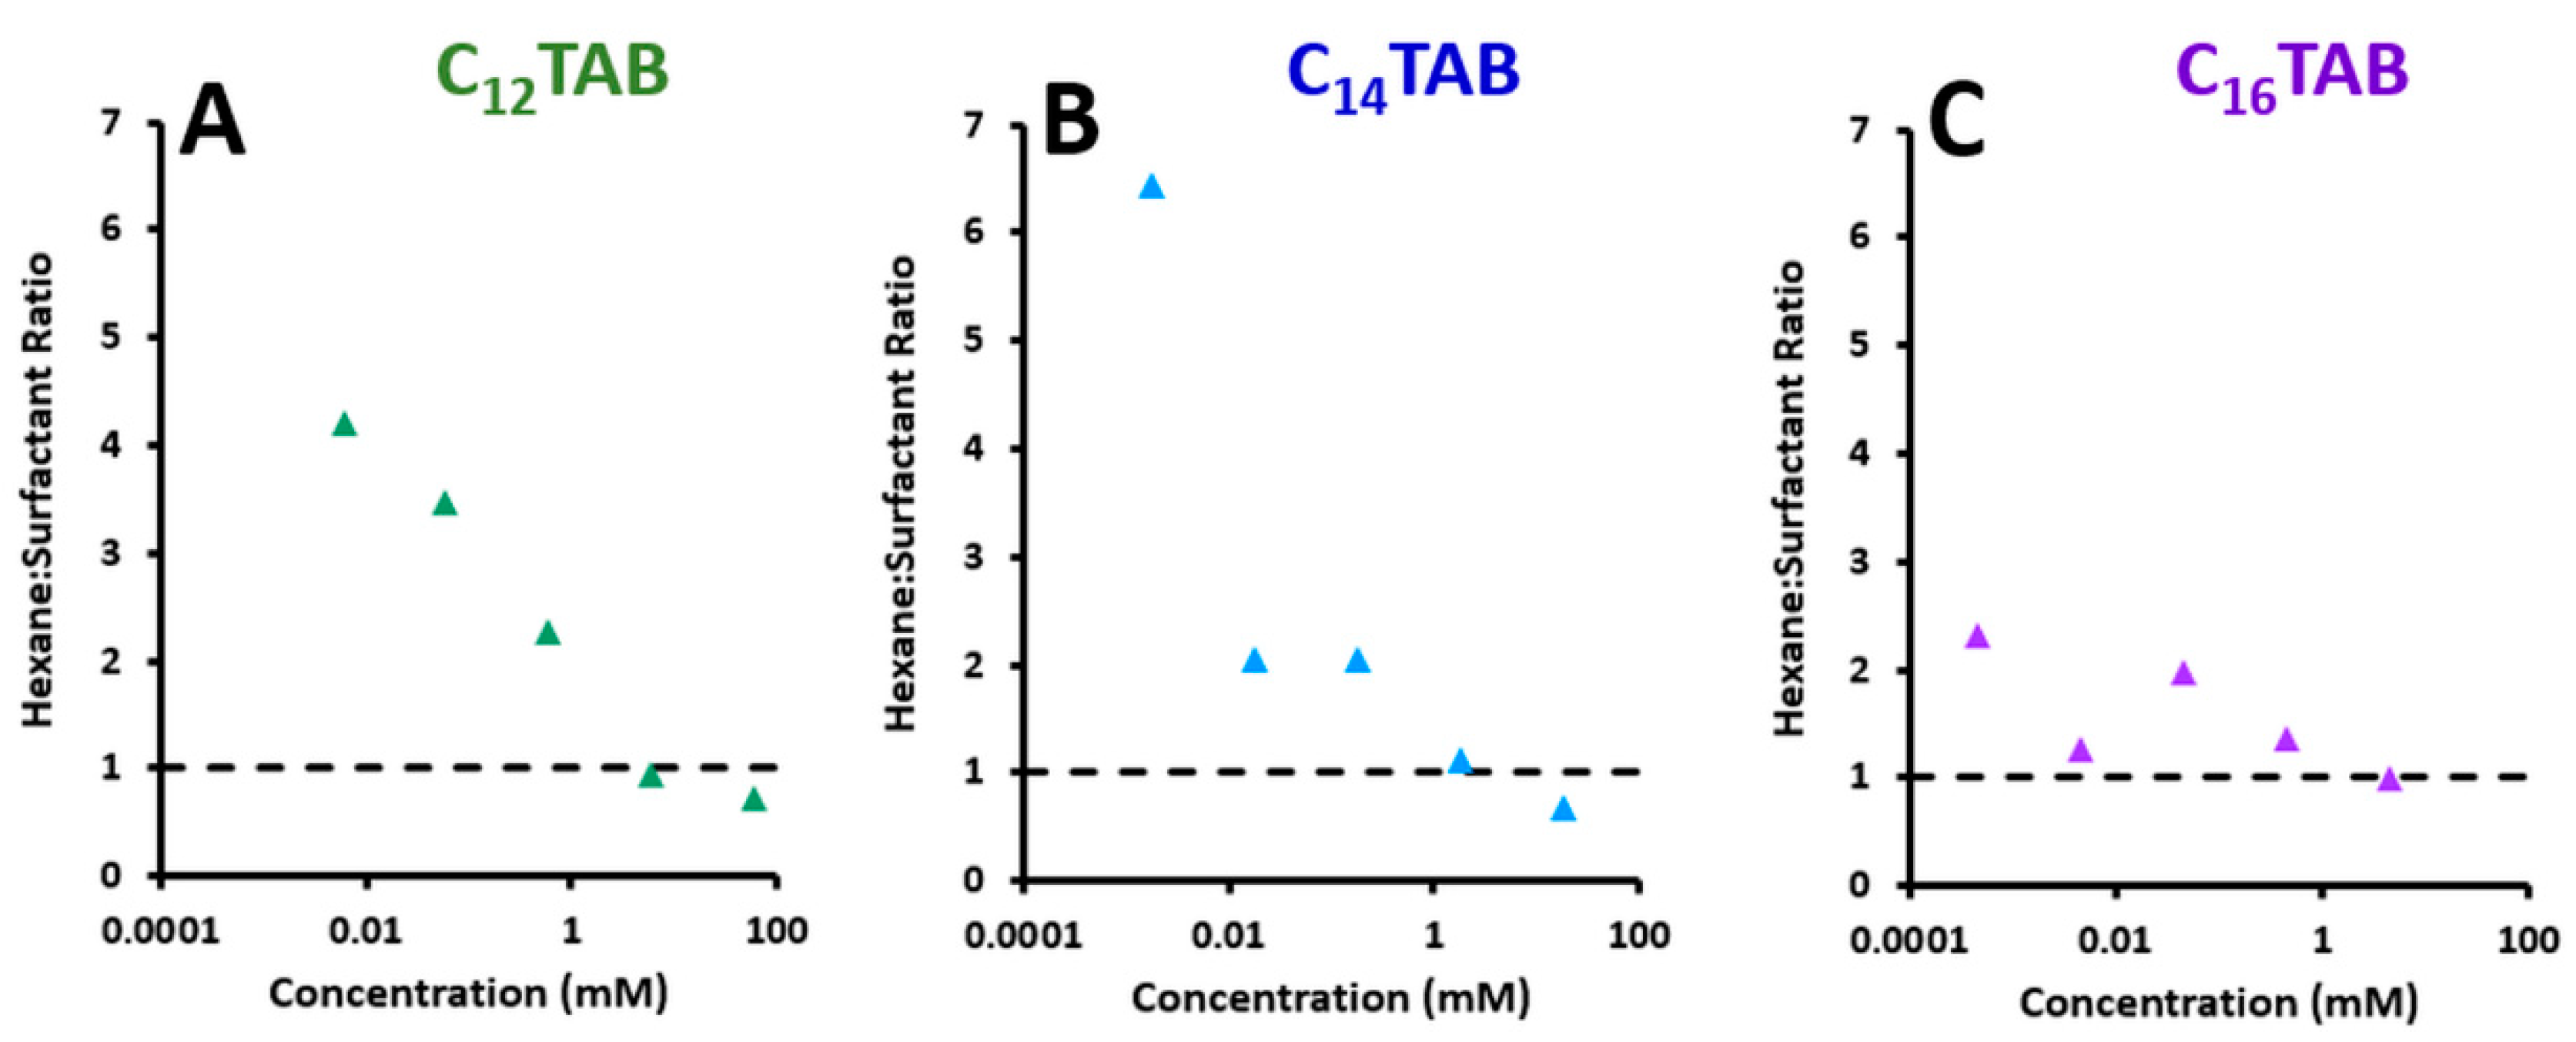
3.2. Cationic Surfactants

Data involving the interactions of hexane vapor with cationic surfactant monolayers are shown in Figure 2 for C12TAB, C14TAB, and C16TAB at bulk concentrations spanning four orders of magnitude. As noted in the Methods section, samples were measured for between 3 and 10 h each, depending on the bulk surfactant concentration, to allow for sample equilibration. The data shown consist of: (i) four points prior to the exposure of the surfactant monolayer to hexane vapor, (ii) the last four points during the interaction representing equilibrium, and (iii) four points following the removal of the sealed lids to vent the hexane from the system; note that the full datasets are shown for reference in Figures S1 (for C12TAB), S2 (for C14TAB), S3 (for C16TAB) and S4 (for SDS) of the Supporting Information. Although nine measurements were made of the surfactant surface excess, only five are shown here for clarity, again with the full datasets included in the Supporting Information.
For the majority of the samples, the interactions were competitive in that as hexane adsorbed to the interface, the surfactant surface excess decreased. This effect was more pronounced for the higher bulk surfactant concentrations measured. The data also demonstrated that the venting of hexane from the system generally resulted in the complete removal of hexane from the interface. In this case, it should be mentioned that the non-zero values measured prior to the exposure of hexane to the system was a result of non-zero-level statistical noise in the data. For the highest bulk concentrations measured, the hexane surface excesses returned to zero, while the surfactant surface excesses returned to their values prior to the interaction. In contrast, for the lowest bulk concentrations measured, the surfactant surface excesses were higher after the interaction than prior to it because the values prior to the interaction did not represent sample equilibrium due to the slow kinetics of adsorption. It may be noted that in some cases, the hexane signals did not return to zero, but this happened in isolated cases, and there were no discernible trends. We believe that these experimental artefacts are related to residual spurious scattering in just a few cases caused by changes of the meniscus of the sample, due to the reduced surface tension of the samples during the interaction.
The changes in surface excess as a result of the interaction of hexane vapor with adsorbed surfactant monolayers are shown in Figure 3. The change in surfactant surface excess is represented by the average of the four data points shown during the interaction (i.e., the last four points recorded representing the sample equilibration) minus the average of the four data points shown after the interaction. This approach assumes that hexane is fully vented from the system after the sealed lids are removed, which is evidenced in Figure 2, and we believe that the values are more meaningful than subtracting the average of the values prior to the interaction, given that the samples had not yet equilibrated. The hexane surface excess is represented simply by the average of the four data points shown during the interaction, again assuming full venting of the system, as we believe that this reduces experimental uncertainty related to residual scattering due to changes in the sample meniscus. There is not a clear trend in the extent of the hexane interaction with the changing bulk surfactant concentration or the surfactant chain length; e.g., the interaction appeared to be slightly stronger at lower bulk concentrations for C14TAB and much stronger at higher bulk concentrations for C16TAB.
The interfacial stoichiometry in terms of the molar ratio of hexane:surfactant during the interaction at sample equilibration is shown in Figure 4. The molar ratio decreased with increasing bulk surfactant concentration in every case. It is clear that a lot more hexane than surfactant molecules were present at the interface. This is supported by the measurement of 0.57 μmol/m2 of hexane on the surface of pure water, as discussed above.

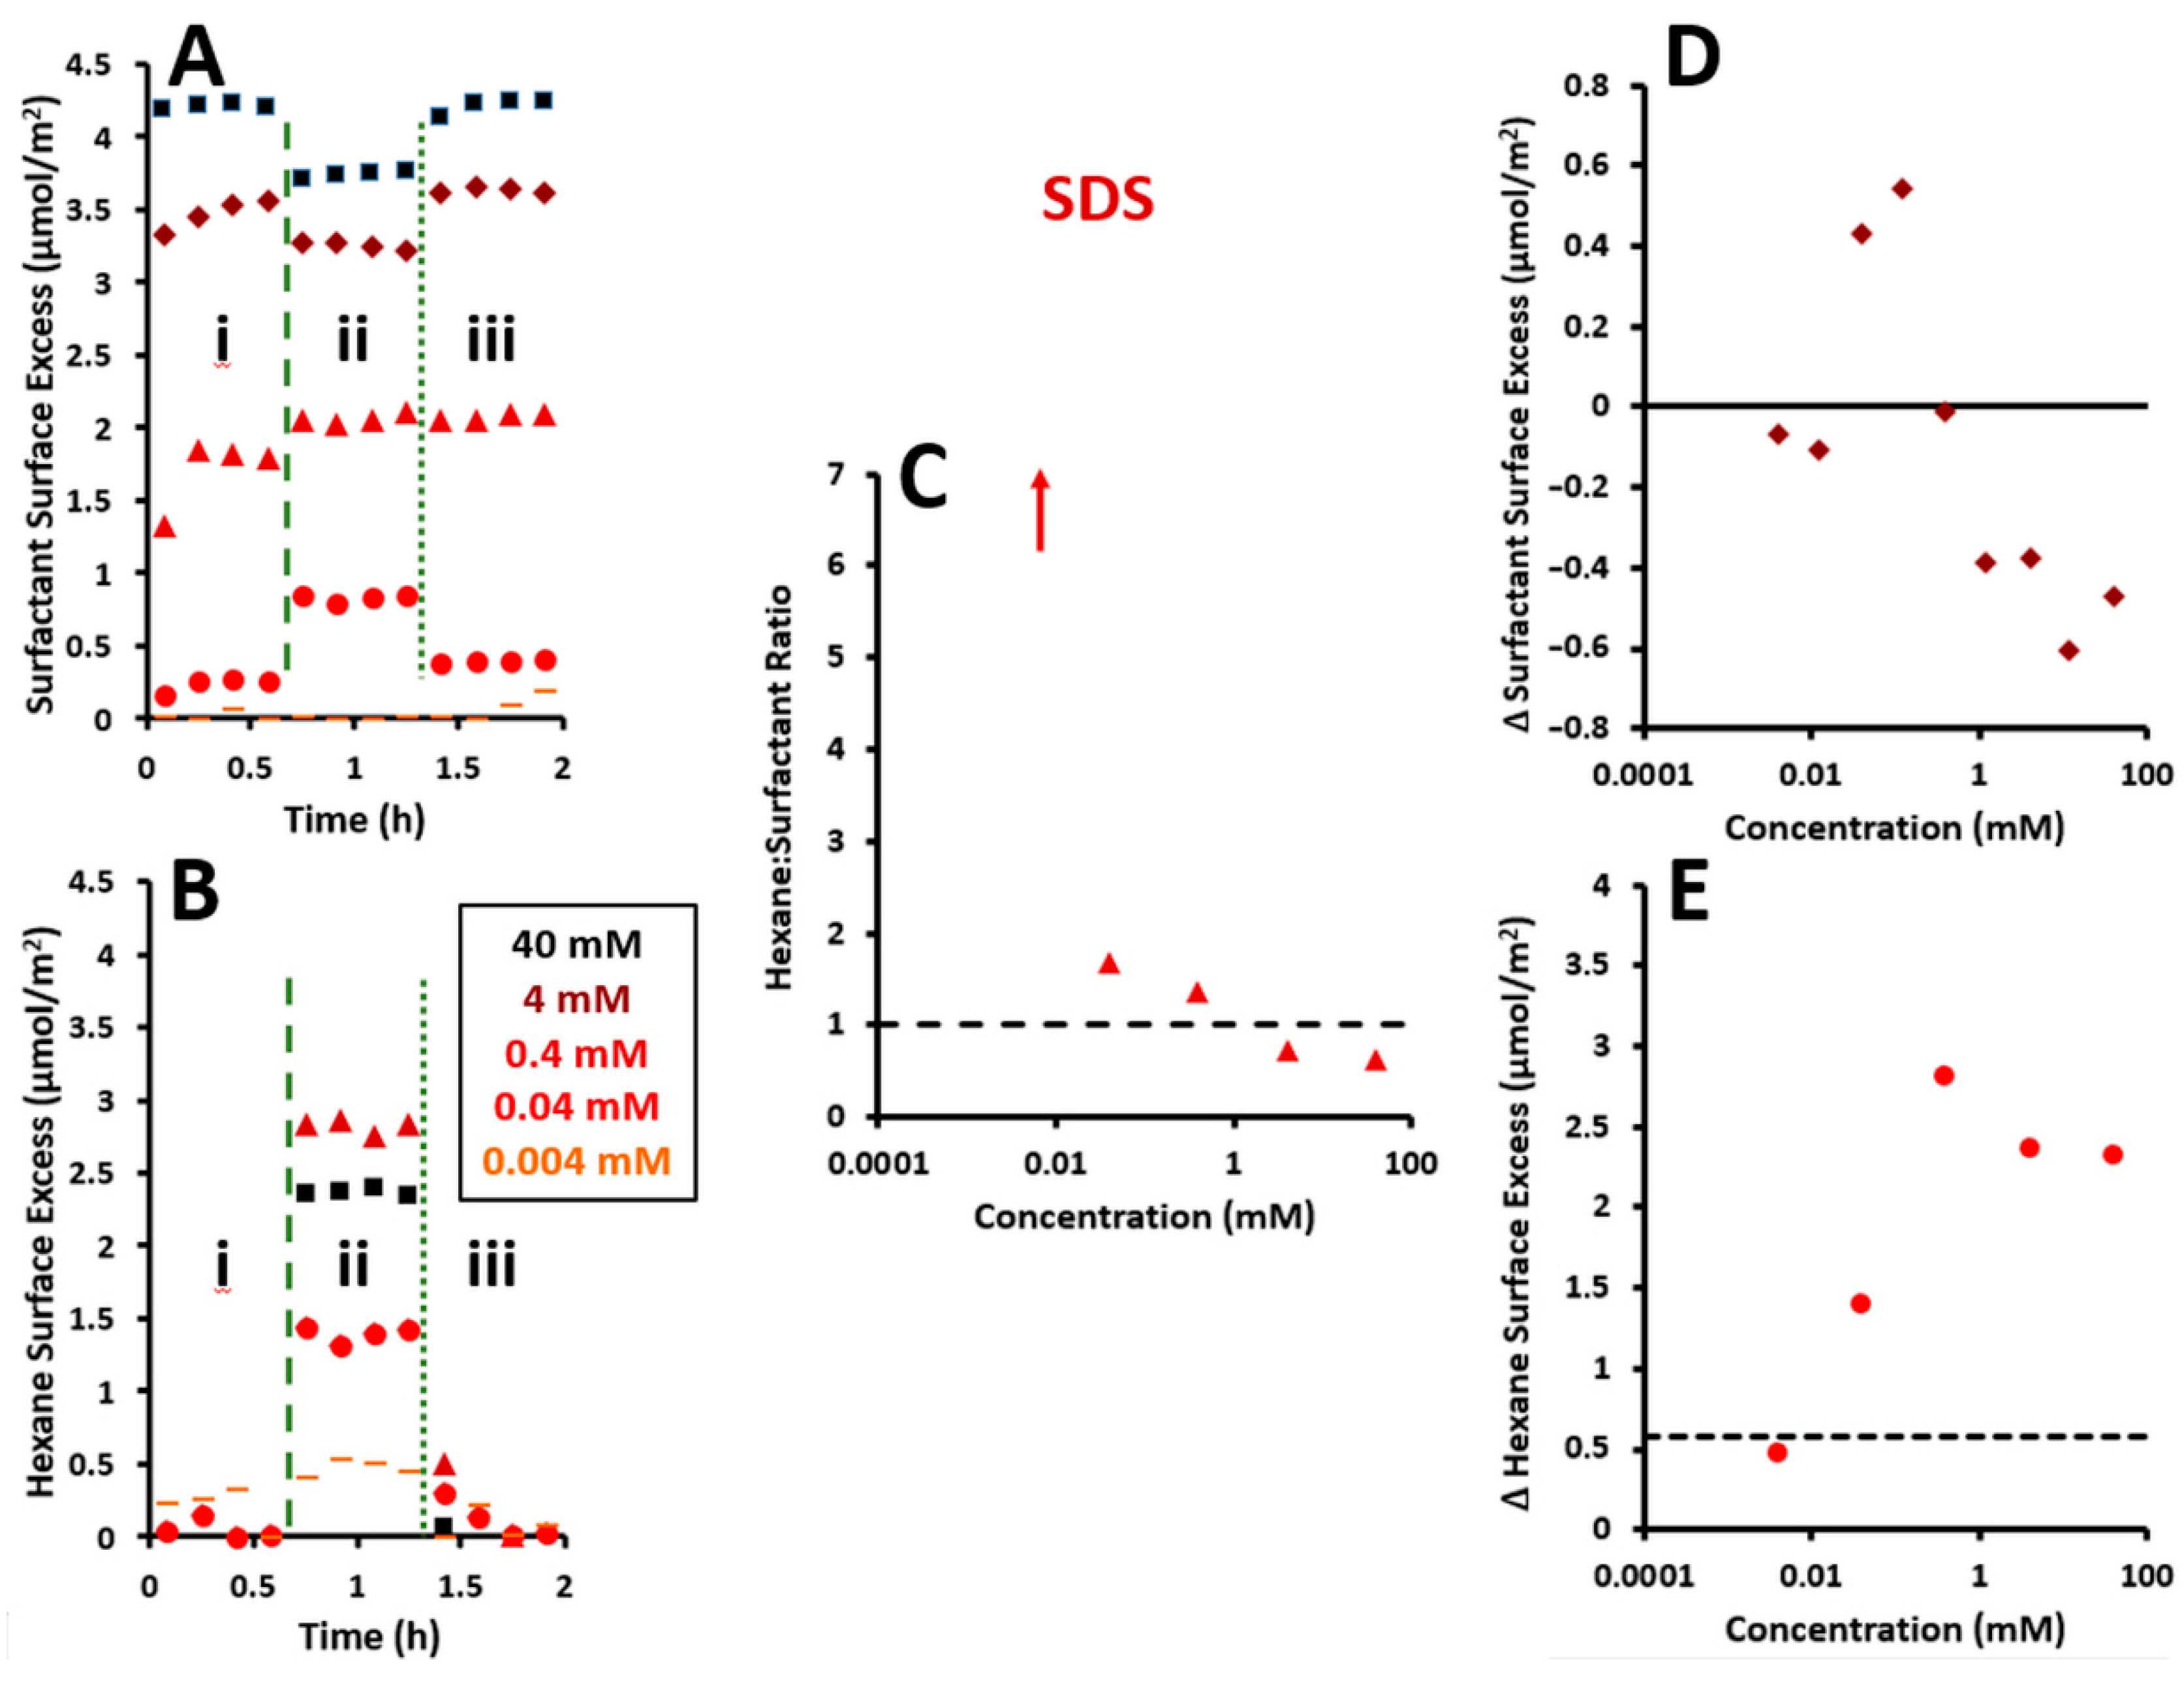
3.3. Anionic Surfactant

The same types of data and analysis as shown in Figure 2, Figure 3 and Figure 4 for the cationic surfactants were combined in Figure 5 for SDS. The main difference was that at intermediate bulk SDS concentrations, there was a cooperative interaction. This may have also been the case for a lower bulk SDS concentration, but it was below the detection limit. This is shown by the measurement at 0.04 mM in panel A, where the surfactant surface excess is higher during the interaction with hexane than that prior to the interaction and venting the hexane from the system. While there is just one example of the cooperative interaction shown in Figure 5, the phenomenon was observed in two consecutive bulk concentrations, as can be seen in the full dataset included in Figure S4 of the Supporting Information, and as confirmed by the two strongly positive data points in panel D.

4. Conclusions

The use of neutron reflectometry has allowed us to provide a direct resolution of the formation of mixed adsorption layers at a planar interface formed by surfactants from aqueous solution and hexane from the vapor phase for the first time. The incorporation of hexane molecules adsorbed from the vapor phase is a reversible process. In most cases, the changes in adsorption of the studied surfactant and the hexane molecules after injection into the measuring cell disappear completely after venting the cell by opening the lid. The few observed exceptions could be explained by experimental artefacts caused by changes in the position of the liquid meniscus of the liquid on the PTFE trough. This point emphasizes the complexity of the experiment, as a set volume of surfactant solution was added to each trough, such that the liquid fully wetted the well of the trough, yet during the interaction with hexane, the liquid started to spill over the rim due to the reduced surface tension. Even so, there was only a small number of artefacts of this nature observed in the data.
Cooperativity effects were observed at intermediate concentrations for SDS (see Figure 5). At low concentrations for the three cationic surfactants, we had also expected cooperativity from our simulations discussed in [9]. However, the bulk surfactant concentrations may not have been low enough to observe the effect, as the data extrapolated to a minimal difference in surfactant surface excess during the interaction at the lowest bulk surfactant concentrations measured. In general, cooperativity was evident in terms of the increased amount of hexane at the interface in the presence of all the studied surfactants. However, was is only for intermediate concentrations of SDS where the surfactant surface excess was enhanced as well. The origin of this difference remains unclear, although to preclude the possibility that trace impurities contributed to the results [33], additional experiments and simulations involving solutions of sodium alkyl sulfate surfactants with different chain lengths in the future may be beneficial to consider. It may also be the case that to observe the cooperativity of enhanced surfactant adsorption for the series of cationic surfactants, we would need to conduct experiments with shorter alkyl chains than C12TAB; the required bulk concentrations to observe cooperativity for surfactants with longer chains would be so low that extremely long adsorption times would be required, precluding NR experiments involving precious beam time. It could also be beneficial in the future to conduct tensiometry experiments with generated convections in the drop, which enhances the adsorption rate by 2–3 orders of magnitude, an approach which has been taken for polymer solutions [34]. Lastly, with increasing bulk surfactant concentrations for all surfactants, competition at the interface was evident, which was clearly observed in all experiments and for all the systems studied.
The stoichiometry in the interfacial layers at the surfactant solution interface to hexane vapor clearly shows that the adsorption of surfactants is enhanced at lower bulk concentrations, which is consistent with the lower interfacial tensions resolved previously [9]. This effect, caused by the interactions of the surfactants with the hexane vapor molecules, can be thought of as an increase in surface activity and could be advantageous for various applications. For example, in enhanced oil recovery based on foams, the used surfactants co-adsorb with alkane molecules from the vapor phase, which emphasizes the relevance of the scenario discussed in the present work, and it may explain why the already small concentrations of surfactant in the bulk are efficient to enhance the cooperativity of the alkane vapor interaction [35,36].
It is necessary to acknowledge two study limitations. First, a quantitative comparison between existing tensiometry and the new NR data was not possible due to differences in the pure surfactant isotherms inferred from tensiometry data from the Gibbs equation and the surface excesses directly resolved, particularly at the low bulk surfactant concentrations studied. We infer the differences to be due to the presence of trace impurities in the deuterated surfactants, which, due to their expense and short supply, were unable to be further purified upon receipt from the manufacturer. Second, structural aspects of the mixed interfacial layer were not resolved, due to the experimental design of the compositional analysis exploiting a high neutron flux at a low Qz that was not sensitive to the locations of the two components at the interface. Indeed, it remains a major challenge to reconcile surface excesses measured experimentally with techniques such as NR and results from analysis using the Gibbs equation with theoretical models, as well as computational simulations [37,38].
We have nevertheless delivered the study objectives of new, direct experimental evidence of the reversibility of the interaction, the balance between cooperativity and competition with respect to different experimental variables, and suggestions on pertinent experiments to drive forward our understanding of the systems. Indeed, to the knowledge of the authors, although related results have been published on interactions of fluorocarbon gases with phospholipid monolayers [25], this is the first study where the surface excesses of two components in equilibrium at the interface, where one is dissolved in the bulk phase and the other volatile in the gas phase, has been directly resolved. This opens the possibility to extend the work to related systems.

Supplementary Materials

The following supporting information can be downloaded at: https://www.mdpi.com/article/10.3390/colloids6040068/s1, Full Datasets: Figure S1. C12TAB; Figure S2. C14TAB; Figure S3. C16TAB: Figure S4. SDS.

Author Contributions

Conceptualization, R.A.C. and R.M.; methodology, R.A.C., E.S. and R.M.; investigation, R.A.C., T.K. and R.M.; formal analysis, R.A.C., T.K., S.S., E.S. and R.M.; writing—original draft preparation, R.A.C., T.K., S.S., E.S. and R.M.; writing—review and editing, R.A.C., T.K., S.S., E.S. and R.M. All authors have read and agreed to the published version of the manuscript.

Funding

This research received no external funding.

Data Availability Statement

Not applicable.

Acknowledgments

We thank the Institut Laue-Langevin in Grenoble, France for the provision of the neutron beam time on the FIGARO reflectometer (https://doi.org/10.5291/ILL-DATA.TEST-2352 and https://doi.org/10.5291/ILL-DATA.9-10-1405).

Conflicts of Interest

The authors declare no conflict of interest.

References

  1. Tadros, T.F. Applied Surfactants: Principles and Applications; Wiley-VCH Verlag GmbH & Co. KGA: Weinheim, Germany, 2005; pp. 85–113. [Google Scholar]
  2. Joshi, T.P. A Short History and Preamble of Surfactants. Int. J. Appl. Chem. 2017, 13, 283–292. [Google Scholar]
  3. Bertsch, H. Available online: https://en.wikipedia.org/wiki/Heinrich_Bertsch (accessed on 23 September 2022).
  4. Rosen, M.J.; Kunjappu, J.T. Surfactants and Interfacial Phenomena; Wiley-VCH: Weinheim, German, 2012; ISBN 978-0-470-54194-4. [Google Scholar]
  5. Aveyard, B. Surfactants: In Solution, at Interfaces and in Colloidal Dispersions; Oxford University Press: Oxford, UK, 2019; ISBN 0198828608. [Google Scholar]
  6. Salamah, A.; Phan, C.M.; Pham, H.G. Dynamic adsorption of cetyltrimethylammonium bromide at decane/water interface. Colloids Surf. A 2015, 484, 313–317. [Google Scholar] [CrossRef]
  7. Zarbakhsh, A.; Querol, A.; Bowers, J.; Yaseen, M.; Lu, J.R.; Webster, J.R.P. Neutron reflection from the liquid-liquid interface: Adsorption of hexadecylphosphorylcholine to the hexadecane—Aqueous solution interface. Langmuir 2005, 21, 11704–11709. [Google Scholar] [CrossRef] [PubMed]
  8. Zarbakhsh, A.; Querol, A.; Bowers, J.; Webster, J.R.P. Structural studies of amphiphiles adsorbed at liquid-liquid interfaces using neutron reflectometry. Faraday Discuss. 2005, 129, 155–167. [Google Scholar] [CrossRef]
  9. Fainerman, V.B.; Aksenenko, E.V.; Kovalchuk, V.I.; Mucic, N.; Javadi, A.; Liggieri, L.; Ravera, F.; Loglio, G.; Schneck, E.; Miller, R. New view of the adsorption of surfactants at the water/alkane interface—Competitive and cooperative effects of surfactant and alkane molecules. Adv. Colloid Interface Sci. 2020, 279, 102143. [Google Scholar] [CrossRef]
  10. Javadi, A.; Moradi, N.; Karbaschi, M.; Fainerman, V.B.; Möhwald, H.; Miller, R. Alkane vapor and surfactants co-adsorption on aqueous solution interfaces. Colloids Surf. A 2011, 391, 19–24. [Google Scholar] [CrossRef]
  11. Mattei, M.; Kontogeorgis, G.M.; Gani, R. A comprehensive framework for surfactant selection and design for emulsion based chemical product design. Fluid Phase Equilibria 2014, 362, 288–299. [Google Scholar] [CrossRef]
  12. Jin, Y.; Liu, D.; Hu, J. Effect of Surfactant Molecular Structure on Emulsion Stability Investigated by Interfacial Dilatational Rheology. Polymers 2021, 13, 1127. [Google Scholar] [CrossRef]
  13. Shabes, B.K.; Altman, R.M.; Richmond, G.L. Come Together: Molecular Details into the Synergistic Effects of Polymer–Surfactant Adsorption at the Oil/Water Interface. J. Phys. Chem. B 2018, 122, 8582–8590. [Google Scholar] [CrossRef]
  14. Mucic, N.; Moradi, N.; Javadi, A.; Aksenenko, E.V.; Fainerman, V.B.; Miller, R. Mixed adsorption layers at the aqueous CnTAB solution/hexane vapour interface. Colloids Surf. A 2014, 442, 50–55. [Google Scholar] [CrossRef]
  15. Ravera, F.; Ferrari, M.; Liggieri, L. Adsorption and partitioning of surfactants in liquid–liquid systems. Adv. Colloid Interface Sci. 2000, 88, 129–177. [Google Scholar] [CrossRef]
  16. Leckner, J. Theory of Reflection. In Volume 87 of Springer Series on Atomic, Optical, and Plasma Physics; Springer International Publishing: Cham, Switzerland, 2016. [Google Scholar]
  17. Tyrode, E.; Johnson, C.M.; Rutland, M.W.; Day, J.P.R.; Bain, C.D. A Study of the Adsorption of Ammonium Perfluorononanoate at the Air-Liquid Interface by Vibrational Sum-Frequency Spectroscopy. J. Phys. Chem. C 2007, 111, 316–329. [Google Scholar] [CrossRef]
  18. Walsh, C.B.; Wen, X.; Franses, E. Ellipsometry and Infrared Reflection Absorption Spectroscopy of Adsorbed Layers of Soluble Surfactants at the Air-Water Interface. J. Colloid Interface Sci. 2001, 233, 295–305. [Google Scholar] [CrossRef] [PubMed]
  19. Bell, G.R.; Manning-Benson, S.; Bain, C.D. Effect of chain length on the structure of monolayers of alkyltrimethylammonium bromides (CnTABs) at the air-water interface. J. Phys. Chem. B 1998, 102, 218–222. [Google Scholar] [CrossRef]
  20. Fragneto, G.; Delhom, R.; Joly, L.; Scoppola, E. Neutrons and model membranes: Moving towards complexity. Curr. Opin. Colloid Interface Sci. 2018, 38, 108–121. [Google Scholar] [CrossRef]
  21. Skoda, M.W.A. Recent developments in the application of X-ray and neutron reflectivity to soft-matter systems. Curr. Opin. Colloid Interface Sci. 2019, 42, 41–54. [Google Scholar] [CrossRef] [Green Version]
  22. Campbell, R.A. Recent advances in resolving kinetic and dynamic processes at the air/water interface using specular neutron reflectometry. Curr. Opin. Colloid Interface Sci. 2018, 37, 49–60. [Google Scholar] [CrossRef] [Green Version]
  23. Ciumac, D.; Campbell, R.A.; Xu, H.; Clifton, L.A.; Hughes, A.V.; Webster, J.R.P.; Lu, J.R. Implications of Lipid Monolayer Charge Characteristics on their Selective Interactions with a Short Antimicrobial Peptide. Colloids Surf. B 2017, 150, 308–316. [Google Scholar] [CrossRef] [Green Version]
  24. Carrascosa Tejedor, J.; Santamaria, A.; Tummino, A.; Varga, I.; Efstratiou, M.; Lawrence, M.J.; Maestro, A.; Campbell, R.A. Polyelectrolyte/Surfactant Films: From 2D to 3D Structural Control. Chem. Commun. 2022, 58, 10687–10690. [Google Scholar] [CrossRef]
  25. Liu, X.; Counil, C.; Shi, D.; Mendoza-Ortega, E.E.; Vela-Gonzalez, A.V.; Maestro, A.; Campbell, R.A.; Krafft, M.P. First quantitative assessment of the adsorption of a fluorocarbon gas on phospholipid monolayers at the air/water interface. J. Colloid Interface Sci. 2021, 593, 1–10. [Google Scholar] [CrossRef]
  26. Petek, A.; Krajnc, M.; Petek, A. Study of host–guest interaction between ß-cyclodextrin and alkyltrimethylammonium bromides in water. J. Incl. Phenom. Macrocycl. Chem. 2016, 86, 221–229. [Google Scholar] [CrossRef]
  27. Bahadur, J.; Ruppert, L.F.; Pipich, V.; Sakurovs, R.; Melnichenko, Y.B. Porosity of the Marcellus Shale: A contrast matching small-angle neutron scattering study. Int. J. Coal Geol. 2018, 188, 156–164. [Google Scholar] [CrossRef]
  28. Palm, R.; Härmas, R.; Härk, E.; Kent, B.; Kurig, H.; Koppel, M.; Russina, M.; Tallo, I.; Romann, T.; Mata, J.; et al. Study of the structural curvature in Mo2C derived carbons with contrast matched small-angle neutron scattering. Carbon 2021, 171, 695–703. [Google Scholar] [CrossRef]
  29. Nelson, A. Co-refinement of multiple-contrast neutron/X-ray reflectivity data using MOTOFIT. J. Appl. Crystallogr. 2006, 39, 273–276. [Google Scholar] [CrossRef]
  30. Parratt, L.G. Surface studies of solids by total reflection of X-rays. Phys. Rev. 1954, 95, 359–369. [Google Scholar] [CrossRef]
  31. Braslau, A.; Deutsch, M.; Pershan, P.S.; Weiss, A.H.; Als-Nielsen, J.; Bohr, J. Surface roughness of water measured by X-ray reflectivity. Phys. Rev. Lett. 1985, 54, 114–117. [Google Scholar] [CrossRef] [Green Version]
  32. Tikhonov, A.M.; Mitrinovic, D.M.; Li, M.; Huang, Z.; Schlossman, M.L. An X-ray reflectivity study of the water-docosane interface. J. Phys. Chem. B 2000, 104, 6336–6339. [Google Scholar] [CrossRef]
  33. Javadi, A.; Mucic, N.; Vollhardt, D.; Fainerman, V.B.; Miller, R. Effects of dodecanol on the adsorption kinetics of SDS at the water-hexane interface. J. Colloid Interface Sci. 2010, 351, 537–541. [Google Scholar] [CrossRef]
  34. Ferri, J.K.; Kotsmar, C.; Miller, R. From surfactant adsorption kinetics to asymmetric nanomembrane mechanics: Pendent drop experiments with subphase exchange. Adv. Colloid Interface Sci. 2010, 161, 29–47. [Google Scholar] [CrossRef]
  35. Azad, M.S. IFT Role on Oil Recovery During Surfactant Based EOR Methods. In Surfactants in Upstream E&P. Petroleum Engineering; Solling, T., Shahzad Kamal, M., Shakil Hussain, S.M., Eds.; Springer: Cham, Switzerland, 2021. [Google Scholar]
  36. Bashir, A.; Haddad, A.S.; Rafati, R. A review of fluid displacement mechanisms in surfactant-based chemical enhanced oil recovery processes: Analyses of key influencing factors. Pet. Sci. 2022, 19, 1211–1235. [Google Scholar] [CrossRef]
  37. Xu†, H.; Li, P.X.; Ma, K.; Thomas, R.K.; Penfold, J.; Lu, J.R. Limitations in the Application of the Gibbs Equation to Anionic Surfactants at the Air/Water Surface: Sodium Dodecylsulfate and Sodium Dodecylmonooxyethylenesulfate Above and Below the CMC. Langmuir 2013, 29, 9335–9351. [Google Scholar]
  38. Müller, P.; Bonthuis, D.J.; Miller, R.; Schneck, E. Ionic Surfactants at Air/Water and Oil/Water Interfaces: A Comparison Based on Molecular Dynamics Simulations. J. Phys. Chem. B 2021, 125, 406–415. [Google Scholar] [CrossRef] [PubMed]
Figure 1. Neutron reflectivity data and model fits of (A) 60 mM cm-C12TAB solution in ACMW before (green) and after (orange) exposure to d-hexane vapor and (B) 60 mM d-C12TAB solution in ACMW before (purple) and after (blue) exposure to cm-hexane vapor; a bare ACMW measurement (red) is shown in both panels, and a measurement of ACMW infused with d-hexane (to preclude depletion effects) after exposure to d-hexane (pink) is shown in panel A for reference. SLD profiles are shown as insets.
Colloids 06 00068 g001
Figure 2. Surface excesses of (A,C,E) surfactant and (B,C,F) hexane from neutron reflectivity measurements involving (A,B) C12TAB, (C,D) C14TAB, and (E,F) C16TAB at the concentrations stated in the legends: (i) the first 4 data points are prior to the exposure of the adsorbed layer to hexane, (ii) the following 4 data points are the last recorded measurements representing equilibration during the interaction, and (iii) the last 4 data points are following the venting of the hexane from the sample changer by removing the sealed lids.
Colloids 06 00068 g002
Figure 3. Change in surface excesses of the (A,C,E) surfactant and (B,D,F) hexane from neutron reflectivity measurements involving (A,B) C12TAB, (C,D) C14TAB, and (E,F) C16TAB. The surfactant values are the averages of the 4 last recorded measurements representing equilibration during the interaction minus the average of the last 4 data points following the venting of the hexane from the sample changer by removing the sealed lids. The hexane values are the average of the 4 last recorded measurements representing sample equilibration during the interaction, an approach to reduce experimental uncertainties through assuming full venting of the hexane. The dashed lines in panels B, D, and F represent the surface excess of hexane adsorbed at a bare water/air interface of 0.57 μmol/m2.
Colloids 06 00068 g003
Figure 4. Surface excess molar ratios of hexane:surfactant reached at equilibrium for the interactions of hexane vapor with adsorbed surfactant monolayers analyzed from neutron reflectivity measurements involving (A) C12TAB, (B) C14TAB, and (C) C16TAB. The dashed lines simply highlight a molar ratio of unity for reference.
Colloids 06 00068 g004
Figure 5. Surface excesses of (A) SDS and (B) hexane from neutron reflectivity measurements at the concentrations stated in the legends. Additional information about the nature of the data points in regions (i), (ii) and (iii) can be found in the caption to Figure 2. (C) Surface excess molar ratios of hexane:SDS reached at equilibrium for the interactions of hexane vapor with adsorbed surfactant monolayers analyzed from neutron reflectivity measurements. The dashed lines simply highlight a molar ratio of unity for reference. The arrow notes a value of the interfacial stoichiometry off the shown scale, as in this case, the measured surfactant surface excess was minimal. Change in surface excesses of the (D) SDS and (E) hexane from neutron reflectivity measurements. Additional information about how the data were averaged can be found in the caption to Figure 3. The dashed line in panels E represent the surface excess of hexane adsorbed at a bare water/air interface of 0.57 μmol/m2.
Colloids 06 00068 g005
Table 1. Scattering lengths of interfacial materials used in this work.
MaterialScattering Length,
fm
H2O−1.678
D2O19.145
Hexane−12.492
d14-hexane133.270
Sodium dodecyl sulfate15.926
d25-sodium dodecyl sulfate276.216
Dodecyltrimethylammonium bromide−11.335
d25-dodecyltrimethylammonium bromide248.955
Tetradecyltrimethylammonium bromide−13.006
d29-tetradecyltrimethylammonium bromide288.931
Hexadecyltrimethylammonium bromide−14.676
d33-hexadecyltrimethylammonium bromide328.907
Publisher’s Note: MDPI stays neutral with regard to jurisdictional claims in published maps and institutional affiliations.

