Article

Relevance of Colloid Inherent Salt Estimated by Surface Complexation Modeling of Surface Charge Densities for Different Silica Colloids

by
Alok Goel
1,*,† and
Johannes Lützenkirchen
2,*
1
Laboratory for Surface Science and Technology, Department of Materials, ETH Zürich, 8093 Zurich, Switzerland
2
Institute for Nuclear Waste Disposal (INE), Karlsruhe Institute of Technology (KIT), Hermann-von-Helmholtz-Platz 1, Eggenstein-Leopoldshafen, 76344 Karlsruhe, Germany
*
Authors to whom correspondence should be addressed.
Current Affiliation: Institute of Polymer Nanotechnology (INKA), FHNW University of Applied Sciences and Arts Northwestern Switzerland, 5210 Windisch, Switzerland.
Colloids Interfaces 2022, 6(2), 23; https://doi.org/10.3390/colloids6020023
Submission received: 9 February 2022 / Revised: 12 March 2022 / Accepted: 31 March 2022 / Published: 6 April 2022

Abstract

:
Potentiometric titrations have been routinely used to measure the proton-related surface charge density (SCD) of particles in solution. Here, we quantify the SCD of silica nanoparticles (NPs) that are commercially available as charge-stabilized colloids (by the addition of NaOH) in the presence of known amounts of added NaCl. The experimental results are simulated by surface complexation models (SCMs) of the electrical double layer (EDL). The modeling results suggest that involving only the added NaCl electrolyte yields poor agreement between the experiment and the best achievable fit. An increase in the Na concentration accounting for the colloid inherent salt (CIS) associated with these charge-stabilized colloids results in much better simulations. In the available literature, this CIS has often been disregarded. However, in the modeling, the total concentration of Na must be known for a consistent mole balance and derivation of reliable ion-pair binding constants. If the CIS is not accounted for or the original suspensions are not dialyzed, the presence of CIS renders the study of those colloids difficult, particularly when investigating specific ion effects, since the CIS always interferes. In the present work, we show that the SCM-estimated amount of CIS from varying the total salt and solid concentration agrees surprisingly well with the manufacturer specification.

Graphical Abstract

1. Introduction

Oxide minerals are among the most frequently studied substrates with respect to the adsorption of pollutants from aqueous solution [1,2,3]. The study of the adsorption reactions has reached a level where surface complexes can be identified at the molecular scale and where thermodynamic models introduce the respective mechanistic level for the surface structure and the surface complexes, [4] with wide variations in the background salt concentration [5] for these kinds of models. This has recently been extended to adsorption from saturated salt solutions [6,7].
At the surface of the oxide minerals, surface hydroxyls may undergo protonation and deprotonation reactions. These cause a fundamental charge that gives rise to the formation of the electrical double layer (EDL). Within the EDL, part of the fundamental charge is screened within the Stern layer by ions from the background electrolyte. The background electrolyte is added in many experiments to keep the salt level at a constant level while varying other parameters. The net charge that remains due to the incomplete neutralization of the fundamental charge within the Stern layer is compensated by the diffuse part of the EDL.
The background electrolyte ions are typically chosen in such a way that they are expected to form relatively weak (outer-sphere) surface complexes. The bonding mechanism of, for example, sodium on negatively charged hydroxyl groups, however, is not ultimately clear. The classical treatment in terms of outer-sphere-surface complexes [5] has been challenged by simulation studies, which sometimes report inner-sphere-surface complexes instead [8].
The SCM relevant chemical reactions occur in the bulk of the solution (aqueous speciation) and within the Stern layer (surface complexation). The bulk solution involves the speciation of a given pollutant (such as a metal cation), where dissolved, non-adsorbing ligands would, for example, compete for the metal cation with the surface functional groups (surface ligands) [9]. The equilibria in the solution and at the surface can be treated with the same formalism if interfacial electrostatics are taken into account for the surface equilibria [10,11]. The treatment requires knowledge of the total concentrations of all relevant chemical components (i.e., the entities from which all species can be formed) or free species concentrations/activities. Knowledge of free concentrations (as in the case of the free proton concentration through pH measurements), in some cases, makes the correct balance for a component obsolete or allows us to calculate the total concentration of such a component from the speciation scheme. Within the framework of SCMs, a model for the interface is required in terms of the nature and amount of the relevant surface sites and the interfacial electrostatics. Currently, many different model combinations exist, the upper level being CD-MUSIC (Charge-Distribution MUlti-SIte-Complexation) models, often coupled with a Gouy-Chapman-Stern (GCS) picture of the electrical double layer [4,12,13,14].
Owing to its geological relevance, or use in semiconductor industry or biomedical applications, silica has been the focus of scientific and technological research for a long time [15]. Particularly, the silica-water interface has received considerable attention, [16,17,18] as the interfacial structure and chemistry directly influence phenomena such as ion adsorption, [19] cellular uptake, [20] and particle mobility [21]. The proton-related surface charge density (SCD) of oxide particles (such as silica) is a key parameter governing the interfacial chemistry and, by extension, all the aforementioned phenomena. The fundamental charging of oxidic particles arises from the protonation and deprotonation of surface functional hydroxyl groups. These surface chemical reactions generate the SCD, which is often simply called the charge density, but must be distinguished from the net surface charge density. The latter accounts for the partial neutralization of SCD due to the formation of surface complexes (outer-sphere or inner-sphere, also referred to as ion-pairs) between charged surface groups and oppositely charged ions from the ‘added’ background electrolyte. The cloud of mobile ions in the diffuse layer compensates this net surface charge, whereas SCD is compensated by the ion-pairs and the diffuse layer charge. In SCMs, ion-specific effects are related to the inner (immobile) layer and are taken into account via different affinities of different ions towards charged groups. This can be achieved in various ways:
  • Change the location of a given ion by using an electrolyte-specific value for the inner layer capacitance(s);
  • Use a unique set of inner layer capacitance(s) involving charge distribution. This places more or less charge of the ion-pair in the inner or outer planes of the simplified interface model.
Ion-specific capacitance values will not allow us to simulate mixtures of electrolytes. Fortunately, in many cases it is possible to simulate data for different background electrolytes with common capacitance(s) and placing them as point charges in one plane (i.e., without the use of charge distribution) while handling ion specificity uniquely via formation constants.
The two model options above will also imply affinity constants specific for each ion, but the comparison of the resulting affinity binding constants becomes blurred. Unfortunately, most of the thinkable model options will allow us to describe a given experimental data set, since the models remain over-parameterized, although they oversimplify in the assumptions (e.g., flat surface planes, idealizing planes of adsorption, etc.).
The use of a constant value for the Stern layer capacitance as another example of simplification is questioned by the results of Brown et al. [22], which suggest that the inner layer capacitance of silica varies with the salt content (of NaCl). One might, in general, argue that capacitance values are probably even affected by the variation in the interfacial electrostatic field (i.e., with surface potential and surface charge) because the electric field strength is expected to vary with the pH and salt concentration. The latter two experimental variables are known to affect the interfacial water structure [23,24,25].
Experimental values for the net surface charge not only inform about the stability of a given colloid but, in combination with knowledge about the fundamental charge, include indirect information about ion pair formation (i.e., ionic species that can be accommodated at oppositely charged surface groups). The fundamental charge and the resulting net charge directly influence the mobility of particles in environmental settings [26].
In aqueous solution, the water-silica interface is charged in the classical picture due to the spontaneous protonation/deprotonation of terminal silanol groups [27]. The isoelectric point (IEP) of amorphous silica is usually cited to be in the range of 2–4 [28]. In the usual pH range, silica has a net negative charge. This has been interpreted via ionization of the surface functional groups, which tunes the surface charge, for example, by changing the pH, as in the following reaction.
Si OH +   OH   Si O +   H 2 O
Adding hydroxide to an SiO 2 suspension will therefore cause an increase in the negative fundamental charge. As discussed above, the IEP of SiO 2 is at a low pH, and since we mostly (if not exclusively) work above the IEP, the SiO 2 NPs always exhibit negative SCD [29]. The degree of ionization in general, besides pH, depends on the electrolyte nature [30] and electrolyte concentration [31]. The ionization that generates a strong electric field, which, in turn, regulates many physical and chemical properties of oxide interfaces, can be studied by potentiometric acid-base titrations. The results of such experiments are well understood, since these titrations have been used to study the SCD of different kinds of SiO 2 and many other types of particles [30,31,32,33,34]. In this paper, we use potentiometric titrations to quantify the SCD of different sub-10 nm SiO 2 NPs in various concentrations of NaCl as the background electrolyte. During the analysis, it turned out that an appropriate model description required including the amount of salt present in these SiO 2 suspensions, as prepared by the manufacturer, which is the colloid inherent salt (CIS).
The particles we study here are typically sold as suspensions of a relatively high pH (around 10) and include a given amount of sodium (in the present cases). The sodium is introduced when the suspension is put to a high negative charge by adding sodium hydroxide according to Equation (1). The resulting negative charge keeps the NPs from aggregating, and a stable dispersion is obtained even for the very high solid concentrations of these commercial products. It may seem trivial that, in the respective studies, the presence of CIS should be considered. Even very old literature contains experimental work where the residual salt was removed. Bolt [31], for example, performed a double de-ionization of the Ludox sol he used and finally obtained a sol with pH 4.5 (i.e., he removed the CIS and accordingly decreased the initially high pH). On the other hand, in many other studies involving the use of such Ludox sols in the recent literature, such precautions have not been taken [35,36,37]. While the presence of the CIS may appear irrelevant in many cases, in other circumstances, the lack of control of total sodium will ultimately lead to ambiguities. For example, in a gelation study, aliquots of such (as received) suspensions were added to NaCl solutions to yield a constant concentration of added salt and variable solid contents [38]. This obviously requires the addition of different amounts of silica stock suspension and, consequently, different amounts of CIS will ultimately be present in the finally studied samples. More specifically, the sodium concentrations in these samples are not identical, as intended, but the results of the experiments are interpreted as if they were. In other examples dealing with ion specificity, the properties of such charge-stabilized silica NPs were studied in solutions of NaCl, LiCl, CsCl, etc. [39,40]. Depending on the solid content used, more or less sodium will be present in the studied samples, but the results are interpreted as if CIS-related sodium were absent. As a final example, the technique used in the present work may be discussed. Comparison of titration data between data obtained with or without the removal of CIS will be ambiguous on the basis of added NaCl salt.
The choice of sodium for the charge stabilization of Ludox (and other silica) sols indicates a specific type of interaction. Recent MD simulations suggest that sodium ions can be more strongly bound to the amorphous silica surface than calcium ions [41]. The results of these simulations also point to a very specific binding. To what extent this may, for example, inhibit dissolution and growth is an important issue that is not typically addressed. However, it has been shown that very small particles can be charge-stabilized against the growth of bigger particles, in the case of magnetite [42].
In the present work, we have attempted to understand if experimental charging data can reveal the effect of CIS in modeling calculations, and specifically to what extent the thermodynamic models are susceptible to the correct sodium concentration.
Surface complexation modeling was carried out to fit our titration (SCD) data using the GCS model and, in this process, the total salt background (i.e., the amount of sodium introduced in the system, which increases the sodium concentration above the amount arising from the nominal added NaCl background electrolyte) was estimated. The surface complexation approach requires total concentrations for the components for which a mole balance is carried out in the calculations. Such a mole balance is also performed for sodium in such SiO 2 suspensions containing NaCl. Erroneous values for the total sodium concentration results in erroneous model parameters. For example, fitting the binding constant of sodium is directly influenced by the total concentration of sodium. Usually, it is assumed that the total concentration is known. However, if the stock suspension contains sodium due to the preparation (i.e., the CIS), and if this is neglected in calculations, the outcome is questionable. Interestingly, in our calculations, it consistently turned out that neglecting the CIS failed to produce good fits to the data. This would support the model concept. To further constrain the conclusions, the solid concentrations of silica in the titrations were varied. This changes the ratio between added NaCl and CIS. Parameter optimization using the titration data was carried out for different fixed CIS estimates to obtain an optimum fit. As pointed out, we can also change the solid concentration for a given product (i.e., dilution of the SiO 2 content will decrease the value of CIS) and the total electrolyte concentration. This variation in the contribution of the CIS content to the total Na for a given solid concentration should result in a common CIS optimum when back-calculated to the stock suspension if the approach is valid. The procedure can, moreover, be carried out for various colloids with different CIS. All of these tests were found to yield self-consistent results for different SiO 2 suspensions over a range of added NaCl. The importance of including CIS into considerations became most obvious when the standard silica model was unable to simulate data when the CIS contribution was neglected. In some cases found in the literature [31,43], SiO 2 suspensions containing CIS Na + have indeed been dialyzed to remove CIS Na + and start with clean SiO 2 . We emphasize again that, if this is not carried out and, for example, the effect of LiCl to CsCl on certain properties of undialyzed CIS containing SiO 2 is studied, the results are obtained with mixtures of the added cation and the already present sodium. Here, the sodium contribution depends on the silica concentrations. In order to understand the actions of the target cations, the impact of CIS must be accounted for. This does not seem to have been the case in many studies (see above) [35,36,37,38,39,40,44]. The present study shows, for surface titrations, the importance of including the CIS in the modeling and comparison of experimental data.
While we specifically study silica samples here, we would like to add that complications related to the CIS in silica samples will also occur in the case of clays [45] or soil samples [46] that, when taken from their natural environment, will contain adsorbed ions. Potentiometric titrations and their interpretations in such cases will not necessarily take into account the role that such ions may play. With clays, the problem is often addressed by transforming the natural clay into its sodium form, for example. To what extent the bound sodium that may interfere later in subsequent experiments is possibly not so often addressed.

2. Materials and Methods

2.1. Chemicals

Sodium chloride (NaCl, ≥99.8%, ACS Reagent, Sigma-Aldrich, Buchs, Switzerland), NaOH (BioUltra, for molecular biology, 10 M in H2O, Sigma Aldrich, Buchs, Switzerland), and HCl (0.1 N, Acros Organics, Geel, Belgium) were used as received. The different commercial SiO 2 samples utilized were Ludox SM (Sigma-Aldrich, Buchs, Switzerland), Klebosol 300 (Merck, Buchs, Switzerland) and Bindzil 360 (AkzoNobel, Amsterdam, The Netherlands). All the suspensions are sold as ~30 wt.% SiO 2 and their natural pH ranges from 9.5 to 11. Milli-Q water was used throughout the experiments to prepare suspensions and solutions.

2.2. Potentiometric Titration

Potentiometric titrations were carried out at room temperature with an automated Mettler-Toledo G-20 Compact Titrator. Polypropylene beakers of 100 mL were used under continuous purge from wet (home built bubbler filled with Milli-Q water) ultrapure N2 (Stickstoff 5.0, PanGas 99.999% pure) to avoid adverse effects of CO2. The electrode was calibrated with 4 buffers (2.00, 4.01, 7.00, and 10.00, technical buffer solutions, Mettler-Toledo, Greifensee, Switzerland) before each experiment. Prior to use, the colloid suspension was sonicated. All SiO 2 stock suspensions were filtered once before diluting them. The basic methodology of potentiometry involved titrating a given SiO 2 sample ( SiO 2 with NaCl) and a blank (only NaCl) with the same acid (in this case HCl). The added titrant volume was 0.2 mL per step for the sample and 0.005 mL per step for the blank. The stir rate (mechanical stir rod) was maintained at 700 rpm. A volume of 25 mL of either sample or blank were titrated from pH 10 to pH = 3 to obtain SCD for one SiO 2 concentration with one concentration of added NaCl. The lower pH is taken as the PZC of amorphous SiO 2 , and used for obtaining absolute SCD. The value of PZC = 3 was reported by Milonjic [33], whereas both Bolt [31] and Sonnefeld [34] reported approx. ~3.5. As pointed out above, the precise value cannot be determined, but changing PZC on the charging plateau does not cause significant changes in absolute SCD. Experiments were performed in triplicates for consistency.

2.3. Calculation of Surface Charge Density (SCD)

The raw titration curves show the amount of titrant consumed by the sample and the blank to reach a certain pH from a given initial pH (ΔpH). The amount of H+ ions that produces a specific ΔpH in the sample was diminished by the amount required to produce the same ΔpH in the blanks. The corresponding difference in the volume of titrant constitutes the amounts of protons adsorbed by the surface at a given pH value and directly translates to the SCD of the colloid based on an appropriate reference value (here, for zero SCD at low pH, as discussed above).
The following equation is suitable for calculating SCD   ( σ 0 , H ) , as reported in the literature [30,34].
σ 0 , H = F   ( Γ H +   Γ OH )
Here F   is the Faraday constant (C/mol) and   Γ H +   Γ O H represents the net uptake of H + ions or the release of OH ions (mol/m2). Here, we have adopted the use of Equation (3), according to which, surface charge density ( σ 0 , H ) at a given pH is defined as [47]
σ 0 , H = F   C HCl   v sample   v blank s . γ . V
where C H C l   is the concentration of HCl titrant (mol/L), v sample is the volume of titrant consumed by the sample to reach a given pH (L), v blank is the volume of titrant consumed by the blank at that same pH (L), s   is the specific surface area of the solid (m2/g), V is the total volume of the liquid medium (L) at a given pH and   γ is the mass concentration of the solid (mass of the solid divided by the volume of liquid, g/L).

2.4. Surface Complexation Modeling

SCMs, also sometimes called site-binding models, have been conventionally employed to model titration and, less frequently, electrokinetic data, for many mineral surfaces. Since they involve mass law equations and equilibrium constants, SCMs can be viewed as an extension of solution chemistry models to solid/water interface chemistry. The formalism allows for the calculation of a model-inherent surface speciation, i.e., the distribution of the interfacial species as a function of pH and salt content. As part of an SCM, basic chemical reactions visualize, in a formalized way, the interactions of metal ions, ligands, or protons with surface sites, which are also sometimes called surface ligands. These interactions affect the surface charge via the ionization of the surface hydroxyl groups. The various SCMs that are available differ in the formalization of the basic surface chemical equations, the handling of surface heterogeneity, and the treatment of the electrical double layer (EDL), resulting in a wide range of options. The EDL options include the purely diffuse layer model (DLM) [48], the constant capacitance model (CCM) [49], and the Gouy-Chapman-Stern model (GCS, also basic Stern model), [50] as well as triple layer and three plane models (TLM or TPL) [4,13,51], and even more complex approaches, such as multi-layer models that allow for charge distribution (CD-MUSIC) [13]. The amount of possible model combinations causes significant difficulties when it comes to choosing the most appropriate one. In addition, concerning the terms, surfaces that are treated by the SCM formalism are being referred to as charge-regulated surfaces, although the term of charge regulation had been established for interacting surfaces.
For data treatment, a modified version of the program FITEQL [52], in combination with uCODE, was used. The latter is a general parameter optimization routine that can be coupled to a simulation tool. In the present case, FITEQL was used as the simulation code. Here, we simulated the titration data for a given set of model parameters based on a particular EDL/SCM combination. Best fit was obtained by involving uCODE to optimize model-inherent values for adjustable parameters, such as capacitance, intrinsic pKa, and an intrinsic electrolyte-binding constant, whereas the site density of the silanols can fortunately be fixed at a widely accepted value (4.75 sites/nm2) [53]. The activity coefficients of solute species need to be included and were calculated based on the Davies equation. Fits were performed on curves of SCD vs. log ([H+]/M) for the range of salt levels (either using added NaCl only or using added NaCl plus an assumed value for residual Na). Values of log ([H+]/M) are calculated from the measured pH values and the appropriate activity coefficients. To constrain parameters to a maximum, capacitance was fixed at electrolyte-concentration-specific values reported for Ludox SM particles by Brown et al. [22]. Although not necessarily covering the potential changes with pH (as discussed in the introduction), we believe that the use of these values is currently an elegant way to constrain the inner-layer capacitance, given also that Ludox SM is part of the present study. Furthermore, this eliminates an adjustable parameter. Finally, the electrolyte association constant for the equation
Si O +   Na +   Si O Na + ,   K ass
was fixed to log K(ass) = 0.3 for the results presented here. This leaves the pKa value for the surface silanol as the only adjustable parameter. Initial variation in the association constant showed that, with the above value, the best fit was obtained

3. Results and Discussions

The surface charge densities for 5 wt.% Bindzil 360, as determined from the results of potentiometric titrations between pH 3 and 10 in 2 mM, 10 mM and 100 mM added NaCl, are shown in Figure 1.
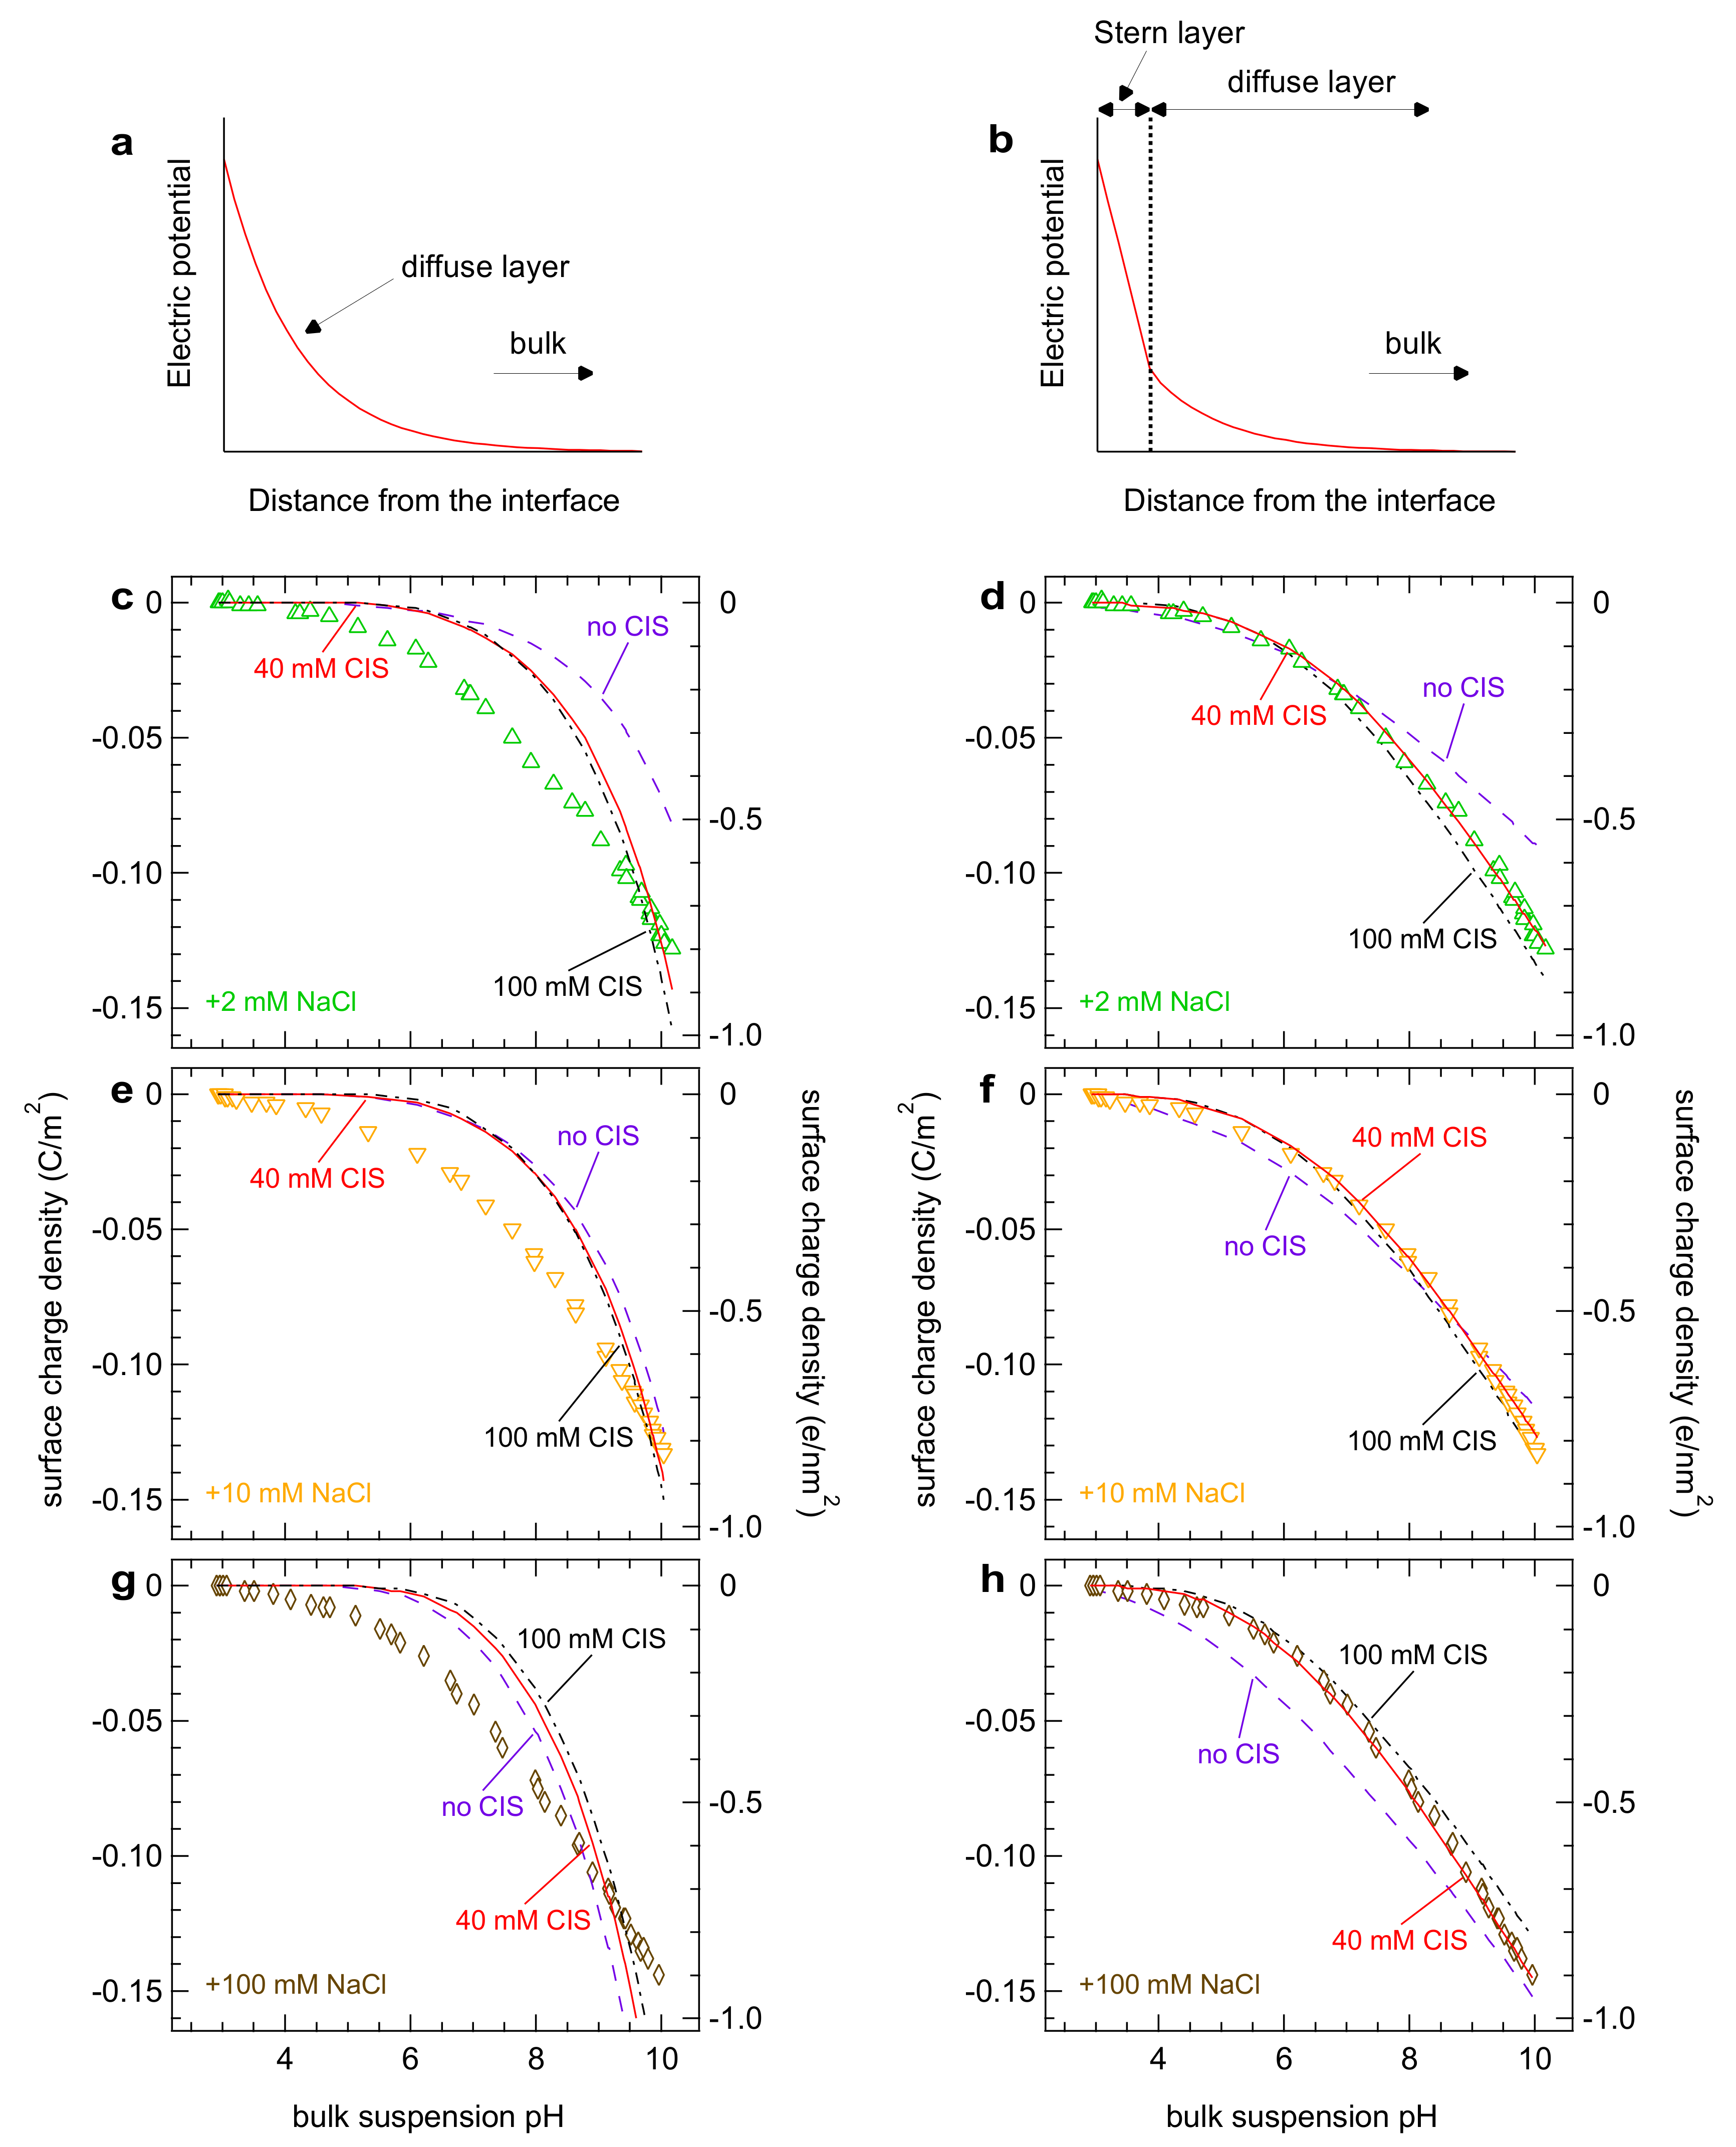
Due to the CIS, the actual amount of sodium contained in the suspensions is higher than the NaCl concentrations indicated. We estimate the CIS by changing the amount of background salt during parameter optimization to obtain best fits to the titration data. Within the SCMs, DLM (Figure 2a) and GCS (Figure 2b) variants were tested. Figure 2c–h show the fits to the experimental data where we progressively varied the assumed CIS contribution from 0 to 100 mM.
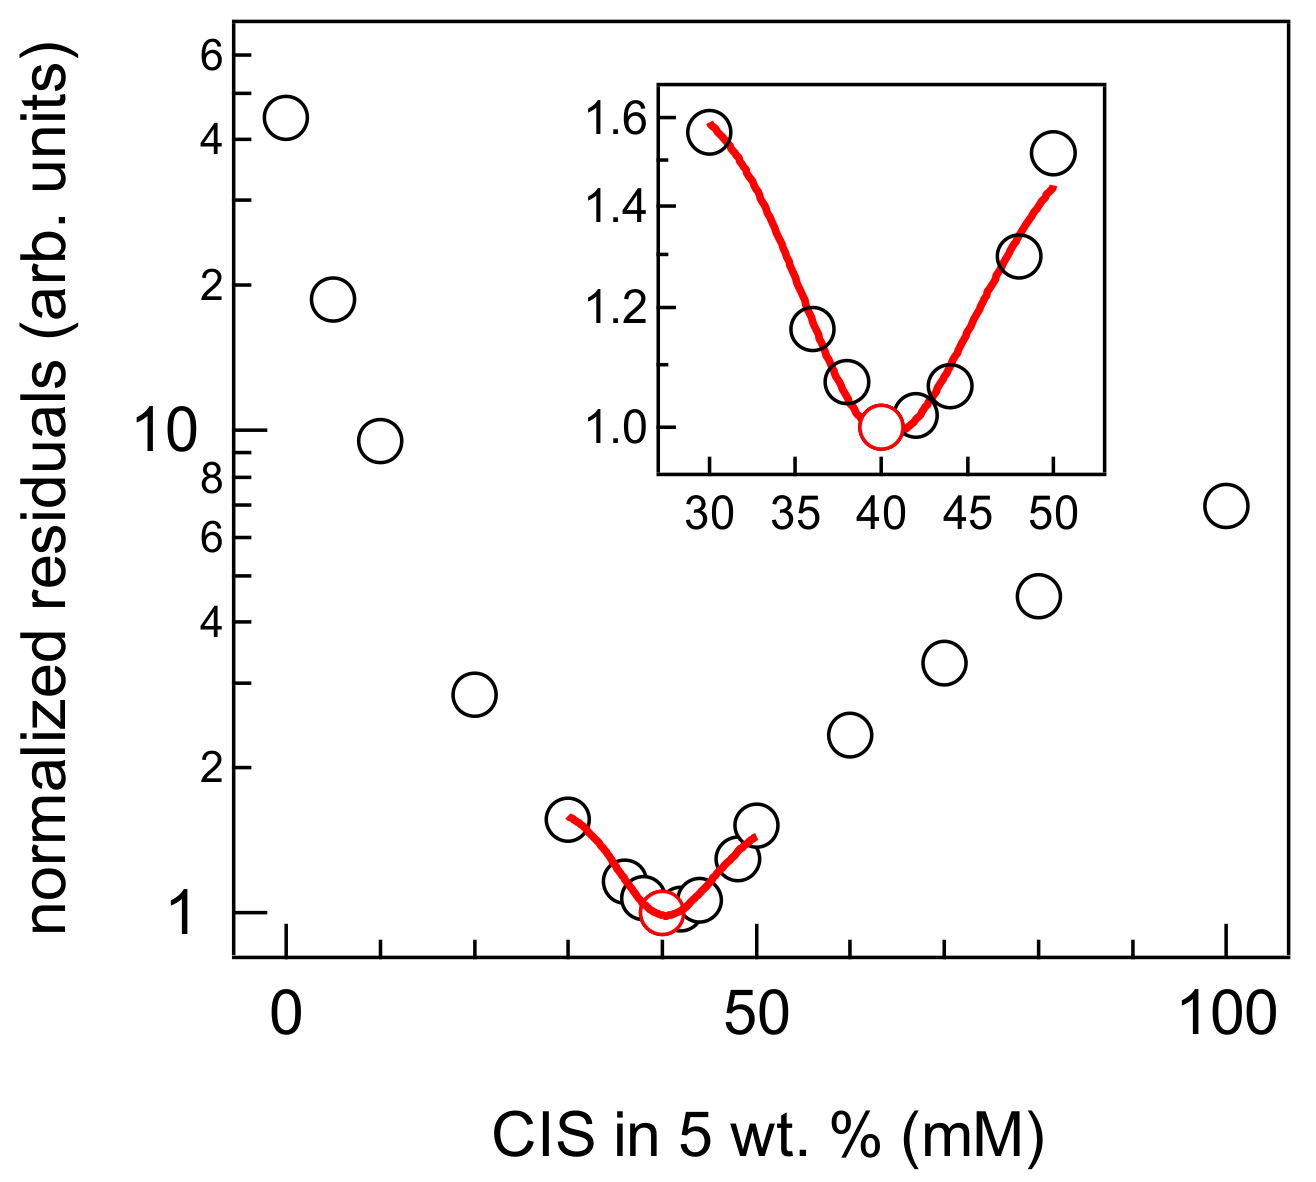
The simulations clearly show the failure of the DLM to interpret the titration data and ultimately the electrical double layer. The GCS model is a better representation of the EDL and acknowledges the presence of an interfacial capacitor in addition to the diffuse layer. The GCS model can reproduce the experimental data much more successfully than the DLM. Therefore, in the following, we no further consider the DLM but adopt the GCS as the only model. While varying the CIS contribution, we compare the residuals (errors) between the experimental data and the simulation results for the SCD. The best fit (lowest sum of residuals) is taken as an estimate of CIS present in the respective suspension (Figure 3). The normalized residuals exhibit a surprisingly sharp minimum at around 40 mM for Bindzil 360.5 wt.% (shown as one example in Figure 3).
To obtain a refinement, the minimum region (in Figure 3 from 30 mM to 50 mM) is fitted with an asymmetric Gaussian. The derivative of the fitted function equated to 0 yields the co-ordinates that correspond to the minimum for this function. We take this (i.e., 40 mM) as the final value for the CIS content for 5 wt.% Bindzil 360. The total CIS in the Bindzil 360 stock suspension (~30 wt.% SiO 2 ) is estimated to be 242 mM ± 3 mM. The total site concentration in such a suspension amounts to about 0.9 M (for about 360 m2/g), meaning that enough sodium is present to allow for a maximum of less than a quarter of the sites to be deprotonated. The important outcome is that, since SCD depends on the concentration of salt in the suspension, the CIS present in the stock must obviously be accounted for. In order to check the consistency of our approach, CIS estimation was also carried out for 1 wt.% Bindzil 360 and 10 wt.% Bindzil 360 at three different salt levels. Here, too, it was found that the fits became acceptable only when the appropriate amount of CIS was considered in the SCM (see Figure S1, Supplementary Information). Moreover, the back-calculated CIS for the original product for the three different experimental series agreed very well.
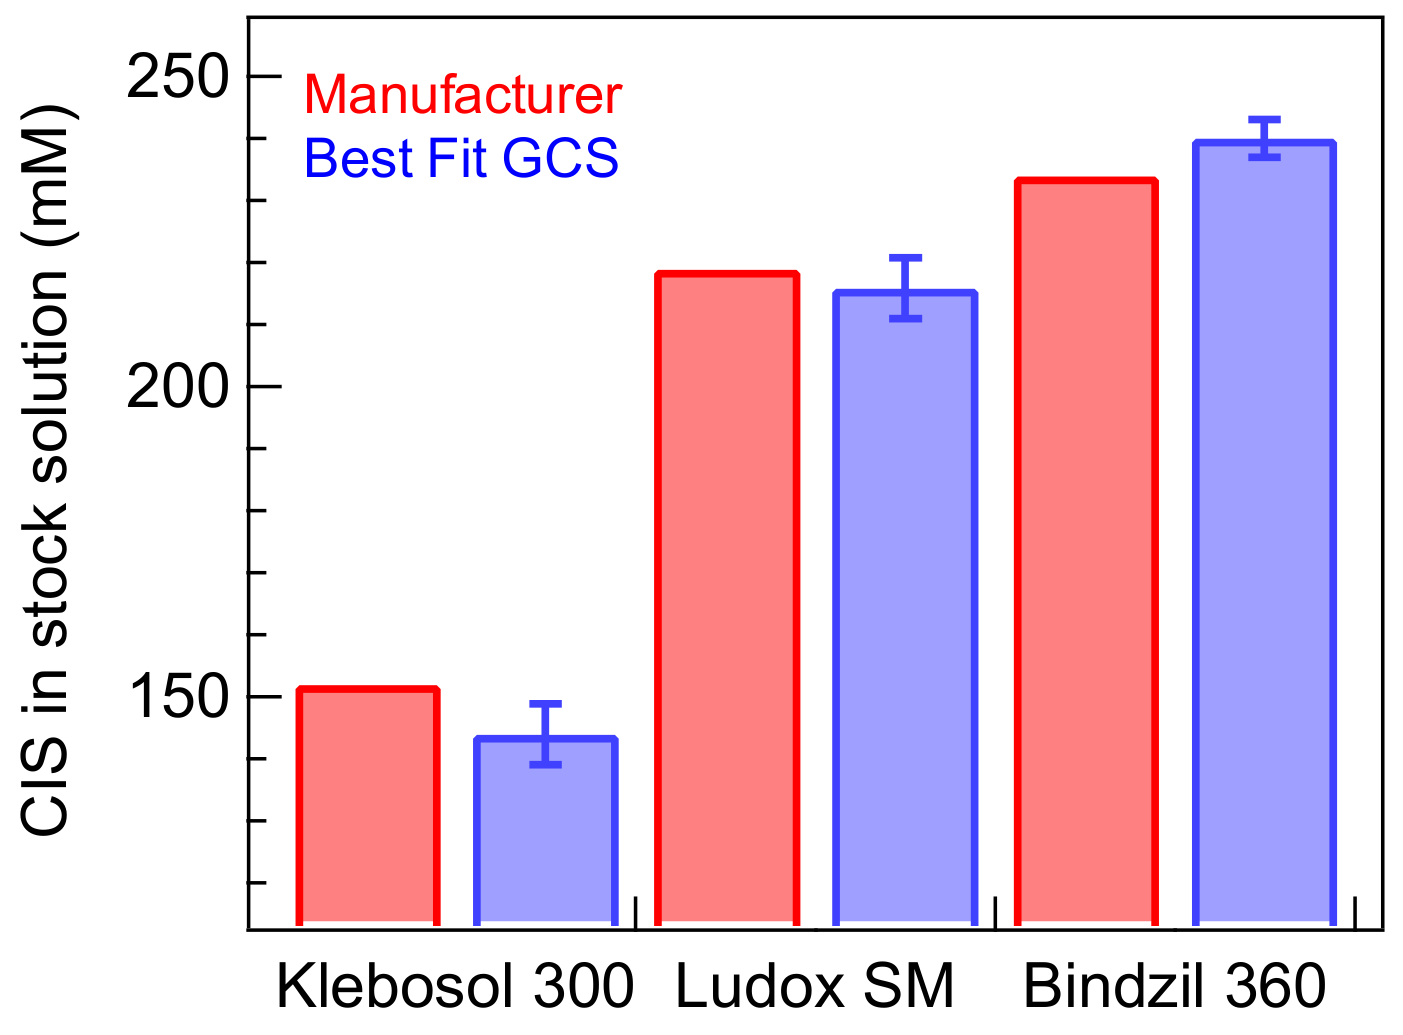
Our findings for Bindzil 360 encouraged us to check the consistency of our CIS estimation for other commercial SiO 2 suspensions. Potentiometric titrations followed by GCS modeling estimate stock CIS values of 144 mM ± 5 mM and 216 mM ± 5 mM for Klebosol 300 (Merck) and Ludox SM (Sigma-Aldrich), respectively. Detailed analysis for each of these colloids can be found in the Supplementary Information (SI). Manufacturer-specified CIS values in stock solutions for Klebosol 300, Ludox SM and Bindzil 360 are 152 mM, 219 mM, and 234 mM, respectively. The amount of CIS estimated using our approach is compared to the values specified by the respective manufacturers in Figure 4.
The close agreement of our estimated CIS values with the values provided by the respective manufacturers suggests that the estimation of the CIS in SiO 2 suspensions in a consistent manner is possible using an appropriate SCM approach. The parameters for the best fit models are summarized in SI (see Table S1 for a series of simulations as a function of assumed CIS and Table S2 for the set of parameters obtained for the different silicas at the optimum CIS). Such estimates yield, at the same time, a model for the original suspension, which can be used to (re-)interpret data obtained on such undialyzed systems with CIS.

4. Conclusions

Using potentiometric titrations, we have determined the SCD for colloidal silica for a range of added NaCl. Surface complexation modeling has been carried out to fit the titration data using the diffuse layer and the Gouy-Chapman-Stern models of the EDL. Simulations using the DLM do not agree with the experimental data for any reasonable values of model parameters (i.e., pKa). This is because the DLM disregards the presence of a double layer capacitor. On the other hand, the GCS model appears to reproduce the experimental data, albeit under some additional considerations. Thus, the fits become acceptable only when the colloid-inherent sodium/salt is acknowledged in the model calculations (i.e., total Na + is the sum of colloid-inherent Na + and added NaCl). The CIS is the salt associated with the charge-stabilized colloid, and is thus present in many commercial products, such as those obtained from the manufacturer. We measured the SCD by potentiometric titrations, utilized surface complexation modeling to estimate the CIS for different SiO 2 NPs, and found surprisingly good agreement with the values provided by the different manufacturers. This shows the robustness of our modeling approach and is also a significant finding that might serve as a prerequisite for experiments when specific ion effects are studied with commercially available charge-stabilized silica colloids.
Overall, the outcome of this study is important from various point of views:
  • The models appear to be sufficiently robust so that errors in the total concentration of a relevant chemical component (here Na) can be traced. This would mean that, if such models fail, an error in a mole balance may be the origin (among other possibilities);
  • The study of ion-specific effects will be affected by the presence of residual salt (CIS) because there is interaction with ions (here, sodium) that are not necessarily considered;
  • The relevance of CIS crucially depends on the conditions (such as the added salt amount and sol concentration);
  • For the models, disregarding the residual salt in titrations and adsorption experiments will lead to inaccurate model parameters.
Our literature survey shows that, in far too many articles, the residual salt in commercially obtained colloids is simply not considered, and it is not clear to what extent this may have affected the respective experimental results and their interpretation. One way to highlight the consequences of CIS in charging data could be to compare titration between silica samples that do not contain CIS and data for CIS-containing samples using the same amount of added background electrolytes of the same kind. A more involved approach would be a comparison between data that involve additions of salts that are different from the CIS. Evidently, ignoring the CIS is non-trivial and our findings reiterate the importance of acknowledging the CIS while carrying out, for example, surface complexation modeling for charge-stabilized colloids.

Supplementary Materials

The following supporting information can be downloaded at: https://www.mdpi.com/article/10.3390/colloids6020023/s1, Table S1: Normalized residuals and pKa results from surface complexation modeling of potentiometric titration-based surface charge density of 5 wt. % Bindzil 360 colloidal silica in different concentrations of CIS. For these simulations, the Stern layer capaci-tance and the logarithm of the electrolyte binding constant were fixed at 0.42 F m−2 and 0.3 respectively; Table S2: Predicted pKa results from surface complexation modeling of potentiometric titration-based surface charge density of different 5 wt. % silicas with optimum concentrations of CIS. For these simulations, Stern layer capacitance and the logarithm of the electrolyte binding constant were fixed at 0.42 F m−2 and 0.3, respectively. Figure S1: (a,c,e) SCD for 1 wt. % and (b,d,f) 10 wt. % Bindzil 360 in different amounts of added salt. SCM fits with varying background compared to the SCD in (a,b), 2 mM NaCl (c,d) 10 mM NaCl and (e,f) 100 mM NaCl. For all these simulations the logarithm of the electrolyte binding constant was fixed at 0.3. The Stern layer capacitances for 1 wt. % samples (i.e., a, c, e) and 10 wt. % samples (i.e., b, d, f) were fixed at 0.42 F m−2 and was 0.51 F m−2, respectively. Figure S2: (a) SCD for 5 wt. % Klebosol 300 in different amounts of added salt. SCM fits with varying background compared to the SCD in (b) 2 mM NaCl (c) 100 mM NaCl. (d) Goodness of fit (residuals) as a function of different amounts of CIS (mM). For these simulations, the Stern layer capacitance and the logarithm of the electrolyte binding constant were fixed at 0.42 F m−2 and 0.3, respectively. Figure S3: (a) SCD for 5 wt. % Ludox SM in different amounts of added salt. SCM fits with varying background compared to the SCD in (b) 2 mM NaCl (c) 100 mM NaCl. (d) Goodness of fit (residuals) as a function of different amounts of CIS (mM). For these simulations, the Stern layer capacitance and the logarithm of the electrolyte binding constant were fixed at 0.42 F m−2 and 0.3, respectively.

Author Contributions

Conceptualization, A.G. and J.L.; data curation, A.G.; formal analysis, A.G.; methodology, J.L.; supervision, J.L.; writing—original draft, A.G.; writing—review and editing, A.G. and J.L. All authors have read and agreed to the published version of the manuscript.

Funding

This research was funded by the Swiss National Science Foundation, grant number 153578.

Institutional Review Board Statement

Not applicable.

Informed Consent Statement

Not applicable.

Data Availability Statement

Not applicable.

Acknowledgments

A.G. would like to thank Nicholas D. Spencer (ETH Zurich) for his unwavering support and guidance. The authors would also like to acknowledge Matthew Brown for his valuable inputs at the beginning of the project.

Conflicts of Interest

The authors declare no conflict of interest.

References

  1. Jenne, E.A. Trace Element Sorption by Sediments and Soils: Sites and Processes. In Molybdenum in the Environment; Chappel, W.R., Petersen, K.K., Eds.; Marcel-Dekker: New York, NY, USA, 1977; Volume 2, pp. 425–553. [Google Scholar]
  2. Stumm, W.; Morgan, J.J. Aquatic Chemistry: An Introduction Emphasizing Chemical Equilibria in Natural Waters; Wiley: New York, NY, USA, 1981. [Google Scholar]
  3. Schindler, P.W.; Sposito, G. Surface complexation at (Hydr)oxide surfaces. In Interactions at the Soil Colloid—Soil Solution Interface; Bolt, G.H., De Boodt, M.F., Hayes, M.H.B., McBride, M.B., De Strooper, E.B.A., Eds.; Springer: Dordrecht, The Netherlands, 1991; Volume 190, pp. 115–145. [Google Scholar]
  4. Hiemstra, T.; Van Riemsdijk, W.H. On the relationship between charge distribution, surface hydration, and the structure of the interface of metal hydroxides. J. Colloid Interface Sci. 2006, 301, 1–18. [Google Scholar] [CrossRef] [PubMed]
  5. Hayes, K.F.; Leckie, J.O. Modeling ionic strength effects on cation adsorption at hydrous oxide/solution interfaces. J. Colloid Interface Sci. 1987, 115, 564–572. [Google Scholar] [CrossRef]
  6. Garcia, D.; Lützenkirchen, J.; Petrov, V.; Siebentritt, M.; Schild, D.; Lefèvre, G.; Rabung, T.; Altmaier, M.; Kalmykov, S.; Duro, L.; et al. Sorption of Eu(III) on quartz at high salt concentrations. Colloids Surf. A Physicochem. Eng. Asp. 2019, 578, 123610. [Google Scholar] [CrossRef] [Green Version]
  7. Morelová, N.; Finck, N.; Lützenkirchen, J.; Schild, D.; Dardenne, K.; Geckeis, H. Sorption of americium/europium onto magnetite under saline conditions: Batch experiments, surface complexation modelling and X-ray absorption spectroscopy study. J. Colloid Interface Sci. 2020, 561, 708–718. [Google Scholar] [CrossRef]
  8. Předota, M.; Machesky, M.L.; Wesolowski, D.J.; Cummings, P.T. Electric double layer at the rutile (110) surface. 4. Effect of temperature and pH on the adsorption and dynamics of ions. J. Phys. Chem. C 2013, 117, 22852–22866. [Google Scholar] [CrossRef]
  9. Schindler, P.W. A solution chemists view of surface chemistry. Pure Appl. Chem. 1991, 63, 1697–1704. [Google Scholar] [CrossRef]
  10. Westall, J.C. Mineql: A Computer Program for the Calculation of Chemical Equilibrium Composition of Aqueous Systems; Massachusetts Institute of Technology, Water Quality Laboratory: Cambridge, MA, USA, 1976. [Google Scholar]
  11. Westall, J.; Hohl, H. A comparison of electrostatic models for the oxide/solution interface. Adv. Colloid Interface Sci. 1980, 12, 265–294. [Google Scholar] [CrossRef]
  12. Hiemstra, T.; De Wit, J.C.M.; Van Riemsdijk, W.H. Multisite proton adsorption modeling at the solid/solution interface of (hydr)oxides: A new approach: II. Application to various important (hydr)oxides. J. Colloid Interface Sci. 1989, 133, 105–117. [Google Scholar] [CrossRef]
  13. Hiemstra, T.; Van Riemsdijk, W.H. A surface structural approach to ion adsorption: The charge distribution (CD) model. J. Colloid Interface Sci. 1996, 179, 488–508. [Google Scholar] [CrossRef]
  14. Hiemstra, T. Ferrihydrite interaction with silicate and competing oxyanions: Geometry and hydrogen bonding of surface species. Geochim. Cosmochim. Acta 2018, 238, 453–476. [Google Scholar] [CrossRef]
  15. Tasciotti, E.; Liu, X.; Bhavane, R.; Plant, K.; Leonard, A.D.; Price, B.K.; Cheng, M.C.-C.; Decuzzi, P.; Tour, J.; Roberta, F.M.; et al. Mesoporous silicon particles as a multistage delivery system for imaging and theraputic applications. Nat. Nanotechnol. 2008, 3, 151–157. [Google Scholar] [CrossRef]
  16. Iler, R.K. The Chemistry of Silica: Solubility, Polymerization, Colloid and Surface Properties and Biochemistry of Silica; Wiley: New York, NY, USA, 1979. [Google Scholar]
  17. Sahai, N. Is silica really an anomalous oxide? Surface acidity and aqueous hydrolysis revisited. Environ. Sci. Technol. 2002, 36, 445–452. [Google Scholar] [CrossRef]
  18. Brown, M.A.; Arrigoni, M.; Heroguel, F.; Beloqui Redondo, A.; Giordano, L.; van Bokhoven, J.A.; Pacchioni, G. pH dependent electronic and geometric structures at the water-silica nanoparticle interface. J. Phys. Chem. C 2014, 118, 29007–29016. [Google Scholar] [CrossRef]
  19. Kosmulski, M. Adsorption of cesium hydroxide on controlled porous glasses. J. Radioanal. Nucl. Chem. Artic. 1989, 129, 149–154. [Google Scholar] [CrossRef]
  20. Redhead, H.; Davis, S.; Illum, L. Drug Delivery in poly (lactide-co-glycolide) nanoparticles surface modified with poloxamer 407 and poloxamine 908: In vitro characterization and in vivo evaluation. J. Control. Release 2001, 70, 353–363. [Google Scholar] [CrossRef]
  21. Kosmulski, M.; Matijevic, E. Zeta-potentials of silica in water alcohol mixtures. Langmuir 1992, 8, 1060–1064. [Google Scholar] [CrossRef]
  22. Brown, M.A.; Goel, A.; Abbas, Z. Effect of electrolyte concentration on the stern layer thickness at a charged interface. Angew. Chem. Int. Ed. 2016, 55, 3790–3794. [Google Scholar] [CrossRef]
  23. Jena, K.C.; Covert, P.A.; Hore, D.K. The effect of salt on the water structure at a charged solid surface: Differentiating second- and third-order nonlinear contributions. J. Phys. Chem. Lett. 2011, 2, 1056–1061. [Google Scholar] [CrossRef]
  24. Ostroverkhov, V.; Waychunas, G.A.; Shen, Y.R. Vibrational spectra of water at water/A-quartz (0001) interface. Chem. Phys. Lett. 2004, 386, 144–148. [Google Scholar] [CrossRef]
  25. Ong, S.; Zhao, X.; Eisenthal, K.B. Polarization of water molecules at a charged interface: Second harmonic studies of the silica/water interface. Chem. Phys. Lett. 1992, 191, 327–335. [Google Scholar] [CrossRef]
  26. Keller, A.A.; Wang, H.T.; Zhou, D.X.; Lenihan, H.S.; Cherr, G.; Cardinale, B.J.; Miller, R.; Ji, Z.X. Stability and aggregation of metal oxide nanoparticles in natural aqueous matrices. Environ. Sci. Technol. 2010, 44, 1962–1967. [Google Scholar] [CrossRef]
  27. Iler, R.K. The Colloidal Chemistry of Silica and Silicates; Cornell University Press: Ithaca, NY, USA, 1955. [Google Scholar]
  28. Parks, G.A. The isoelectric points of solid oxide, solid hydroxides and aqueous hydro complex systems. Chem. Rev. 1965, 65, 177–198. [Google Scholar] [CrossRef]
  29. Duval, Y.; Mielczarski, J.A.; Pokrovsky, O.S.; Meilczarski, E.; Ehrhardt, J.J. Evidence of the existence of three types of species at the quartz-aqueous solution interface at pH 0-10: XPS surface group quantification and surface complexation. J. Phys. Chem. B 2002, 106, 2937–2945. [Google Scholar] [CrossRef]
  30. Dove, P.M.; Craven, C.M. Surface charge density on silica in alkali and alkaline earth chloride electrolyte solutions. Geochim. Cosmochim. Acta 2005, 69, 4963–4970. [Google Scholar] [CrossRef]
  31. Bolt, G.H. Determination of the charge density of silica sols. J. Phys. Chem. 1957, 61, 1166–1169. [Google Scholar] [CrossRef]
  32. Tadros, T.F.; Lyklema, J. Adsorption of potential-determining ions at the silica-aqueous electrolyte interface and the role of some cations. J. Electroanal. Chem. 1968, 17, 267–275. [Google Scholar] [CrossRef]
  33. Milonjic, S.K. Determination of surface ionization and complexation constants at colloidal silica/electrolyte interface. Colloids Surf. 1987, 23, 301–312. [Google Scholar] [CrossRef]
  34. Sonnefeld, J.; Göbel, A.; Vogelsberger, W. Surface charge density on spherical silica particles in aqueous alkali chloride solutions part 1. Experimental results. Colloid Polym. Sci. 1995, 273, 926–931. [Google Scholar] [CrossRef]
  35. Brown, M.A.; Abbas, Z.; Kleibert, A.; Goel, A.; Green, R.; May, S.; Squires, T.M. Determination of surface potential and electrical double layer structure at the aqueous electrolyte-nanoparticle interface. Phys. Rev. X 2016, 6, 011007. [Google Scholar] [CrossRef] [Green Version]
  36. Jalil, A.H.; Pyell, U. Quantification of zeta-potential and electrokinetic surface charge density for colloidal silica nanoparticles dependent on type and concentration of the counterion: Probing the outer Helmholtz plane. J. Phys. Chem. C 2018, 122, 4437–4453. [Google Scholar] [CrossRef]
  37. Boakye-Ansah, S.; Khan, M.A.; Haase, M.F. Controlling surfactant adsorption on highly charged nanoparticles to stabilize bijels. J. Phys. Chem. C 2020, 124, 12417–12423. [Google Scholar] [CrossRef] [PubMed]
  38. Hunt, J.D.; Ezzedine, S.M.; Bourcier, W.; Roberts, S. Kinetics of the Gelation of Colloidal Silica at Geothermal Conditions, and Implications for Reservoir Modification and Management. In Proceedings of the 38th Workshop on Geothermal Reservoir Engineering, Stanford, CA, USA, 11–13 February 2013. [Google Scholar]
  39. Trompette, J.-L.; Meireles, M. Ion-specific effect on the gelation kinetics of concentrated colloidal silica suspensions. J. Colloid Interface Sci. 2003, 263, 522–527. [Google Scholar] [CrossRef]
  40. Trompette, J.-L.; Clifton, M.J.; Bacchin, P. Ion-specific repulsive interactions in colloidal silica dispersions evidenced through osmotic compression measurements and implication in frontal ultrafiltration experiments. J. Colloid Interface Sci. 2005, 290, 455–461. [Google Scholar] [CrossRef] [PubMed]
  41. Döpke, M.F.; Lützenkirchen, J.; Moultos, O.A.; Siboulet, B.; Dufrêche, J.-F.; Padding, J.T.; Hartkamp, R. Preferential adsorption in mixed electrolytes confined by charged amorphous silica. J. Phys. Chem. C 2019, 123, 16711–16720. [Google Scholar] [CrossRef] [Green Version]
  42. Vayssieres, L. On the thermodynamic stability of metal oxide nanoparticles in aqueous solutions. Int. J. Nanotechnol. 2005, 2, 411–439. [Google Scholar] [CrossRef]
  43. Zackrisson, A.S.; Martinelli, A.; Matic, A.; Bergenholtz, J. Concentration effects on irreversible colloid cluster aggregation and gelation of silica dispersions. J. Colloid Interface Sci. 2006, 301, 137–144. [Google Scholar] [CrossRef]
  44. Trompette, J.-L. Influence of Co-ion nature on the gelation kinetics of colloidal silica suspensions. J. Phys. Chem. B 2017, 121, 5654–5659. [Google Scholar] [CrossRef]
  45. Fossum, J.O.; Gudding, E.; Fonseca, D.d.M.; Meheust, Y.; DiMasi, E.; Gog, T.; Venkataraman, C. Observations of orientational ordering in aqueous suspensions of a nano-layered silicate. Energy 2005, 30, 873–883. [Google Scholar] [CrossRef]
  46. Philips, I.R.; Sheehan, K.J. Importance of surface charge characteristics when selecting soils for wastewater re-use. Aust. J. Soil Res. 2005, 43, 915–927. [Google Scholar] [CrossRef]
  47. Lützenkirchen, J.; Preočanin, T.; Kovačević, D.; Tomišić, V.; Lövgren, L.; Kallay, N. Potentiometric titrations as a tool for surface charge determination. Croat. Chem. Acta 2012, 85, 391–417. [Google Scholar] [CrossRef]
  48. Stumm, W.; Huang, C.P.; Jenkins, S.R. Specific chemical interaction affecting stability of dispersed systems. Croat. Chem. Acta 1970, 42, 223–245. [Google Scholar]
  49. Lützenkirchen, J. The constant capacitance model and variable ionic strength: An evaluation of possible applications and applicability. J. Colloid Interface Sci. 1999, 217, 8–18. [Google Scholar] [CrossRef]
  50. Lyklema, J. Fundamentals of Interface and Colloid Science; Academic Press: San Diego, CA, USA, 1995; Volume 2. [Google Scholar]
  51. Sverjensky, D.A. Interpretation and prediction of triple-layer model capacitances and the structure of the oxide-electrolyte-water interface. Geochim. Cosmochim. Acta 2001, 65, 3643–3655. [Google Scholar] [CrossRef]
  52. Westall, J. FITEQL: A Computer Program for Determination of Chemical Constants from Experimental Data. Version 2.0; Oregon State University: Corvallis, OR, USA, 1982. [Google Scholar]
  53. Zhuravlev, L.T. The surface chemistry of amorphous silica. Zhuravlev model. Colloids Surf. A Physicochem. Eng. Asp. 2000, 173, 1–38. [Google Scholar] [CrossRef] [Green Version]
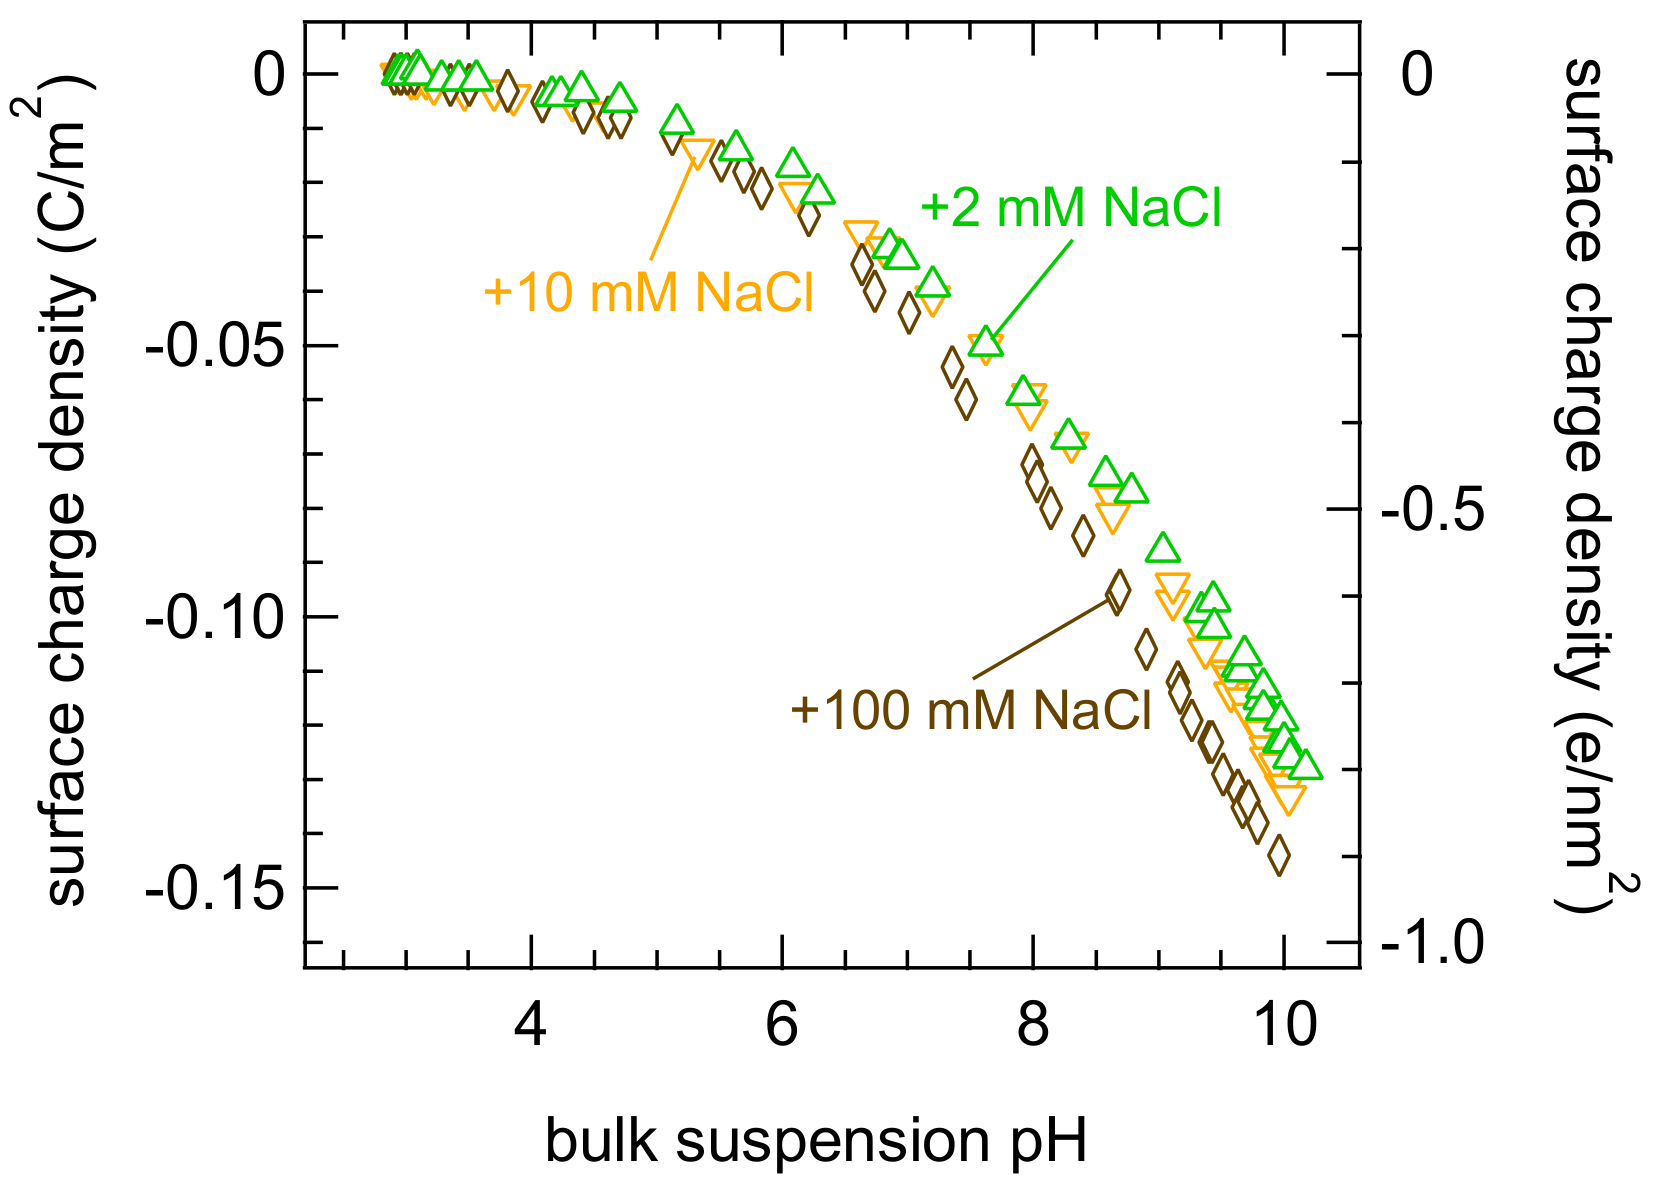
Figure 1. SCD of 5 wt.% Bindzil 360 in varying concentrations of added NaCl (2 mM: green, 10 mM: orange, 100 mM: brown).
Colloids 06 00023 g001
Figure 2. Schematic representation of the electrical double layer at the interface as per (a) diffuse layer model and (b) Gouy-Chapman-Stern model. SCM fits with varying CIS compared to the SCD of 5 wt.% Bindzil 360 in (c,d) 2 mM NaCl, in (e,f) 10 mM NaCl, and in (g,h) 100 mM NaCl. The fits in (c,e,g) are DLM fits whereas (d,f,h) are GCS fits.
Colloids 06 00023 g002
Figure 3. The residuals (errors), i.e., representing the discrepancy between simulation and experiment, are shown as a function of different amounts of CIS (mM) using GCS model for 5 wt.% Bindzil 360. Inset shows the differentiated function (asymmetric gaussian) to estimate the point of minima.
Colloids 06 00023 g003
Figure 4. Estimated residual salt for each SiO 2 compared to the values given by their respective manufacturers.
Colloids 06 00023 g004
Publisher’s Note: MDPI stays neutral with regard to jurisdictional claims in published maps and institutional affiliations.