1. Introduction
Studies on the adsorption of various types of surfactants at fluid interfaces have been frequently performed. The most important facts are summarized in several books, such as by Möbius et al. [
1], Kronberg et al. [
2], Rosen [
3], or most recently by Rosen and Kunjappu [
4], being the fourth edition of [
3]. The knowledge presented in these and other textbooks still remains correct and represents the fundamentals of surfactants at interfaces. However, recent papers report on new features of adsorbed surfactant molecules [
5,
6,
7,
8,
9,
10,
11] and new experimental methods, such as [
12,
13] in particular, where studies were performed at water/oil interfaces. As a general fact, it is very clear that the adsorption behavior of surfactants at the surface of an aqueous solution is rather different from that at the interfaces between these solutions and an oil phase. In particular, the distribution coefficient of non-ionic surfactants between the aqueous and oil phase is an additional feature, important for all systems containing non-ionics [
14,
15].
The theoretical description of surfactant adsorption layers at water/oil interfaces started by applying classical models derived for the water/air interface [
16]. The lattice theory later derived by Bahramian and Danesh [
17] gives a relationship for the interfacial tension but does not specify the contribution of surfactant molecules to the properties of the interfacial layers. In subsequent publications, it was typically stated that the oil molecules can penetrate into the alkyl chain layer of the adsorbed surfactant molecules, leading to stronger adsorption as compared to the water/air surface [
18,
19,
20]. The next step in understanding the special situation at water/oil interfaces was the picture of competitive adsorption of surfactant and oil molecules, as it was discussed in [
21], for the homologs of alkyl trimethyl ammonium bromides at different water/alkane interfaces. Such an assumption allowed describing experimental data even better.
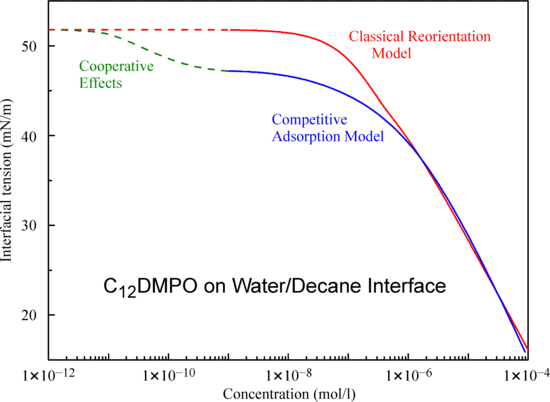
However, it was experimentally observed that, at very low surfactant concentrations, there is a surface tension decrease of few mN/m, and this effect cannot easily be explained by a competitive surfactant/alkane adsorption alone. In a new theoretical approach by Fainerman et al. [
21], it was proposed that there is a cooperative effect governing the formation of the mixed adsorption layer of surfactant and alkane molecule. This cooperativity means that the presence of first-adsorbed surfactant molecules initiates the ordering of alkane molecules at the interface, and this mixed layer provides an attractive environment for surfactants to adsorb and further reduce the interfacial tension.
In this paper, we continue the study of dodecyl dimethyl phosphine oxide (C
12DMPO) adsorption layers, now at the water/decane interface, and compare the results with those obtained for the water/hexane interface using a theoretical approach similar to that applied in [
21]. In contrast to the approach given in [
21], however, we apply a combined version of two adsorption models: the Frumkin model for the adsorption of the alkane molecules, and the reorientation model for the surfactant molecules. In this way, we cannot only explain the decrease of the interfacial tension at very low surfactant concentration, but can also give a realistic composition of the adsorbed amounts of alkane and surfactant over the entire C
12DMPO concentration range.
In this study, the surfactant’s distribution coefficient between the water and decane phases was determined. Similar to the experiments performed in [
15], two series of measurements were performed with two types of systems: a decane drop in the C
12DMPO aqueous solution, and a water drop immersed into the C
12DMPO solution in decane. To determine the distribution coefficient, we employed the method proposed in [
14].
2. Materials and Methods
The interfacial tension measurements were performed with the bubble/drop profile analysis tensiometers PAT-1 and PAT-2P (SINTERFACE Technologies, Germany) as described in detail elsewhere [
22]. The dynamic interfacial tension values were measured in the time range from seconds up to the equilibrium state of adsorption at 5 h for the higher and 25 h for the lower surfactant concentrations. Dodecyl dimethyl phosphine oxide (C
12DMPO) was synthesized and purified as described in [
23] and had a purity of better than 99%. The measurement temperature was kept constant at 25 °C. The decane for the oil phase was of spectroscopic grade (Labscan, Thailand) with a purity of better than 99% and used as received. All aqueous surfactant solutions were prepared using Milli-Q water. The experiments were performed with the buoyant (sessile) drop mode of PAT. The aqueous C
12DMPO solutions were filled into the measuring cell having a volume of 20 mL. The decane drops were then formed at the bottom tip of a vertical steel capillary. The internal profile of the capillary was conical with an inner tip diameter of 2.0 mm. The drops formed in the experiments had a surface area between 31 and 34 mm
2. The PAT software produced drops with an initial size of 21 to 23 mm³ and kept the size constant over the entire experiment.
Two methods were employed to determine the surfactant’s distribution coefficient. Similarly to what was reported in [
15], the interfacial tensions were measured of decane drops formed in the aqueous surfactant solution and of water drops formed in surfactant solutions in decane. From the two adsorption isotherms of a surfactant thus obtained, it was possible to determine the distribution coefficient via the ratio of concentrations in oil and water, respectively, at which the interfacial tension was the same. Another method proposed in [
14] was applied to determine the distribution coefficient. To the cell containing 18 mL of aqueous C
12DMPO solution, 5 mL of decane was added at the top of the solution. The diffusion of surfactant occurred in the decane. After equilibration (which required more than one day), the surfactant concentration in the aqueous solution decreased, which resulted in an increase of the interfacial tension as compared to that measured before the addition of the decane. Then, from the interfacial tension isotherm of the aqueous solution, the C
12DMPO concentration in the solution was determined, which finally gave the distribution coefficient.
3. Theory
The effect of alkanes on the interfacial tension can be described either by their co-adsorption with surfactants in a mixed adsorption layer or only by a modification of the surface layer properties of the surfactant molecules. In contrast to the model described in [
21], where the adsorption of both components was assumed to obey the Frumkin model, here we consider a combined model. This model assumes the co-adsorption of alkane adsorbed from the oil drop governed by the Frumkin model, and surfactant adsorbed from the aqueous solution in the cuvette obeying the reorientation model. In what follows, the subscripts F and R refer to the quantities relative to the Frumkin and reorientation model, respectively. This combined model, first proposed in [
24], is formulated as follows.
It is assumed that the surfactant molecules can be adsorbed in two orientations, corresponding to the molar areas ωR1 and ωR2, respectively. For definiteness, we assume ωR1 < ωR2. The partial adsorptions of the reorientation species in the two states, ΓR1 and ΓR2, respectively, are described by the equations: ΓR = ΓR1 + ΓR2 and ωRΓR = θR = ωR1ΓR1 + ωR2ΓR2, where ωR is the average molar area of the reorientation component and θR is the partial coverage of surface by the molecules of reorientation species.
Assuming the non-ideal enthalpy and entropy of the interfacial layer, the equation of state for the mixed layer is:
where R and T are the gas law constant and absolute temperature, respectively,
is the surface pressure, and γ
0 and γ are the surface tension of solvent and solution, respectively. The parameter ω
R10 is the molar area of the reorientable component in its state 1 when the surface coverage is infinitely small, and the parameters a
R, a
F, and a
RF account for the interactions between the molecules of corresponding species in the adsorbed layer. The total surface coverage θ is related to the partial coverages as θ = θ
R + θ
F. The average molar area for the mixture is approximated by the relation:
The adsorption isotherm for the reorientation component in state 1 is:
Here, b
R1 and c
R are the adsorption equilibrium coefficient for the state 1 and the bulk concentration of the reorientation component. Assuming that the interrelation between the adsorption equilibrium coefficients for states 1 and 2 of the reorientation component follows the power law:
, the distribution between the two states is expressed by the equation:
For the Frumkin component, the adsorption isotherm reads:
The model assumes that the adsorption equilibrium parameter for the Frumkin component b
F depends on the surface coverage by the reorientation component θ
R:
The model involves intrinsic compressibility in the adsorption layer. More specifically, it is assumed that the molar areas ω
R1 and ω
F decrease with the increase of total surface coverage and surface pressure:
where ε
R and ε
F are the intrinsic compressibility coefficients and ω
F0 is the molar area of the Frumkin component when the surface coverage is infinitely small.
4. Results and Discussion
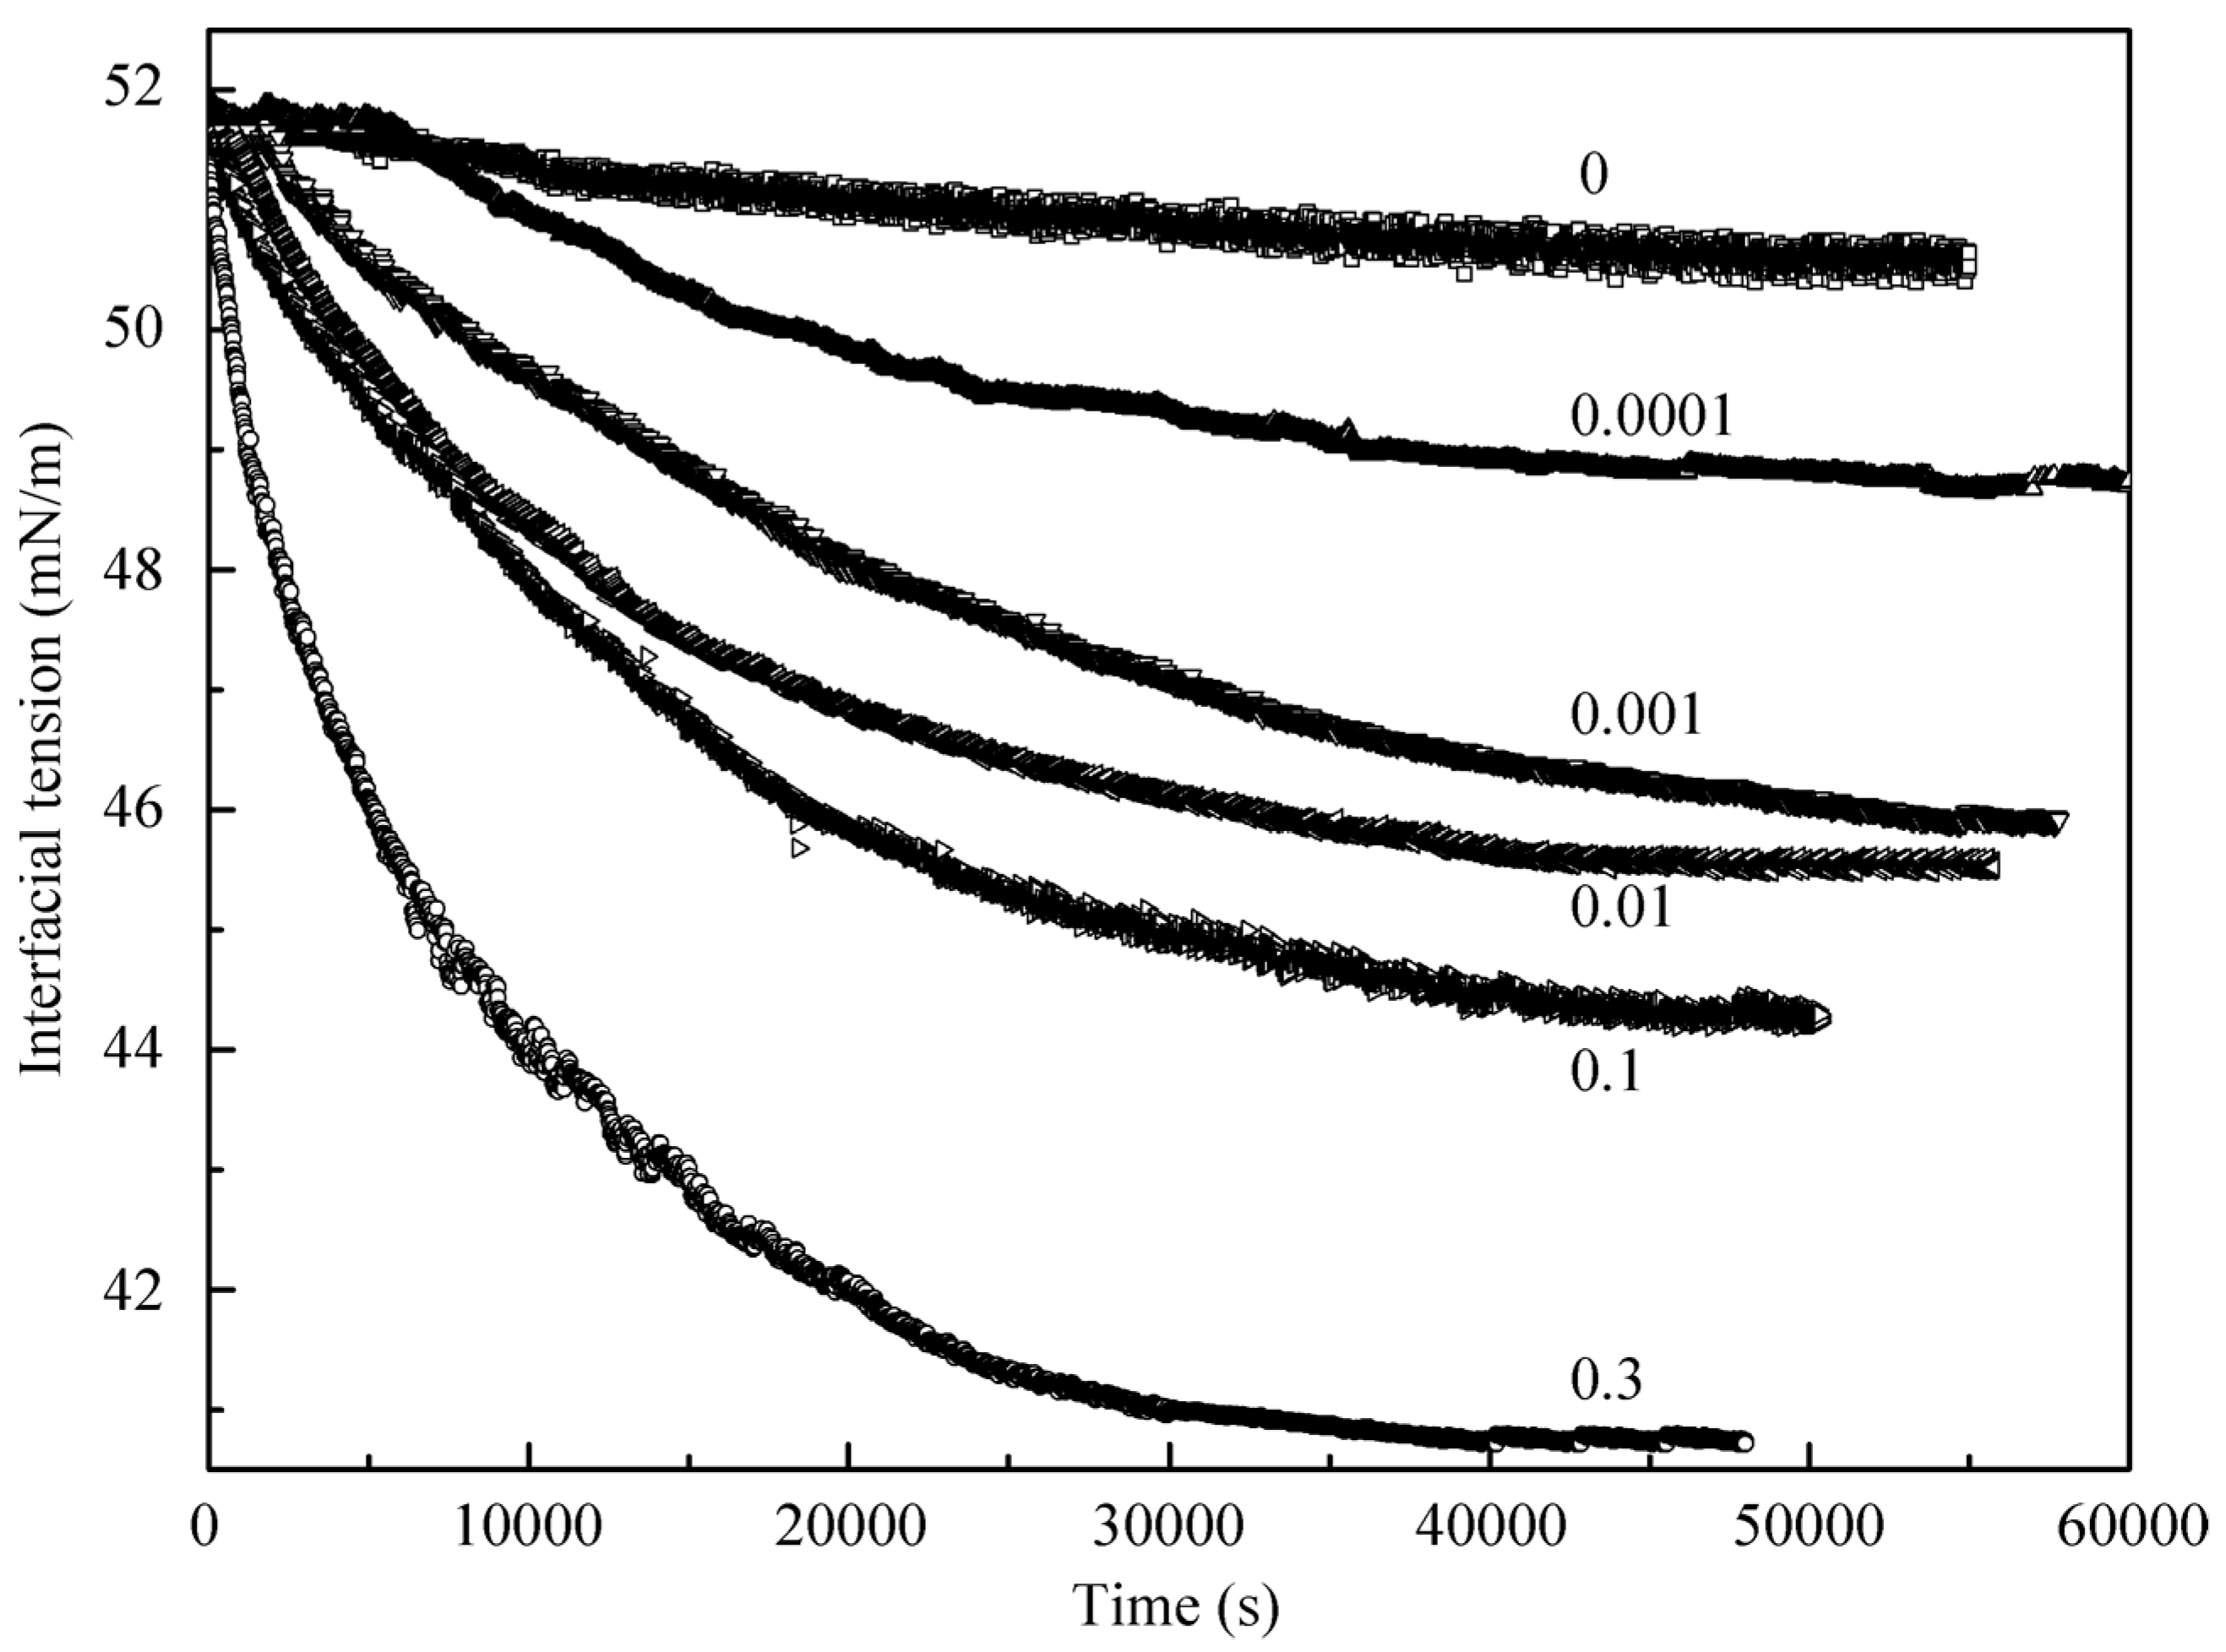
Let us consider first the adsorption kinetics. In
Figure 1, the dynamic interfacial tension at the interface between a decane drop and the surrounding aqueous solution of C
12DMPO at several low concentrations is shown. Included is also the time dependence for the pure water at the interface with decane. It is seen that during 55,000 s the interfacial tension at the water/decane interface decreased only by 0.8 mN/m, which is obviously caused by the presence of small admixtures in the decane sample. For the solutions with surfactant concentrations of 10
−9, 10
−8, and 10
−7 mol/L the interfacial tension is lower than that for the pure water/decane interface by 5 to 8 mN/m.
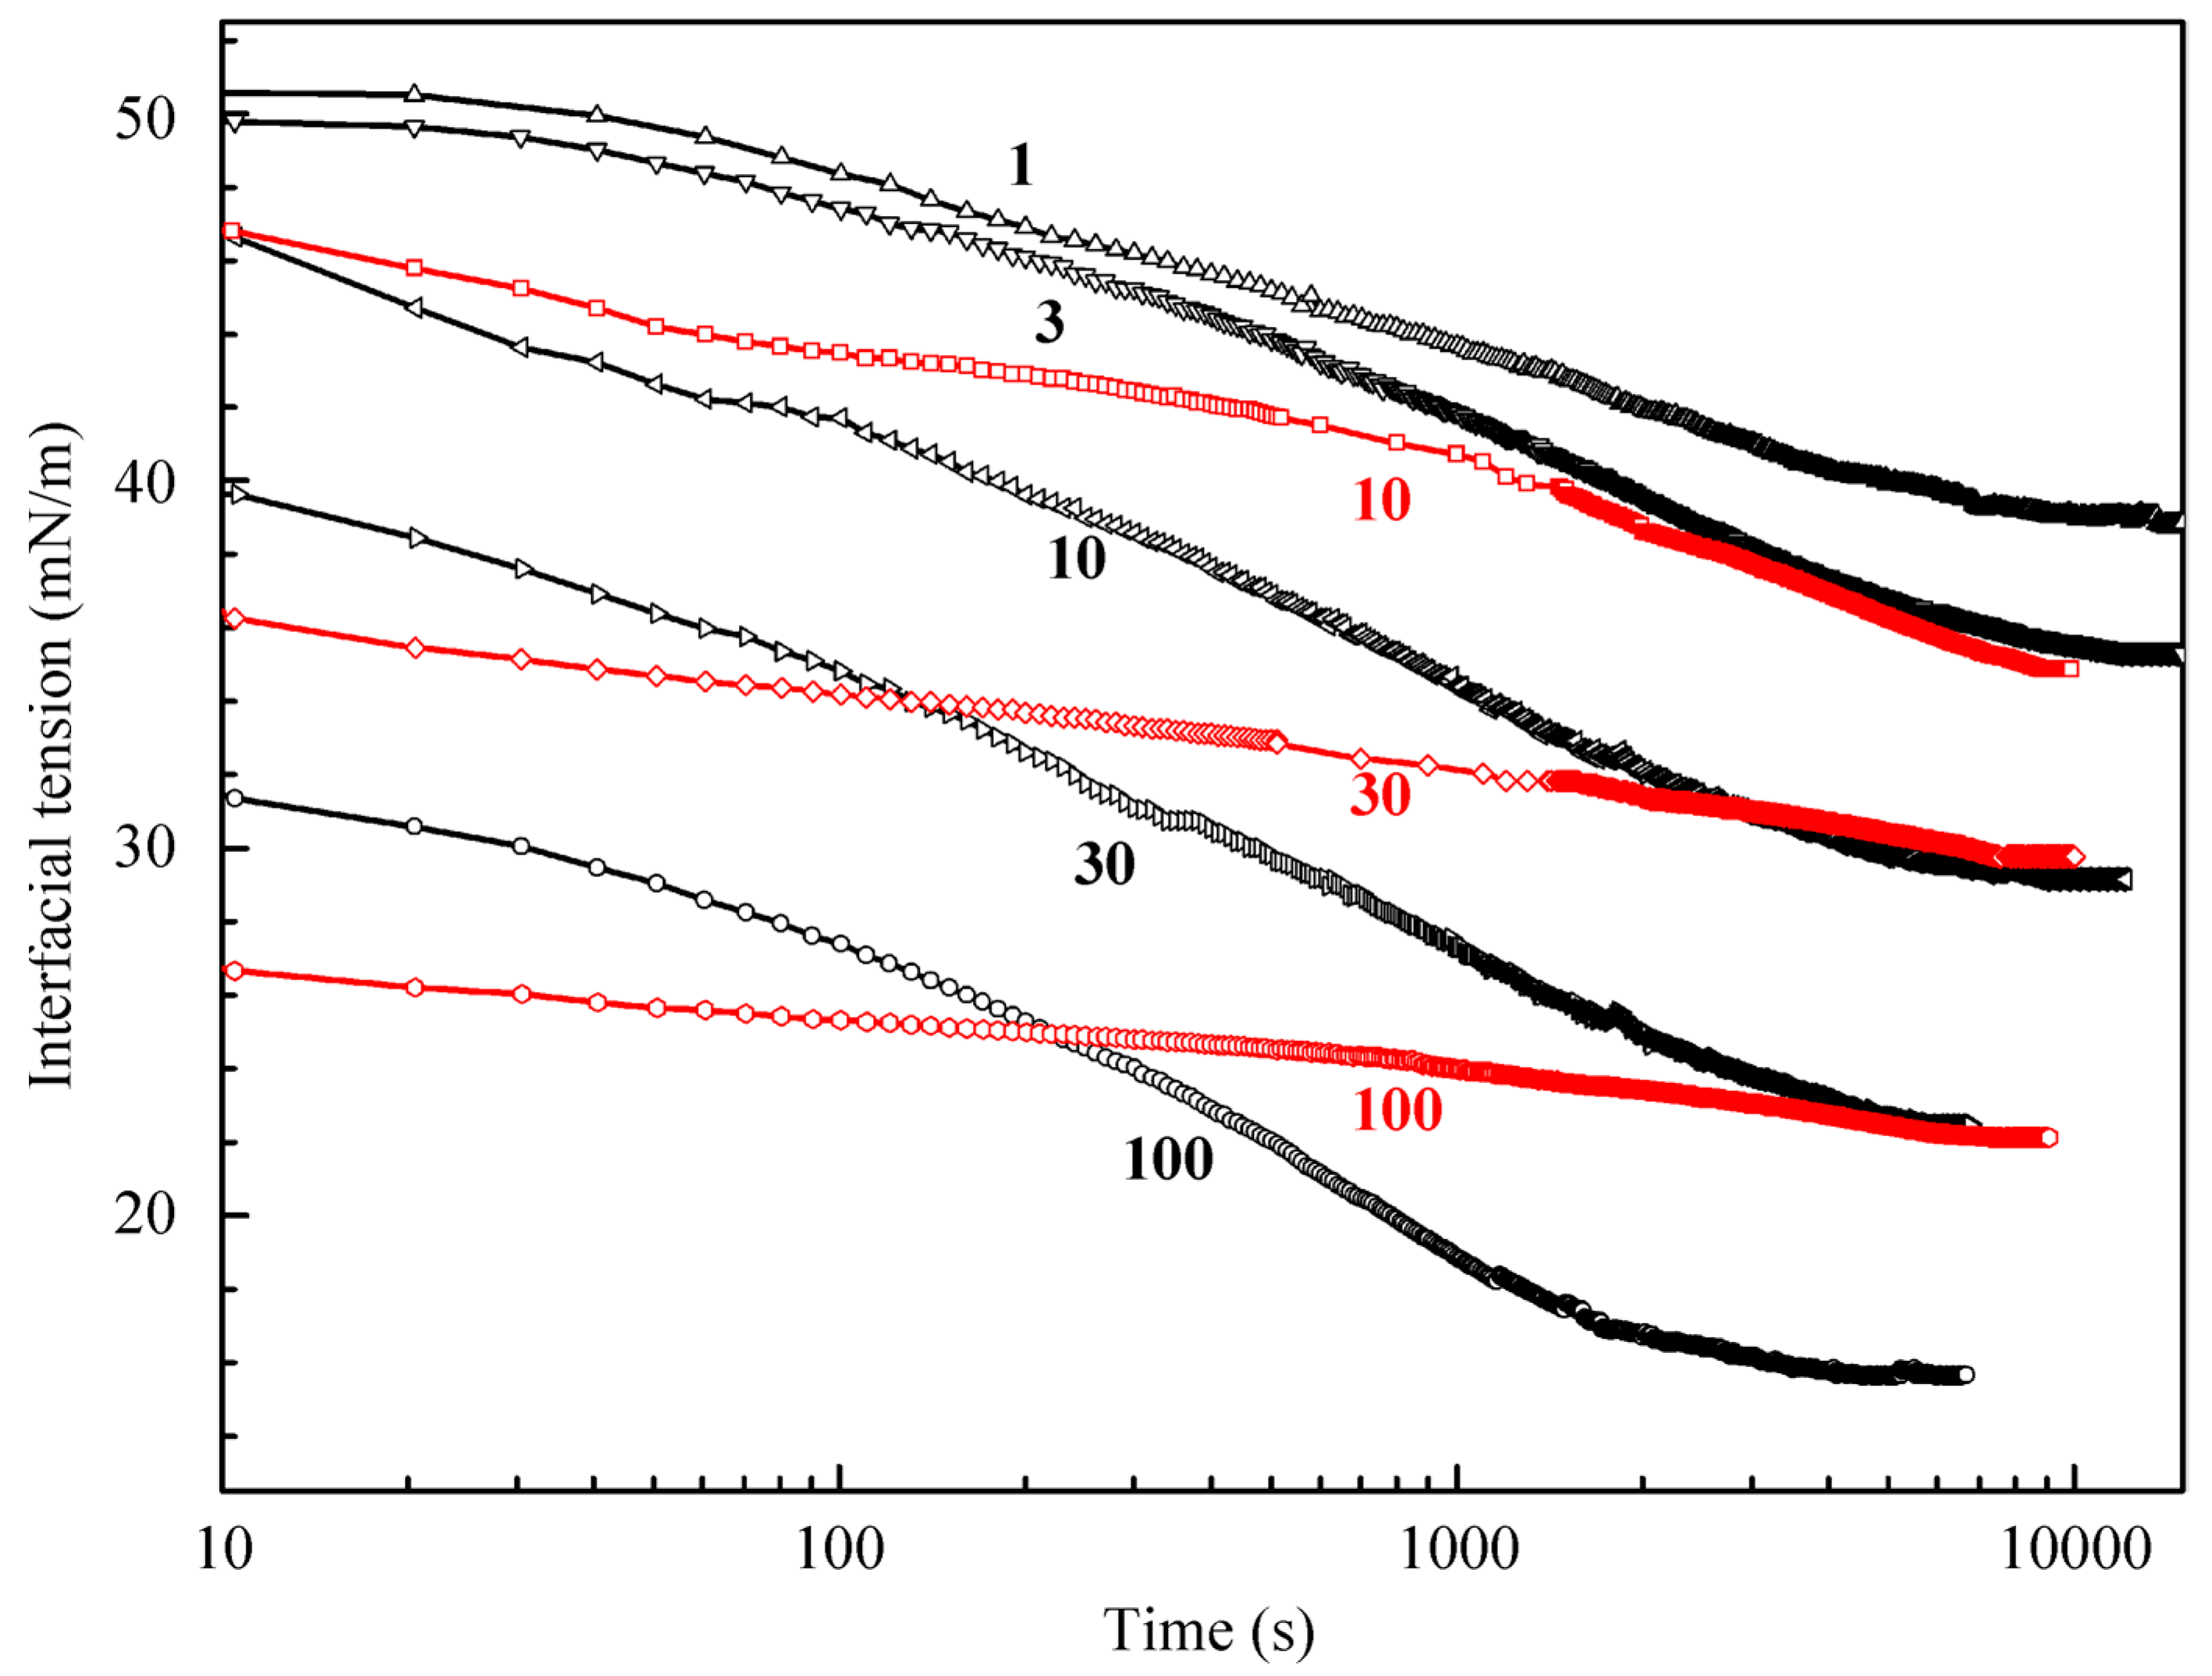
Figure 2 illustrates the results obtained for higher C
12DMPO concentrations (black curves); also shown are the results obtained for a water drop surrounded by the C
12DMPO solution in decane for three concentrations (10, 30, and 100 µmol/L, red curves). The equilibrium interfacial tension for a water drop in the C
12DMPO solution in decane is by 6–7 mN/m higher than that for the same C
12DMPO concentration in the aqueous solution. These results were used to determine the distribution coefficient of C
12DMPO between the water and decane phases. It should be noted that the dynamics of adsorption from the surfactant solution in decane is different from that from the aqueous solution. The equilibration in the solution in decane is attained faster than in the aqueous solution; this is attributable to a higher C
12DMPO diffusion coefficient in decane than in water. The dependencies for the C
12DMPO solutions at the interface with hexane studied in [
21] are rather similar to those shown in
Figure 2, i.e., the tension at the alkane drop/aqueous solution interface is approximately equal for the two alkanes.
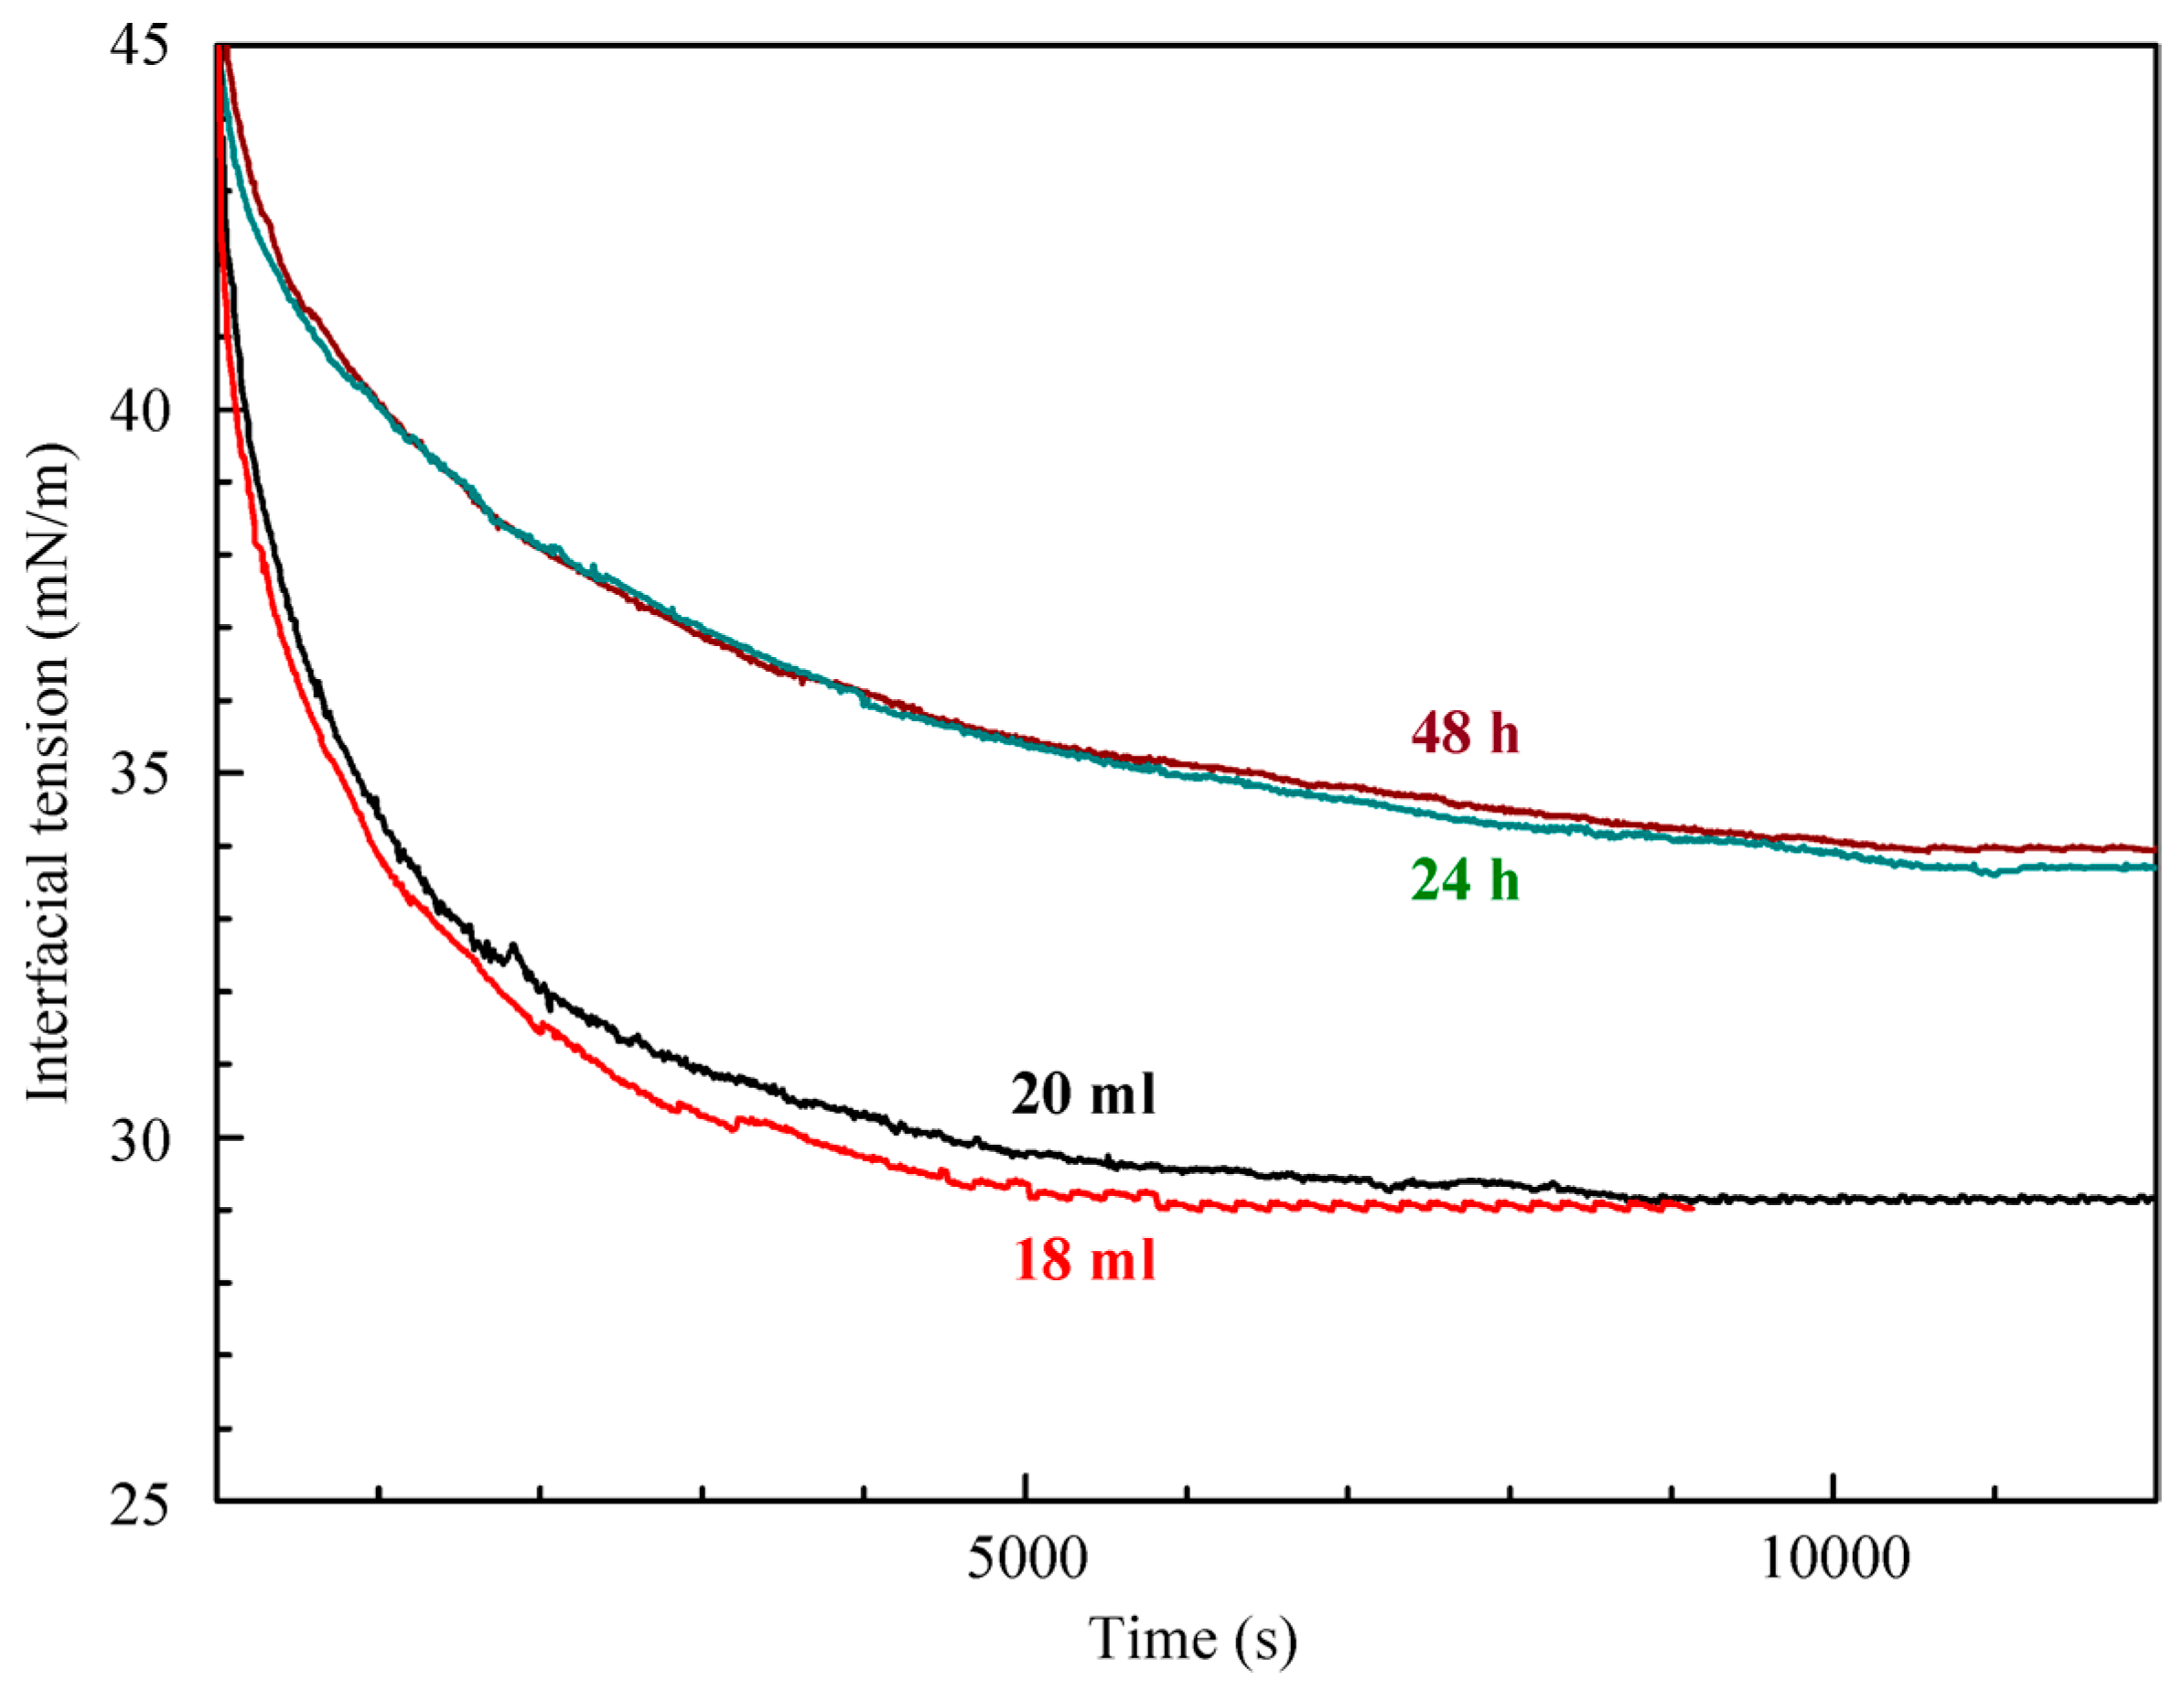
The results of interfacial tension measurements performed to determine the distribution coefficient via the method proposed in [
14] are shown in
Figure 3. The lower curves were obtained for a 10 μmol/L aqueous C
12DMPO concentration with solution volumes of 20 mL and 18 mL (as shown in the Figure). The upper curves were obtained for the experiment in which 5 mL of decane were added on top of the solution. To estimate the effect caused by the partial penetration of the surfactant from its aqueous solution into the decane phase, two sets of measurements were performed, with different time lags between the addition of decane (24 and 48 h, as indicated in the Figure). It is seen that the curves are virtually the same for times longer than 9000 s, which shows that the equilibrium is attained. The penetration results in the decrease of the surfactant concentration in its aqueous solution, which leads to an increase in the interfacial tension. Thus, it becomes possible to use the interfacial tension values and the C
12DMPO adsorption to determine the surfactant concentrations in water and decane, and hence to calculate the distribution coefficient.
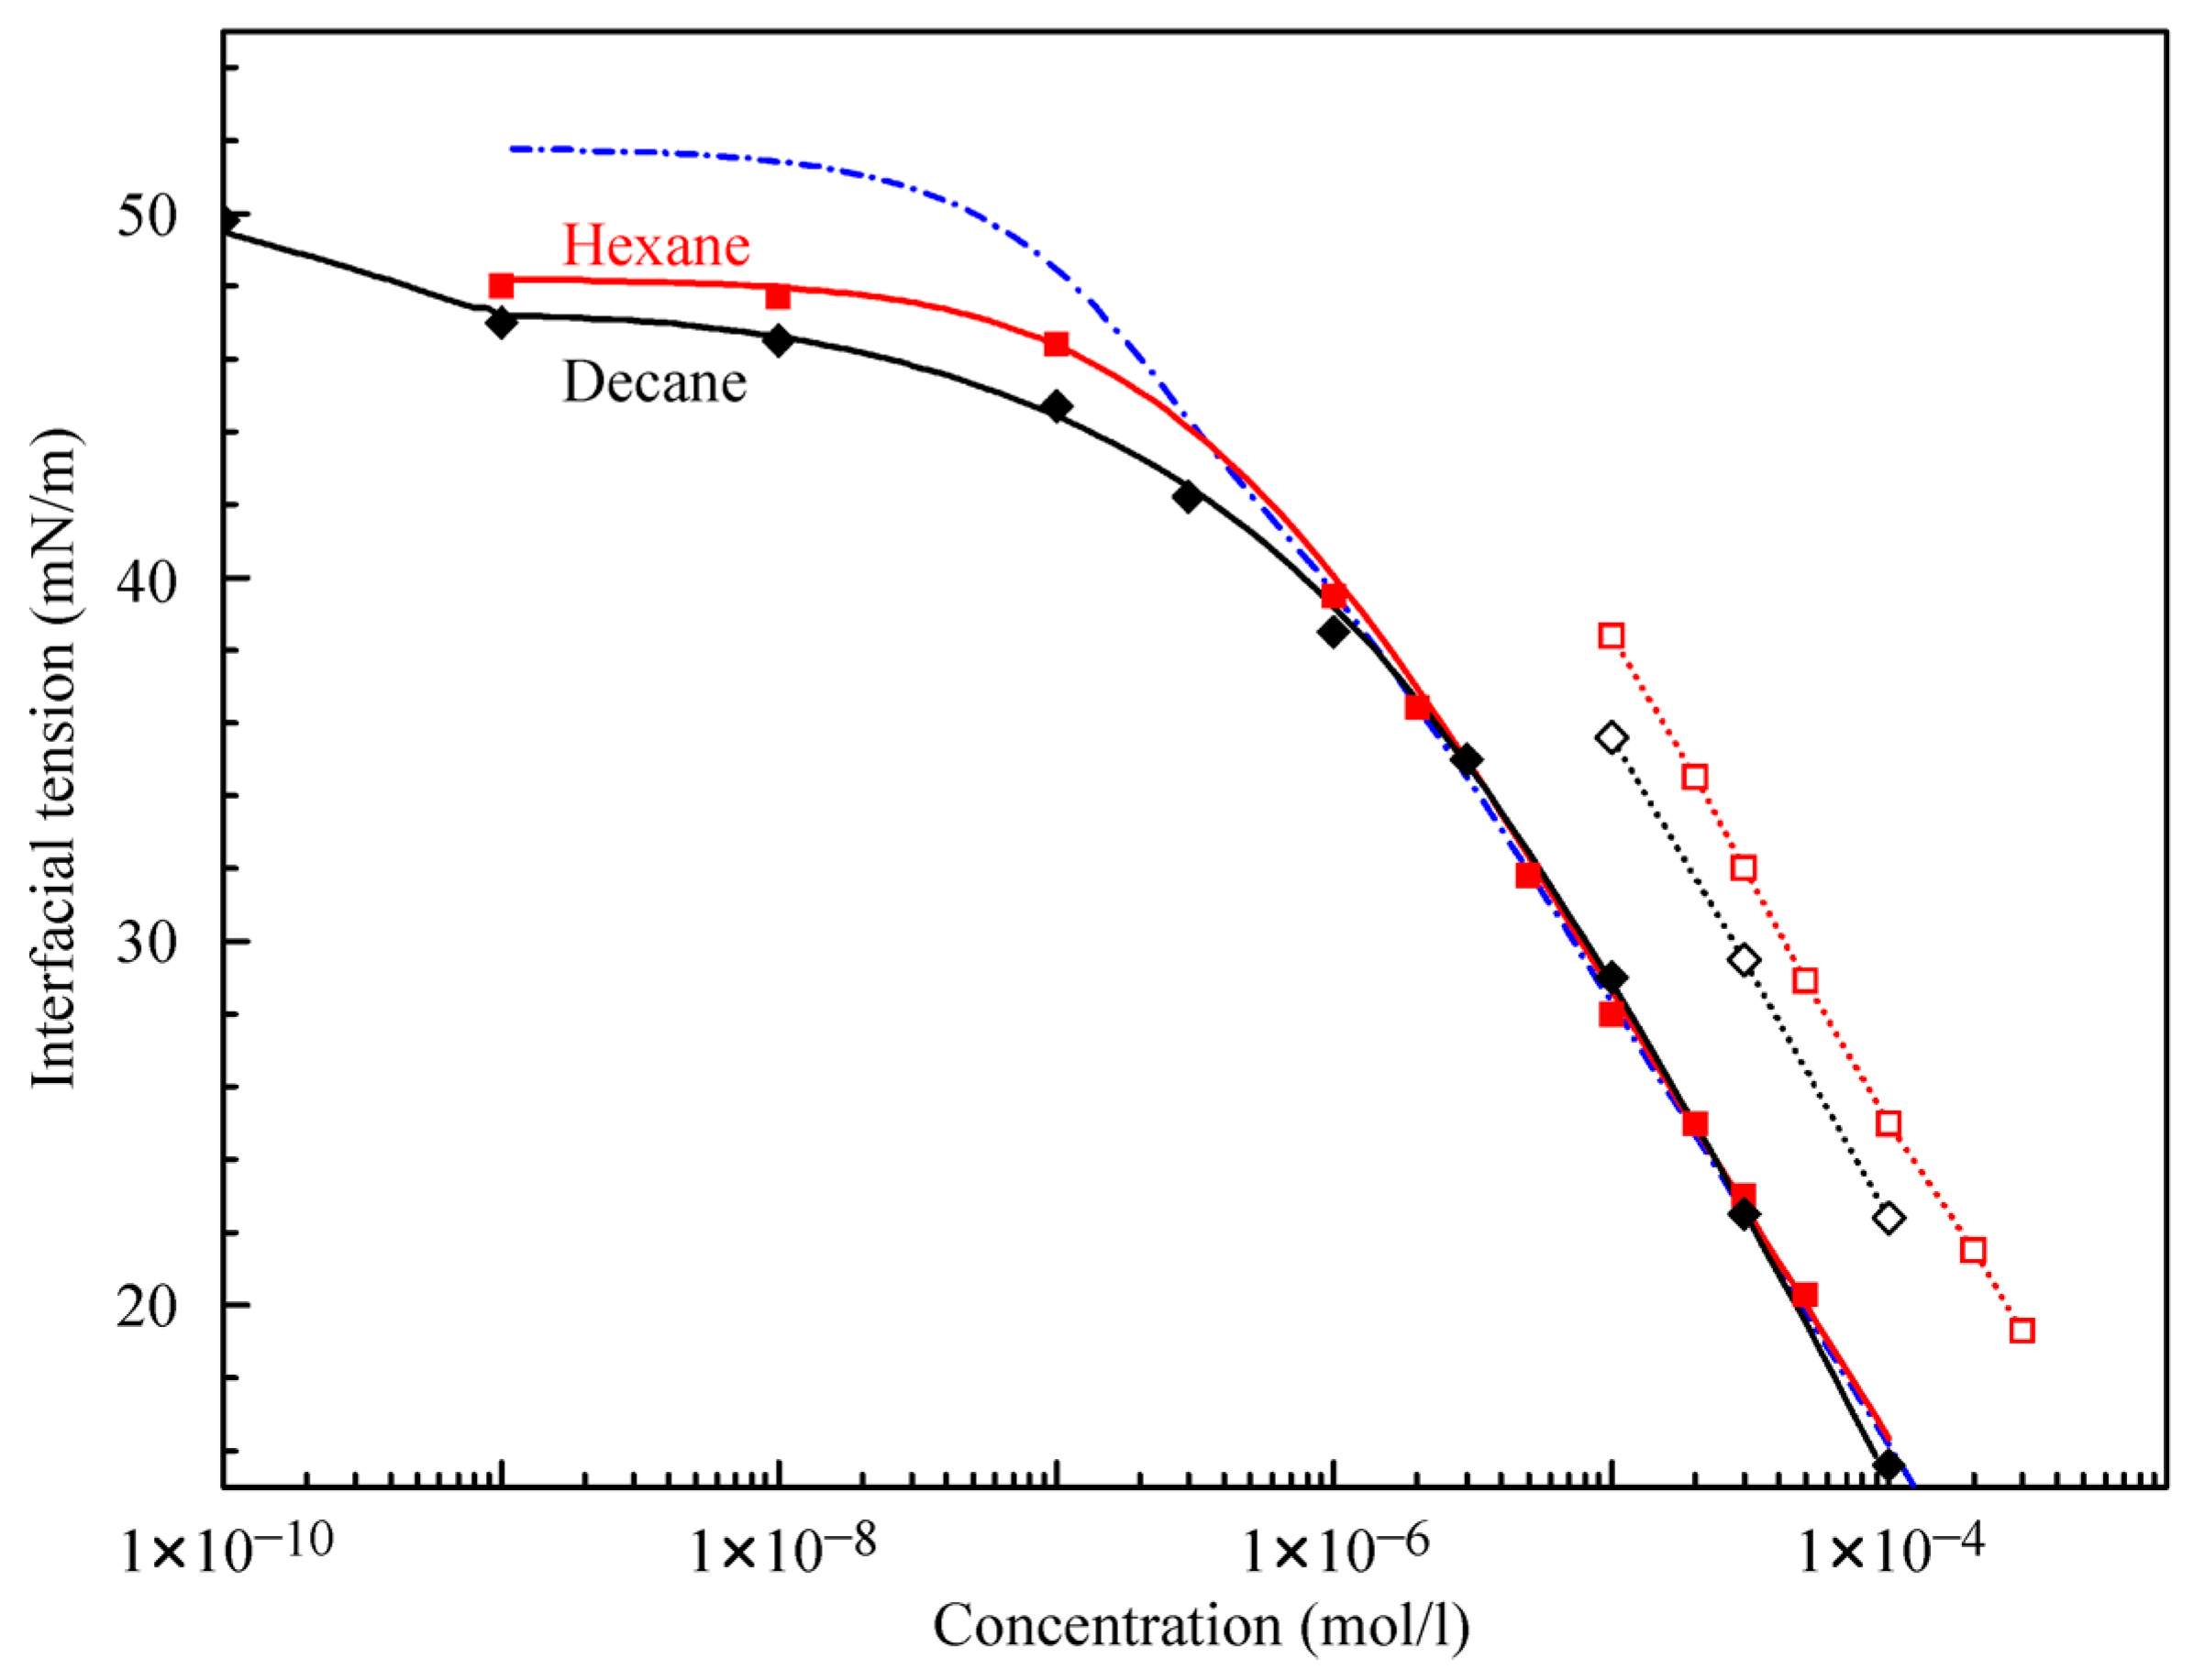
Figure 4 illustrates the interfacial tension isotherms of aqueous C
12DMPO solutions against hexane and decane. The equilibrium interfacial tension values were estimated from the data shown in
Figure 1 and
Figure 2. The experimental values of surface tension for single hexane and decane drops in C
12DMPO solutions are shown by solid symbols. It is seen that above 1 μmol/L C
12DMPO concentrations, the isotherms for hexane and decane drops in C
12DMPO aqueous solutions almost coincide, while at concentrations below 1 μmol/L the interfacial tension at the interface with decane is lower than that with hexane. It was shown previously in [
21] that the decrease of tension at very low surfactant concentrations is caused by the adsorption of alkane rather than by the adsorption of surfactant molecules. The present results show that the adsorption of decane is stronger than the adsorption of hexane.
The theoretical values calculated using Equations (1)–(7) with the parameters listed in
Table 1 are shown in
Figure 4 by solid curves. The theoretical results are in good agreement with the experimental data. It is seen that, while the model parameters relative to the C
12DMPO for both interfaces (decane and hexane) are almost the same, the b
Fmax parameter for decane is twice as large as that for hexane. The values calculated with the parameters for C
12DMPO listed in
Table 1 for the case of negligible alkane adsorption (dash-dotted curve in
Figure 4) are also in good agreement with the experiments at concentrations above 1 μmol/L.
Figure 4 also shows the experimental isotherms for water drops in C
12DMPO solutions in hexane and decane (open symbols). The interfacial tension values for the solutions in hexane are higher than those in decane, which is caused by the higher solubility of C
12DMPO in hexane than in decane, i.e., by the different distribution coefficients. Note, the concentrations for these data are those in the alkane phase, while for the other experimental points the abscissa refers to concentrations in the aqueous phase.
Using the method explained in [
21], based on the comparison of two types of isotherms, the distribution coefficients K for C
12DMPO between water and hexane (K = 6.4–6.8) and between water and decane (K = 3.8–4.1) were estimated. From the values of equilibrium interfacial tension (
Figure 3) and the isotherm for decane drops in water, the distribution coefficient of the C
12DMPO between decane and water was determined. The interfacial tension increase caused by the transfer of C
12DMPO from water into decane (
Figure 3) results in a decrease of the C
12DMPO concentration in water from 10 μmol/L to 5.5–5.8 μmol/L. Then, from the volume (18 mL) and the difference in concentrations, it is possible to calculate the amount of C
12DMPO and its concentration in 5 mL of decane. This yields a distribution coefficient of 4.1–4.7. Therefore, both methods used lead to close results, and for the distribution coefficient of C
12DMPO between water and decane, a value of K = 4 was obtained.
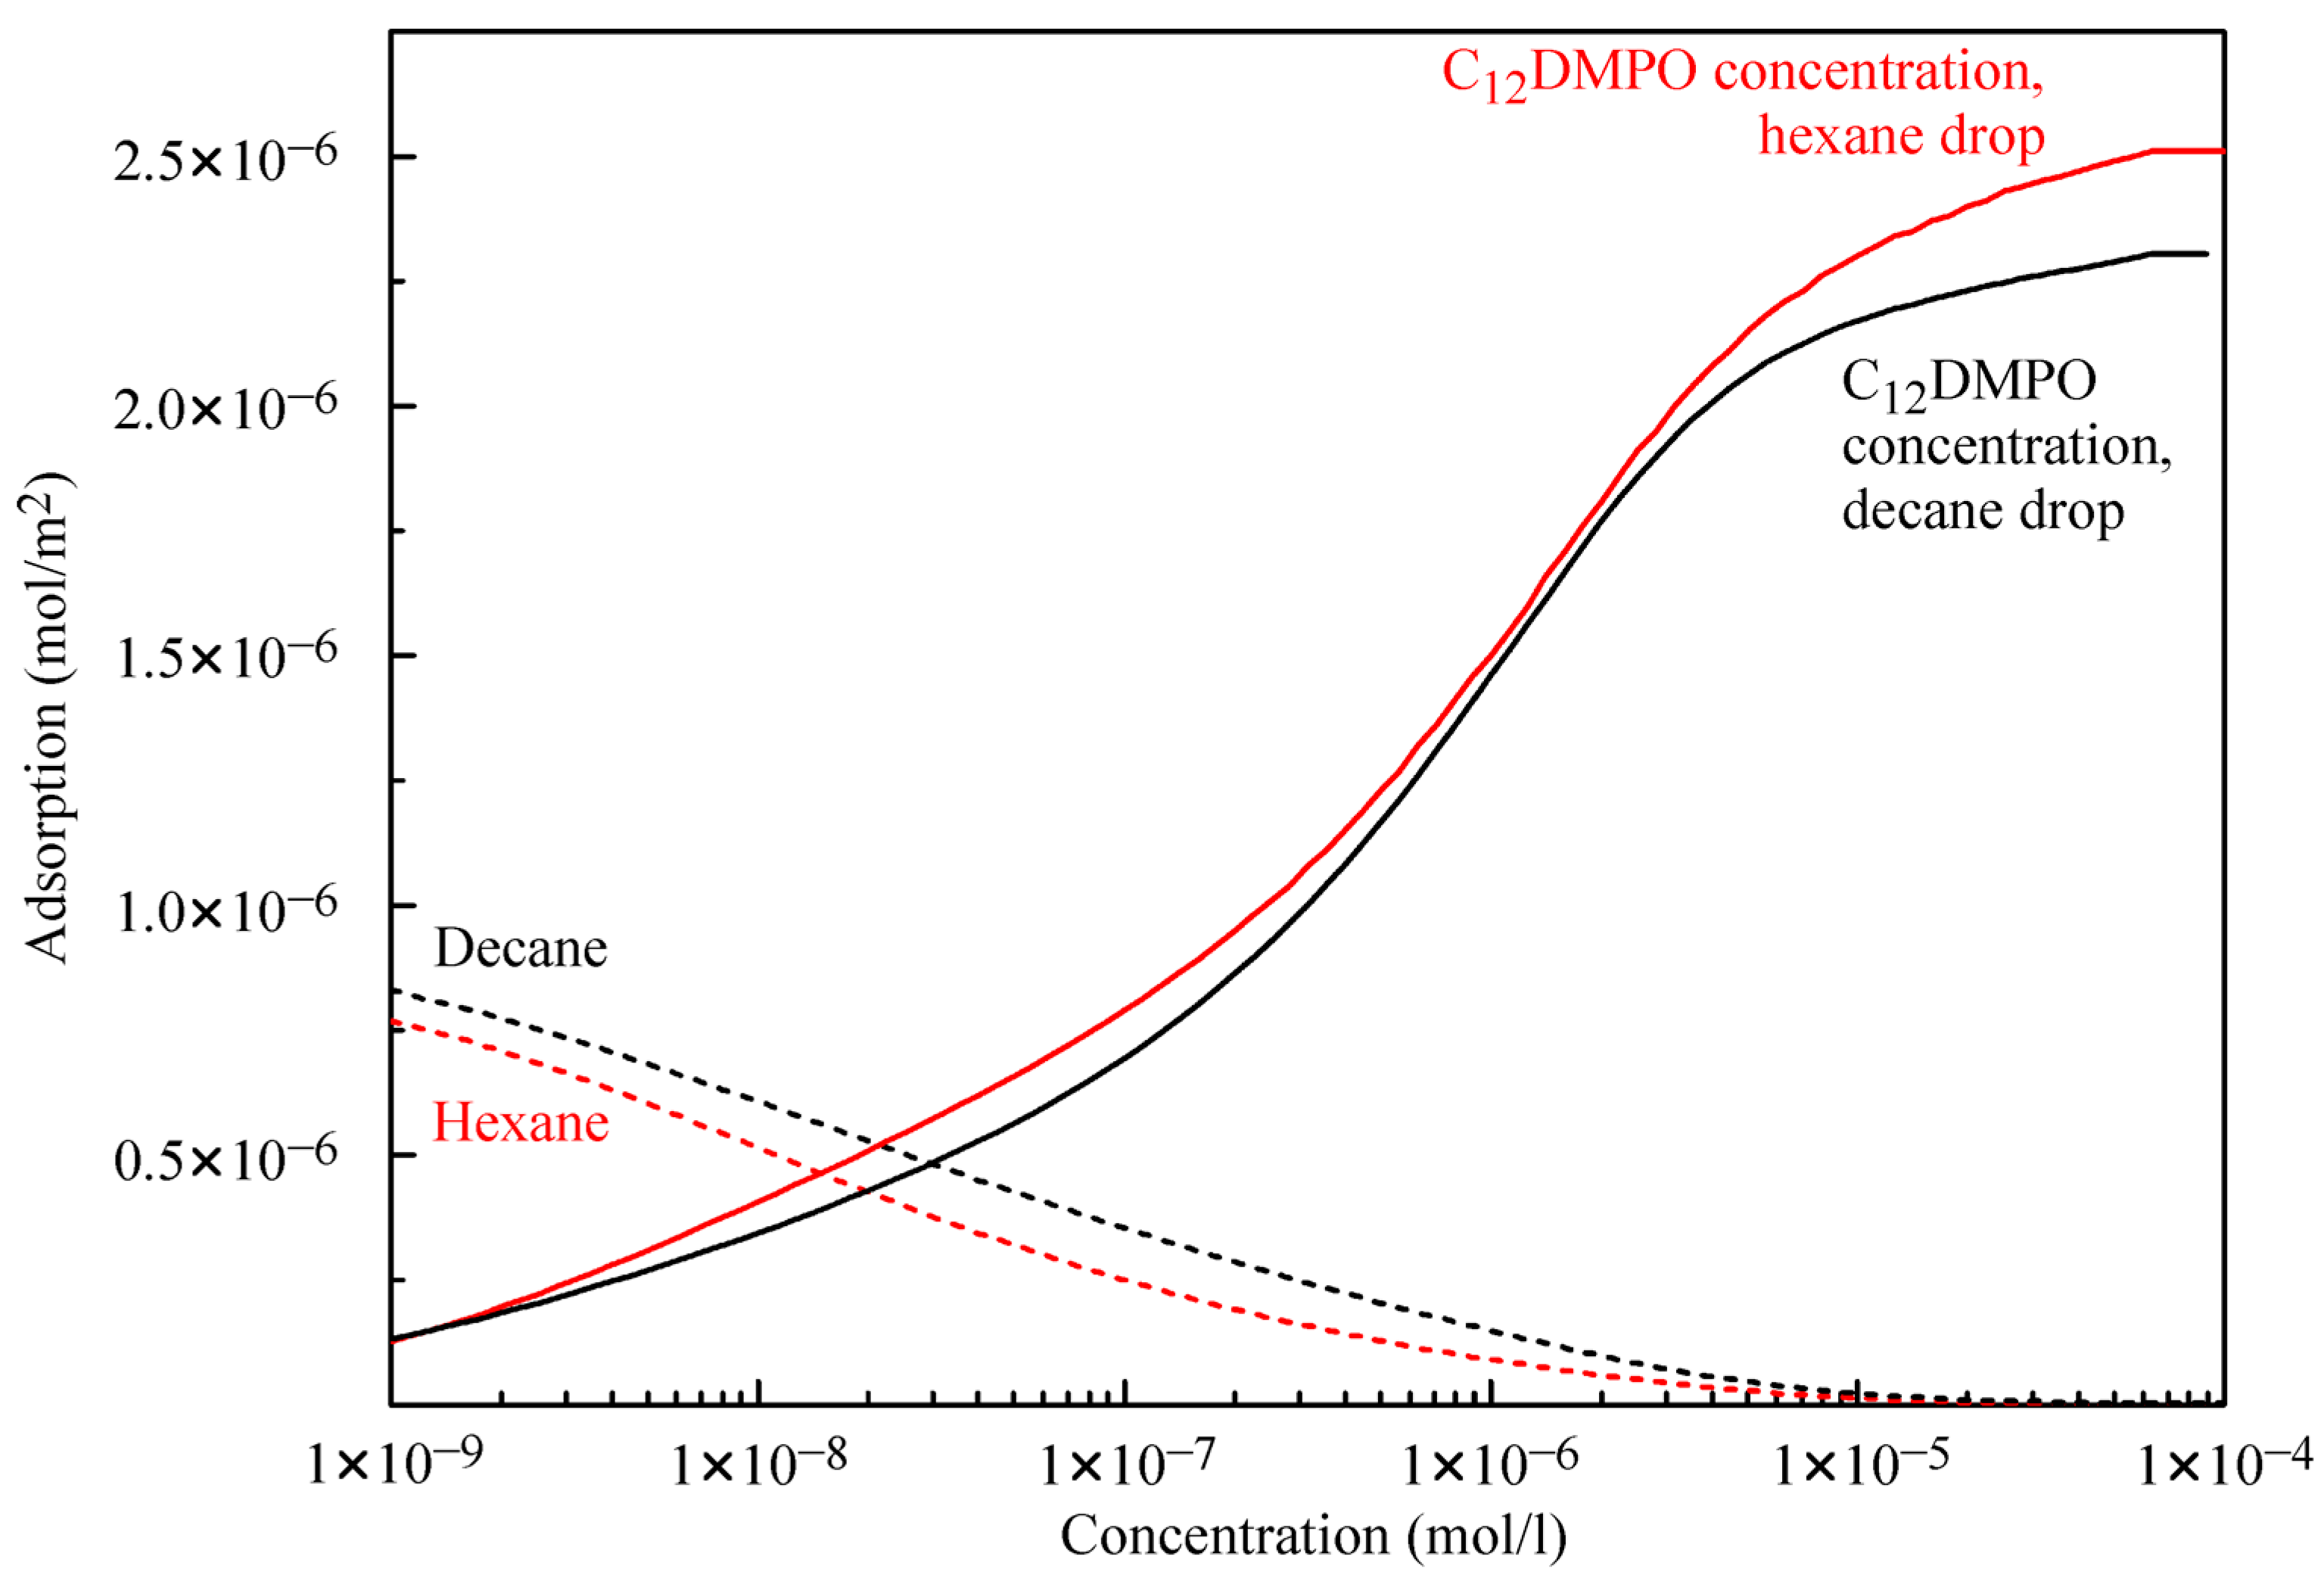
Figure 5 illustrates the adsorptions of alkanes and C
12DMPO. For the water–decane system, the decane adsorption is somewhat higher, and the C
12DMPO adsorption is somewhat lower than the corresponding values for the water–hexane system. At surfactant concentrations below 2 × 10
−8 mol/L the alkanes, adsorption dominates, while at higher surfactant concentrations the adsorption of surfactant molecules prevails. The reorientation model for the surfactant yields real values for the alkane:surfactant adsorption ratio for the lowest surfactant concentrations. For the two alkanes considered here, the maximum value of this ratio is 6, which agrees quite well with the results of quantum chemical calculations [
25] where it was predicted that this ratio cannot exceed a value of 8.
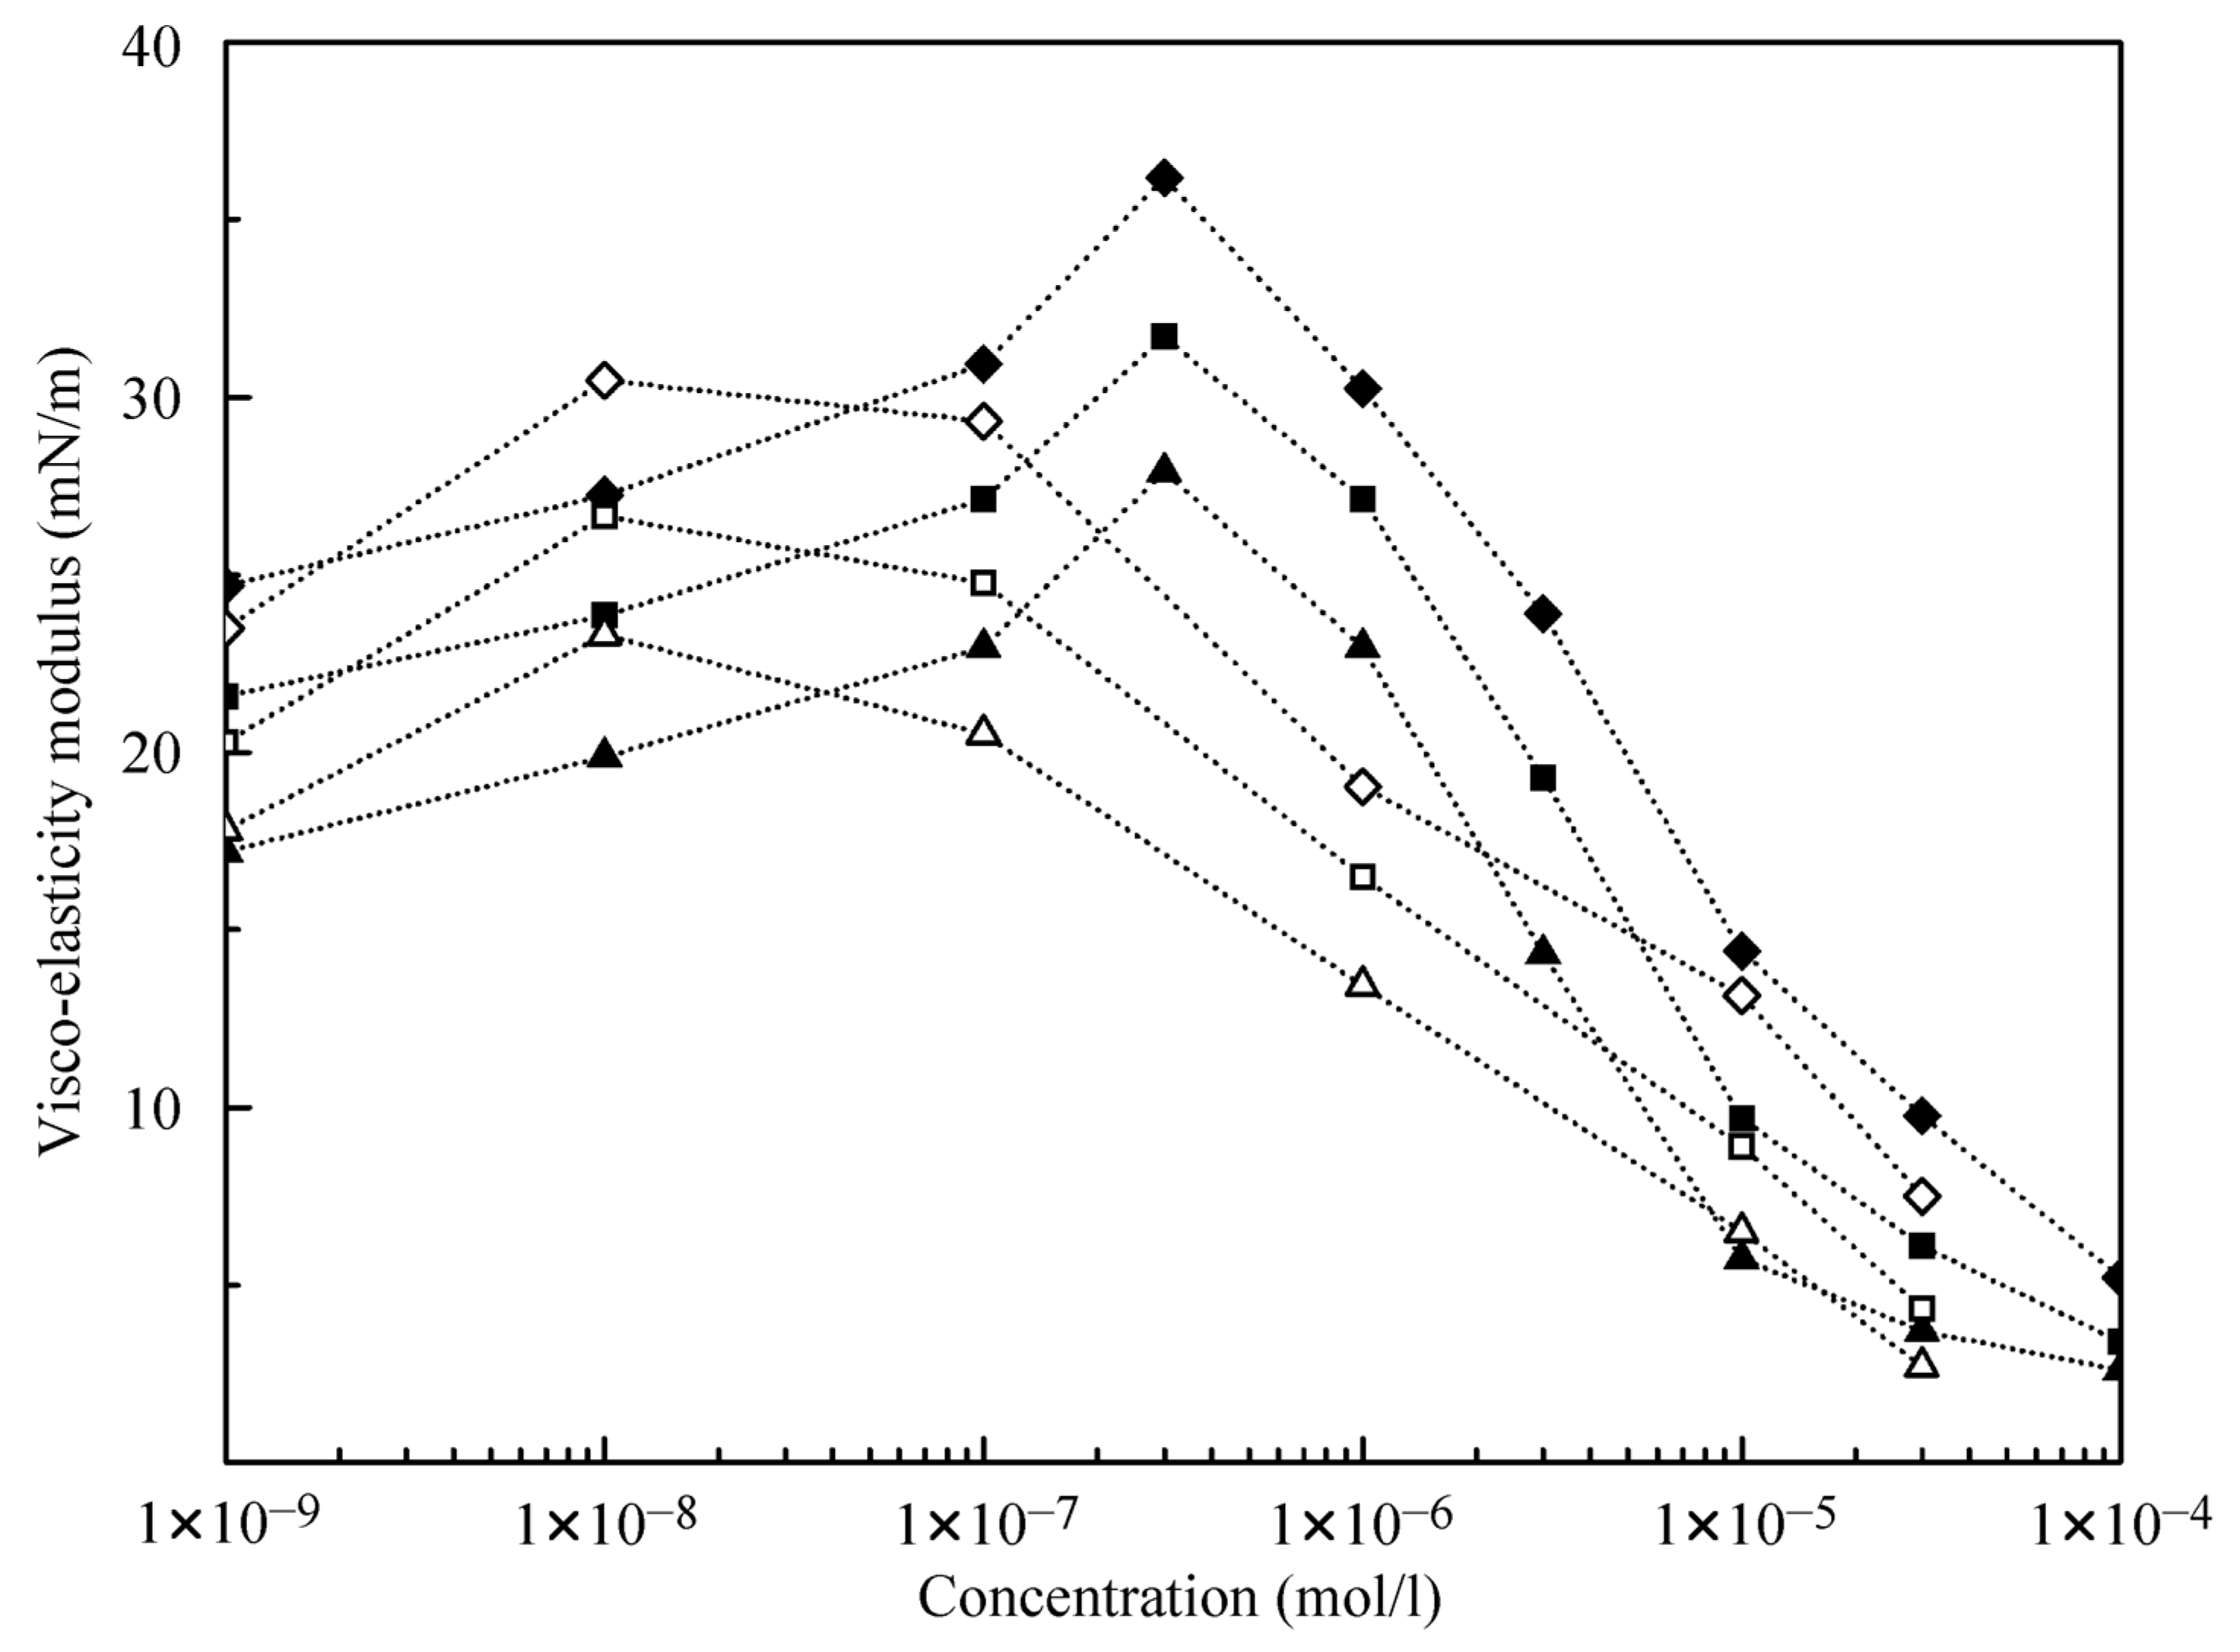
The results obtained in the dilation rheology studies at the water/hexane interface (data from [
21]) and at the water/decane interface using alkane drops in C
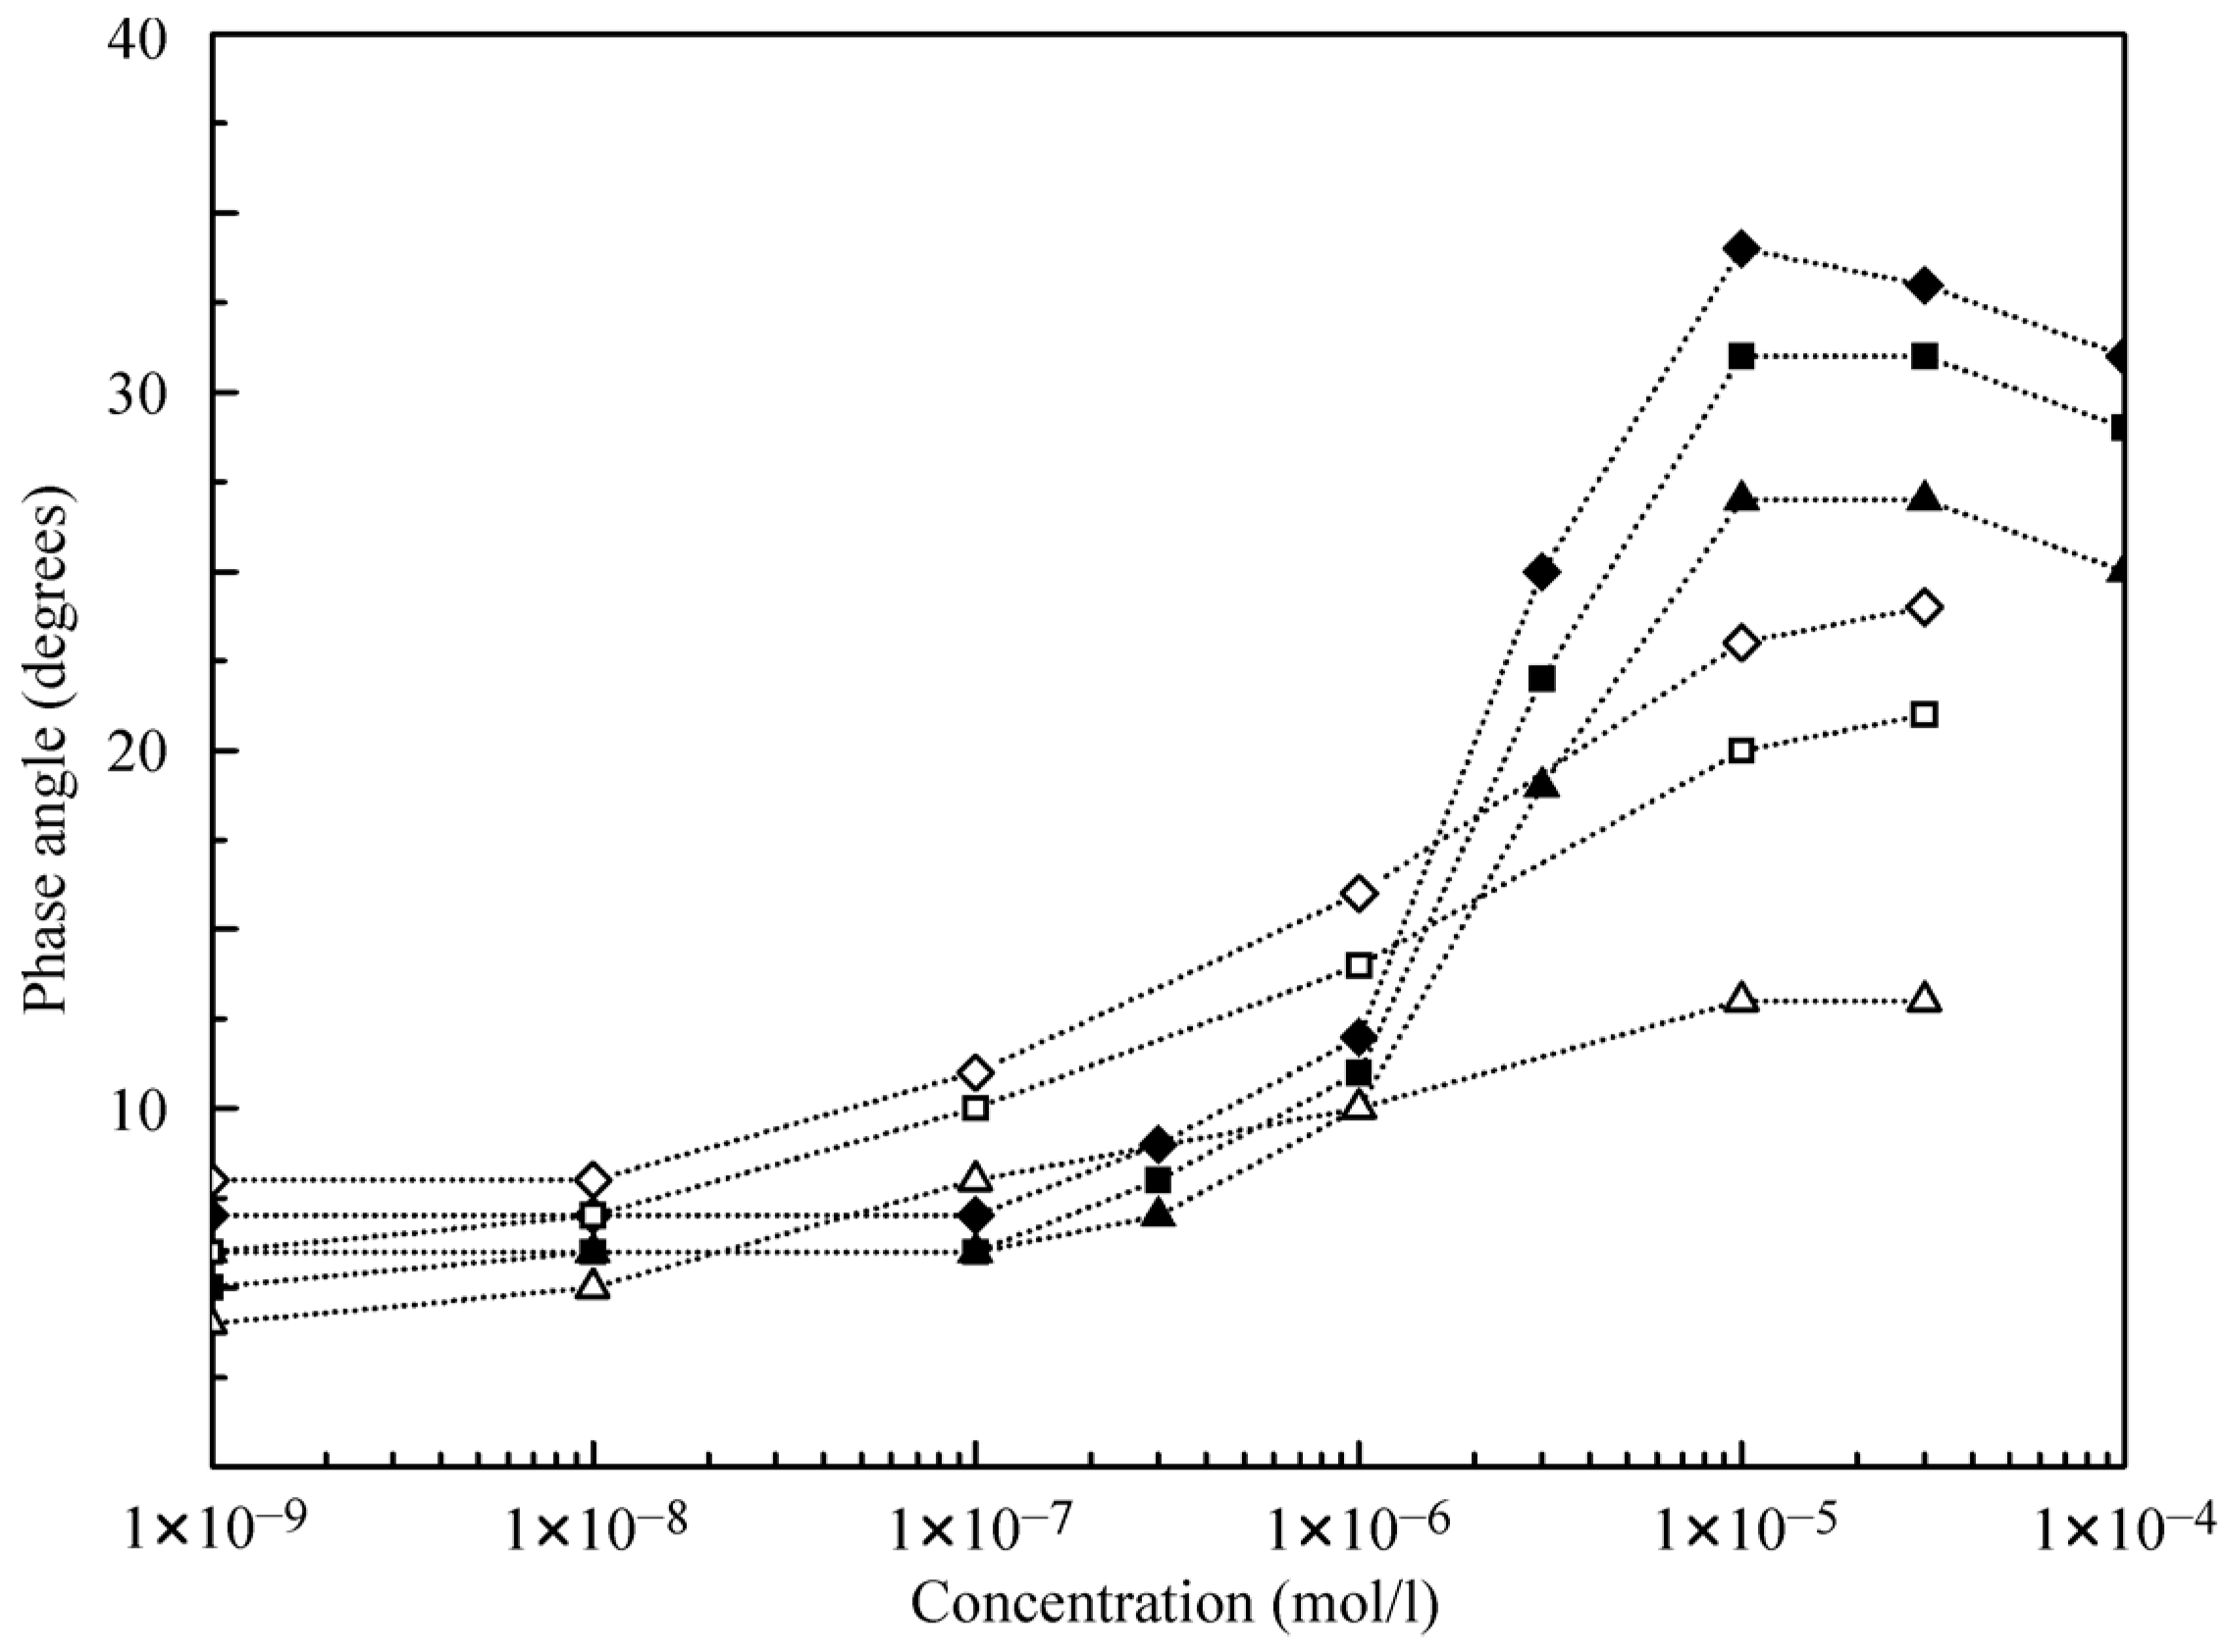
12DMPO aqueous solutions after equilibration are illustrated by
Figure 6 and
Figure 7. It is seen that the visco-elasticity modulus increases with the increase of the oscillation frequency. For the water/decane interface, the modulus values are somewhat higher than for the water/hexane interface, and the concentration dependencies of the visco-elasticity modulus exhibit a maximum at the concentration of 0.01 μmol/L for hexane, and 0.3 μmol/L for decane. This indicates that the alkanes contribute significantly to the rheological properties. Note, the experiments for water drops in C
12DMPO solutions in alkane show modulus values approximately twice as higher as for the same surfactant concentrations in water. This can be explained by the controlled (lower) concentration of the surfactant in alkane for water drops formed in surfactant in alkane solutions.
Of interest are the dependencies of the phase angle as shown in
Figure 7. At low concentrations, the phase angle values do not exceed 10° and become higher at concentrations above 1 μmol/L. This suggests that the presence of alkanes in the surface layer hampers the phase shift. The phase angle increases with the increase of oscillation frequency; for decane, the angle is approximately two times higher than for hexane at the same concentrations.
It follows from the data shown in
Figure 5 that at C
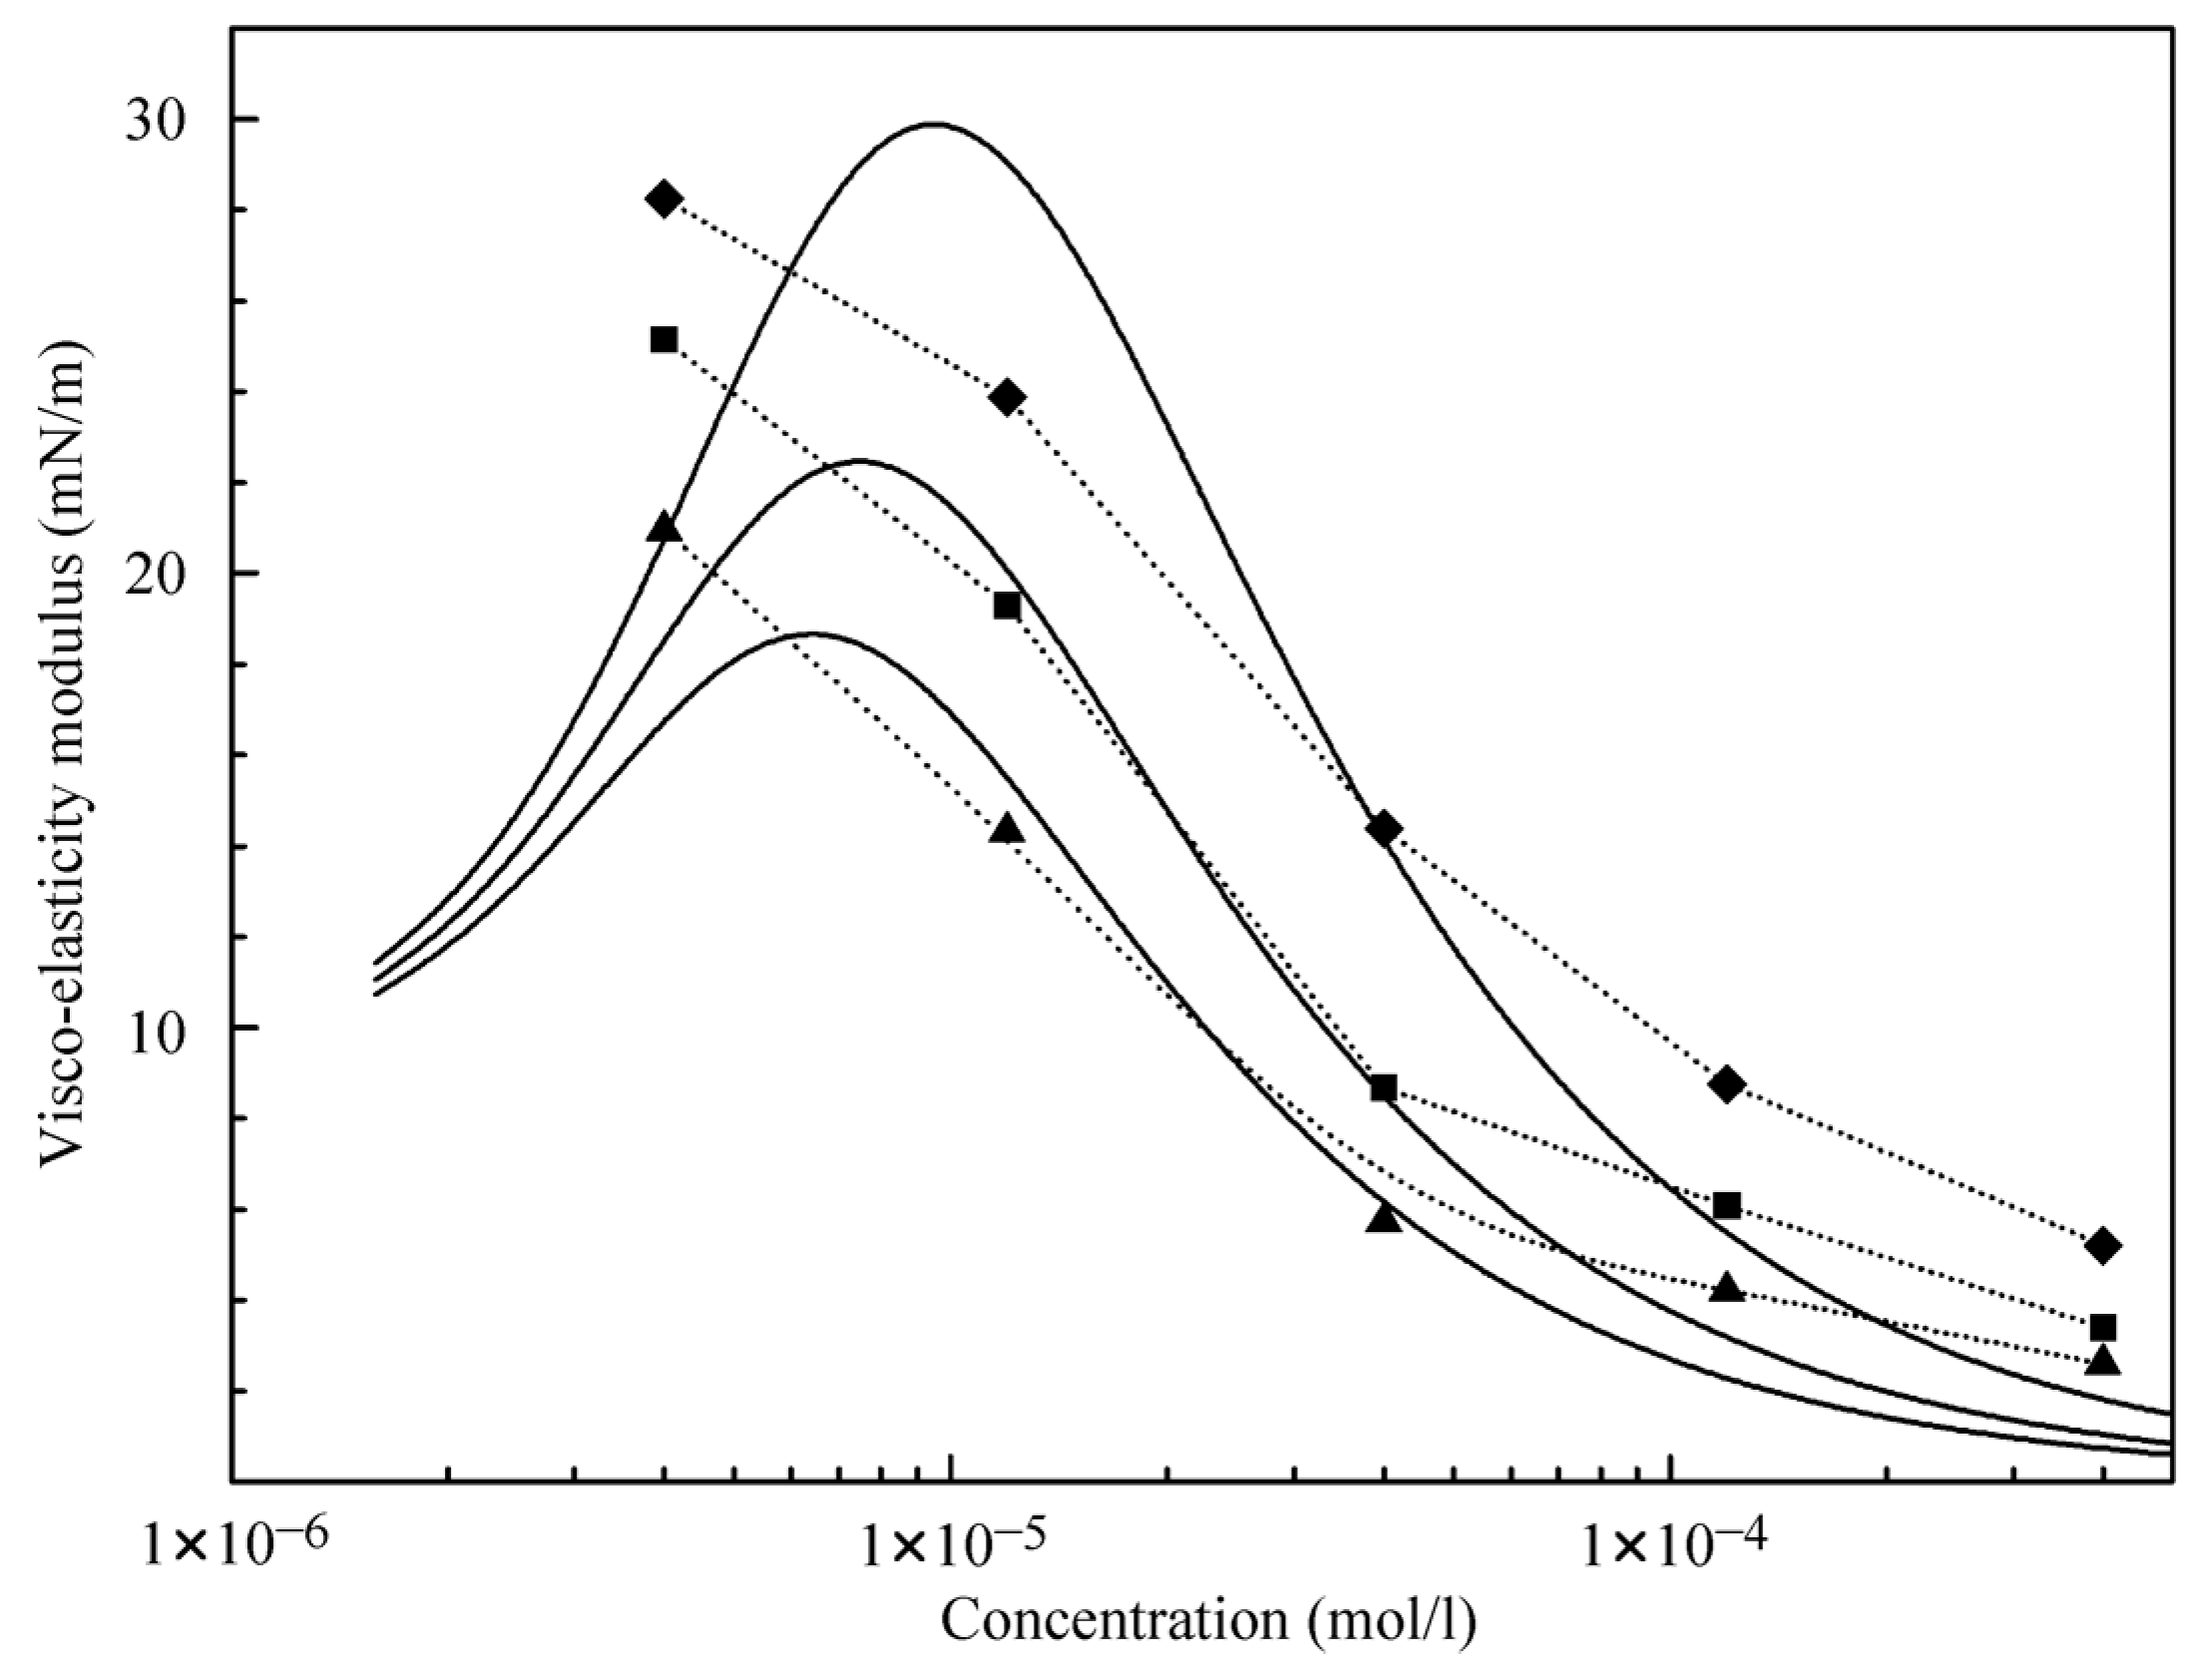
12DMPO concentrations above 1 μmol/L, the influence of decane adsorption is negligible. Therefore, in this concentration range, we can calculate the dilational visco-elasticity using equations valid for individual C
12DMPO solutions. Moreover, only the diffusion from the alkane drop could be taken into account, while the diffusion from the aqueous solution can also be neglected because the equilibrium concentration of surfactant in the alkane drop is essentially higher than that in the water phase. Moreover, the surfactant diffusion in the alkane is several times higher than in water. In
Figure 8, the experimental data are compared with the theoretical values calculated using a software elaborated in [
25], which assumed a four-fold concentration increase (K = 4) and a C
12DMPO diffusion coefficient of 10
−9 m
2/s. A rather moderate agreement between the calculated results and the experimental data is observed. Presently, an improved software is under development, which is capable of accounting for both the diffusion from the aqueous solution and the adsorption of alkane molecules.
