Development of Cu-Modified PVC and PU for Catalytic Generation of Nitric Oxide


Abstract
1. Introduction
2. Materials and Methods
2.1. Materials
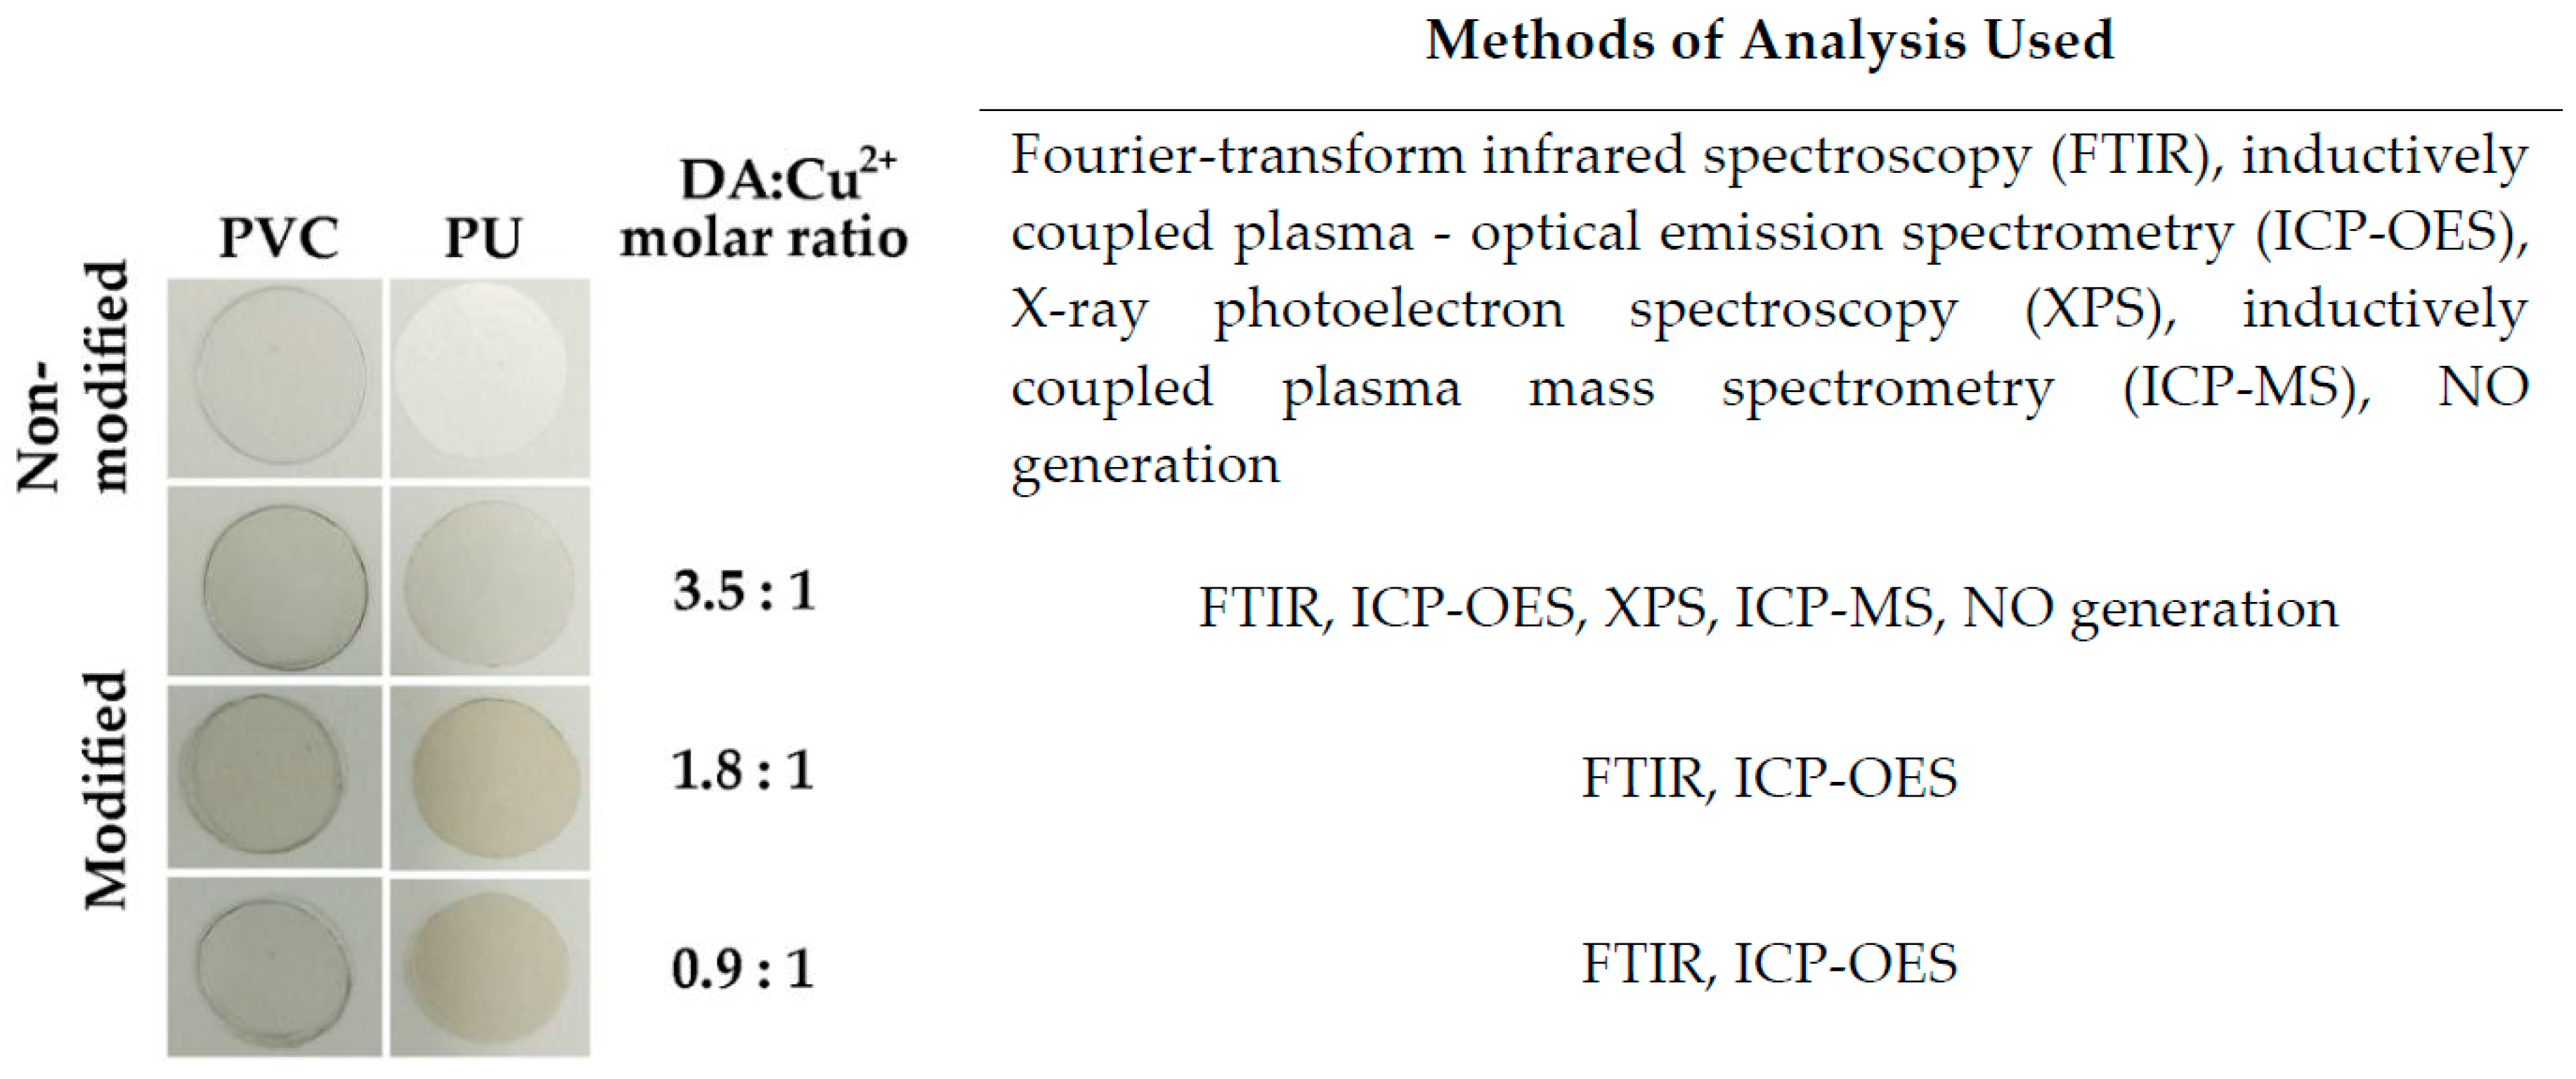
2.2. Method of Copper Immobilization
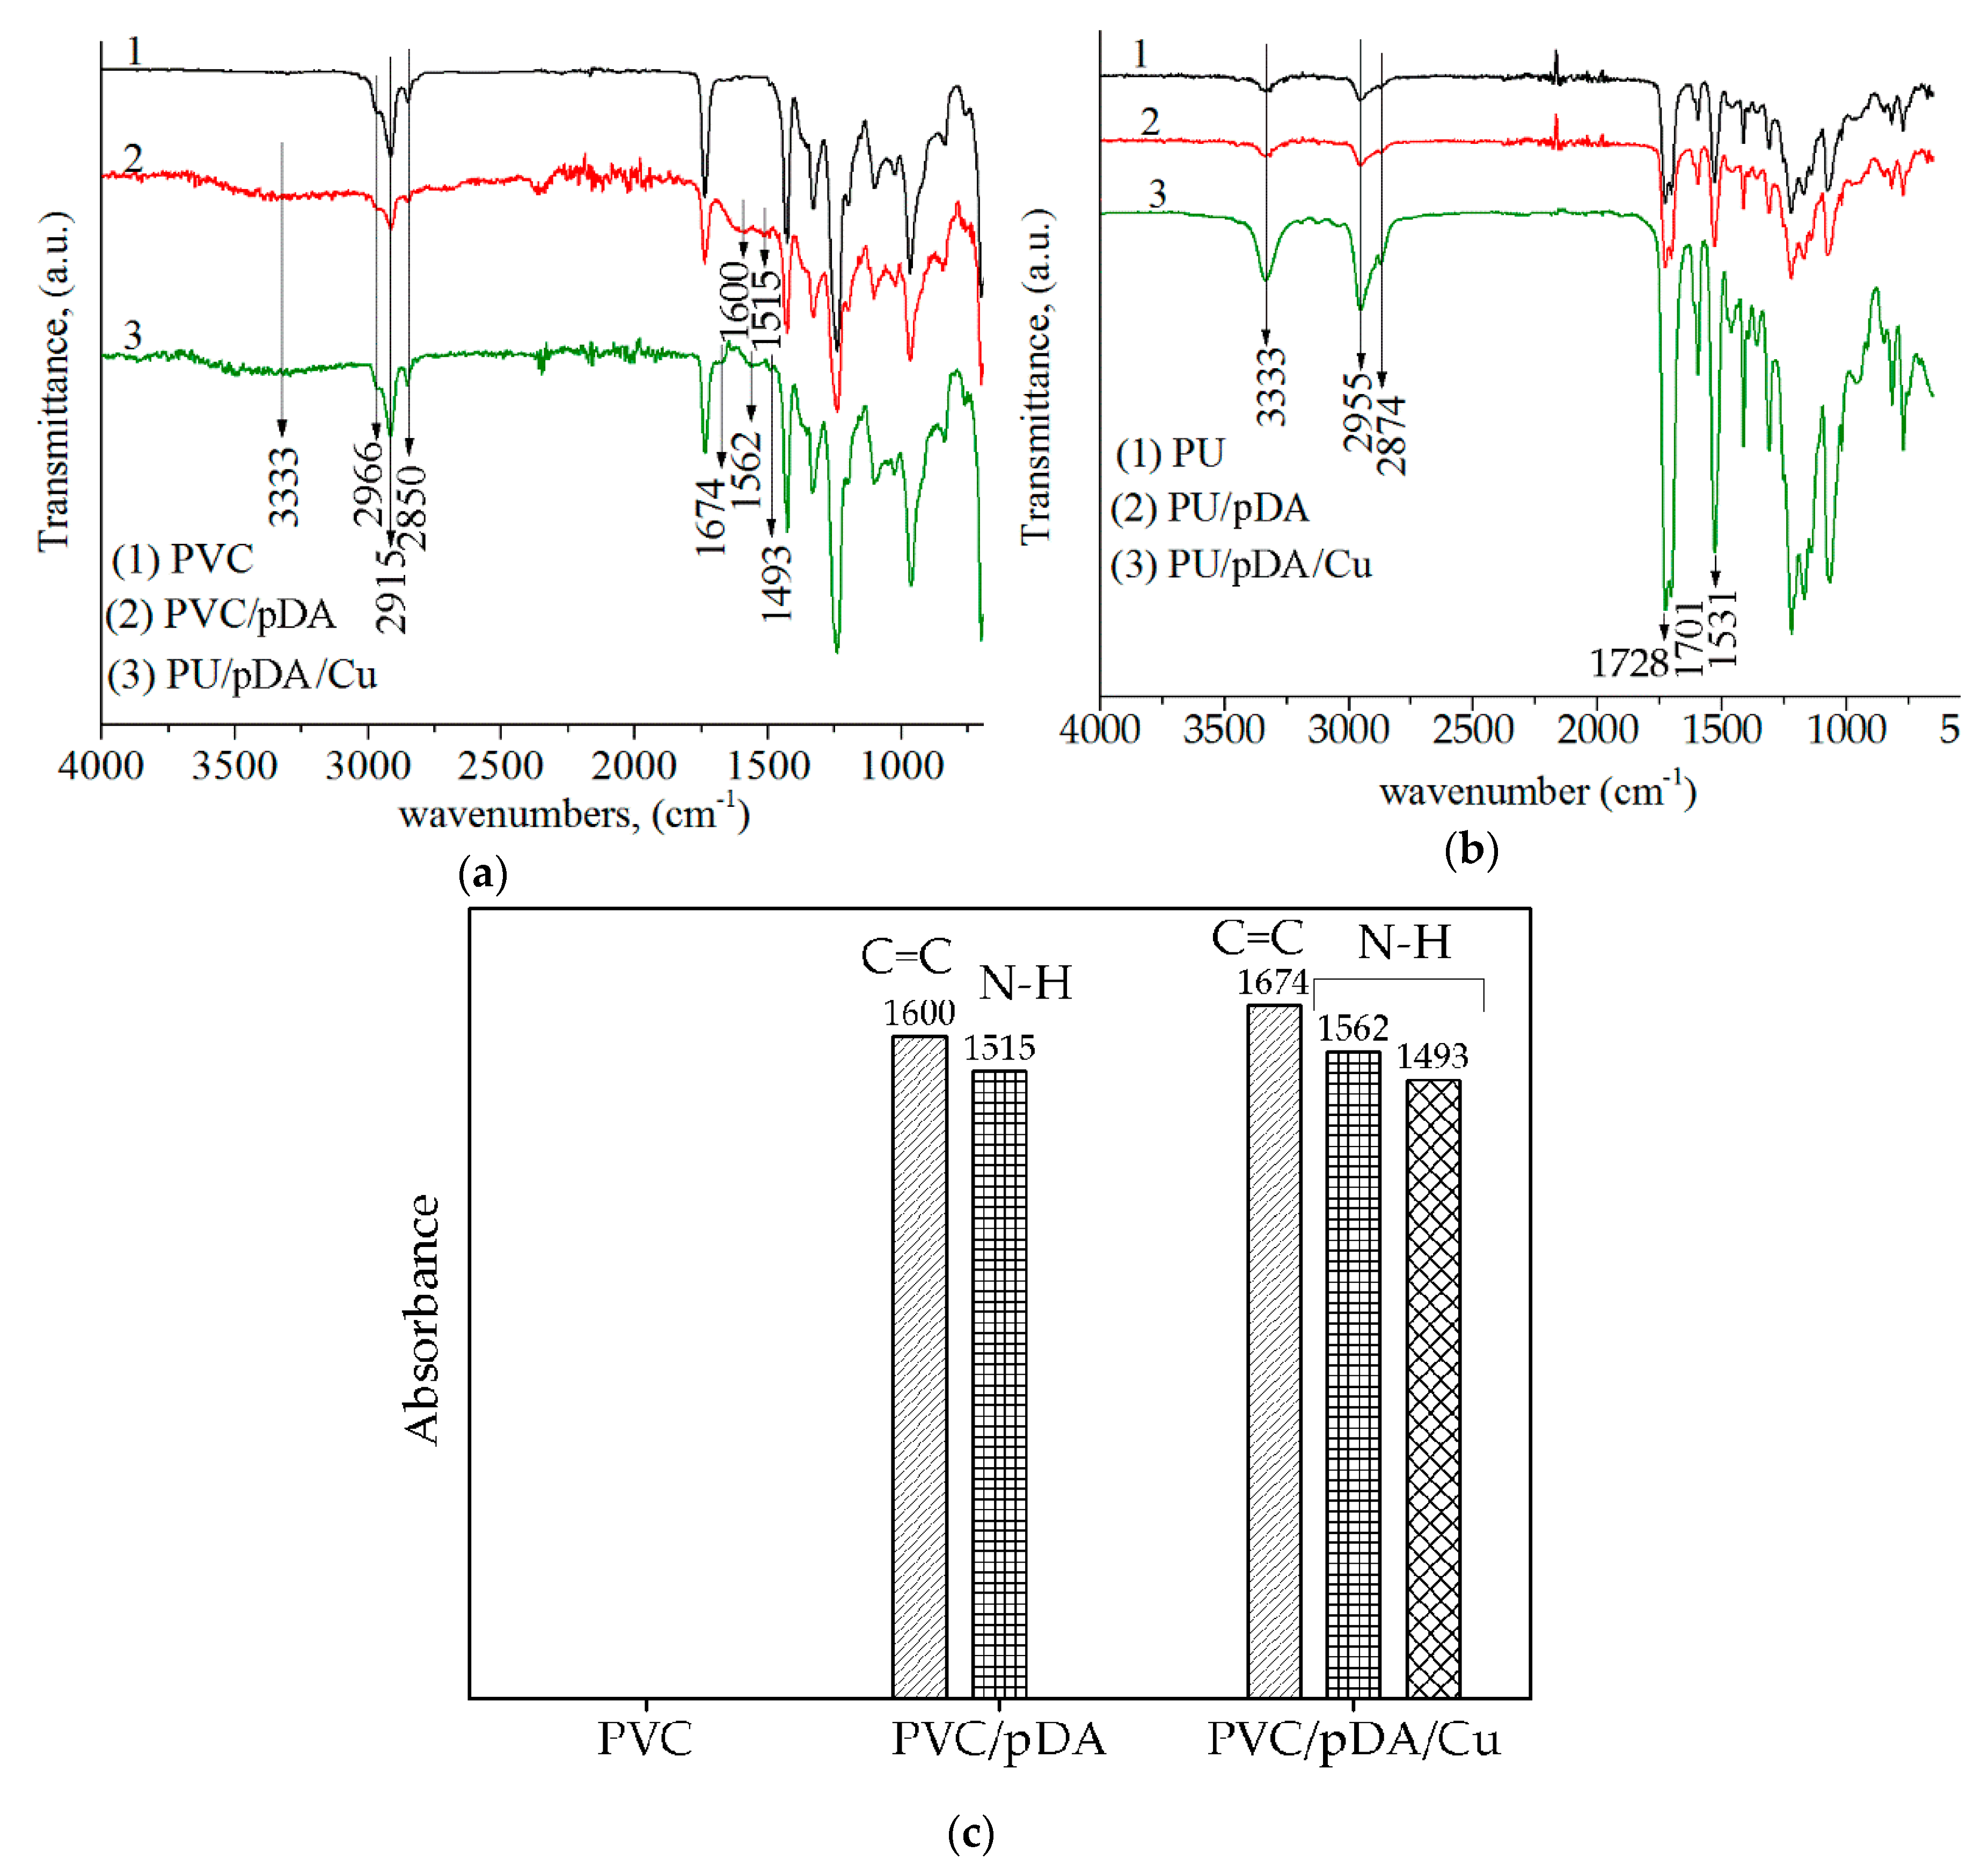
2.3. Fourier Transform Infrared Spectroscopy Method (FTIR) for Studying the Chemical Composition of Cu-Modified Polymers
2.4. Analysis of Copper Content by Inductively Coupled Plasma-Optical Emission Spectrometry (ICP-OES)
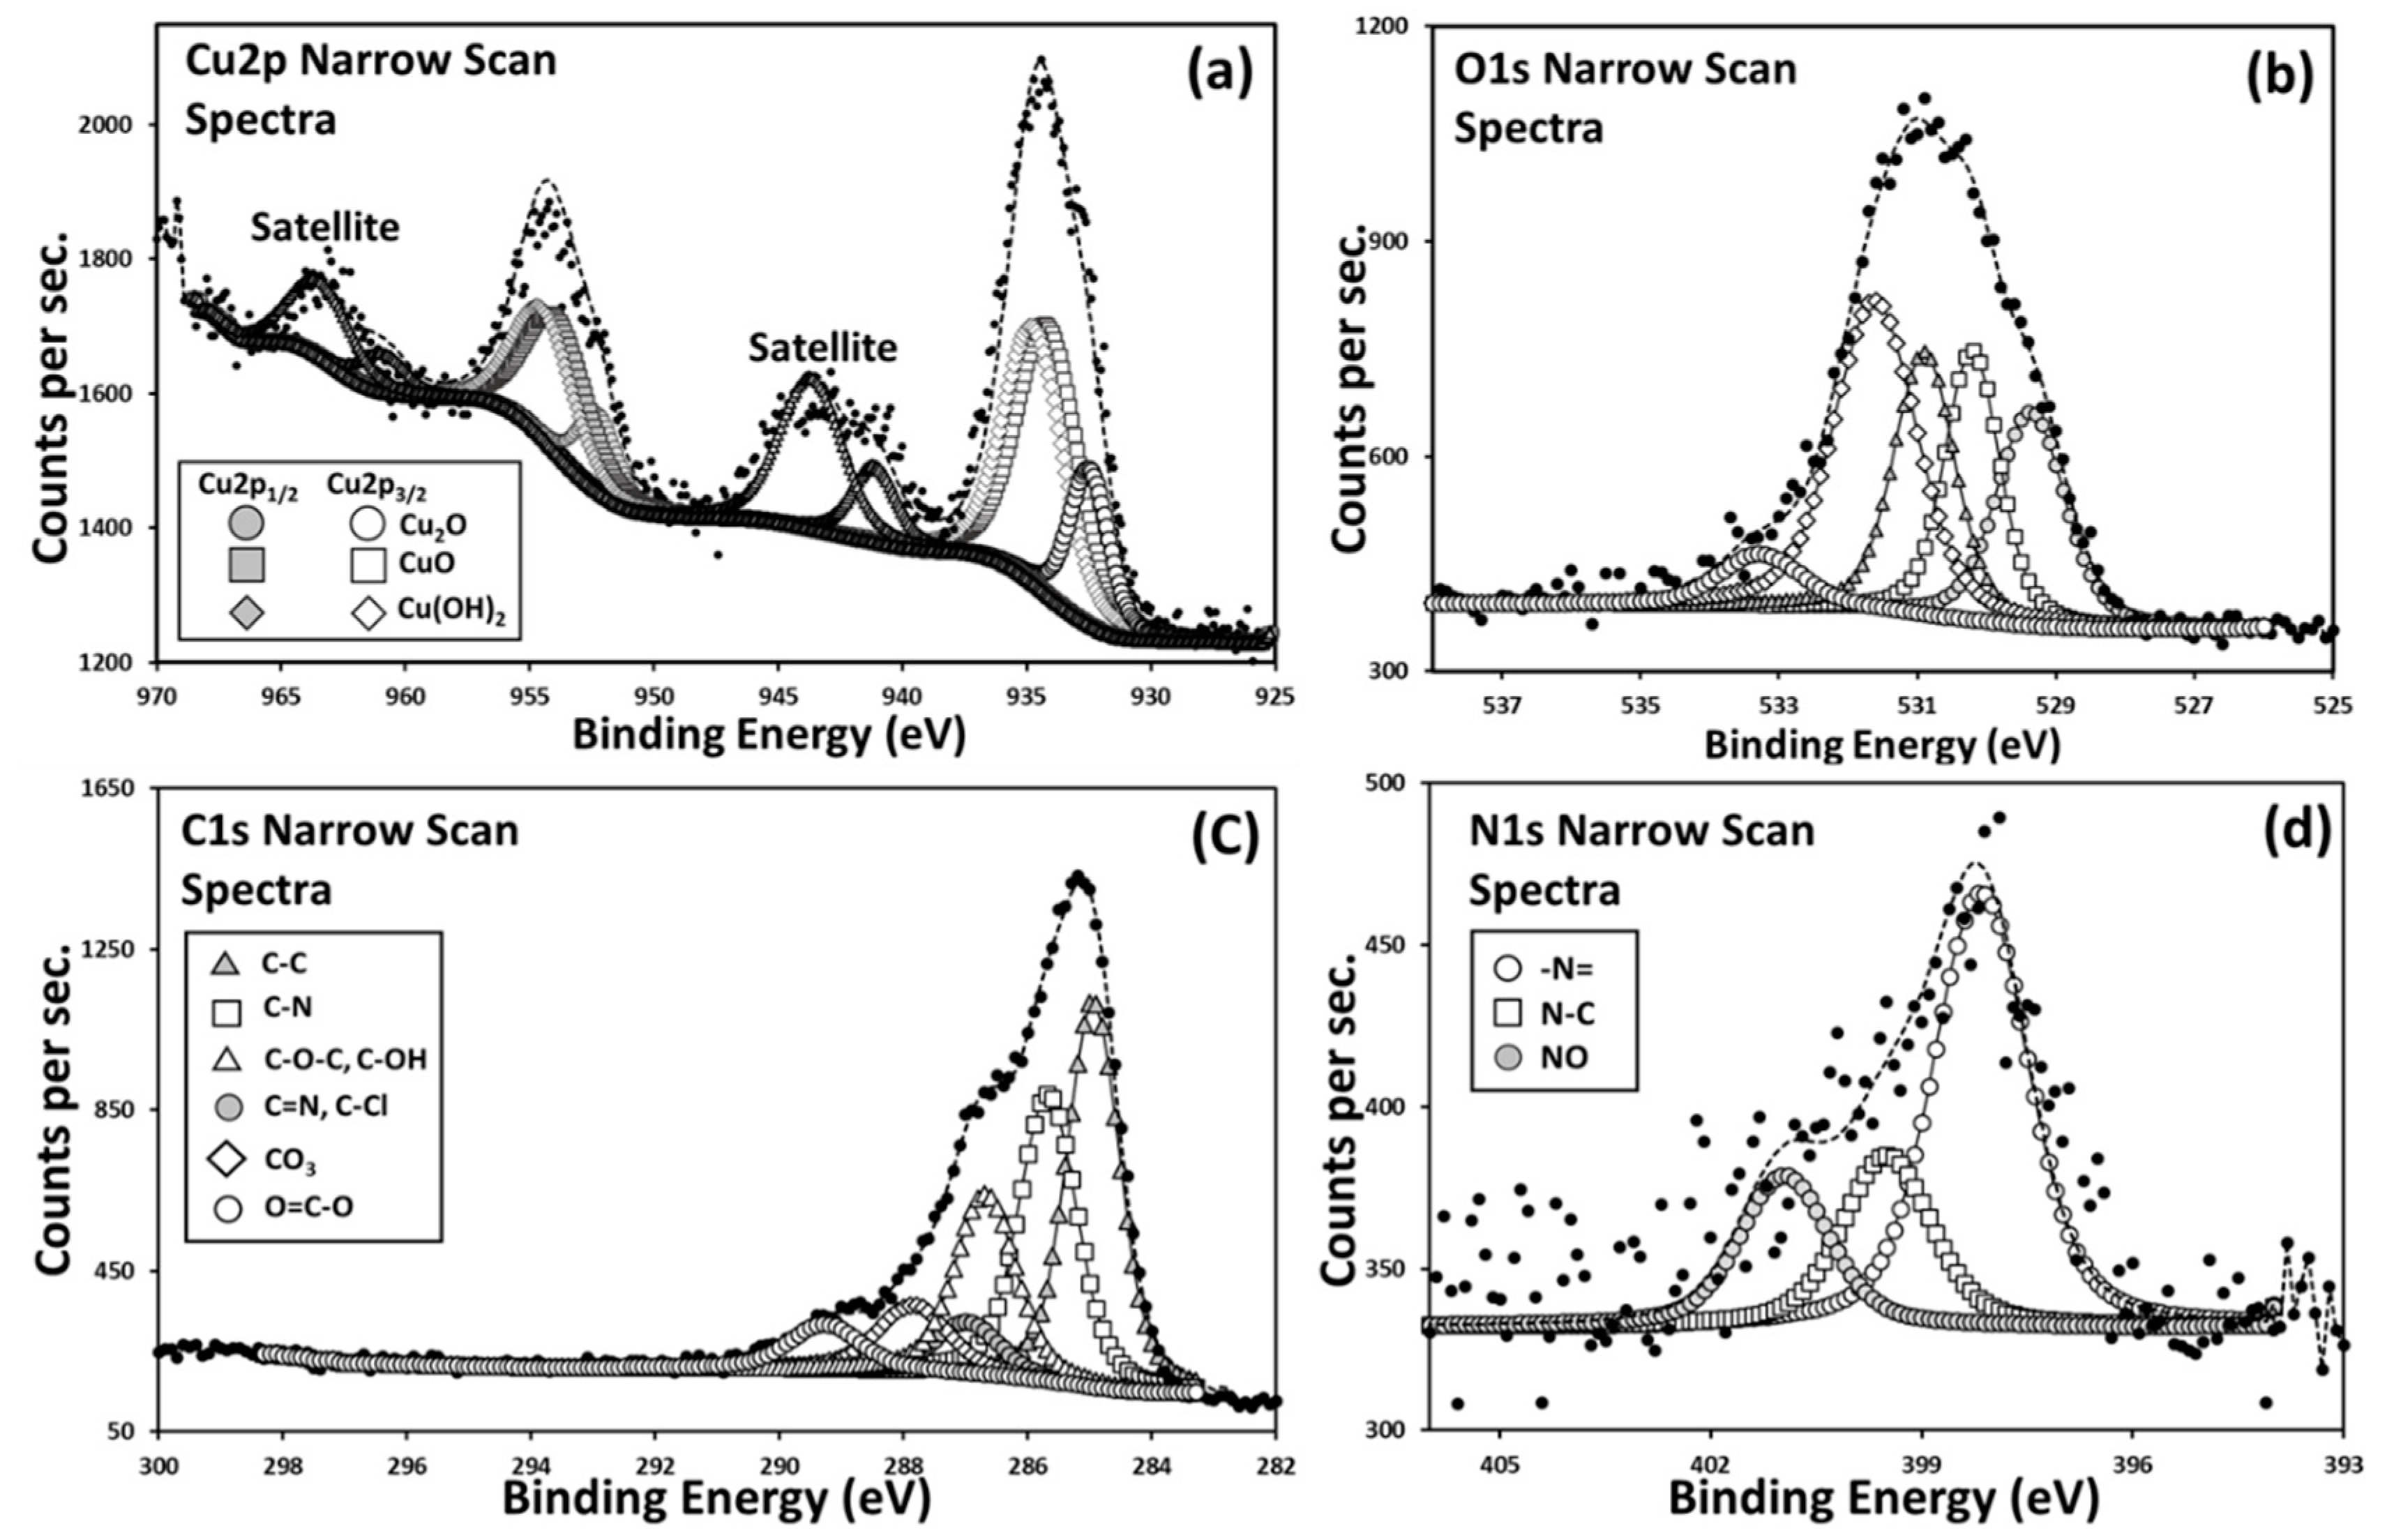
2.5. X-ray Photoelectron Spectroscopy (XPS) Analysis of the Chemical Composition of the Surface of Cu-Modified Polymeric Samples
2.6. Evaluation of Copper Leaching from Polymers Studied by Inductively Coupled Plasma-Mass Spectrometry (ICP-MS)
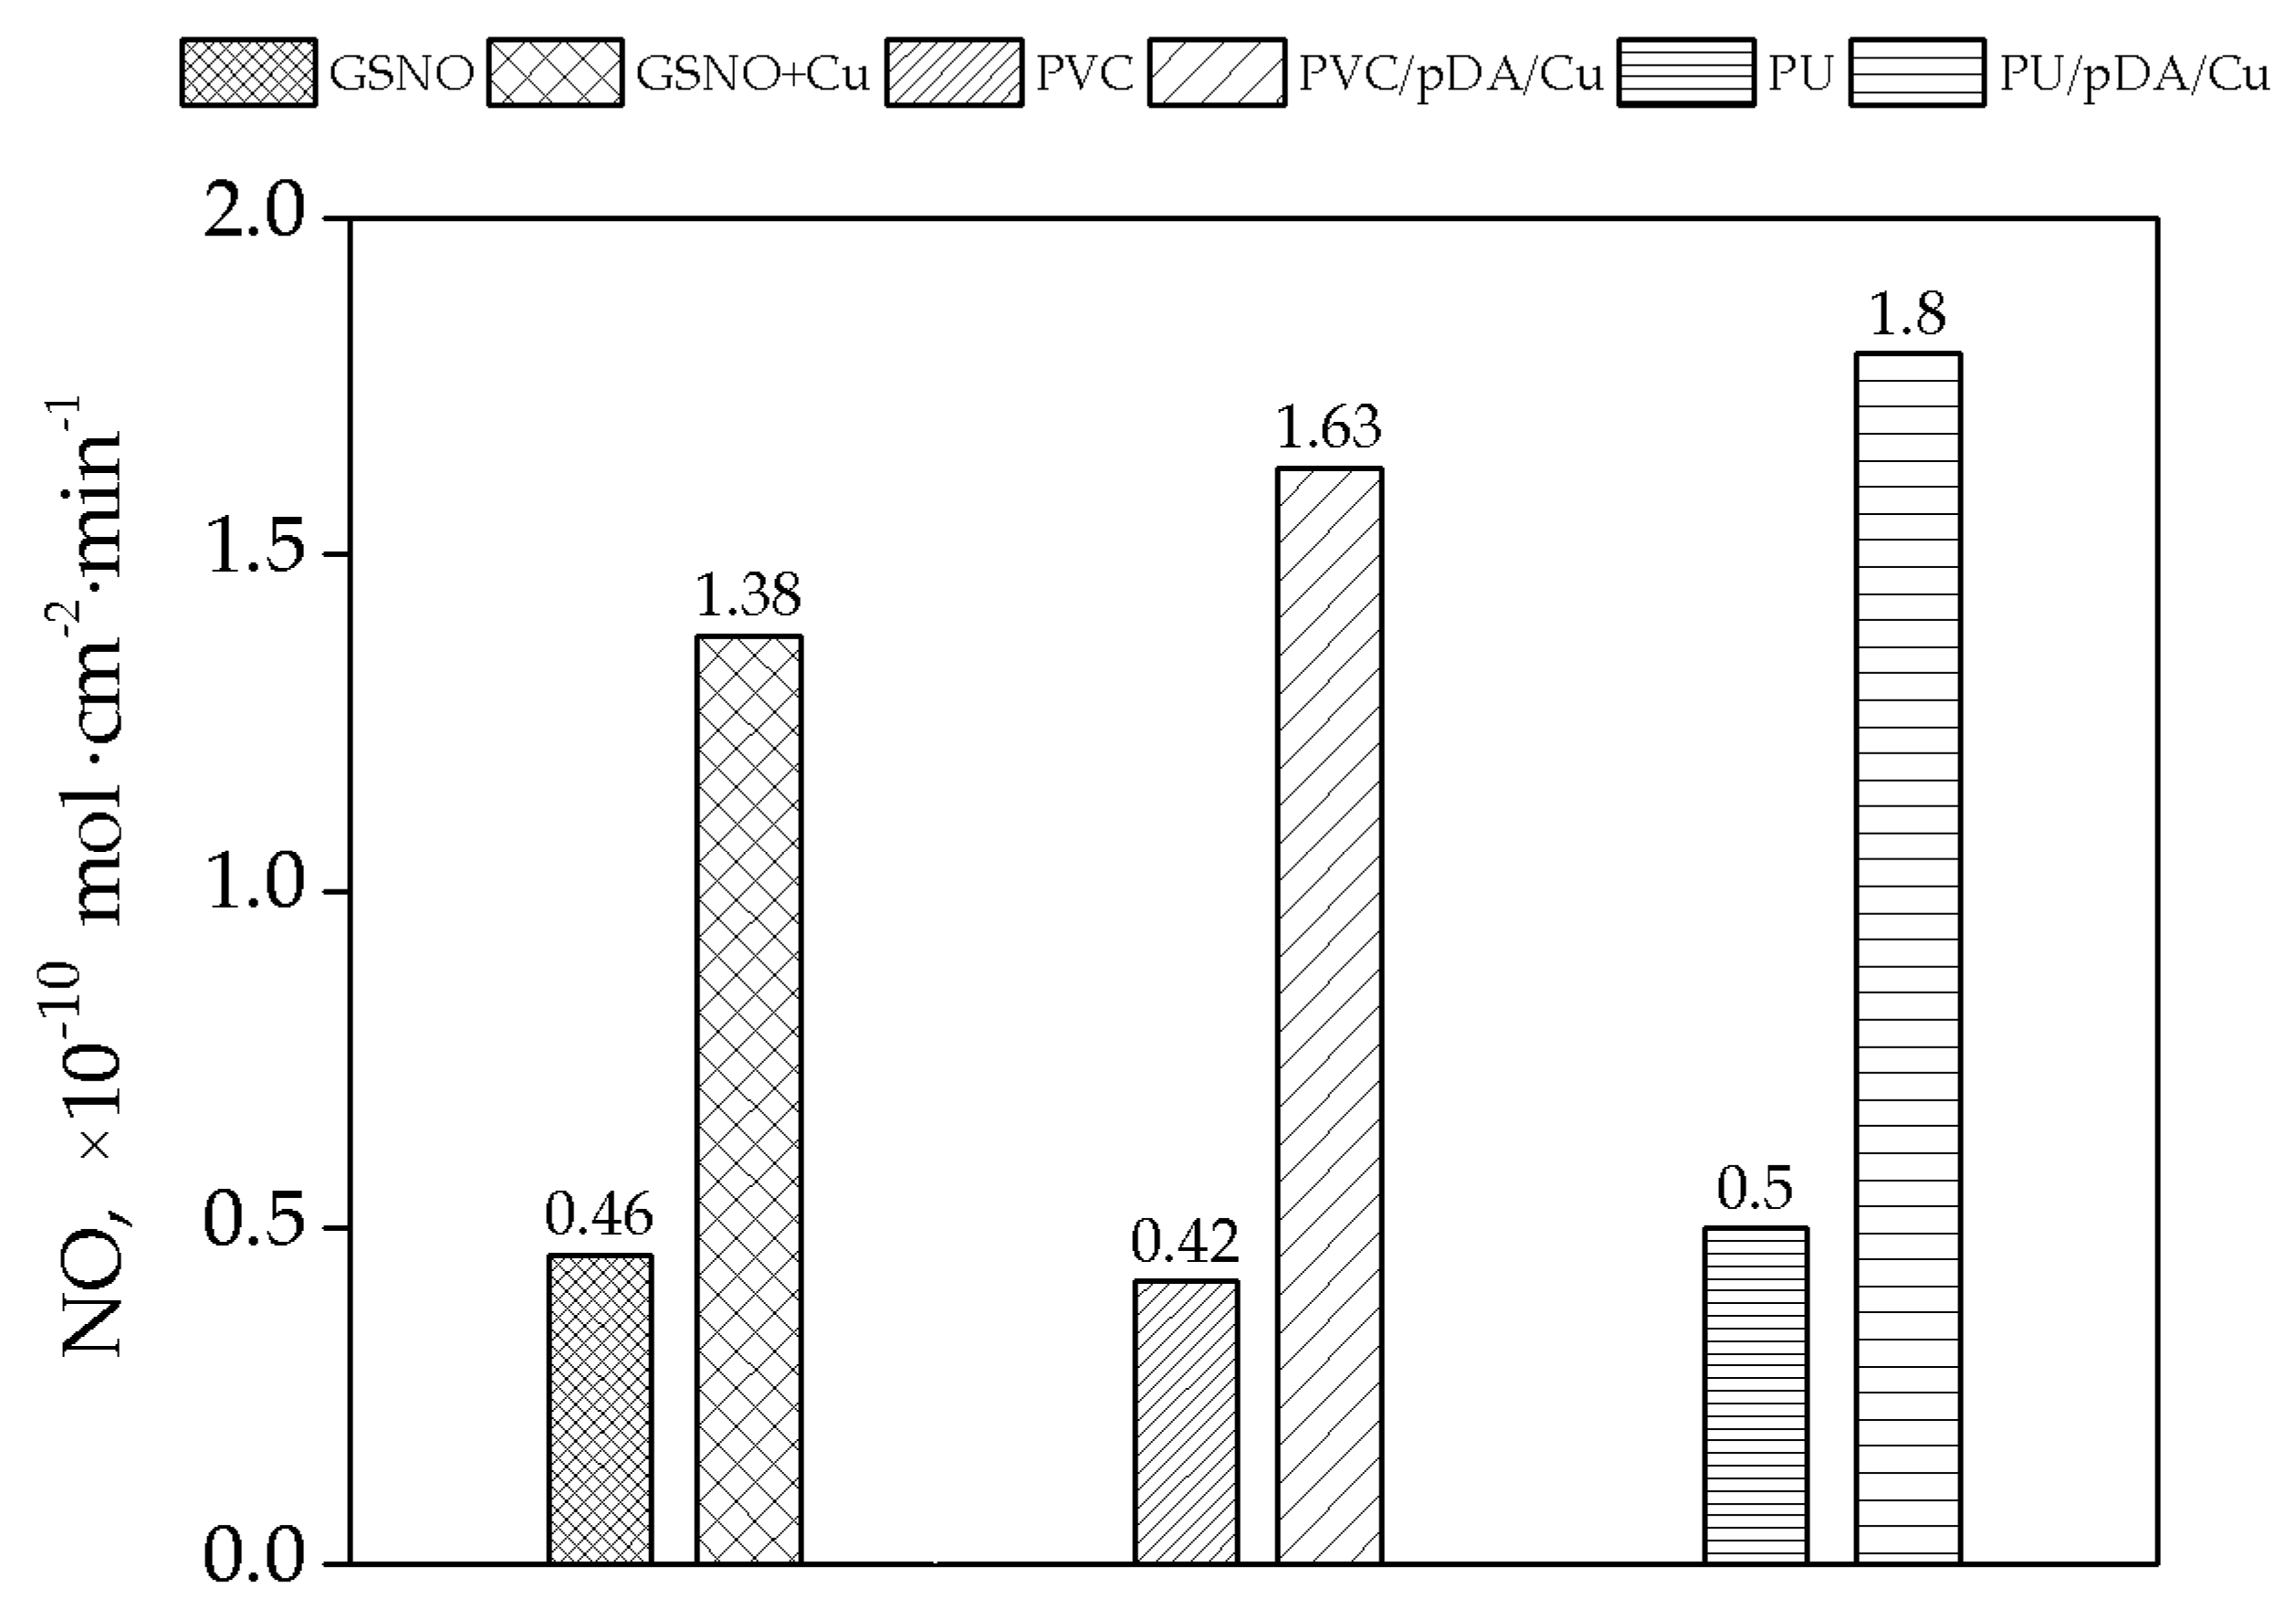
2.7. Nitric Oxide (NO) Release Measurements
3. Results and Discussion
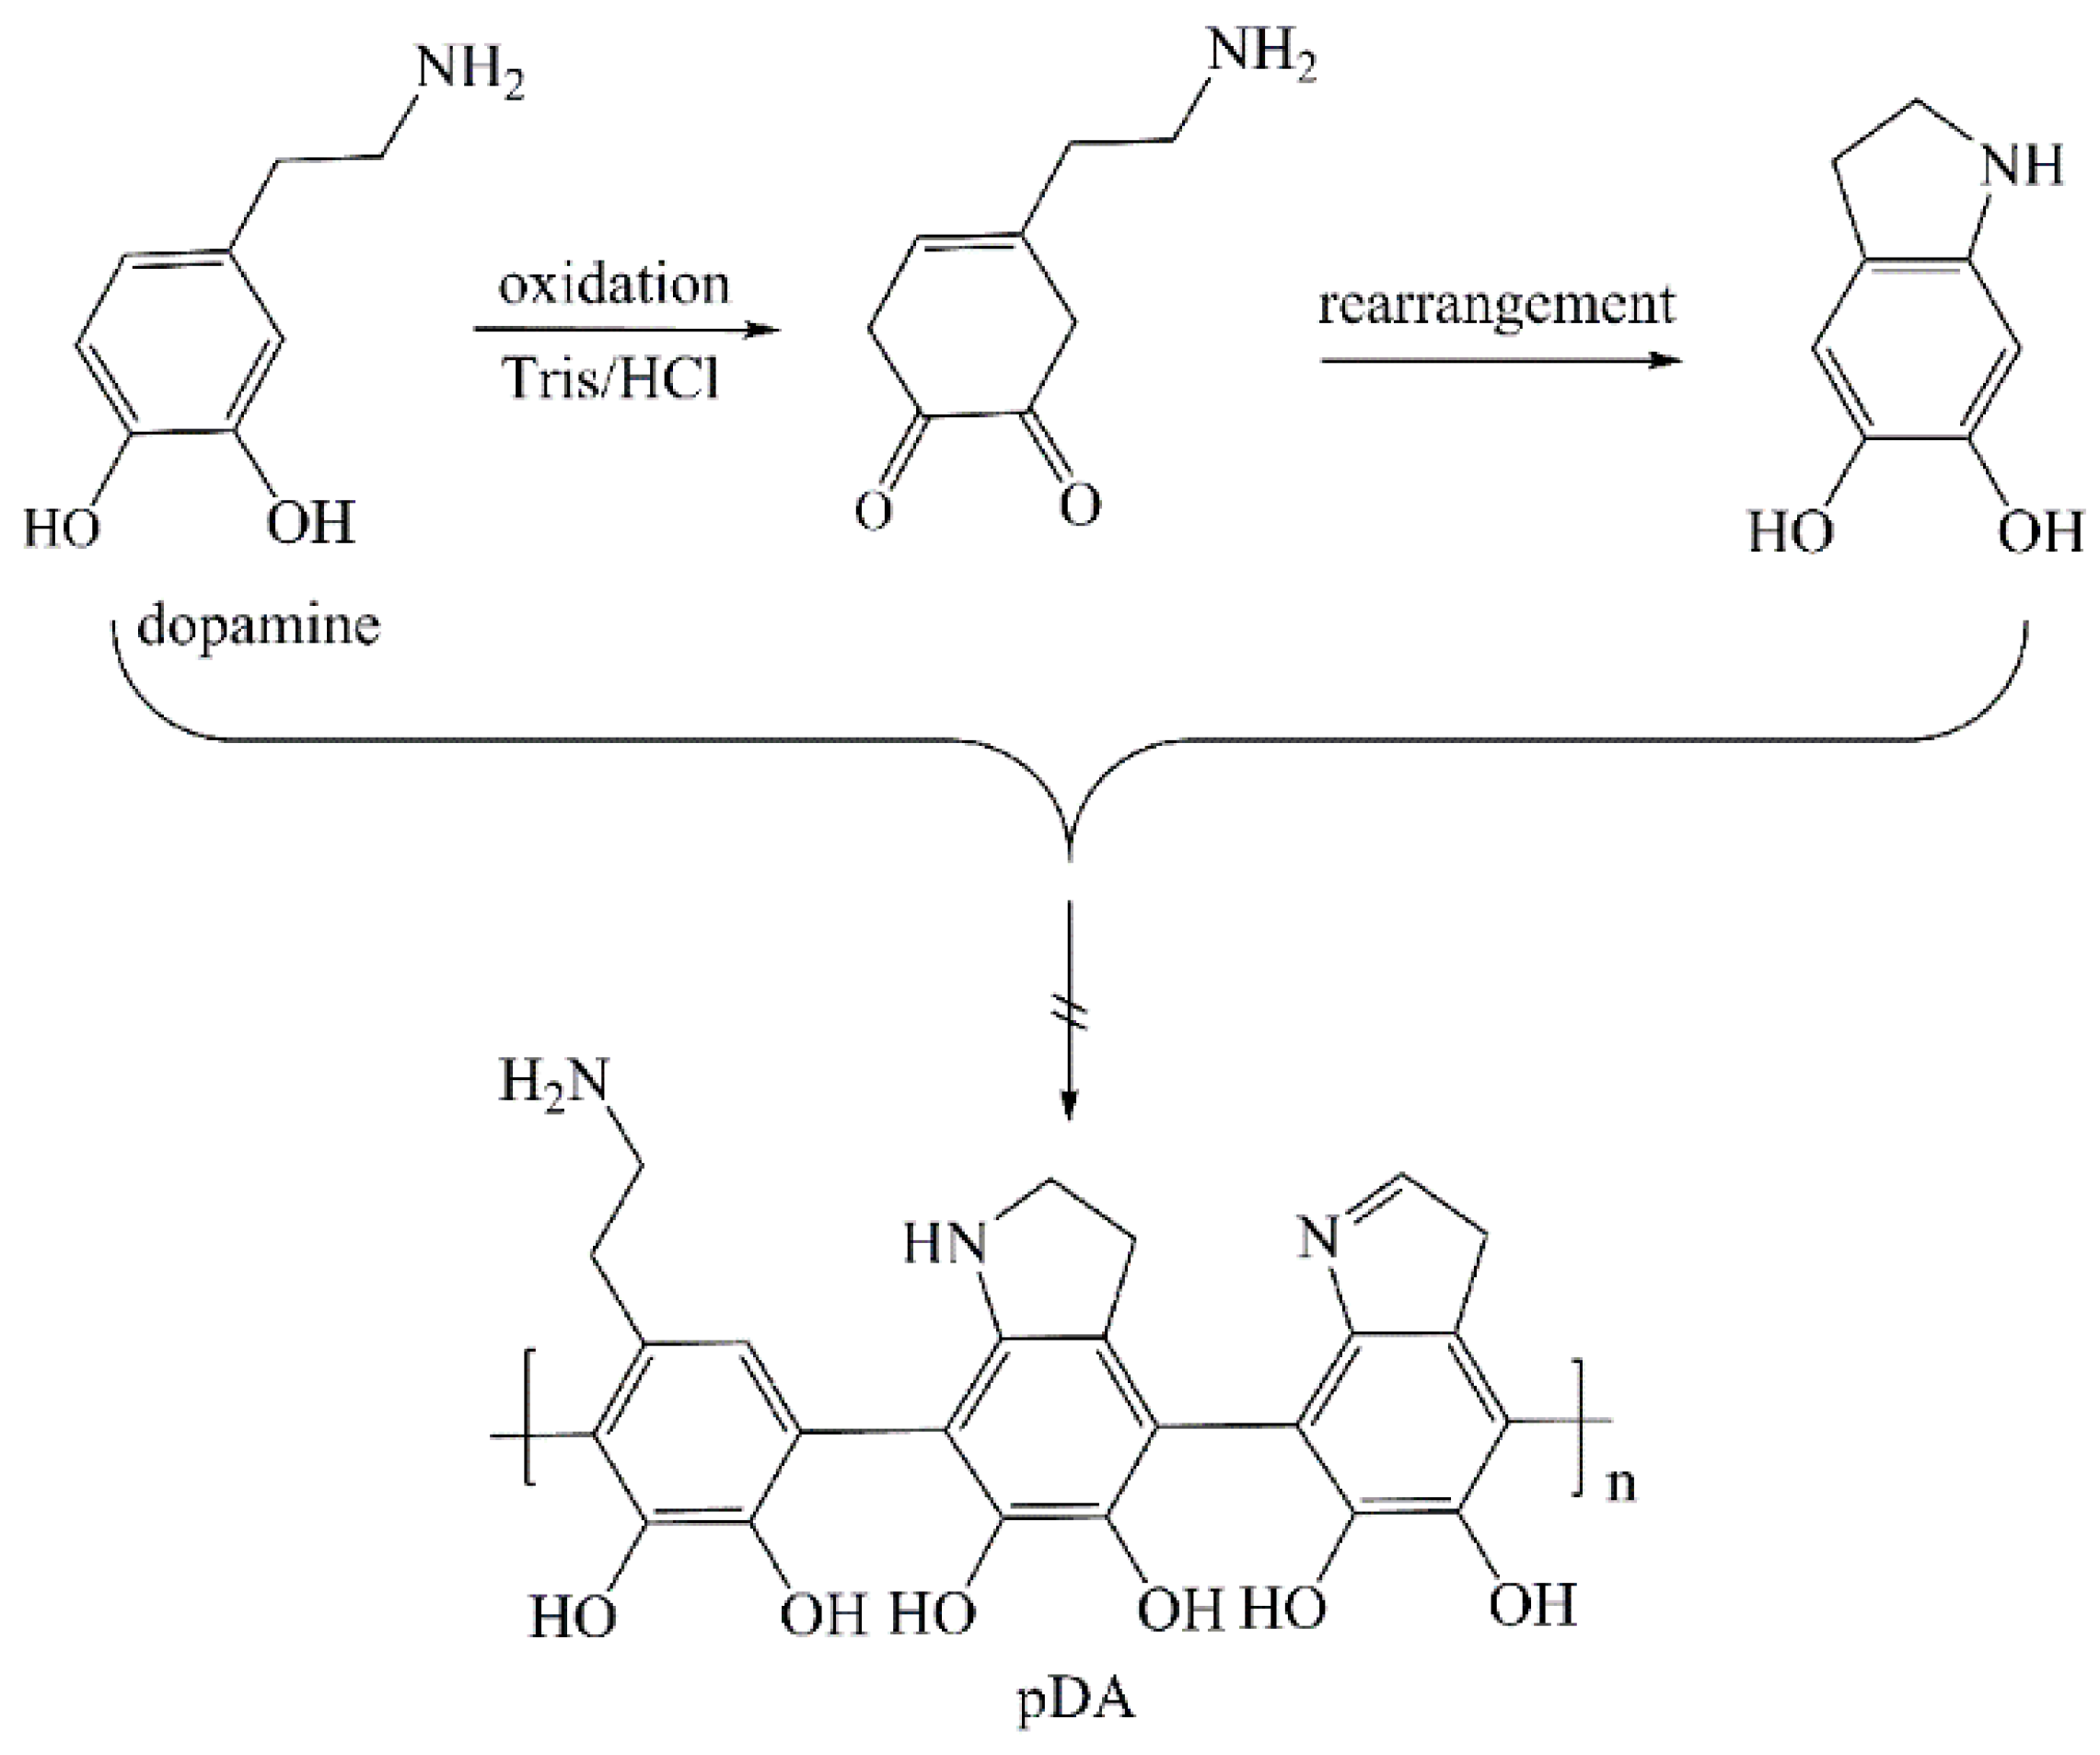
3.1. Chemical Structure of Cu-Modified Polymers
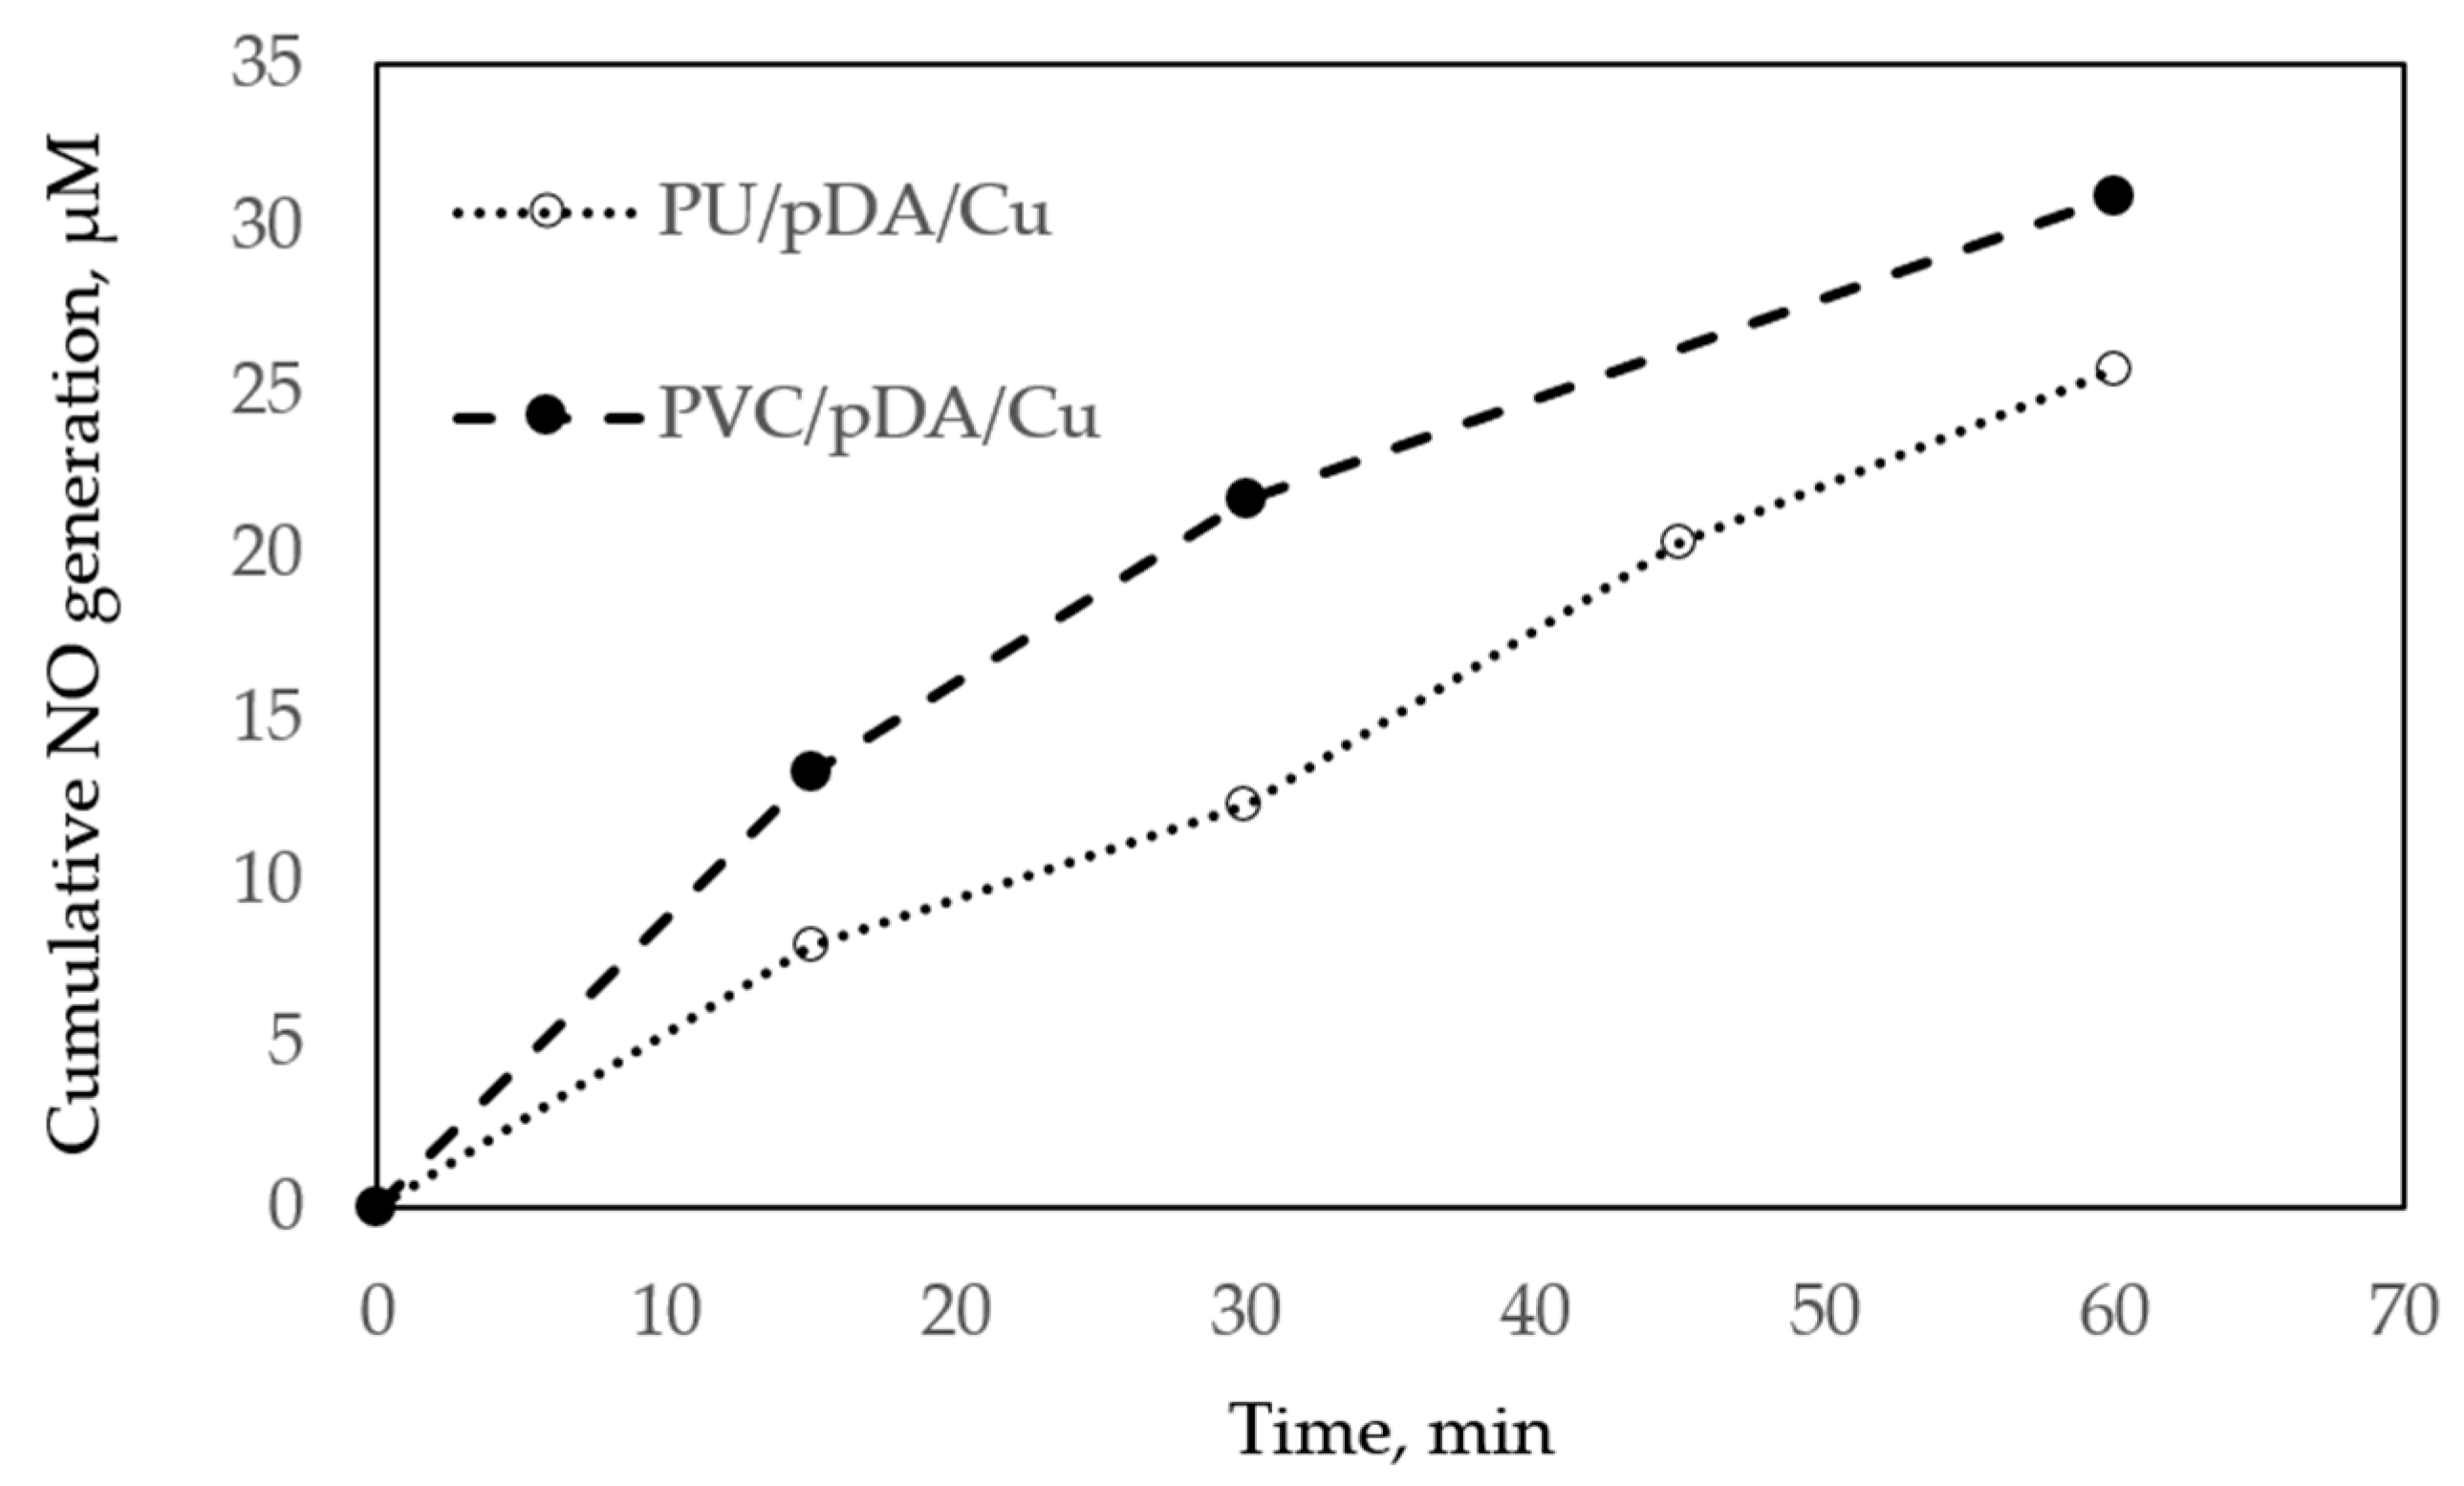
3.2. Measurement of NO Generation Catalyzed by Modified Materials
4. Conclusions
Supplementary Materials
Author Contributions
Funding
Acknowledgments
Conflicts of Interest
References
- Dumitriu, S. Polymeric Biomaterials, Revised and Expanded; CRC Press: Boca Raton, FL, USA, 2001. [Google Scholar]
- Bajpai, A.K.; Bajpai, J.; Saini, R.K.; Agrawal, P.; Tiwari, A. Smart Biomaterial Devices: Polymers in Biomedical Sciences; CRC Press: Boca Raton, FL, USA, 2016. [Google Scholar]
- Yang, Y.; Qi, P.K.; Yang, Z.L.; Huang, N. Nitric oxide based strategies for applications of biomedical devices. Biosurf. Biotribol. 2015, 1, 177–201. [Google Scholar] [CrossRef]
- de Mel, A.; Murad, F.; Seifalian, A.M. Nitric oxide: A guardian for vascular grafts? Chem. Rev. 2011, 111, 5742–5767. [Google Scholar] [CrossRef] [PubMed]
- Naghavi, N.; Mel, A.D.; Alavijeh, O.S.; Cousins, B.G.; Seifalian, A.M. Nitric oxide donors for cardiovascular implant applications. Small 2013, 9, 22–35. [Google Scholar] [CrossRef] [PubMed]
- Pant, J.; Goudie, M.J.; Hopkins, S.P.; Brisbois, E.J.; Handa, H. Tunable nitric oxide release from s-nitroso-n-acetylpenicillamine via catalytic copper nanoparticles for biomedical applications. ACS Appl. Mater. Interfaces 2017, 9, 15254–15264. [Google Scholar] [CrossRef]
- Wo, Y.; Brisbois, E.J.; Bartlett, R.H.; Meyerhoff, M.E. Recent advances in thromboresistant and antimicrobial polymers for biomedical applications: Just say yes to nitric oxide (no). Biomater. Sci. 2016, 4, 1161–1183. [Google Scholar] [CrossRef] [PubMed]
- Wu, H.; Ang, J.M.; Kong, J.; Zhao, C.; Du, Y.; Lu, X. One-pot synthesis of polydopamine–zn complex antifouling coatings on membranes for ultrafiltration under harsh conditions. RSC Advances 2016, 6, 103390–103398. [Google Scholar] [CrossRef]
- Damodaran, V.B.; Joslin, J.M.; Wold, K.A.; Lantvit, S.M.; Reynolds, M.M. S-nitrosated biodegradable polymers for biomedical applications: Synthesis, characterization and impact of thiol structure on the physicochemical properties. J. Mater. Chem. 2012, 22, 5990–6001. [Google Scholar] [CrossRef]
- Riccio, D.A.; Schoenfisch, M.H. Nitric oxide release: Part I. Macromolecular scaffolds. Chem. Soc. Rev. 2012, 41, 3731–3741. [Google Scholar] [CrossRef]
- Seabra, A.B.; Marcato, P.D.; de Paula, L.B.; Durán, N. New strategy for controlled release of nitric oxide. J. Nano Res. 2012, 20, 61–67. [Google Scholar] [CrossRef]
- Kim, J.; Saravanakumar, G.; Choi, H.W.; Park, D.; Kim, W.J. A platform for nitric oxide delivery. J. Mater. Chem. B 2014, 2, 341–356. [Google Scholar] [CrossRef]
- Dicks, A.P.; Swift, H.R.; Williams, D.L.H.; Butler, A.R.; Al-Sa’doni, H.H.; Cox, B.G. Identification of cu+ as the effective reagent in nitric oxide formation from s-nitrosothiols (rsno). J. Chem. Soc. Perkin Trans. 2 1996, 481–487. [Google Scholar] [CrossRef]
- Puiu, S.C.; Zhou, Z.; White, C.C.; Neubauer, L.J.; Zhang, Z.; Lange, L.E.; Mansfield, J.A.; Meyerhoff , M.E.; Reynolds, M.M. Metal ion-mediated nitric oxide generation from polyurethanes via covalently linked copper(ii)-cyclen moieties. J. Biomed. Mater. Res. Part B Appl. Biomater. 2009, 91, 203–212. [Google Scholar] [CrossRef] [PubMed]
- Hwang, S.; Meyerhoff, M.E. Polyurethane with tethered copper(ii)–cyclen complex: Preparation, characterization and catalytic generation of nitric oxide from s-nitrosothiols. Biomaterials 2008, 29, 2443–2452. [Google Scholar] [CrossRef] [PubMed]
- Luo, R.; Liu, Y.; Yao, H.; Jiang, L.; Wang, J.; Weng, Y.; Zhao, A.; Huang, N. Copper-incorporated collagen/catechol film for in situ generation of nitric oxide. ACS Biomater. Sci. Eng. 2015, 1, 771–779. [Google Scholar] [CrossRef]
- Neufeld, M.J.; Lutzke, A.; Jones, W.M.; Reynolds, M.M. Nitric oxide generation from endogenous substrates using metal–organic frameworks: Inclusion within poly(vinyl alcohol) membranes to investigate reactivity and therapeutic potential. ACS Appl. Mater. Interfaces 2017, 9, 35628–35641. [Google Scholar] [CrossRef] [PubMed]
- Oh, B.K.; Meyerhoff, M.E. Spontaneous catalytic generation of nitric oxide from s-nitrosothiols at the surface of polymer films doped with lipophilic copper(ii) complex. J. Am. Chem. Soc. 2003, 125, 9552–9553. [Google Scholar] [CrossRef]
- Nagababu, E.; Rifkind, J.M. Routes for formation of s-nitrosothiols in blood. Cell Biochem. Biophys. 2013, 67, 385–398. [Google Scholar] [CrossRef]
- Zhang, Y.; Hogg, N. S-nitrosothiols: Cellular formation and transport. Free Radic. Biol. Med. 2005, 38, 831–838. [Google Scholar] [CrossRef]
- Vanin, A.F.; Papina, A.A.; Serezhenkov, V.A.; Koppenol, W.H. The mechanisms of s-nitrosothiol decomposition catalyzed by iron. Nitric Oxide 2004, 10, 60–73. [Google Scholar] [CrossRef]
- Peaston, R.T.; Weinkove, C. Measurement of catecholamines and their metabolites. Ann. Clin. Biochem. 2004, 41, 17–38. [Google Scholar] [CrossRef]
- Liu, Y.; Ai, K.; Lu, L. Polydopamine and its derivative materials: Synthesis and promising applications in energy, environmental, and biomedical fields. Chem. Rev. 2014, 114, 5057–5115. [Google Scholar] [CrossRef] [PubMed]
- Zhang, C.; Gong, L.; Xiang, L.; Du, Y.; Hu, W.; Zeng, H.; Xu, Z.-K. Deposition and adhesion of polydopamine on the surfaces of varying wettability. ACS Appl. Mater. Interfaces 2017, 9, 30943–30950. [Google Scholar] [CrossRef] [PubMed]
- Mrówczyński, R.; Markiewicz, R.; Liebscher, J. Chemistry of polydopamine analogues. Polym. Int. 2016, 65, 1288–1299. [Google Scholar] [CrossRef]
- Saiz-Poseu, J.; Mancebo-Aracil, J.; Nador, F.; Busqué, F.; Ruiz-Molina, D. The chemistry behind catechol-based adhesion. Angew. Chem. Int. Ed. 2019, 58, 696–714. [Google Scholar] [CrossRef]
- Ding, Y.H.; Floren, M.; Tan, W. Mussel-inspired polydopamine for bio-surface functionalization. Biosurf. Biotribol. 2016, 2, 121–136. [Google Scholar] [CrossRef]
- Huang, N.; Zhang, S.; Yang, L.; Liu, M.; Li, H.; Zhang, Y.; Yao, S. Multifunctional electrochemical platforms based on the michael addition/schiff base reaction of polydopamine modified reduced graphene oxide: Construction and application. ACS Appl. Mater. Interfaces 2015, 7, 17935–17946. [Google Scholar] [CrossRef]
- Liebscher, J.; Mrówczyński, R.; Scheidt, H.A.; Filip, C.; Hădade, N.D.; Turcu, R.; Bende, A.; Beck, S. Structure of polydopamine: A never-ending story? Langmuir 2013, 29, 10539–10548. [Google Scholar] [CrossRef]
- Ryu, J.H.; Messersmith, P.B.; Lee, H. Polydopamine surface chemistry: A decade of discovery. ACS Appl. Mater. Interfaces 2018, 10, 7523–7540. [Google Scholar] [CrossRef]
- Dreyer, D.R.; Miller, D.J.; Freeman, B.D.; Paul, D.R.; Bielawski, C.W. Elucidating the structure of poly(dopamine). Langmuir 2012, 28, 6428–6435. [Google Scholar] [CrossRef]
- Szpoganicz, B.; Gidanian, S.; Kong, P.; Farmer, P. Metal binding by melanins: Studies of colloidal dihydroxyindole-melanin, and its complexation by cu(ii) and zn(ii) ions. J. Inorg. Biochem. 2002, 89, 45–53. [Google Scholar] [CrossRef]
- Wang, Z.; Xie, Y.; Li, Y.; Huang, Y.; Parent, L.R.; Ditri, T.; Zang, N.; Rinehart, J.D.; Gianneschi, N.C. Tunable, metal-loaded polydopamine nanoparticles analyzed by magnetometry. Chem. Mater. 2017, 29, 8195–8201. [Google Scholar] [CrossRef]
- Zangmeister, R.A.; Morris, T.A.; Tarlov, M.J. Characterization of polydopamine thin films deposited at short times by autoxidation of dopamine. Langmuir 2013, 29, 8619–8628. [Google Scholar] [CrossRef]
- Zhang, C.; Biggs, T.D.; Devarie-Baez, N.O.; Shuang, S.; Dong, C.; Xian, M. S-nitrosothiols: Chemistry and reactions. Chem. Commun. 2017, 53, 11266–11277. [Google Scholar] [CrossRef] [PubMed]
- Sever, M.J.; Weisser, J.T.; Monahan, J.; Srinivasan, S.; Wilker, J.J. Metal-mediated cross-linking in the generation of a marine-mussel adhesive. Angew. Chem. Int. Ed. 2004, 43, 448–450. [Google Scholar] [CrossRef] [PubMed]
- Brown, D.G.; Hughes, W.J.; Knerr, G. Electronic and x-ray photoelectron spectra of copper catecholate complexes. Inorg. Chim. Acta 1980, 46, 123–126. [Google Scholar] [CrossRef]
- Liu, Z.; Hu, Y.; Liu, C.; Zhou, Z. Surface-independent one-pot chelation of copper ions onto filtration membranes to provide antibacterial properties. Chem. Commun. 2016, 52, 12245–12248. [Google Scholar] [CrossRef] [PubMed]
- Ye, W.; Shi, X.; Su, J.; Chen, Y.; Fu, J.; Zhao, X.; Zhou, F.; Wang, C.; Xue, D. One-step reduction and functionalization protocol to synthesize polydopamine wrapping ag/graphene hybrid for efficient oxidation of hydroquinone to benzoquinone. Appl. Catal. B Environ. 2014, 160–161, 400–407. [Google Scholar] [CrossRef]
- Brewer, G.J. Wilson’s disease. In Harrison’s Principles of Internal Medicine, 18th ed.; Longo, D., Fauci, A., Kasper, D., Hauser, S., Jameson, J., Loscalzo, J., Eds.; McGraw-Hill Education: New York, NY, USA, 2011; pp. 3188–3190. [Google Scholar]
- Valodkar, M.; Rathore, P.S.; Jadeja, R.N.; Thounaojam, M.; Devkar, R.V.; Thakore, S. Cytotoxicity evaluation and antimicrobial studies of starch capped water soluble copper nanoparticles. J. Hazard. Mater. 2012, 201–202, 244–249. [Google Scholar] [CrossRef]
- Singh, S.P.; Wishnok, J.S.; Keshive, M.; Deen, W.M.; Tannenbaum, S.R. The chemistry of the s-nitrosoglutathione/glutathione system. Proc. Natl. Acad. Sci. USA 1996, 93, 14428–14433. [Google Scholar] [CrossRef]


| Sample | Cu, nmol cm−2 | DA: Cu2+ Molar Ratio |
|---|---|---|
| PVC/pDA/Cu | 3.86 ± 0.30 | 3.5:1 |
| PVC/pDA/Cu | 1.35 ± 0.28 | 1.8:1 |
| PVC/pDA/Cu | 0.96 ± 0.30 | 0.9:1 |
| PU/pDA/Cu | 6.04 ± 0.17 | 3.5:1 |
| PU/pDA/Cu | 1.97 ± 0.42 | 1.8:1 |
| PU/pDA/Cu | 1.4 ± 0.70 | 0.9:1 |
| PVC/pDA/Cu | PU/pDA/Cu | |||
|---|---|---|---|---|
| Elements | Before | After | Before | After |
| N1s | 5.6 | 6.9 | 3.23 | 3.82 |
| C1s | 72.4 | 67.8 | 75.61 | 66.26 |
| O1s | 15.7 | 18.5 | 20.14 | 25.08 |
| Cl2p | 4.4 | 4.7 | 0.11 | 1.75 |
| Na1s | 0.1 | 0.7 | 0.37 | 2.65 |
| Cu2p3 | 1.5 | 1.1 | 0.54 | 0.44 |
| N/C ratio | 0.08 | 0.1 | 0.04 | 0.06 |
| O/C ratio | 0.22 | 0.27 | 0.27 | 0.38 |
| Sample | 5 Days, ppb | 5 Days, % from Original |
|---|---|---|
| PVC/pDA/Cu (3.5:1) | 50.7 ± 14.5 | 39 |
| PU/pDA/Cu (3.5:1) | 48.1 ± 11.6 | 23 |
© 2019 by the authors. Licensee MDPI, Basel, Switzerland. This article is an open access article distributed under the terms and conditions of the Creative Commons Attribution (CC BY) license (http://creativecommons.org/licenses/by/4.0/).
Share and Cite
Azizova, L.; Ray, S.; Mikhalovsky, S.; Mikhalovska, L. Development of Cu-Modified PVC and PU for Catalytic Generation of Nitric Oxide. Colloids Interfaces 2019, 3, 33. https://doi.org/10.3390/colloids3010033
Azizova L, Ray S, Mikhalovsky S, Mikhalovska L. Development of Cu-Modified PVC and PU for Catalytic Generation of Nitric Oxide. Colloids and Interfaces. 2019; 3(1):33. https://doi.org/10.3390/colloids3010033
Chicago/Turabian StyleAzizova, Liana, Santanu Ray, Sergey Mikhalovsky, and Lyuba Mikhalovska. 2019. "Development of Cu-Modified PVC and PU for Catalytic Generation of Nitric Oxide" Colloids and Interfaces 3, no. 1: 33. https://doi.org/10.3390/colloids3010033
APA StyleAzizova, L., Ray, S., Mikhalovsky, S., & Mikhalovska, L. (2019). Development of Cu-Modified PVC and PU for Catalytic Generation of Nitric Oxide. Colloids and Interfaces, 3(1), 33. https://doi.org/10.3390/colloids3010033