Communication

Impact of a Linear Array of Hydrophilic and Superhydrophobic Spheres on a Deep Water Pool

1
Institute of Refrigeration and Cryogenics, Shanghai Jiao Tong University, Shanghai 200240, China
2
Institute of Aerospace Thermodynamics (ITLR), University of Stuttgart, 70569 Stuttgart, Germany
3
Institute for Modelling Hydraulic and Environmental Systems, University of Stuttgart, 70569 Stuttgart, Germany
*
Authors to whom correspondence should be addressed.
These authors contributed equally to this work.
Colloids Interfaces 2019, 3(1), 29; https://doi.org/10.3390/colloids3010029
Submission received: 23 January 2019 / Revised: 19 February 2019 / Accepted: 20 February 2019 / Published: 22 February 2019

Abstract

:
The impact of solid bodies on the free surface of liquid pools is involved in many practical applications—such as bullets and air-to-sea anti-torpedo defense systems, or the water entry of athletes in water sports—aimed at improving the performance through a control of cavity dynamics. This work reports an experimental investigation of the impact of a linear array of hydrophilic (H) and superhydrophobic (SH) spheres on a deep water pool. The array consisted of ten magnetic spheres, with different permutations of H and SH spheres. Using high speed shadowgraphy, we captured the underwater kinematics of the array for different permutations of H and SH spheres. In particular, we observed the evolution or absence of an air cavity attached to the array as a function of the position of the H and SH spheres. The position of the first SH sphere from the leading edge of the array (ZSH) emerged as a key parameter that alters the characteristics of cavity evolution. The appearance and pinch-off characteristics of a wake cavity behind the trailing edge were governed by the wetting properties of the leading and trailing surfaces of the array. The position of the first SH surface, as well as the wetting characteristics of the leading and trailing surfaces, are potential control parameters to alter underwater cavity evolution during solid surface impact on deep water pools.

1. Introduction

Beginning with the classical works of Worthington and Cole [1,2] more than a century ago, the impact of solid bodies on the free surface of liquid pools has been studied for a long time, motivated by practical applications—including the water entry of projectiles such as bullets and air-to-sea anti-torpedo defense systems and the water entry of athletes in water sports—aimed at improving performance through a control of cavity dynamics [3].
Experimental studies on the water entry of solid bodies have focused mainly on the effects of: (i) the size and shape of the solid body (see Figure 5 in [3]), (ii) the surface wetting and roughness characteristics of the solid body (see Figure 2 in [3]), (iii) the impact velocity and rotation of the solid body at entry (see Figure 8 in [3]), (iv) the density of the solid body material compared to that of the liquid pool (see Figure 6 in [3]), and (v) the presence of oil film on the free surface of water [4] on the dynamics of the cavity below the free surface of a liquid pool and the dynamics of the splash above the free surface of a liquid pool.
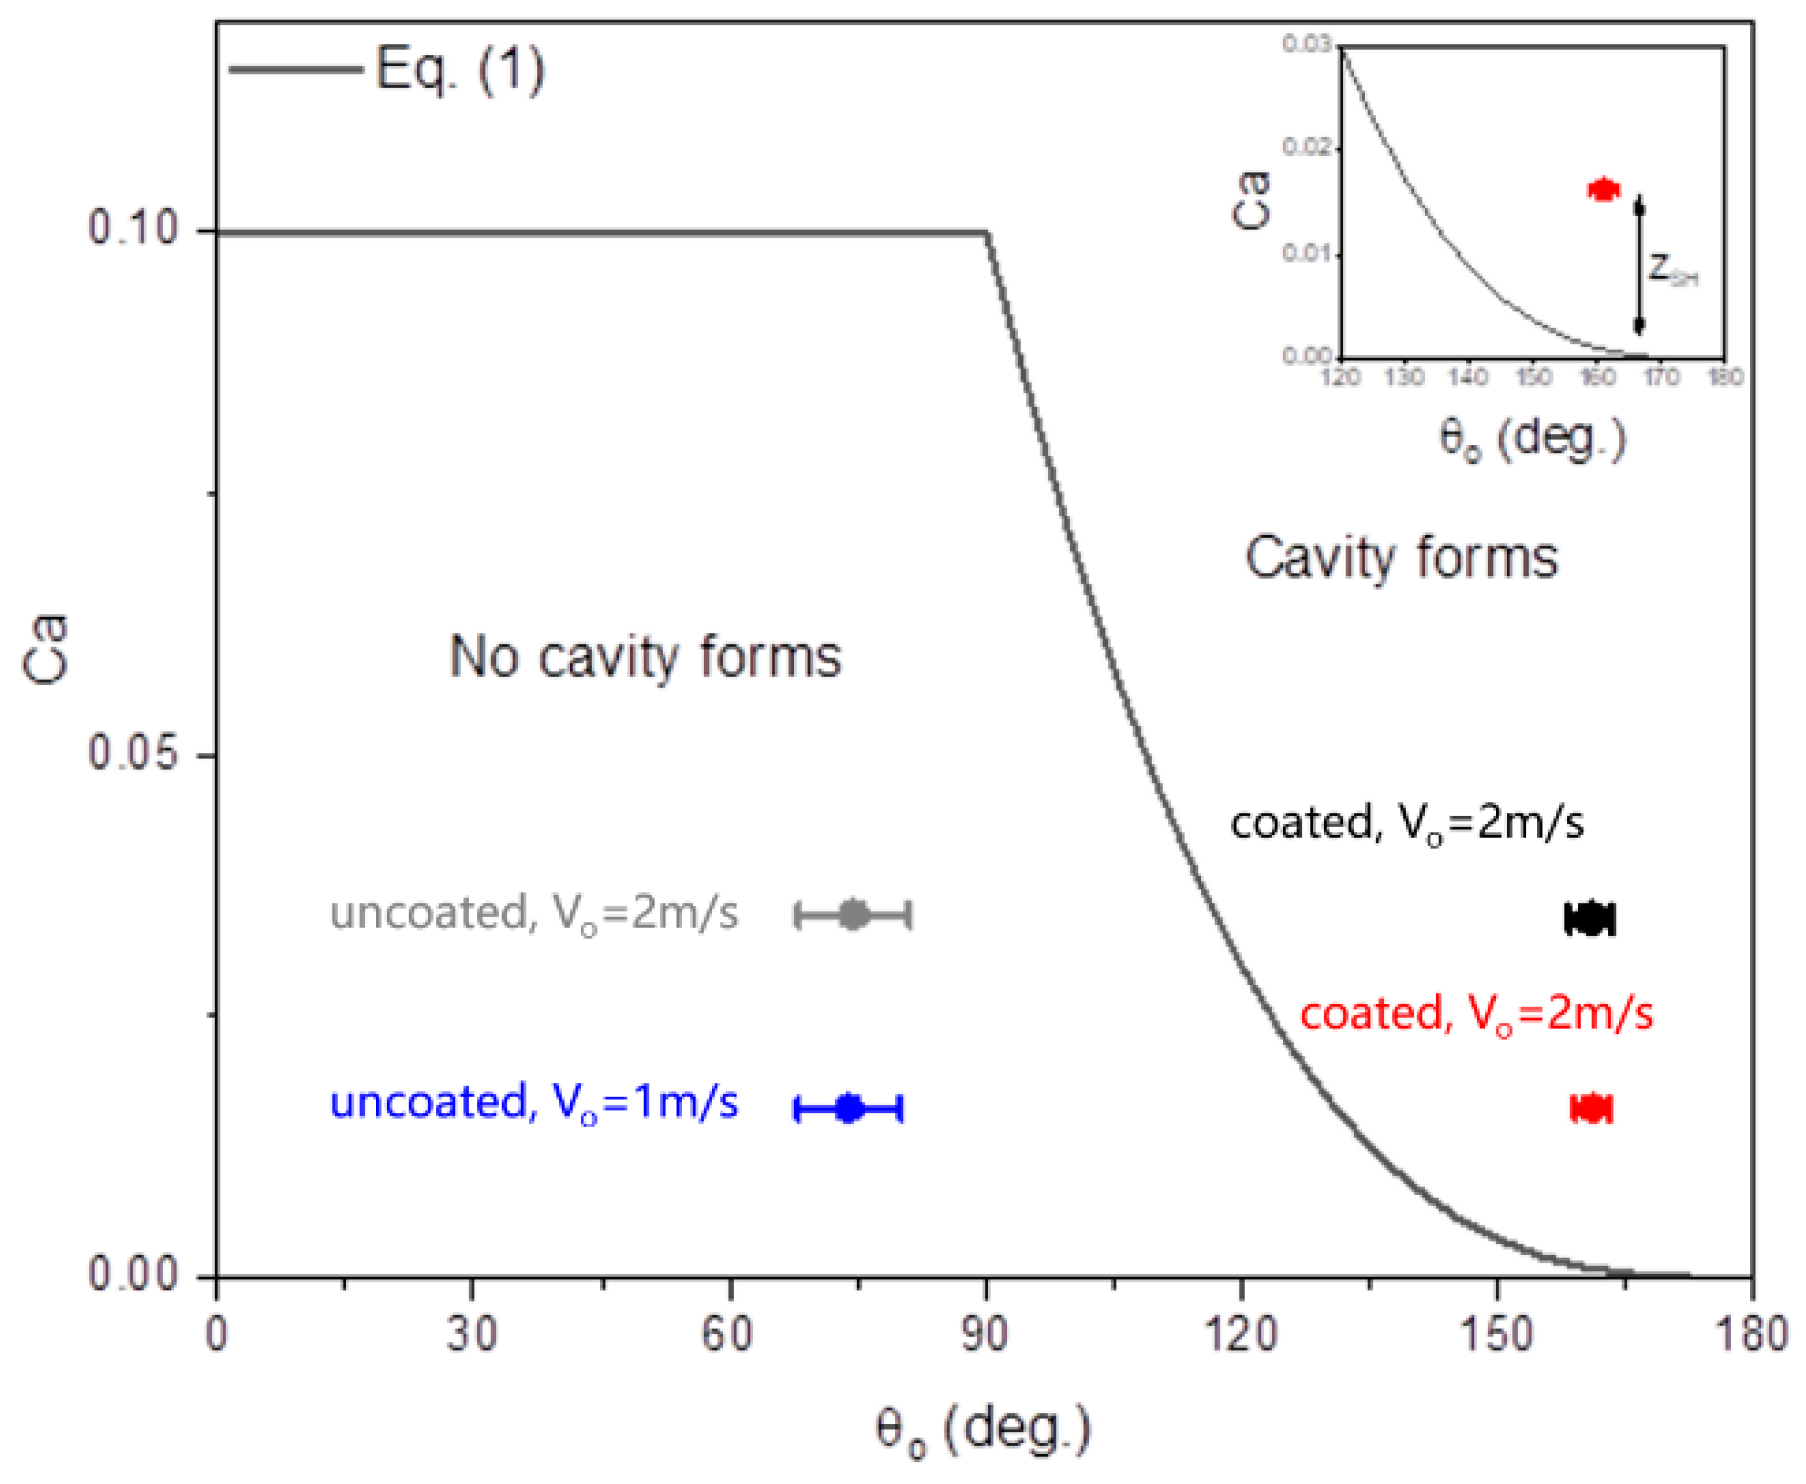
It is known that by altering the surface wetting characteristics of solid spheres, cavity formation can be enhanced (due to more hydrophobic surfaces) or suppressed (due to more hydrophilic surfaces) [5,6]. The impact conditions and cavity formation are related by the Ca-θo phase diagram, where Ca = μVo/σ is the capillary number (μ and σ are the dynamic viscosity and surface tension of the pool liquid), Vo is the impact velocity of the solid sphere, and θo is the static contact angle of the pool liquid on the solid sphere surface. At a given θo, when Ca < Cacr cavity formation is suppressed, whereas when Ca > Cacr cavity formation is observed. This critical value of Ca, (Cacr) is mainly a function of θo and is given as follows [5]:
C a c r = { ξ   ;   θ o 90 ° g o 9 l ζ ( π θ o ) 3 ;   θ o 90 °
Here the values of the adjustable parameters that yielded best-fit with the experimental data of Duez et al. [5] were ξ = 0.1, go = 7, l = 15, and ξ = 2. Aristoff and Bush [7] further showed that there were four different cavity shapes dependent on the Bond and Weber numbers. Speirs et al. [8] indicated that the pinch-off type could be predicted by the cavity diameter and downward cavity velocity regardless of the type of impacting body.
Some recent works have also studied cavity formation characteristics in more complex conditions, such as the entry of deformable elastomeric spheres [9], entry of heated spheres [10] and entry into a water–surfactant mixture [11].
While cavity dynamics has been studied for many decades, this work focused on the effect of alternate surface wetting of solid spheres in a linear array, which has not been previously considered. The linear array consisted of hydrophilic (H) and superhydrophobic (SH) spheres. The rest of this paper is organized as follows: in Section 2 the experimental set-up is introduced, then in Section 3, the effect of the permutations of H and SH spheres on the appearance and pinch-off characteristics of the air cavity are analyzed in detail. The paper closes with some key conclusions in Section 4.

2. Materials and Methods

The experimental set-up used for studying the impact of linear arrays of spheres on a deep pool of water is schematically shown in Figure 1a. The main components were the dropper arrangement, liquid pool, and a high-speed imaging system. The dropper arrangement comprised a magnetic switch (1) attached to a long vertical tube (2) of an internal diameter slightly larger than that of the spheres, which provided directed passage for the spheres. The array of spheres were attached to the magnetic switch through a thick layer of cardboard so that when the switch was turned on, the magnet held the magnetic spheres in place. When the switch was turned off, the magnetic spheres dropped through the vertical tube made of non-magnetic material. The entire dropper arrangement was attached to a vertical traverse (3) so as to enable control of the fall height and, hence, the impact velocity. The liquid pool (4) was a glass tank with the dimensions of 300 mm × 200 mm × 200 mm, filled with filtered tap water (density, ρ = 1000 kg/m3; μ = 1 mPa·s; σ = 0.0728 N/m) to a desired depth (160 mm). The experiments were conducted at an ambient temperature of about 25 °C.
The linear array (Figure 1b) was composed of ten magnetic spheres, each with a diameter (Ds) of 5 mm, with different combinations of hydrophilic (H) and superhydrophobic (SH) spheres so as to vary the position of the first superhydrophobic sphere in the array, ZSH. The H and SH spheres were made of the same metallic alloy (NdFeB) and had a density (ρs) of 7400 kg/m3. The SH spheres were made by coating a superhydrophobic layer on H spheres (see [12] for details of this coating; Appendix A shows typical wetting experiments conducted on H and SH spheres). Prior to the dropping experiment, we coated over 1000 SH spheres under the same conditions. Thus, replicate sets with fresh, previously unused spheres were used during the multiple tests. Two constant impact velocities were studied (1 m/s and 2 m/s) so that the effect of ZSH on the cavity characteristics could be studied. The corresponding capillary numbers on the Duez et al. [5] Ca-θo phase diagram are shown in Figure 2.
The high-speed imaging system consisted of a Photron FASTCAM SAX-2 camera (5) along with diffused backlighting (6). The operating parameters of the high-speed camera were kept constant for all the experiments: frame rate = 12,500 fps, spatial resolution = 0.125 mm/pixel, and exposure = 0.078 milliseconds.

3. Results and Discussion

3.1. Cavity Evolution

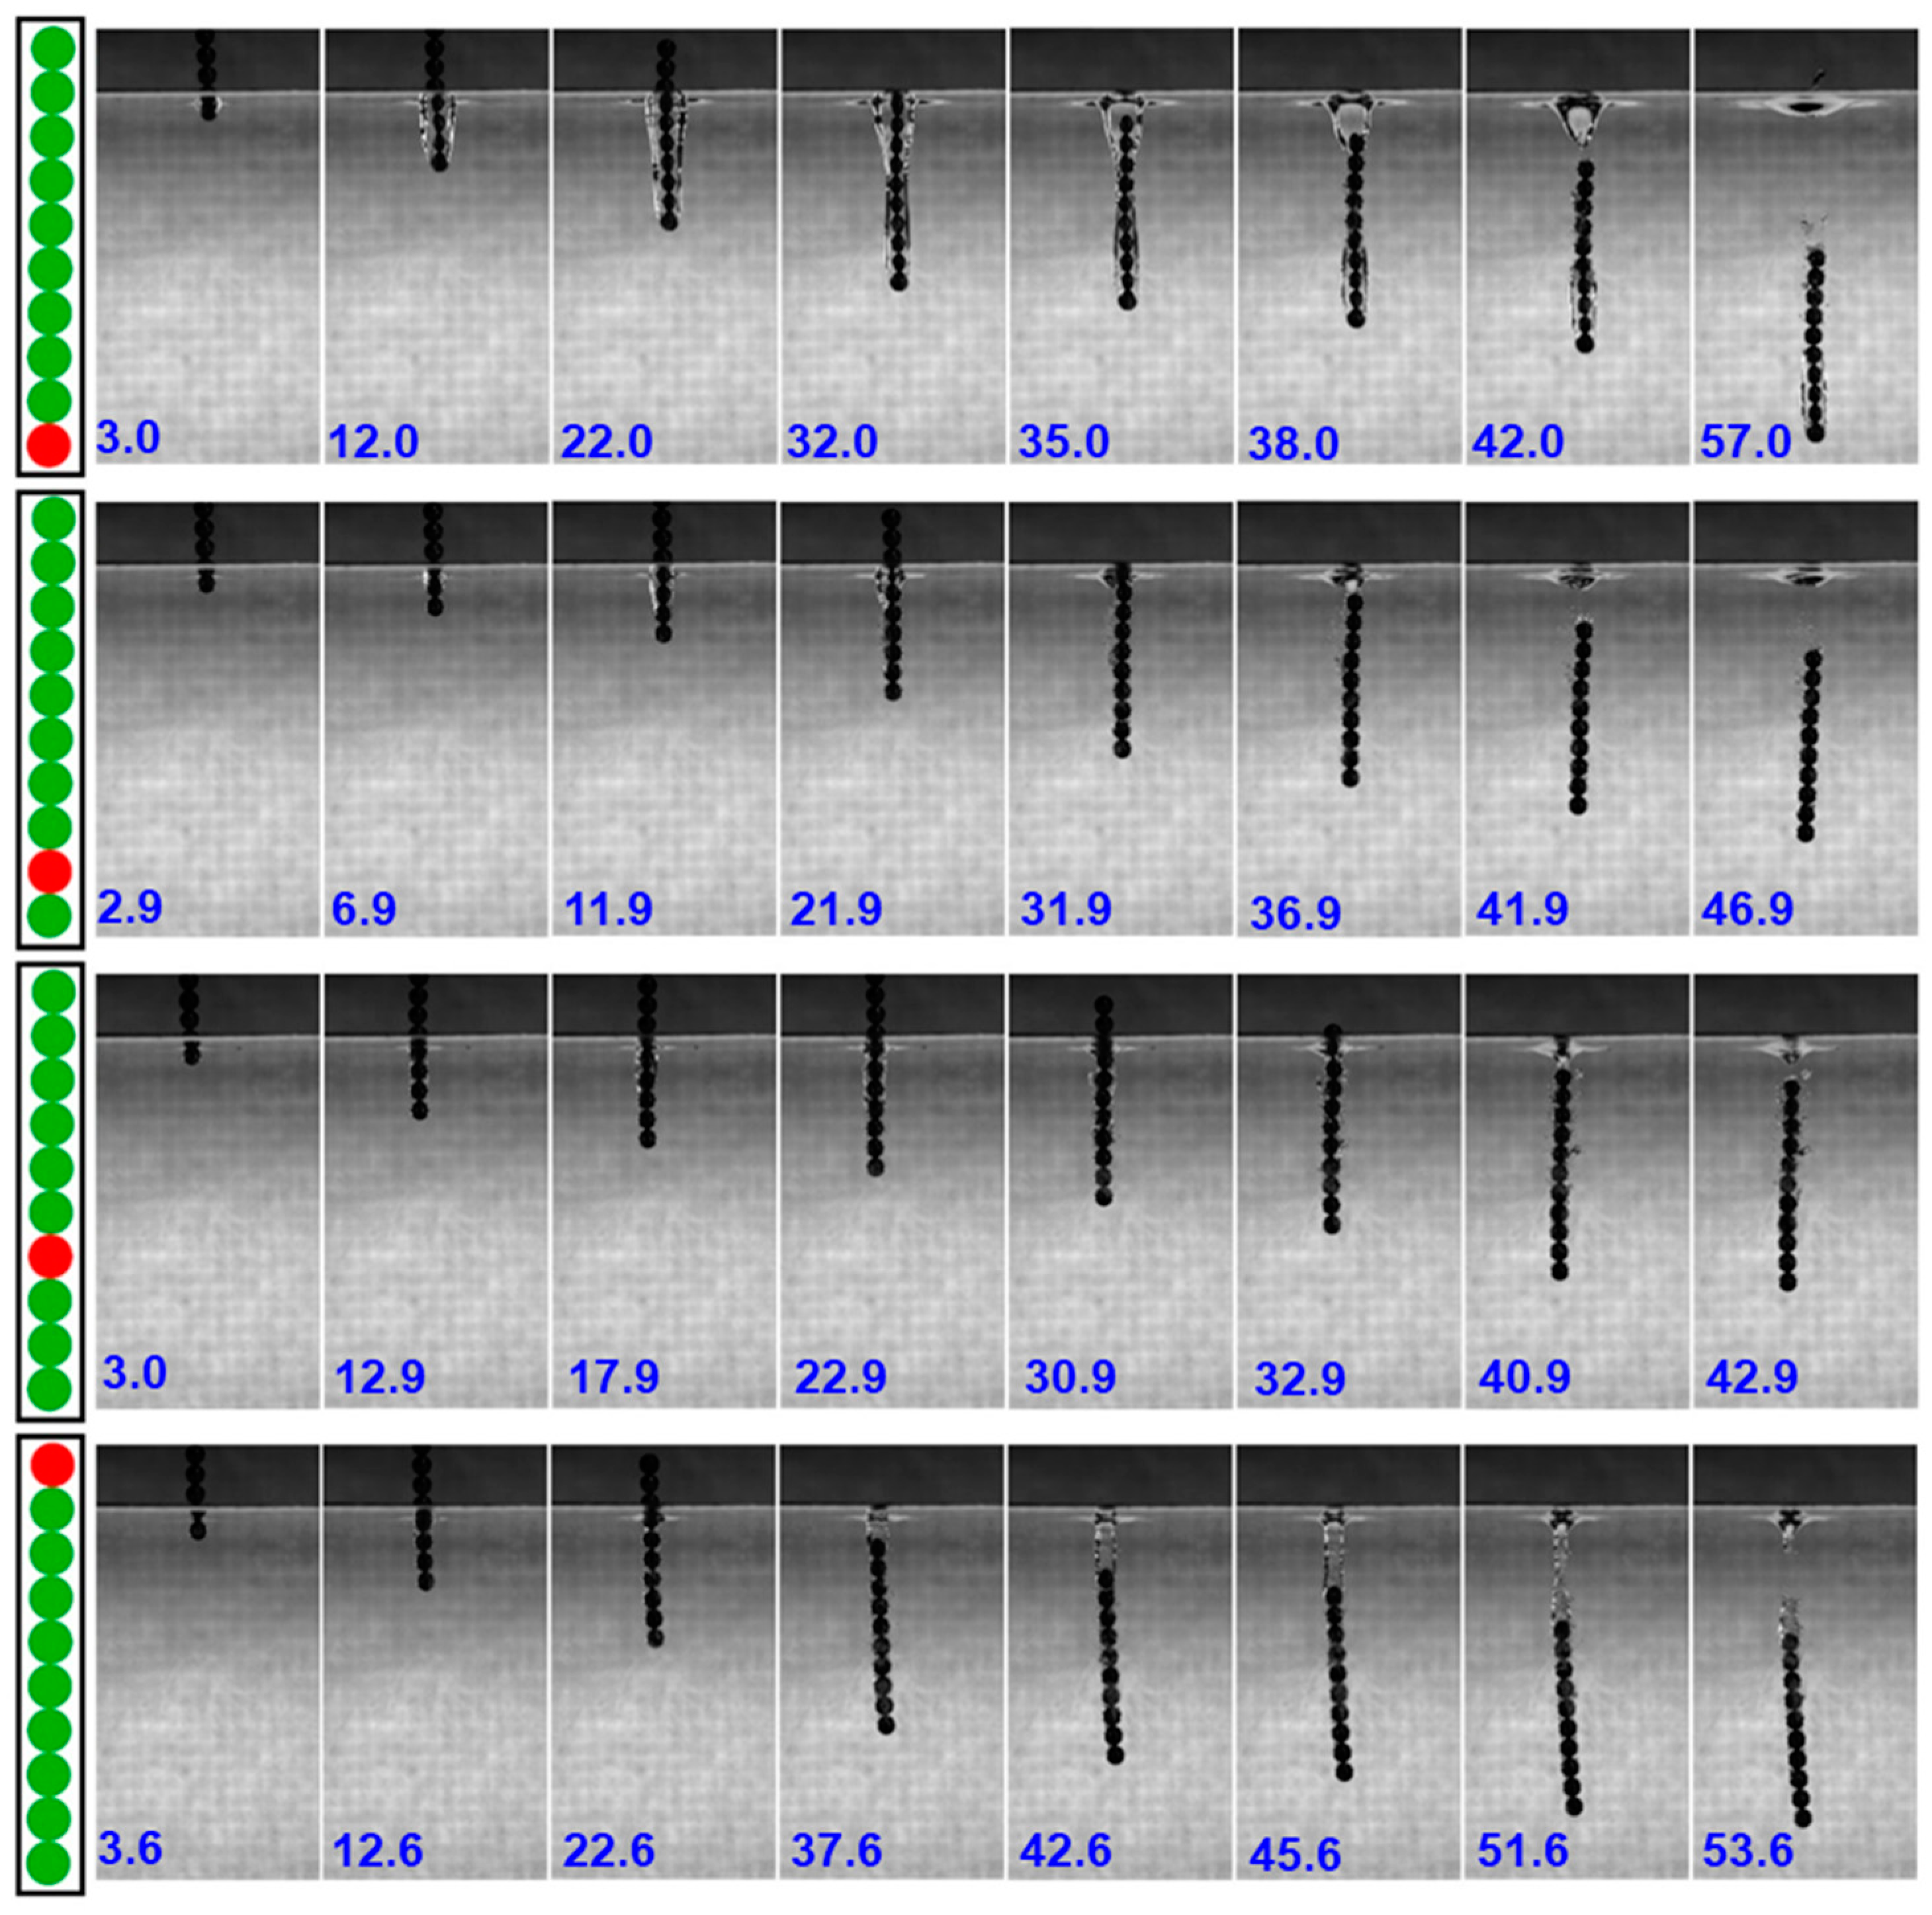
Figure 3 shows the evolution of the cavities beneath the water surface for four cases of linear arrays of H and SH spheres differing in the position of the first SH sphere, with the rest of each array made of H spheres, from top to bottom: ZSH = 0 mm, 5 mm, 15 mm, and 45 mm. Note that the images were chosen at appropriate time instants to highlight cavity evolution. For ZSH = 0 mm, the cavity formed at the leading edge of the linear array. It expanded radially outward, reaching a maximum width (Wmax) in the process (second and third frames). It then receded radially towards the array axis, collapsing between the sixth and seventh spheres in the array (fourth and fifth frames). This is referred to as the ‘first pinch-off’ event. It was characterized by (i) the first pinch-off time (tp1) defined as the corresponding time elapsed after the array first contacts the free surface of the water (t = 0); (ii) the relative first pinch-off time (tp1–tf1), where tf1 is the instant at which the cavity starts forming; and (iii) the first pinch-off depth (Hp1), defined as the depth of the first pinch-off location from the free surface of the water. Afterwards, as the array kept falling through the pool, the upper part of the pinched-off cavity underwent a second pinch-off in the wake of the last sphere in the array (sixth and seventh frames). This second pinch-off event was characterized by (i) the second pinch-off time (tp2), and (ii) the second pinch-off depth (Hp2), both defined similarly to those of the first pinch-off. This was sharply in contrast with the cavity evolution for the single SH sphere impact (see Figure A2b), which exhibited only one cavity pinch-off event. For more details regarding the cavity formation and evolution characteristics, please refer to our videos in the Gallery of Fluid Motion [13].
As the position of the first SH sphere shifted away from the leading edge (ZSH = 0 mm) to ZSH = 5 mm (second row in Figure 3), even though the qualitative characteristics of cavity formation and evolution remained similar to that at ZSH = 0 mm, there was a drastic difference in the quantitative characteristics. As the second sphere in the array entered the pool surface, the cavity began to form (second frame), however it expanded to less radial and axial extents than were observed at ZSH = 0 mm (third frame) and collapsed faster (fourth frame). As the array fell through the pool, a smaller air cavity, which was a residue of the upper part of the pinched-off first cavity, was seen at the wake of the last sphere (fifth and sixth frames) and pinched off afterwards (seventh frame). The size of this wake cavity was much smaller than that observed at ZSH = 0 mm. Further, as ZSH was increased to 15 mm (third row in Figure 3), the cavity started to form when the fourth sphere in the array entered the water pool. These cavity dimensions were found to be smaller (third and fourth frames) and it pinched off much faster (fifth frame) than in case of ZSH = 0 mm. The residual air cavity from this pinch-off at the wake of the last sphere (sixth and seventh frames) was also smaller than at ZSH = 0 mm. The last row in Figure 3 presents the case when the first SH sphere is the last sphere in the array (ZSH = 45 mm). There was no cavity formed until the last sphere entered the water pool (fourth frame). The cavity which then formed at the wake of the last sphere was longer than the wake cavities observed in the previous cases and narrower than the one formed in the condition ZSH = 0 mm (first row in Figure 3). This discussion clearly demonstrates that by changing the position of the first SH sphere in the array, the characteristics of cavity evolution can be controlled.

3.2. Maximum Cavity Width

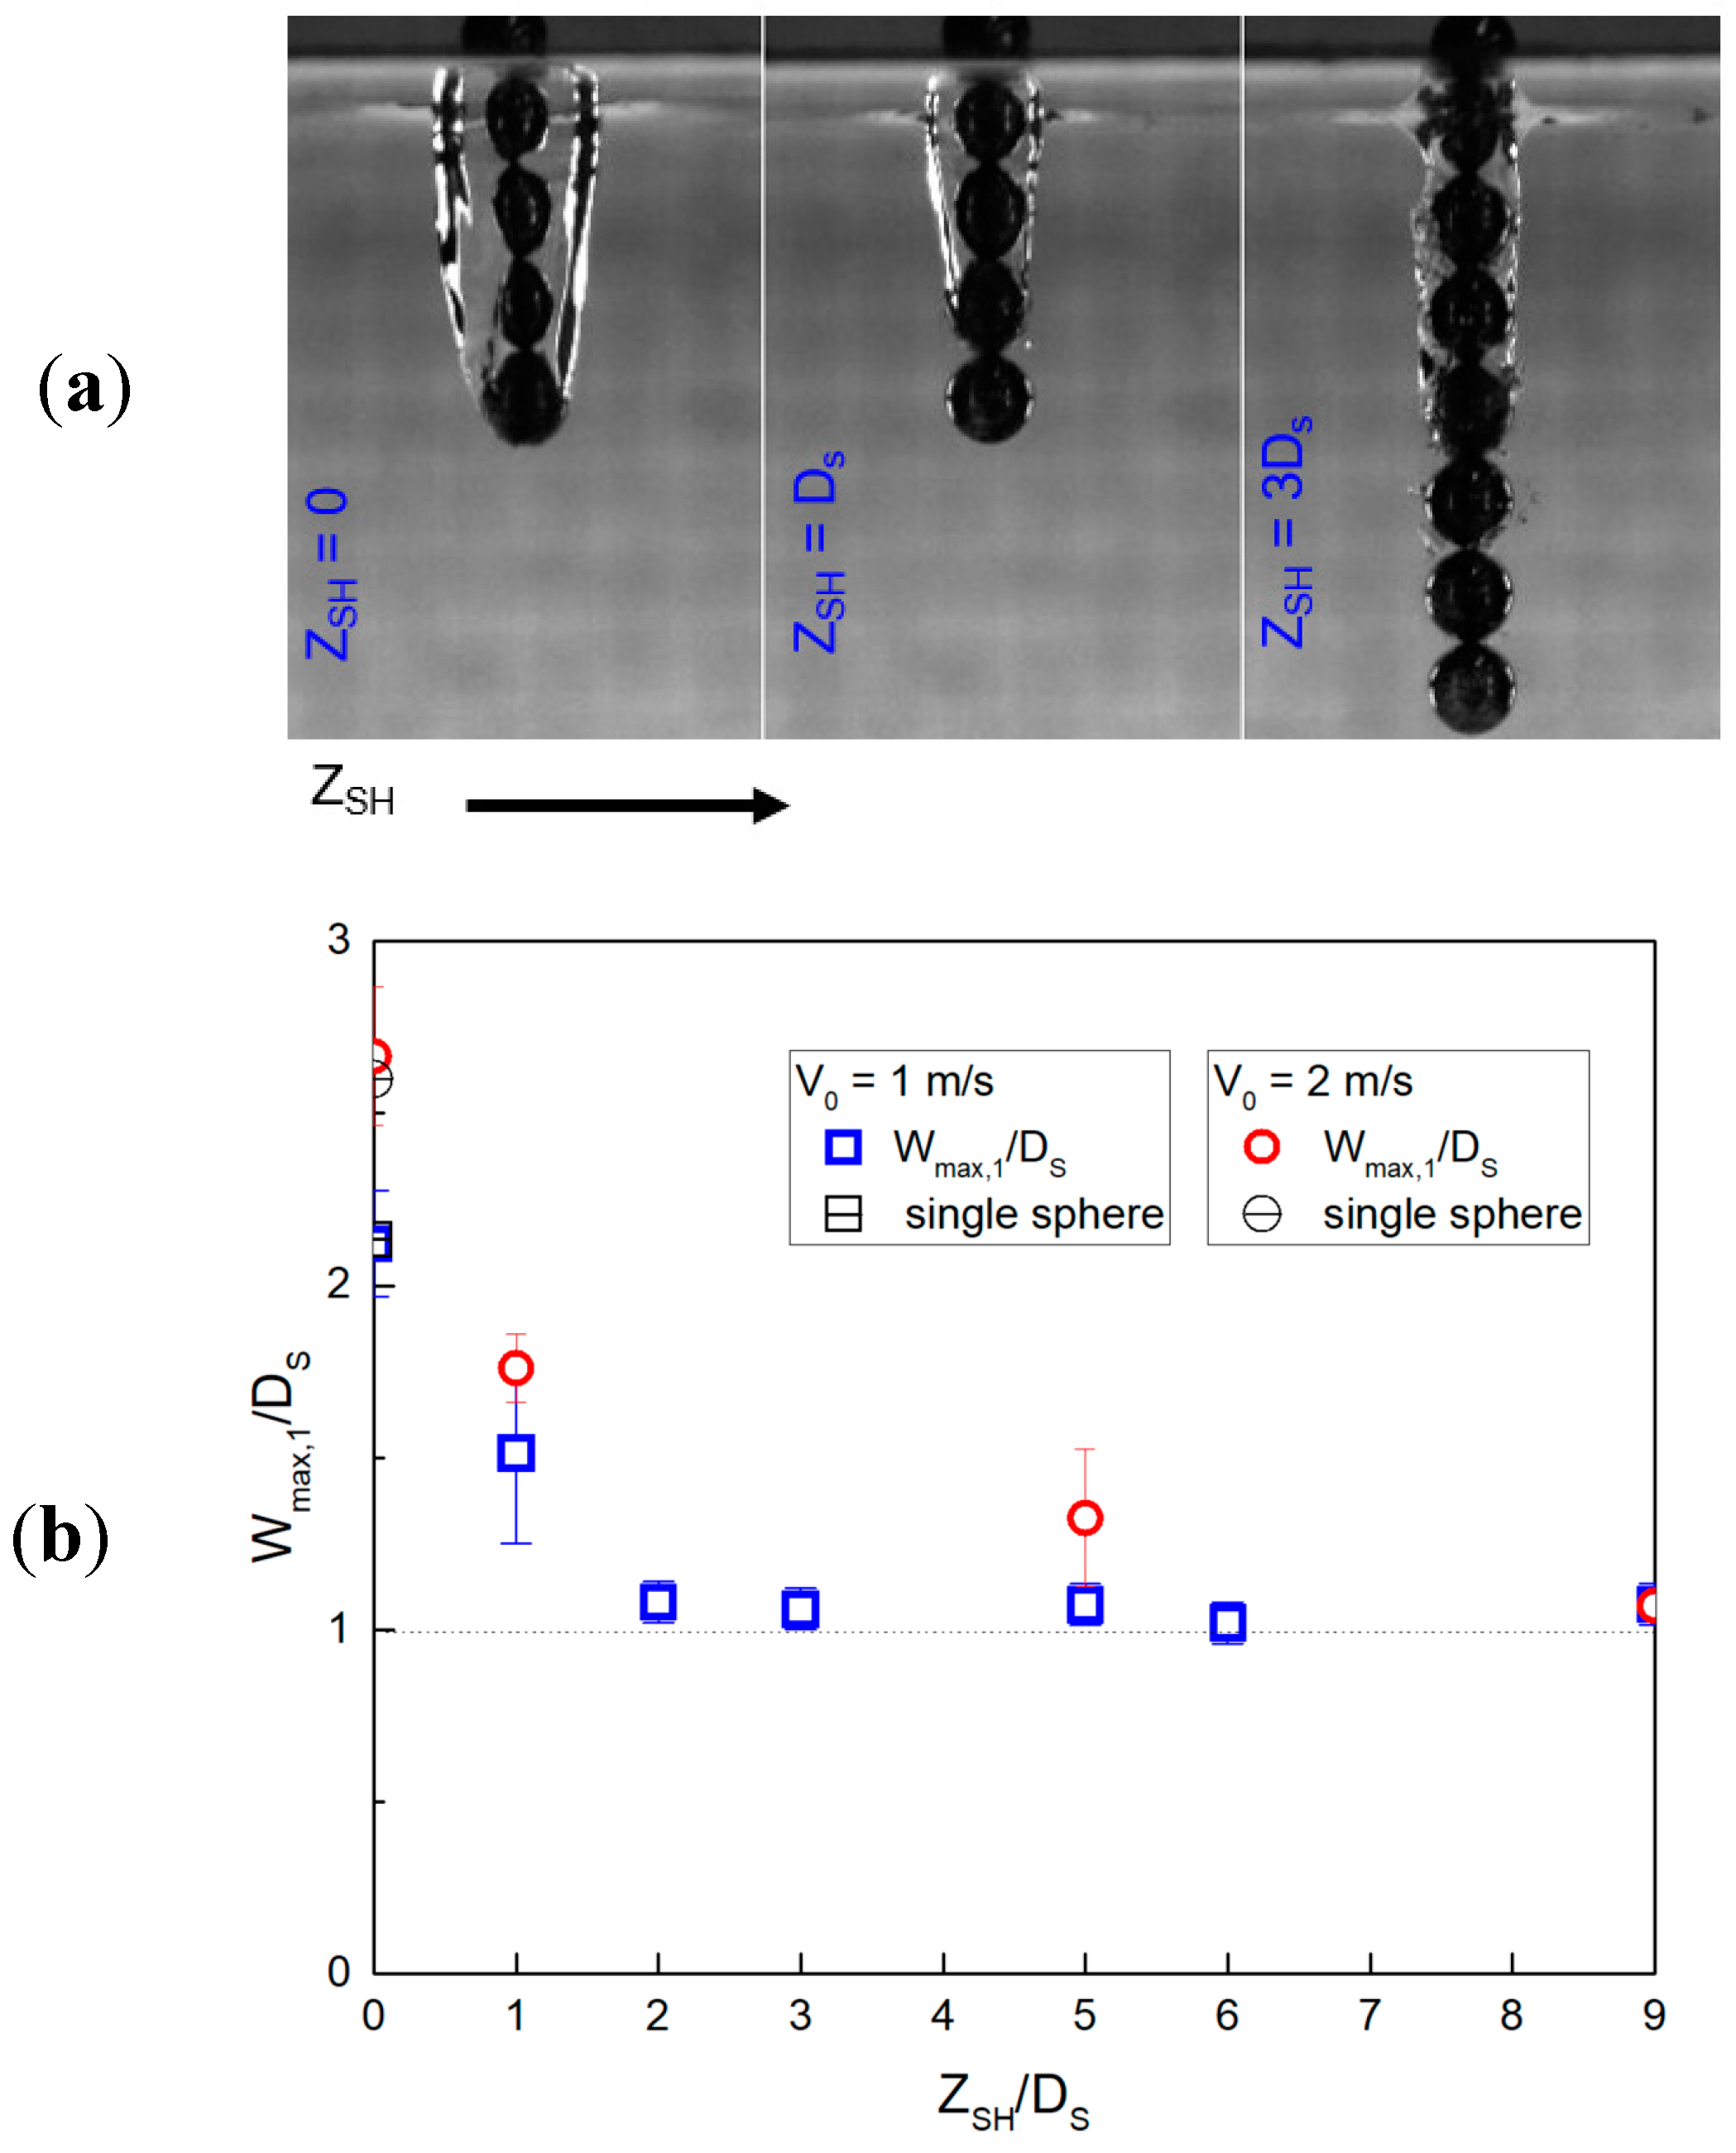
The quantitative characteristics of the cavities observed above were extracted for different combinations of the position of the first SH sphere. Figure 4 shows quantitative trends of the maximum cavity width as a function of the position of the first SH sphere in the array. The length scales were normalized with the diameter of the sphere, Ds. Figure 4a shows that the maximum cavity width decreased as ZSH increased. This can be explained as follows: as ZSH increased, the flow velocity (V) encountered by the first SH sphere decreased due to (i) the position of the sphere at the wake of the flow around the upstream sphere, and (ii) the absence of a strong stagnation point flow compared to that at ZSH = 0. This decrease in the flow velocity led to a decrease in the effective capillary number (Caeff = μV/σ). In Figure 2, if we used Caeff instead of Ca, the decrease in Caeff at a given θo (of an SH sphere) due to the increase in ZSH, led to a less dominant cavity formation (as illustrated in the inset of Figure 1). This is quantitatively captured in Figure 4b by the decrease in maximum cavity width with increasing ZSH. It should be noted that the results of two limit cases, namely 10SH spheres and 10H spheres, are also included this figure, and were within the error bars of ZSH/Ds = 0 and ZSH/Ds = 9, respectively.
It is interesting to note that the maximum cavity width for the impact of a single SH sphere was the same as that for the impact of a linear array of spheres when the leading sphere was superhydrophobic (ZSH = 0). An increase of maximum cavity width due to the increase of impact velocity was also clearly observed. At higher values of ZSH, this difference due to impact velocity became less significant (note that when ZSH = 9Ds, both the velocity cases merged).

3.3. First Pinch-Off

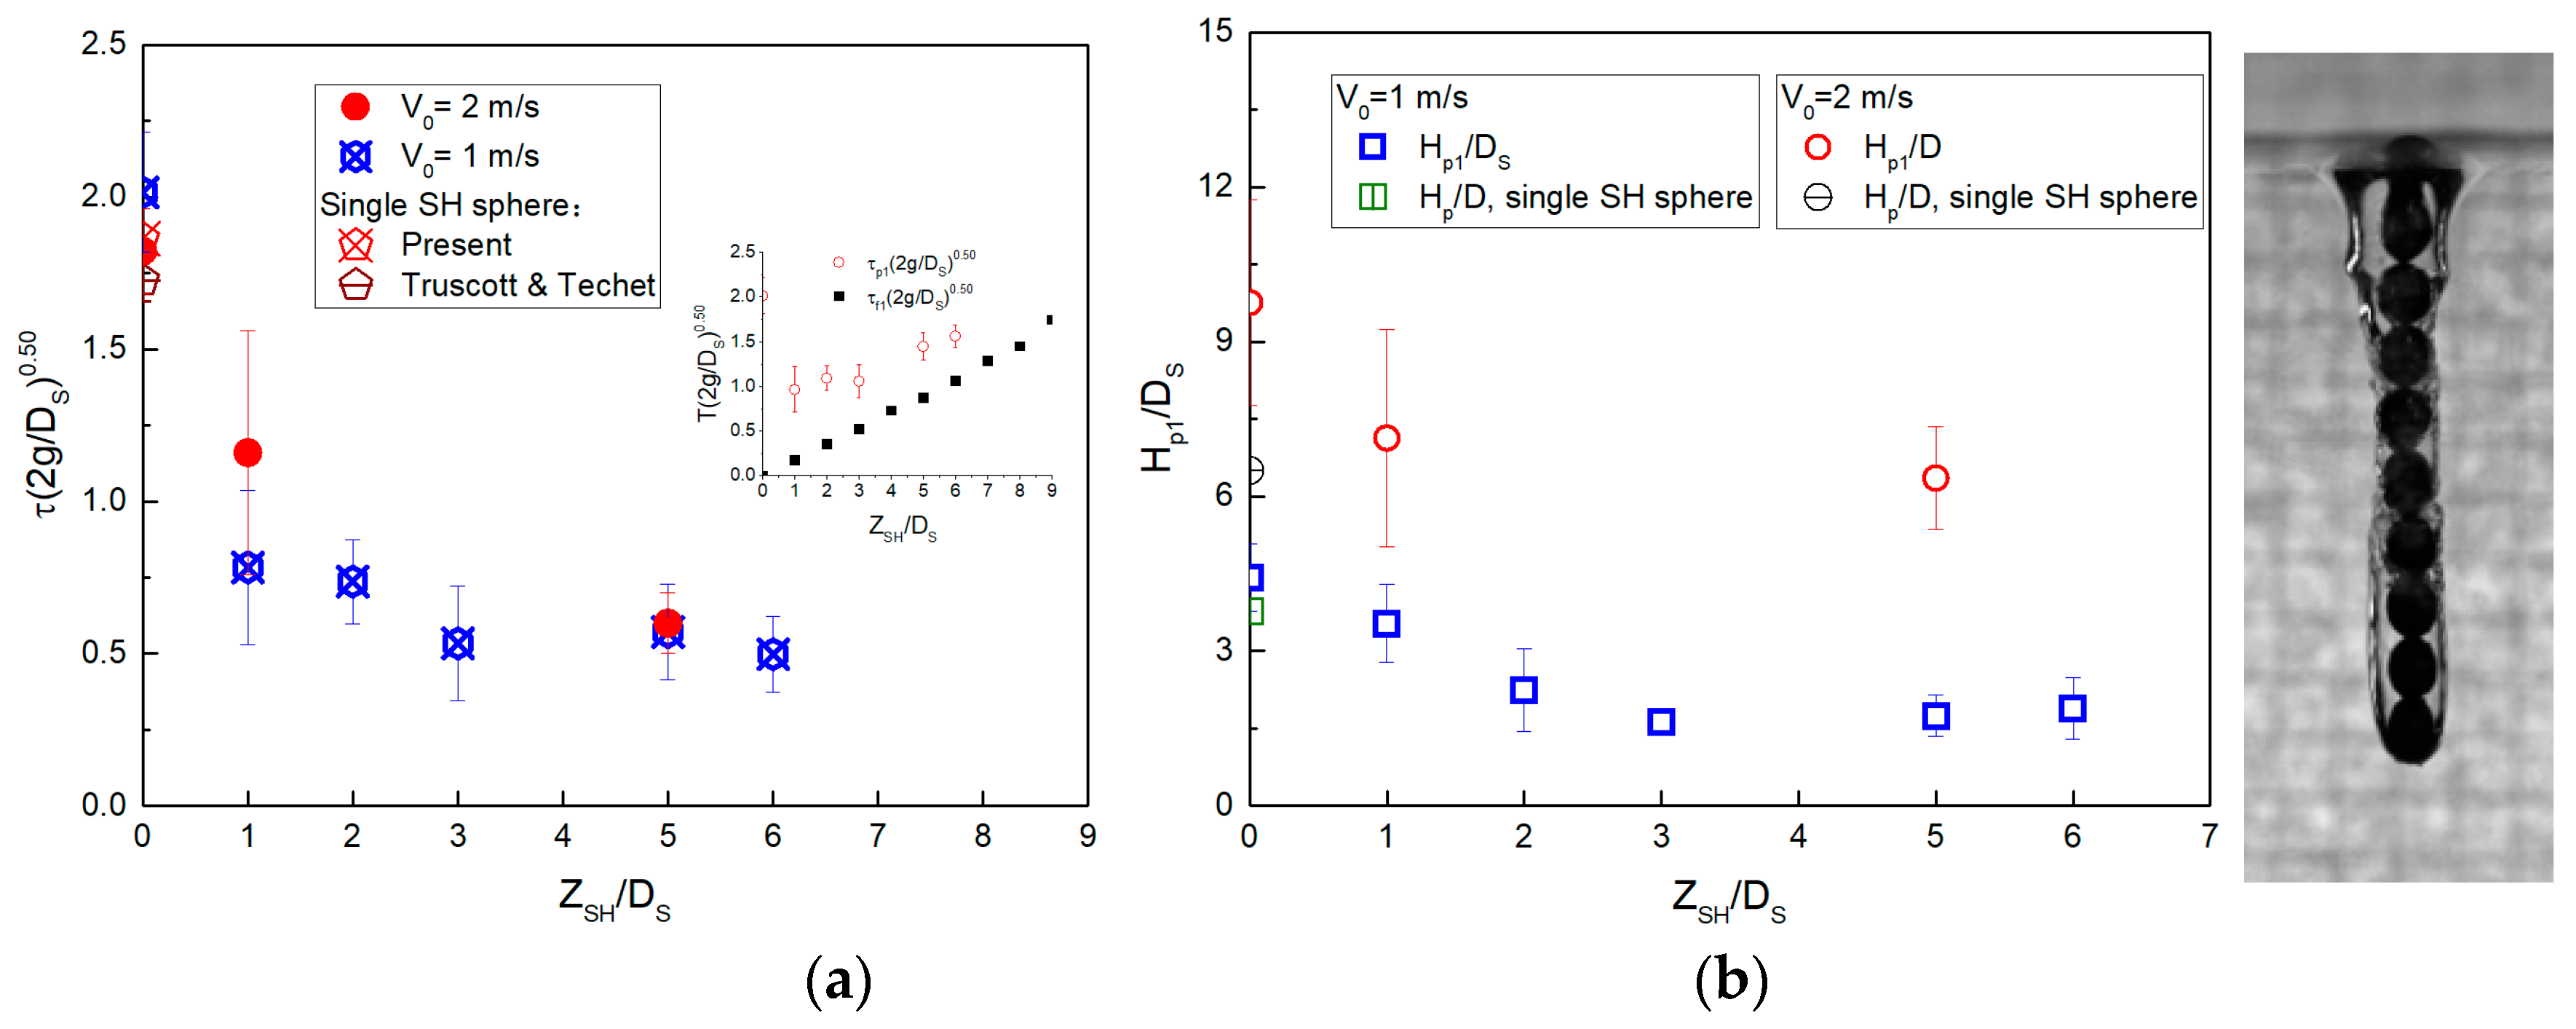
The time scales were normalized with the characteristic time scale of a sphere of diameter Ds falling under gravitational acceleration (g) given by (2g/Ds)0.50 [3]. The relative pinch-off time of the first cavity (tp1−tf1,) decreased as ZSH increased (Figure 5a), since the maximum cavity width decreased, whereas the cavity collapse rate, governed mainly by the physical properties of the pool liquid at a given impact velocity, remained the same. Note that the absolute pinch-off time (tp1) showed an initial decrease between ZSH/Ds = 0 and ZSH/Ds = 1, and then increased afterwards, whereas the cavity formation instant (tf1) increased with ZSH (see inset of Figure 5a). Moreover, the pinch-off time when the first sphere was an SH was close to the one for the impact of a single SH sphere from present study as well as to that reported in literature (≈1.73 ± 0.07) [3]. The impact velocity was also found to have little effect on pinch-off time. This is because both the maximum cavity width and the cavity collapse rate increased with the impact velocity.
The depth from the free surface of the pool at which the first pinch-off occurred (Hp1), also decreased as ZSH increased (Figure 5b). This was mainly due to the decrease in relative pinch-off time which, at a given impact velocity, led to a decrease in the distance or depth travelled by the cavity-forming sphere during this time. The pinch-off depth for the impact of a single SH sphere was very close to that observed when ZSH = 0. The trend of the first pinch-off depth with ZSH for the higher impact velocity case was similar. However, the values of Hp1 at 2 m/s were larger than that at 1 m/s; this was because the distance/depth travelled between cavity formation and first pinch-off times increased with impact velocity. These results demonstrated that ZSH is a new parameter, in addition to the properties of the pool liquid, impact velocity, wetting characteristics, and size/shape of the solid surface, to control the evolution characteristics of the first cavity.

3.4. Second Pinch-Off

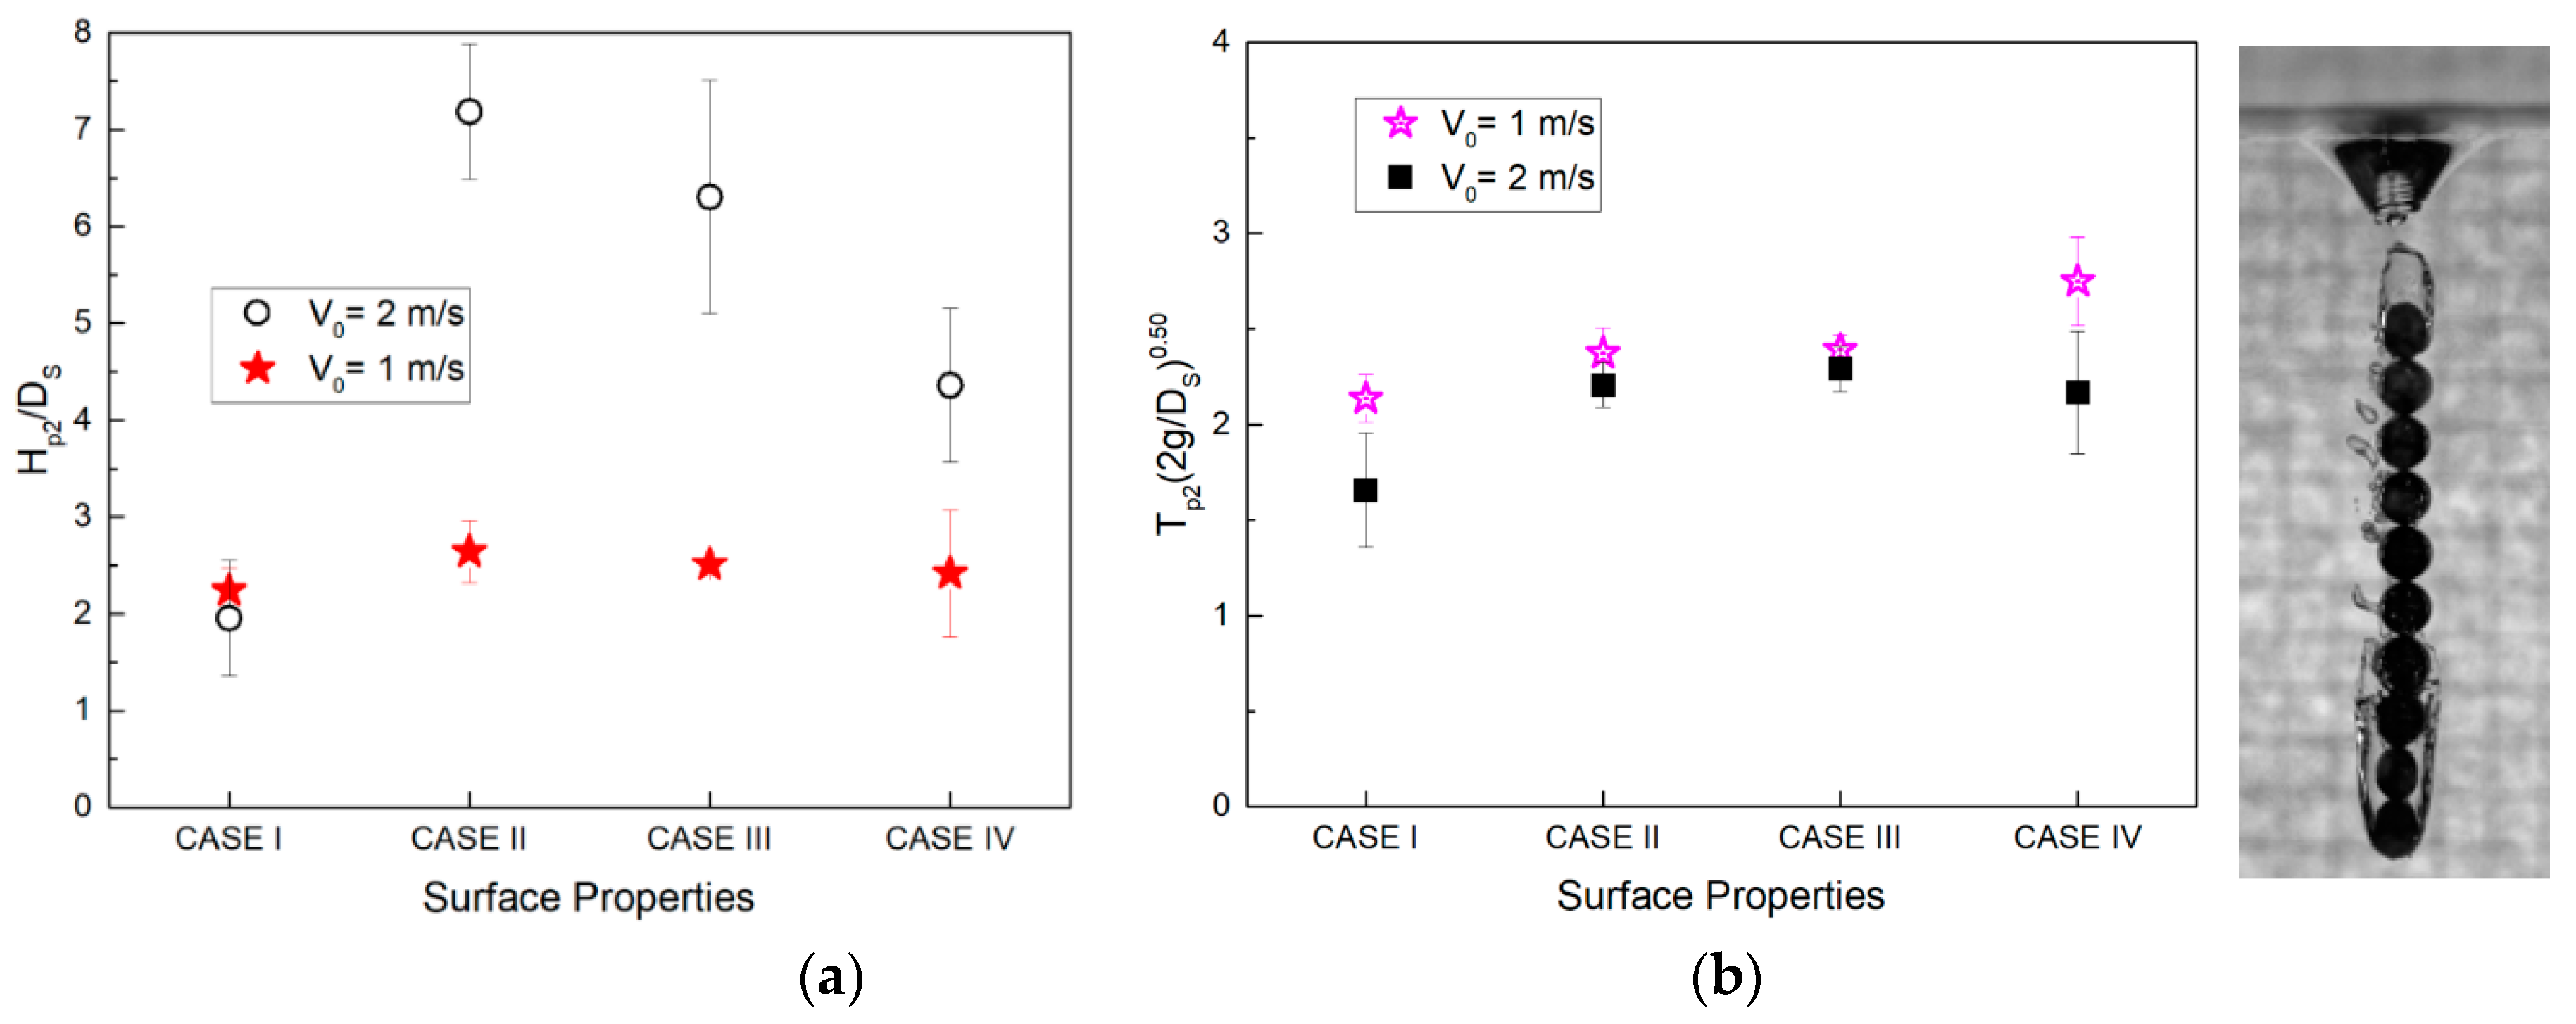
The second pinch-off characteristics were governed more by the wetting properties of the first and last spheres (as discussed with Figure 3). Hence, in Figure 6a, the impact cases were grouped into four as follows: the first and last spheres were hydrophilic (Case I/H-H), the first sphere was superhydrophobic and the last sphere was hydrophilic (Case II/SH-H), the first and last spheres were superhydrophobic (Case III/SH-SH), finally the first sphere was hydrophilic and the last sphere was superhydrophobic (Case IV/H-SH). Cases I, II and IV correspond respectively to conditions similar to those in second and third rows, first row, and fourth row of Figure 3.
When the first and last spheres were hydrophilic (Case I/H-H), the wake cavity was the least pronounced and hence the pinch-off time and depth were the smallest (see Figure 6). This was because of the less dominant effect of first cavity pinch-off due to the presence of the first hydrophilic sphere and inability to form a dominant wake cavity by the last hydrophilic sphere. When the first sphere in Case I/H-H was replaced with a superhydrophobic sphere (Case II/SH-H), the wake cavity became more dominant (longer pinch-off time and greater depth) due to the dominant pinch-off of the first cavity which led to a prominent upper part of the pinched-off cavity interacting with the last sphere at its wake. When both the first and last spheres in Case I/H-H were replaced with superhydrophobic spheres (Case III/SH-SH), the wake cavity pinch-off was similar to Case II/SH-H. This is probably because the development of wake cavity was affected more dominantly by the pinch-off of the first cavity. When the last sphere in Case I/H-H was replaced with a superhydrophobic sphere (Case IV/H-SH), the wake cavity became more dominant than Case I/H-H (larger pinch-off time and depth). Similar to the first pinch-off, the higher impact velocity led to a higher second pinch-off depth, but had little effect on the pinch-off time.
The above discussion indicates that when the first sphere was hydrophilic, the wake cavity was more sensitive to the wetting characteristics of the last sphere; whereas when the first sphere was superhydrophobic, the wake cavity was not affected much by the wetting characteristics of the last sphere. Hence tuning the wetting characteristics of the first and last spheres in the array provided a new pathway to control the wake cavity.

4. Conclusions

To summarize, we presented a preliminary study on the impact of a linear array of hydrophilic and superhydrophobic spheres on a pool of water. Comparison of the impact of single superhydrophobic and linear array of hydrophilic and superhydrophobic spheres showed the presence of two pinch-off events corresponding to the first and wake cavities in the linear array case. Through systematic experiments and analysis, we demonstrated that by controlling the position of the superhydrophobic surface in the array, the evolution characteristics of the first cavity could be controlled. Furthermore, by varying the wetting properties of the leading and trailing edge surfaces, the pinch-off characteristics of the wake cavity were able to be fine-tuned.
This study showed that—in addition to the conventional parameters such as impact velocity, wetting characteristics, and size/shape of the solid surface—the position of the non-wetting surface and the wetting characteristics of the leading and trailing surfaces offer a new pathway to control the evolution characteristics of the cavities formed during the water entry of solid surfaces. Future work in this direction will involve exploring the effects of the impact velocity and the size of the array (length, diameter, and aspect ratio) on the efficacy of ZSH as a control parameter, especially at higher impact velocities and larger sizes of array, in underwater cavity dynamics as well as the splash characteristics above the free surface of the pool.

Author Contributions

V.V., G.Y., and A.T. conceived the idea. V.V., G.Y., and X.C. performed the experiments, analysed the data, and wrote the draft manuscript. A.T., B.W. and R.H. provided feedback and suggestions on the experiments and draft manuscript. All the authors read and approved the manuscript.

Funding

The authors acknowledge the financial support from the German Research Foundation (DFG) through the International Research Training Group (GRK 2160/1) Droplet Interaction Technologies (DROPIT) and SFB 1313, Research Project A02. A. T. acknowledges the Alexander von Humboldt (AvH) foundation for the funding support.

Conflicts of Interest

The authors declare no conflict of interest.

Appendix A

Figure A1. Interaction of water droplets with (a) uncoated, and (b) coated spheres. These experiments were conducted using a standard contact angle goniometer (DataPhysics OCA15EC). (a) On the uncoated sphere, when gently placed, the water droplet formed a sessile droplet with contact angle, θo = 74.1° ± 6.0°. (b) On the coated sphere, it was not possible to gently deposit a water droplet since the needle tip was always more hydrophilic than the coated surface of the sphere. This resulted in the droplet gently bouncing off the surface even at the smallest possible height of the needle from the surface of the sphere at which droplet detached from the needle before contacting the sphere surface. Time increases from left to right in (b), which shows two consecutive bounce-off events. The scale bars shown in the images correspond to a length of 1 mm.
Colloids 03 00029 g0a1

Appendix B

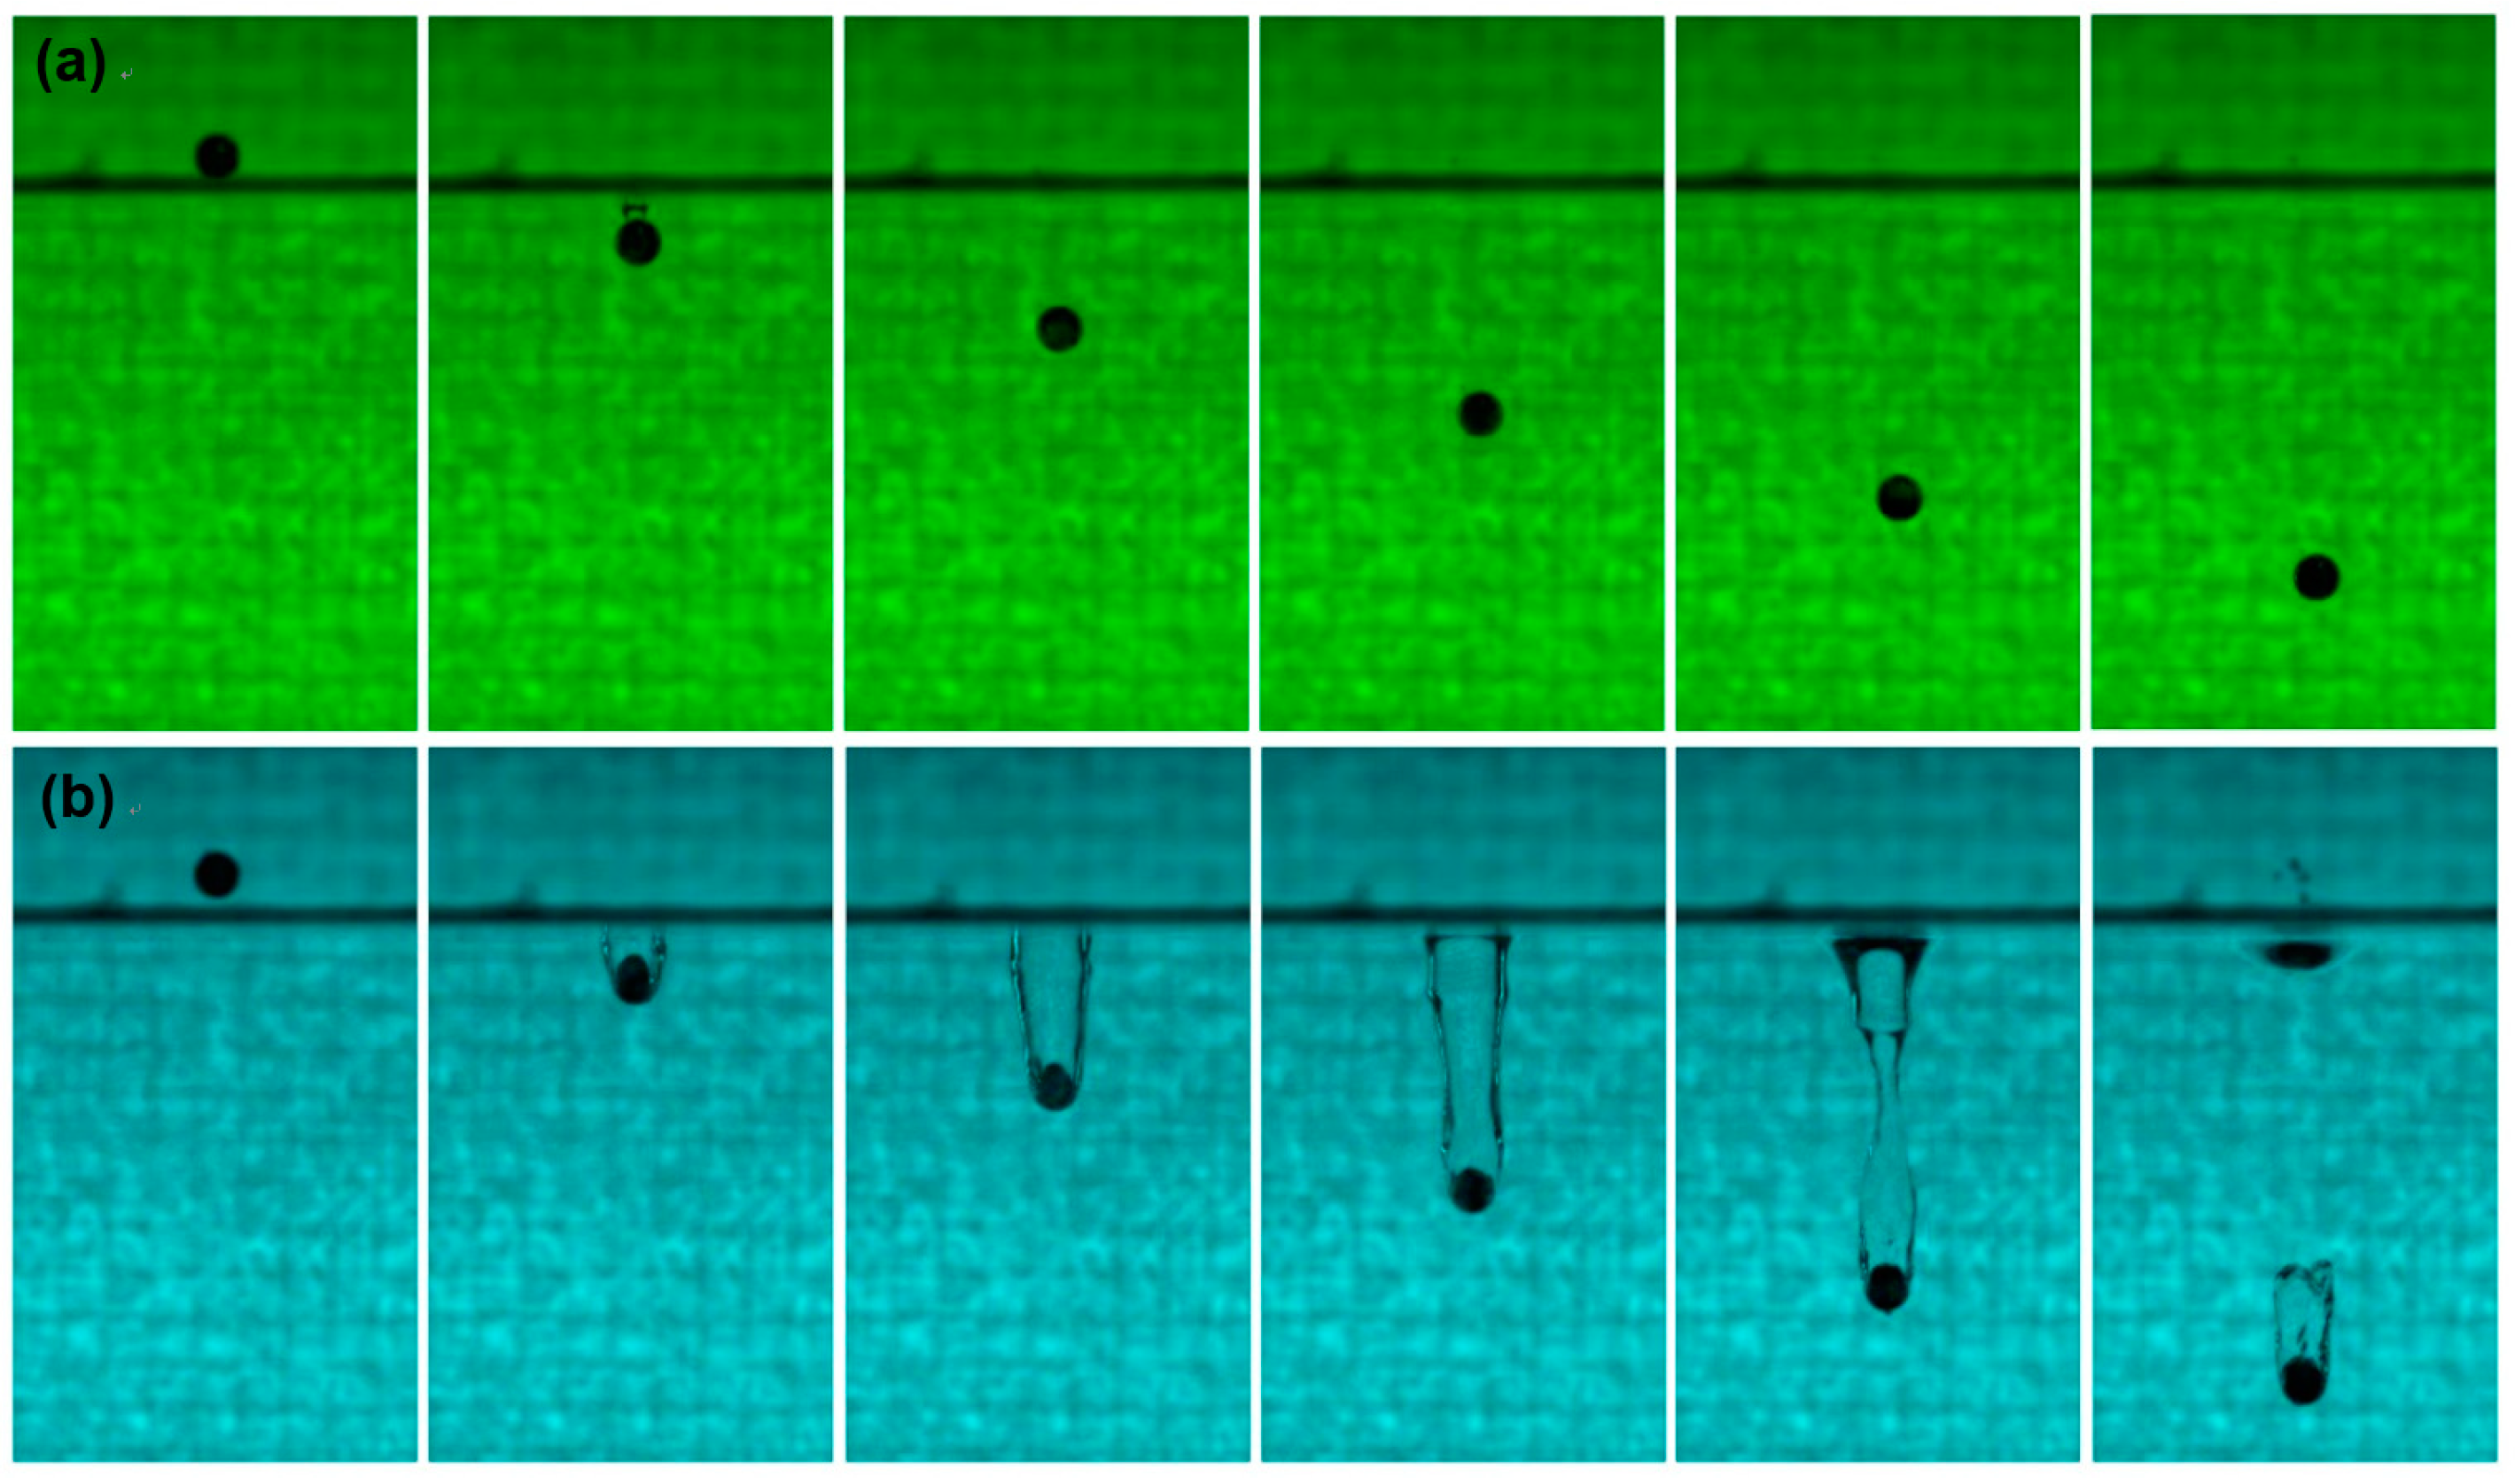
Figure A2. Interactions of (a) uncoated and (b) coated spheres 5.0 mm in diameter, (Ds) = with a pool of water at an impact velocity, Vo = 1.00 m/s (±0.09 m/s). (a) The uncoated sphere impacts on the free surface of the pool (just below the thick dark line) resulting in a small air bubble in its wake (second frame) that is not seen as the sphere falls through the pool. This shows the hydrophilic nature of the uncoated sphere surface. (b) The coated sphere impacts on the free surface of the pool, resulting in the formation of an air cavity in its wake (second frame), which elongates as the sphere falls through the pool (third and fourth frames), radially shrinking in the process (fourth and fifth frames), and finally pinching off (last frame) with one part still attached to the wake of the sphere, whereas the other part resulted in the Worthington jet on the free surface (not studied here). The time difference between two consecutive frames in the image sequence was 8.0 milli-seconds.
Colloids 03 00029 g0a2

References

  1. Worthington, A.M.; Cole, R.S. Impact with a liquid surface, studied by the aid of instantaneous photography. Phil. Trans. A 1897, 189, 137–148. [Google Scholar] [CrossRef]
  2. Worthington, A.M.; Cole, R.S. Impact with a liquid surface, studied by the aid of instantaneous photography—Paper II. Phil. Trans. A 1900, 194, 175–200. [Google Scholar] [CrossRef]
  3. Truscott, T.T.; Epps, B.P.; Belden, J. Water entry of projectiles. Annu. Rev. Fluid Mech. 2014, 46, 355–378. [Google Scholar] [CrossRef]
  4. Tan, B.C.W.; Thomas, P.J. Influence of an upper layer liquid on the phenomena and cavity formation associated with the entry of solid spheres into a stratified two-layer system of immiscible liquids. Phys. Fluids 2018, 30, 064104. [Google Scholar] [CrossRef]
  5. Duez, C.; Ybert, C.; Clanet, C.; Bocquet, L. Making a splash with water repellency. Nat. Phys. 2007, 3, 180–183. [Google Scholar] [CrossRef] [Green Version]
  6. Truscott, T.T.; Techet, A.H. A spin in cavity formation during water entry of hydrophobic and hydrophilic spheres. Phys. Fluids 2009, 21, 121703. [Google Scholar] [CrossRef]
  7. Aristoff, J.M.; Bush, J.W. Water entry of small hydrophobic spheres. J. Fluid Mech. 2009, 619, 45–78. [Google Scholar] [CrossRef]
  8. Speirs, N.B.; Mansoor, M.M.; Belden, J.; Truscott, T.T. Water entry of spheres with various contact angles. J. Fluid Mech. 2019, 862, 3. [Google Scholar] [CrossRef]
  9. Hurd, R.C.; Belden, J.; Jandron, M.A.; Fanning, D.T.; Bower, A.F.; Truscott, T.T. Water entry of deformable spheres. J. Fluid Mech. 2017, 824, 912–930. [Google Scholar] [CrossRef] [Green Version]
  10. Li, J.C.; Wei, Y.J.; Wang, C.; Xia, W.X. Cavity formation during water entry of heated spheres. Chin. Phys. B 2018, 27, 094703. [Google Scholar] [CrossRef]
  11. Speirs, N.B.; Mansoor, M.M.; Hurd, R.C.; Sharker, S.I.; Robinson, W.G.; Williams, B.J.; Truscott, T.T. Entry of a sphere into a water-surfactant mixture and the effect of a bubble layer. Phys. Rev. Fluids 2018, 3, 104004. [Google Scholar] [CrossRef]
  12. Gupta, R.; Vaikuntanathan, V.; Sivakumar, D. Superhydrophobic qualities of an aluminum surface coated with hydrophobic solution NeverWet. Colloid Surf. A 2016, 500, 45–53. [Google Scholar] [CrossRef]
  13. Yang, G.; Vaikuntanathan, V.; Terzis, A.; Weigand, B.; Helmig, R. Impact of a linear array of hydrophilic and superhydrophobic spheres on water pool. In Gallery of Fluid Motion, 71st Annual Meeting of the APS Division of Fluid Dynamics, Atlanta, GA, USA, 18–20 November 2018; The Division of Fluid Dynamics of the American Physical Society: College Park, MD, USA, 2018. [Google Scholar] [CrossRef]
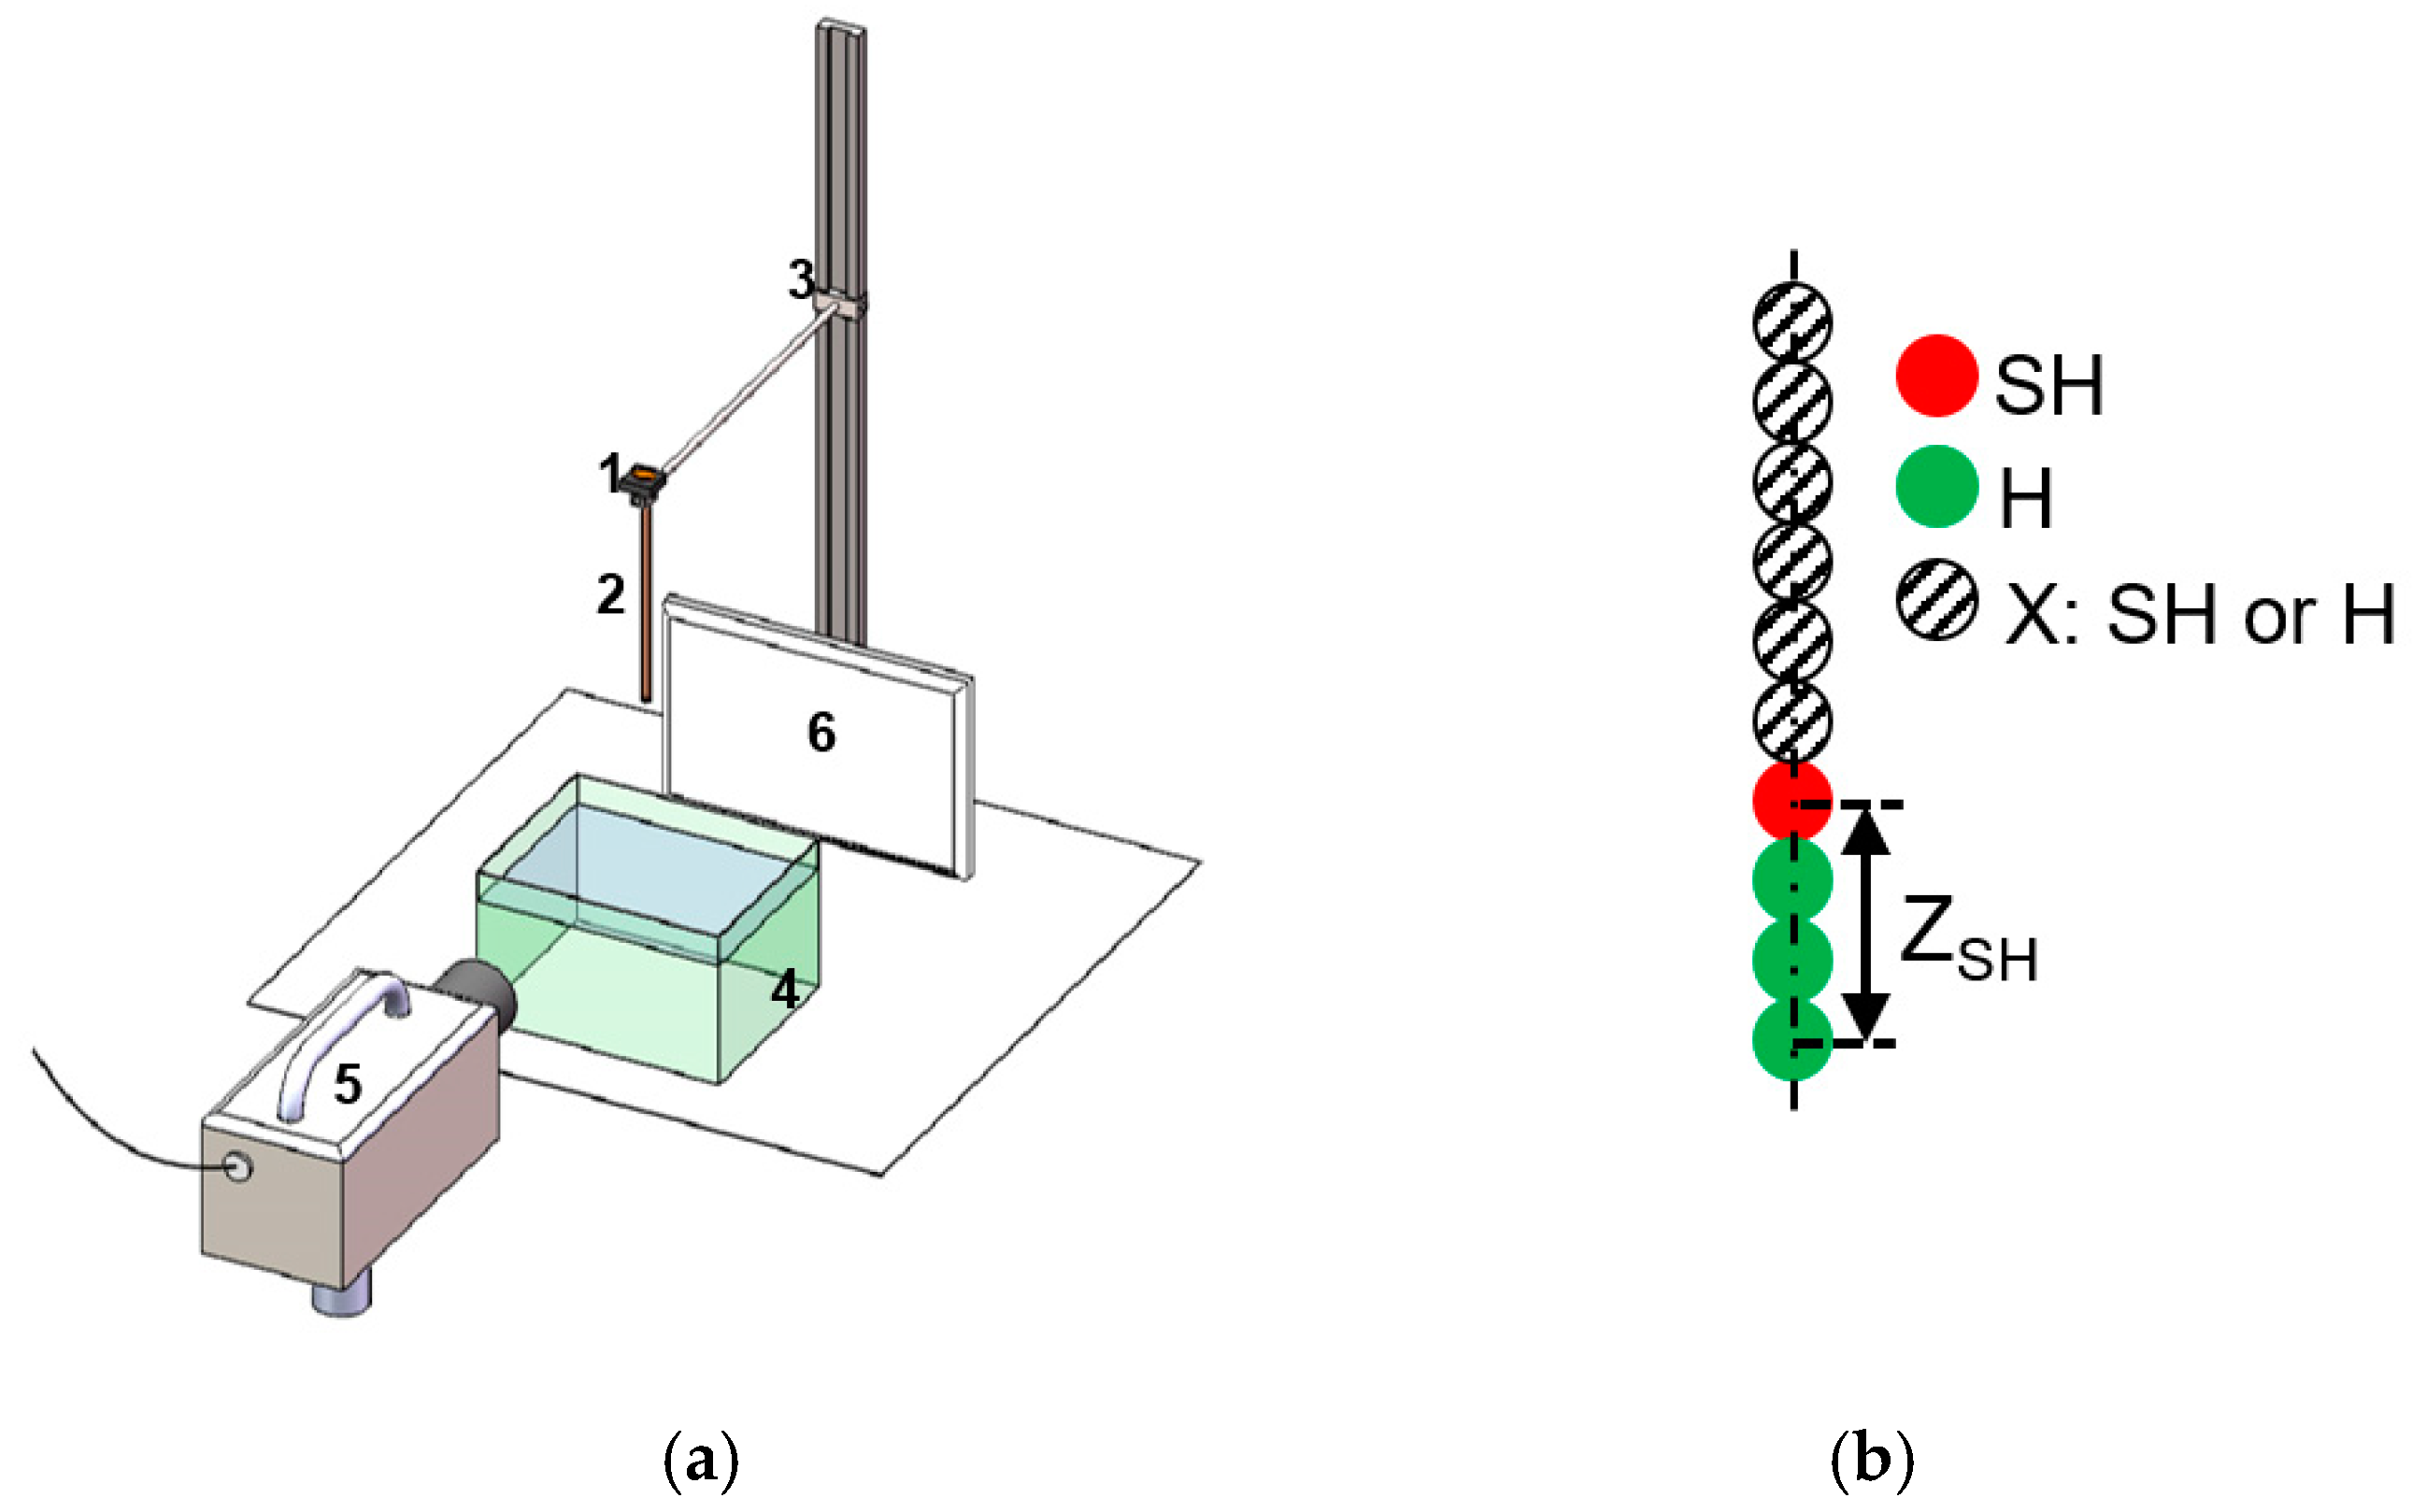
Figure 1. Schematic of (a) experimental set-up highlighting its major components: (1) magnetic switch; (2) long vertical tube; (3) vertical traverse; (4) liquid pool; (5) CCD camera; and (6) diffused backlighting. (b) The linear array of spheres defining the parameter ZSH which characterizes the position of the first SH sphere.
Colloids 03 00029 g001
Figure 2. Ca versus θo map showing the critical Ca for cavity formation as given for a single sphere by Equation (1) [5]; the values of θo for H (uncoated) and SH (coated) spheres are ≈74° (see Figure A1) and ≈161° [12], respectively. (Inset) Magnification of the SH case illustrating a control of Ca with ZSH.
Colloids 03 00029 g002
Figure 3. Images showing the time evolution of the impact process showing the effect of ZSH on the cavity evolution characteristics (V0 = 1 m/s). From top to bottom, ZSH = 0 mm, 5 mm, 15 mm, and 45 mm. The time instant (in milliseconds) of each frame is shown at its bottom left corner.
Colloids 03 00029 g003
Figure 4. Maximum cavity width: (a) Images showing the cavity width at different ZSH values (Vo = 1m/s), (b) A plot showing normalized maximum cavity width, Wmax/Ds versus ZSH/Ds.
Colloids 03 00029 g004
Figure 5. First pinch-off: (a) Variation of normalized relative pinch-off time, (tp1–tf1)(2g/Ds)0.50 with ZSH/Ds. (Inset) The variation of normalized pinch-off time, tp1(2g/Ds)0.50 and cavity formation time, tf1(2g/Ds)0.50 with ZSH/Ds. (b) Variation of normalized pinch-off depth, Hp1/Ds with ZSH/Ds. (The image on the right shows a typical cavity profile when the first pinch-off happens).
Colloids 03 00029 g005
Figure 6. Second pinch-off: (a) Normalized pinch-off time, tp2(2g/Ds)0.50 and (b) normalized pinch-off depth, Hp2/Ds of the wake cavity for four categories of linear arrays based on the wetting of first and last spheres in the array. Case I: H/H. Case II: SH/H. Case III: SH/SH. Case IV: H/SH. (The image on the right shows a typical cavity profile when the second pinch-off happens).
Colloids 03 00029 g006