Abstract
Fast electron transfer between laccase (Lac) and single-walled carbon nanotubes (SWCNTs) can be achieved at a cholate-modified SWCNT interface. Furthermore, the catalytic reduction of O2 starts at a high potential, close to the equilibrium redox potential of the O2/H2O couple. A sodium cholate (SC)-modified electrode interface provides suitable conditions for Lac direct bioelectrocatalysis. In the present study, the SC promotional effect in Lac direct bioelectrocatalysis was investigated using various types of electrode materials. The fully hydrophilic surface of indium tin oxide and an Au electrode surface did not show a SC promotional effect, because SC did not bind to these surfaces. A carbon surface with a large number of defects was unsuitable for SC binding because of hydrophilic functional groups at the defect sites. Carbon surfaces with few defects, for example, basal-plane highly oriented pyrolytic graphite (HOPG), gave a SC promotional effect.
1. Introduction
Steroid biosurfactants such as cholate, deoxycholate, taurocholate, and deoxycholate are large, rigid, planar, hydrophobic moieties that have a steroid nucleus with two or three hydroxyl groups. These biosurfactants have been used as solubilizers for nucleotide- and membrane-binding proteins [1]. Furthermore, these biosurfactants, especially sodium cholate (SC, Figure 1), are outstanding dispersing agents for nanocarbon, especially single-walled carbon nanotubes (SWCNTs) [2,3,4].
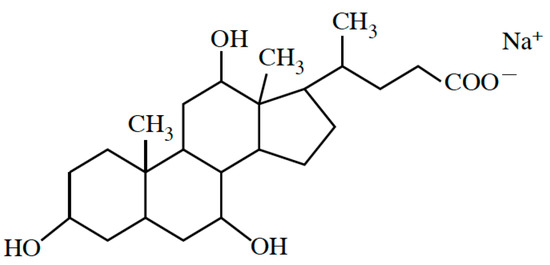
Figure 1.
Chemical structure of sodium cholate.
Direct electron transfer reactions between proteins (enzymes) and electrodes have been extensively studied from the viewpoints of both, understanding the fundamental features and for applications as biosensors and biofuel cell [5,6,7,8,9,10,11]. Typically, enzymatic biofuel cell has been focused because of their possibility to harvest energy out of non-toxic and non-combustible compounds like sugar opened the way for glucose biofuel cells [5,6,7,8,9,10,11,12,13,14,15,16]. However, the transfer of electrons involved in the redox reactions to an external circuit is a challenging theme. This difficulty is due to the redox center of the enzyme buried deeply within the protein shell. This requires the molecular orientation of the enzyme on the electrode surface for achievement for direct electron transfer reaction.
Most enzymes used for the bioelectrocatalytic reduction of oxygen into water are from the multicopper enzyme family, such as laccase (Lac) and bilirubin oxidase. Lac contains four copper atoms within its active sites, which are classified as type-1 (T1), type-2 (T2), and type-3 (T3) Cu sites according to their spectroscopic and magnetic properties [5,6,7,17]. T2 and T3 sites form a trinuclear copper cluster called type-2/3 Cu (T2/3 Cu). The T1 Cu site functions as the primary electron acceptor, and shuttles electrons to the T2/3 Cu site, where O2 is fully reduced to water without releasing a H2O2 intermediate [5,6,7,12,13,14,17,18,19]. Lac has a number of strong advantages over other multicopper oxidases, such as a high turnover catalytic frequency [6] and high catalytic efficiency at high redox potentials [11,15,20,21,22,23,24]. Practical applications of Lac as a catalyst for enzymatic biocathodes require direct electron transfer via fast interfacial tunneling. Attention has focused on engineering of Lac electrode interfaces and materials such as planar and nanostructured carbon materials with physically adsorbed Lac, surface-functionalized Au electrodes, carbon nanotube wires, and carbon or Au nanoparticles have been developed [5,6,7,11,12,13,14,15,16,17,18,19,20,21,22,23,24]. We developed SC-functionalized SWCNT interfaces for fast interfacial tunneling of Lac [5,6,7]. An SC-SWCNT electrode provides fast electron tunneling at pH 3, namely 4–5 × 103 cm−1·s−1, with a high O2 reduction potential that is close to the equilibrium redox potential of the O2/H2O couple (1.05 V vs. NHE at pH 3.0) [25,26,27,28]. Taking previous research into account, this SC promotion effect would come from the Lac orientation controlling onto the interface through hydorphobic and/or π–π interactions between the SWCNT interface and T1 Cu site of Lac located the substrate-binding pocket [5,6,7,11,12,13,14,15,16,17,18,19,20,21,22,23,24]. However, it was unclear whether the SC effect could be achieved with other planar electrodes, such as Au, metallic oxides, and carbon electrodes. In the present study, we clarified which electrode types give the SC effect and the reasons for their suitability. Furthermore, SC adsorption on a basal-plane highly oriented pyrolytic graphite (HOPG) electrode and the thickness of the SC molecular layer at its interface were investigated to gain insights into Lac direct bioelectrocatalysis via fast interfacial tunneling.
2. Materials and Methods
Sodium cholate (SC) was obtained from Wako Pure Chemical Industries (Osaka, Japan). Fungal Lac from Trametes sp. (Enzyme Commission number EC 1.10.3.2) was obtained from Amano Enzyme (Nagoya, Japan) and purified by a previously reported method [16]. The Lac purity was confirmed by SDS-PAGE (sodium dodecyl sulfate-polyacrylamide gel electrophoresis), which gave a single band at approximately 63 kDa [26]. The Lac concentration was determined from its molar absorption coefficient, that is, 5700 (mol·dm−3)−1·cm−1 at 614 nm [29]. Potassium hexacyanoferrate (III) (K3[Fe(CN)6]) and hexa-ammineruthenium (III) chloride ([Ru(NH3)6]Cl3) were obtained from Wako Pure Chemical Industries (Osaka, Japan).
Plastic formed carbon (PFC) plate (electrode area: 0.28 cm2, Mitsubishi Pencil Co., Ltd., Tokyo, Japan) was obtained from the Tsukuba Materials Information Laboratory, Ltd. (Tsukuba, Japan). Prior to use, the surface was polished with 0.05 mm alumina slurry, followed by sonication in Milli-Q water for 10 min. HOPG plate (electrode area: 0.28 cm2) was obtained from Veeco Instruments, New York, NY, USA. Prior to use, the surface of the basal plane was peeled off with adhesive tape to expose a fresh basal plane. A tin-doped indium oxide (ITO) electrode (electrode area: 0.25 cm2, tin-doped indium oxide thickness: ca. 30 nm), which was used as a metallic oxide, was obtained from the Kinoene Optics Co., Tokyo, Japan. The ITO electrode surface was cleaned with a UV–ozone system (OC-2503 model, Eye Graphics Co., Ltd., Tokyo, Japan) for 3 min to remove organic contaminants [30]. An Au disk electrode (electrode area: 0.20 cm2) was obtained from the BAS Co., Ltd. (Tokyo, Japan). Prior to use, the disk surface was polished with 0.05 μm alumina slurry, followed by sonication in water.
The electrode with a fresh surface was immersed in 0.2% (w/v) SC aqueous solution for 30 min. For Lac modification, the electrode was immersed in 0.1 mol·dm−3 acetate buffer solution (pH 5) containing 5 μmol·dm−3 Lac at 8 °C for 30 min. Finally, each electrode surface was gently rinsed with 0.1 mol·dm−3 acetate buffer solution.
Voltammetric measurements were performed with an electrochemical analyzer (ALS/CHI model 600A) with a conventional three-electrode cell. The reference electrode was Ag|AgCl|saturated KCl (+199 mV vs. NHE) and a Pt plate was used as the counter electrode. All potentials are reported with respect to Ag|AgCl|saturated KCl at 25 °C. For the Lac bioelectrocatalysis experiments, 0.1 mol dm−3 acetate buffer solution (pH 5) was used as the electrolyte; it was purged with high-purity argon before measurements were performed. A steady-state sigmoidal shape (with a plateau current) in the voltammograms of Lac adsorbed on the electrodes was obtained by stirring the buffer solution with a magnetic stirrer. The cell temperature was controlled at 25 °C by a thermostated incubator. The redox waves of K3[Fe(CN)6] and [Ru(NH3)6]Cl3 were examined in 0.1 mol dm−3 acetate buffer solution.
Cyclic voltammograms were simulated with cyclic voltammetric simulation software (DigiSim 2.0, Bioanalytical Systems, Tokyo, Japan) [31].
Raman spectroscopy was performed with a HORIBA LabRAM HR-800 instrument (HORIBA Jobin Yvon, Les Ulis, France) with 514 nm (2.41 eV) laser excitation. All images were captured with a digital charge-coupled device camera. Wavenumbers were calibrated against the 520 cm−1 emission of the silica slides used for analysis. A 50× long lens was used to focus the laser at 2 μm, with a laser power of 0.2 mW.
3. Results and Discussion
3.1. Dependence of SC Effect on Electrode Type
To investigate the SC promotion effect against the different type of planar electrode, we used two types of carbon electrodes of HOPG and PFC, ITO, and Au electrodes. Figure 2 shows cyclic voltammograms for HOPG, PFC, ITO, and Au electrodes after immersion in SC solution and then Lac solution. A catalytic O2 reduction current was observed at the SC-treated HOPG electrode from +0.65 V; this arises from direct electron transfer between immobilized Lac and the HOPG electrode. However, the O2 reduction potential from +0.65 was lower potential than the previously obtained result at SC-modified SWCNT interface. This direct bioelectrocatalytic current was not observed at the bare HOPG electrode (i.e., HOPG without SC treatment). This clearly indicates that SC plays an important role in promoting direct electron transfer from Lac at the HOPG interface. In contrast, direct bioelectrocatalytic currents were not observed at PFC, ITO, and Au electrodes, although these electrode surfaces were immersed in SC solution. It should be noted that the PFC did not give the SC promotional effect although it is a carbon material. Possible reasons for these results are as follows. The SC molecules were not adsorbed on the PFC, ITO, and Au electrode interfaces. Alternatively, the SC molecules were adsorbed on the electrode surfaces, but the direct electron transfer reaction with Lac did not occur.
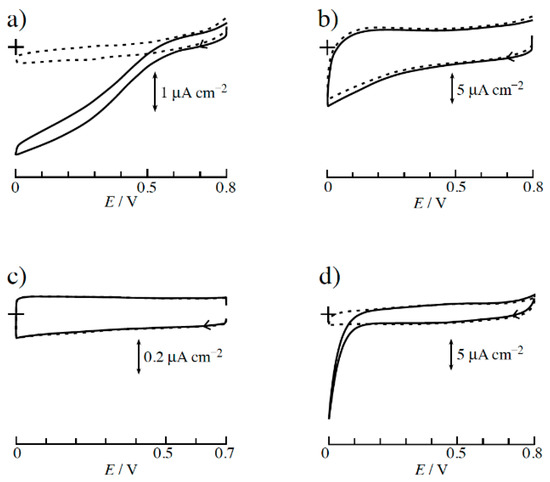
Figure 2.
Cyclic voltammograms in 0.1 mol·dm−3 acetate buffer solution (pH 5) for (a) highly oriented pyrolytic graphite (HPOG), (b) plastic formed carbon (PFC), (c) tin-doped indium oxide (ITO), and (d) Au electrodes treated with 0.2 wt.% SC solution, and then 5 μmol·dm−3 Lac solution containing O2 (solid line) and Ar gas (broken line). Potential sweep rate was 10 mV·s−1.
3.2. SC Adsorption Behavior
The dependence of the SC promotional effect on the electrode type was clarified by investigating SC adsorption phenomena, with redox complexes [Fe(CN)6]3− and [Ru(NH3)6]3+ as probes. The redox reactions of [Fe(CN)6]3− and [Ru(NH3)6]3+ are strongly affected by electrode interface conditions [32]. It was expected that the redox behavior would change when SC was adsorbed on the interface. Figure 3 shows the changes in the redox behaviors of [Fe(CN)6]3− and [Ru(NH3)6]3+ at the HOPG electrode before and after surface modification with SC. As described above, the HOPG electrode gave a SC promotional effect in direct bioelectrocatalysis. This clearly indicates that SC was adsorbed on its surface. Figure 3a shows that the redox reaction of [Fe(CN)6]3− was inhibited at the SC-modified HOPG interface, but that of [Ru(NH3)6]3+ was not affected. The results obtained with [Fe(CN)6]3− and [Ru(NH3)6]3+ differed because the SC molecule has a negatively charged carboxylic acid group bound to the steroid framework; therefore, electrostatic repulsion should occur between [Fe(CN)6]3− and the SC-modified HOPG interface, but not at the interface with [Ru(NH3)6]3+. These results show that [Fe(CN)6]3− is a suitable indicator for monitoring SC adsorption. The redox reactions of [Fe(CN)6]3− at the PFC, ITO, and Au electrodes were also investigated. No change in the redox behavior was observed at these electrodes, which indicates that SC molecules did not adsorb on the PFC, ITO, and Au interfaces. This suggests that the fully hydrophilic surfaces of the ITO and Au interfaces did not interact with the hydrophobic steroid framework. Moreover, electrostatic interactions between the negatively charged carboxylic acid bound to the steroid framework and the electrode interface is not expected because the ITO and Au interfaces are slightly negatively charged.
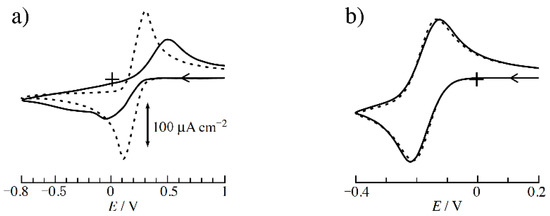
Figure 3.
Cyclic voltammograms of 2 mmol dm−3 (a) [Fe(CN)6]−3 and (b) [Ru(NH3)6]+3 at sodium cholate (SC)-modified HOPG (solid line) and bare HOPG (broken line) electrodes in 0.1 mol·dm−3 acetate buffer solution (pH 5). Potential sweep rate was 20 mV·s−1.
The PFC electrode material is carbon, which is the same materials as HOPG. Carbon defects are important to decide its surface characteristics. Figure 4 shows Raman spectra of HOPG and PFC. Raman spectroscopy can be used to investigate sp2-hybridized structures in carbon materials, and yields information on defects and the crystalline structure [33,34]. The prominent features in the Raman spectra of HOPG and PFC are the G-band at ca. 1585 cm−1 and the D-band at ca. 1350 cm−1 [33,34]. The G-band is a doubly-degenerate phonon Raman active mode in sp2-structured carbon networks, whereas the D-band is localized where the lattice structure is not perfect, mostly at the edges, and at defects in the sp2-hybridized carbon structure. A D-band is not observed for HOPG. This indicates that the sp2-hybridized carbon structure HOPG is highly crystalline, with almost no defects at the detection level of this method. In contrast, the G/D intensity ratio for PFC was calculated to be ca. 0.65. The intensity of the D-band was higher than that of the G-band. Usually, defects in carbon are caused by cleavage of carbon sp2-bonds and oxidation by O2 at cleavage sites. Hydrophilic functional groups such as –C=O, –COOH, –C–OH, and –C–O–C– are present at defect sites [35,36,37]. The Raman results indicate that the PFC surface is more hydrophilic than HOPG. In fact, the contact angles of HOPG and PFC were obtained to be 71° (±2°) and 58° (±2°), which clearly indicated that the hydrophilicity of PFC was higher than that of HOPG. This could be why SC does not adsorb on the PFC interface.
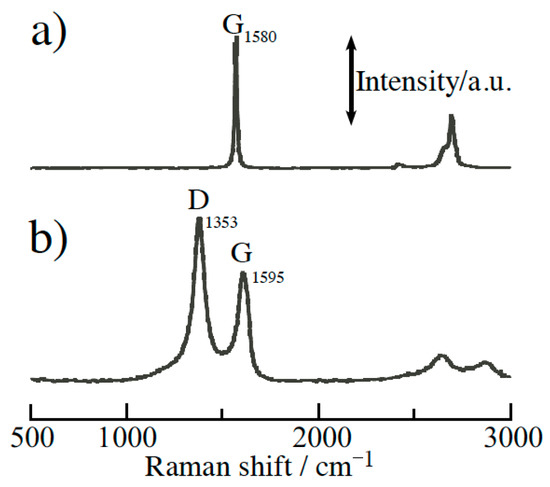
Figure 4.
Raman spectra of (a) HOPG and (b) PFC surfaces. Excitation laser wavelength: 514.5 nm (2.41 eV).
3.3. Analysis of SC Adsorption Phenomena at HOPG Interface
In the Section 3.2, we clarified the reasons for the dependence of the SC promotional effect on the electrode type. The SC promotional effect was observed only at the HOPG interface. We then investigated SC adsorption phenomena at the HOPG interface by using [Fe(CN)6]3− as a probe. Figure 5a shows the redox reaction of [Fe(CN)6]3− at the HOPG interface in 0.1 mol·dm−3 acetate buffer solution in the presence of SC. The redox reaction was rapidly inhibited, even when the concentration of SC was 40 nmol·dm−3, as shown by the increasing potential difference between the positive and negative peak potentials. The heterogeneous electron transfer rate (k˚’) of [Fe(CN)6]3− under these conditions was investigated by cyclic voltammogram digital simulation. The calculated k˚’ was 6.3 × 10 cm·s−1, which is similar to the previously reported value [32]. Addition of 40 nmol·dm−3 SC caused the k˚’ of [Fe(CN)6]3− to decrease to 6.3 × 10 cm·s−1 from the value of 11.5 × 10 cm·s−1 obtained with no SC (Figure 5b). The reaction of [Fe(CN)6]3− was inhibited because SC adsorbed easily on the HOPG interface. The degree of inhibition became almost constant at SC concentrations higher than 400 nmol·dm−3. The adsorption behavior of SC was analyzed by plotting the k˚’ values as a function of SC concentration (Figure 6a) [38]. The k˚’ value decreased quickly with increasing SC concentration up to ca. 10 nmol dm−3, and then decreased slowly until ca. 40 nmol·dm−3. The k˚’ values were almost constant or decreased slightly at 40–4000 nmol·dm−3. We thus concluded that binding of SC molecules to the HOPG interface reached a maximum at a SC concentration of 40 nmol·dm−3. The Frumkin adsorption isotherm (Equation (1)) was used to analyze the SC adsorption behavior [38].
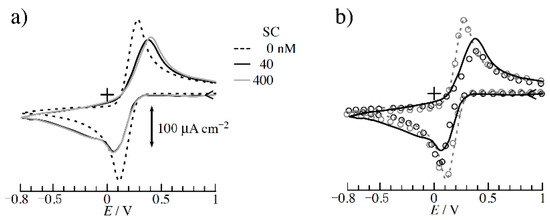
Figure 5.
(a) Cyclic voltammograms of [Fe(CN)6]3− at HOPG electrode in 0.1 mol·dm−3 acetate buffer solution in the absence (broken line) and presence of 40 (solid black line) and 400 (solid gray line) nmol·dm−3 SC at potential sweep rate of 20 mV·s−1. (b) Simulated cyclic voltammograms (open circle) fitted to experimental voltammograms at HOPG electrode in the absence (broken line) and presence (solid line) of 40 nmol·dm−3 SC. The electrochemical parameters for the simulated voltammograms were as follows: electrode area 0.28 cm2; heterogeneous electron transfer rate constants (k˚’) 11.5 × 10⁻⁴, and 6.1 × 10⁻⁴ cm·s−1 for bare HOPG (broken line) and SC-modified HOPG (solid line), respectively; transfer coefficients 0.5 and 0.63, respectively; redox potential E˚’ = 0.191 V; and diffusion coefficient 1.4 × 10⁻⁵ cm2·s−1 [30].
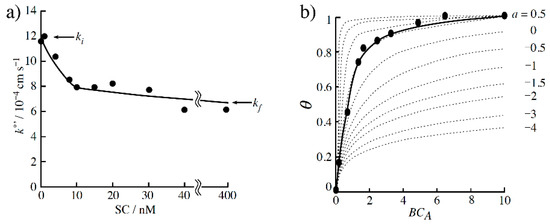
Figure 6.
(a) Heterogeneous electron transfer rate (k˚’) as function of SC concentration. The k˚’ value was estimated from the simulated analysis of the cyclic voltammograms of [Fe(CN)6]3− at HOPG in 0.1 mol·dm−3 acetate buffer solution in the presence of various concentrations of SC at potential sweep rate of 20 mV·s−1. (b) SC coverage (θ) as a function of BCA (B: adsorption coefficient, CA: SC concentration) and curves (broken line) simulated by Frumkin adsorption isotherm at various values of the interaction coefficient (a). The θ value was estimated from Equation (2).
In Equation (1), B is the adsorption coefficient, CA is the SC concentration, a is an interaction coefficient, and θ is the surface coverage of the HOPG interface by SC. If we assume that electron transfer rate is linearly related to the coverage ratio of SC at the HOPG interface, θ can be described by Equation (2), where ki˚’ is the initial k˚’ obtained in the absence of SC, kf˚’ is the k˚’ value at a SC concentration of 40 nmol·dm−3, and k˚’ is the obtained value at a given value of the SC concentration.
Figure 6b shows the obtained θ values as a function of BCA, and the simulated curve when various a values were used. The figure clearly shows that the obtained results fitted the simulated curve well according to Equation 1, when a was 0.5 and B was 1.4 (±0.4) × 108. Usually, in the Frumkin adsorption isotherm, the a value indicates the following: a > 0, an attractive force between molecules; a = 0, no interactions between molecules; and a < 0, a repulsive force between molecules. For SC, a (=0.5) > 0, which indicates slight attraction between SC molecules and the HOPG interface. Direct bioelectrocatalysis of Lac at the HOPG interface was also observed when SC and Lac were both present (Figure 7b), but the catalytic current was much smaller than that obtained for only HOPG surface modification with SC (Figure 7a). This could be because of the slow electron transfer rate of Lac. The electron transfer rate is strongly affected by the electron tunneling distance. The electron transfer rate decreases in proportion to exp (−βR), where R is the edge-to-edge electron tunneling distance and β is proportional to the square root of the barrier height [39,40]. SC molecules act as an insulating barrier and inhibit fast electron transfer when the SC molecules form a multilayer on the HOPG interface.
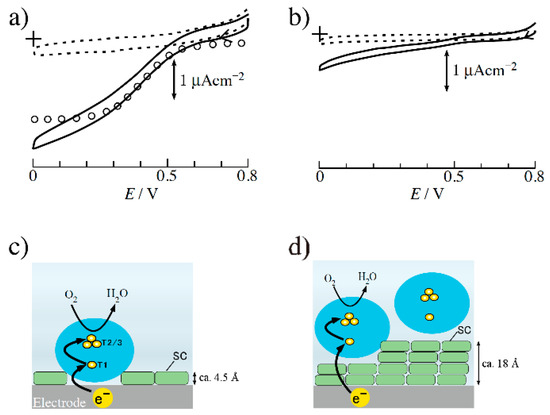
Figure 7.
(a) Lac direct bioelectrocatalytic current obtained at a) SC-modified HOPG electrode in 0.1 mol·dm−3 acetate buffer solution (pH 5) containing O2 (solid line) and Ar gas (broken line), and Simulated cyclic voltammograms (open circle) fitted to experimental voltammograms (Supplementary Material). (b) Bioelectrocatalytic current obtained at HOPG electrode in 0.1 mol·dm−3 acetate buffer solution (pH 5) in the presence of 1 μmol·dm−3 Lac and 10 nmol·dm−3 SC; (c,d) show schematic diagrams of electron tunneling between Lac and HOPG through SC layer under conditions in (a,b), respectively.
The electron transfer rate constant (k˚’) for Lac at the SC-modified HOPG was evaluated by previously reported methods [25,26,27]. Figure 7a shows the catalytic current steady-state voltammograms and their fittings with simulated plots (Supplementary Material). The obtained onset potential (+0.65 V) for O2 reduction was similar to the previously reported value, suggesting that the T1 Cu site is the primary electron acceptor from the HOPG electrode, and electrons are shuttled to the T2/T3 Cu site, at which O2 is fully reduced to water (Figure 7c,d) [7]. The simulated curve fitted the experimental bioelectrocatalytic current curves when the individual values of the determined parameters were used as shown in Table 1. The residual slope obtained potential of ca. 0.3–0 V in Figure 7a could be a result of random orientation effect of Lac. The determined k˚’ value was 30–115 s−1, which is much smaller than the value obtained at the SC-modified SWCNT electrode. The reason for the difference is as yet unclear, but it may come from the differences between the morphologies of the atomically flat HOPG surface and the atomically one-dimensional SWCNTs. SC molecule binding would be suited to a slightly curved surface because SC has a slightly curved steroid framework.

Table 1.
Estimated parameters from experiments and simulation.
Roughly, without accounting endergonic tunneling compensation, we used Equation (3) to evaluate the electron tunneling distance between the T1 Cu site of Lac and the modified electrode surface from the obtained k˚’ values [41].
where ket is the electron tunneling rate; ρ is the packing density of protein atoms in the volume between the redox centers, to account for the β variations in exergonic electron tunneling rates; R is the edge-to-edge distance; λ is the energy required to reorganize the nuclear coordinates on electron transfer; and ΔG is the driving force for electron transfer. The β value is included as a function of ρ [42]. Assuming that ρ = 0.78, ket = k˚ (for Lac) at ΔG = −λ, and R is the distance between the T1 Cu site of Lac and the HOPG surface, R is calculated to be 9.3 (±0.5) Å, where R is the included thickness of the SC layer (LSC) on the HOPG interface electrode, as shown in Figure 7c. The LSC value can thus be obtained with Equation 4 from the distance (L) between the T1 Cu site of Lac and the outside of the Lac protein structure:
log10ket = 13.0 − (1.2 − 0.8ρ)(R − 3.6) − 3.1(ΔG + λ)2/λ
LSC = R − L
The L value was previously reported to be 6.5 Å [24,43]. The calculated LSC value is 2.8 (±0.5) Å. This LSC value is slightly smaller than 4.5 Å, which is the value obtained from the CPK model (space-filling model) of a SC monolayer adsorbed on a HOPG surface. This result may suggest that the SC molecules are present at the sub-monolayer level, and such SC sub-monolayer may promote electron transfer from Lac.
4. Conclusions
SC adsorption phenomena strongly depend on surface hydrophilicity and hydrophobicity. SC was not adsorbed on hydrophilic surfaces such as ITO and Au. However, SC adsorption on hydrophobic carbon surfaces such as HOPG was good. SC did not bind well to PFC, although it is a carbon material, because PFC has a large number of defects. These results were obtained from the redox reaction of the charged complex [Fe(CN)6]3−. Electrochemical methods are useful for investigating surfactant binding on electric conducting materials.
The SC adsorption phenomena at the HOPG interface were investigated with the Frumkin adsorption isotherm. The SC coverage was evaluated from the k˚’ values of [Fe(CN)6]3− at the HOPG interface. The results indicate that the SC molecule is slightly attracted to the HOPG interface. In a solution containing a high concentration of SC, the SC molecules form a multilayer on the HOPG interface. The resulting SC layer acts as an insulating barrier and inhibits fast electron transfer from Lac.
Supplementary Materials
The following are available online at http://www.mdpi.com/2504-5377/2/3/33/s1. Equation: simulated analysis of the steady-state current density.
Author Contributions
Conceptualization, M.T. (Correspondence); Experiments, M.T. and T.T.; Writing—Original Draft Preparation, M.T. (Correspondence).
Funding
This research was financially supported by the Hosokawa Powder Technology Foundation, Japan.
Acknowledgments
We thank Helen McPherson from Edanz Group (www.edanzediting.com/ac) for editing a draft of this manuscript.
Conflicts of Interest
The authors declare no conflict of interest.
References and Note
- Jones, M.B.; Garrison, J.C. Instability of the G-protein β5 subunit in detergent. Anal. Biochem. 1999, 268, 126–133. [Google Scholar] [CrossRef] [PubMed]
- Liu, H.; Nishide, D.; Tanaka, T.; Kataura, H. Large-scale single-chirality separation of single-wall carbon nanotubes by simple gel chromatography. Nat. Commun. 2011, 309, 1–8. [Google Scholar] [CrossRef] [PubMed]
- Wenseleers, W.; Vlasov, I.I.; Goovaerts, E.; Obraztsova, E.D.; Lobach, A.S.; Bouwen, A. Efficient isolation and solubilization of pristine single-walled nanotubes in vile salt micelles. Adv. Funct. Mater. 2004, 14, 1105–1112. [Google Scholar] [CrossRef]
- Ishibashi, A.; Nakashima, N. Individual dissolution of single-walled carbon nanotubes in aqueous solutions of steroid or sugar compounds and their Raman and near-IR spectral properties. Chem. Eur. J. 2006, 12, 7595–7602. [Google Scholar] [CrossRef] [PubMed]
- Solomon, E.I.; Sundaram, U.M.; Machonkin, T.E. Multicopper Oxidases and Oxygenases. Chem. Rev. 1996, 96, 2563–2605. [Google Scholar] [CrossRef] [PubMed]
- Cracknell, J.A.; Vincent, K.A.; Armstrong, F.A. Enzymes as working or inspirational electrocatalysts for fuel cells and electrolysis. Chem. Rev. 2008, 108, 2439–2461. [Google Scholar] [CrossRef] [PubMed]
- Shleev, S.; Tkac, J.; Christenson, A.; Ruzgas, T.; Yaropolov, A.I.; Whittaker, J.W.; Gorton, L. Direct electron transfer between copper-containing proteins and electrodes. Biosens. Bioelectron. 2005, 20, 2517–2554. [Google Scholar] [CrossRef] [PubMed]
- Armstrong, F.A.; Wilson, G.S. Recent developments in faradaic bioelectrochemistry. Electrochim. Acta 2000, 45, 2623–2645. [Google Scholar] [CrossRef]
- Cosnier, S.J.; Gross, A.; Le Goff, A.; Holzinger, M. Recent advances on enzymatic glucose/oxygen and hydrogen/oxygen biofuel cells: Achievements and limitations. J. Power Sources 2016, 325, 252–263. [Google Scholar] [CrossRef]
- Willner, I.; Willner, B.; Katz, E. Biomolecule–nanoparticle hybrid systems for bioelectronic applications. Bioelectrochemistry 2007, 70, 2–11. [Google Scholar] [CrossRef] [PubMed]
- Shleev, S.; Andoralov, V.; Falk, M.; Reimann, C.T.; Ruzgas, T.; Srnec, M.; Ryde, U.; Rulíšek, L. On the possibility of uphill intramolecular electron transfer in multicopper oxidases: Electrochemical and quantum chemical study of bilirubin oxidase. Electroanalysis 2012, 24, 1524–1540. [Google Scholar] [CrossRef]
- Barton, S.C.; Gallaway, J.; Atanassov, P. Enzymatic biofuel cells for implantable and microscale devices. Chem. Rev. 2004, 104, 4867–4886. [Google Scholar] [CrossRef] [PubMed]
- Leech, D.; Kavanagh, P.; Schuhmann, W. Enzymatic fuel cells: Recent progress. Electrochim. Acta 2012, 84, 223–234. [Google Scholar] [CrossRef]
- Mano, N.; Edembe, L. Bilirubin oxidases in bioelectrochemistry: Features and recent findings. Biosens. Bioelectron. 2013, 50, 478–485. [Google Scholar] [CrossRef] [PubMed]
- Katsounaros, I.; Cherevko, S.; Zeradjanin, A.R.; Mayrhofer, J.J. Oxygen electrochemistry as a cornerstone for sustainable energy conversion. Angew. Chim. Int. Ed. 2014, 53, 102–121. [Google Scholar] [CrossRef] [PubMed]
- Kamitaka, Y.; Tsujimura, S.; Setoyama, N.; Kajino, T.; Kano, K. Fructose/dioxygen biofuel cell based on direct electron transfer-type bioelectrocatalysis. Phys. Chem. Chem. Phys. 2007, 9, 1793–1801. [Google Scholar] [CrossRef] [PubMed]
- Dwivedi, U.N.; Singh, P.; Pandey, V.P.; Kumar, A. Structure–function relationship among bacterial, fungal and plant laccases. J. Mol. Catal. B Enzym. 2011, 68, 117–128. [Google Scholar] [CrossRef]
- Johnson, D.L.; Thompson, J.L.; Brinkmann, S.M.; Schuller, K.A.; Martin, L.L. Electrochemical characterization of purified Rhus Vernicifera Laccase: Voltammetric evidence for a sequential four-electron transfer. Biochemistry 2003, 42, 10229–10237. [Google Scholar] [CrossRef] [PubMed]
- Betancor, L.; Johnson, G.R.; Luckarift, H.R. Stabilized laccases as heterogeneous bioelectrocatalysts. ChemCatChem 2013, 5, 46–60. [Google Scholar] [CrossRef]
- Shleev, S.; Shumakovich, G.; Morozova, O.; Yaropolov, A. Stable ‘Floating’ air diffusion biocathode based on direct electron transfer reactions between carbon particles and high redox potential laccase. Fuell Cells 2010, 10, 726. [Google Scholar] [CrossRef]
- Pita, M.; Mate, D.; Gonzalez-Perez, D.; Shleev, S.; Fernandez, V.M.; Alcalde, M.; Lacey, A.L.D. Bioelectrochemical oxidation of water. J. Am. Chem. Soc. 2014, 136, 5892–5895. [Google Scholar] [CrossRef] [PubMed]
- Matijošyte, I.; Arends, I.W.C.E.; Sheldon, R.A.; Vries, S. Pre-steady state kinetic studies on the microsecond time scale of the laccase from Trametes versicolor. Inorg. Chim. Acta 2008, 361, 1202–1206. [Google Scholar] [CrossRef]
- Tarasevich, M.R.; Yaropolov, A.I.; Bogdanovskaya, V.A.; Varfolomeev, S.D. Electrocatalysis of a cathodic oxygen reduction by laccase. Bioelectrochem. Bioenergy 1979, 6, 393–403. [Google Scholar] [CrossRef]
- Wu, F.; Su, L.; Yu, P.; Mao, L. Role of organicsolvents in immobilizing fungus laccase on single-walled carbon nanotubes for improved current response in direct bioelectrocatalysis. J. Am. Chem. Soc. 2017, 139, 1565–1574. [Google Scholar] [CrossRef] [PubMed]
- Tominaga, M.; Sasaki, A.; Togami, M. Laccase bioelectrocatalyst at a steroid-type biosurfactant-modified carbon nanotube interface. Anal. Chem. 2015, 87, 5417–5421. [Google Scholar] [CrossRef] [PubMed]
- Tominaga, M.; Sasaki, A.; Tsushida, M.; Togami, M. Biosurfactants functionalized single-walled carbon nanotubes to promote laccase bioelectrocatalysis. New J. Chem. 2017, 41, 231–236. [Google Scholar] [CrossRef]
- Tominaga, M.; Sasaki, A.; Togami, M. Bioelectrocatalytic oxygen reaction and chloride inhibition resistance of laccase immobilized on single-walled carbon nanotube and carbon paper electrodes. Electrochemistry 2016, 84, 315–318. [Google Scholar] [CrossRef]
- Watanabe, N.; Devanathan, M.A.V. Reversible oxygen electrode. J. Electrochem. Soc. 1964, 111, 615–619. [Google Scholar] [CrossRef]
- Santucci, R.; Ferri, T.; Morpurgo, L.; Savini, I.; Avigliano, L. Unmediated heterogeneous electron transfer reaction of ascorbate oxidase and laccase at a gold electrode. Biochem. J. 1998, 332, 611–615. [Google Scholar] [CrossRef] [PubMed]
- Tominaga, M.; Hirata, N.; Taniguchi, I. UV-ozone dry-cleaning process for indium oxide electrodes for protein electrochemistry. Electrochem. Commun. 2005, 7, 1423–1428. [Google Scholar] [CrossRef]
- Rodolph, M.; Reddy, D.P.; Feldberg, S.W. A simulator for cyclic voltammetric responses. Anal. Chem. 1994, 66, 589A–600A. [Google Scholar] [CrossRef]
- Wong, C.H.A.; Pumera, M. Surfactants show both large positive and negative effects on observed electron transfer rates at thermally reduced graphenes. Electrochem. Commun. 2012, 22, 105–108. [Google Scholar] [CrossRef]
- Tuinstra, F.; Koenig, J.L. Raman spectrum of graphite. J. Chem. Phys. 1970, 53, 1126–1130. [Google Scholar] [CrossRef]
- Tuinstra, F.; Koenig, J.L. Characterization of graphite fiber surfaces with Raman spectroscopy. J. Compos. Mater. 1970, 4, 492–499. [Google Scholar] [CrossRef]
- McCreery, R.L. Advanced carbon electrode materials for molecular electrochemistry. Chem. Rev. 2008, 108, 2646–2687. [Google Scholar] [CrossRef] [PubMed]
- Ago, H.; Kugler, T.; Cacialli, F.; Salaneck, W.R.; Shaffer, M.S.P.; Windle, A.H.; Friend, R.H.J. Work functions and surface functional groups of multiwall carbon nanotubes. Phys. Chem. B 1999, 103, 8116–8121. [Google Scholar] [CrossRef]
- Tominaga, M.; Sakamoto, S.; Yamaguchi, H. Jungle-gym structured-film of single-walled carbon nanotubes on a gold surface: Oxidative treatment and electrochemical properties. J. Phys. Chem. C 2012, 116, 9498–9506. [Google Scholar] [CrossRef]
- Bard, A.J.; Faulkner, L.R. Electrochemical Methods, Funtamentals and Applications; John Wiley & Sons: New York, NY, USA, 1980; pp. 515–519. ISBN 0-4771-08753-X. [Google Scholar]
- Marcus, R.A.; Sutin, N. Electron transfer in chemistry and biology. Biochim. Biophys. Acta 1985, 811, 265–322. [Google Scholar] [CrossRef]
- Marcus, R.A. Electron transfer reactions in chemistry: Theory and experiment. Angew. Chem. Int. Ed. 1993, 32, 1111–1121. [Google Scholar] [CrossRef]
- Christopher, C.P.; Christopher, C.M.; Xiaoxi, C.; Dutton, P.L. Natural engineering principles of electron tunnelling in biological oxidation–reduction. Nature 1999, 402, 47–52. [Google Scholar]
- The ρ can range from values of 1 to 0, corresponding to a fully packed medium (β = 0.9 Å−1) and the interstitial space in the protein structure outside the united van der Waals atomic radii (β = 2.8 Å−1), respectively. The ρ weighting of β and β = (ρ)0.9 Å−1 + (1 − ρ)2.8 Å−1 generates the (1.2–0.8ρ) coefficient in Equation (3). The log of the optimal rate at 3.6 Å van der Waals contact is 13.
- Pionetek, K.; Antorini, M.; Choinowski, T. Crystal structure of a laccase from the fungus trametes versicolor at 1.90-Å resolution containing a full complement of coppers. J. Biol. Chem. 2002, 277, 37663–37669. [Google Scholar] [CrossRef] [PubMed]
© 2018 by the authors. Licensee MDPI, Basel, Switzerland. This article is an open access article distributed under the terms and conditions of the Creative Commons Attribution (CC BY) license (http://creativecommons.org/licenses/by/4.0/).