Abstract
Density, viscosity and speed of sound of aqueous solutions of nonionic surfactants such as polyoxyethylene (20) sorbitan monolaurate (Tween 20) and polyoxyethylene (20) sorbitan monostearate (Tween 60) at T = 293, 303 and 313 K are reported. From these measured values different parameters such as, for example, isentropic compressibility, molecular free length, acoustic impedance, primary hydration numbers and internal pressure have been calculated and employed to discuss molecular packing, structural alteration and molecular interactions. The variation in these parameters with temperature indicates that the mobility of surfactant molecules increases the disordered state of the liquid (surfactant + water) due to irregular packing of the molecules. Also, for Tween 20 solutions, more conversion to bulk water of the structured water molecules was observed, obtaining lower compressibilities and higher values of hydration numbers as well as internal pressure for a given T.
1. Introduction
An important class of nonionic surfactants widely used in the pharmaceutical industry are polysorbates, that is, amphipathic surfactants composed of fatty acid esters of polyoxyethylene sorbitan known as Tweens. Their popularity is largely due to their effectiveness at low concentrations and relative low toxicities. In addition, they do not usually interact, or at least not largely, with active ingredients [1,2,3,4,5,6]. These surfactants are also widely used in the food industry because of their excellent emulsifying properties, and they also find applications as aerating agents and lubricants in cakes, toppings, cookies, and crackers [7,8,9]. As an example, polysorbate 60 (Tween 60) is used as a dough strengthening co-emulsifier in bakery products. Also, sorbitan esters of fatty acids and polysorbates have been used in surfactant mixtures [10,11,12]. For example, Losada-Barreiro et al. (2013) evaluated the effects of the HLB of mixtures of four nonionic amphiphiles (Tween 20, 40, 80, and Span 20) on the partition between the aqueous and oil phases plus the interface of gallic acid, propyl gallate, and alpha-tocopherol (antioxidants) in edible emulsions formulated with corn oil, acidic water, and a mixture [13].
It should be noted that the micelles of surfactant are of crucial significance in the pharmaceutical sciences. Surfactant molecules form associates in the aqueous/non-aqueous solution beyond a certain concentration called micelles and this phenomenon is known as critical micelle concentration (CMC) [14,15]. Owing to their particular structure, which limits the presence of water in the internal sites, micelles provide an energetically more favourable environment for residence of amphiphilic drugs compared with the bulk aqueous solution [16]. The consumption of micelles in the form of drug carriers is more valuable than other types of carriers owing to their tiny mass (~10–30nm) and the enhanced stability of the drug in the course of micelle inclusion [17]. Thus, in order to prepare micelles, it is essential to extract the volumetric properties data such as density, molar volume, apparent molar volume or apparent molar expansibility. The reports in the literature on the physicochemical properties of Tween solutions at different temperature are still incomplete or contrary [18,19,20,21,22].Considering that this information on the volumetric and viscometric properties of Tween is very important in order to elucidate solute-solute and solute-solvent (water) interactions and to understand their effects on the water-structure, the purpose of the present study was to determine these properties for the aqueous solutions of Tween 20 and Tween 60 in a wide range of concentrations and at temperatures equal to 293, 303 and 313 K. For this, the speed of sound, density and viscosity of aqueous solutions of the above mentioned Tweens were determined and different physical and chemical parameters were calculated. Furthermore, various molecular interactions in these solutions were analyzed based on their alteration with concentration and temperature.
2. Experimental Method
2.1. Materials and Methods
Aqueous solutions of polyethylene glycol sorbitan monolaurate, Tween® 20 (T20) (Sigma-Aldrich, St. Louis, MO, USA; CAS: 9005-65-5; lauric acid, ≥40%,balance primarily myristic, palmitic, and stearic acids) and polyethylene glycol sorbitan monostearate, Tween® 60 (T60) (Sigma-Aldrich; CAS: 9005-67-8; stearic acid, 40–60%, total stearic and palmitic acid, ≥90%) were prepared in the concentration range from 10−6 to 10−2 M, using doubly distilled and deionized water obtained from a Destamat Bi18E distiller.
The speed of sound as well as the densities of aqueous solutions of studied surfactants at the temperatures 293, 303 and 313 K were simultaneously and automatically measured using a digital vibrating tube densitometer and the speed of sound analyzer (Anton Paar DSA 5000 M, Graz, Austria) equipped with automatic viscosity correction and two integrated Pt 100 thermometers. Both the speed of sound and density are extremely sensitive to temperature, so it was kept constant within 0.001 K using a proportional temperature controller. The apparatus was first calibrated with triply-distilled water and dry air. The standard uncertainties in density measurements were estimated to be ±2 × 10⁻³ kg·m−3 but for the speed of sound it was ±0.1 m s−1.
All dynamic viscosity measurements of the aqueous solutions of the studied surfactants were performed with the Anton Paar viscometer (AMVn) at 293–313 K ± 0.01 K with a precision of 0.0001 mPas and an uncertainty of 0.3%.
All speed of sound/density and viscosity measurements were made for 3 samples of two set measurements. Next, for a given concentration of surfactant and temperature, the average value of speed of sound, density and viscosity was calculated and used for other calculations and discussion.
2.2. Calculations
The increase in the concentration of a given surfactant in an aqueous solvent reveals a sudden change in various aqueous surfactant solution properties, which are attributed to the formation of aggregates of surfactant molecules above the CMC. To characterize this process, first, the distance between the surfaces of two molecules, that is, the molecular free length, , should be determined. The values of , which depend on both intermolecular and intramolecular interactions occurring among the components in a solution can be obtained from the expression [23]:
where and is the isentropic compressibility, which can be determined from the speed of sound () and density () using the Newton-Laplace equation [24]:
The temperature increase also has an impact on the values of acoustic impedance () of the studied solutions, which can be calculated from the expression [23]:
is the ratio of the effective sound pressure at a point and the effective particle velocity at that point or the impedance offered to the sound wave by the solution components. In other words, the acoustic impedance is one of the most significant parameters that describes the medium and targets the molecular packing of the system in terms of different types of interactions.
The changes of both and Z values can be associated with those of size and/or shape of the surfactant micelles, disorder of the water molecules around the surfactant molecules, and hydration of their oxyethylene chains. Of the methods presented in the literature to determine hydration numbers, the ultrasonic measurements allow the primary hydration numbers to obtain, , through the expression [25,26]:
where and are the numbers of moles of water and solute, respectively, and is the isentropic compressibility of pure water. Equation (4) implicitly assumes that (1) is the number of water molecules in the hydration shell of the solute whose properties are altered with respect to those of the bulk solvent by the presence of the solute, and (2) these molecules of water are trapped so tightly that they can be considered as incompressible.
Knowing the density and speed of sound of surfactant solutions, the values of available volume (), molar sound velocity (), volume expansivity () and apparent molar volume () can be calculated from the following equations [27,28,29,30]:
where = 1600 ms−1, is the molar volume, is the molecular weight of the surface active agent, and is the density of the “pure” solvent.
Next, from the values of at different temperatures and concentrations, it is possible to calculate the following thermodynamic parameters: reduced volume (), Moelwyn-Hughes parameter (), reduced compressibility (), isochoric temperature coefficient of internal pressure (), Sharma parameter (), Huggins parameter (), isochoric temperature coefficient of volume expansivity (), anharmonic microscopic isothermal Gruneisen parameter (), fractional free volume (), Gruneisen parameter (), isobaric thermo-acoustic parameter () and the isochoric thermo-acoustic parameter () [31,32,33,34].
Taking into account the measured values of dynamic viscosity of surfactant solutions (), it is possible to calculate the shear activation energy (), that is, the energy that is necessary to move individual micelles in the environment of surrounding micelles and express the interactions between individual aggregates from the Arrhenius law, which has the form [35,36]:
where is the is pre-exponential factor.
Using the experimental density, speed of sound and dynamic viscosity data it is possible to calculate one of the fundamental properties of liquid, that is, the internal pressure () from the following equation:
where the packing factor is assumed to be equal to 2 in the liquid system, and = 4.28 × 10⁹ is the constant independent of the nature of the liquid [37,38].
3. Results and Discussion
Taking into account the measured values of and of aqueous solutions of T20 and T60 (Figure 1, Figure 2, Figure 3 and Figure 4) the values of both and were calculated (Equations (1) and (2)) and are presented in Table 1 and Table 2, respectively. The presented data indicates that for both studied surfactants the values decrease significantly with the increasing concentration at C higher than 10−4 M and 10−3 M for T20 and T60, respectively. This decrease can be attributed to the presence of specific strong intermolecular interactions among surfactant molecules in micelles in the solution and indicates that the structural readjustment in the solution proceeds towards a less convenient phase, that is, closer packing of the molecules. The smaller values of for T20 in the whole studied concentration range and at a given temperature suggest the presence of stronger solute-solvent interactions with a less compressible phase. It should be also noted that with the temperature increase the values of increase for a given surfactant, but there is a bigger difference between the values for T = 303 and 313 K than those between 293 and 303 K. Also, at a given C and at high T20 and T60 concentrations the values of decrease with the negative slopes (Table 1 and Table 2). These negative slopes indicate the development of higher intermolecular forces supported by densities and speed of sound attributed to breaking or stretching of interaction bonds in the self-associated dipole-dipole interactions between the Tween and water molecules. Taking into account the values of Z (Equation (3)) for T20 and T60 (Table 1 and Table 2), it follows that for a given surfactant the values of Z increase with T, but for a given T those for T20 are bigger than those for T60, which confirms stronger solute-solvent interactions in the T20 aqueous solutions.
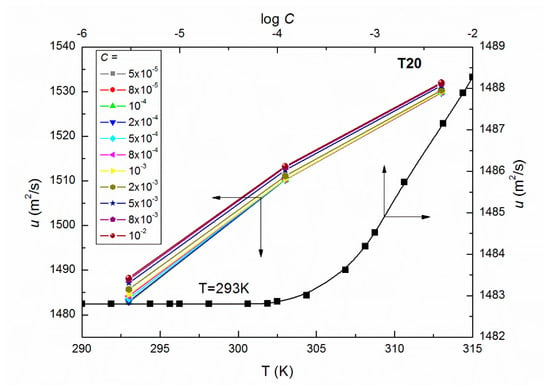
Figure 1.
A plot of the values of speed of sound of aqueous solutions of T20 at C from 5 × 10⁻⁵ to 10−2 M vs. the temperature, T as well as the values of of the aqueous solutions of T20 at T = 293 K vs. log C.
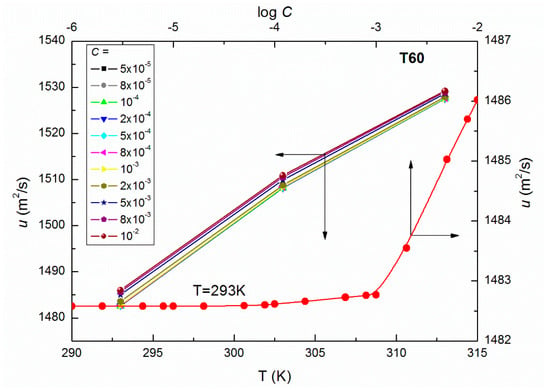
Figure 2.
A plot of the values of speed of sound of aqueous solutions of T60 at C from 5 × 10⁻⁵ to 10−2 M vs. the temperature, T as well as the values of of the aqueous solutions of T60 at T = 293 K vs. log C.
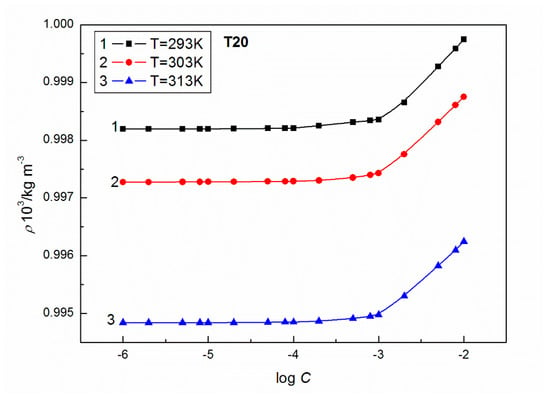
Figure 3.
A plot of the values of density of aqueous solutions of T20 at C from 10−6 to 10−2 M vs. log C at T = 293 K (curve 1), 303 K (curve 2) and 313 K (curve 3).
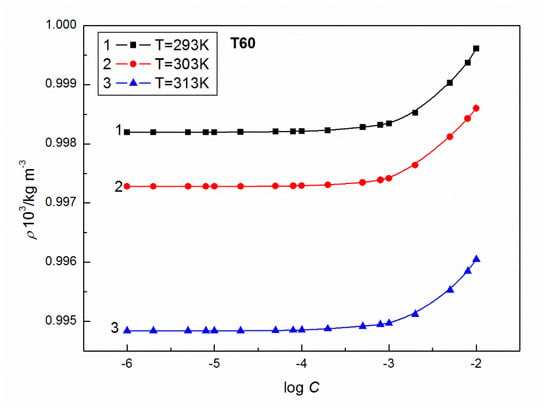
Figure 4.
A plot of the values of density of aqueous solutions of T60 at C from 10−6 to 10−2M vs. log C at C from 10−6 to 10−2 M vs. log C at T = 293 K (curve 1), 303 K (curve 2) and 313 K (curve 3).

Table 1.
Values of , , , and for the aqueous solutions of T20 at temperatures equal to 293, 303 and 313 K.

Table 2.
Values of , , , and for the aqueous solutions of T60 at temperatures equal to 293, 303 and 313 K.
As follows from Figure 5, at C higher than 10−3 M the calculated values of (Equation (4)) for T20 are higher than those for T60 which means that at T20 solutions more conversion to bulk water of the structured water molecules is observed, obtaining lower compressibilities and higher values of for a given T.
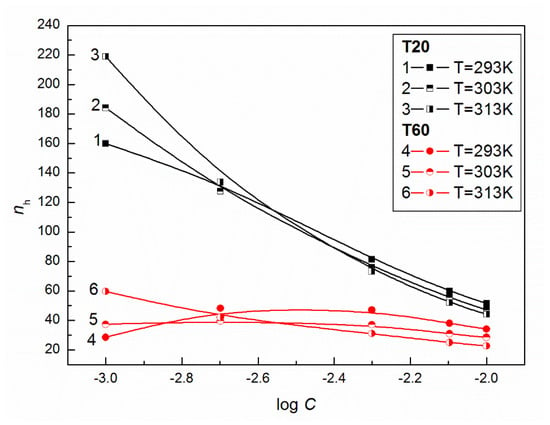
Figure 5.
A plot of the values of hydration numbers of aqueous solutions of T20 (curves 1–3) and T60 (curves 4–6) vs. log C at T = 293, 303 and 313 K.
This idea is also confirmed by the calculated values of and (Equations (5) and (6)), which suggest significant structural changes in the studied surfactant micelles with the increasing temperature and/or changes in the intermolecular interactions occurring between the surfactants and water. The mentioned interactions can be described, among others, by the values of also known as the coefficient of thermal expansion which is a measure of how the volume changes with the temperature, as presented in Figure 6. From this Figure it can be observed that at a given T for T20 at a concentration higher than 10−4 M, the values of decrease significantly in contrast to those for T60, for which at C > 10−3 M the values for the volume expansivity increase. Also, from the comparison of the values of T20 and T60 at T = 293 K it appears that at C < 10−3 M these values are higher for T20, but at C > 10−3 M the situation is quite opposite. This suggests that at a given temperature and high surfactant concentration, the water around T60 is loosely bound because of larger values of volume expansivity which is in accordance with the values (Table 1 and Table 2). A larger value of at a given concentration also indicates greater sensitivity in the volume change due to the temperature change. The results in Table S1 (Supplementary Materials) show that the values of fractional free volume (), which is expressed in terms of the repulsive exponent of intermolecular potential for both surfactants and a given C, show an increase with T and indicate that the mobility of surfactant molecules enhances the disordered state of the liquid (surfactant + water) due to irregular packing of the molecules [34]. At the same time the parameters , , , and show a decrease with the increasing temperature. Indeed, the changes in these parameters at C > 10−3 M are quite the opposite for T20 and T60 (Table S1).
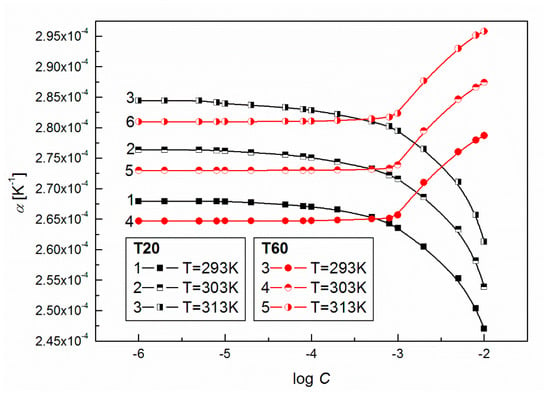
Figure 6.
A plot of the volume expansivity of aqueous solutions of T20 (curves 1–3) and T60 (curves 4–6) vs. log C at T = 293, 303 and 313 K.
To show the influence of surfactants’ concentration on the structure of the solution, the values of for T20 and T60 were calculated from Equation (8) and are presented in Figure 7. From this figure, it can be seen that at high surfactant concentration, the values of for T20 and T60 increase with T. For T60, when C is smaller than 10−3 M, a drop in apparent molar volume with T is observed. This probably indicates that more dimmers or trimmers are formed and their density is higher. The formation of such supramolecular structures should induce significant changes in the dynamic viscosity of solutions. As follows from Figure 8 and Figure 9, the values of dynamic viscosity () of aqueous solutions of T20 and T60 are highly sensitive to temperature changes. Also, the values of T60 at a given T are higher than those for T20 since depends on dispersion forces. This is in contrast to the and changes and might be connected with the larger sized and structured T60 micelles which have higher friction on the capillary, but lower than T20. As follows from Figure 10, the calculated values of for T20 are much larger than those for T60, and for both surfactants there is a significant increase at C > 10−3 M, which is in contrast to the already studied Tween 80 [39]. The values of the studied surfactants are between 15.9 and 18.2 kJ/mol and this confirms the existence of spherocolloids in the solution at the studied concentrations. On the other hand, as non-electrolytes with the hydrophilic 3-hydroxyl group, they have a high affinity for water and are involved in intramolecular hydrogen bonding with water. The viscosity coefficient is a good tool for providing information about salvation of the solute (surfactant) in the solution and the effect on the structure of the solvent (water) in the vicinity of solute molecules. This can be obtained from fitting the experimental viscosity data with the Jones-Dole equation from the plots of against where is the relative viscosity and C is the molar concentration [40,41]. The viscosity coefficient is a measure of the size and shape of the solute molecules as well as the structural effects induced by solute-solvent interactions.
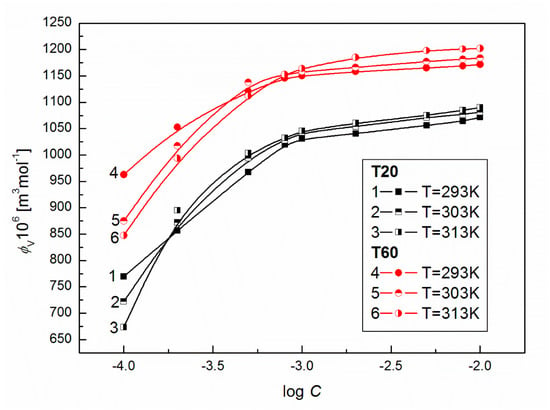
Figure 7.
A plot of the values of apparent molar volume of aqueous solutions of T20 (curves 1–3) and T60 (curves 4–6) vs. log C at T = 293, 303 and 313 K.
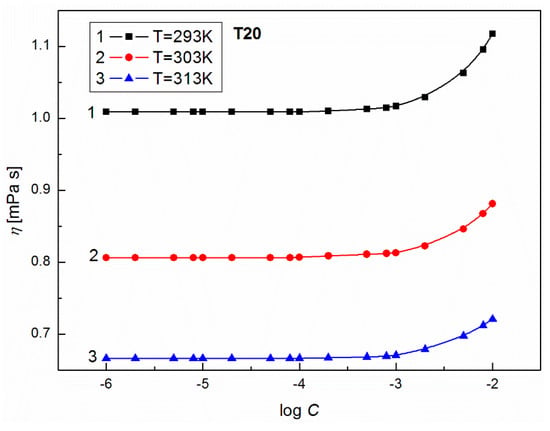
Figure 8.
A plot of the values of density of aqueous solutions of T20 at C from 10−6 to 10−2 M vs. log C at T = 293 K (curve 1), 303 K (curve 2) and 313 K (curve 3).
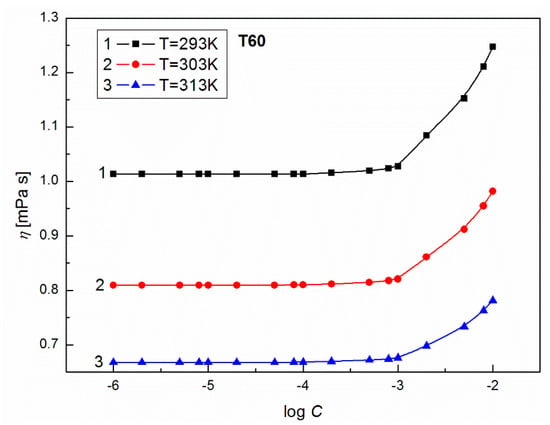
Figure 9.
A plot of the values of density of aqueous solutions of T60 at C from 10−6 to 10−2 M vs. log C at C from 10−6 to 10−2 M vs. log C at T = 293 K (curve 1), 303 K (curve 2) and 313 K (curve 3).
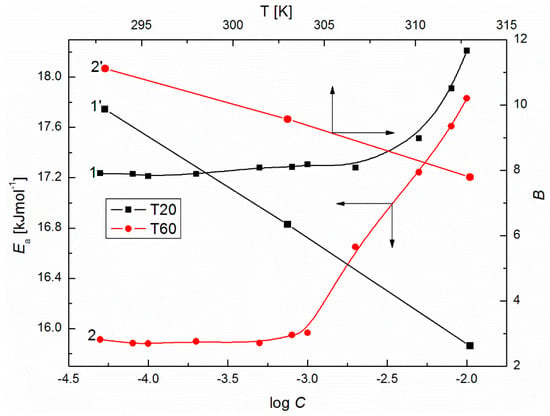
Figure 10.
A plot of the values of shear activation energy of aqueous solutions of T20 (curve 1) and T60 (curve 2) vs. log C as well as the values of coefficient of the aqueous solutions of T20 (curve 1’) and T60 (curve 2’) vs. the temperature, T.
As results from Figure 11 and Figure 12 show, a good linear dependence of the Jones-Dole equation was obtained for T20 and T60 for the post micellar region and the values obtained from these equations are positive, which denotes the water structure breaking nature of surfactant molecules. The higher positive values of for T60 suggest the greater kosmotropic effect in aqueous solutions of this surfactant, and then more solute-solvent interactions in the case of T60. It is interesting that the values of obtained for the post micellar region are equal to −0.36 and −0.17 for T20 and T60, respectively, and also, previous literature [42] indicates that this solute is a structure maker. It should be mentioned that when the surfactant aggregate forms, the released water molecules in the vicinity of the hydrophobic part of the molecule become bulk water. The water molecules around the hydrophobic part are highly structured, having a rather low compressibility compared to the bulk water. If the amphiphile becomes longer, more conversion to bulk water of the structured water molecules is observed, obtaining lower compressibilities. It should also be remembered that the studied Tweens belong to the polyethoxylated sorbitans, which possess a similar head group but a different hydrophobic chain; strain hydrocarbon chain in the T20 molecule formed by lauric acid and bent chain of stearic acid in the T60 molecule, which are responsible for their different physicochemical properties. For example, the density of aqueous solutions of T20 at a given T (Figure 3) is higher than for T60 (Figure 4) probably because of the lower hydrophobicity of T20 molecules. These higher densities facilitate the oscillation of atoms at a closer distance that easily pass on the sound waves to the surrounding atoms. Thus, T20 molecules with greater vibrations in the packed environment speed up the sound waves resulting in higher speed of sound (Figure 1).
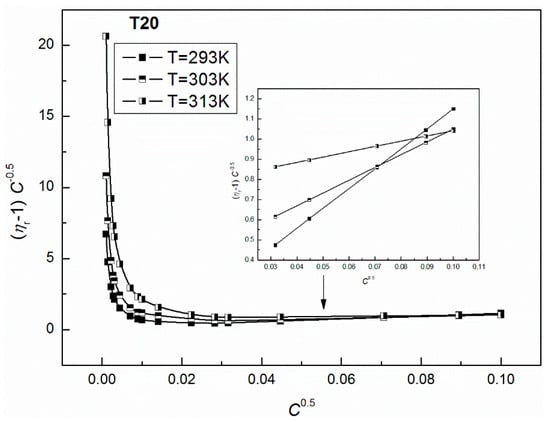
Figure 11.
A plot of the values of of the aqueous solutions of T20 at T = 293, 303 and 313 K vs. .
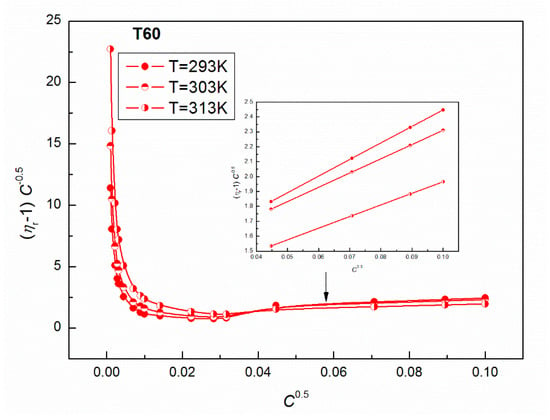
Figure 12.
A plot of the values of of the aqueous solutions of T60 at T = 293, 303 and 313 K vs. .
According to Sannaningannavar [19], in the studied range of T there are three possible types of intermolecular forces: (1) the dipole-dipole interactions between the neighbouring polar heads; (2) the dipole-induced dipole interactions between the polar head of one molecule with the induced dipole in the non-polar tail of the other molecule; and (3) the induced dipole-induced dipole interactions between the non-polar tails of neighbouring molecules. The effect of all these intermolecular forces is the main cause of cohesive forces between the molecules of each Tween liquid and one of the fundamental properties of liquid that is . As expected, there is an increase of with the surfactant concentration (Figure 13), which indicates an increase in intermolecular interactions due to the formation of aggregates of solvent molecules around the solute which affects the structural arrangement of the solvent system. Greater values for T20 at a given T confirm stronger inter-molecular forces between molecules in solutions. This fact is in accordance with the values of acoustic impedance, which also describes the cohesive forces between the surfactant molecules in solution (Table 2).
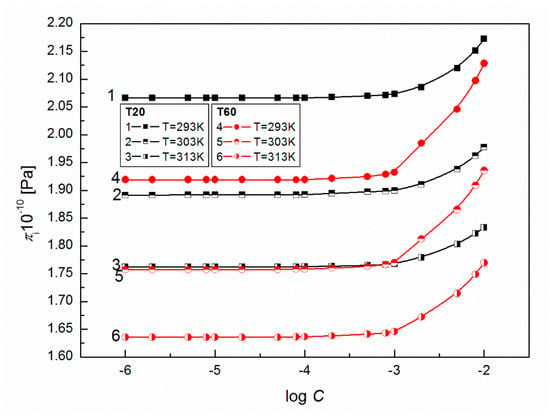
Figure 13.
A plot of the values of internal pressure of aqueous solutions of T20 (curves 1–3) and T60 (curves 4–6) vs. log C at T = 293, 303 and 313 K.
4. Conclusions
The influence of temperature on the thermodynamic parameters describing molecular order, molecular packing and movement of nonionic Tween molecules in solutions was studied. It was observed that with the rise of temperature, intermolecular cohesive forces were found to decrease and as a result, the values of and increased, but decreased with the temperature T. Due to this, loosening of the molecular packing was observed and the spacing between the molecules in each liquid sample increased, leading to a less ordered structure with the rise in T. Also, T20 developed a stabilized molecular configuration, which was highly structured. This was confirmed by the lower compressibilities and higher values of the hydration number for a given T.
Supplementary Materials
The following are available online at http://www.mdpi.com/2504-5377/2/3/34/s1,Table S1: Values of , , , , , , , , , , and for the aqueous solutions of T20 and T60 at the temperature equal to 293, 303 and 313 K.
Author Contributions
Conceptualization, K.S.; Investigation, M.S. and A.T.; Visualization, M.S. and A.T.; Writing—review & editing, K.S.
Funding
National Science Centre in Poland.
Acknowledgments
The financial support from the National Science Centre in Poland, Project No. 2014/15/B/ST4/05086 is gratefully acknowledged.
Conflicts of Interest
The authors declare no conflicts of interest.
References
- Mahjoubi, N.; Fazeli, A.; Dinarvand, R.; Khoshayand, M.R.; Shekarchi, M.; Fazelie, M.R. Effect of nonionic surfactants (Dodecyl Maltoside and Polysorbate 20) on prevention of aggregation and conformational changes of recombinant human IFNβ_1b induced by light. Iran J. Pharm. Res. 2017, 16, 103–111. [Google Scholar] [PubMed]
- Martos, A.; Koch, W.; Jiskoot, W.; Wuchner, K.; Winter, G.; Friess, W.; Hawe, A. Trends on analytical characterization of polysorbates and their degradation products in biopharmaceutical formulations. J. Pharm. Sci. 2017, 106, 1722–1735. [Google Scholar] [CrossRef] [PubMed]
- Hall, T.; Sandefur, S.L.; Frye, C.C.; Tuley, T.L.; Huang, L. Polysorbates 20 and 80 degradation by group XV lysosomal phospholipase A 2 isomer X1 in monoclonal antibody formulations. J. Pharm. Sci. 2016, 105, 1633–1642. [Google Scholar] [CrossRef] [PubMed]
- Li, Y.; Hewitt, D.; Lentz, Y.K.; Ji, J.A.; Zhang, T.Y.; Zhang, K. Characterization and stability study of Polysorbate 20 in therapeutic monoclonal antibody formulation by multidimensional ultrahigh-performance liquid chromatography–charged aerosol detection–mass spectrometry. Anal. Chem. 2014, 86, 5150–5157. [Google Scholar] [CrossRef] [PubMed]
- Jiao, J. Polyoxyethylated nonionic surfactants and their applications in topical ocular drug delivery. Adv. Drug Deliv. Rev. 2008, 60, 1663–1673. [Google Scholar] [CrossRef] [PubMed]
- Kerwin, B.A. Polysorbates 20 and 80 used in the formulation of protein biotherapeutics: Structure and degradation pathways. J. Pharm. Sci. 2008, 97, 2924–2935. [Google Scholar] [CrossRef] [PubMed]
- Bosmuler Züge, L.C.; Isidoro Haminiuk, C.W.; Maciel, G.M.; Meira Silveira, J.L.; de PaulaScheer, A. Catastrophic inversion and rheological behavior in soy lecithin and Tween 80 based food emulsions. J. Food Eng. 2013, 116, 72–77. [Google Scholar] [CrossRef]
- Yaghmur, A.; Aserin, A.; Garti, N. Phase behavior of microemulsions based on food-grade nonionic surfactants: Effect of polyols and short-chain alcohols. Colloid Surf. A 2002, 209, 71–81. [Google Scholar] [CrossRef]
- Sugumar, S.; Singh, S.; Mukherjee, A.; Chandrasekaran, N. Nanoemulsion of orange oil with non ionic surfactant produced emulsion using ultrasonication technique: Evaluating against food spoilage yeast. Appl. Nanosci. 2016, 6, 113–120. [Google Scholar] [CrossRef]
- Shah, A.; Tool, P.; Sorathiya, K.; Prajapati, H.; Dalrymole, D.; Serajuddin, A.T.M. Effect of different polysorbates on development of self-microemulsifying drug delivery systems using medium chain lipids. Drug Dev. Ind. Pharm. 2018, 44, 215–223. [Google Scholar] [CrossRef] [PubMed]
- Torres, L.G.; Rojas, N.; Iturbe, R. Use of two-surfactants mixtures to attain specific HLB values for assisted TPH-diesel biodegradation. J. Environ. Sci. 2004, 16, 950–956. [Google Scholar]
- O’Sullivan, S.M.; Woods, J.A.; O’Brien, N.M. Use of Tween 40 and Tween 80 to deliver a mixture of phytochemicals to human colonic adenocarcinoma cell (CaCo-2) monolayers. Br. J. Nutr. 2004, 91, 757–764. [Google Scholar] [CrossRef] [PubMed]
- Losada-Barreiro, S.; Sánchez-Paz, V.; Bravo-Díaz, C. Effects of emulsifier hydrophile-lipophile balance and emulsifier concentration on the distributions of gallic acid, propyl gallate, and α-tocopherol in corn oil emulsions. J. Colloid Interface Sci. 2013, 389, 1–9. [Google Scholar] [CrossRef] [PubMed]
- Rosen, J.M. Surfactants and Interfacial Phenomena, 3rd ed.; Wiley Interscience: New York, NY, USA, 2004. [Google Scholar]
- Schick, M.J. Nonionic Surfactants, Physical Chemistry, Surfactant Science Series; Marcel Dekker, Inc.: New York, NY, USA, 1987. [Google Scholar]
- Williams, H.D.; Trevaskis, N.L.; Charman, S.A.; Shanker, R.M.; Charman, W.N.; Pouton, C.W.; Porter, C.J.H. Strategies to address low drug solubility in discovery and development. Pharmacol. Rev. 2013, 65, 315–499. [Google Scholar] [CrossRef] [PubMed]
- Florence, A.T.; Hussain, N. Transcytosis of nanoparticle and dendrimer delivery systems: Evolving vistas. Adv. Drug Deliv. Rev. 2001, 50, 569–589. [Google Scholar] [CrossRef]
- Meena, J.; Singh, M. Hydrophobics and double bond of Tweens affecting water interactions estimated with physicochemical properties at T = 298.15 K. J. Mol. Liq. 2013, 220, 671–680. [Google Scholar] [CrossRef]
- Sannaningannavar, F.M.; Patil, S.N.; Melavanki, R.M.; Navati, B.S.; Ayachit, N.H. Thermodynamic parameters and their dependence on temperature in the range 298–353 K for ethoxylated sorbitan ester tween 20, 40, 60 and 80 surfactants. J. Surfactants Deterg. 2015, 18, 495–504. [Google Scholar] [CrossRef]
- Glenn, K.M.; Moroze, S.; Bhattacharya, S.C.; Palepu, R.M. Effect of ethylene glycol on the thermodynamic and micellar properties of Tween 40, 60, and 80. J. Dispers. Sci. Technol. 2005, 26, 79–86. [Google Scholar] [CrossRef]
- Hait, S.K.; Moulik, S.P. Determination of critical micelle concentration (CMC) of nonionic surfactants by donor-acceptor interaction with lodine and correlation of CMC with hydrophile-lipophile balance and other parameters of the surfactants. J. Surfactants Deterg. 2001, 4, 303–309. [Google Scholar] [CrossRef]
- Carnero Ruiz, C.; Molina-Bolıávar, J.A.; Aguiar, J.; MacIsaac, G.; Moroze, S.; Palepu, R. Effect of ethylene glycol on the thermodynamic and micellar properties of Tween 20. Colloid Polym. Sci. 2003, 281, 531–541. [Google Scholar] [CrossRef]
- Chauhan, S.; Sharma, K. Extended studies on molecular interactions of SDBS and DTAB in aqueous solutions of amino acid at T = 293.15–313.15 K. J. Mol. Liq. 2015, 211, 675–685. [Google Scholar] [CrossRef]
- Kiełek, K.; Marczak, W. Hydration of non-electrolytes in H2O and D2O investigated by Passynski’s method. Int. J. Thermophys. 2010, 31, 77–84. [Google Scholar] [CrossRef]
- Singh, T.; Kumar, A. Thermodynamics of dilute aqueous solutions of imidazolium based ionic liquids. J. Chem. Thermodyn. 2011, 43, 958–965. [Google Scholar] [CrossRef]
- Burakowski, A.; Gliński, J. Hydration numbers of non-electrolytes—Application of the acoustic method of Pasynski. Chem. Phys. 2007, 332, 336–340. [Google Scholar] [CrossRef]
- Sannaningannavar, F.M.; Navati, B.S.; Ayachit, N.H. Studies on thermo-acoustic parameters of poly(ethylene glycol)-400 at different temperatures. J. Therm. Anal. Calorim. 2013, 112, 1573–1578. [Google Scholar] [CrossRef]
- Gautam, P.K.; Gautam, R.K.; Rai, R.; Pandey, J.D. Thermodynamic and transport properties of sodium dodecylbenzenesulphonate (SDBS) in aqueous medium over the temperature range 298.15 K to 333.15 K. J. Mol. Liq. 2014, 191, 107–110. [Google Scholar] [CrossRef]
- Boden, N.; Corne, S.A.; Jolley, K.W. Lyotropic mesomorphism of the cesium pentadecafluorooctanoate/water system: High-resolution phase diagram. J. Phys. Chem. 1987, 1, 4092–4105. [Google Scholar] [CrossRef]
- Benjamin, L. Partial molal volume changes during micellization and solution of nonionic surfactants and perfluorocarboxylates using a magnetic density balance. J. Phys. Chem. 1966, 70, 3790–3797. [Google Scholar] [CrossRef]
- Sunil Babu, K.; Venkateswara Rao, A.; Madhavi Latha, D.; Pardhasaradhi, P.; Pisipati, V.G.K.M. Estimation of thermodynamic parameters in 4-(hexyloxybenzylidene)-4′alkoxy anilines, 6O·Om liquid crystalline compounds—A density study. J. Mol. Liq. 2016, 220, 999–1003. [Google Scholar] [CrossRef]
- Venkata Rao, D.; Pardhasaradhi, P.; Pisipati, V.G.K.M.; Madhavi Latha, D.; Datta Prasad, P.V. Estimation of thermodynamic parameters in 3.Om and 3O.Om liquid crystalline compounds. J. Mol. Liq. 2015, 211, 90–95. [Google Scholar] [CrossRef]
- Reddy, R.R.; Rama Gopal, K.; Narasimhulu, K.; Siva Sankara Reddy, L.; Raghavendra Kumar, K.; Venkatesulu, A.; Krishna Reddy, C.V. Correlations between Moelwyn–Hughes parameter, available volume and intermolecular free-lengths in liquid systems. J. Mol. Liq. 2008, 140, 48–53. [Google Scholar] [CrossRef]
- Sannaningannavar, F.M.; Patil, S.N.; Navati, B.S.; Melavanki, R.M.; Ayachit, N.H. Studies on thermodynamic properties of pure poly(ethylene glycol)-400 in the temperature range 299–363 K using volume expansivities. Polym. Bull. 2013, 70, 3171–3183. [Google Scholar] [CrossRef]
- Subrahmanyam, M.S.R.; Vedanayagam, H.S.; Venkateshwar, R.D.; Rajaiah, A.; Venkatacharyulu, P. Estimation of Sharma constant and thermoacoustic properties of fatty acids. J. Am. Oil Chem. Soc. 1995, 72, 1537–1540. [Google Scholar] [CrossRef]
- Huang, J.; Zhang, S.; Feng, Y.; Li, J.; Yan, H.; He, F.; Wang, G.; Liu, Y.; Wang, L. Rheological properties and application of wormlike micelles formed by sodium oleate/benzyltrimethyl ammonium bromide. Colloid Surf. A 2016, 500, 222–229. [Google Scholar] [CrossRef]
- Kumar, R.; Mahesh, R.; Shanmugapriyan, B.; Kannappan, V. Volumetric, viscometric, acoustic and refractometric studies of molecular interactions in certain binarysystems of o-chlorophenol at 303.15 K. Indian J. Pure Appl. Phys. 2012, 50, 633–640. [Google Scholar]
- Chauhan, S.; Kumar, K.; Patial, B.S. Study of acoustical parameters f proline in lecithin–ethanol mixture at varying temperature. Indian J. Pure Appl. Phys. 2013, 51, 531–541. [Google Scholar]
- Szymczyk, K.; Taraba, A. Aggregation behavior of Triton X-114 and Tween 80 at various temperatures and concentrations studied by density and viscosity measurements. J. Therm. Anal. Calorim. 2016, 126, 315–326. [Google Scholar] [CrossRef]
- Jones, G.; Dole, M. The viscosity of aqueous solutions of strong electrolytes with special reference to barium chloride. J. Am. Chem. Soc. 1929, 51, 2950–2964. [Google Scholar] [CrossRef]
- Ali, A.; Hyder, S.; Akhtar, Y. Viscometric studies of a-amino acid in aqueous NaCl and MgCl2 at 303 K. Indian J. Phys. 2005, 79, 157–160. [Google Scholar]
- Huque, M.; Siddiquey, I.A.; Uddin, N. Volumetric and viscometric studies on dodecyltrimethylammonium bromide in aqueous and in aqueous amino acid solutions in premicellar region. J. Chem. Thermodyn. 2006, 38, 1474–1478. [Google Scholar] [CrossRef]
© 2018 by the authors. Licensee MDPI, Basel, Switzerland. This article is an open access article distributed under the terms and conditions of the Creative Commons Attribution (CC BY) license (http://creativecommons.org/licenses/by/4.0/).