Review

Comparative Diagnostic Performance of Artificial Intelligence Versus Conventional Approaches for Early Detection of Mosquito-Borne Viral Infections: A Systematic Review and Meta-Analysis, with Evidence Predominantly from Dengue Studies


1
PhD National Program in One Health Approaches to Infectious Diseases and Life Science Research, Department of Public Health, Experimental and Forensic Medicine, University of Pavia, 27100 Pavia, Italy
2
Faculty of Medicine, University Vita-Salute San Raffaele, 20132 Milan, Italy
3
Department of Cardiac, Thoracic, Vascular Sciences, and Public Health, University of Padua, Via Loredan 18, 35128 Padua, Italy
*
Authors to whom correspondence should be addressed.
Mach. Learn. Knowl. Extr. 2026, 8(4), 93; https://doi.org/10.3390/make8040093
Submission received: 1 March 2026 / Revised: 31 March 2026 / Accepted: 2 April 2026 / Published: 7 April 2026
(This article belongs to the Section Thematic Reviews)

Abstract

Background: Early differentiation of mosquito-borne viral infections from other causes of acute febrile illness remains challenging, particularly in endemic and resource-limited settings. Artificial intelligence (AI) models have been proposed to improve early diagnosis, but their incremental value over conventional approaches is unclear. Methods: We conducted a systematic review and meta-analysis of comparative studies evaluating AI/machine learning models versus conventional approaches (clinical assessment, laboratory-based pathways, or traditional statistical models) for early detection of mosquito-borne viral infections. PubMed, Embase, and Scopus were searched through August 2025. Paired performance metrics were synthesized using fixed- and random-effects models. Outcomes included AUC, sensitivity, specificity, accuracy, positive predictive value (PPV), and negative predictive value (NPV). Risk of bias was assessed using PROBAST. Results: Thirteen studies met inclusion criteria. Under random-effects models, AI improved sensitivity (ES = 2.64, p = 0.028), specificity (ES = 5.55, p < 0.001), accuracy (ES = 3.19, p < 0.001), and NPV (ES = 13.84, p < 0.001). No consistent advantage was observed for AUC, and PPV findings were inconsistent. Substantial heterogeneity was present across outcomes (I2 = 100%). Most studies relied on internal validation, and PROBAST identified high risk of bias in the analysis domain in over half. Conclusions: AI-based models may enhance threshold-dependent performance metrics, supporting their use as adjunctive decision-support tools for early triage and case exclusion, while external validation and implementation-focused research remain essential.

1. Introduction

Early differentiation of mosquito-borne viral infections, particularly dengue, chikungunya, and Zika, from other causes of acute febrile illness remains a persistent clinical challenge, particularly in endemic and resource-constrained settings [1,2,3]. During the first days of presentation, symptoms are largely nonspecific, while confirmatory laboratory testing may be unavailable, delayed, or selectively applied [4,5]. As a result, early clinical decision-making often relies on imperfect combinations of bedside assessment, limited laboratory parameters, and simple statistical risk models, with important implications for patient triage and public health surveillance [6,7].
In recent years, artificial intelligence (AI) and machine learning (ML) approaches have been increasingly proposed to support early diagnosis of arboviral infections using routinely collected clinical and laboratory data, with several models reporting high apparent performance in retrospective and prospective cohorts [8,9,10]. Indeed, recent systematic reviews highlight generally promising performance in supporting clinical decision-making while also identifying persisting limitations and challenges in developing predictive models from limited datasets [8,11]. Studies focus mainly on the three most common infections (Dengue, Chikungunya, and Zika), employ predominantly binary classification, and provide limited evidence on multi-class differential diagnosis. Furthermore, evaluation practices are often suboptimal, with inadequate consideration of class imbalance, limited assessment of model generalizability, and inconsistent reporting of performance metrics. These issues underscore the need to move beyond the commonly adopted standalone accuracy, focusing instead on the incremental benefit of AI/ML approaches compared with conventional diagnostic strategies [12]. From a translational perspective, this distinction is critical: the clinical relevance of AI depends not on absolute performance alone but on whether it meaningfully improves upon conventional approaches such as clinical assessment, laboratory-based diagnostic pathways, or traditional statistical models (e.g., logistic regression) [13,14]. Importantly, a growing number of studies now report direct, within-cohort comparisons between AI/ML models and these established comparators [15,16,17], creating an opportunity to quantify relative diagnostic benefit—evidence that has not yet been systematically synthesized.
We therefore conducted a systematic review and meta-analysis of studies directly comparing AI/ML-based diagnostic models with traditional diagnostic approaches for early detection of mosquito-borne viral infections. Importantly, this review specifically focuses on diagnostic models operating at the individual patient level. This choice reflects our primary objective of evaluating the incremental clinical utility of AI/ML approaches in supporting real-world diagnostic decision-making at the point of care, where individual-level predictions directly inform triage, testing, and management strategies. Models developed for population-level prediction, outbreak forecasting, or surveillance, although highly relevant from a public health perspective, address fundamentally different analytical questions and were therefore considered outside the scope of the present synthesis. Our aims were to quantify pooled differences in diagnostic performance between AI/ML and comparator strategies, assess heterogeneity and risk of bias across studies, and characterize methodological features influencing comparative effectiveness. By focusing on head-to-head evaluations, this work seeks to clarify the current added value and limitations of AI-driven diagnostics in real-world arboviral case identification.

2. Materials and Methods

2.1. Study Design and Search Strategy

This systematic review was performed in accordance with the Preferred Reporting Items for Systematic Reviews and Meta-Analyses (PRISMA 2020) guidelines [18], with the protocol registered in PROSPERO (CRD420261306082). We conducted a comprehensive search of PubMed/MEDLINE, Embase, and Scopus up to 11 August 2025. The search strategy integrated controlled vocabulary terms and free-text keywords related to AI, ML, deep learning (DL), and mosquito-borne viral infections, including dengue, Zika, chikungunya, West Nile, yellow fever, and Rift Valley fever. The review specifically targeted comparative diagnostic accuracy studies evaluating AI/ML models against conventional diagnostic approaches for early detection of mosquito-borne viral infections. To ensure completeness, reference lists of eligible articles and relevant reviews were manually screened, and subject-matter experts were consulted to identify additional published studies. Only peer-reviewed studies with fully accessible data were considered eligible for inclusion in order to ensure transparency, reproducibility, and consistency in study selection. The search strategy was intentionally designed to be highly sensitive and inclusive, covering a broad range of mosquito-borne viral infections (e.g., dengue, chikungunya, Zika, West Nile virus, yellow fever, and Rift Valley fever). Full database-specific search strategies are reported in Supplementary Table S1.

2.2. Eligibility Criteria

We included original peer-reviewed studies enrolling human participants of any age evaluated for suspected mosquito-borne viral infection in any clinical or surveillance setting. Studies based on synthetic datasets were also considered eligible if the data were explicitly designed to simulate individual-level clinical presentations and diagnostic scenarios, and if model development and evaluation were conducted in a manner directly applicable to patient-level diagnostic decision-making. Further, we included original peer-reviewed studies evaluating suspected mosquito-borne viral infection in any clinical or surveillance setting, provided that: (i) an AI/ML model was developed or validated for early diagnosis (at or near first presentation); and (ii) Model performance was reported alongside at least one traditional comparator, defined as: laboratory-based diagnostic approaches (e.g., RT-PCR, ELISA-supported clinical workflows), clinical assessment or rule-based algorithms, and/or conventional statistical models (e.g., logistic regression or similar parametric methods).
Eligible studies were required to report extractable quantitative performance metrics for both AI/ML and comparator approaches, including at least one of the following: area under the receiver operating characteristic curve (AUC), sensitivity, specificity, accuracy, positive predictive value (PPV), negative predictive value (NPV), or F1-score.
We included retrospective and prospective diagnostic accuracy studies as well as model development/validation studies, provided comparative data were available.
We excluded: studies relying exclusively on non-human or vector data; investigations based solely on environmental or climatic predictors without individual-level diagnostic outcomes; reviews, editorials, commentaries, case reports, guidelines, and trial protocols; conference abstracts without full text; studies not published in English.

2.3. Study Selection

Search results were collated in Rayyan (Rayyan Systems Inc., Cambridge, MA, USA), where duplicate entries were identified and removed. Initial eligibility was assessed through independent title and abstract screening by two reviewers. Any discordant decisions were resolved through discussion, with involvement of a third reviewer when consensus could not be reached. Studies passing this stage were subjected to independent full-text evaluation to determine final inclusion in accordance with the predefined criteria.

2.4. Data Extraction

Data extraction was performed using a standardized extraction framework developed a priori and pilot-tested on a subset of included studies. The selection of variables included in the data extraction framework was guided by both conceptual and methodological considerations aligned with the objectives of this review. First, given the comparative aim of assessing the incremental diagnostic value of AI/ML models over conventional approaches, it was essential to extract detailed and paired information on both AI/ML models and their corresponding comparators within the same study populations. Second, the framework was informed by established methodological guidance for prediction model research, including key domains highlighted in tools such as PROBAST, as well as reporting recommendations for diagnostic accuracy and machine learning studies. Third, variables were selected to capture known sources of heterogeneity in AI-based diagnostic research, including differences in data sources, feature types, model development and validation strategies, and implementation readiness. Finally, the extraction framework was iteratively refined through pilot testing on a subset of included studies to ensure completeness, clarity, and applicability across diverse study designs. For each eligible article, two reviewers independently collected bibliographic details (first author, year of publication, continent, and country) and core study characteristics, including study design, recruitment period, clinical or community setting, target population, and disease focus. Diagnostic definitions were recorded, specifying whether case ascertainment relied on clinical suspicion, laboratory confirmation, or combined criteria, together with the temporal availability of predictors relative to clinical presentation.
Methodological features were systematically captured, including strategies for handling missing or imbalanced data, calibration procedures, data partitioning schemes (training, testing, and validation), and reported implementation readiness. For each study, we documented the diagnostic level (individual patient-based), as well as the types of input data employed, categorized as clinical, laboratory, epidemiological or surveillance, demographic or socio-economic, entomological, environmental, genomic or virological, biomarker, imaging, or other sources.
For every AI/ML model, we extracted the model architecture, number of variables included versus considered, data source, and sample size across training, testing, and validation subsets. Diagnostic performance metrics were recorded for both AI/ML models and their corresponding comparators, including AUC, sensitivity, specificity, PPV, NPV, accuracy, and F1-score. When available, confusion matrix components were retrieved to enable derivation of missing measures. When confusion matrices were not explicitly reported, they were reconstructed using the reported sensitivity, specificity, disease prevalence, and total sample size. Standard errors (SEs) for sensitivity, specificity, PPV, NPV, and accuracy were calculated assuming binomial variance, derived from the corresponding confusion matrix counts. When studies reported performance estimates with confidence intervals (CIs) but did not provide standard deviations (SDs) or SEs, SEs were derived from the reported CIs using a normal approximation. For AUC values, SEs were calculated using the analytical method proposed by Hanley and McNeil [19], which incorporates the observed AUC and the number of positive and negative cases in the test dataset.
Information on internal or external validation strategies and use of interpretability or explainability techniques was also documented.
Crucially, given the comparative aim of this review, we additionally extracted data for all traditional diagnostic comparators evaluated within the same cohorts. Comparators were classified into three predefined categories: (i) laboratory-based approaches (e.g., serological or molecular assays used within diagnostic pathways); (ii) clinical assessment or rule-based strategies; and (iii) conventional statistical models, primarily logistic regression (LR) or derivative clinical severity indices. Comparator sample sizes and corresponding performance metrics were recorded separately to enable paired quantitative synthesis.

2.5. Data Synthesis and Statistical Analysis

Results were reported in accordance with the PRISMA 2020 statement, including a PRISMA flow diagram and detailed tables summarizing study characteristics, methodological quality, and diagnostic performance metrics. A narrative synthesis was initially conducted to describe study designs, populations, AI/ML model types, comparator strategies, and reported outcomes. For each AI/ML category, ranges of diagnostic performance metrics were summarized descriptively.
Quantitative analyses focused on diagnostic performance measures obtained from model testing or validation datasets. A quantitative synthesis was performed only when at least 5 independent studies were available for a given performance metric, in order to ensure stability of pooled estimates. Effect sizes (ES) were defined as unstandardized mean differences (UMD) between AI/ML models and their corresponding comparator methods. Comparative meta-analyses were conducted using both fixed-effects (FEM) and random-effects (REM) models to estimate pooled differences in diagnostic performance between AI/ML models and conventional comparator approaches. Outcomes of interest included AUC, sensitivity, specificity, accuracy, PPV, and NPV.
Statistical heterogeneity across studies was assessed using the I2 statistic, with values greater than 75% indicating high heterogeneity, 50–75% moderate heterogeneity, 25–50% low heterogeneity, and less than 25% indicating negligible heterogeneity [20]. Between-study variance was estimated using the DerSimonian–Laird method. Potential publication bias was evaluated through visual inspection of funnel plots and Egger’s regression asymmetry test, with statistical significance defined as p < 0.10 [21].
Sensitivity analyses were performed by grouping comparator approaches into three predefined categories, as previously described, and were conducted only when at least three independent studies and a minimum of 5 paired AI–comparator model comparisons were available for a given subgroup. To enhance comparability, analyses were based on paired performance metrics derived from AI/ML models and their corresponding comparators evaluated within the same study populations, thereby reducing confounding due to differences in case-mix, prevalence, and study design. Given the structure of the available evidence, multiple AI–comparator model pairs were often extracted from the same studies; consequently, the unit of analysis was the individual model comparison rather than the study. While this approach enabled a more granular assessment of comparative performance, it may introduce statistical dependence among effect sizes derived from the same dataset, potentially affecting variance estimation and the precision of pooled results.

2.6. Risk of Bias Assessment

Risk of bias and methodological rigor were evaluated using the Prediction model Risk Of Bias Assessment Tool (PROBAST) [22]. Each included study was independently examined across the four PROBAST domains: participants, predictors, outcome, and analysis. Assessments were performed by two reviewers working in parallel, with disagreements reconciled through discussion until consensus was achieved.

3. Results

3.1. Literature Search

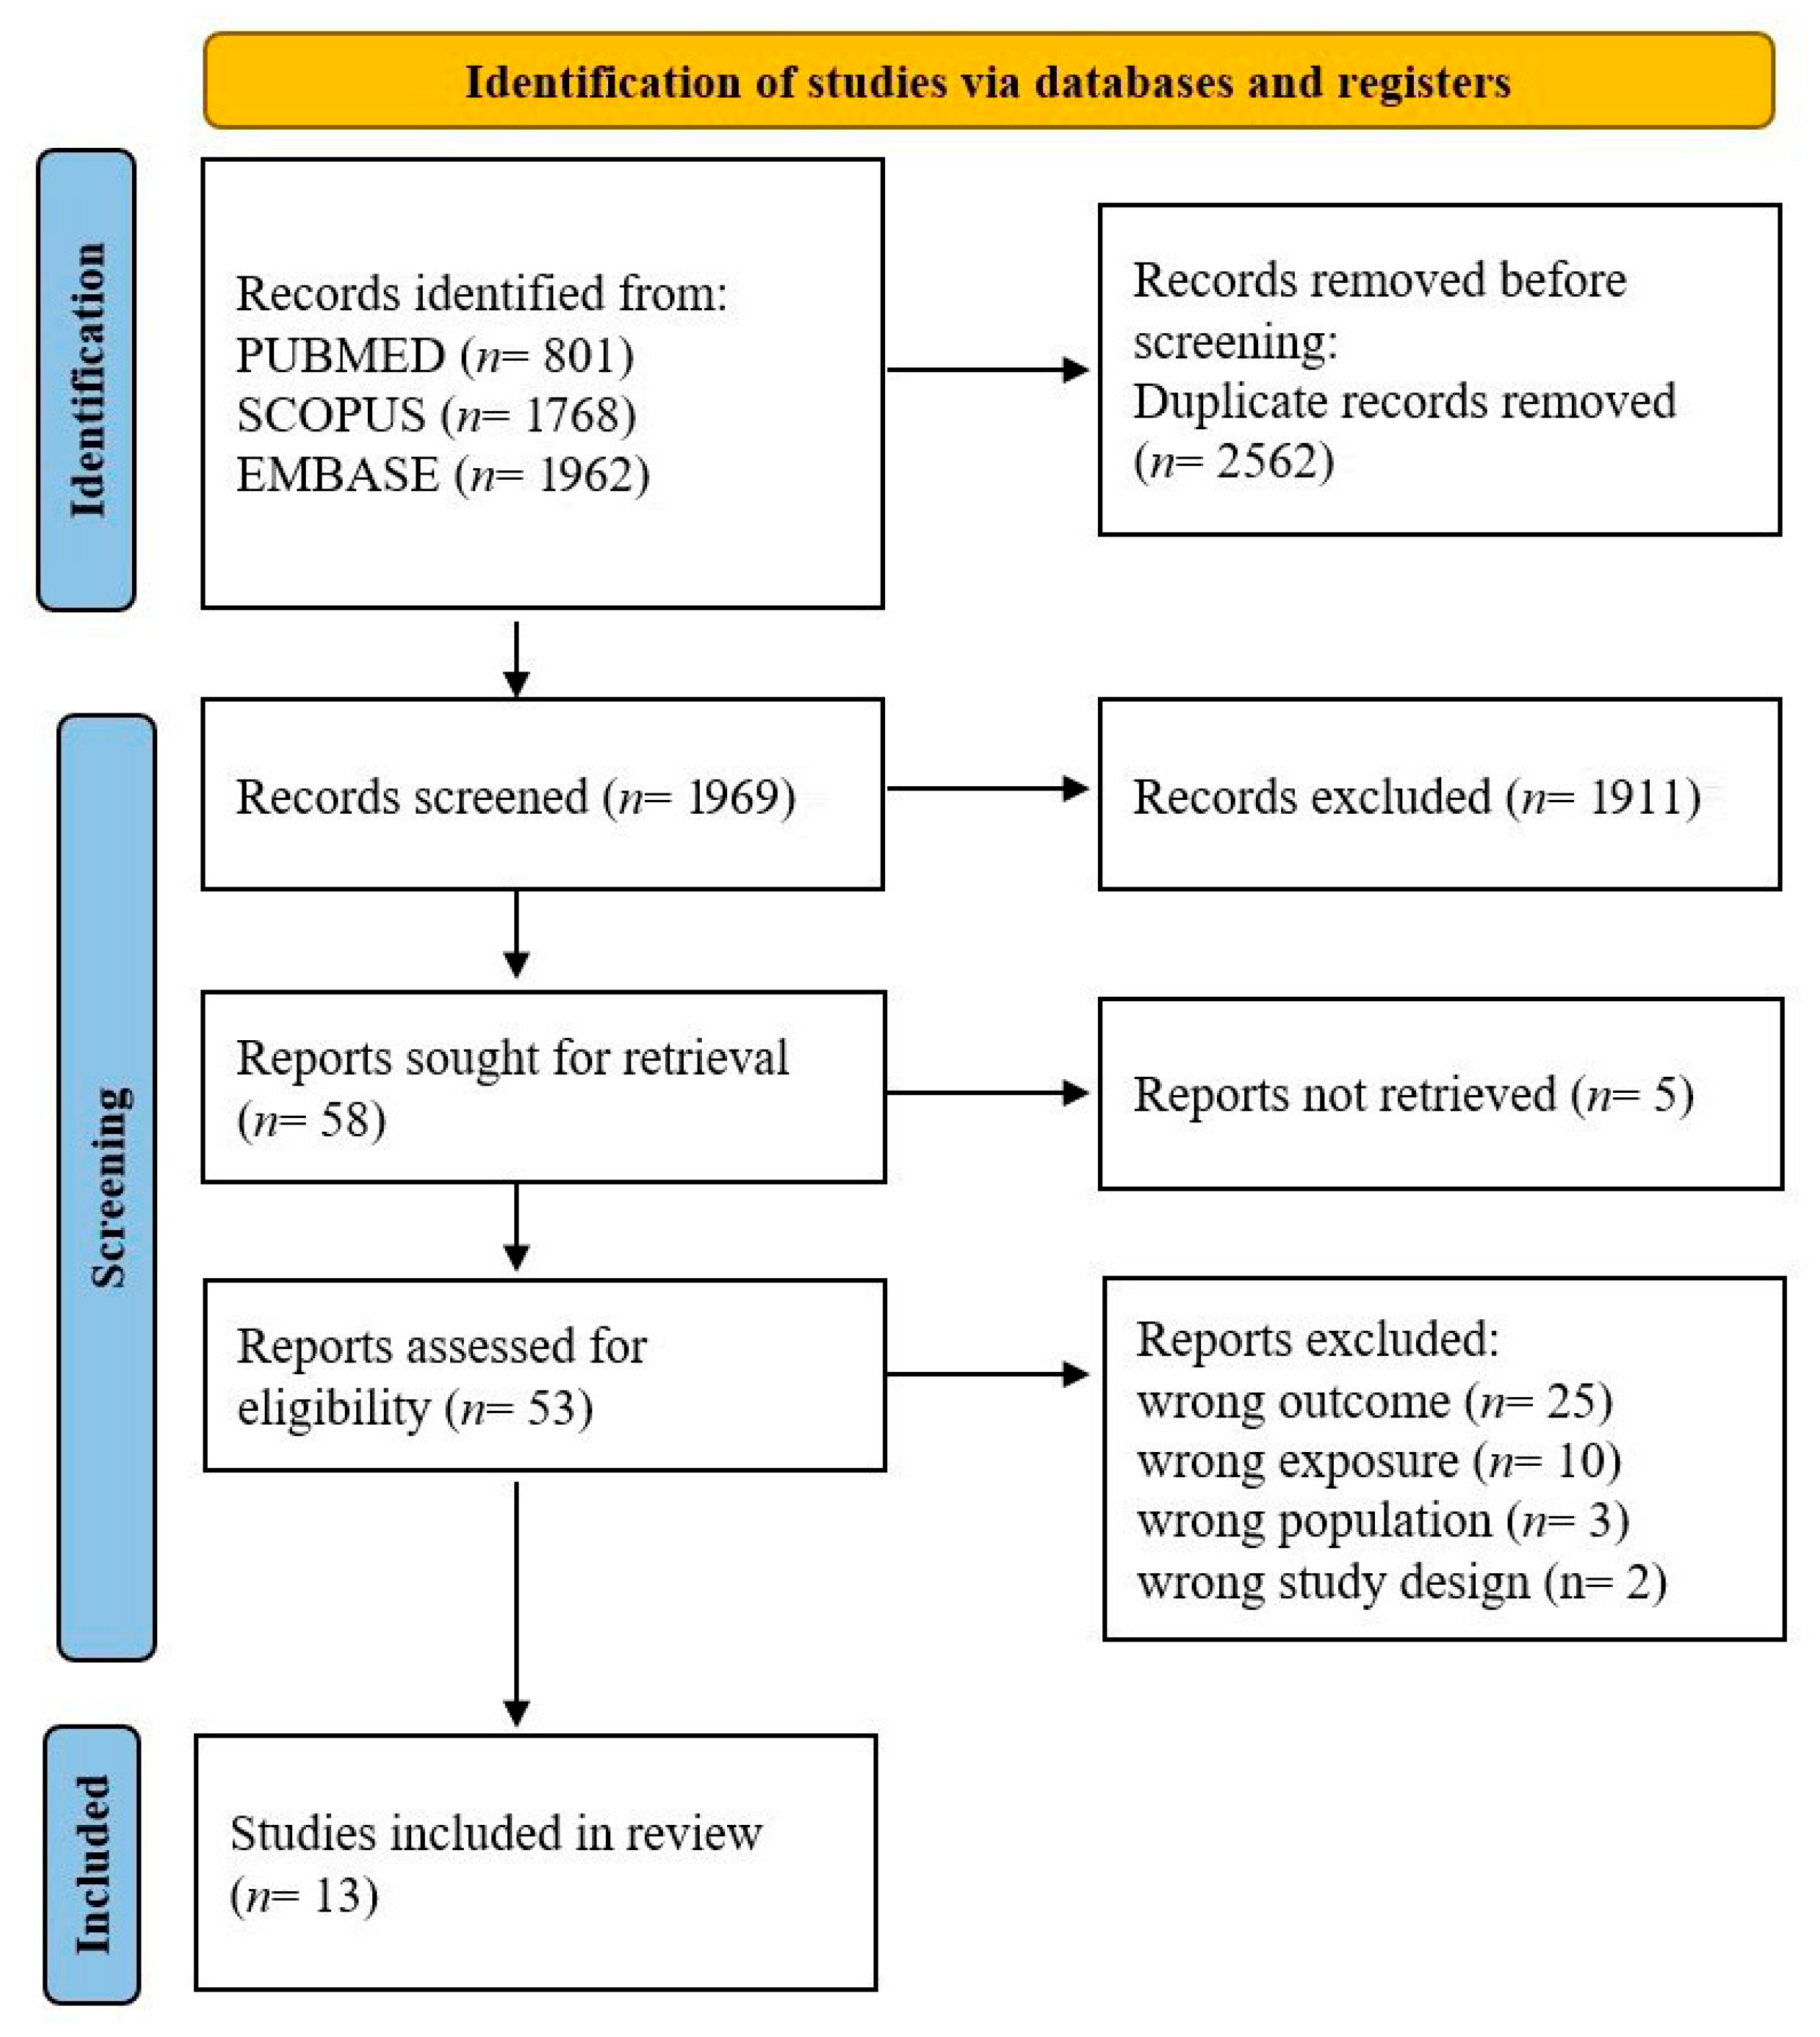
The database search identified 4531 records, including 801 from PubMed/MEDLINE, 1768 from Scopus, and 1962 from Embase. After removal of 2562 duplicate entries, 1969 unique references remained for screening. Title and abstract review led to the exclusion of 1911 records that did not meet inclusion criteria, resulting in 58 articles selected for full-text evaluation. Full-texts could not be retrieved for 5 papers. After a detailed full-text assessment, 39 articles were excluded, including 13 records [23,24,25,26,27,28,29,30,31,32,33,34,35]. The study selection process is illustrated in Figure 1.

3.2. Geographic Distribution of Studies and Temporal Trends

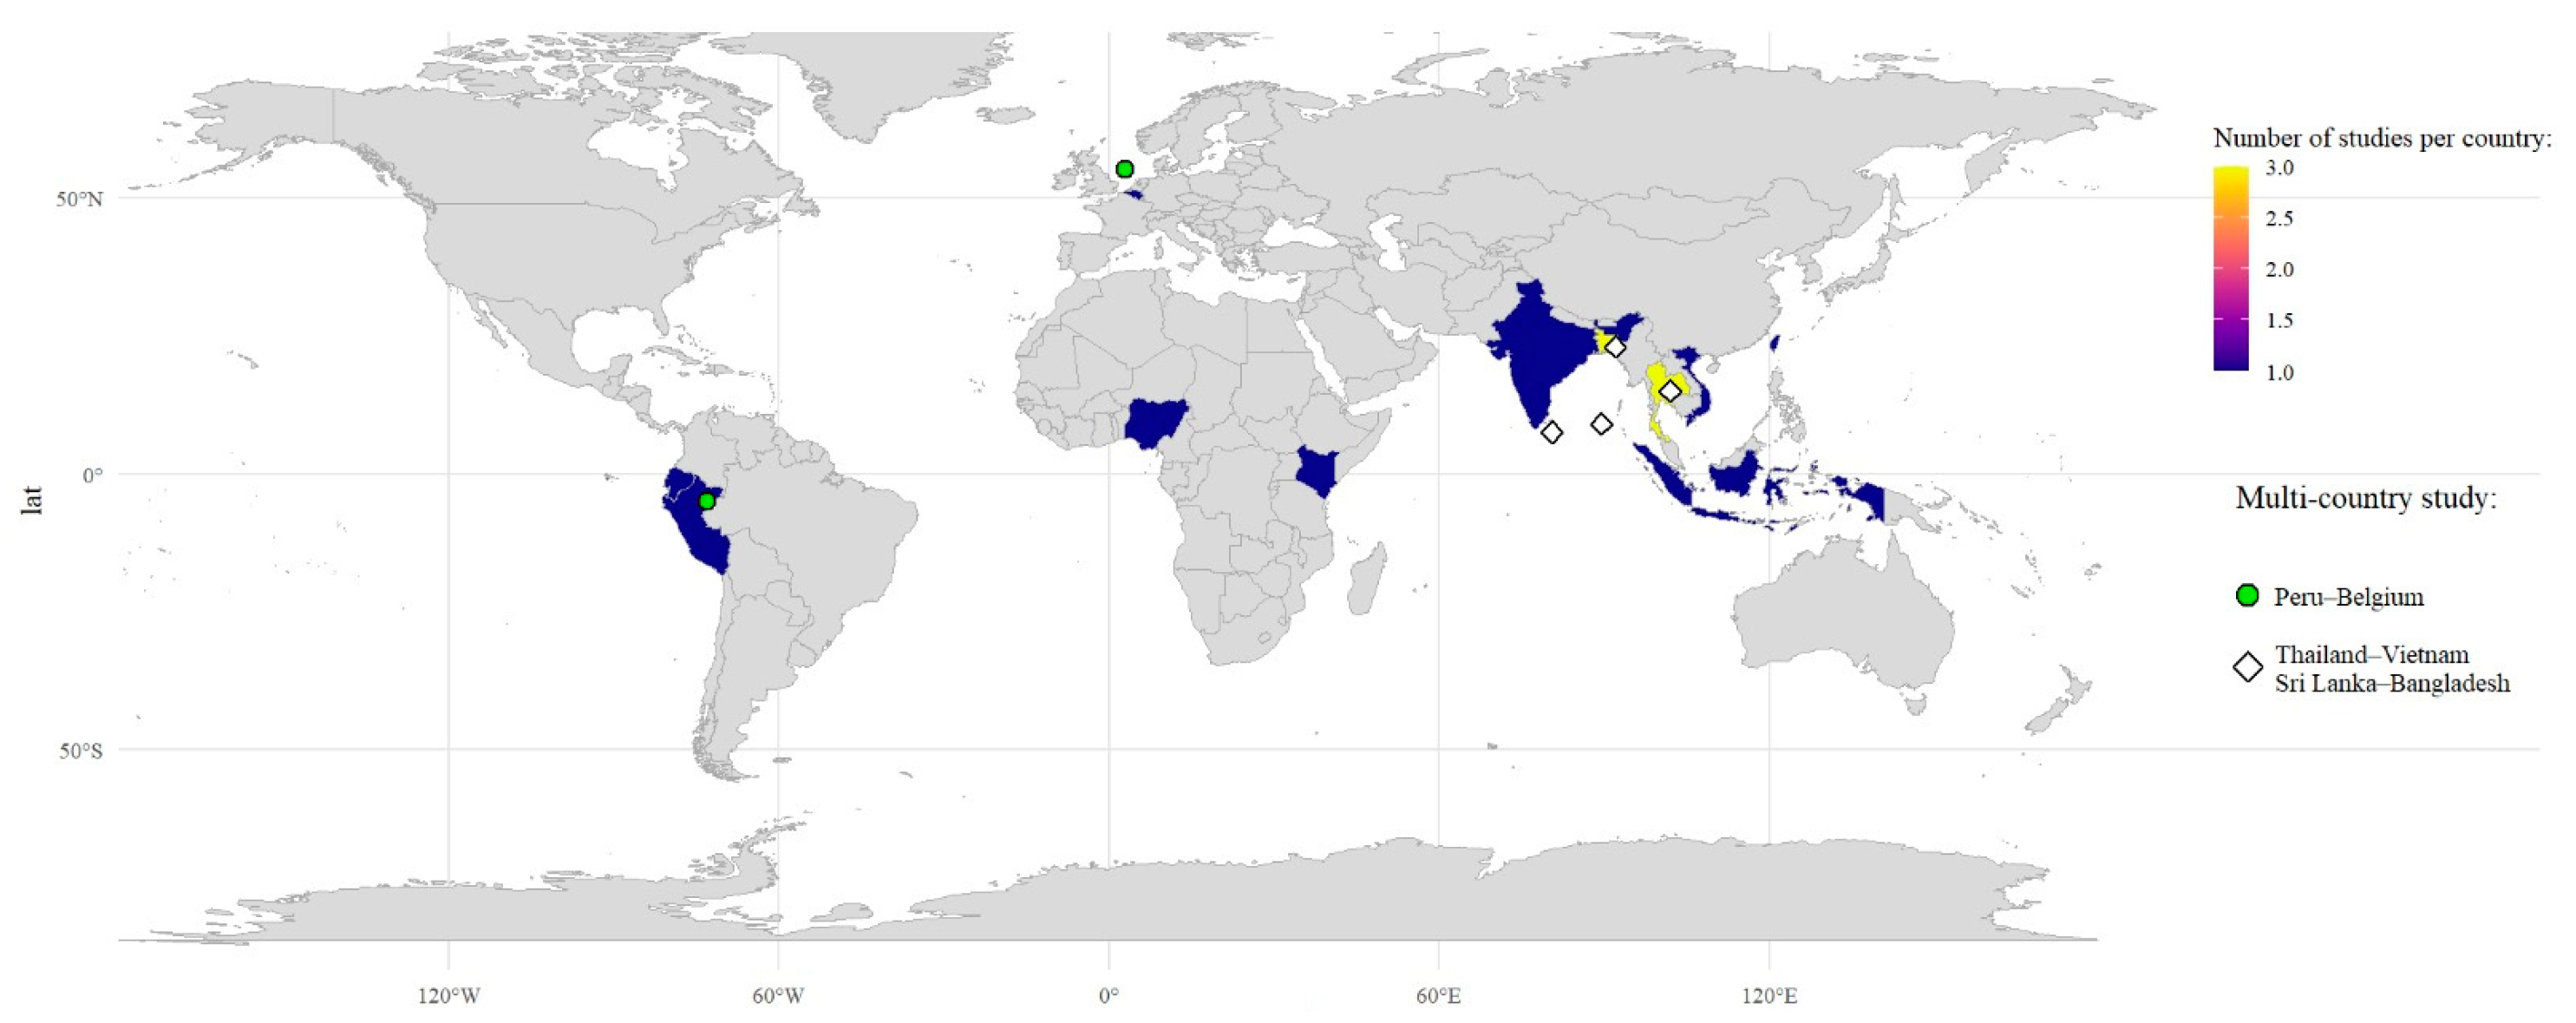
The included studies were predominantly conducted in Asia, which accounted for 9 of the 13 investigations (Figure 2) [23,25,26,27,28,29,31,32,35]. Bangladesh [28,31] and Thailand [32,35] were each represented by two publications; single studies originated from India [29], Indonesia [26], Singapore [25], and Taiwan [27]. Two studies were performed in Africa (Nigeria [30] and Kenya [34]) and one in South America (Ecuador [33]). Two studies instead adopt a multi-country approach: one spread across 4 Southeast Asian countries (Thailand, Vietnam, Sri Lanka, Bangladesh [23]) while another on South America (Peru) and Europe (Belgium) [24]. Overall, study locations were largely concentrated in South and Southeast Asia, with limited representation from Africa and the Americas.
Publication years ranged from 2018 [32] to 2024 [23,31], with most studies conducted during the past decade. Reported study periods (Supplementary Table S2) extended from 2007 [35] to 2023 [31], reflecting both historical and contemporary cohorts.

3.3. Characteristics of the Included Studies

An overview of the general characteristics of the 13 included studies is presented in Table 1.
Most studies were hospital-based (n = 8 [24,25,26,27,28,30,32,35]), while two were community-based field or surveillance investigations [23,33], two adopted multicenter setting [31,34], and one relied on a synthetic dataset simulating Zika virus disease presentations [29].
Dengue was the primary target condition in 10 studies [23,24,25,26,27,30,31,32,34,35], whereas two studies focused exclusively on chikungunya [28] and Zika [29], respectively, while one study examined all three viruses in combination [33]. Study populations predominantly comprised patients presenting with acute febrile illness or clinically suspected dengue in hospital or emergency department settings, with two studies focusing specifically on pediatric populations [23,34].
Case definitions were predominantly based on acute febrile illness or clinical suspicion of dengue, typically defined by fever with dengue-compatible symptoms or recent symptom onset. In most studies, diagnostic confirmation relied on laboratory testing, primarily RT-PCR and/or ELISA, either alone (n = 9 [23,24,25,27,28,30,32,33,35]) or in combination with clinical criteria (n = 2 [26,34]). Across all clinical cohorts reporting temporal availability, predictor variables were collected at the time of initial presentation.
The included literature reflected diverse methodological frameworks, comprising four model development studies [23,26,28,29], six retrospective diagnostic test accuracy investigations [24,25,27,30,31,34], two prospective diagnostic test accuracy studies [32,35], and one prospective cohort. All analyses were conducted at the individual patient level.
As shown in Supplementary Table S2, handling of missing or imbalanced data varied across studies and included multiple imputation, median imputation, Synthetic Minority Over-sampling Technique (SMOTE), belief degree updates, random forest-based imputation, or exclusion of incomplete records. Calibration was infrequently reported, with only two studies describing formal calibration procedures or goodness-of-fit assessments [27,35]. Data partitioning strategies most commonly relied on internal validation, typically using random train–test splits (e.g., 70/30 or 80/20) and cross-validation approaches (n = 5 [23,25,27,33,34]), including k-fold and repeated cross-validation. Implementation readiness was generally limited to research (n = 11 [23,24,25,26,27,30,31,32,33,34,35]) or pilot/proof-of-concept (n = 2 [28,29]) settings, with no study reporting deployment in routine clinical practice.

3.4. Feature Categories Used as Predictors

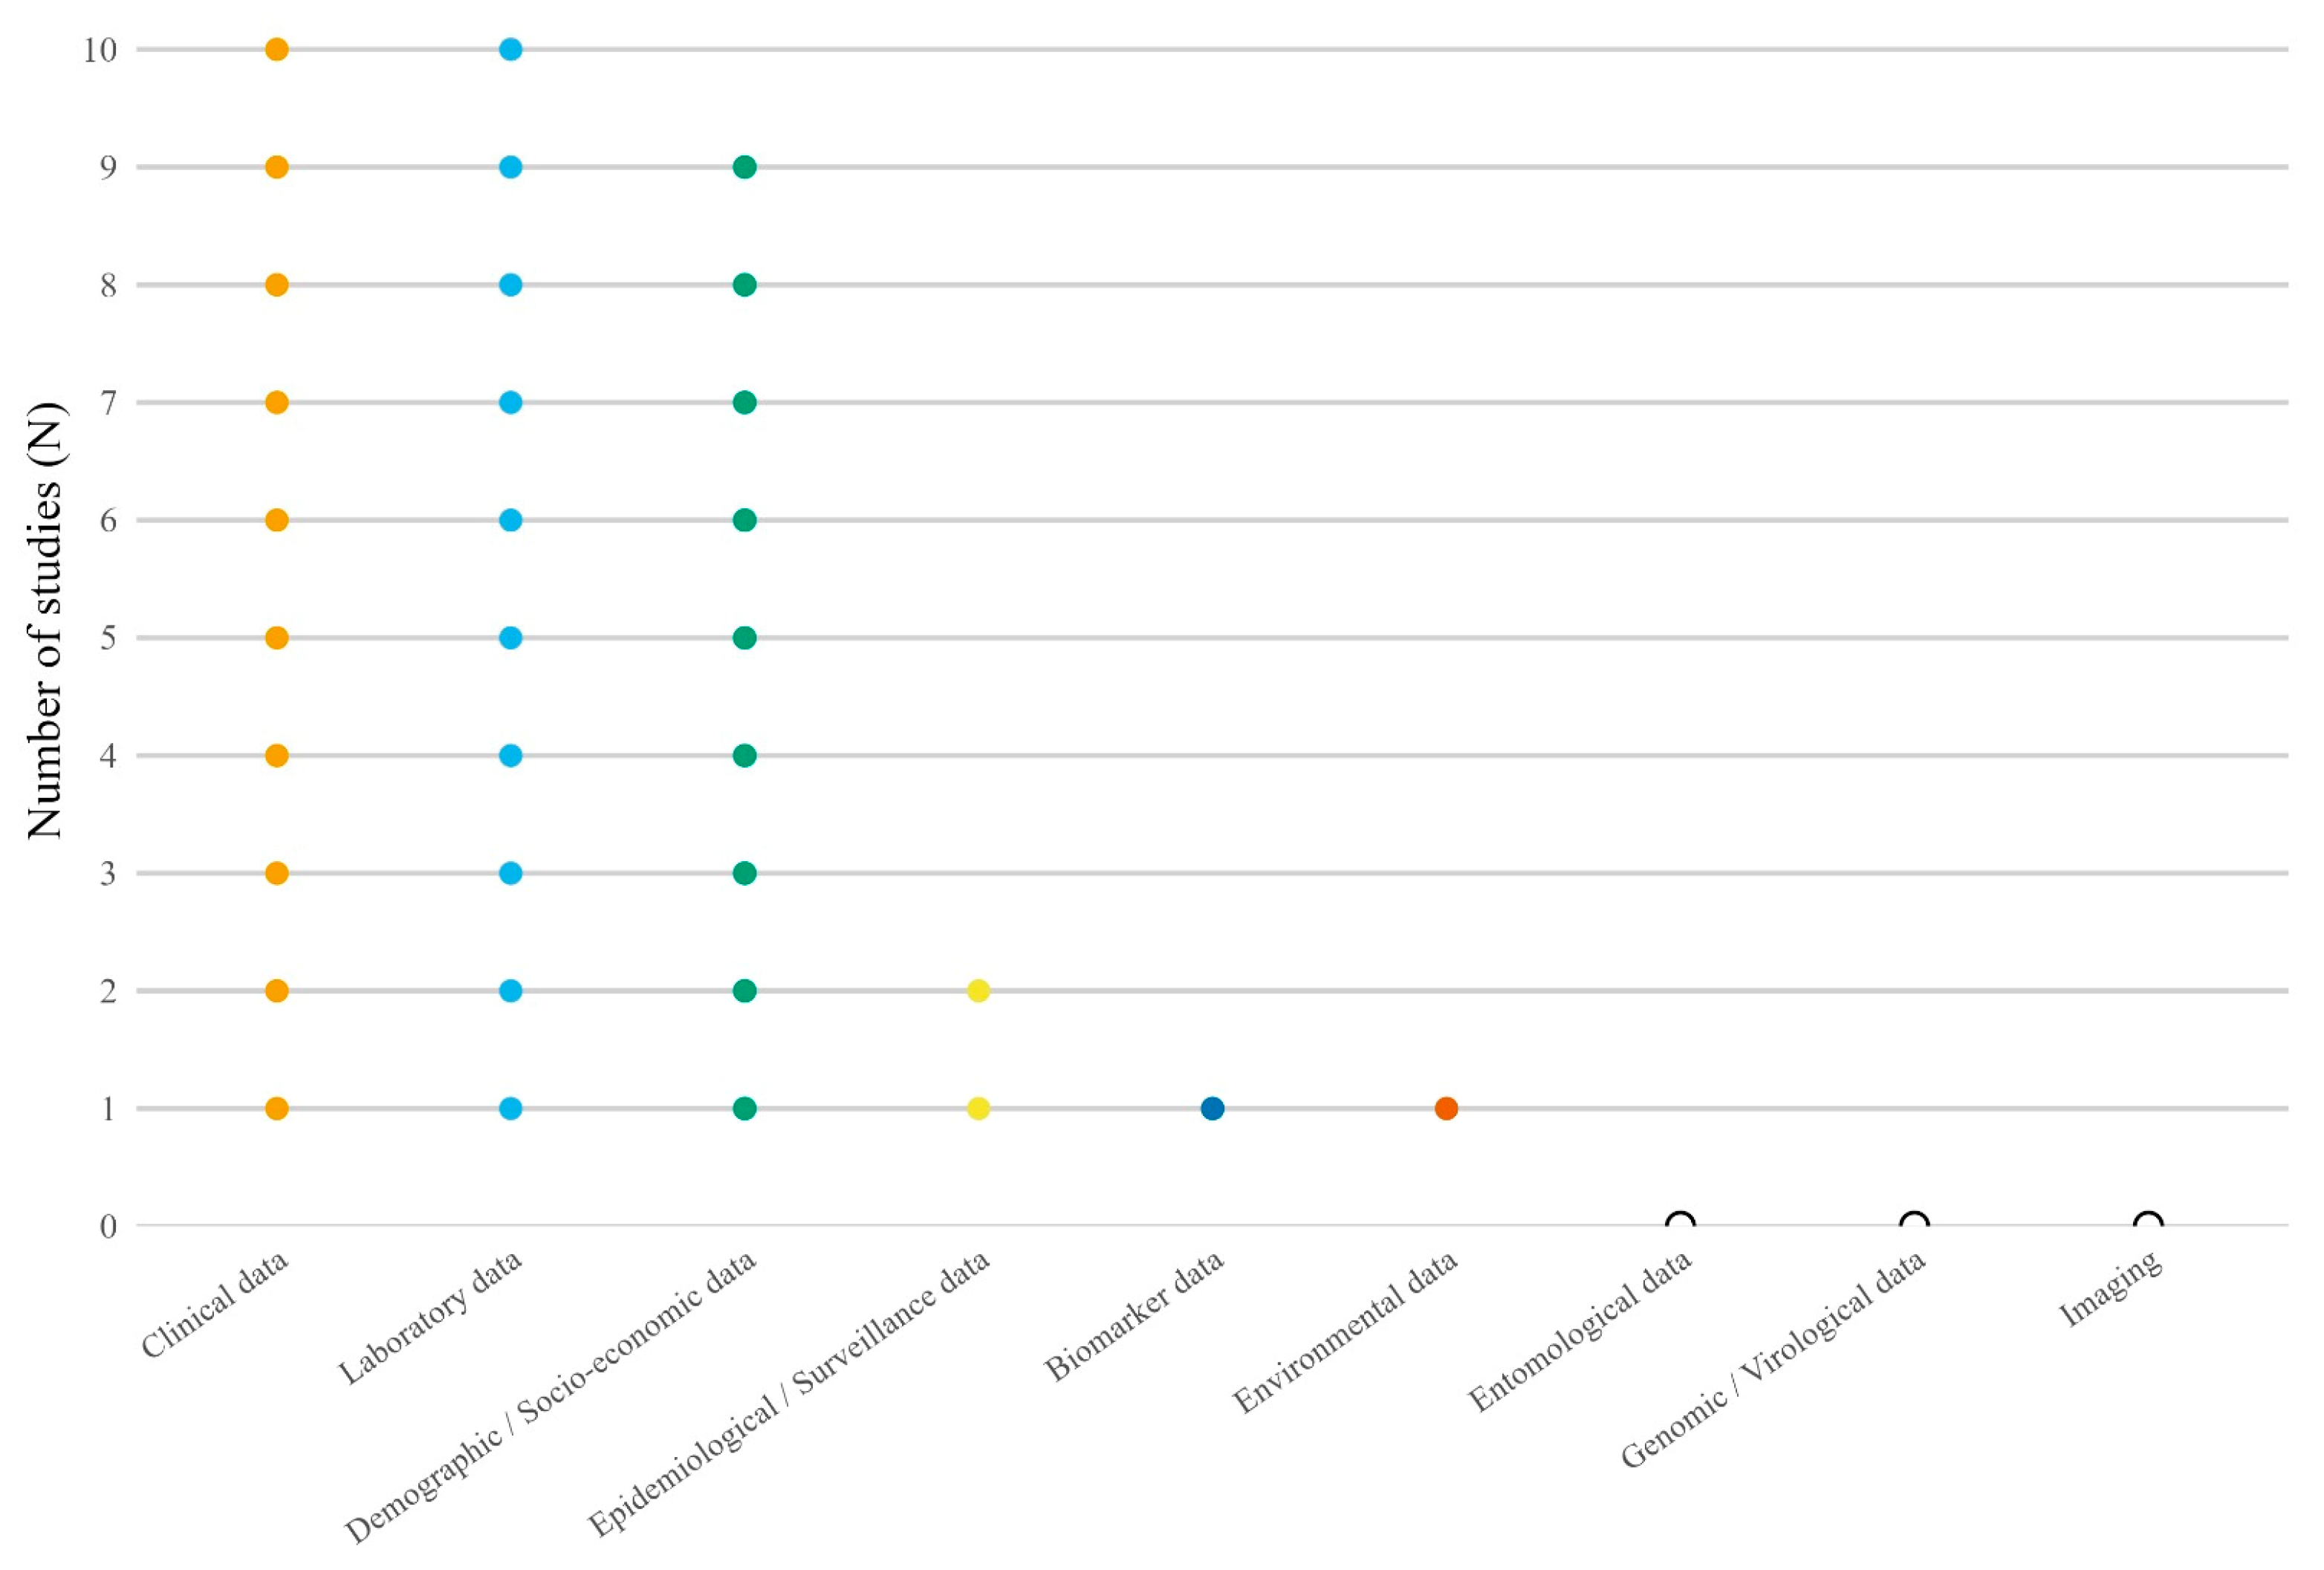
Clinical [25,26,27,28,29,30,32,33,34,35] and laboratory [23,24,25,26,27,28,30,31,32,33] variables were the most frequently incorporated predictor domains, each included in 10 of the 13 studies (Figure 3). Demographic or socio-economic information was used in 9 studies [23,25,26,27,30,32,33,34,35]. Epidemiological or surveillance data were reported in two investigations [32,35], while biomarker [24] and environmental [35] variables were each included in a single study. No study incorporated entomological data, genomic or virological features, or imaging-based inputs.

3.5. Classification Performance of AI Models vs. Conventional Comparators

Across the included studies, reported discrimination for AI/ML models (Table 2) was generally high but heterogeneous, reflecting differences in populations, predictor availability, and modelling targets. Where AUC was available, AI/ML models spanned a wide range, 0.64–0.99, with the lowest value reported for an SVM in a chikungunya-focused dataset [28] and the highest for a stacking approach in a multiclass model comparison [31]. Classification operating characteristics also varied: reported sensitivities ranged from 0.01 [34] to 0.98 [29] and specificities from 0.71 [23] to 1.00 [34], underscoring substantial threshold-dependent trade-offs across studies. Where reported, overall accuracy for AI/ML models ranged from 0.75 [25] to 0.98 [29], and F1-scores from 0.70 [25] to 0.94 [31,32], broadly suggesting good balanced performance in many cohorts but with incomplete reporting for several metrics.
Comparator approaches (Table 3) included clinical assessment, conventional statistical models (predominantly logistic regression and derivatives), and laboratory-based pathways (commercial serologic assays). Where AUC was reported, comparator discrimination ranged from 0.76 [24] to 0.94 [27], with laboratory assays clustering at the lower end (e.g., IgM/IgG ELISA AUC 0.76–0.80) and statistical models frequently in the higher range. For operating characteristics, comparator sensitivities ranged from 0.06 [34] to 0.91 [31] and specificities from 0.66 [23] to 0.98 [34], again indicating substantial variability in thresholds and intended use cases (rule-in vs. rule-out). Accuracy values ranged from 0.46 [24] to 1.00 [26], although the upper extreme occurred in a very small test set for clinical assessment, limiting interpretability and generalizability.
Overall, the pattern of results suggests that AI/ML models can provide incremental gains over conventional statistical and laboratory-based approaches in some settings, while performance remains context-dependent and sensitive to threshold selection and study design.

3.6. Data Sources, Model Inputs, Validation Strategy, and Interpretability

Supplementary Table S3 summarizes key study-design features that are directly relevant to the credibility and potential clinical translatability of reported model performance. Most AI models were developed using routinely collected clinical data from hospital datasets or emergency department records, with fewer studies drawing primarily on serological or immunoassay-derived inputs, and one study using a synthetic dataset. Across studies, the number of predictors ultimately included in final models ranged from 5 [23] to 41 [35] variables, indicating considerable heterogeneity in feature engineering and candidate model complexity. Importantly, all studies reported internal validation only (including train/test splits and bootstrap resampling or cross-validation), with no external validation described in this set, limiting conclusions about generalizability across settings and epidemiological contexts. Reporting of interpretability or explainability was inconsistent: only a minority of studies (n = 5 [26,28,31,32,35]) explicitly reported interpretability approaches, more commonly in smaller or more clinically oriented models, whereas most studies did not describe explainability methods.

3.7. Assessment of Risk of Bias Using PROBAST

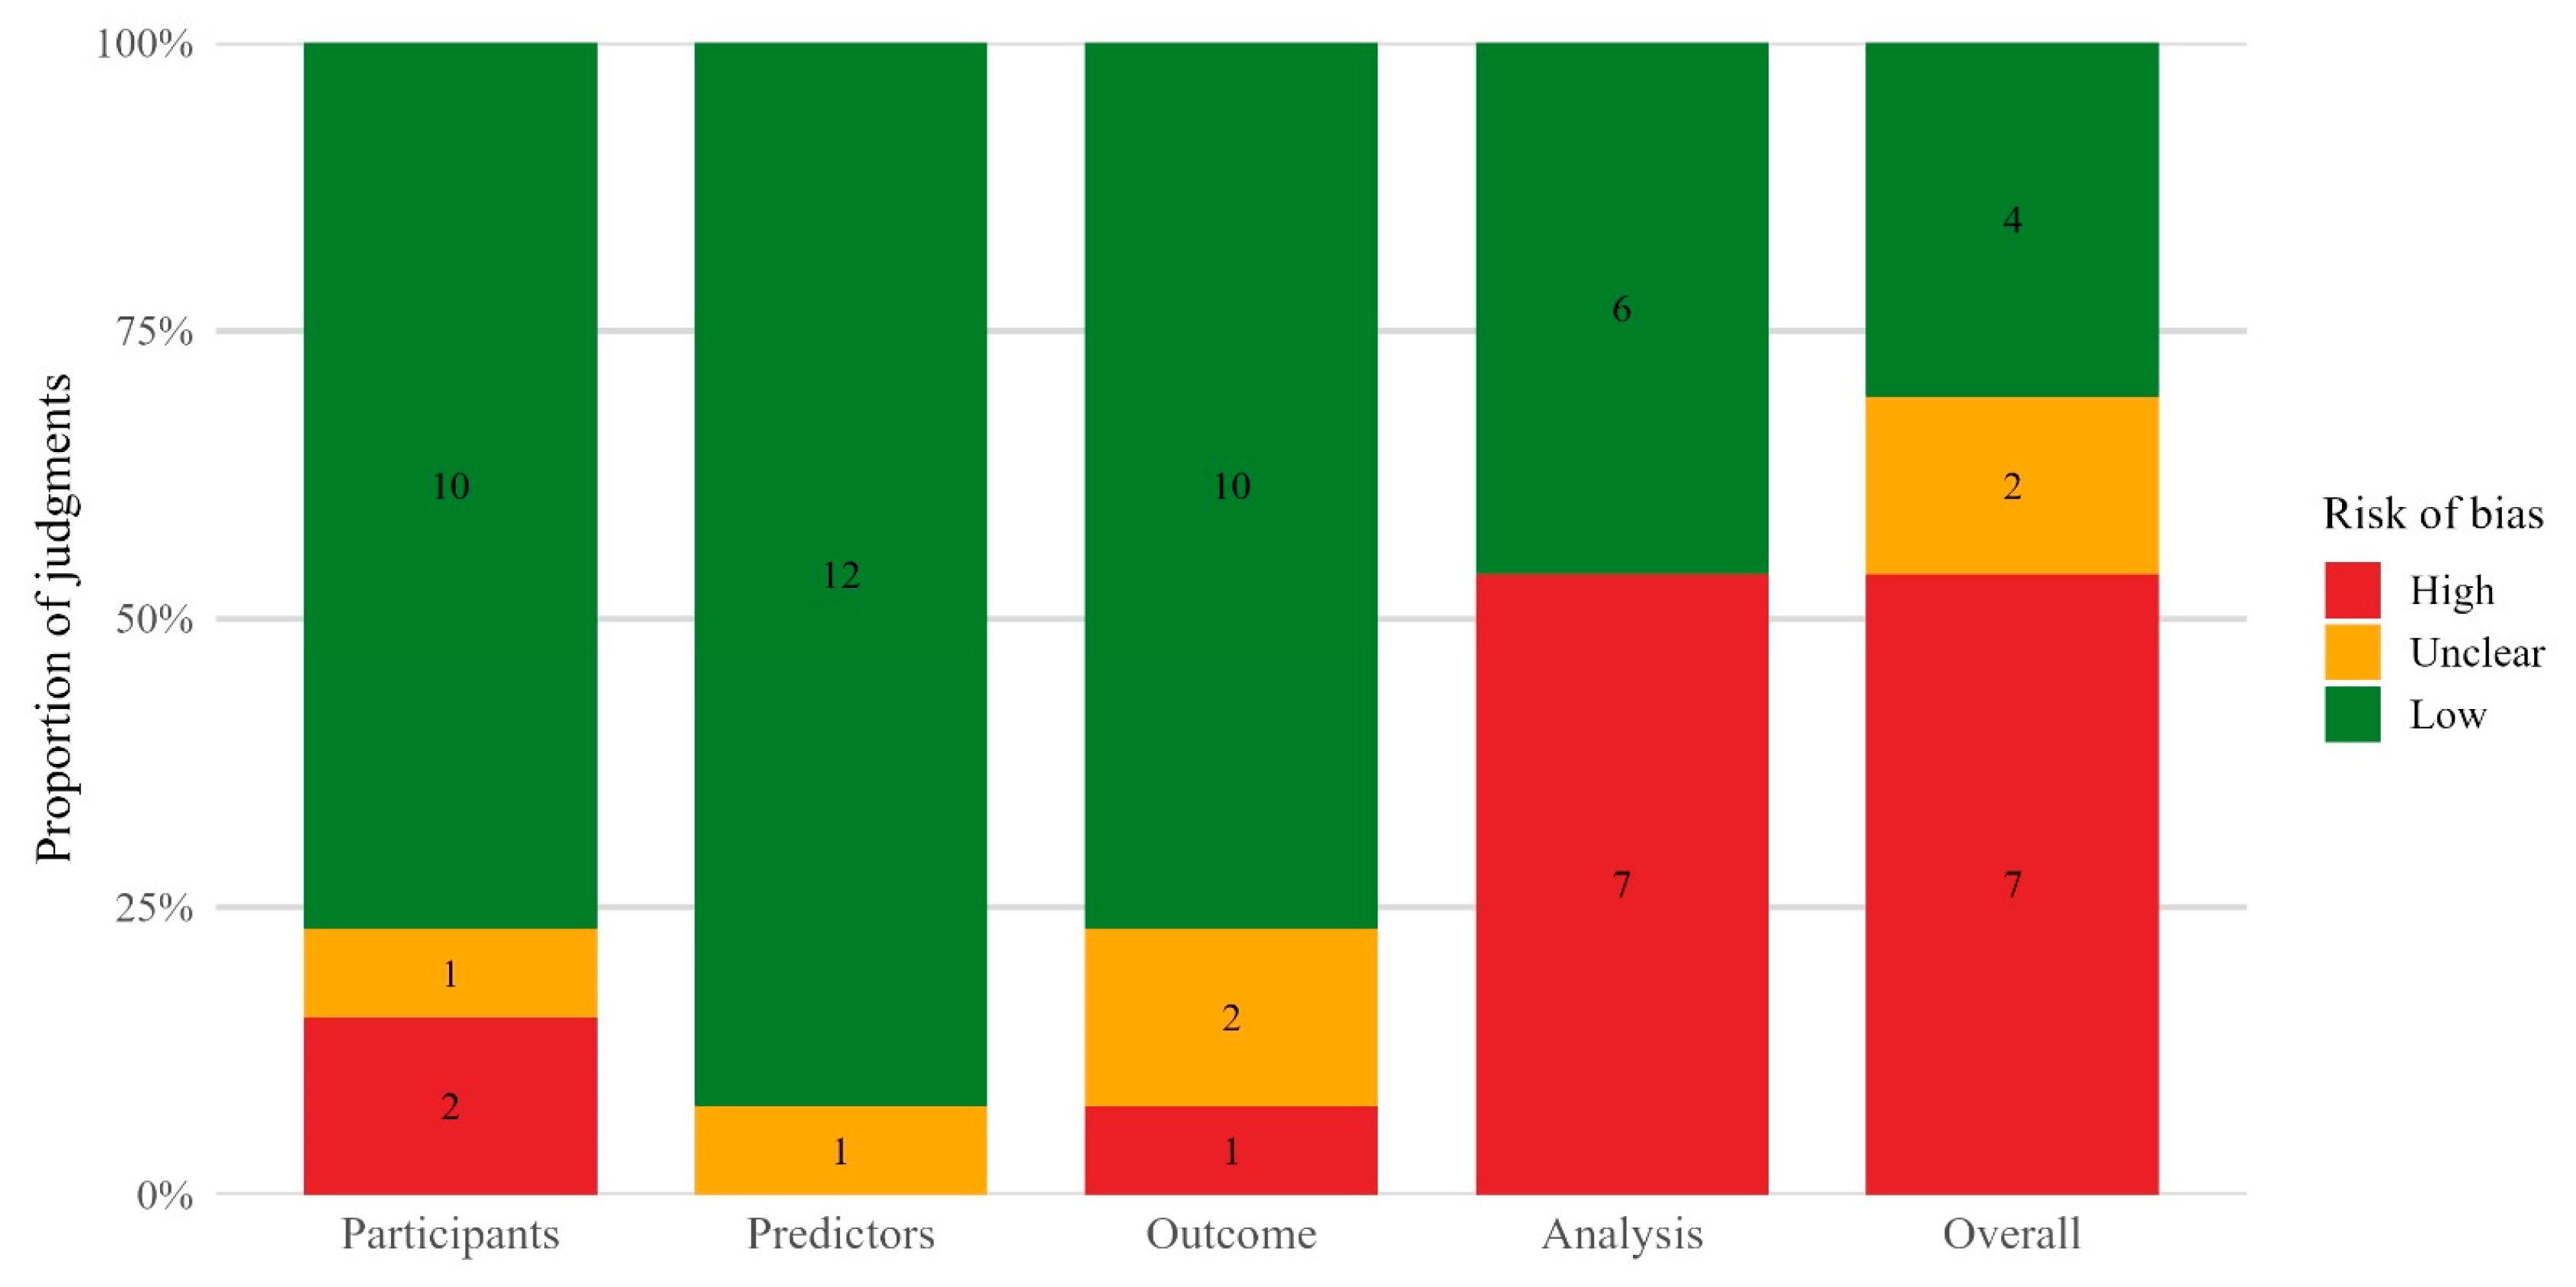
The PROBAST risk-of-bias assessment revealed a heterogeneous profile across domains, with the main concerns concentrated in the Analysis domain (Figure 4). Specifically, the Participants, Predictors, and Outcome domains showed a predominance of Low-risk judgments (10/13 [23,24,25,27,28,30,32,33,34,35], 12/13 [23,24,25,26,27,28,30,31,32,33,34,35], and 10/13 studies [23,24,25,27,28,30,31,32,33,35], respectively), with only a limited number of High- or Unclear-risk ratings. In contrast, the Analysis domain exhibited a higher frequency of High-risk assessments (7/13; 53.8% [23,25,26,28,29,30,32]) compared with Low-risk (6/13; 46.2% [24,27,31,33,34,35]), suggesting that analytical aspects (e.g., management of overfitting, threshold selection/optimization, handling of missing data, and/or validation procedures) represent the main source of potential bias. Consistently, the Overall assessment classified most studies as High risk (7/13; 53.8% [23,25,26,28,29,30,32]), with a minority rated as Low risk (4/13; 30.8% [24,27,33,35]) and a smaller proportion as Unclear (2/13; 15.4% [31,34]). This indicates that, despite generally adequate performance in several domains, methodological limitations within the analytical domain may affect confidence in the reported performance estimates.

3.8. Statistical Analysis

3.8.1. Meta-Analysis

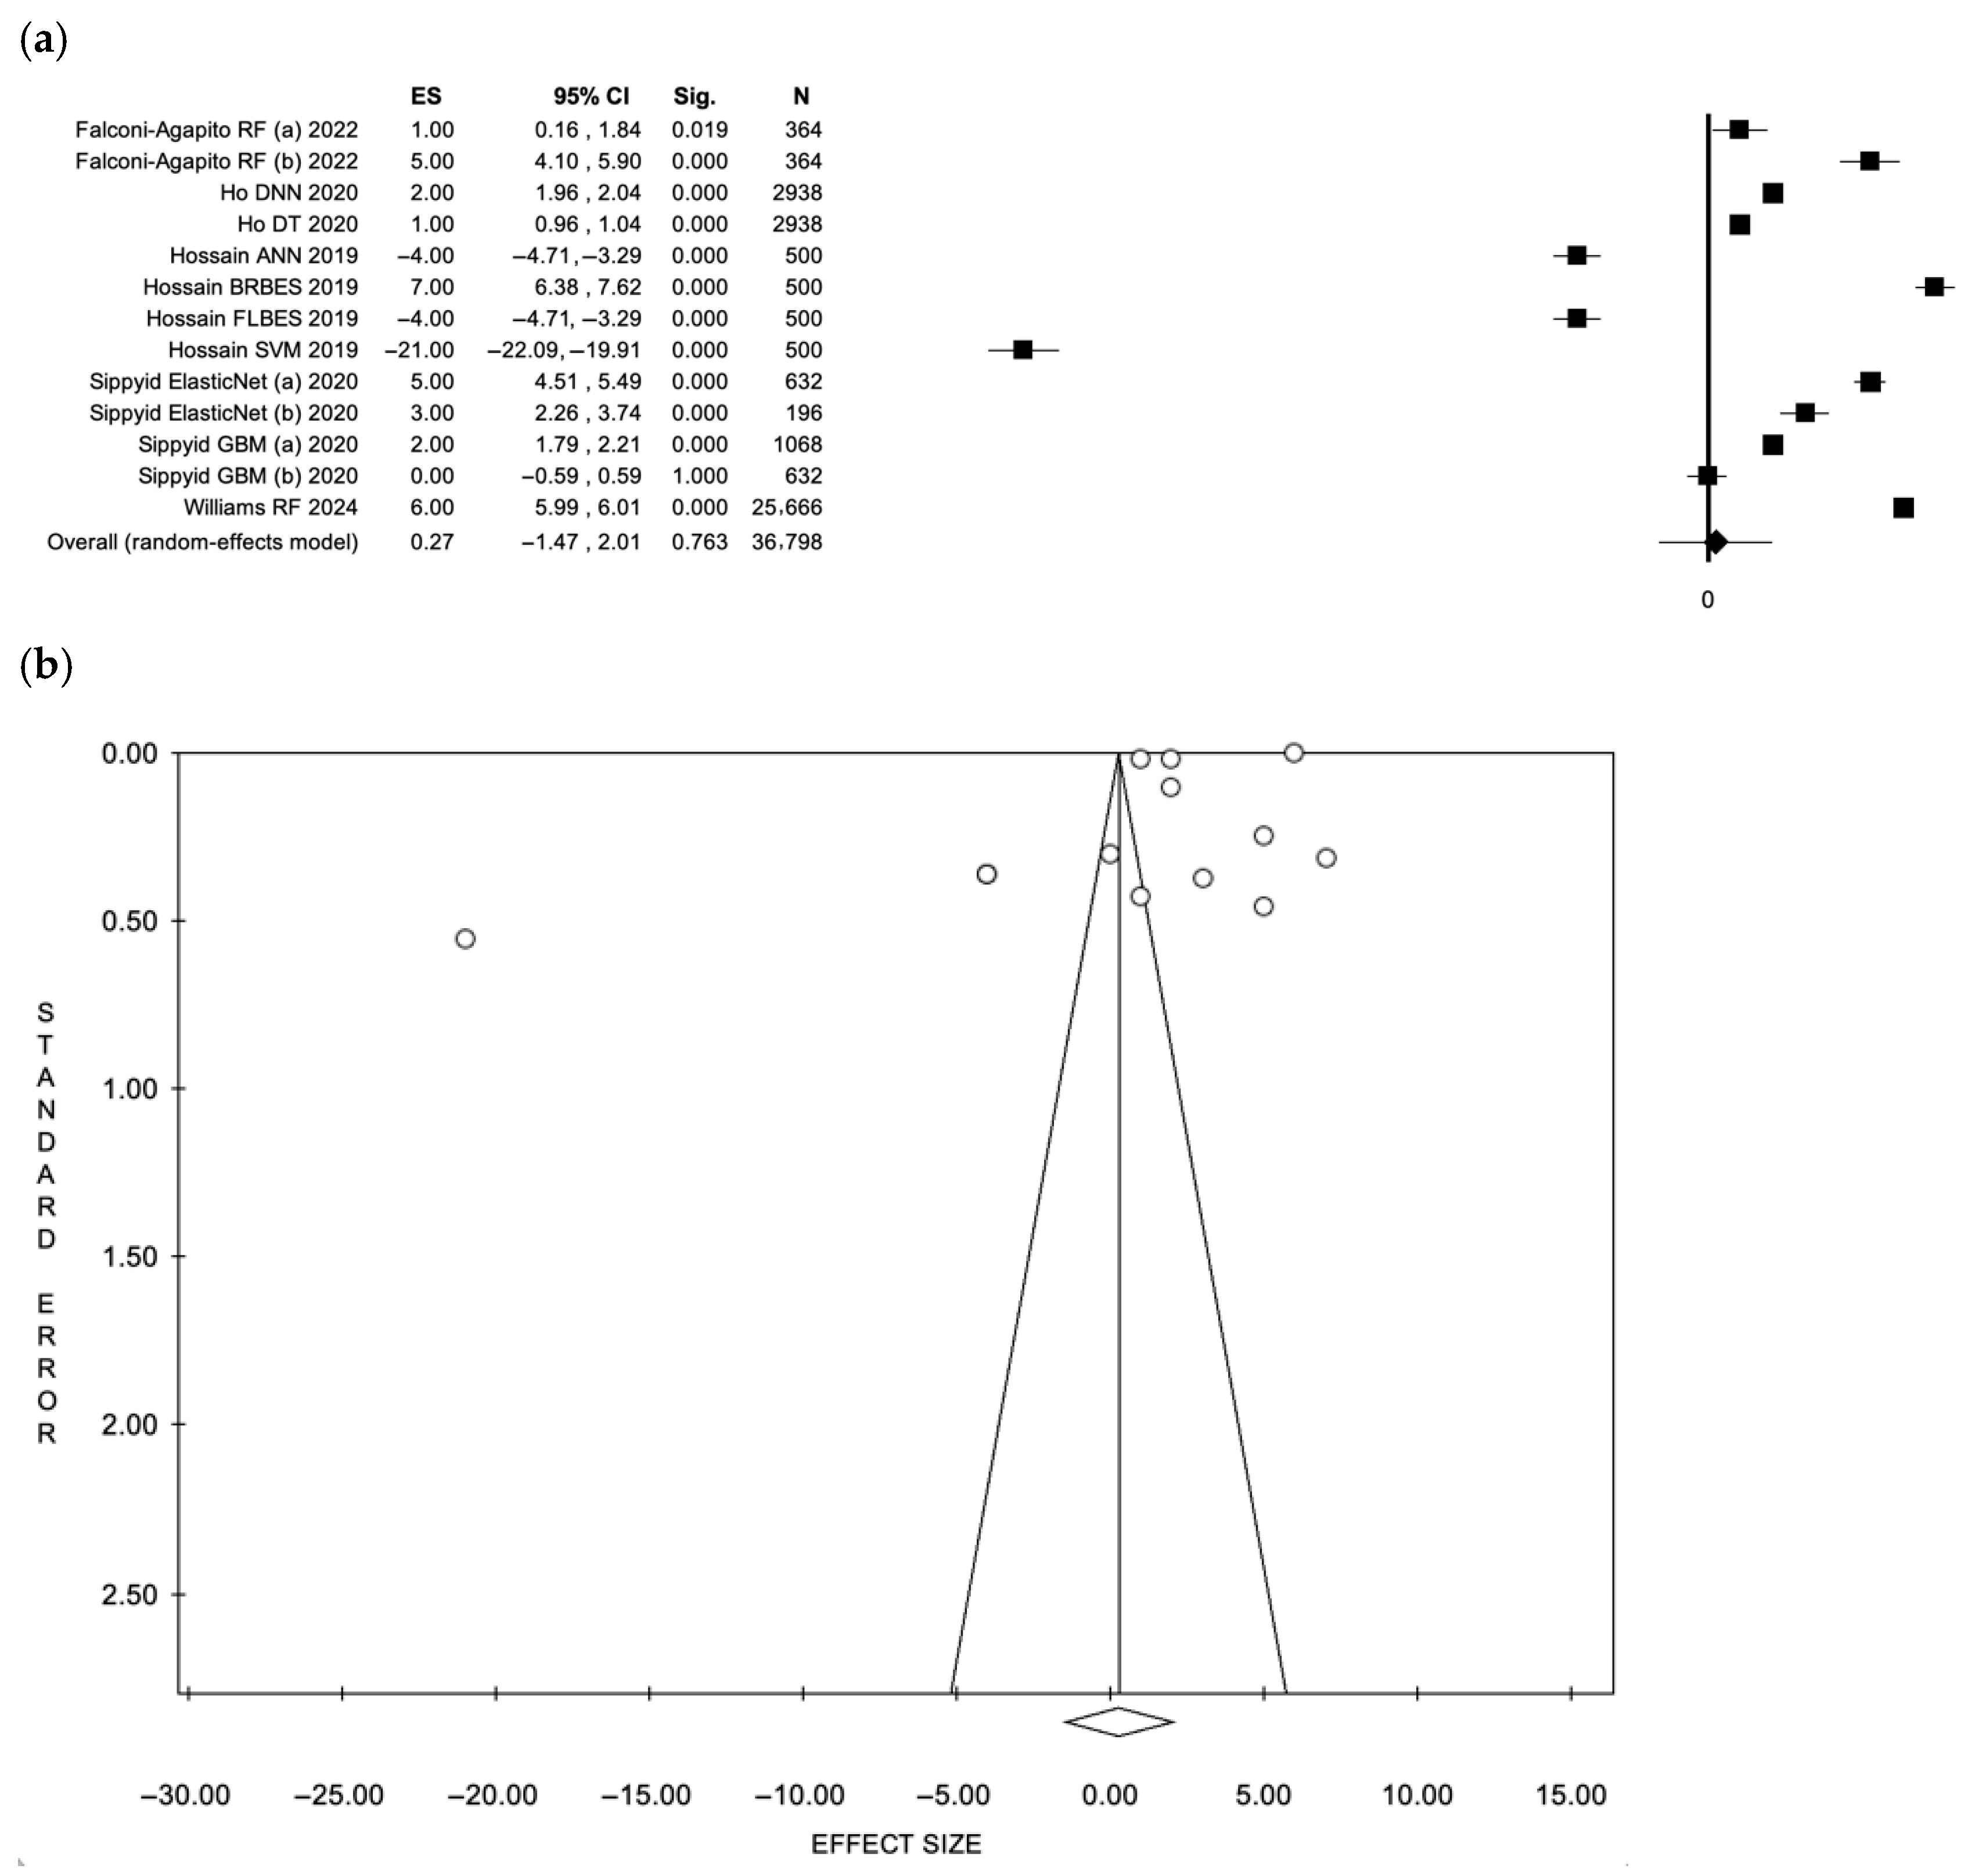
For the AUC outcome, 6 studies contributed 13 paired model comparisons, each comparing an AI-based model with a conventional diagnostic comparator, for a total included sample of 36,798 participants. Using REM (Figure 5a: forest plot; Figure 5b: funnel plot), no significant difference in AUC was observed between AI models and comparators (ES (UMD) = 0.27, 95% CI: −1.47 to 2.01, p = 0.763), though significant heterogeneity was observed (I2 = 99.9%, p < 0.001). In contrast, the FEM showed a statistically significant pooled effect favoring AI-based models (ES = 5.59, 95% CI: 5.59–5.60, p < 0.001; n = 36,798) (Figure S1a: Forest plot; Figure S1b: funnel plot). No evidence of publication bias was found, as indicated by the funnel plot and Egger’s test (intercept: −44.69, p = 0.098).
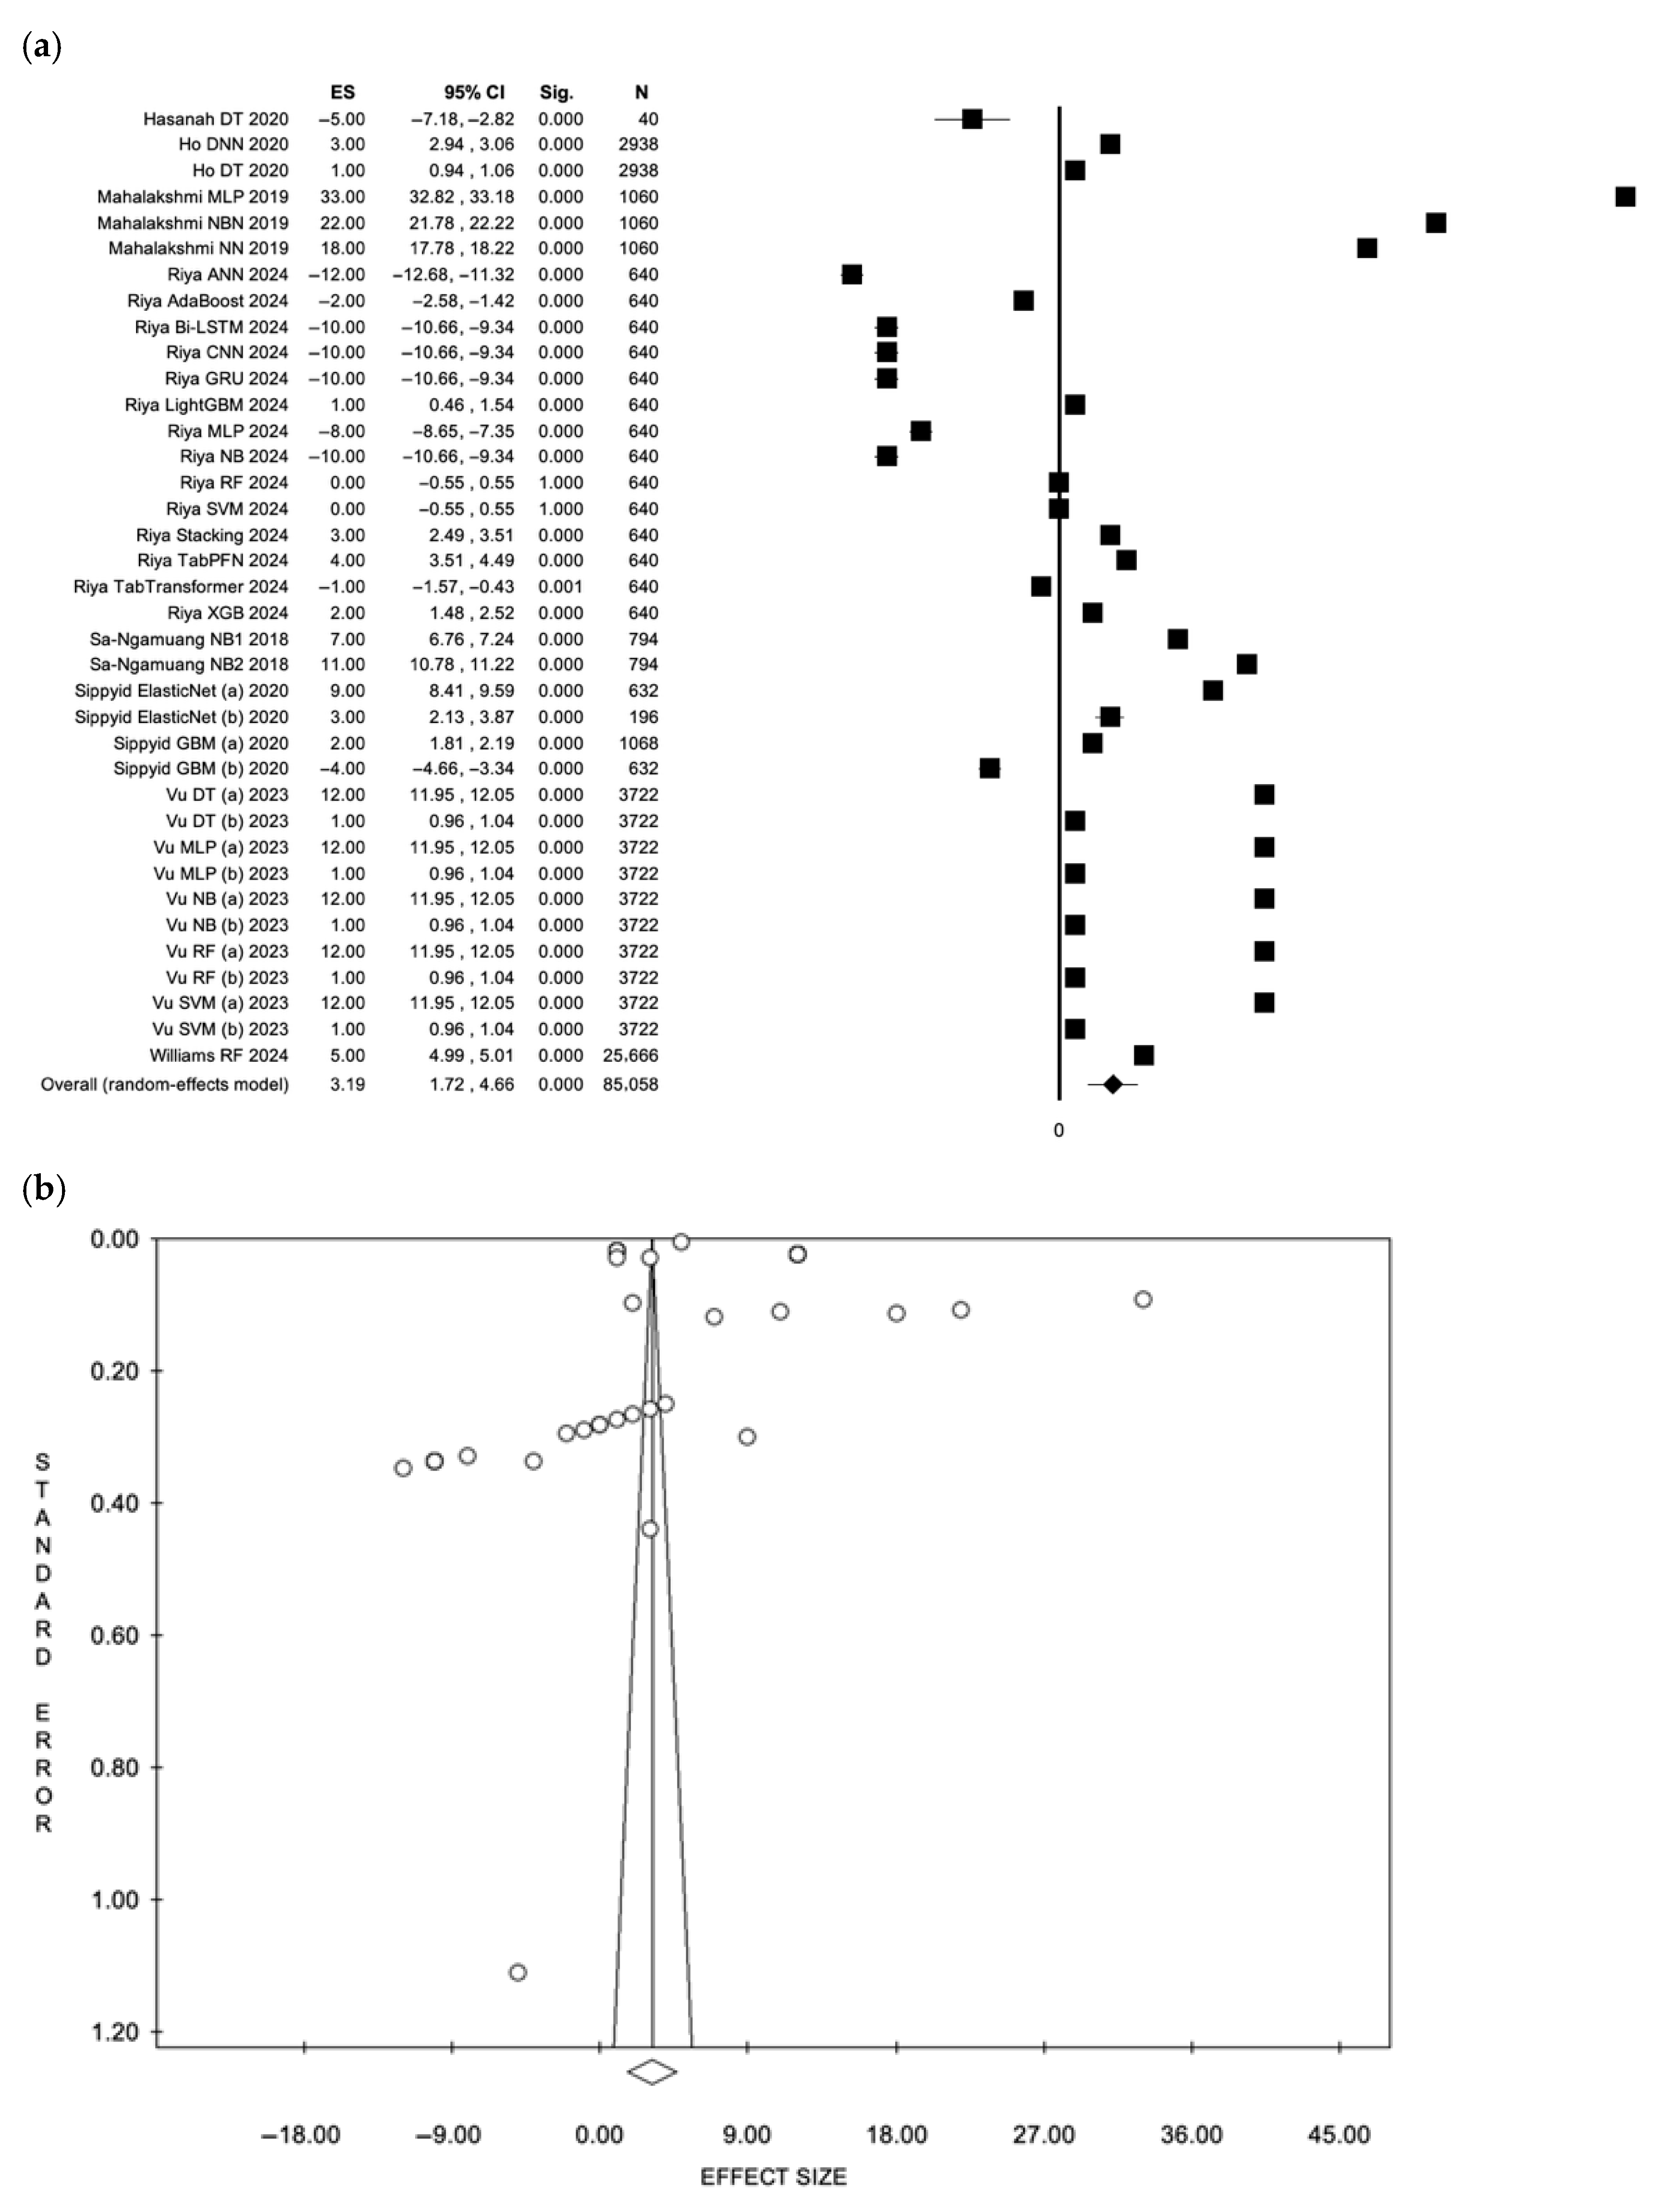
For accuracy, 8 studies contributed 37 paired model comparisons, for a total included sample of 85,058 participants. Using REM (Figure 6a: forest plot; Figure 6b: funnel plot), AI-based models showed a statistically significant but heterogeneous improvement in accuracy compared with traditional approaches (ES = 3.19, 95% CI: 1.72–4.66, p < 0.001), with substantial between-study heterogeneity (I2 = 100%, p < 0.001). Under FEM, the pooled effect size was larger and statistically significant (ES = 5.10, 95% CI: 5.09–5.10, p < 0.001) (Figure S2a: Forest plot; Figure S2b: funnel plot). No evidence of publication bias was found, as indicated by the funnel plot and Egger’s test (intercept: 12.74, p = 0.653) (Figure 7 and Figure 8).
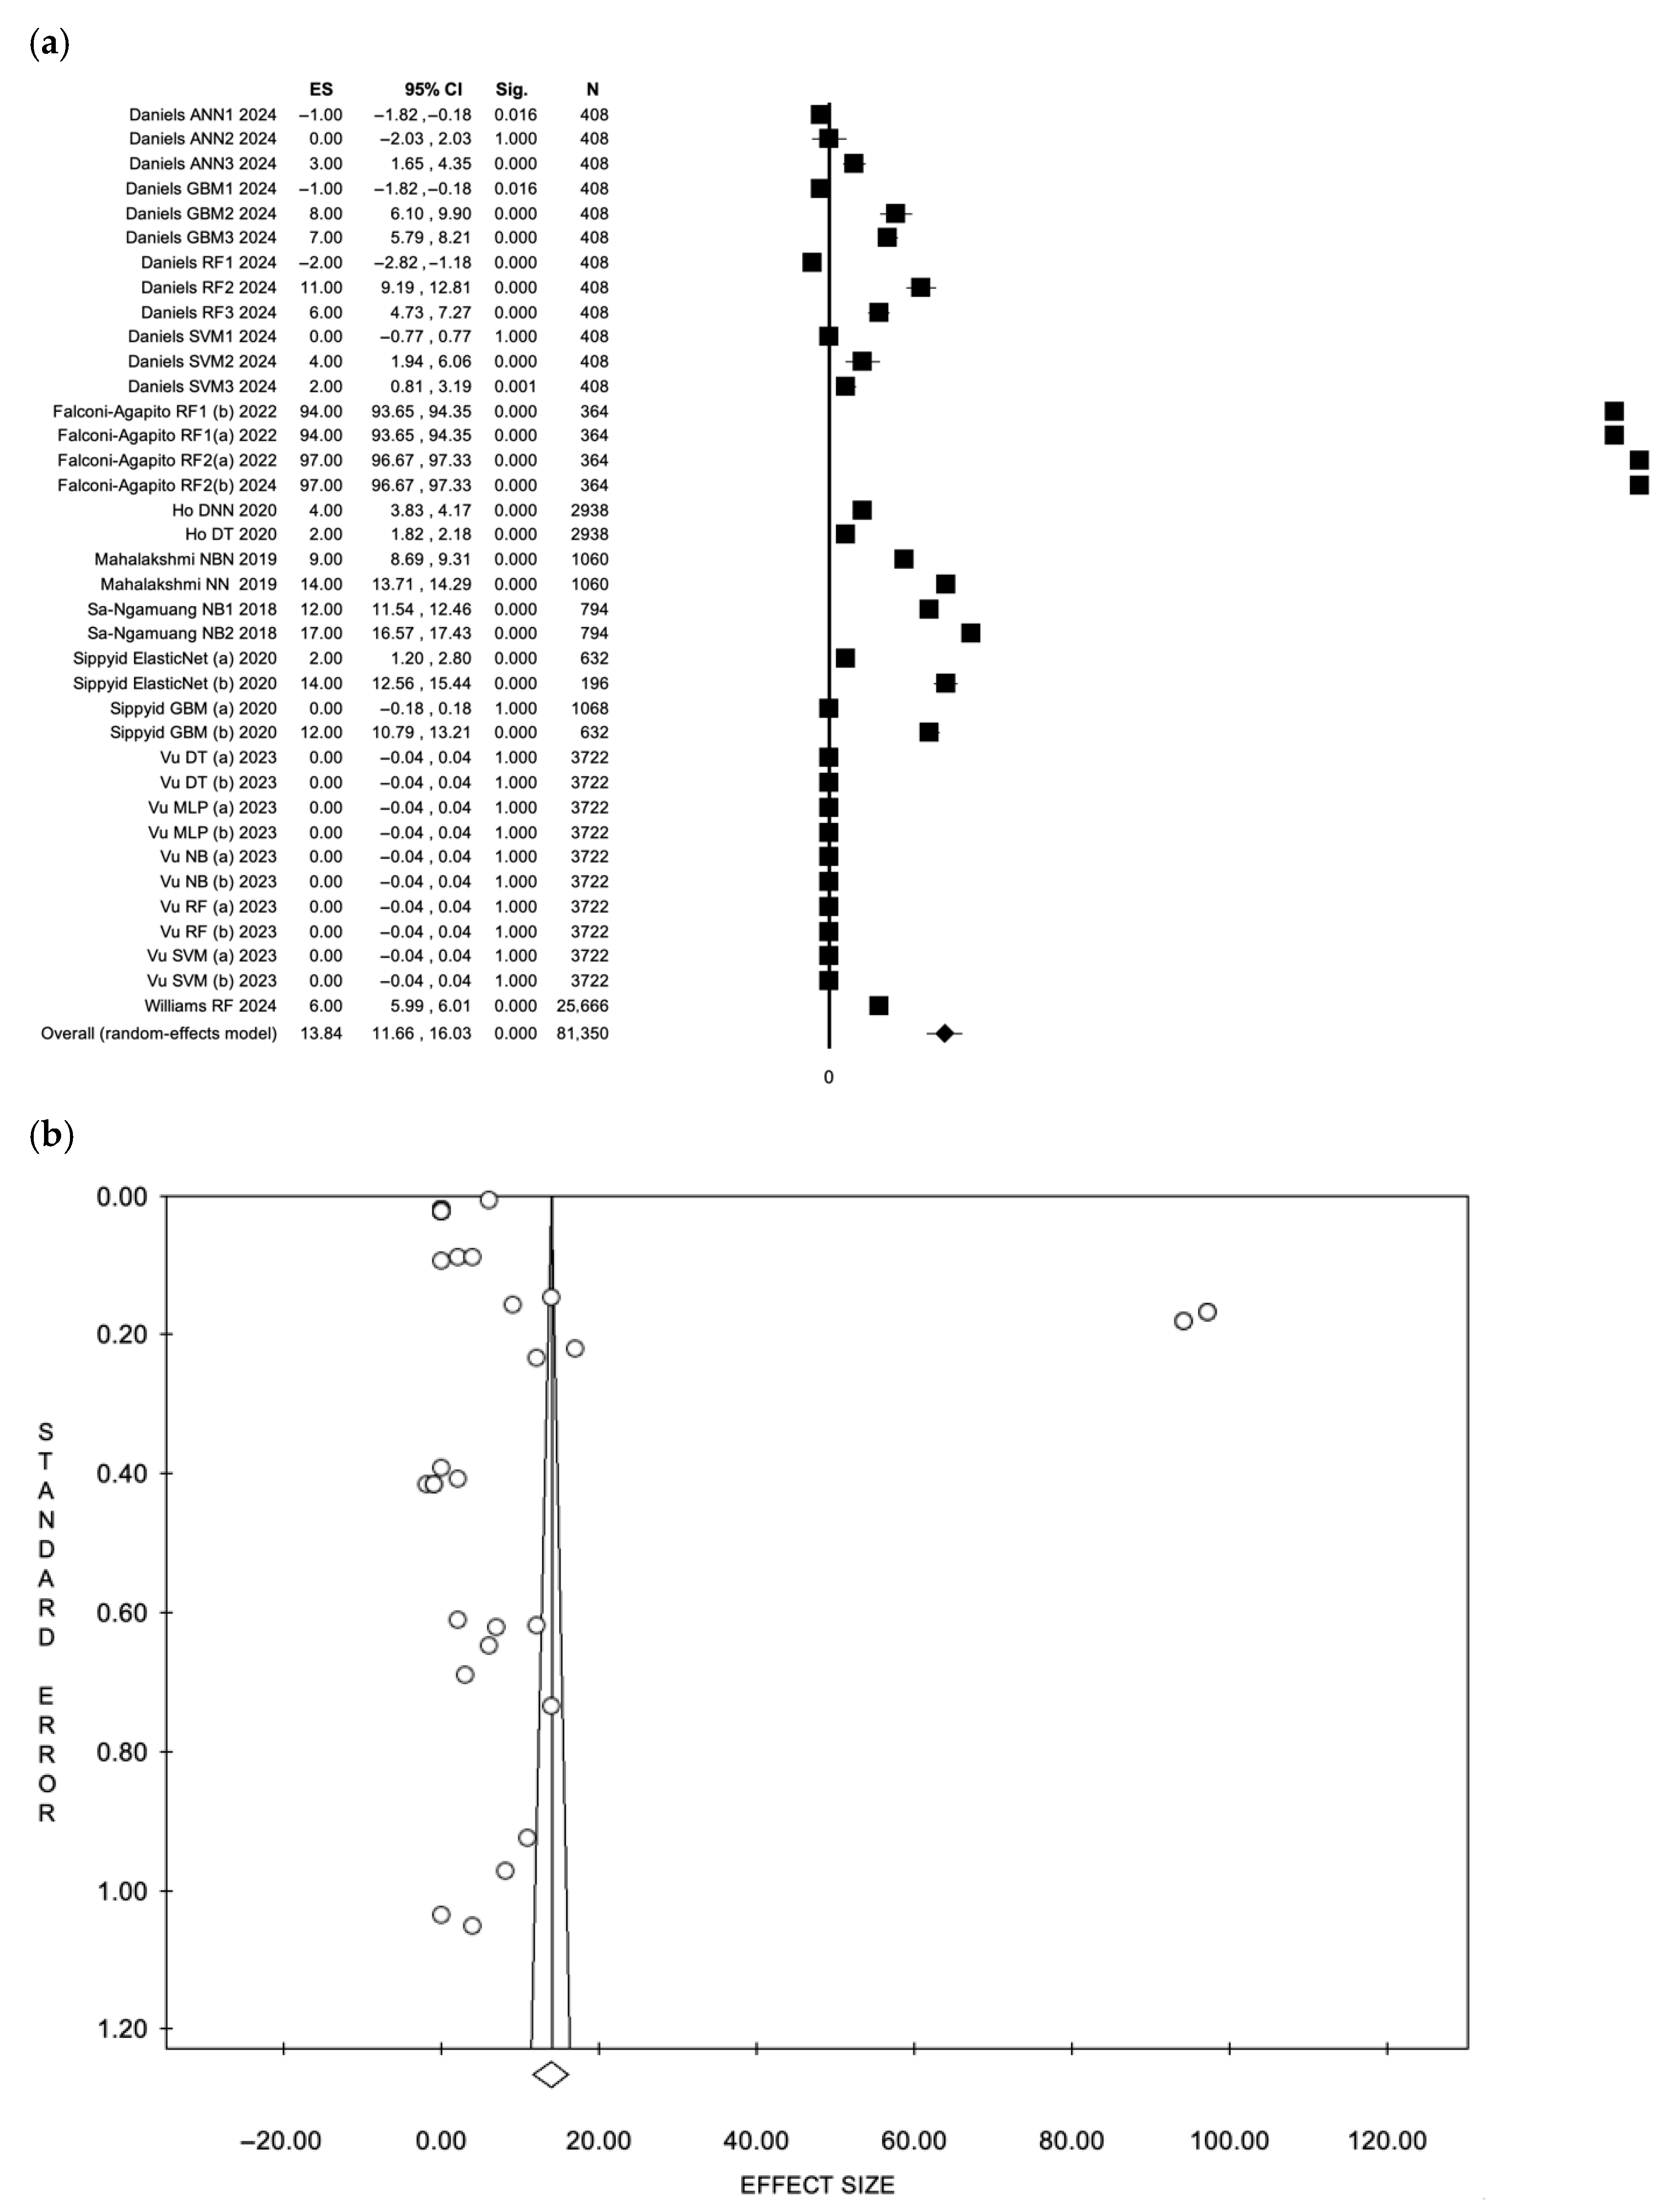
For NPV, 8 studies contributed 37 paired model comparisons, for a total included sample of 81,350 participants. Using REM (Figure 7a: forest plot; Figure 7b: funnel plot), AI-based models demonstrated a statistically significant improvement in negative predictive value compared with traditional approaches (ES = 13.84, 95% CI: 11.66–16.03, p < 0.001), with substantial between-study heterogeneity (I2 = 100%, p < 0.001). Under the FEM, the pooled effect size remained statistically significant but was markedly smaller (ES = 3.38, 95% CI: 3.37–3.39, p < 0.001) (Figure S3a: Forest plot; Figure S3b: funnel plot). No publication bias was evident (intercept: 42.3, p = 0.314).
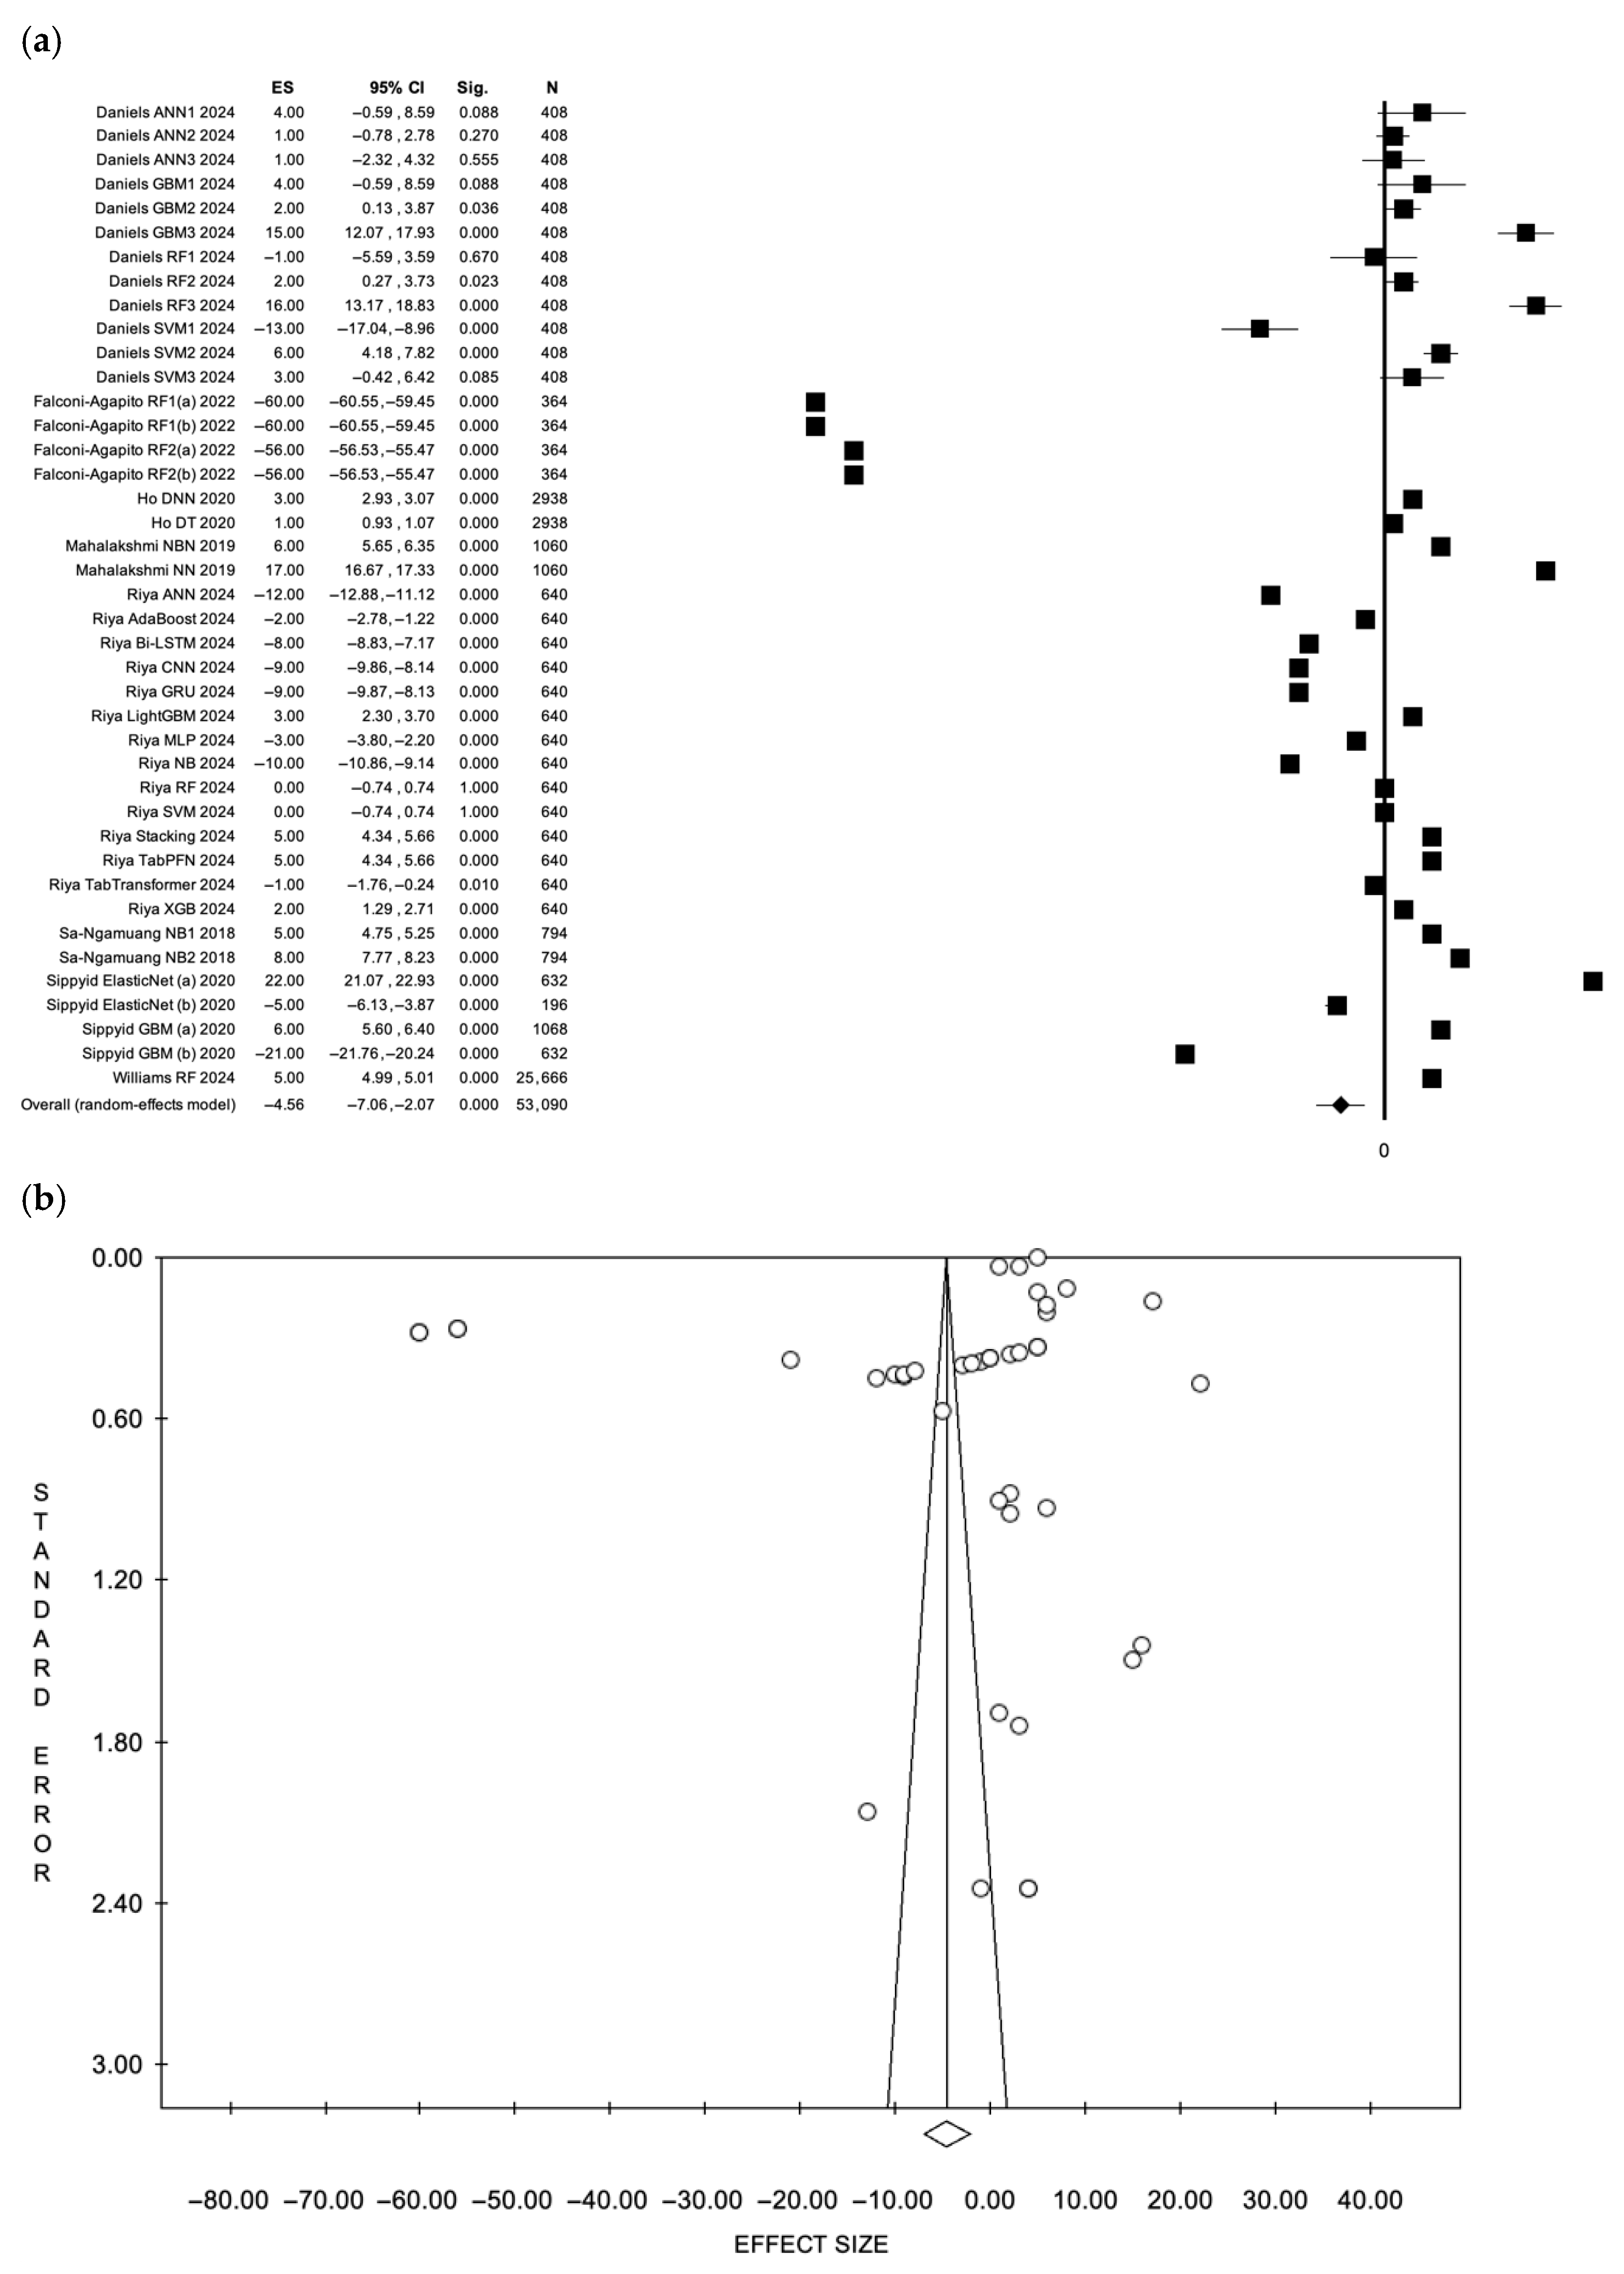
For PPV, 8 studies contributed 41 paired model comparisons, for a total included sample of 53,090 participants. Using a REM (Figure 8a: forest plot; Figure 8b: funnel plot), AI-based models showed a statistically significant reduction in positive predictive value compared with traditional approaches (ES = −4.56, 95% CI: −7.06 to −2.07, p < 0.001), with substantial between-study heterogeneity (I2 = 100%, p < 0.001). In contrast, under the FEM, the pooled effect size favored AI-based models (ES = 4.67, 95% CI: 4.66–4.69, p < 0.001), reflecting the strong influence of large studies and the assumption of a common underlying effect (Figure S4a: Forest plot; Figure S4b: funnel plot of estimated values). Visual inspection of funnel plots suggested evidence of publication bias, which was further supported by Egger’s regression test (intercept: −32.1, p = 0.01).
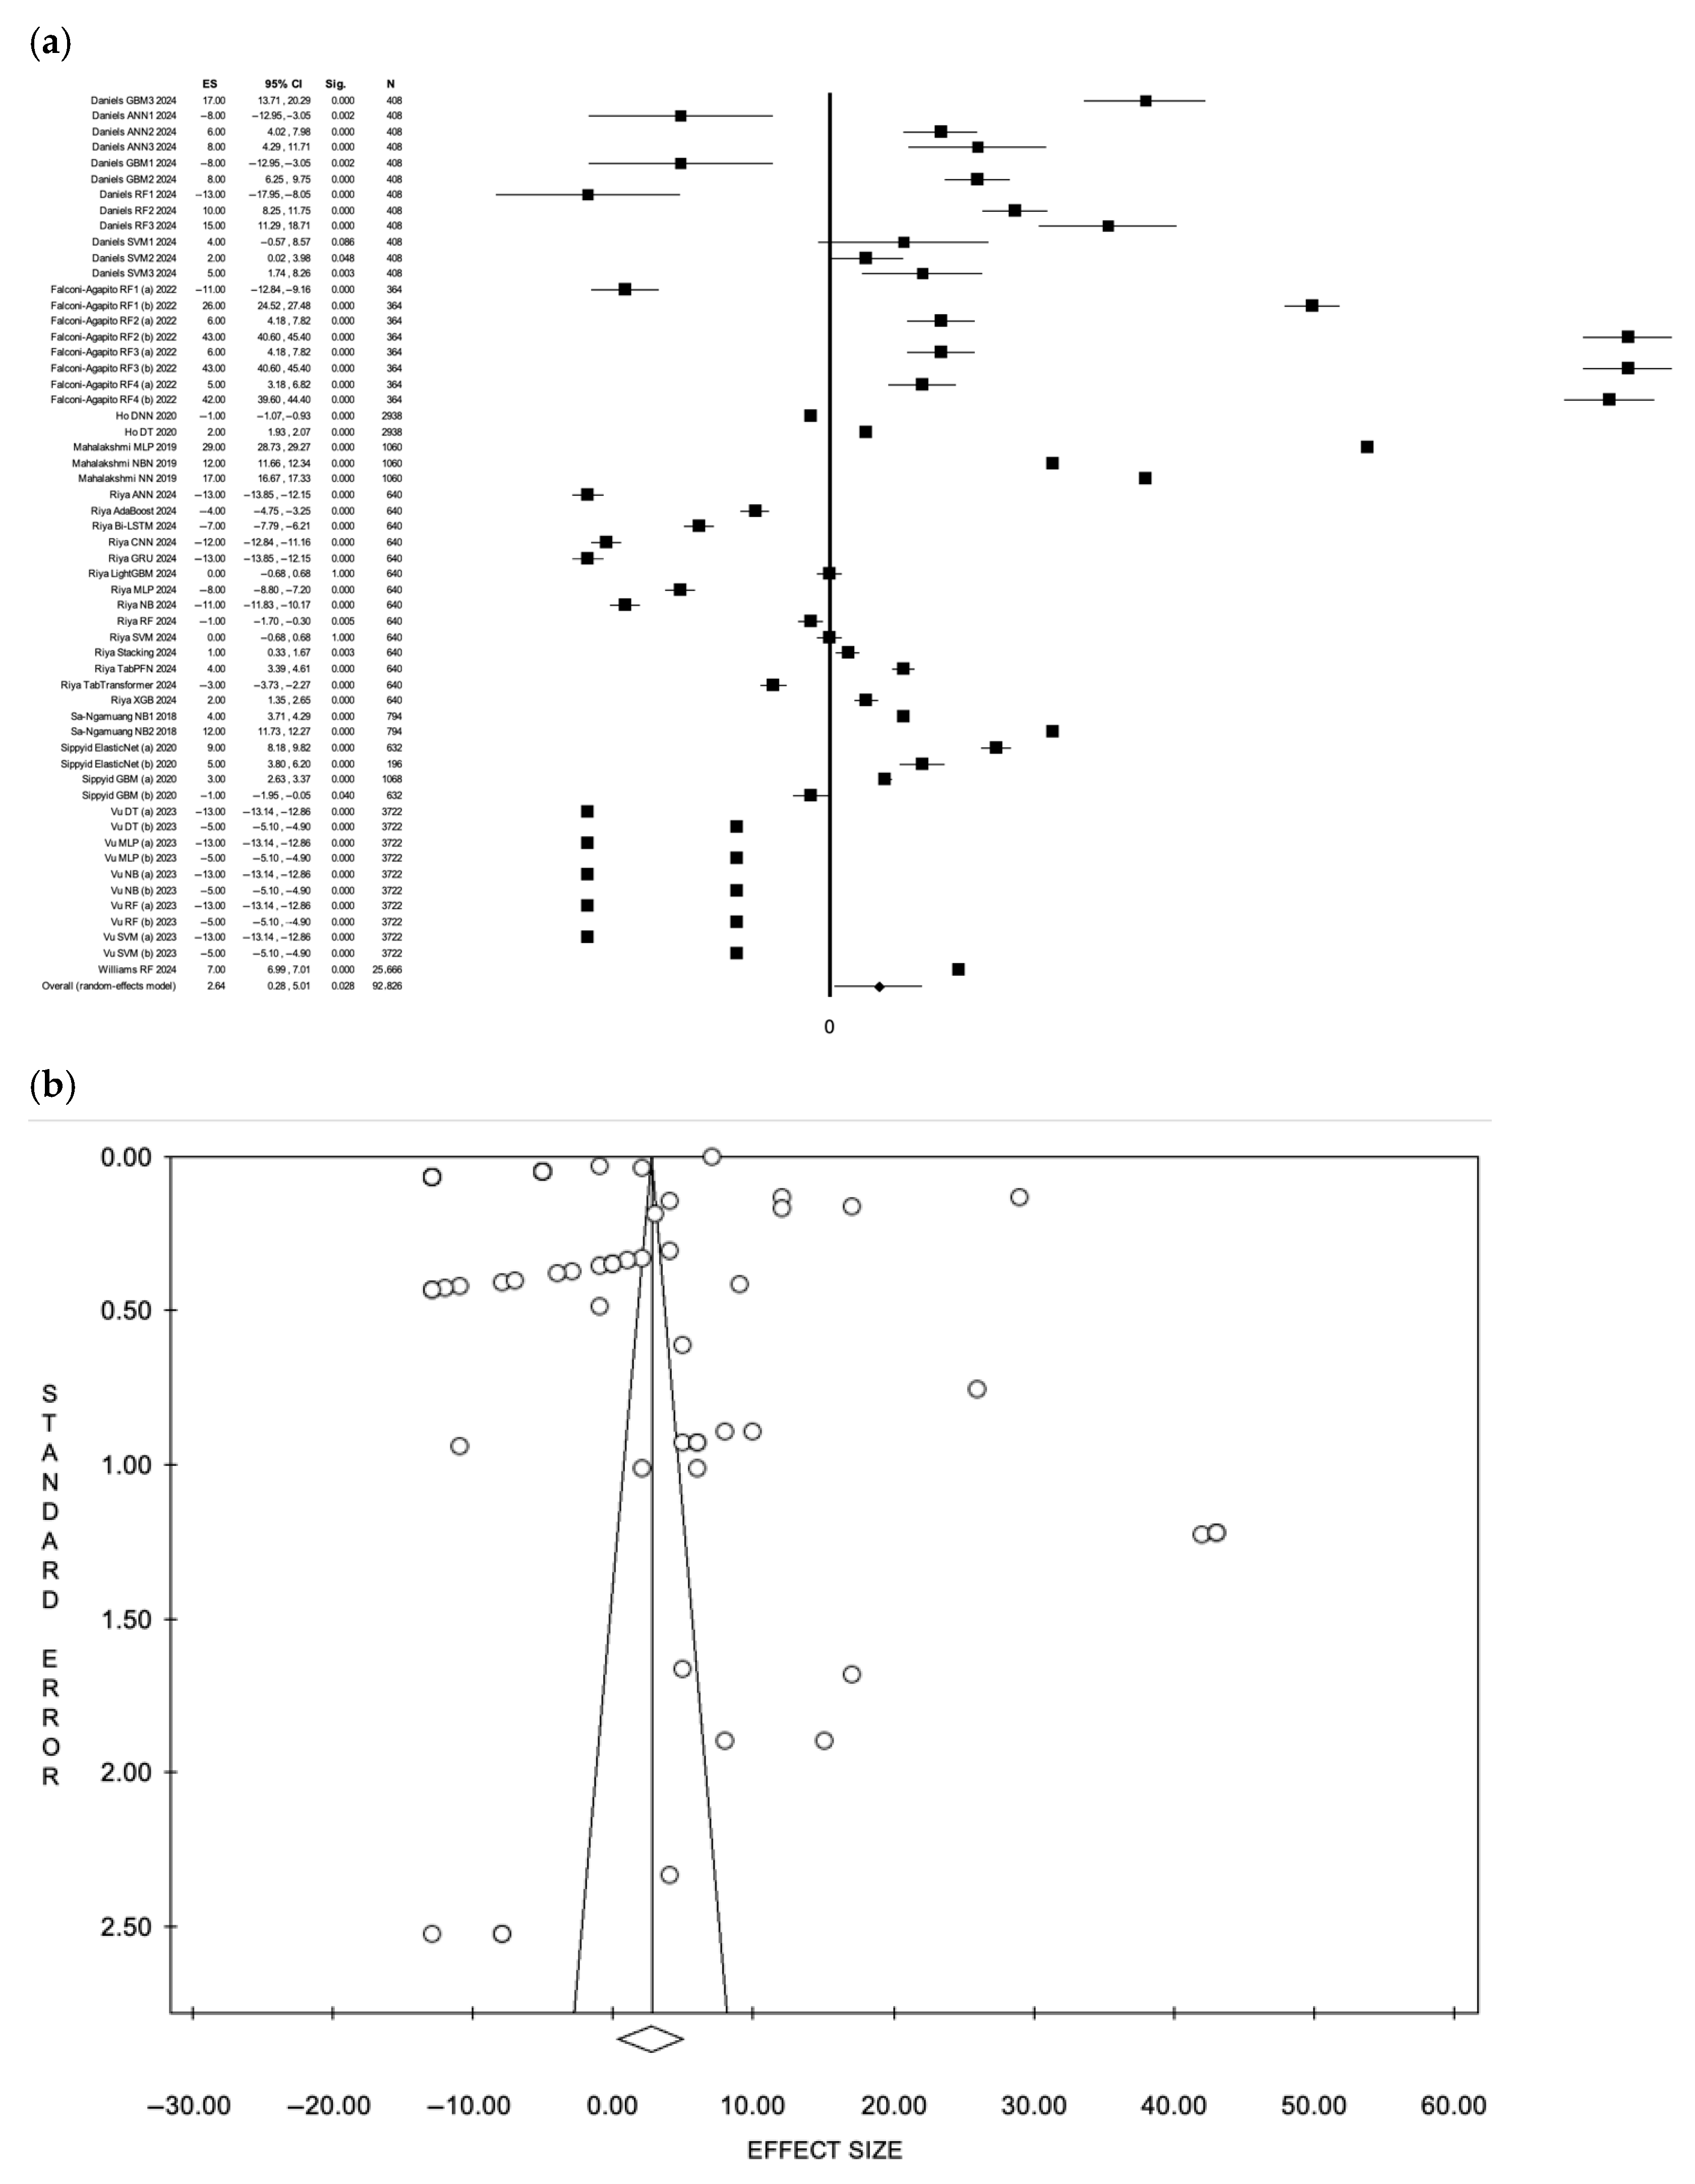
For sensitivity, 9 studies contributed 56 paired model comparisons, for a total included sample of 98,286 participants. Using a REM (Figure 9a: forest plot; Figure 9b: funnel plot), AI-based models showed a statistically significant improvement in sensitivity compared with traditional diagnostic approaches (ES = 2.64, 95% CI: 0.28–5.01, p = 0.028), with substantial between-study heterogeneity (I2 = 100%, p < 0.001). Under the FEM, the pooled effect size was larger and statistically significant (ES = 5.58, 95% CI: 5.57–5.59, p < 0.001) (Figure S5a: Forest plot; Figure S5b: funnel plot). Visual inspection of funnel plots suggested evidence of publication bias, which was further supported by Egger’s regression test (intercept: −47.6, p = 0.003).
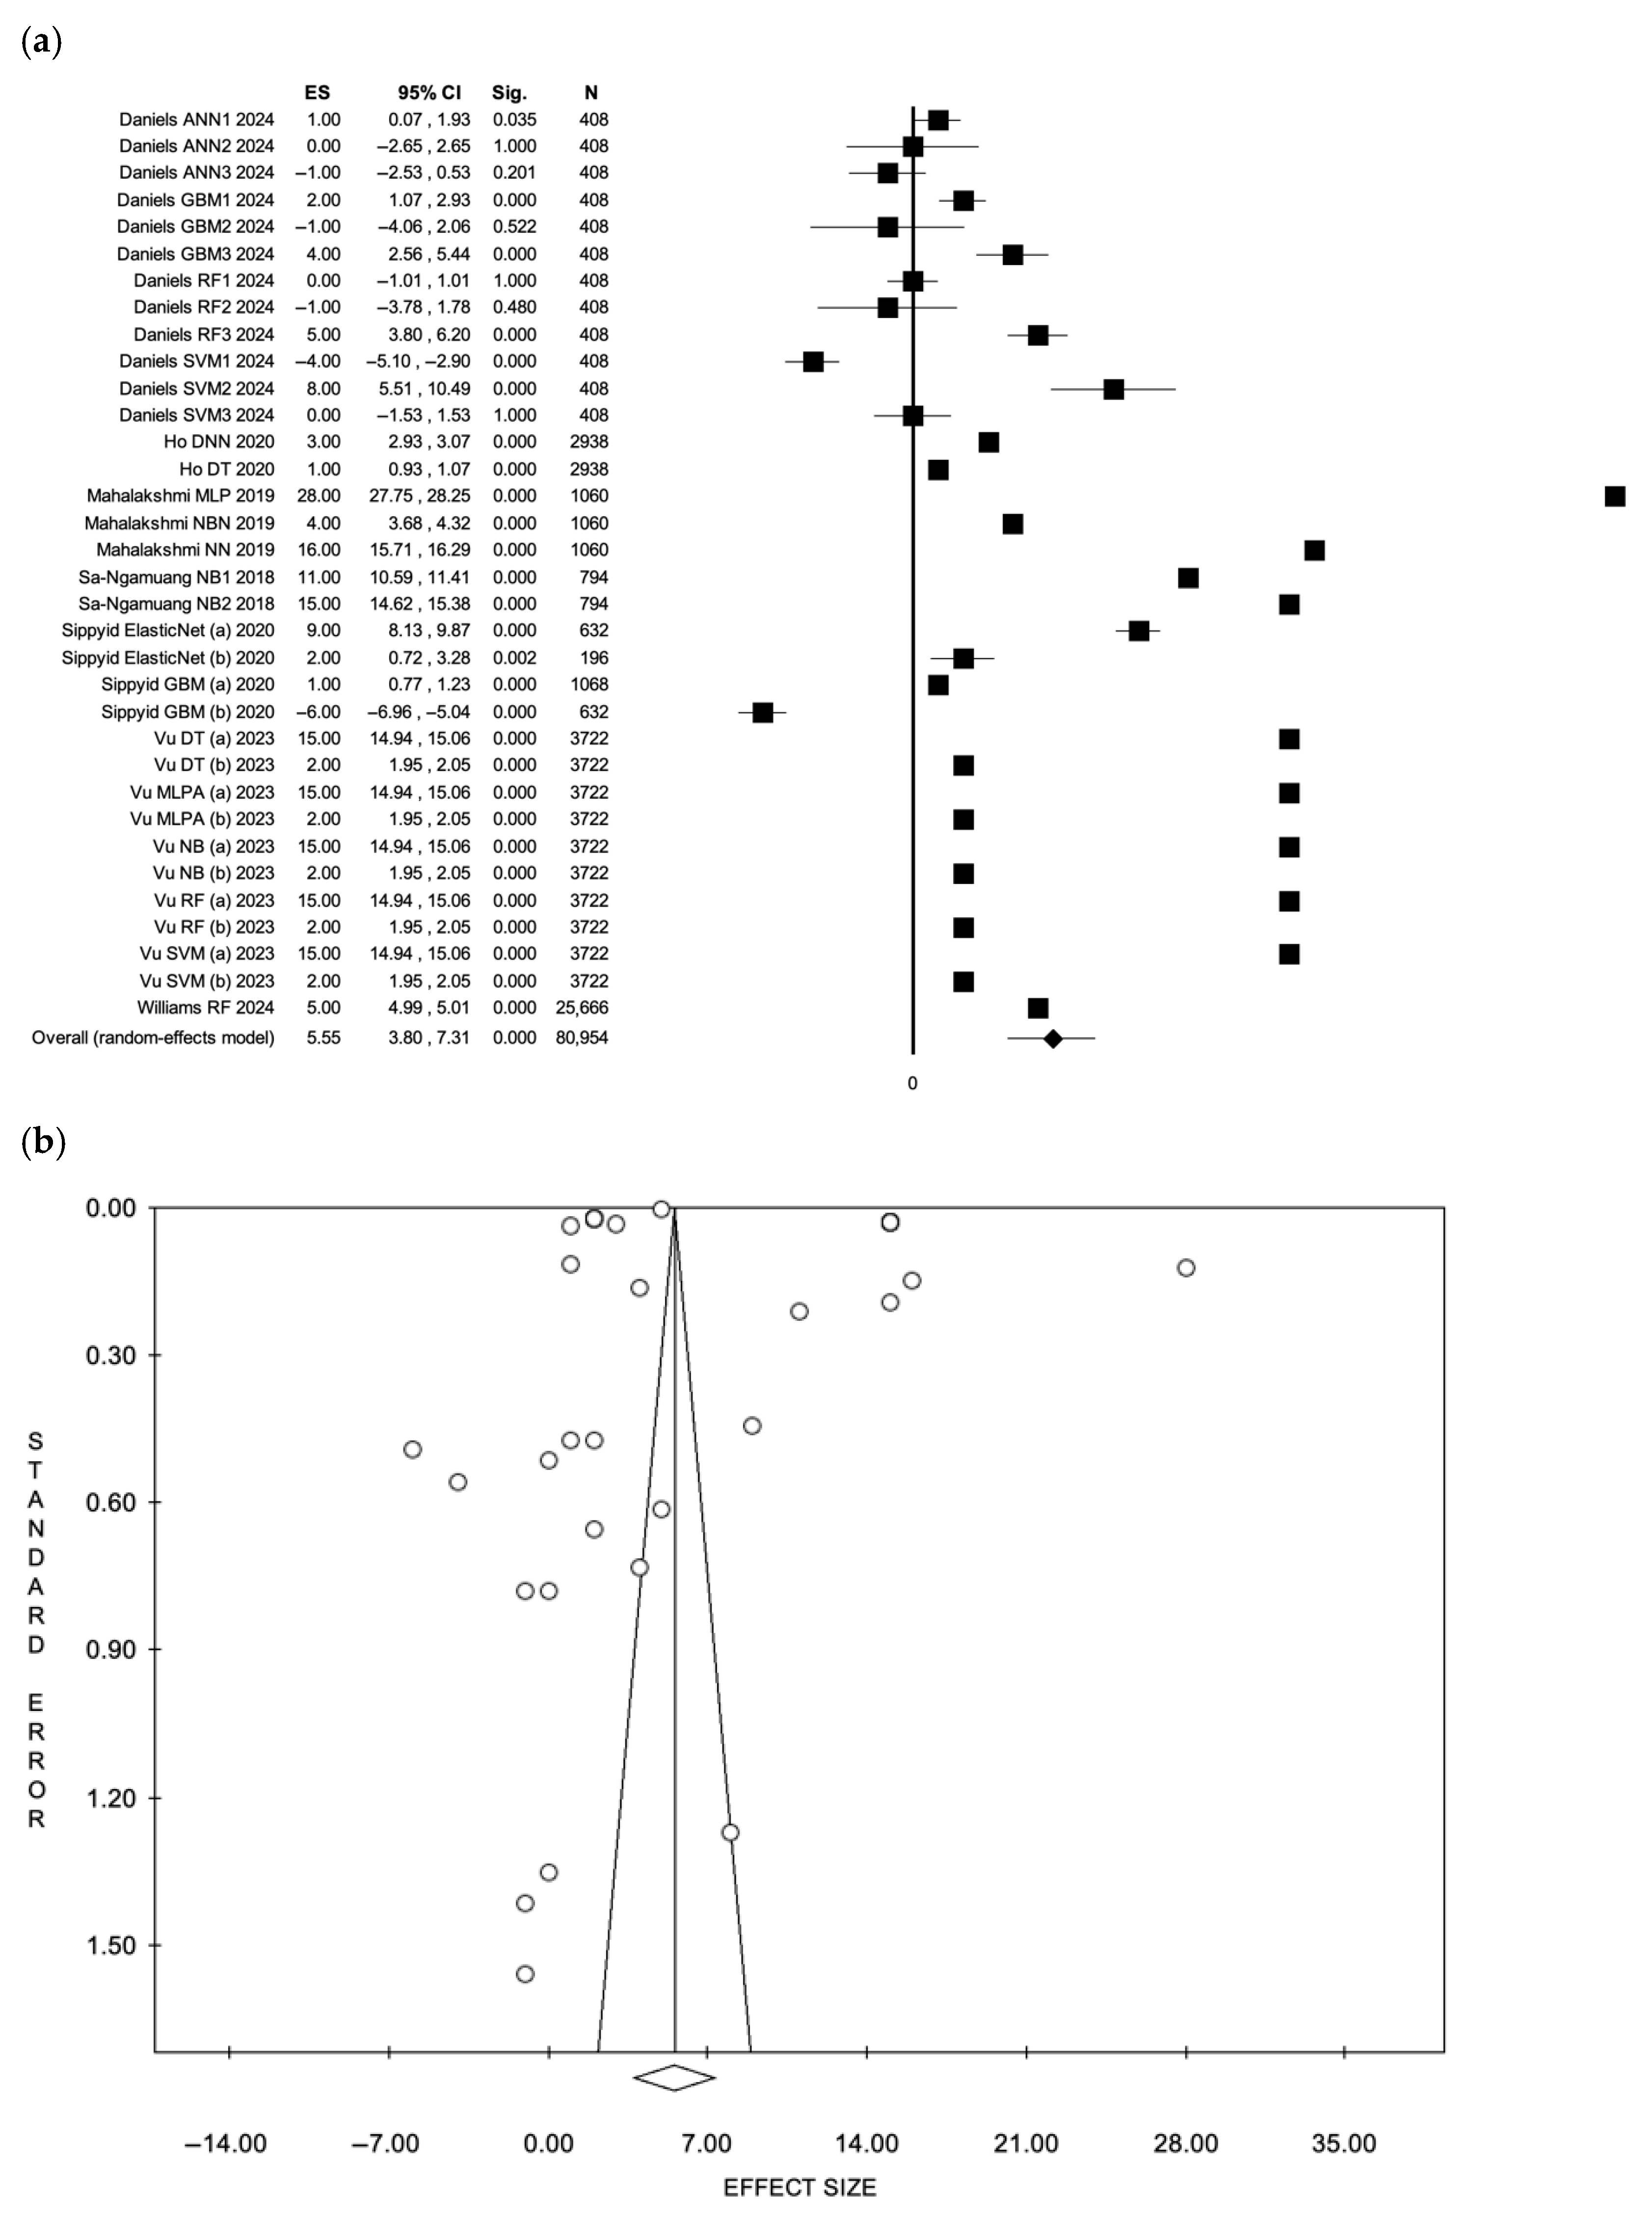
For specificity, 7 studies contributed 34 paired model comparisons, for a total included sample of 80,954 participants. Using REM (Figure 10a: forest plot; Figure 10b: funnel plot), AI-based models demonstrated a statistically significant improvement in specificity compared with traditional diagnostic approaches (ES = 5.55, 95% CI: 3.80–7.31, p < 0.001), with substantial between-study heterogeneity (I2 = 100%, p < 0.001). Under the FEM, the pooled effect size was similar in magnitude and statistically significant (ES = 5.67, 95% CI: 5.66–5.68, p < 0.001) (Figure S6a: Forest plot; Figure S6b: funnel plot). No publication bias was evident (intercept: 27.5, p = 0.351).

3.8.2. Sensitivity Analysis

Sensitivity analyses were performed by restricting the AUC meta-analysis to predefined comparator categories. For the AUC outcome, only the subgroup of conventional statistical models (primarily logistic regression–based approaches and derivative clinical indices) included a sufficient number of studies to allow quantitative subgroup analysis. Within this subgroup, 4 studies and 7 paired model comparisons contributed, for a total included sample of 34,070 participants. Using REM, AI-based models showed a statistically significant improvement in AUC compared with conventional statistical comparators (ES = 2.72, 95% CI: 0.39–5.04, p = 0.022), with substantial between-study heterogeneity (I2 = 100%, p < 0.001). Under the FEM, the pooled effect size was larger and highly significant (ES = 5.60, 95% CI: 5.59–5.61, p < 0.001) (Figure S7a: REM; Figure S7b: FEM).
Sensitivity analysis for accuracy was restricted to the subgroup of conventional statistical models, as this was the only comparator category including a sufficient number of studies and paired comparisons to permit quantitative analysis. In this subgroup, 6 studies contributed 29 paired AI–comparator model comparisons, for a total included sample of 64,820 participants. Using REM, AI-based models demonstrated a statistically significant improvement in accuracy compared with conventional statistical approaches (ES = 1.54, 95% CI: 0.24–2.83, p = 0.020), with substantial between-study heterogeneity (I2 = 100%, p < 0.001). Under the FEM, the pooled effect size was larger and highly significant (ES = 4.03, 95% CI: 4.02–4.04, p < 0.001) (Figure S8a: REM; Figure S8b: FEM).
Sensitivity analysis for NPV was also restricted to the subgroup of conventional statistical models (6 studies, 26 paired AI–comparator model comparisons), for a total included sample of 59,696 participants. Using REM, AI-based models showed a statistically significant improvement in negative predictive value compared with conventional statistical approaches (ES = 3.82, 95% CI: 2.31–5.32, p < 0.001), with substantial between-study heterogeneity (I2 = 99.9%, p < 0.001). Under the FEM, the pooled effect size was similar in magnitude and highly significant (ES = 4.04, 95% CI: 4.03–4.05, p < 0.001), reflecting the influence of large, high-weight studies (Figure S9a: REM; Figure S9b: FEM).
Sensitivity analysis for PPV was restricted to the same subgroup (6 studies, 35 paired AI–comparator model comparisons), for a total included sample of 50,046 participants. Using REM, no statistically significant difference in PPV was observed between AI-based models and conventional statistical approaches (ES = 0.92, 95% CI: −0.15 to 2.00, p = 0.093), with substantial between-study heterogeneity (I2 = 99.9%, p < 0.001). In contrast, under the FEM, the pooled effect size favored AI-based models and was statistically significant (ES = 4.80, 95% CI: 4.79–4.81, p < 0.001) (Figure S10a: REM; Figure S10b: FEM).
Sensitivity analysis for sensitivity was restricted to the same subgroup of conventional statistical models. In this subgroup, paired AI–comparator comparisons were available for a total included sample of 69,716 participants. Using REM, no statistically significant difference in sensitivity was observed between AI-based models and conventional statistical approaches (ES = 0.94, 95% CI: −1.28 to 3.16, p = 0.406), indicating substantial variability in effect estimates across studies. In contrast, under the FEM, the pooled effect size favored AI-based models and was statistically significant (ES = 6.09, 95% CI: 6.08–6.10, p < 0.001), with substantial between-study heterogeneity (I2 = 99.9%, p < 0.001) (Figure S11a: REM; Figure S11b: FEM).
Sensitivity analysis for specificity was restricted to the same subgroup. In this subgroup, paired AI–comparator comparisons were available for a total included sample of 60,756 participants. Using a REM, AI-based models demonstrated a statistically significant improvement in specificity compared with conventional statistical approaches (ES = 3.31, 95% CI: 2.32–4.29, p < 0.001), despite substantial between-study heterogeneity (I2 = 99.9%, p < 0.001). Under the FEM, the pooled effect size was also statistically significant and slightly larger (ES = 4.15, 95% CI: 4.14–4.17, p < 0.001) (Figure S12a: REM; Figure S12b: FEM).

4. Discussion

4.1. Main Findings

To the best of our knowledge, this study represents the first systematic review and meta-analysis to provide a quantitative, paired comparison between AI-based diagnostic models and conventional diagnostic approaches for mosquito-borne viral infections across multiple performance metrics. This work applies a formal meta-analytic framework to directly compare AI models with laboratory-based, clinical, and conventional statistical comparators. Across the pooled analyses, AI-based models demonstrated statistically significant improvements in several clinically relevant performance metrics, including accuracy, sensitivity, specificity, and NPV, although results were characterized by substantial heterogeneity. In contrast, no robust or consistent advantage was observed for AUC, and findings for PPV were highly dependent on the choice of meta-analytic model. Sensitivity analyses restricted to conventional statistical comparators confirmed that AI-based approaches frequently outperformed LR–based models, particularly for accuracy, NPV, and specificity, while improvements in sensitivity and PPV were less consistent under heterogeneity-aware assumptions.

4.2. Interpretation of Findings

The lack of a robust and consistent increase in AUC under REM, despite statistically significant gains in sensitivity, specificity, accuracy, and NPV, indicates that AI models do not systematically improve discrimination when averaged across all possible thresholds. Since AUC reflects threshold-independent discrimination, its relative stability suggests that AI models largely preserve the same overall ranking of cases and non-cases as conventional models, while altering classification behavior at specific decision thresholds. This observation is congruent with empirical reports from dengue case-screening studies in which multilayer perceptron, decision tree, and logistic regression models yield nearly identical AUCs close to 0.98–0.99, despite differences in decision rules, complexity, and explainability [36]. Similarly, in models predicting severe dengue in Puerto Rico, gradient boosting achieves a high AUC (0.97), but the incremental gain over simpler models primarily manifests at clinically selected cut-offs, where improved sensitivity and NPV are emphasized [37].
By contrast, the consistent improvements observed for sensitivity, specificity, accuracy, and particularly NPV, underscore the operational strengths of AI-based approaches when evaluated at fixed thresholds, i.e., in the way they are deployed in clinical pathways. Gains in NPV are especially relevant in the context of arboviral infections, where early exclusion of infection among low-risk individuals is central to triage and resource allocation, and where confirmatory testing is often constrained. In a recent dengue case-screening study using simple binary-encoded clinical features, tree-based models and neural networks achieved very high NPV and overall accuracy (98%), supporting their use as pre-test stratification tools in primary care and emergency settings [36]. Analogously, transfer-learning-based models for predicting hospitalization due to arboviral infections achieved excellent discrimination but were explicitly tuned to minimize false negatives for severe outcomes, thus prioritizing sensitivity and NPV at the cost of increased false positives [12].
The behavior of PPV in this meta-analysis further illustrates the underlying trade-off structure and the sensitivity of prevalence-dependent metrics to evaluation conditions. Under REM, AI-based models are associated with a reduction in PPV relative to conventional approaches, reflecting a shift toward sensitivity-oriented operating points that increase the number of individuals classified as positive. This pattern is coherent with many development studies in which class imbalance, cost-sensitive loss functions, or clinical priorities (e.g., avoidance of missed severe dengue) explicitly favor higher sensitivity [13,38,39]. However, PPV is inherently dependent on disease prevalence, and in several included studies AI models and comparators were not evaluated under identical prevalence or class-balance conditions, limiting direct comparability. This is particularly evident in Falconi-Agapito et al. [24], where the comparator was assessed in an almost exclusively positive cohort, resulting in an inflated PPV by construction rather than reflecting superior discriminative performance. In surveillance and early-warning contexts, such sensitivity-oriented profiles may be desirable, whereas in confirmatory or rule-in applications reduced PPV reinforces the need to integrate AI outputs with high-specificity laboratory assays (e.g., NS1-based rapid tests or RT-PCR) within sequential diagnostic algorithms [40,41].
The pronounced divergence between FEM and REM estimates across almost all outcomes provides additional insight. FEM, heavily influenced by large or high-performing studies, consistently favor AI-based approaches for AUC and threshold-dependent metrics. However, REM, which treats between-study variability as substantive, yields attenuated and sometimes non-significant pooled effects. External validation work on dengue classifiers supports this picture: LR and other relatively simple models show appreciable degradation in calibration and performance when transported across datasets with different case mixes and prevalence, and more complex ML algorithms do not automatically generalize better without retraining or recalibration. These findings imply that the apparent superiority of AI in individual reports may be at least partly dataset-specific, and that pooled advantages should not be extrapolated uncritically to new populations or health systems [10,42]. In this review, as in other meta-analyses pooling performance metrics of AI models in clinical settings, substantial heterogeneity across studies and evidence derived almost exclusively from internally validated models, with no evaluation of the identified models in clinical deployment, could heavily limit confidence in the robustness, interpretation, and transferability of the observed effects to real-world settings. Indeed, assessing the real-world impact of AI implementation in clinical practice through systematic reviews and meta-analyses remains methodologically challenging, despite the expanding literature, due to suboptimal reporting of external validation metrics, prospective performance assessments, and health outcomes [43,44].
Importantly, sensitivity analyses restricted to conventional statistical comparators indicate that AI-based models frequently outperform LR with respect to specificity, NPV, and accuracy, even though LR is implemented as a reasonably strong baseline. This is consistent with comparative dengue studies in which ensemble methods (random forest, gradient boosting, XGBoost) and DL architectures attain higher AUCs, better calibration, and improved composite metrics (e.g., F1-score) than LR and other linear models, particularly when non-linear interactions and higher-order terms are important [38,45,46]. At the same time, external validation analyses demonstrate that well-specified LR models can be competitive across diverse datasets when appropriately recalibrated, sometimes matching or exceeding more complex models under distributional shift. The combined evidence therefore supports a nuanced interpretation: AI confers measurable but modest advantages over traditional parametric approaches, and these advantages are highly contingent on data quality, feature availability, epidemiological context, and the care taken in model development and validation.

4.3. Implications for Public Health and Clinical Practice

The findings of this meta-analysis have several important implications for public health surveillance and clinical management of mosquito-borne viral infections. Taken together, the observed performance profile suggests that AI-based diagnostic models may be most appropriately positioned as adjunctive decision-support tools, rather than as stand-alone diagnostic replacements, particularly in the early phases of patient evaluation and outbreak detection.
From a public health perspective, the consistent gains in sensitivity and NPV indicate that AI-based approaches may enhance early case identification and exclusion in surveillance and triage settings. Integrating conventional surveillance infrastructures with AI-driven analytics and the analysis of user search trends on platforms such as Google and Wikipedia may strengthen situational awareness and assist policy-makers in implementing timely preventive measures and targeted information campaigns [47,48]. In endemic or outbreak-prone regions, where large numbers of patients present with acute febrile illness and laboratory capacity is limited, tools that reliably rule out infection among low-risk individuals can improve patient flow, reduce unnecessary testing, and support more efficient allocation of public health resources [9,15,49,50,51]. In this context, AI models tuned toward sensitivity-oriented operating points may be advantageous, as missed cases pose a greater risk to outbreak detection and control than false-positive signals, which can be addressed through subsequent confirmatory testing.
In clinical practice, AI-based models may complement existing diagnostic pathways by supporting risk stratification at first presentation, using routinely available clinical and basic laboratory data. The observed improvements in accuracy and specificity suggest potential value in prioritizing patients for confirmatory assays, isolation measures, or closer follow-up, particularly in settings where access to molecular or serological testing is delayed. However, the reduction or instability of PPV under heterogeneity-aware models highlights that AI outputs should be interpreted probabilistically and integrated within sequential diagnostic algorithms, rather than used to make definitive rule-in decisions. Integration with high-specificity laboratory tests, such as NS1 antigen assays or RT-PCR, is therefore essential to mitigate false-positive classifications and ensure clinical safety [41].
At the health-system level, these findings underscore the importance of context-specific implementation. The substantial between-study heterogeneity observed across all outcomes indicates that AI model performance is sensitive to local epidemiology, disease prevalence, feature availability, and case-mix composition [11]. As a result, models developed in one setting should not be assumed to generalize without recalibration or retraining. Routine local validation, performance monitoring, and threshold adjustment should be considered prerequisites for deployment, particularly in public health surveillance systems where decision thresholds may need to adapt dynamically to changing epidemiological conditions [52].
Finally, the results emphasize a broader implication for the evaluation of AI in public health: performance should not be judged solely on global discrimination metrics such as AUC, but rather on operationally meaningful outcomes aligned with specific use cases, including triage efficiency, resource utilization, and downstream clinical or public health impact [53]. Future work should therefore move beyond retrospective accuracy assessments and prioritize prospective, implementation-focused studies that evaluate how AI-assisted decision-making influences real-world outcomes, equity, and system-level performance.

4.4. Strengths and Limitations

This study has several strengths. To the best of our knowledge, it is the first systematic review and meta-analysis to quantitatively compare AI-based diagnostic models with conventional diagnostic approaches for mosquito-borne viral infections using a paired analytical framework. Adherence to PRISMA 2020 guidelines, comprehensive database searching, and the use of clinically interpretable unstandardized effect sizes strengthen the robustness of the findings. The inclusion of multiple performance metrics and prespecified sensitivity analyses allowed a nuanced assessment of diagnostic performance across clinically relevant dimensions.
Important limitations should be acknowledged. Substantial between-study heterogeneity was observed across all outcomes (I2 ≈ 100%), reflecting variability in study design, populations, disease prevalence, predictor availability, clinical context and modelling strategies. In such settings, pooled estimates may be influenced as much by differences in study design and data characteristics as by true differences in model performance and should therefore be interpreted as indicative of general trends rather than precise quantitative effects. Secondly, the meta-analysis was based on multiple paired comparisons extracted from a relatively small number of studies. Because several comparisons originated from the same datasets, the assumption of independence between effect sizes may not be fully satisfied, potentially leading to underestimation of uncertainty and overrepresentation of specific studies in the pooled results. Third, several performance metrics considered—particularly accuracy, PPV, NPV, and F1-score—are inherently dependent on disease prevalence and decision thresholds, which varied across studies. Although within-study paired comparisons improve comparability by controlling for case-mix and prevalence within individual studies, differences in class balance, threshold selection, and calibration strategies across studies limit the comparability of these metrics at the pooled level. Consequently, meta-analytic estimates for threshold-dependent outcomes should be interpreted with caution. In contrast, threshold-independent metrics such as AUC may provide more stable comparisons across studies, although they capture different aspects of model performance and are less directly aligned with clinical decision-making. Forth, although the review was designed to focus on individual-level diagnostic applications, some included studies differed in design, scope, or modelling objectives, reflecting the heterogeneity of the field and potentially limiting alignment with a single, uniform research question. In addition, most studies relied on retrospective data and internal validation, with limited reporting of external validation and calibration, restricting generalizability. Differences in comparator definitions and incomplete reporting further constrained subgroup analyses, and evidence of publication bias was observed for selected outcomes. Finally, this review could not assess the downstream clinical or public health impact of AI-assisted diagnostics. Actually, most of the included studies were based on hospitalized cases or clinical series, with limited representation of community-based settings and local outbreak scenarios. Very scanty information was obtained from community-based studies of local outbreaks.
Taken together, these considerations raise concerns about the extent to which comparisons between AI/ML and conventional statistical approaches can be considered fully fair or unbiased. Although within-study paired comparisons improve internal comparability, residual heterogeneity in datasets, validation strategies, and threshold selection limits the strength of causal interpretation. More standardized evaluation frameworks—based on shared datasets, consistent validation procedures, and greater reliance on threshold-independent metrics—would be necessary to support more definitive conclusions. Thus, no definitive conclusion might be drawn on the capacity of AI to improve early diagnosis in course of outbreaks either in endemic or non-endemic countries.

4.5. Future Directions

Future research should prioritize prospective, externally validated studies assessing AI-based diagnostic tools within real-world clinical and surveillance workflows. Particular emphasis should be placed on multicenter external validation across heterogeneous epidemiological contexts, dynamic recalibration strategies under shifting prevalence, and transparent reporting of calibration and decision thresholds. Implementation studies should move beyond retrospective accuracy metrics to evaluate patient-centered and system-level outcomes, including time to diagnosis, resource utilization, triage efficiency, equity of access, and outbreak detection performance. Integration with laboratory-based diagnostics in sequential or hybrid algorithms warrants formal evaluation. Finally, methodological rigor must improve, particularly in addressing overfitting, handling missing data, reporting interpretability approaches, and adhering to AI-specific reporting standards. Such advances will be essential to determine the sustainable and equitable role of AI in arboviral diagnostics and public health surveillance.

5. Conclusions

This systematic review and meta-analysis show that AI-based diagnostic models can provide, to a limited extent, incremental improvements over conventional approaches for mosquito-borne viral infections, particularly in sensitivity, specificity, accuracy, and negative predictive value. These findings indicate that AI primarily enhances threshold-dependent, operational diagnostic performance, such as early triage, case exclusion, and prioritization for confirmatory testing, rather than overall discrimination. The results support the use of AI-based models as adjunctive decision-support tools, especially in early clinical assessment, while underscoring the need for cautious interpretation given the substantial heterogeneity across studies. Prospective validation and implementation-focused research are required to determine the real-world clinical and public health impact of these approaches.

Supplementary Materials

The following supporting information can be downloaded at: https://www.mdpi.com/article/10.3390/make8040093/s1, Table S1. Full search strings used in PubMed, Embase, and Scopus, including all controlled vocabulary terms and free-text keywords, reported exactly as executed; Table S2. Detailed characteristics of the included studies; Table S3. Study-level characteristics of the included AI models, including data source, number of variables included versus considered during model development, type of validation, and whether model interpretability/explainability was reported; Figure S1. (a) Forest plot and (b) funnel plot of the fixed effect model assessing AUC. Effect sizes are expressed as unstandardized mean differences, with AUC values reported in percentage points (%); Figure S2. (a) Forest plot of the fixed effect model assessing accuracy and (b) funnel plot of estimated values. Effect sizes are expressed as unstandardized mean differences; Figure S3. (a) Forest plot and (b) funnel plot of the fixed effect model assessing NPV. Effect sizes are expressed as unstandardized mean differences; Figure S4. (a) Forest plot and (b) funnel plot of the fixed effect model assessing PPV. Effect sizes are expressed as unstandardized mean differences; Figure S5. (a) Forest plot and (b) funnel plot of the fixed effect model assessing sensitivity. Effect sizes are expressed as unstandardized mean differences; Figure S6. (a) Forest plot and (b) funnel plot of the fixed effect model assessing specificity. Effect sizes are expressed as unstandardized mean differences; Figure S7. Sensitivity analysis of AUC restricted to conventional statistical model comparators: (a) random effects model and (b) fixed-effects model, based on paired comparisons between AI-based models and conventional statistical approaches. Effect sizes are expressed as unstandardized mean differences, with AUC values reported in percentage points (%); Figure S8. Sensitivity analysis of accuracy restricted to conventional statistical model comparators: (a) random effects model and (b) fixed-effects model, based on paired comparisons between AI-based models and conventional statistical approaches. Effect sizes are expressed as unstandardized mean differences; Figure S9. Sensitivity analysis of NPV restricted to conventional statistical model comparators: (a) random effects model and (b) fixed-effects model, based on paired comparisons between AI-based models and conventional statistical approaches. Effect sizes are expressed as unstandardized mean differences; Figure S10. Sensitivity analysis of PPV restricted to conventional statistical model comparators: (a) random effects model and (b) fixed-effects model, based on paired comparisons between AI-based models and conventional statistical approaches. Effect sizes are expressed as unstandardized mean differences; Figure S11. Sensitivity analysis of sensitivity restricted to conventional statistical model comparators: (a) random effects model and (b) fixed-effects model, based on paired comparisons between AI-based models and conventional statistical approaches. Effect sizes are expressed as unstandardized mean differences; Figure S12. Specificity analysis of sensitivity restricted to conventional statistical model comparators: (a) random effects model and (b) fixed-effects model, based on paired comparisons between AI-based models and conventional statistical approaches. Effect sizes are expressed as unstandardized mean differences.

Author Contributions

Conceptualization, F.P. and A.P.; methodology, F.P., A.P., C.C. and V.G.; software, F.P. and A.P.; validation, A.C. and V.G.; formal analysis, F.P., A.P. and C.C.; investigation, F.P. and A.P.; resources, F.P.; data curation, A.P.; writing—original draft preparation, F.P. and A.P.; writing—review and editing, V.G.; visualization, A.P.; supervision, G.R., C.S. and V.B.; project administration, V.G. All authors have read and agreed to the published version of the manuscript.

Funding

This research received no external funding.

Data Availability Statement

The data analyzed in this study were obtained from previously published articles included in the review and are available in the cited references. Further details are available from the corresponding author upon reasonable request.

Conflicts of Interest

The authors declare no conflicts of interest.

References

  1. Capeding, M.R.; Chua, M.N.; Hadinegoro, S.R.; Hussain, I.I.H.M.; Nallusamy, R.; Pitisuttithum, P.; Rusmil, K.; Thisyakorn, U.; Thomas, S.J.; Huu Tran, N.; et al. Dengue and Other Common Causes of Acute Febrile Illness in Asia: An Active Surveillance Study in Children. PLoS Negl. Trop. Dis. 2013, 7, e2331. [Google Scholar] [CrossRef] [PubMed]
  2. Ravel, F.; Robert, S.; Djibougou, D.A.; Horo, K.; Tanon, A.; Ango, P.; Lompo, P.F.; Meynier, F.; Brossault, L.; Guler, U.; et al. Improving Management of Viral Febrile Illness and Reducing the Need for Empiric Antibiotics Using VIDAS® Immunoassay for Dengue and Chikungunya: A West African Multicentric Study. Diagnostics 2025, 15, 2269. [Google Scholar] [CrossRef] [PubMed]
  3. Gianfredi, V.; Nucci, D.; Pennisi, F.; Provenzano, S.; Ferrara, P.; Santangelo, O.E. Knowledge and Attitudes towards Zika Virus: An Italian Nation-Wide Cross-Sectional Study. Ann. Ist. Super. Sanita 2022, 58, 34–41. [Google Scholar] [CrossRef]
  4. Bustos Carrillo, F.A.; Ojeda, S.; Sanchez, N.; Plazaola, M.; Collado, D.; Miranda, T.; Saborio, S.; Lopez Mercado, B.; Carey Monterrey, J.; Arguello, S.; et al. A Comparative Analysis of Dengue, Chikungunya, and Zika in a Pediatric Cohort over 18 Years. medRxiv 2025, 2025.01.06.25320089. [Google Scholar] [CrossRef]
  5. Piantadosi, A.; Kanjilal, S. Diagnostic Approach for Arboviral Infections in the United States. J. Clin. Microbiol. 2020, 58, e01926-19. [Google Scholar] [CrossRef] [PubMed]
  6. Arrubla-Hoyos, W.; Gómez, J.G.; De-La-Hoz-Franco, E. Methodology for the Differential Classification of Dengue and Chikungunya According to the PAHO 2022 Diagnostic Guide. Viruses 2024, 16, 1088. [Google Scholar] [CrossRef]
  7. Beltrán-Silva, S.L.; Chacón-Hernández, S.S.; Moreno-Palacios, E.; Pereyra-Molina, J.Á. Clinical and Differential Diagnosis: Dengue, Chikungunya and Zika. Rev. Médica Hosp. Gen. México 2018, 81, 146–153. [Google Scholar] [CrossRef]
  8. da Silva Neto, S.R.; Tabosa Oliveira, T.; Teixeira, I.V.; Aguiar de Oliveira, S.B.; Souza Sampaio, V.; Lynn, T.; Endo, P.T. Machine Learning and Deep Learning Techniques to Support Clinical Diagnosis of Arboviral Diseases: A Systematic Review. PLoS Negl. Trop. Dis. 2022, 16, e0010061. [Google Scholar] [CrossRef]
  9. Pinto, A.; Pennisi, F.; Odelli, S.; De Ponti, E.; Veronese, N.; Signorelli, C.; Baldo, V.; Gianfredi, V. Artificial Intelligence in the Management of Infectious Diseases in Older Adults: Diagnostic, Prognostic, and Therapeutic Applications. Biomedicines 2025, 13, 2525. [Google Scholar] [CrossRef]
  10. Pennisi, F.; Pinto, A.; Borgonovo, F.; Scaglione, G.; Ligresti, R.; Santangelo, O.E.; Provenzano, S.; Gori, A.; Baldo, V.; Signorelli, C.; et al. Artificial Intelligence Models for Forecasting Mosquito-Borne Viral Diseases in Human Populations: A Global Systematic Review and Comparative Performance Analysis. Mach. Learn. Knowl. Extr. 2026, 8, 15. [Google Scholar] [CrossRef]
  11. Attai, K.; Amannejad, Y.; Vahdat Pour, M.; Obot, O.; Uzoka, F.-M. A Systematic Review of Applications of Machine Learning and Other Soft Computing Techniques for the Diagnosis of Tropical Diseases. Trop. Med. Infect. Dis. 2022, 7, 398. [Google Scholar] [CrossRef] [PubMed]
  12. Ozer, I.; Cetin, O.; Gorur, K.; Temurtas, F. Improved Machine Learning Performances with Transfer Learning to Predicting Need for Hospitalization in Arboviral Infections against the Small Dataset. Neural Comput. Appl. 2021, 33, 14975–14989. [Google Scholar] [CrossRef] [PubMed]
  13. Cruz-Parada, E.; Vivar-Estudillo, G.; Pérez-Campos Mayoral, L.; Hernández-Huerta, M.T.; Pérez-Santiago, A.D.; Romero-Diaz, C.; Pérez-Campos Mayoral, E.; Montalvo, I.A.G.; Martínez-Martínez, L.; Martínez-Ruiz, H.; et al. Proof-of-Concept Machine Learning Framework for Arboviral Disease Classification Using Literature-Derived Synthetic Data: Methodological Development Preceding Clinical Validation. Healthcare 2026, 14, 247. [Google Scholar] [CrossRef] [PubMed]
  14. Pennisi, F.; Pinto, A.; Ricciardi, G.E.; Signorelli, C.; Gianfredi, V. The Role of Artificial Intelligence and Machine Learning Models in Antimicrobial Stewardship in Public Health: A Narrative Review. Antibiotics 2025, 14, 134. [Google Scholar] [CrossRef]
  15. Pinto, A.; Pennisi, F.; Ricciardi, G.E.; Signorelli, C.; Gianfredi, V. Evaluating the Impact of Artificial Intelligence in Antimicrobial Stewardship: A Comparative Meta-Analysis with Traditional Risk Scoring Systems. Infect. Dis. Now 2025, 55, 105090. [Google Scholar] [CrossRef]
  16. Tabosa de Oliveira, T.; da Silva Neto, S.R.; Teixeira, I.V.; Aguiar de Oliveira, S.B.; de Almeida Rodrigues, M.G.; Sampaio, V.S.; Endo, P.T. A Comparative Study of Machine Learning Techniques for Multi-Class Classification of Arboviral Diseases. Front. Trop. Dis. 2022, 2, 969968. [Google Scholar] [CrossRef]
  17. Da Silva Neto, S.R.; Tabosa, T.; Medeiros Neto, L.; Teixeira, I.V.; Sadok, S.; De Souza Sampaio, V.; Endo, P.T. Binary Models for Arboviruses Classification Using Machine Learning: A Benchmarking Evaluation. In Proceedings of the 56th Hawaii International Conference on System Sciences, Maui, HI, USA, 3 January 2023. [Google Scholar]
  18. Page, M.J.; McKenzie, J.E.; Bossuyt, P.M.; Boutron, I.; Hoffmann, T.C.; Mulrow, C.D.; Shamseer, L.; Tetzlaff, J.M.; Akl, E.A.; Brennan, S.E.; et al. The PRISMA 2020 Statement: An Updated Guideline for Reporting Systematic Reviews. BMJ 2021, 372, n71. [Google Scholar] [CrossRef]
  19. Hanley, J.A.; McNeil, B.J. The Meaning and Use of the Area under a Receiver Operating Characteristic (ROC) Curve. Radiology 1982, 143, 29–36. [Google Scholar] [CrossRef]
  20. Higgins, J.P.T.; Thompson, S.G.; Deeks, J.J.; Altman, D.G. Measuring Inconsistency in Meta-Analyses. BMJ 2003, 327, 557–560. [Google Scholar] [CrossRef]
  21. Egger, M.; Davey Smith, G.; Schneider, M.; Minder, C. Bias in Meta-Analysis Detected by a Simple, Graphical Test. BMJ 1997, 315, 629–634. [Google Scholar] [CrossRef]
  22. Moons, K.G.M.; Wolff, R.F.; Riley, R.D.; Whiting, P.F.; Westwood, M.; Collins, G.S.; Reitsma, J.B.; Kleijnen, J.; Mallett, S. PROBAST: A Tool to Assess Risk of Bias and Applicability of Prediction Model Studies: Explanation and Elaboration. Ann. Intern. Med. 2019, 170, W1–W33. [Google Scholar] [CrossRef]
  23. Cracknell Daniels, B.; Buddhari, D.; Hunsawong, T.; Iamsirithaworn, S.; Farmer, A.R.; Cummings, D.A.T.; Anderson, K.B.; Dorigatti, I. Predicting the Infecting Dengue Serotype from Antibody Titre Data Using Machine Learning. PLoS Comput. Biol. 2024, 20, e1012188. [Google Scholar] [CrossRef]
  24. Falconi-Agapito, F.; Kerkhof, K.; Merino, X.; Bakokimi, D.; Torres, F.; Van Esbroeck, M.; Talledo, M.; Ariën, K.K. Peptide Biomarkers for the Diagnosis of Dengue Infection. Front. Immunol. 2022, 13, 793882. [Google Scholar] [CrossRef] [PubMed]
  25. Goh, B.; Soares Magalhães, R.J.; Ciocchetta, S.; Liu, W.; Sikulu-Lord, M.T. Identification of Visible and Near-Infrared Signature Peaks for Arboviruses and Plasmodium Falciparum. PLoS ONE 2025, 20, e0321362. [Google Scholar] [CrossRef] [PubMed]
  26. Hasanah, I.; Purwanti, E.; Widiyanti, P. Design and Implementation of an Early Screening Application for Dengue Fever Patients Using Android-Based Decision Tree C4.5 Method. Int. J. Adv. Sci. Eng. Inf. Technol. 2020, 10, 2237–2243. [Google Scholar] [CrossRef]
  27. Ho, T.-S.; Weng, T.-C.; Wang, J.-D.; Han, H.-C.; Cheng, H.-C.; Yang, C.-C.; Yu, C.-H.; Liu, Y.-J.; Hu, C.H.; Huang, C.-Y.; et al. Comparing Machine Learning with Case-Control Models to Identify Confirmed Dengue Cases. PLoS Negl. Trop. Dis. 2020, 14, e0008843. [Google Scholar] [CrossRef]
  28. Hossain, M.S.; Sultana, Z.; Nahar, L.; Andersson, K. An Intelligent System to Diagnose Chikungunya under Uncertainty. J. Wirel. Mob. Netw. Ubiquitous Comput. Dependable Appl. 2019, 10, 37–54. [Google Scholar] [CrossRef]
  29. Mahalakshmi, B.; Suseendran, G. Prediction of Zika Virus by Multilayer Perceptron Neural Network (MLPNN) Using Cloud. Int. J. Recent Technol. Eng. (IJRTE) 2019, 8, 249–254. [Google Scholar] [CrossRef]
  30. Obot, O.; John, A.; Udo, I.; Attai, K.; Johnson, E.; Udoh, S.; Nwokoro, C.; Akwaowo, C.; Dan, E.; Umoh, U.; et al. Modelling Differential Diagnosis of Febrile Diseases with Fuzzy Cognitive Map. Trop. Med. Infect. Dis. 2023, 8, 352. [Google Scholar] [CrossRef]
  31. Riya, N.J.; Chakraborty, M.; Khan, R. Artificial Intelligence-Based Early Detection of Dengue Using CBC Data. IEEE Access 2024, 12, 112355–112367. [Google Scholar] [CrossRef]
  32. Sa-Ngamuang, C.; Haddawy, P.; Luvira, V.; Piyaphanee, W.; Iamsirithaworn, S.; Lawpoolsri, S. Accuracy of Dengue Clinical Diagnosis with and without NS1 Antigen Rapid Test: Comparison between Human and Bayesian Network Model Decision. PLoS Negl. Trop. Dis. 2018, 12, e0006573. [Google Scholar] [CrossRef] [PubMed]
  33. Sippy, R.; Farrell, D.F.; Lichtenstein, D.A.; Nightingale, R.; Harris, M.A.; Toth, J.; Hantztidiamantis, P.; Usher, N.; Cueva Aponte, C.; Barzallo Aguilar, J.; et al. Severity Index for Suspected Arbovirus (SISA): Machine Learning for Accurate Prediction of Hospitalization in Subjects Suspected of Arboviral Infection. PLoS Negl. Trop. Dis. 2020, 14, e0007969. [Google Scholar] [CrossRef] [PubMed]
  34. Vu, D.M.; Krystosik, A.R.; Ndenga, B.A.; Mutuku, F.M.; Ripp, K.; Liu, E.; Bosire, C.M.; Heath, C.; Chebii, P.; Maina, P.W.; et al. Detection of Acute Dengue Virus Infection, with and without Concurrent Malaria Infection, in a Cohort of Febrile Children in Kenya, 2014–2019, by Clinicians or Machine Learning Algorithms. PLoS Glob. Public Health 2023, 3, e0001950. [Google Scholar] [CrossRef] [PubMed]
  35. Williams, R.J.; Brintz, B.J.; Santos, G.R.D.; Huang, A.; Buddhari, D.; Kaewhiran, S.; Iamsirithaworn, S.; Rothman, A.L.; Thomas, S.; Farmer, A.; et al. Integration of Population-Level Data Sources into an Individual-Level Clinical Prediction Model for Dengue Virus Test Positivity. medRxiv 2023, 10, 2023.08.08.23293840. [Google Scholar] [CrossRef]
  36. Bohm, B.C.; de Borges, F.E.M.; Silva, S.C.M.; Soares, A.T.; Ferreira, D.D.; Belo, V.S.; Lignon, J.S.; Bruhn, F.R.P. Utilization of Machine Learning for Dengue Case Screening. BMC Public Health 2024, 24, 1573. [Google Scholar] [CrossRef]
  37. Madewell, Z.J.; Rodriguez, D.M.; Thayer, M.B.; Rivera-Amill, V.; Paz-Bailey, G.; Adams, L.E.; Wong, J.M. Machine Learning for Predicting Severe Dengue in Puerto Rico. Infect. Dis. Poverty 2025, 14, 5. [Google Scholar] [CrossRef]
  38. Liu, B.; Hossain, M.F.; Hossain, S. A Comparative Evaluation of Multiple Machine Learning Approaches for Forecasting Dengue Outbreaks in Bangladesh. Sci. Rep. 2025, 15, 35931. [Google Scholar] [CrossRef]
  39. Cheong, K.H.; Li, K.; Yu, D.; Zhao, X. Forecasting Dengue Cases through Time-Series Modeling with Google Trends and Deep Neural Networks. Chaos Solitons Fractals 2025, 201, 117290. [Google Scholar] [CrossRef]
  40. El Kabbani, S.; Saleh, G. Next-Generation Diagnostic Technologies for Dengue Virus Detection: Microfluidics, Biosensing, CRISPR, and AI Approaches. Sensors 2025, 26, 145. [Google Scholar] [CrossRef]
  41. Vongsouvath, M.; Bharucha, T.; Seephonelee, M.; de Lamballerie, X.; Newton, P.N.; Dubot-Pérès, A. Harnessing Dengue Rapid Diagnostic Tests for the Combined Surveillance of Dengue, Zika, and Chikungunya Viruses in Laos. Am. J. Trop. Med. Hyg. 2020, 102, 1244–1248. [Google Scholar] [CrossRef]
  42. Lu, B.; Li, Y.; Evans, C. Assessing Generalizability of a Dengue Classifier across Multiple Datasets. PLoS ONE 2025, 20, e0323886. [Google Scholar] [CrossRef] [PubMed]
  43. Cozzolino, C.; Mao, S.; Bassan, F.; Bilato, L.; Compagno, L.; Salvò, V.; Chiusaroli, L.; Cocchio, S.; Baldo, V. Are AI-Based Surveillance Systems for Healthcare-Associated Infections Ready for Clinical Practice? A Systematic Review and Meta-Analysis. Artif. Intell. Med. 2025, 165, 103137. [Google Scholar] [CrossRef] [PubMed]
  44. Morone, G.; De Angelis, L.; Martino Cinnera, A.; Carbonetti, R.; Bisirri, A.; Ciancarelli, I.; Iosa, M.; Negrini, S.; Kiekens, C.; Negrini, F. Artificial Intelligence in Clinical Medicine: A State-of-the-Art Overview of Systematic Reviews with Methodological Recommendations for Improved Reporting. Front. Digit. Health 2025, 7, 1550731. [Google Scholar] [CrossRef] [PubMed]
  45. Ong, S.Q.; Isawasan, P.; Ngesom, A.M.M.; Shahar, H.; Lasim, A.M.; Nair, G. Predicting Dengue Transmission Rates by Comparing Different Machine Learning Models with Vector Indices and Meteorological Data. Sci. Rep. 2023, 13, 19129. [Google Scholar] [CrossRef]
  46. Chaw, J.K.; Chaw, S.H.; Quah, C.H.; Sahrani, S.; Ang, M.C.; Zhao, Y.; Ting, T.T. A Predictive Analytics Model Using Machine Learning Algorithms to Estimate the Risk of Shock Development among Dengue Patients. Healthc. Anal. 2024, 5, 100290. [Google Scholar] [CrossRef]
  47. Gianfredi, V.; Bragazzi, N.L.; Nucci, D.; Martini, M.; Rosselli, R.; Minelli, L.; Moretti, M. Harnessing Big Data for Communicable Tropical and Sub-Tropical Disorders: Implications From a Systematic Review of the Literature. Front. Public Health 2018, 6, 90. [Google Scholar] [CrossRef]
  48. Santangelo, O.E.; Provenzano, S.; Vella, C.; Firenze, A.; Stacchini, L.; Cedrone, F.; Gianfredi, V. Infodemiology and Infoveillance of the Four Most Widespread Arbovirus Diseases in Italy. Epidemiologia 2024, 5, 340–352. [Google Scholar] [CrossRef]
  49. Ming, D.K.; Hernandez, B.; Sangkaew, S.; Vuong, N.L.; Lam, P.K.; Nguyet, N.M.; Tam, D.T.H.; Trung, D.T.; Tien, N.T.H.; Tuan, N.M.; et al. Applied Machine Learning for the Risk-Stratification and Clinical Decision Support of Hospitalised Patients with Dengue in Vietnam. PLoS Digit. Health 2022, 1, e0000005. [Google Scholar] [CrossRef]
  50. McCarter, M.; Self, S.C.W.; Ewing, A.; Kanyangarara, M.; Gunter, S.M.; Nolan, M.S. The Evolution of Public Health Statistical Modeling Approaches and How to Advance Their Incorporation into Modern Arboviral Surveillance. J. Med. Entomol. 2026, 63, tjaf127. [Google Scholar] [CrossRef]
  51. Karolcik, S.; Manginas, V.; Chanh, H.Q.; Daniels, J.; Giang, N.T.; Huyen, V.N.T.; Hoang, M.T.V.; Phan Nguyen Quoc, K.; Hernandez, B.; Ming, D.K.; et al. Towards a Machine-Learning Assisted Non-Invasive Classification of Dengue Severity Using Wearable PPG Data: A Prospective Clinical Study. eBioMedicine 2024, 104, 105164. [Google Scholar] [CrossRef]
  52. Rocha, F.P.; Giesbrecht, M. Machine Learning Algorithms for Dengue Risk Assessment: A Case Study for São Luís Do Maranhão. Comput. Appl. Math. 2022, 41, 393. [Google Scholar] [CrossRef]
  53. Haque, M.E.; Nurul Absur, M.; Al Farid, F.; Uddin, J.; Abdul Karim, H. A Novel Interpretable and Real-Time Dengue Prediction Framework Using Clinical Blood Parameters with Genetic and GAN-Based Optimization. Front. Artif. Intell. 2025, 8, 1626699. [Google Scholar] [CrossRef]
Figure 1. Flow diagram outlining the selection process.
Make 08 00093 g001
Figure 2. Geographic distribution of included studies. Countries are shaded according to the number of studies conducted in each location. Symbols indicate participation in multi-country studies (circle: Peru–Belgium; diamond: Thailand–Vietnam–Sri Lanka–Bangladesh). Multi-country studies were counted once for each participating country.
Make 08 00093 g002
Figure 3. Feature domains used as predictors in the included studies. Stacked dots denote the number of studies incorporating each feature category (one dot per study).
Make 08 00093 g003
Figure 4. Risk of bias assessment across PROBAST domains. Stacked bars show the proportion of judgments (Low/Unclear/High) for each domain (Participants, Predictors, Outcome, Analysis) and the Overall rating across the included studies; numbers within segments indicate the count of studies per judgment category.
Make 08 00093 g004
Figure 5. (a) Forest plot and (b) funnel plot of the random-effects model assessing the difference in AUC between AI-based models and conventional comparators. Effect sizes are expressed as unstandardized mean differences, with AUC values reported in percentage points (%). Studies included: Falconi-Agapito, 2022 [24]; Ho, 2020 [27]; Hossain, 2019 [28]; Syppy, 2020 [33]; Williams, 2024 [35].
Make 08 00093 g005
Figure 6. (a) Forest plot and (b) funnel plot of the random effect model assessing accuracy. Effect sizes are expressed as unstandardized mean differences. Studies included: Hasanah, 2020 [26]; Ho, 2020 [27]; Mahalakshmi, 2019 [29]; Riya, 2024 [31]; Sa-Ngamuang, 2018 [32]; Syppy, 2020 [33]; Vu, 2023 [34]; Williams, 2024 [35].
Make 08 00093 g006
Figure 7. (a) Forest plot and (b) funnel plot of the random effect model assessing NPV. Effect sizes are expressed as unstandardized mean differences. Studies included: Daniels, 2024; Falconi-Agapito, 2022 [24]; Ho, 2020 [27]; Mahalakshmi, 2019 [29]; Sa-Ngamuang, 2018 [32]; Syppy, 2020 [33]; Vu, 2023 [34]; Williams, 2024 [35].
Make 08 00093 g007
Figure 8. (a) Forest plot and (b) funnel plot of the random effect model assessing PPV. Effect sizes are expressed as unstandardized mean differences. Studies included: Daniels, 2024; Falconi-Agapito, 2022 [24]; Ho, 2020 [27]; Mahalakshmi, 2019 [29]; Riya, 2024 [31]; Sa-Ngamuang, 2018 [32]; Syppy, 2020 [33]; Williams, 2024 [35].
Make 08 00093 g008
Figure 9. (a) Forest plot and (b) funnel plot of the random effect model assessing sensitivity. Effect sizes are expressed as unstandardized mean differences. Studies included: Daniels, 2024 [23]; Falconi-Agapito, 2022 [24]; Ho, 2020 [27]; Mahalakshmi, 2019 [29]; Riya, 2024 [31]; Sa-Ngamuang, 2018 [32]; Syppy, 2020 [33]; Vu, 2023 [34]; Williams, 2024 [35].
Make 08 00093 g009
Figure 10. (a) Forest plot and (b) funnel plot of the random effect model assessing specificity. Effect sizes are expressed as unstandardized mean differences. Studies included: Daniels, 2024 [23]; Ho, 2020 [27]; Mahalakshmi, 2019 [29]; Sa-Ngamuang, 2018 [32]; Syppy, 2020 [33]; Vu, 2023 [34]; Williams, 2024 [35].
Make 08 00093 g010
Table 1. Summary characteristics of the included studies.
First Author (Year)ContinentCountryStudy DesignSettingPopulationDiseaseCase Definition (Clinical Suspicion vs. Laboratory-Confirmed Cases)Disease Confirmation Method
Daniels, B.C. (2024) [23]AsiaThailand, Vietnam, Sri Lanka, BangladeshMDCommunity-based (field/surveillance in population)Children, adolescentsDengueDF suspected or identified by seroconversion/known infectionLab-confirmed (RT-PCR/ELISA)
Falconi-Agapito, F. (2022) [24]South
America,
Europe
Peru, BelgiumrDTAHospital-based/ClinicalPts (hospital/clinical cases)DengueAFI ≤ 7 d with ≥1 dengue-suggestive symptom (Peru); travelers with suspected dengue (Belgium)Lab-confirmed (RT-PCR/ELISA)
Goh, B. (2023) [25]AsiaSingaporerDTAHospital-based/ClinicalPts (hospital/clinical cases)DengueSuspected DF (AFI)Lab-confirmed (RT-PCR/ELISA)
Hasanah, I. (2020) [26]AsiaIndonesiaMDHospital-based/ClinicalPts (hospital/clinical cases)DenguePts with dengue-like symptoms in medical recordsClinical + RT-PCR/ELISA
Ho, T.S. (2020) [27]AsiaTaiwanrDTAHospital-based/ClinicalGPDengueFebrile pts with clinical suspicion of DF at EDLab-confirmed (RT-PCR/ELISA)
Hossain, M.S. (2019) [28]AsiaBangladeshMDHospital-based/ClinicalPts (hospital/clinical cases)ChikungunyaPts with fever, arthralgia, headache, myalgia, or joint swellingLab-confirmed (RT-PCR/ELISA)
Mahalakshmi, B. (2019) [29]AsiaIndiaMDSynthetic datasetSynthetic dataset ZikaSynthetic ZVD-like cases (fever, rash, myalgia, arthralgia, joint pain)NA
Obot, O. (2023) [30]AfricaNigeriarDTAHospital-based/ClinicalPts (hospital/clinical cases)DengueClinically suspected DFLab-confirmed (RT-PCR/ELISA)
Riya, N.J. (2024) [31]AsiaBangladeshrDTAMulticenterPts (hospital/clinical cases)DengueNANA
Sa-ngamuang, C. (2018) [32]AsiaThailandpDTAHospital-based/ClinicalAdults, adolescentsDengueAFI < 14 d with clinical suspicion of DFLab-confirmed (RT-PCR/ELISA)
Sippy, R. (2020) [33]South
America
EcuadorpCohCommunity-based (field/surveillance in population)GPDengue, Chikungunya, ZikaAFI with clinical suspicion of DFLab-confirmed (RT-PCR/ELISA)
Vu, D.M. (2023) [34]AfricaKenyarDTAMulticenterChildrenDenguePts aged 1–17 y with AFI (T ≥ 38 °C)Clinical + RT-PCR/ELISA
Williams, R.J. (2024) [35]AsiaThailandpDTAHospital-based/ClinicalGPDengueAFI (T ≥ 38 °C, ≤ 7 d) with clinical suspicion of DFLab-confirmed (RT-PCR/ELISA)
AFI = Acute Febrile Illness; DF = Dengue Fever; DTA = Diagnostic Test Accuracy study; ED = Emergency Department; GP = General Population; MD = Model Development study; pCoh = Prospective Cohort; pDTA = Prospective Diagnostic Test Accuracy study; rDTA = Retrospective Diagnostic Test Accuracy study; RT-PCR = Reverse Transcription Polymerase Chain Reaction; ZVD = Zika Virus Disease.
Table 2. Results of classification metrics for the AI models used in the included studies.
First Author (Year)AI ModelsSample Size (Train/Test/
Validation)
AUCSensitivitySpecificityPPVNPVAccuracyF1-Score
Daniels, B.C. (2024) [23]RF; GBM; ANN; SVM204NAScenario A: RF 0.48, GBM 0.53, ANN 0.53, SVM 0.65; Scenario B: RF 0.92, GBM 0.90, ANN 0.88, SVM 0.84; Scenario C: RF 0.64, 0.66, 0.57, 0.54Scenario A: RF 0.94, GBM 0.96, ANN 0.95, SVM 0.90; Scenario B: RF 0.71, GBM 0.71, ANN 0.72, SVM 0.80; Scenario C: RF 0.92, GBM 0.91, ANN 0.86, SVM 0.87Scenario A: RF 0.69, GBM 0.74, ANN 0.74, SVM 0.57; Scenario B: RF 0.79, GBM 0.79, ANN 0.78, SVM 0.83; Scenario C: RF 0.81, GBM 0.80, ANN 0.66, SVM 0.68Scenario A: RF 0.91, GBM 0.92, ANN 0.92, SVM 0.93; Scenario B: RF 0.90, GBM 0.87, ANN 0.79, SVM 0.83; Scenario C: RF 0.85, GBM 0.86, ANN 0.82, SVM 0.81NANA
Falconi-Agapito, F. (2022) [24]RF323Single peptide (FPG-1): 0.81RFM3 0.72; RFG1 0.89; RFG2 0.89; RFG3 0.88RF models ≥0.80RFM3 0.40; RFG3 0.44RFM3 0.95; RFG3 0.98NANA
Goh, B. (2023) [25]RF; GBM; AdaBoost; SVM; KNN; NB4225 (train: 2957; test: 1268)RF 0.88; GB 0.87; AdaBoost 0.86; NB 0.80; KNN 0.82; SVM 0.85RF 0.82; GBM 0.80; AdaBoost 0.78; NB 0.71; KNN 0.76; SVM 0.78RF 0.84; GBM 0.83; AdaBoost 0.82; NB 0.77; KNN 0.80; SVM 0.82RF 0.81; GBM 0.79; AdaBoost 0.77; NB 0.69; KNN 0.74; SVM 0.77RF 0.86; GBM 0.85; AdaBoost 0.83; NB 0.78; KNN 0.81; SVM 0.83RF 0.83; GBM 0.82; AdaBoost 0.80; NB 0.75; KNN 0.78; SVM 0.80RF 0.81; GBM 0.79; AdaBoost 0.77; NB 0.70; KNN 0.75; SVM 0.77
Hasanah, I. (2020) [26]DTTrain: 100; test: 20NANANANANA0.95NA
Ho, T.S. (2020) [27]DT; DNN4894 (train: 3425; test: 1469)DNN 0.96; DT 0.95DNN 0.93; DT 0.91DNN 0.89; DT 0.87DNN 0.90; DT 0.88DNN 0.92; DT 0.90DNN 0.91; DT 0.89DNN 0.91; DT 0.89
Hossain, M.S. (2019) [28]BRBES; FLBES; ANN; SVM250BRBES 0.92; FLBES 0.81; ANN 0.81; SVM 0.64NANANANANANA
Mahalakshmi, B. (2019) [29]MLP; NN; NBN530NAMLP 0.98; NN 0.84; NBN 0.80MLP 0.97; NN 0.85; NBN 0.73NN 0.82; NBN 0.71NN 0.86; NBN 0.81MLP 0.98; NN 0.83; NBN 0.87NA
Obot, O. (2023) [30]RF; XGB; LightGBM; ANN820 (train: 656; test: 164)RF 0.92; LightGBM 0.94; XGB 0.95; ANN 0.91RF 0.87; LightGBM 0.89; XGB 0.90; ANN 0.85RF 0.88; LightGBM 0.90; XGB 0.91; ANN 0.87RF 0.86; LightGBM 0.89; XGB 0.90; ANN 0.84RF 0.89; LightGBM 0.91; XGB 0.92; ANN 0.88RF 0.88; LightGBM 0.90; XGB 0.91; ANN 0.87RF 0.86; LightGBM 0.89; XGB 0.90; ANN 0.84
Riya, N.J. (2024) [31]SVM; NB; RF; AdaBoost; XGB; MLP; LightGBM; ANN; CNN; GRU; Bi-LSTM; TabPFN; TabTransformer320Stacking 0.99SVM 0.91; NB 0.80; RF 0.90; AdaBoost 0.87; XGB 0.93; MLP 0.83; LightGBM 0.91; Stacking 0.92; ANN 0.78; CNN 0.79; GRU 0.78; Bi-LSTM 0.84; TabPFN 0.95; TabTransformer 0.88NASVM 0.89; NB 0.79; RF 0.89; AdaBoost 0.87; XGB 0.91; MLP 0.86; LightGBM 0.92; Stacking 0.94; ANN 0.77; CNN 0.80; GRU 0.80; Bi-LSTM 0.81; TabPFN 0.94; TabTransformer 0.88NASVM 0.91; NB 0.81; RF 0.91; AdaBoost 0.89; XGB 0.93; MLP 0.83; LightGBM 0.92; Stacking 0.94; ANN 0.79; CNN 0.81; GRU 0.81; Bi-LSTM 0.81; TabPFN 0.95; TabTransformer 0.90SVM 0.90; NB 0.79; RF 0.90; AdaBoost 0.87; XGB 0.92; MLP 0.83; LightGBM 0.91; Stacking 0.93; ANN 0.77; CNN 0.79; GRU 0.79; Bi-LSTM 0.81; TabPFN 0.94; TabTransformer 0.88
Sa-ngamuang, C. (2018) [32]NB without NS1; NB with NS1397 (260 dengue; 137 non-dengue)NB without NS1 0.95; NB with NS1 0.97NB without NS1 0.89; NB with NS1 0.93NB without NS1 0.91; NB with NS1 0.95NB without NS1 0.93; NB with NS1 0.96NB without NS1 0.85; NB with NS1 0.90NB without NS1 0.90; NB with NS1 0.94NB without NS1 0.91; NB with NS1 0.94
Sippy, R. (2020) [33]GBM; ElasticNetGBM 534 (154 hospitalized, 380 outpatients); ElasticNet 98 (59 hospitalized, 39 outpatientsGBM 0.91; ElasticNet 0.94GBM 0.84; ElasticNet 0.90GBM 0.84; ElasticNet 0.92GBM 0.71; ElasticNet 0.87GBM 0.91; ElasticNet 0.93GBM 0.84; ElasticNet 0.91GBM 0.77; ElasticNet 0.88
Vu, D.M. (2023) [34]DT; RF; SVM; NB; MLP6208 (train: 4347; test: 1861)NADT 0.01; RF 0.01; SVM 0.01; NB 0.01; MLP 0.01DT 1.00; RF 1.00; SVM 1.00; NB 1.00; MLP 1.00NADT 0.92; RF 0.92; SVM 0.92; NB 0.92; MLP 0.92DT 0.92; RF 0.92; SVM 0.92; NB 0.92; MLP 0.92NA
Williams, R.J. (2024) [35]RF12,8330.870.820.790.740.850.800.78
AUC = Area Under the Receiver Operating Characteristic Curve; ANN = Artificial Neural Network; Bi-LSTM = Bidirectional Long Short-Term Memory; BRBES = Belief Rule-Based Expert System; CNN = Convolutional Neural Network; DNN = Deep Neural Network; DT = Decision Tree; FLBES = Fuzzy Logic–Based Expert System; FPG-1 = (dengue) peptide identifier “FPG-1”; GBM = Gradient Boosting Machine; GRU = Gated Recurrent Unit; KNN = k-Nearest Neighbors; LightGBM = Light Gradient Boosting Machine; MLP = Multilayer Perceptron; NA = Not Available; NBN = Naive Bayes Network; NB = Naive Bayes; NN = Neural Network; NPV = Negative Predictive Value; NS1 = Non-Structural Protein 1; PPV = Positive Predictive Value; RF = Random Forest; SVM = Support Vector Machine; TabPFN = Tabular Prior-Data Fitted Network; TabTransformer = Tabular Transformer; XGB = Extreme Gradient Boosting.
Table 3. Results of classification metrics for the comparator models used in the included studies.
First Author (Year)ComparatorComparator Sample Size (Train/Test/
Validation)
AUCSensitivitySpecificityPPVNPVAccuracyF1-Score
Daniels, B.C. (2024) [23]Statistical models (MLR)204NAScenario A: 0.65 (95% CI 0.60–0.70); Scenario B: 0.66 (0.61–0.71); Scenario C: 0.64 (0.59–0.69); Scenario D: 0.65 (0.60–0.70)Scenario A: 0.66 (95% CI 0.62–0.70); Scenario B: 0.67 (95% CI 0.63–0.71); Scenario C: 0.65 (95% CI 0.61–0.69); Scenario D: 0.66 (95% CI 0.62–0.70)Scenario A: 0.69; Scenario B: 0.71; Scenario C: 0.68; Scenario D: 0.69Scenario A: 0.66; Scenario B: 0.68; Scenario C: 0.65; Scenario D: 0.66Scenario A: 0.66 (95% CI 0.62–0.70); Scenario B: 0.68 (95% CI 0.64–0.71); Scenario C: 0.65 (95% CI 0.61–0.69); Scenario D: 0.66 (95% CI 0.62–0.70)NA
Falconi-Agapito, F. (2022) [24]Commercial serologic assays (ELISA, RDT) 41 DENV patients IgG ELISA 0.80; IgM ELISA 0.76IgG ELISA 0.83; IgM ELISA 0.46NAIgG ELISA 1.00; IgM ELISA 1.00IgG ELISA 0.01; IgM ELISA 0.01IgG ELISA 0.83; IgM ELISA 0.46NA
Goh, B. (2023) [25]Statistical models (LR)4225 (train: 2957; test: 1268)0.810.730.780.700.800.760.71
Hasanah, I. (2020) [26]Clinical assessmentTrain: 100; test: 20 NANANANANA1.00NA
Ho, T.S. (2020) [27]Statistical models (LR)14690.940.890.860.870.880.880.88
Hossain, M.S. (2019) [28]Clinical assessment2500.85NANANANANANA
Mahalakshmi, B. (2019) [29]Statistical models (LR)530NA0.680.690.640.720.65NA
Obot, O. (2023) [30]Statistical models (LR)820 (train: 656; test: 164)0.890.820.850.800.860.840.81
Riya, N.J. (2024) [31]Statistical models (LR)320NA0.91NA0.89NA0.91NA
Sa-ngamuang, C. (2018) [32]Clinical assessment397 (260 dengue; 137 non-dengue)NA0.850.800.890.740.83NA
Sippy, R. (2020) [33]Statistical models (SISA, SISAL)SISA 534 (154 hospitalized, 380 outpatients); SISAL 98 (59 hospitalized, 39 outpatients)SISA 0.89; SISAL 0.91SISA 0.81; SISAL 0.85SISA 0.83; SISAL 0.90SISA 0.66; SISAL 0.93SISA 0.91; SISAL 0.80SISA 0.82; SISAL 0.88NA
Vu, D.M. (2023) [34]Clinical assessment/Statistical models (LR)6208 (train: 4347; test: 1861)NAClinical assessment 0.14; LR 0.06Clinical assessment 0.85; LR 0.98Clinical assessment 0.08; LR NAClinical assessment 0.92; LR 0.92Clinical assessment 0.80; LR 0.91NA
Williams, R.J. (2024) [35]Statistical models (LR)12,8330.810.750.740.690.790.750.72
AUC = Area Under the Receiver Operating Characteristic Curve; CI = Confidence Interval; DENV = Dengue virus; ELISA = Enzyme-Linked Immunosorbent Assay; IgG = Immunoglobulin G; IgM = Immunoglobulin M; LR = Logistic Regression; MLR = Multinomial Logistic Regression; NA = Not Available; NPV = Negative Predictive Value; PPV = Positive Predictive Value; RDT = Rapid Diagnostic Test; SISA = Severity Index for Suspected Arbovirus; SISAL = Severity Index for Suspected Arbovirus with Laboratory data.
Disclaimer/Publisher’s Note: The statements, opinions and data contained in all publications are solely those of the individual author(s) and contributor(s) and not of MDPI and/or the editor(s). MDPI and/or the editor(s) disclaim responsibility for any injury to people or property resulting from any ideas, methods, instructions or products referred to in the content.