Article

The Field-Effect Transistor Based on a Polyyne–Polyene Structure Obtained via PVDC Dehydrochlorination

by
Oleg A. Streletskiy
1,
Ilya A. Zavidovskiy
1,2,*,
Islam F. Nuriahmetov
1,
Abdusame A. Khaidarov
1,
Alexander V. Pavlikov
1 and
Kashif F. Minnebaev
1
1
Faculty of Physics, M.V. Lomonosov Moscow State University, 119991 Moscow, Russia
2
Center for Photonics and 2D Materials, Moscow Institute of Physics and Technology, 141700 Dolgoprudny, Russia
*
Author to whom correspondence should be addressed.
J. Compos. Sci. 2023, 7(7), 264; https://doi.org/10.3390/jcs7070264
Submission received: 23 May 2023 / Revised: 14 June 2023 / Accepted: 20 June 2023 / Published: 22 June 2023
(This article belongs to the Special Issue Recent Progress and Future of Polymer Composites)

Abstract

:
We report on the formation of the field-effect transistor based on a polyyne–polyene structure. Polyvinylidene chloride (PVDC) drop casting and its subsequent dehydrochlorination in KOH solution allowed for the formation of porous polyyne–polyene material, which was analyzed via transmission electron microscopy, Fourier-transform infrared spectroscopy, and Raman spectroscopy, revealing the presence of sp- and sp2-hybridized chained fragments in the structure. The polyyne–polyene-based field-effect transistor showed a transconductance of 3.2 nA/V and a threshold voltage of −0.3 V. The obtained results indicate that polyyne–polyene-based transistors can be used as discrete elements of molecular electronics and that subsequent studies can be aimed toward the development of selective polyyne–polyene-based gas sensors with tunable sensitivity.

1. Introduction

In recent years, the research of electronic components based on polymeric materials, organic electronics, has been of immense interest in the scientific community. As organic materials may combine flexibility, piezo-response capability, transparency, biocompatibility, biodegradability, and various types of chemosensing and photo-induced response [1,2,3,4], currently, multi-purpose polymer-based materials have been widely studied all over the world as potential as electronic components. The application of polymers, due to the variety of their properties, lies in a wide range of areas, e.g., light emitters, wearable biosensors, photonic devices, etc. Yet, the most basic and, therefore, the most studied element acting as a building block for most electronic devices is a transistor.
Despite the immense amount of research works dedicated to the improvement of organic electronic components, there are still some principal difficulties in using polymer-based components. For example, most organic transistors typically have poor environmental and operational stability [5,6], and their performance is affected by sufficient contact resistance [7]. Stepping forward towards the solution of these problems, researchers develop and investigate novel materials that can be potentially applied as transistor components. Nowadays, the performance of such materials as electronic components has been thoroughly analyzed in order to diversify the types of organic electronic devices.
Among the novel organic components, materials containing sp-hybridized carbon (sp-based materials) have received noticeable attention in recent years. Carbyne material, i.e., the material composed of sp-hybridized chains, has a tunable chain-length-dependent bandgap [8], good mechanical strength, and thermal conductivity [9]. Additionally, the effects of ballistic conductivity [10], spin-polarized electronic transport [11], and strain-induced metal-insulator transition [12] were theoretically predicted for sp–carbon structures. Novel effects, tunability, and promising properties of sp-based materials make them potentially interesting for various applications in electronics and help focus the attention toward their analysis. For example, DNA sensors and sequencers based on sp-chains have been analyzed theoretically [13].
Aside from theoretical studies of the sp-based materials, experimental ones have been carried out as well, revealing their potential applications in temperature sensing, gas sensing, and fluorescent and colorimetric dual-function probing [14]. Transistors based on cumulenes, i.e., (=C=C=)n carbon chain form, were analyzed in [15,16], while optoelectronic properties of metal–polyyne structures were summarized in [17]. In our previous paper [18], we reported on the formation of the resistive gas sensors based on polyene–polyyne materials, i.e., structures with prevailing sp2-hybridization consisting of the chains with alternating polyenic (–C=C–)n and polyynic (–C≡C–)n fragments. Although the drop casting and subsequent dehydrohalogenation of the polyvinylidene fluoride (PVDF) were shown to be a facile and scalable way to form a continuous porous structure, in this current study, we have chosen to use a PVDC precursor rather than PVDF, as its carbonization is more effective due to the C–Cl bonding energy being lower than the one of C–F [19,20], which was suggested to facilitate the formation of sp–carbon, thus allowing us to synthesize the material with quite different properties compared to conventional polyenes.
In this current paper, we report on the manufacturing of the transistor and its channel, which is synthesized by the KOH-driven dehydrochlorination of the drop-cast PVDC precursor. We investigate the structure and the porosity of the obtained polyyne–polyene material and analyze the characteristics of the resulting transistor; its parameters and foam-like structure allowed us to suggest the potential application of polyyne–polyene-based transistor as a basis for selective resistive gas sensors.

2. Materials and Methods

2.1. Sample Preparation

The formation of polyyne–polyene films was carried out via the drop casting of dissolved polymer and its subsequent KOH-induced room-temperature dehydrohalogenation. This route introduced in [18] was revealed to be a prominent way to deposit sp-containing films with a desired morphology. As C–Cl bonding energy is lower than the one of C–F [19,20], PVDC dehydrohalogenation is known to be a more effective process compared with the one of PVDF. Therefore, in order to increase the fraction of sp–carbon in the material structure, we chose a PVDC precursor polymer.
The studied samples and analyzed devices were manufactured in several stages. PVDC powder (Aldrich Chemical Company, Inc., Milwaukee, WI, USA) was used as a precursor. To obtain the films, in the first stage, 5 mg of the PVDC powder was dissolved in 10 mL of the mixture of N,N-dimethylformamide (DMF, produced by LLC “Rushim.ru”, Moscow, Russia), and acetone (LCC «CHIMMED», Moscow, Russia) in the 7:3 proportion at 70 °C. Afterward, the solution was poured into a 9 cm diameter glass Petri dish (LCC “MLC-KLIN”, Klin, Russia) and dried until the evaporation of the solution, thus applying the conventional drop-casting technique to obtain a polymer material of desired morphology. As a result, thin translucent 100 nm thick PVDC films were formed.
In the second stage, a room-temperature dehydrochlorination of the PVDC films was carried out. First, the solution of potassium hydroxide (Labtech LLC, Moscow, Russia) and methanol (RCI LabScan Group, Bangkok, Thailand) was prepared. KOH crystals placed in methanol were dissolved until the formation of the supersaturated solution. Afterward, the KOH/CH3OH solution was diluted with acetone, with careful stirring, until the proportion of 1:9 was reached. Subsequently, the obtained solution was poured into the Petri dishes containing PVDC films ensuring the latter were entirely submerged.
The radicals of PVDC were removed via the dehydrohalogenation reaction (adopted from [21]) as follows:
n(–CH2–CCl2–) + 2nKOH → (–C≡C–)n + 2nH2O + 2nKCl
The reaction proceeded for 24 h at room temperature. As a result of the reaction, the film’s appearance changed from translucent to opaque black, and the film separated from the surface of the Petri dish.
Afterward, the residual products were removed from the synthesized material by cleaning it for 15 min in the ultrasonic cleaner (Wahluen electronic tools, Shantou, China) filled with distilled water. After that, the film was placed into acetone. Distilled water was purified on site via the electric medical water distiller DE-4-02 (“EMO”, Saint-Petersburg, Russia). The thickness of the obtained material was 100 nm.

2.2. Device Fabrication Process

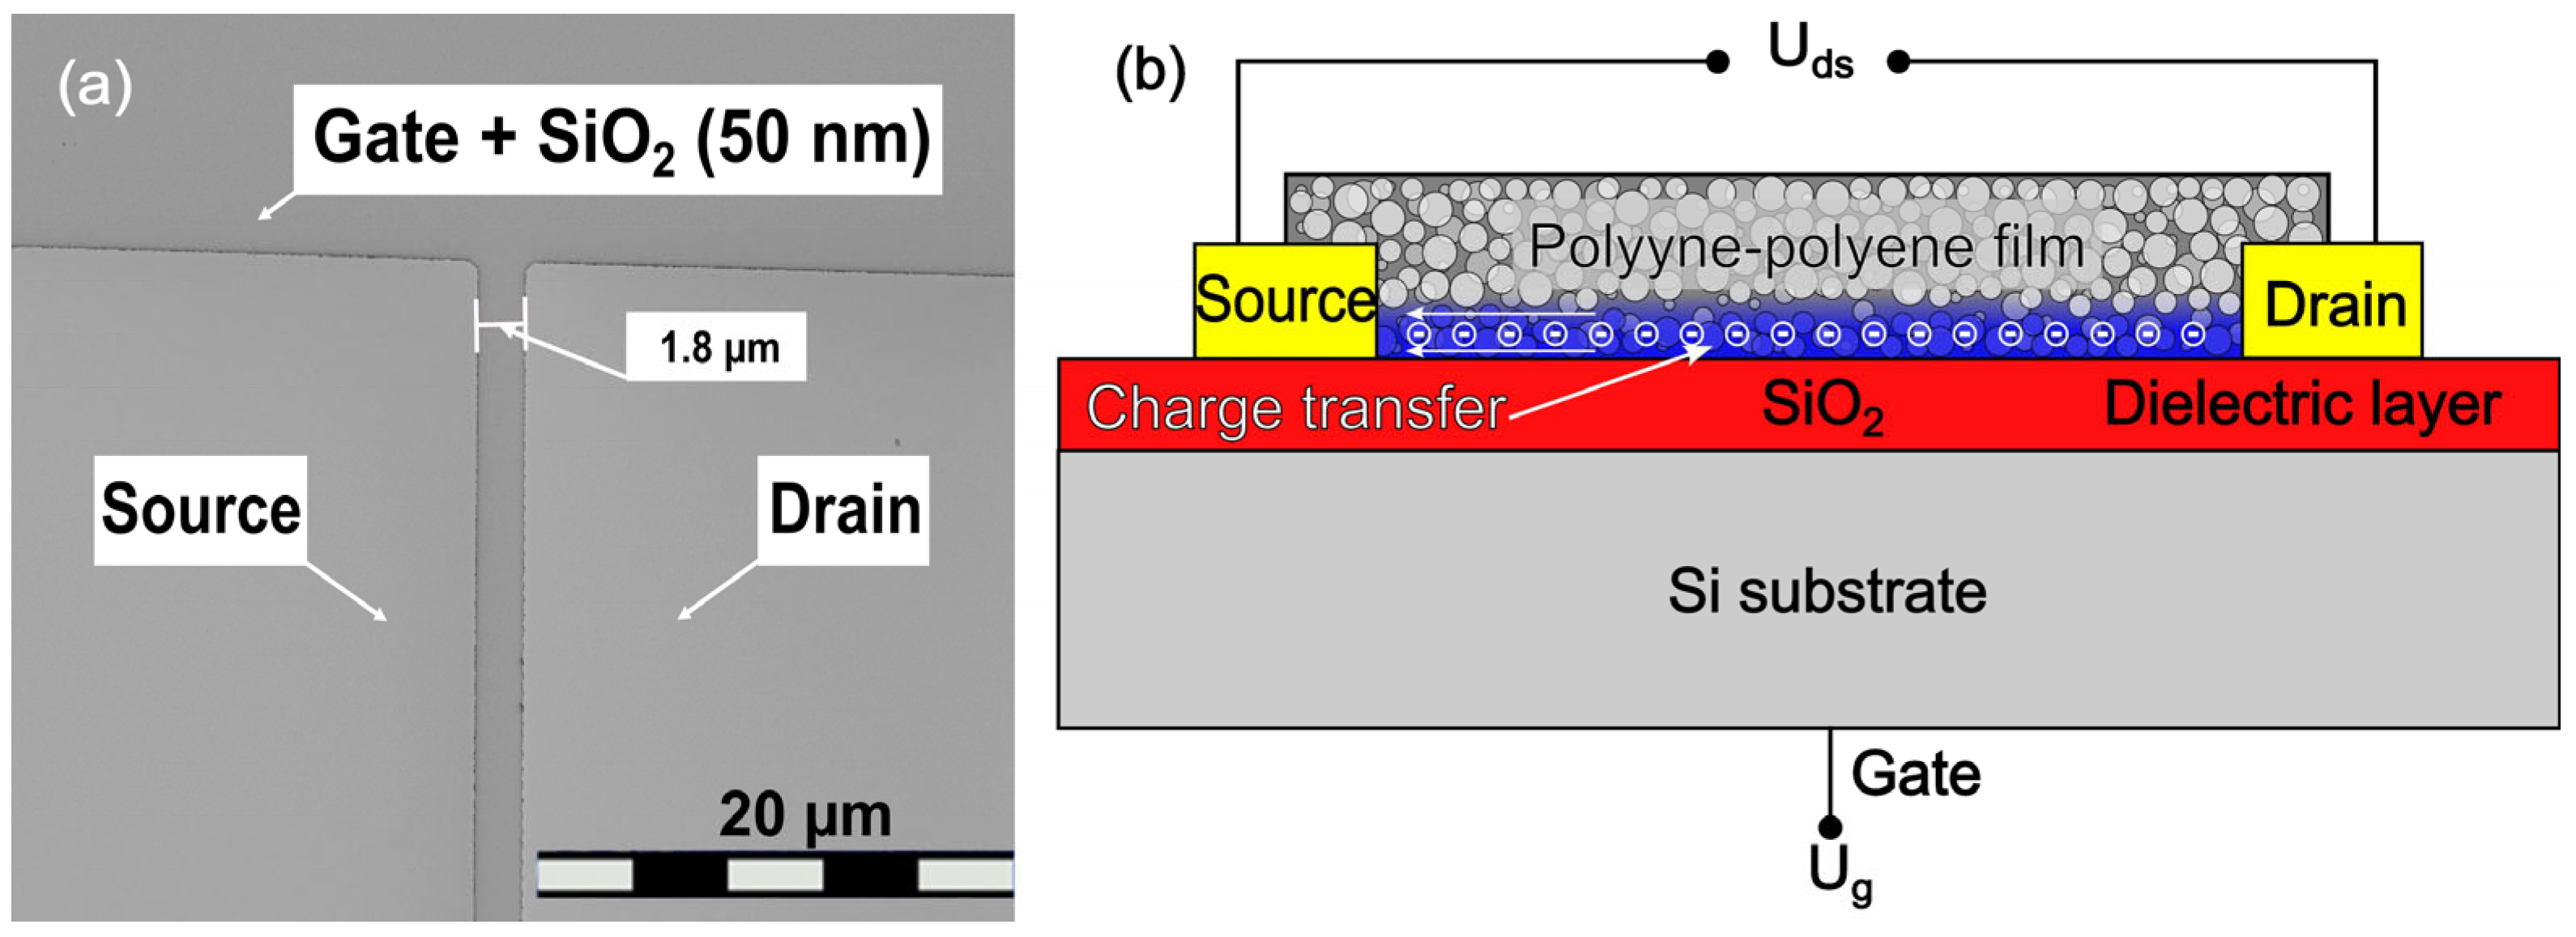
The transistor was deposited in several stages. At the first stage, a 50 nm thick layer of SiO2 was formed via the annealing of p-doped Si plates (10 mm × 5 mm) at 1000 °C in the oxygen atmosphere. The thickness of SiO2 layer was determined via scanning electron microscopy (SEM) of the cleavage of the oxidated substrates. The annealing was performed for an hour. In the second stage, aluminum tracks, subsequently used as a source and a drain, were deposited by magnetron sputtering of the sample partially covered with the special mask. The distance between the tracks was 1.8 μm. The obtained thin polyyne–polyene film of 100 nm thickness submerged in acetone was deposited on the top of the SiO2/Al structure in order to form a channel between the metal contacts. In Figure 1, the scheme of the transistor deposition process is presented. The SEM image (Figure 2a) shows the obtained structure prior to the deposition of the polyyne–polyene film. Figure 2b presents the schematic image of the obtained transistor, which is a type of bottom-gate bottom-contact transistor.

2.3. Sample Characterization

The transmission electron microscopy (TEM) studies were carried out using an LEO 912 AB electron microscope (Carl Zeiss, Jena, Germany). The operating acceleration voltage was 120 keV. The used electron microscopy grids consisted of copper frames with 40 μm cells. To transfer the structure to the grids, the samples were mechanically pressed to the polymer-coated side of the grids and removed after 5–10 s of grid–sample interaction. This method was previously reported and tested in [22]. For TEM studies, we used the set of non-irradiated films produced from the ~100 nm thick PVDC film. The conditions of its dehydrohalogenation were the same as the ones reported in Section 2.1.
Raman spectra were obtained via Sunshine GE-Raman spectrometer (Changchun New Industries Optoelectronics Tech. Co., Ltd. (CNI), Changchun, China) coupled to a Leitz Wetzlar microscope (Ernst Leitz GmbH, Germany, Wetzlar). The excitation wavelength was 532 nm, and the laser power was 1 mW. The ×50 objective lens (N.A. = 0.85) was used for the spectra acquisition. For each sample, spectra from 3 to 5 regions were analyzed by selecting the most typical spectrum of each sample for subsequent procession.
Fourier-transform infrared spectroscopy (FTIR) studies were carried out via Brucker IFS-66v/S FTIR spectrometer (Bruker Optics, Karlsruhe, Germany). The resolution of the FTIR spectrometer is 0.5 cm−1.
The electrical properties of the transistor were measured at the custom measuring stand equipped with three gold-coated probes. The set-up was based on the F-136 (“Vibrator” factory, Saint-Petersburg, Russia) nanoampermeter and 16-digit ADC/DAC board NI PCI 6229 (National Instruments, Austin, TX, USA). The set-up was controlled via the program for personal computers designed via LabView software (https://www.ni.com/ru-ru/shop/labview.html, accessed on 10 June 2023; National Instruments, Austin, TX, USA).

3. Results

3.1. TEM

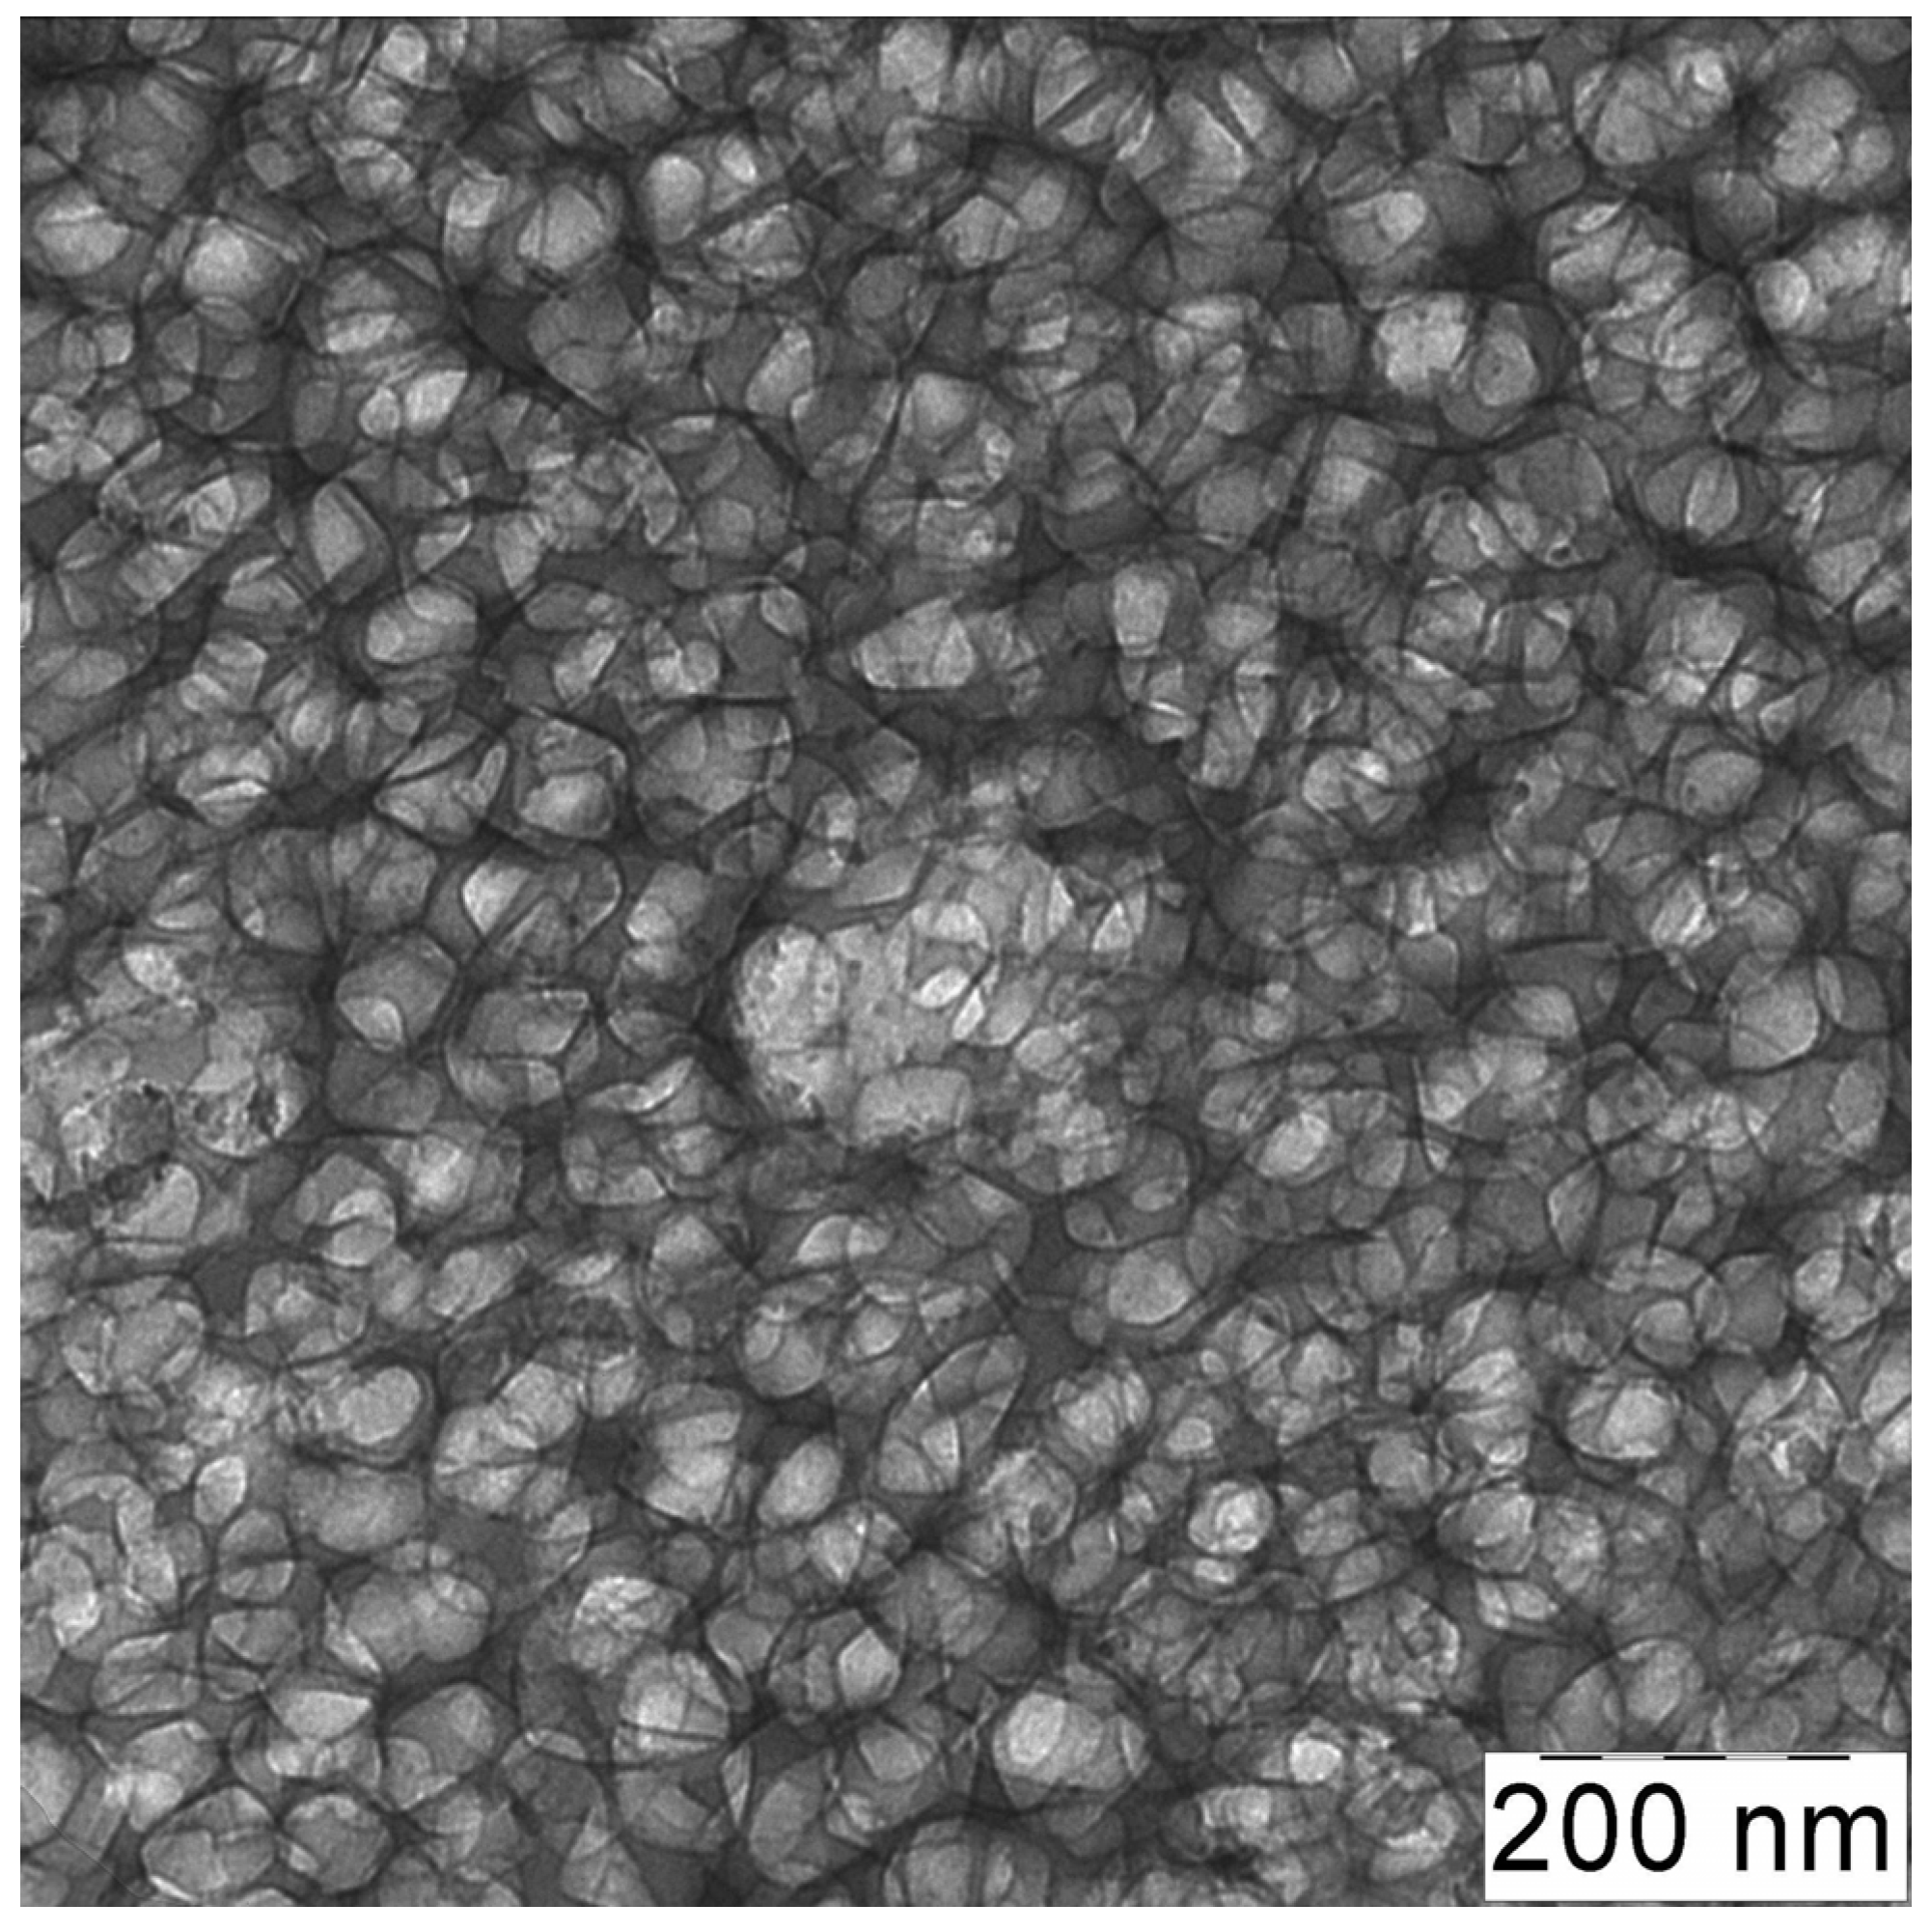
Figure 3 shows the TEM image of the polyyne–polyyne-based film. The TEM analysis reveals that it features a foam-like structure with the ~60 nm sized pores separated from each other by the material fragments of the ~5–15 nm width and ~1 nm thickness. Such a structure may form as a result of the efficient dehydrochlorination, resulting in the potassium chloride formation and the removal of the material from the structure, leading to mass loss and shrinkage of the film. As a result, a monodisperse disordered foam-like structure formed.
The KOH-induced formation of the 1–100 nm sized pores during the dehydrohalogenation of various polymers is not uncommon [23,24]. However, the demonstration of the pore formation taking place after the alkali treatment of the continuous film is especially promising for the manufacturing of functional coatings with prominent gas adsorption capabilities.
In [25], it was reported that the PVDF-derived carbons obtained via high-temperature annealing have smaller pore diameters compared to the PVDC-derived carbons, as the release of smaller fluorine atoms takes place more efficiently than one of the larger chloride atoms. In the studied case of the prolonged treatment, that effect does not seem to play a significant role, as the pores size of the dehydrochlorinated PVDC is close to the one reported for dehydrofluorinated PVDF [18]. However, the disruption of the continuous structure resulting in the pore formation seems to be more prominent during PVDF treatment, which is unsurprising due to the easier breakdown of C–F bonds.

3.2. FTIR Spectroscopy

The FTIR spectrum of the PVDC precursor powder is shown in Figure 4a. Nearly all of the observed line positions and relative intensities are typical for amorphous PVDC [26]. The lines located at 290, 360, 450, 600, and 670 cm−1 are typical for the C–Cl2 vibrations. The bands positioned at 750, 890, and 1350 cm−1 are related to C–H2 vibrations. The line at 530 cm−1 is assigned to the skeletal vibrations of the polyvinylidene chloride backbone, while the prominent band centered at 1060 cm−1 is ascribed to the PVDC helix mode. The line at 750 cm−1 is also typical for PVDC, and, although it is sometimes attributed to C–Cl stretching [27], the authors of [26] have concluded it to be most probably ascribed to the C–H2 rocking mode. The line at 880 cm−1 is also assigned to C–H2 rocking observed in the PVDC. The lines located at 2850, 2920, and 2990 cm−1 are related to C–H stretching, and the positions of such lines vary significantly with the chemical state of bonded carbon atoms.
One prominent difference between the obtained FTIR spectrum of the studied PVDC precursor and the spectrum of amorphous PVDC (Figure 4 in [26]) can be observed. The intensity of the 1060 cm−1 band associated with the helical mode is relatively large. This effect may be caused by a relatively large length of the helix conformations in polymer chains [28].
The FTIR spectrum of the transistor channel material obtained via PVDC dehydrochlorination is shown in Figure 4b. The set of lines at 460, 530, 600, 660, 750, and 880 cm−1 was also observed in the untreated PVDC precursor, indicating that fragments of non-dehydrohalogenated polymer remain in the sample after chemical treatment, which may be caused by an incomplete dehydrohalogenation of the deep layers of the structure, featuring the suppressed interaction with KOH. For the chemically treated material, the line at 660 cm−1 may also be attributed to the C–O–H twisting mode [29] and the vibrations of cis-polyacetylenic fragments [30].
The series of wide lines located in the 900–1600 cm−1 range is typical for disordered carbon components, showing a notably less straightforward assignment compared to one of the PVDC-related bands. The lines observed at 1060 and 1210 cm−1 can be attributed to C–C, C–O, and C–O–C bonds [18,31,32]. The line observed at 1350 cm−1 is ascribed to C–O [31] and C–H [33] bonding. The band at 1420 cm−1 can be attributed to the vibrations of C–H3 [34], C–H2 [35], and C–O bonds [36]. The line centered at 1620 cm−1 is ascribed to C=C vibrations, featuring the position more typical for the olefinic groups rather than for aromatic rings [31], confirming that the sp2-hybridized component of the structure is present in the form of polyenic fragments rather than graphitic clusters or phenylic side groups and capping groups. The intensive C=O stretching vibration band is observed at 1710 cm−1 [31]. Despite not being observed for carbonized PVDF, this line is typical for PVDC dehydrohalogenated in alcoholic KOH solution [31], thus implicitly confirming that PVDC dehydrohalogenation and subsequent saturation of the dangling bonds by oxygen is more prominent than a similar process taking place in PVDF.
The line at 2160–2170 cm−1 is attributed to the stretching vibrations of C≡C bonds [37,38,39]. Its emergence in the FTIR is related to the violation of the exclusion principle between Raman and FTIR spectra, which is typical for long-bended chains [40], while the observed peak position indicates that sp-hybridized fragments comprise a single C≡C bond [41]. As suggested in [18], it indicates that obtained long chains consist of alternating polyenic and polyynic fragments. In such structures, the emergence of the lines related to C–C and C=C bonds in the FTIR spectra is possible due to the chain distortions and the presence of polar cappings and side groups. These features lead to the variation of the dipole moment of the structure, thus invoking its infrared response.
The chain-like structure of the material’s structural units is confirmed by the lines related to C–H stretching positioned at 2930 and 2970 cm−1, which are typical locations for aliphatic hydrocarbon fragments [42,43]. Similar to the C=C vibrations line observed at 1620 cm−1, the location of the C–H band proves the predomination of non-aromatic sp2-hybridized fragments, such as chains, in the sample. In its turn, the wide line at 3050–3710 cm−1 peaking at 3380 cm−1 is assigned to the O-H vibration of adsorbed water [44].

3.3. Raman Spectroscopy

The Raman spectrum of the precursor PVDC powder is shown in Figure 5. It demonstrates the lines typical for PVDC [26]. The lines at 240, 300, 350, 450, 600, and 650 cm−1 are attributed to C–Cl2, while the lines at 870 and 1410 cm−1 are assigned to C–H2. The line at 1070 cm−1 is ascribed to the helix mode, and the lines at 2870, 2940, and 2980 cm−1 are typical for C–H stretching.
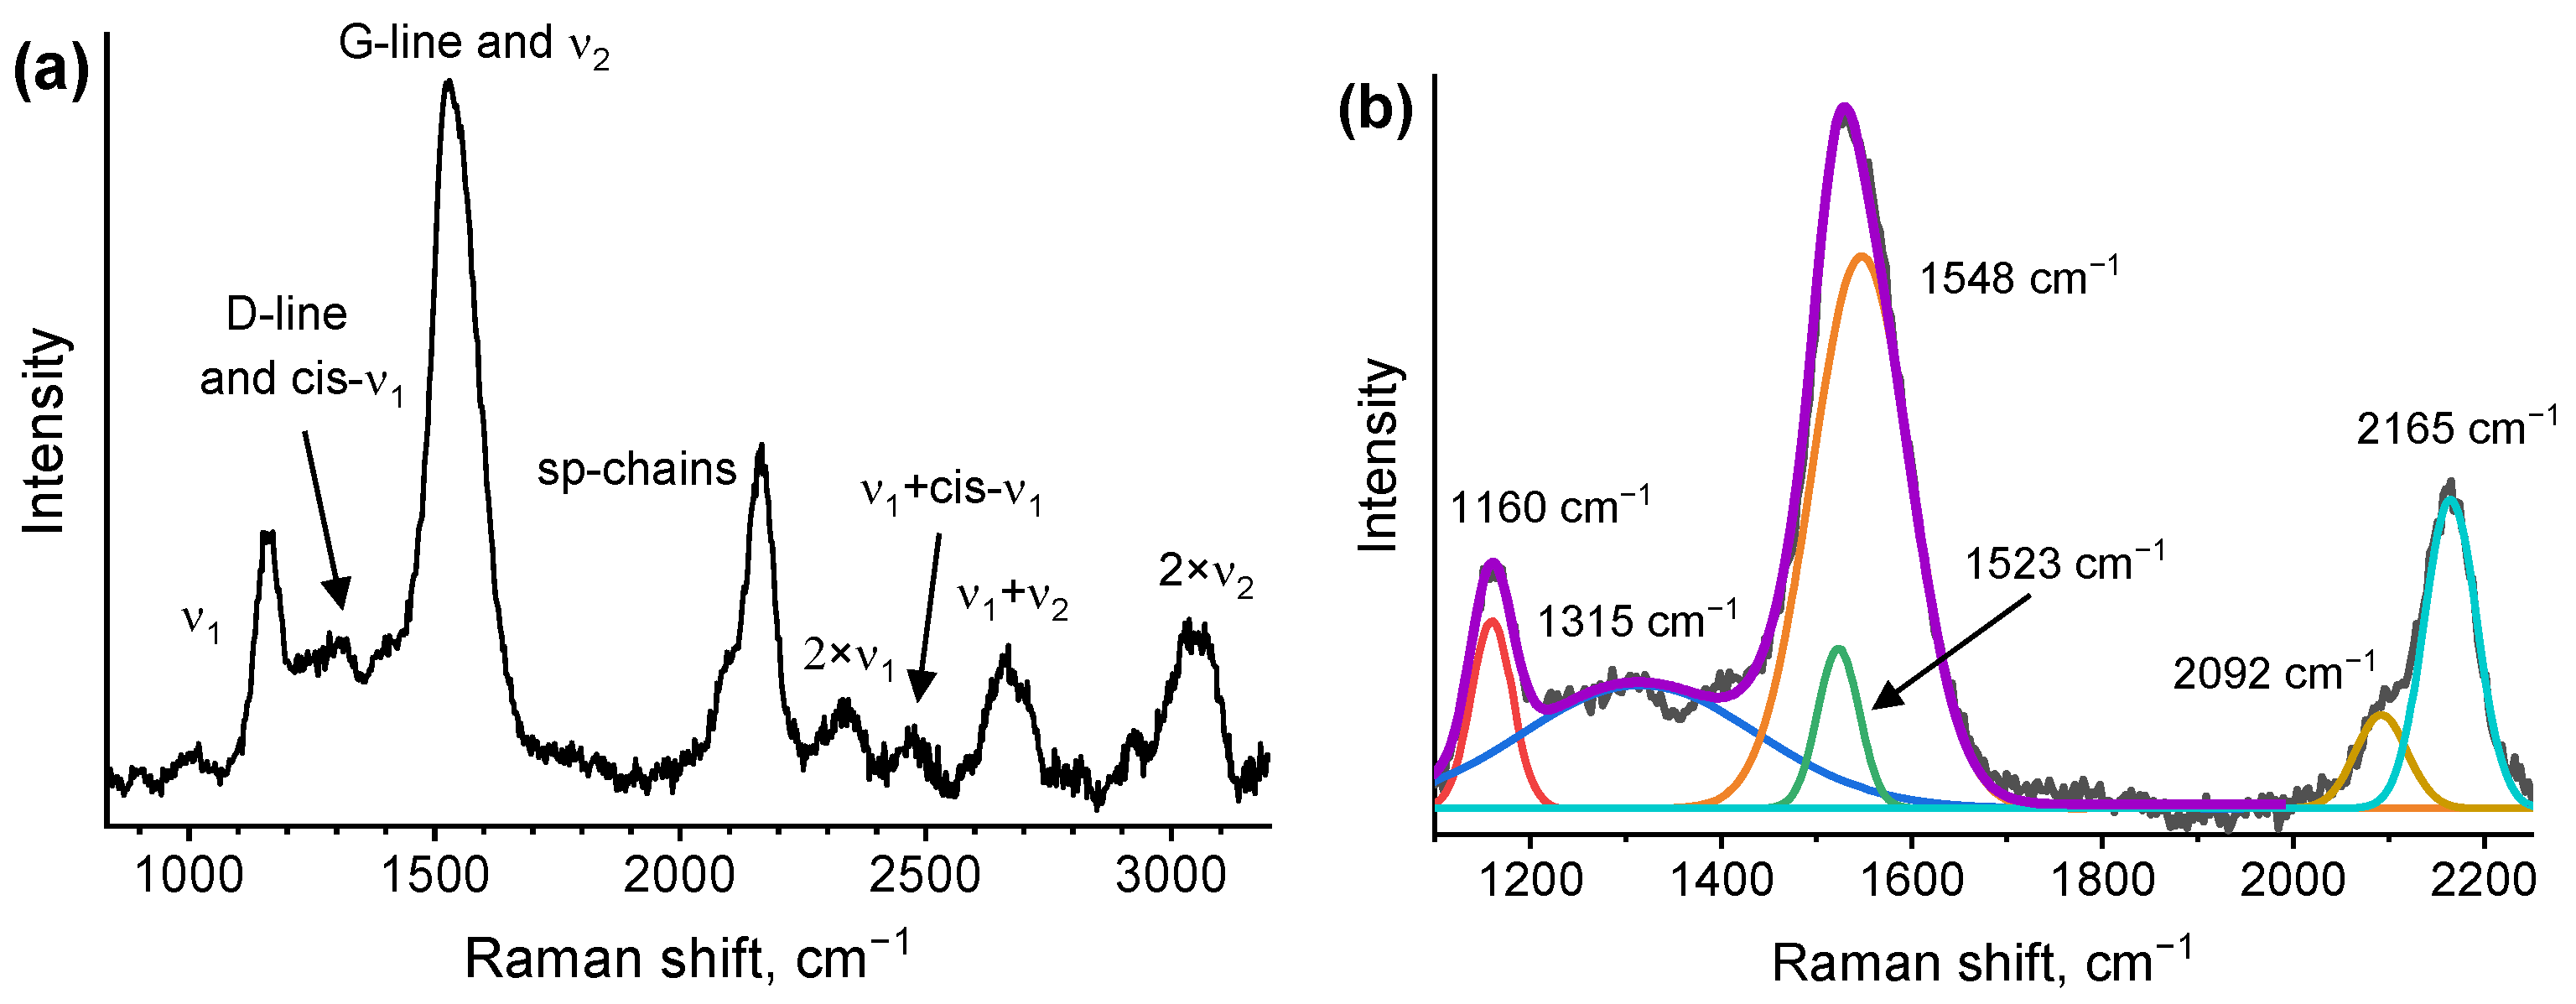
The typical Raman spectra of the polyyne–polyene sample are shown in Figure 6a. Unlike the FTIR spectroscopy, the Raman analysis shows no resemblance between the spectra of the precursor and the resulting material. As the Raman spectroscopy has finite analysis depth [45], a prominent variation between the spectra of precursor and the resulting material may indicate the subsurface layers of the polyyne–polyene being dehydrohalogenated better than deeper layers, thus confirming the studies of PVDF dehydrofluorination using similar techniquea [18].
The narrow peak at ~1160 cm−1 is attributed to the C–C bonds of trans-isomeric polyenic structures [46] and will be subsequently referred to as ν1. The most intensive narrow peak at 1540 cm−1 is typical for C=C vibrations and can be observed both in polyenes [47] (will be referred to as ν2) and in disordered carbon [48] (G-line). Its asymmetric shape shows the contribution of both of these lines to the spectra in the 1520–1560 cm−1 range. The plateau between ν1 and ν2 is centered at ~1315 cm−1, which is somewhat lower than expected for an amorphous-carbon-related D-line located in the 1320–1360 cm−1 range [48]. We suggest that the relatively low wavelength and significant width of this “line” are attributed to the contribution of cis-isomeric C–C fragments (indicated as cis-ν1), which is similar to the Raman spectra of polyene–polyynes reported in [18].
The line at 2160 cm−1 is attributed to the vibration of sp-hybridized chains [37,38,39], while the lines at higher wavelengths of 2330, 2470, 2670, and 3070 cm−1 are related to the overtones of the discussed fundamental lines, corresponding to the second order of ν1 (denoted as 2×ν1), a weak overtone of ν1 and cis-ν1 (indicated as ν1+cis-ν1), an overtone of ν1 and ν212), the second order of ν2 (2×ν2), respectively. The location of ν1 at 1160 cm−1 and ν1+cis-ν1 positioning at 2470 cm−1 indicates that the contribution of cis-ν1 is centered at approximately 1310 cm−1, which is somewhat distant from the position of 1250 cm−1 observed for cis-polyacetylene [49], though, the position can be shifted to higher wavelengths for short and defected chain fragments. The cis-ν1 line centered at 1310 cm−1 confirms that it is the cis-ν1 peak that contributes to the plateau centered at 1315 cm−1 and shifts its position to the wavenumber atypical for the D-line.
In Figure 6b, the fitting of the Raman spectra in the range of fundamental lines is presented. The cumulative line that comprise the G-peak and v2 is fitted by two lines peaked at 1523 cm−1 and 1548 cm−1. However, as these lines are not resolved, we cannot directly attribute them to G-peak or v2. Moreover, the G-line position within the 1520–1600 cm−1 range depends on the sp2/sp3 ratio and graphite clustering [50], and v2 shifts with the variation of the chain length within the 1490–1660 cm−1 range [51]. Therefore, their resolution is hindered for the studied spectra. Thus, the presence of the two lines in the spectra fitting depicted in Figure 6b shows that the 1400–1700 cm−1 range- spectra in are poorly fitted by a single C=C–related line, providing little insight into the clustering of sp2–carbon in the substructure of the studied material. As shown in Section 3.2, the C=C and C–H line positions in the FTIR spectrum indicate that the samples have predominantly chained structure, allowing us to suggest that a graphitized-carbon-related G-line provides only a significant contribution to the observed lines. Chain-like structure of the material and the presence of both polyyne (–C≡C–)m and polyene fragments (–CH=CCl–)n, allows us to confirm the polyyne–polyene structure of the dehydrohalogenated samples.
Interestingly, the sp–carbon-related line at 2160 cm−1 can also be fitted by two components centered at 2092 and 2165 cm−1 (Figure 6b). The two lines were observed in the Raman spectra of sp-based carbon in [38,52], while multiple bands located in a similar range were observed in [53]. As shown in [38], the multi-peak fitting of the C≡C line may reflect the presence of polyynic and cumulenic carbyne forms, chain capping by various end groups as well as the formation of kinks and the distortion in the chain structure of other types.

3.4. The Properties of the Field-Effect Transistor with a Polyyne–Polyene Gate

During the studies of the transport properties of the transistor, the source-drain voltage varied from 0 to 5 V, with the gate voltage ranging from 0 to 15 V. The investigations were carried out in ambient conditions at room temperature with no external lighting. Figure 6 shows the input characteristics of the transistor, demonstrating that the application of the positive bias to the gate electrode allows effective adjustment of the source-drain voltammetries. The output characteristics reveal the behavior typical for the n-type channel. The n-type conductivity of the investigated structure confirms previously reported data on the resistive sensing response of the polyyne–polyene structure to various electron-doping vapors [18].
Figure 7a shows source-to-drain current Ids as a function of the drain-source voltage at various gate voltages Ug. In Figure 6b, the transfer characteristic of the transistor is plotted in the Ids0.5 and Ug coordinates. These characteristics are measured at the constant source-drain voltage of 4 V. The extrapolation of the transfer characteristics to the Ids = 0 A value allows us to estimate the value of the threshold voltage (Ut) of the current initiation as Ut = 0.8 V. The source-drain current modulation via the variation of the gate bias is shown in Figure 7b. The device exhibits good saturation characteristics at 18 V operation voltage. The quantitative characteristic of such modulation, Ion/Ioff ratio (the ratio of the drain current Ion in the “ON” state (Ug = 18 V) to the current Ioff in the “OFF” state (Ug = 0 V) at Uds = 4 V), was estimated to be 104 for the studied structure. This is a decent result, as various types of the organic transistors show Ion/Ioff value varying in the 103–105 range [54,55,56,57]. The gate leakage current was 12 pA.
Our estimation of the field effect mobility μf of the charge carriers was based on the equation describing the Ids dependence on Ug as follows [55,56,58]:
I ds = μ f ( W 2 L C d ) ( U g U t ) 2
where specific capacity Cd is evaluated as an electrical capacitance of a planar layer Cd = ε0εd/hd0 is a vacuum permittivity, εd is a relative dielectric constant of SiO2, and hd is a layer thickness).
In Equation (2), W and L are the width and length of the transistor channel, Cd is the capacitance of the dielectric layer, and the Ut is a threshold voltage.
For the studied transistor, the geometrical parameters are W = 1.8 μm and L = 1 mm, and Cd was estimated for a 50 nm thick dielectric layer with ε0 = 3.9. Its value was evaluated to be 69 nF/cm2.
The charge carrier mobility μf was assessed to be 3.07 × 10⁻⁴ cm2/(V×s). This value is relatively small in comparison to the one reported for organic transistors [1,59,60]. For the polythiophene derivatives with side chains, the mobility of 10−5−10−3 cm2/(V×s) was reported, and it was suggested that the solution processing and field-effect device operation in a dry box environment would beneficially affect the mobility [61]. For the studied structures, a low μf value does not play a significant role when transistors are used as active elements of gas sensors, as their response times are limited by the gas adsorption and desorption dynamics and are typically in the order of minutes.
Notably, polyenic systems, such as carotenoids [62], demonstrate p-type of the conductivity and low mobility of the carriers (10−6–10−8 cm2/(V×s)). For the studied channel material, polyyne–polyene, n-type conductivity, and higher mobility are observed, which may be related to the presence of polyynic fragments in the structure [18].

4. Conclusions

In this current paper, we have investigated the field-effect bottom-gate bottom-contact transistor and its channel, which is based on a polyyne–polyene structure. The polyyne–polyene component was prepared via PVDC drop casting and its subsequent dehydrochlorination in a KOH-based solution. KOH-induced dehydrochlorination allowed us to create the foam-like disordered material based on (–CH=CCl–)n and (–C≡C–)m chain fragments (i.e., polyyne–polyene material) containing various side groups and capping groups. The pores of ~60 nm diameter formed by the material release induced by dehydrohalogenation were observed.
The possibility of the formation of the transistor with a polyyne–polyene channel was demonstrated. The studied transistor consisted of the Si substrate with a SiO2 layer and aluminum contacts deposited on top of it. On top of the contacts, a 100 nm thick polyyne–polyyne film was formed in order to act as a transistor channel. The study of the transistor’s properties showed that the transistor has n-type conductivity and the threshold voltage Ut = 0.8 V. The Ion/Ioff~104 is a promising result demonstrating that current modulation in the investigated structure is entirely possible. However, the μf = 3.07 × 10⁻⁴ cm2/(V×s) is a relatively low value of charge carrier mobility. The obtained characteristics, especially the combination of the porosity and significant Ion/Ioff amplification parameter, show that the investigated structure can potentially be applied as a transistor-based resistive gas sensor.

Author Contributions

Conceptualization, O.A.S.; Data curation, I.F.N. and A.V.P.; Formal analysis, O.A.S., I.A.Z. and I.F.N.; Funding acquisition, I.A.Z.; Investigation, I.F.N., A.A.K., A.V.P. and K.F.M.; Methodology, O.A.S.; Project administration, O.A.S.; Resources, O.A.S.; Software, I.A.Z.; Supervision, O.A.S. and K.F.M.; Validation, I.A.Z.; Visualization, I.A.Z. and I.F.N.; Writing—original draft, O.A.S. and I.A.Z.; Writing—review and editing, A.V.P. All authors have read and agreed to the published version of the manuscript.

Funding

I.A. Zavidovskiy acknowledges the support of the Basis Foundation fellowship program (grant 20-2-2-7-1). The formation of the dielectric layers and the implementation of the lithography method were partially supported by the Russian Science Foundation (grant № 23-72-00037). This work was supported by the Ministry of Science and Higher Education of the Russian Federation (Agreement No. 075-15-2022-1150).

Data Availability Statement

Not applicable.

Acknowledgments

The authors are grateful to I.P. Ivanenko for his help with the formation of the transistor layout by lithography process.

Conflicts of Interest

The authors declare no conflict of interest.

References

  1. Liu, K.; Ouyang, B.; Guo, X.; Guo, Y.; Liu, Y. Advances in Flexible Organic Field-Effect Transistors and Their Applications for Flexible Electronics. Npj. Flex. Electron. 2022, 6, 1–19. [Google Scholar] [CrossRef]
  2. Efremenko, Y.; Mirsky, V.M. Poly-3-Thienylboronic Acid: A Chemosensitive Derivative of Polythiophene. J. Solid. State Electrochem. 2020, 24, 3105–3111. [Google Scholar] [CrossRef]
  3. Aliqué, M.; Simão, C.D.; Murillo, G.; Moya, A. Fully-Printed Piezoelectric Devices for Flexible Electronics Applications. Adv. Mater. Technol. 2021, 6, 2001020. [Google Scholar] [CrossRef]
  4. Bolognesi, M.; Prosa, M.; Seri, M. 9-Biocompatible and Biodegradable Organic Electronic Materials. In Sustainable Strategies in Organic Electronics; Marrocchi, A., Ed.; Woodhead Publishing Series in Electronic and Optical Materials; Woodhead Publishing: Delhi, India, 2022; pp. 297–338. ISBN 978-0-12-823147-0. [Google Scholar]
  5. Xu, Y.; Liu, W.; Huang, Y.; Jin, C.; Zhou, B.; Sun, J.; Yang, J. Recent Advances in Flexible Organic Synaptic Transistors. Adv. Electron. Mater. 2021, 7, 2100336. [Google Scholar] [CrossRef]
  6. Iqbal, H.F.; Ai, Q.; Thorley, K.J.; Chen, H.; McCulloch, I.; Risko, C.; Anthony, J.E.; Jurchescu, O.D. Suppressing Bias Stress Degradation in High Performance Solution Processed Organic Transistors Operating in Air. Nat. Commun. 2021, 12, 2352. [Google Scholar] [CrossRef]
  7. Han, H.; Kim, C. Unexpected Benefits of Contact Resistance in 3D Organic Complementary Inverters. Adv. Electron. Mater. 2020, 6, 1900879. [Google Scholar] [CrossRef]
  8. Pan, B.; Xiao, J.; Li, J.; Liu, P.; Wang, C.; Yang, G. Carbyne with Finite Length: The One-Dimensional Sp Carbon. Sci. Adv. 2015, 1, e1500857. [Google Scholar] [CrossRef] [Green Version]
  9. Eaton, A.L.; Fielder, M.; Nair, A.K. Mechanical and Thermal Properties of Carbon-Based Low-Dimensional Materials. MRS Bull. 2022, 47, 1001–1010. [Google Scholar] [CrossRef]
  10. Wang, M.; Lin, S. Ballistic Thermal Transport in Carbyne and Cumulene with Micron-Scale Spectral Acoustic Phonon Mean Free Path. Sci. Rep. 2015, 5, 18122. [Google Scholar] [CrossRef] [Green Version]
  11. Zanolli, Z.; Onida, G.; Charlier, J.-C. Quantum Spin Transport in Carbon Chains. ACS Nano 2010, 4, 5174–5180. [Google Scholar] [CrossRef]
  12. La Torre, A.; Botello-Mendez, A.; Baaziz, W.; Charlier, J.-C.; Banhart, F. Strain-Induced Metal–Semiconductor Transition Observed in Atomic Carbon Chains. Nat. Commun. 2015, 6, 6636. [Google Scholar] [CrossRef] [PubMed] [Green Version]
  13. Mota, E.A.V.; da Silva Paula, M.V.; da Silva, C.A.B., Jr.; Del Nero, J. Tuning Transport Properties in Carbyne-DNA Fragments-Carbyne Devices. Mater. Lett. 2023, 336, 133925. [Google Scholar] [CrossRef]
  14. Yang, G. Synthesis, Properties, and Applications of Carbyne Nanocrystals. Mater. Sci. Eng. R Rep. 2022, 151, 100692. [Google Scholar] [CrossRef]
  15. Scaccabarozzi, A.D.; Milani, A.; Peggiani, S.; Pecorario, S.; Sun, B.; Tykwinski, R.R.; Caironi, M.; Casari, C.S. A Field-Effect Transistor Based on Cumulenic Sp-Carbon Atomic Wires. J. Phys. Chem. Lett. 2020, 11, 1970–1974. [Google Scholar] [CrossRef] [PubMed] [Green Version]
  16. Pecorario, S.; Scaccabarozzi, A.D.; Fazzi, D.; Gutiérrez-Fernández, E.; Vurro, V.; Maserati, L.; Jiang, M.; Losi, T.; Sun, B.; Tykwinski, R.R.; et al. Stable and Solution-Processable Cumulenic Sp-Carbon Wires: A New Paradigm for Organic Electronics. Adv. Mater. 2022, 34, 2110468. [Google Scholar] [CrossRef] [PubMed]
  17. Wong, W.-Y. Recent Advances in Luminescent Transition Metal Polyyne Polymers. J. Inorg. Organomet. Polym. Mater. 2005, 15, 197–219. [Google Scholar] [CrossRef]
  18. Zavidovskiy, I.A.; Streletskiy, O.A.; Nuriahmetov, I.F.; Nishchak, O.Y.; Savchenko, N.F.; Tatarintsev, A.A.; Pavlikov, A.V. Highly Selective Polyene-Polyyne Resistive Gas Sensors: Response Tuning by Low-Energy Ion Irradiation. J. Compos. Sci. 2023, 7, 156. [Google Scholar] [CrossRef]
  19. Hukka, T.I.; Pakkanen, T.A.; D’Evelyn, M.P. Chemisorption of Fluorine, Chlorine, HF, and HCl on the Diamond (100)2x1 Surface: An Ab Initio Study. J. Phys. Chem. 1995, 99, 4710–4719. [Google Scholar] [CrossRef]
  20. Xu, B.; Hou, S.; Chu, M.; Cao, G.; Yang, Y. An Activation-Free Method for Preparing Microporous Carbon by the Pyrolysis of Poly(Vinylidene Fluoride). Carbon 2010, 48, 2812–2814. [Google Scholar] [CrossRef]
  21. Evsyukov, S.E. Chemical Dehydrohalogenation of Polymers. In Carbyne and Carbynoid Structures; Heimann, R.B., Evsyukov, S.E., Kavan, L., Eds.; Physics and Chemistry of Materials with Low-Dimensional Structures; Springer: Dordrecht, The Netherlands, 1999; Volume 21, pp. 55–74. ISBN 978-94-010-5993-0. [Google Scholar]
  22. Streletskiy, O.; Zavidovskiy, I.; Yakubovsky, D.; Doroshina, N.; Syuy, A.; Lebedinskij, Y.; Markeev, A.; Arsenin, A.; Volkov, V.; Novikov, S. Tailoring of the Distribution of SERS-Active Silver Nanoparticles by Post-Deposition Low-Energy Ion Beam Irradiation. Materials 2022, 15, 7721. [Google Scholar] [CrossRef]
  23. Chang, Y.; Pang, Y.; Dang, Q.; Kumar, A.; Zhang, G.; Chang, Z.; Sun, X. Converting Polyvinyl Chloride Plastic Wastes to Carbonaceous Materials via Room-Temperature Dehalogenation for High-Performance Supercapacitor. ACS Appl. Energy Mater. 2018, 1, 10. [Google Scholar] [CrossRef]
  24. Chang, Y.; Zhang, G.; Han, B.; Li, H.; Hu, C.; Pang, Y.; Chang, Z.; Sun, X. Polymer Dehalogenation-Enabled Fast Fabrication of N,S-Codoped Carbon Materials for Superior Supercapacitor and Deionization Applications. Available online: https://pubs.acs.org/doi/pdf/10.1021/acsami.7b08181 (accessed on 7 February 2023).
  25. Kim, J.-I.; Park, S.-J. A Study of Ion Charge Transfer on Electrochemical Behaviors of Poly(Vinylidene Fluoride)-Derived Carbon Electrodes. J. Anal. Appl. Pyrolysis 2012, 98, 22–28. [Google Scholar] [CrossRef]
  26. Coleman, M.M.; Wu, M.S.; Harrison, I.R.; Painter, P.C. Vibrational Spectra and Conformation of Poly(Vinylidene Chloride). J. Macromol. Sci. 1978, 15, 463–480. [Google Scholar] [CrossRef]
  27. Yoshioka, T.; Kameda, T.; Imai, S.; Noritsune, M.; Okuwaki, A. Dechlorination of Poly(Vinylidene Chloride) in NaOH/Ethylene Glycol as a Function of NaOH Concentration, Temperature, and Solvent. Polym. Degrad. Stab. 2008, 93, 1979–1984. [Google Scholar] [CrossRef]
  28. Phan, S.; Padilla-Gamiño, J.L.; Luscombe, C.K. The Effect of Weathering Environments on Microplastic Chemical Identification with Raman and IR Spectroscopy: Part I. Polyethylene and Polypropylene. Polym. Test. 2022, 116, 107752. [Google Scholar] [CrossRef]
  29. Konikkara, N.; Kennedy, L.J.; Vijaya, J.J. Preparation and Characterization of Hierarchical Porous Carbons Derived from Solid Leather Waste for Supercapacitor Applications. J. Hazard. Mater. 2016, 318, 173–185. [Google Scholar] [CrossRef]
  30. Wang, S.J.; Zhu, W.X.; Liao, D.W.; Ng, C.F.; Au, C.T. In Situ FTIR Studies of NO Reduction over Carbon Nanotubes (CNTs) and 1wt.% Pd/CNTs. Catal. Today 2004, 93–95, 711–714. [Google Scholar] [CrossRef]
  31. Ţucureanu, V.; Matei, A.; Avram, A.M. FTIR Spectroscopy for Carbon Family Study. Crit. Rev. Anal. Chem. 2016, 46, 502–520. [Google Scholar] [CrossRef]
  32. Pamuła, E.; Błażewicz, M.; Paluszkiewicz, C.; Dobrzyński, P. FTIR Study of Degradation Products of Aliphatic Polyesters–Carbon Fibres Composites. J. Mol. Struct. 2001, 596, 69–75. [Google Scholar] [CrossRef]
  33. Burket, C.L.; Rajagopalan, R.; Marencic, A.P.; Dronvajjala, K.; Foley, H.C. Genesis of Porosity in Polyfurfuryl Alcohol Derived Nanoporous Carbon. Carbon 2006, 44, 2957–2963. [Google Scholar] [CrossRef]
  34. Karimov, O.K.; Teptereva, G.A.; Chetvertneva, I.A.; Movsumzade, E.M.; Karimov, E.K. The Structure of Lignosulfonates for Production of Carbon Catalyst Support. IOP Conf. Ser. Earth Environ. Sci. 2021, 839, 022086. [Google Scholar] [CrossRef]
  35. Kaur, G.A.; Sharma, V.; Gupta, N.; Shandilya, M.; Rai, R. Structural and Optical Amendment of PVDF into CQDs through High Temperature Calcination Process. Mater. Lett. 2021, 304, 130616. [Google Scholar] [CrossRef]
  36. Venkatesh, R.; Karthi, N.; Kawin, N.; Prakash, T.; Kannan, C.R.; Karthigairajan, M.; Bobe, K. Synthesis and Adsorbent Performance of Modified Biochar with Ag/MgO Nanocomposites for Heat Storage Application. Adsorpt. Sci. Technol. 2022, 2022, e7423102. [Google Scholar] [CrossRef]
  37. Zhivulin, V.E.; Khairanov, R.K.; Zlobina, N.A.; Pesin, L.A. Modification of the IR Spectra Shape in the 2000–2300 Cm–1 Absorption Band upon the Aging of a Chemically Dehydrofluorinated Poly(Vinylidene Fluoride) Film. J. Surf. Investig. 2020, 14, 1144–1151. [Google Scholar] [CrossRef]
  38. Streletskiy, O.A.; Nishchak, O.Y.; Zavidovskiy, I.A.; Maslakov, K.I.; Pavlikov, A.V. Sp-Based Thin Films Synthesized by Magnetron Sputtering of Dehydrohalogenated Polyvinylidenchloride. Thin Solid Film. 2021, 739, 138993. [Google Scholar] [CrossRef]
  39. Streletskiy, O.A.; Zavidovskiy, I.A.; Nishchak, O.Y.; Khaidarov, A.A.; Savchenko, N.F.; Pavlikov, A.V. Low-Threshold Field Emission Cathode Based on Heat-Treated Dehydrofluorinated Polyvinylidene Fluoride. J. Exp. Theor. Phys. 2022, 135, 844–852. [Google Scholar] [CrossRef]
  40. Lucotti, A.; Tommasini, M.; Fazzi, D.; Del Zoppo, M.; Chalifoux, W.A.; Ferguson, M.J.; Zerbi, G.; Tykwinski, R.R. Evidence for Solution-State Nonlinearity of Sp-Carbon Chains Based on IR and Raman Spectroscopy: Violation of Mutual Exclusion. J. Am. Chem. Soc. 2009, 131, 4239–4244. [Google Scholar] [CrossRef]
  41. Leong, T.X.; Collins, B.K.; Dey Baksi, S.; Mackin, R.T.; Sribnyi, A.; Burin, A.L.; Gladysz, J.A.; Rubtsov, I.V. Tracking Energy Transfer across a Platinum Center. J. Phys. Chem. A 2022, 126, 4915–4930. [Google Scholar] [CrossRef]
  42. Begni, F.; Paul, G.; Lasseuguette, E.; Mangano, E.; Bisio, C.; Ferrari, M.-C.; Gatti, G. Synthetic Saponite Clays as Additives for Reducing Aging Effects in PIM1 Membranes. ACS Appl. Polym. Mater. 2020, 2, 3481–3490. [Google Scholar] [CrossRef]
  43. Kebukawa, Y.; Alexander, C.M.O.; Cody, G.D. Comparison of FT-IR Spectra of Bulk and Acid Insoluble Organic Matter in Chondritic Meteorites: An Implication for Missing Carbon during Demineralization. Meteorit. Planet. Sci. 2019, 54, 1632–1641. [Google Scholar] [CrossRef]
  44. Yuan, H.; Zhang, Y.; Li, Q.; Yan, W.; Zhang, X.; Ouyang, X.; Ouyang, X.; Chen, L.; Liao, B. A Study of Al2O3/MgO Composite Films Deposited by FCVA for Thin-Film Encapsulation. Materials 2023, 16, 1955. [Google Scholar] [CrossRef] [PubMed]
  45. Matousek, P.; Everall, N.; Littlejohn, D.; Nordon, A.; Bloomfield, M. Dependence of Signal on Depth in Transmission Raman Spectroscopy. Appl. Spectrosc. 2011, 65, 724–733. [Google Scholar] [CrossRef]
  46. Abdu, Y.A. Raman Micro-Spectroscopy of Nanodiamonds from the Kapoeta Meteorite. Diam. Relat. Mater. 2021, 118, 108536. [Google Scholar] [CrossRef]
  47. Maia, L.F.; De Oliveira, V.E.; Edwards, H.G.M.; De Oliveira, L.F.C. The Diversity of Linear Conjugated Polyenes and Colours in Nature: Raman Spectroscopy as a Diagnostic Tool. ChemPhysChem 2021, 22, 231–249. [Google Scholar] [CrossRef]
  48. Streletskiy, O.; Perevedentseva, E.; Zavidovskiy, I.; Karmenyan, A.; Sychev, V.; Sadykova, V.; Kuvarina, A.; Cheng, C.-L. Amorphous Carbon Films with Embedded Well-Dispersed Nanodiamonds: Plasmon-Enhanced Analysis and Possible Antimicrobial Applications. Magnetochemistry 2022, 8, 171. [Google Scholar] [CrossRef]
  49. Lichtmann, L.S.; Imhoff, E.A.; Sarhangi, A.; Fitchen, D.B. Resonance Raman Spectra of cis (CH)x and (CD)x. J. Chem. Phys. 1984, 81, 168–184. [Google Scholar] [CrossRef]
  50. Streletskiy, O.A.; Zavidovskiy, I.A.; Balabanyan, V.Y.; Tsiskarashvili, A.V. Antibacterial Properties of Modified A–C and Ta–C Coatings: The Effects of the Sp2/Sp3 Ratio, Oxidation, Nitridation, and Silver Incorporation. Appl. Phys. A 2022, 128, 929. [Google Scholar] [CrossRef]
  51. Schaffer, H.E.; Chance, R.R.; Silbey, R.J.; Knoll, K.; Schrock, R.R. Conjugation Length Dependence of Raman Scattering in a Series of Linear Polyenes: Implications for Polyacetylene. J. Chem. Phys. 1991, 94, 4161–4170. [Google Scholar] [CrossRef] [Green Version]
  52. Casari, C.S.; Li Bassi, A.; Baserga, A.; Ravagnan, L.; Piseri, P.; Lenardi, C.; Tommasini, M.; Milani, A.; Fazzi, D.; Bottani, C.E.; et al. Low-Frequency Modes in the Raman Spectrum of $sp\text{\ensuremath{-}}s{p}^{2}$ Nanostructured Carbon. Phys. Rev. B 2008, 77, 195444. [Google Scholar] [CrossRef] [Green Version]
  53. Cataldo, F. The Role of Raman Spectroscopy in the Research on Sp-Hybridized Carbon Chains: Carbynoid Structures Polyynes and Metal Polyynides: Raman Spectra of Sp-Hybridized Carbon Chains. J. Raman Spectrosc. 2008, 39, 169–176. [Google Scholar] [CrossRef]
  54. Demir, A.; Bağci, S.; San, S.E.; Doğruyol, Z. Pentacene-Based Organic Thin Film Transistor with SiO2 Gate Dielectric. Surf. Rev. Lett. 2015, 22, 1550038. [Google Scholar] [CrossRef]
  55. Xu, G.; Bao, Z.; Groves, J.T. Langmuir−Blodgett Films of Regioregular Poly(3-Hexylthiophene) as Field-Effect Transistors. Langmuir 2000, 16, 1834–1841. [Google Scholar] [CrossRef]
  56. Garnier, F.; Hajlaoui, R.; El Kassmi, A.; Horowitz, G.; Laigre, L.; Porzio, W.; Armanini, M.; Provasoli, F. Dihexylquaterthiophene, A Two-Dimensional Liquid Crystal-like Organic Semiconductor with High Transport Properties. Chem. Mater. 1998, 10, 3334–3339. [Google Scholar] [CrossRef]
  57. Demir, A.; Atahan, A.; Bağcı, S.; Aslan, M.; Saif Islam, M. Organic/Inorganic Interfaced Field-Effect Transistor Properties with a Novel Organic Semiconducting Material. Philos. Mag. 2016, 96, 274–285. [Google Scholar] [CrossRef]
  58. Dimitrakopoulos, C.D.; Afzali-Ardakani, A.; Furman, B.; Kymissis, J.; Purushothaman, S. Trans-Trans-2,5-Bis-[2-5-(2,2′-Bithienyl)Ethenyl]Thiophene: Synthesis, Characterization, Thin Film Deposition and Fabrication of Organic Field-Effect Transistors. Synth. Met. 1997, 89, 193–197. [Google Scholar] [CrossRef]
  59. Yuvaraja, S.; Nawaz, A.; Liu, Q.; Dubal, D.; Surya, S.G.; Salama, K.N.; Sonar, P. Organic Field-Effect Transistor-Based Flexible Sensors. Chem. Soc. Rev. 2020, 49, 3423–3460. [Google Scholar] [CrossRef]
  60. Kim, Y.; Chung, S.; Cho, K.; Harkin, D.; Hwang, W.-T.; Yoo, D.; Kim, J.-K.; Lee, W.; Song, Y.; Ahn, H.; et al. Enhanced Charge Injection Properties of Organic Field-Effect Transistor by Molecular Implantation Doping. Adv. Mater. 2019, 31, 1806697. [Google Scholar] [CrossRef]
  61. Bao, Z.; Lovinger, A.J. Soluble Regioregular Polythiophene Derivatives as Semiconducting Materials for Field-Effect Transistors. Chem. Mater. 1999, 11, 2607–2612. [Google Scholar] [CrossRef]
  62. Burch, R.R.; Dong, Y.-H.; Fincher, C.; Goldfinger, M.; Rouviere, P.E. Electrical Properties of Polyunsaturated Natural Products: Field Effect Mobility of Carotenoid Polyenes. Synth. Met. 2004, 146, 43–46. [Google Scholar] [CrossRef]
Figure 1. Schematics of the transistor manufacturing.
Jcs 07 00264 g001
Figure 2. (a) SEM image of the basis of the obtained transistor observed prior to the deposition of the polyyne–polyene film. The length of the whole scale bar is 20 μm. (b) Schematic cross-section of the polyyne–polyene-based field-effect transistor. Uds notation indicates the drain-source voltage.
Jcs 07 00264 g002
Figure 3. TEM image of the foam-like structure of the polyyne–polyene-based material. The length of the whole scale bar is 200 nm.
Jcs 07 00264 g003
Figure 4. FTIR spectrum of (a) PVDC precursor and (b) polyyne–polyene film.
Jcs 07 00264 g004
Figure 5. Raman spectrum of the PVDC powder.
Jcs 07 00264 g005
Figure 6. (a) Raman spectra of the polyyne–polyene film. Fundamental lines, their overlapping (“x and y”), and overtones (“x+y”) are indicated. (b) Decomposition of the Raman spectra in the range of fundamental lines. The violet line is a sum of the peaks, and black line shows experimental results.
Jcs 07 00264 g006
Figure 7. (a) Output characteristics of polyyne–polyene structure-based FET at different steps from 0 to 8 V; (b) Charge transfer characteristic of polyyne–polyene structure-based FET at sweep gate voltage ranging from 0 to 18 V at Uds = 4 V.
Jcs 07 00264 g007
Disclaimer/Publisher’s Note: The statements, opinions and data contained in all publications are solely those of the individual author(s) and contributor(s) and not of MDPI and/or the editor(s). MDPI and/or the editor(s) disclaim responsibility for any injury to people or property resulting from any ideas, methods, instructions or products referred to in the content.