3.1. Comparative Results of Mechanical Testing for BFRP and GFRP
The mechanical behavior of glass and basalt fiber-reinforced polymer (GFRP and BFRP) composites was evaluated through tensile and flexural tests for specimens containing 50%, 65%, and 70% fiber weight fractions. The tensile tests were conducted according to ISO 527-1:2019 [
24] (corresponding to ASTM D3039), while the flexural tests followed ISO 178:2019 [
25] (equivalent to ASTM D7264).
3.1.1. Tensile Behavior
As shown in
Figure 2, the tensile performance of GFRP and BFRP composites exhibits a clear dependency on the fiber weight fraction. For both material systems, an increase in fiber content from 50% to 70% results in a progressive enhancement of tensile strength, confirming the structural contribution of the fibers in sustaining axial loads. GFRP composites display a continuous increase in tensile strength, from 318.8 MPa at 50% fiber content to 480.1 MPa at 70%. Similarly, BFRP composites show a growth from 329.2 MPa to 453.4 MPa across the same reinforcement range.
Although GFRP reaches a higher maximum strength at 70% fiber content, BFRP demonstrates comparable tensile performance and even surpasses GFRP at the 50% level. This suggests that basalt fibers can provide an effective load-bearing reinforcement, particularly in lower-fiber-content configurations, likely due to favorable interfacial bonding and energy dissipation characteristics.
Regarding stiffness,
Figure 2 also illustrates the evolution of the elastic modulus with fiber content. GFRP shows a typical increasing trend, reaching 22.2 GPa at 70% fiber weight. In contrast, BFRP displays an anomalous behavior: the highest tensile modulus of 20.84 GPa is recorded at 50%, followed by a gradual decrease at higher reinforcement levels (18.74 GPa at 65% and 17.99 GPa at 70%). This deviation from expected mechanical behavior may be attributed to manufacturing-related imperfections such as fiber misalignment, resin starvation, or local porosity, which compromise stiffness despite increased reinforcement.
The data in
Figure 2 thus confirm that both composites benefit from increased fiber content in terms of tensile strength, while stiffness evolution is more dependent on microstructural consistency. These results underline the importance of fabrication quality, particularly for BFRP, where high fiber fractions may introduce processing challenges. Nonetheless, BFRP remains a viable alternative to GFRP, offering competitive tensile strength and potential advantages in thermal and environmental durability. Such characteristics make BFRP attractive for lightweight structural applications where tensile integrity is critical but flexural rigidity is less dominant, such as protective panels, secondary structural components, or underbody shielding. This deviation reinforces the need for precise control over fiber packing and resin infiltration, especially at higher reinforcement levels, where defects can override the benefits of added fiber volume.
3.1.2. Flexural Behavior
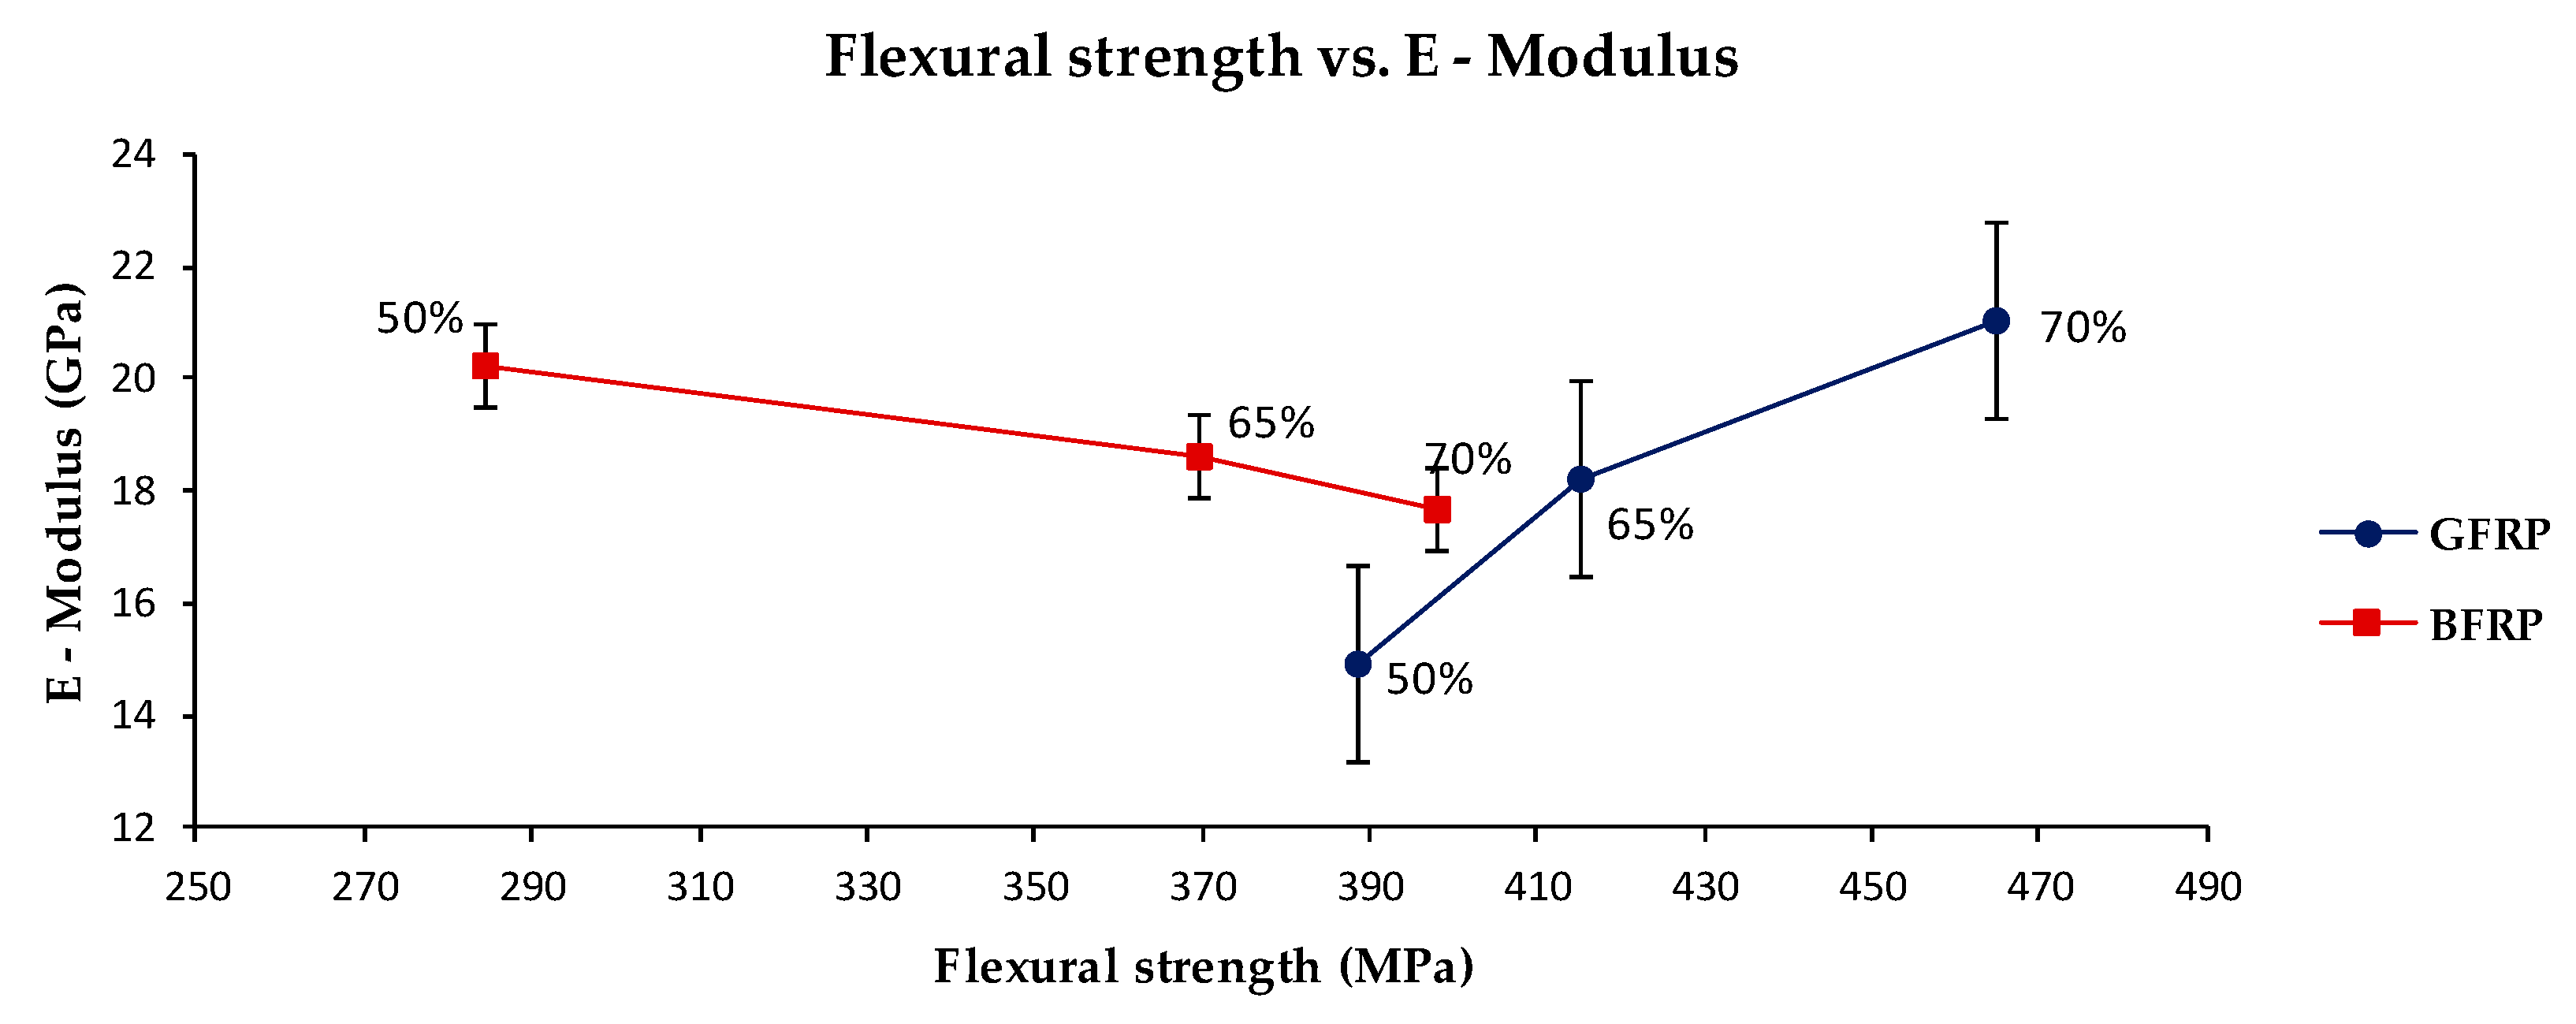
The flexural response of GFRP and BFRP composites, illustrated in
Figure 3, shows a trend similar to the tensile behavior, with flexural strength increasing alongside fiber weight fraction. GFRP consistently outperformed BFRP across all reinforcement levels, reaching a maximum flexural strength of 464.8 MPa at 70% fiber content, compared to 398.0 MPa for BFRP under the same conditions. At 50% fiber content, the performance gap is even more pronounced, with GFRP achieving 388.6 MPa and BFRP only 284.3 MPa.
This systematic superiority of GFRP in flexural loading is likely attributable to its inherently higher stiffness and improved stress distribution capabilities, particularly under bending conditions where both tensile and compressive stresses coexist across the laminate thickness. The consistent structural integrity and stiffness of glass fibers allow for a more efficient load transfer during flexural deformation.
In terms of elastic modulus,
Figure 3 reveals a regular increase for GFRP from 14.94 GPa at 50% fiber to 21.01 GPa at 70%. BFRP, however, follows a non-linear and somewhat unexpected trend, echoing the tensile behavior. The highest flexural modulus of 20.20 GPa is recorded at 50%, decreasing to 18.59 GPa at 65% and 17.68 GPa at 70%. This non-monotonic behavior may be attributed to structural inconsistencies in the BFRP composite at higher fiber fractions, such as poor fiber dispersion, micro voids, or resin-rich zones, which inhibit the full exploitation of the reinforcing potential.
The results in
Figure 3 confirm that while BFRP offers a competitive alternative to GFRP in terms of strength, it is more susceptible to processing-induced limitations that impact stiffness. The decreased modulus at higher fiber content suggests that beyond a certain threshold, the structural benefits of increased reinforcement in BFRP are counteracted by microstructural irregularities.
Overall, the flexural performance data reinforces the conclusion that BFRP can be a structurally viable material, especially when optimal processing conditions are ensured. However, for applications where high flexural stiffness is critical, GFRP remains the more reliable choice due to its predictable and consistent mechanical behavior.
The mechanical characterization of GFRP and BFRP composites demonstrates that fiber weight fraction significantly influences both tensile and flexural performance. In both loading modes, increased fiber content leads to higher strength values, confirming the role of reinforcement in enhancing load-bearing capacity.
GFRP composites exhibited superior mechanical properties in terms of both tensile and flexural strength, as well as stiffness, with a consistent increase in elastic modulus observed across all reinforcement levels. The predictable mechanical response of GFRP, particularly under flexural loading, highlights the structural efficiency of glass fibers and their compatibility with the polymer matrix.
BFRP composites, on the other hand, showed competitive strength values—surpassing GFRP in tensile strength at 50% fiber content—and demonstrated good structural integrity across all reinforcement levels. However, the elastic modulus of BFRP did not follow a monotonic trend, especially under tensile and flexural conditions, where the highest stiffness was recorded at the lowest fiber content. This behavior suggests that while basalt fibers offer attractive mechanical and environmental properties, their performance can be more sensitive to processing quality and fiber distribution.
Overall, GFRP remains the more robust choice for applications requiring high stiffness and consistent performance. Nevertheless, BFRP is a promising alternative, especially when additional factors such as thermal resistance, sustainability, or cost-effectiveness are taken into consideration. Ensuring optimal processing conditions and fiber alignment is essential for fully unlocking the mechanical potential of basalt fiber-reinforced composites. The non-monotonic evolution of the BFRP elastic modulus with increasing fiber content is attributed primarily to manufacturing-related imperfections such as fiber misalignment, resin starvation, and local porosity, which can dominate the stiffness response at high fiber fractions. Although the tests were conducted under strict ASTM/ISO standards and yielded consistent results, this behavior suggests that fiber–matrix interface quality and processing conditions may also play a role. Future work will include more detailed microstructural analysis (high-resolution SEM or EDS) and potential optimization of lay-up and autoclave parameters to fully elucidate and mitigate this effect.
3.2. Comparative Tribological Behavior for GFRP and BFRP
The tribological performance of the GFRP and BFRP composites was assessed under dry sliding conditions using a pin-on-disk tribometer with a chromium alloy steel counterbody (AISI 52100, Ø 12.7 mm), in accordance with ASTM A295 [
26]. The tests were designed to investigate the influence of the key parameters—fiber weight fraction (50%, 65%, and 70%) for two different FRPs, applied normal load (20 N), and sliding speed (0.1, 0.25, 0.36 m/s) on the coefficient of friction (COF), specific wear rate, and surface temperature.
The experimental setup and parameter combinations presented in
Table 4 ensure a comparative evaluation of the tribological behavior of the BFRP material with 50%, 65%, and 70% fiber weight fractions.
The tribological responses were analyzed for steady-state conditions over the last 60 min of the 120 min testing interval. For each test, a new ball and a new disc were employed, both of which were cleaned with ethanol and subsequently dried under controlled conditions prior to testing. During the experiments, temperature, wear track condition, and friction force were continuously recorded. To assess the consistency of the tribomechanical parameters, the coefficient of variation (CV) was computed based on the standard deviation and the mean of the measured values. This coefficient indicates the relative variability of the data. In all cases, CV values remained below 10%, demonstrating the repeatability of the experimental results.
The dry sliding tests performed on both glass fiber-reinforced polymer (GFRP) and basalt fiber-reinforced polymer (BFRP) composites revealed clear distinctions in frictional stability and wear resistance, driven primarily by the type and fraction of reinforcement. Regardless of fiber type, an increase in fiber weight fraction generally resulted in enhanced tribological behavior, confirming the crucial role of reinforcement in resisting surface degradation and stabilizing the friction interface.
Under the same operating conditions (dry contact, constant load, and variable sliding speed), BFRP specimens showed greater resilience against thermal and mechanical degradation compared to GFRP. The formation of a more stable frictional layer, particularly in the BFRP 70% configuration, contributed to consistent performance and lower friction-induced heat accumulation. GFRP samples, while demonstrating slightly higher friction in most configurations, exhibited sharper transitions during the run-in period and higher variability in surface response.
The comparative approach across six material configurations allowed for a clear evaluation of how fiber type and quantity affect key tribological indicators: coefficient of friction, specific wear rate, and surface temperature at the contact zone.
In addition to fiber type and weight fraction, other parameters—such as fiber diameter, surface treatments, matrix modifications, and environmental conditions (e.g., humidity, temperature)—can also influence the tribological behavior of FRP composites. These aspects were kept constant in the present study to ensure a focused comparison, and they will be explored in future work to expand the current findings.
3.2.1. Coefficient of Friction (COF)
The coefficient of friction (COF) measured during steady-state dry sliding shows clear differences between GFRP and BFRP composites, as illustrated in
Figure 4. Across all nine test conditions, BFRP consistently exhibited lower COF values compared to GFRP, confirming its superior frictional performance and interface stability.
At the lowest sliding speed of 0.1 m/s, GFRP composites recorded the highest COF values, particularly in the 50% fiber variant (0.54), whereas BFRP 50% registered a significantly lower value (0.40). This trend is repeated across all reinforcement levels, where BFRP samples reached steady-state friction more quickly and with less fluctuation, likely due to improved tribological layer formation and reduced matrix exposure at the contact surface.
As the fiber content increased to 65% and 70%, both materials experienced a decrease in COF; however, the reduction was more pronounced and consistent in BFRP. Notably, the BFRP 70% composite achieved the lowest COF overall (0.32 at 0.1 m/s), highlighting the role of a dense and well-integrated fiber network in minimizing interfacial resistance and promoting stable sliding.
The influence of sliding speed is also evident: all samples demonstrated a general decrease in COF with increasing speed. This is attributed to enhanced frictional heating at higher velocities, which facilitates the formation of a more continuous and stable contact film, particularly in highly reinforced BFRP composites.
In conclusion, the data presented in
Figure 4 confirm that BFRP composites offer superior frictional performance under dry sliding conditions, especially at higher fiber contents. Their lower and more stable COF values, compared to GFRP, underscore the advantages of basalt fiber reinforcement in reducing interfacial energy dissipation and improving tribological efficiency.
3.2.2. Specific Wear Rate
The specific wear rate, expressed in mm
3/N·m, reflects the volumetric material loss per unit of load and sliding distance and serves as a key indicator of durability under frictional loading. As illustrated in
Figure 5, K is strongly influenced by both the fiber type and the fiber weight fraction.
GFRP composites recorded the highest wear rates overall, especially at lower fiber contents and higher sliding speeds. Notably, the GFRP 50% sample reached a maximum SWR of 32.737 × 10⁻⁵ mm3/N·m at 0.25 m/s. A clear decreasing trend is observed as the fiber content increases: at 70%, GFRP achieves a considerably lower wear rate of 4.42 × 10⁻⁵ mm3/N·m, suggesting enhanced load distribution and surface resistance provided by the denser fiber network.
In contrast, BFRP composites consistently exhibited lower wear rates across all test conditions. At the same sliding speed of 0.25 m/s, BFRP 50% achieved an SWR of only 5.84 × 10⁻⁵ mm3/N·m, which is almost six times lower than its GFRP counterpart. The best performance was observed in the BFRP 70% configuration, which maintained low wear levels (7.26 × 10⁻⁵ mm3/N·m), even at moderate speeds.
The graphical comparison in
Figure 5 highlights that for every matching test condition, the BFRP bars consistently undercut the GFRP values. This pattern indicates a superior wear resistance for BFRP, attributable to the inherent hardness, thermal stability, and fiber–matrix interaction quality of basalt fibers. Furthermore, the stability of BFRP performance across different reinforcement levels suggests that its effectiveness is less dependent on optimal fiber fraction than GFRP. Overall, both materials benefit from increased fiber content in terms of wear resistance. However, BFRP provides a more robust and consistent tribological response, particularly under moderate and high-speed sliding. These findings underscore the importance of fiber type in controlling wear mechanisms and support the use of basalt fibers for applications requiring improved surface durability under frictional contact. These macroscopic trends align with SEM observations, which confirm more stable fiber–matrix interfaces and less evidence of surface degradation in BFRP specimens.
It should be noted that 70% fiber content represents the practical upper limit for the laminate architecture and autoclave process used in this study. Increasing fiber content beyond this level does not necessarily ensure improved wear resistance, as processing-related defects such as fiber misalignment, local porosity, and resin starvation may appear and compromise the fiber–matrix interface. Investigating optimized manufacturing techniques for ultra-high fiber content laminates will be a subject of future research.
3.2.3. Contact Temperature
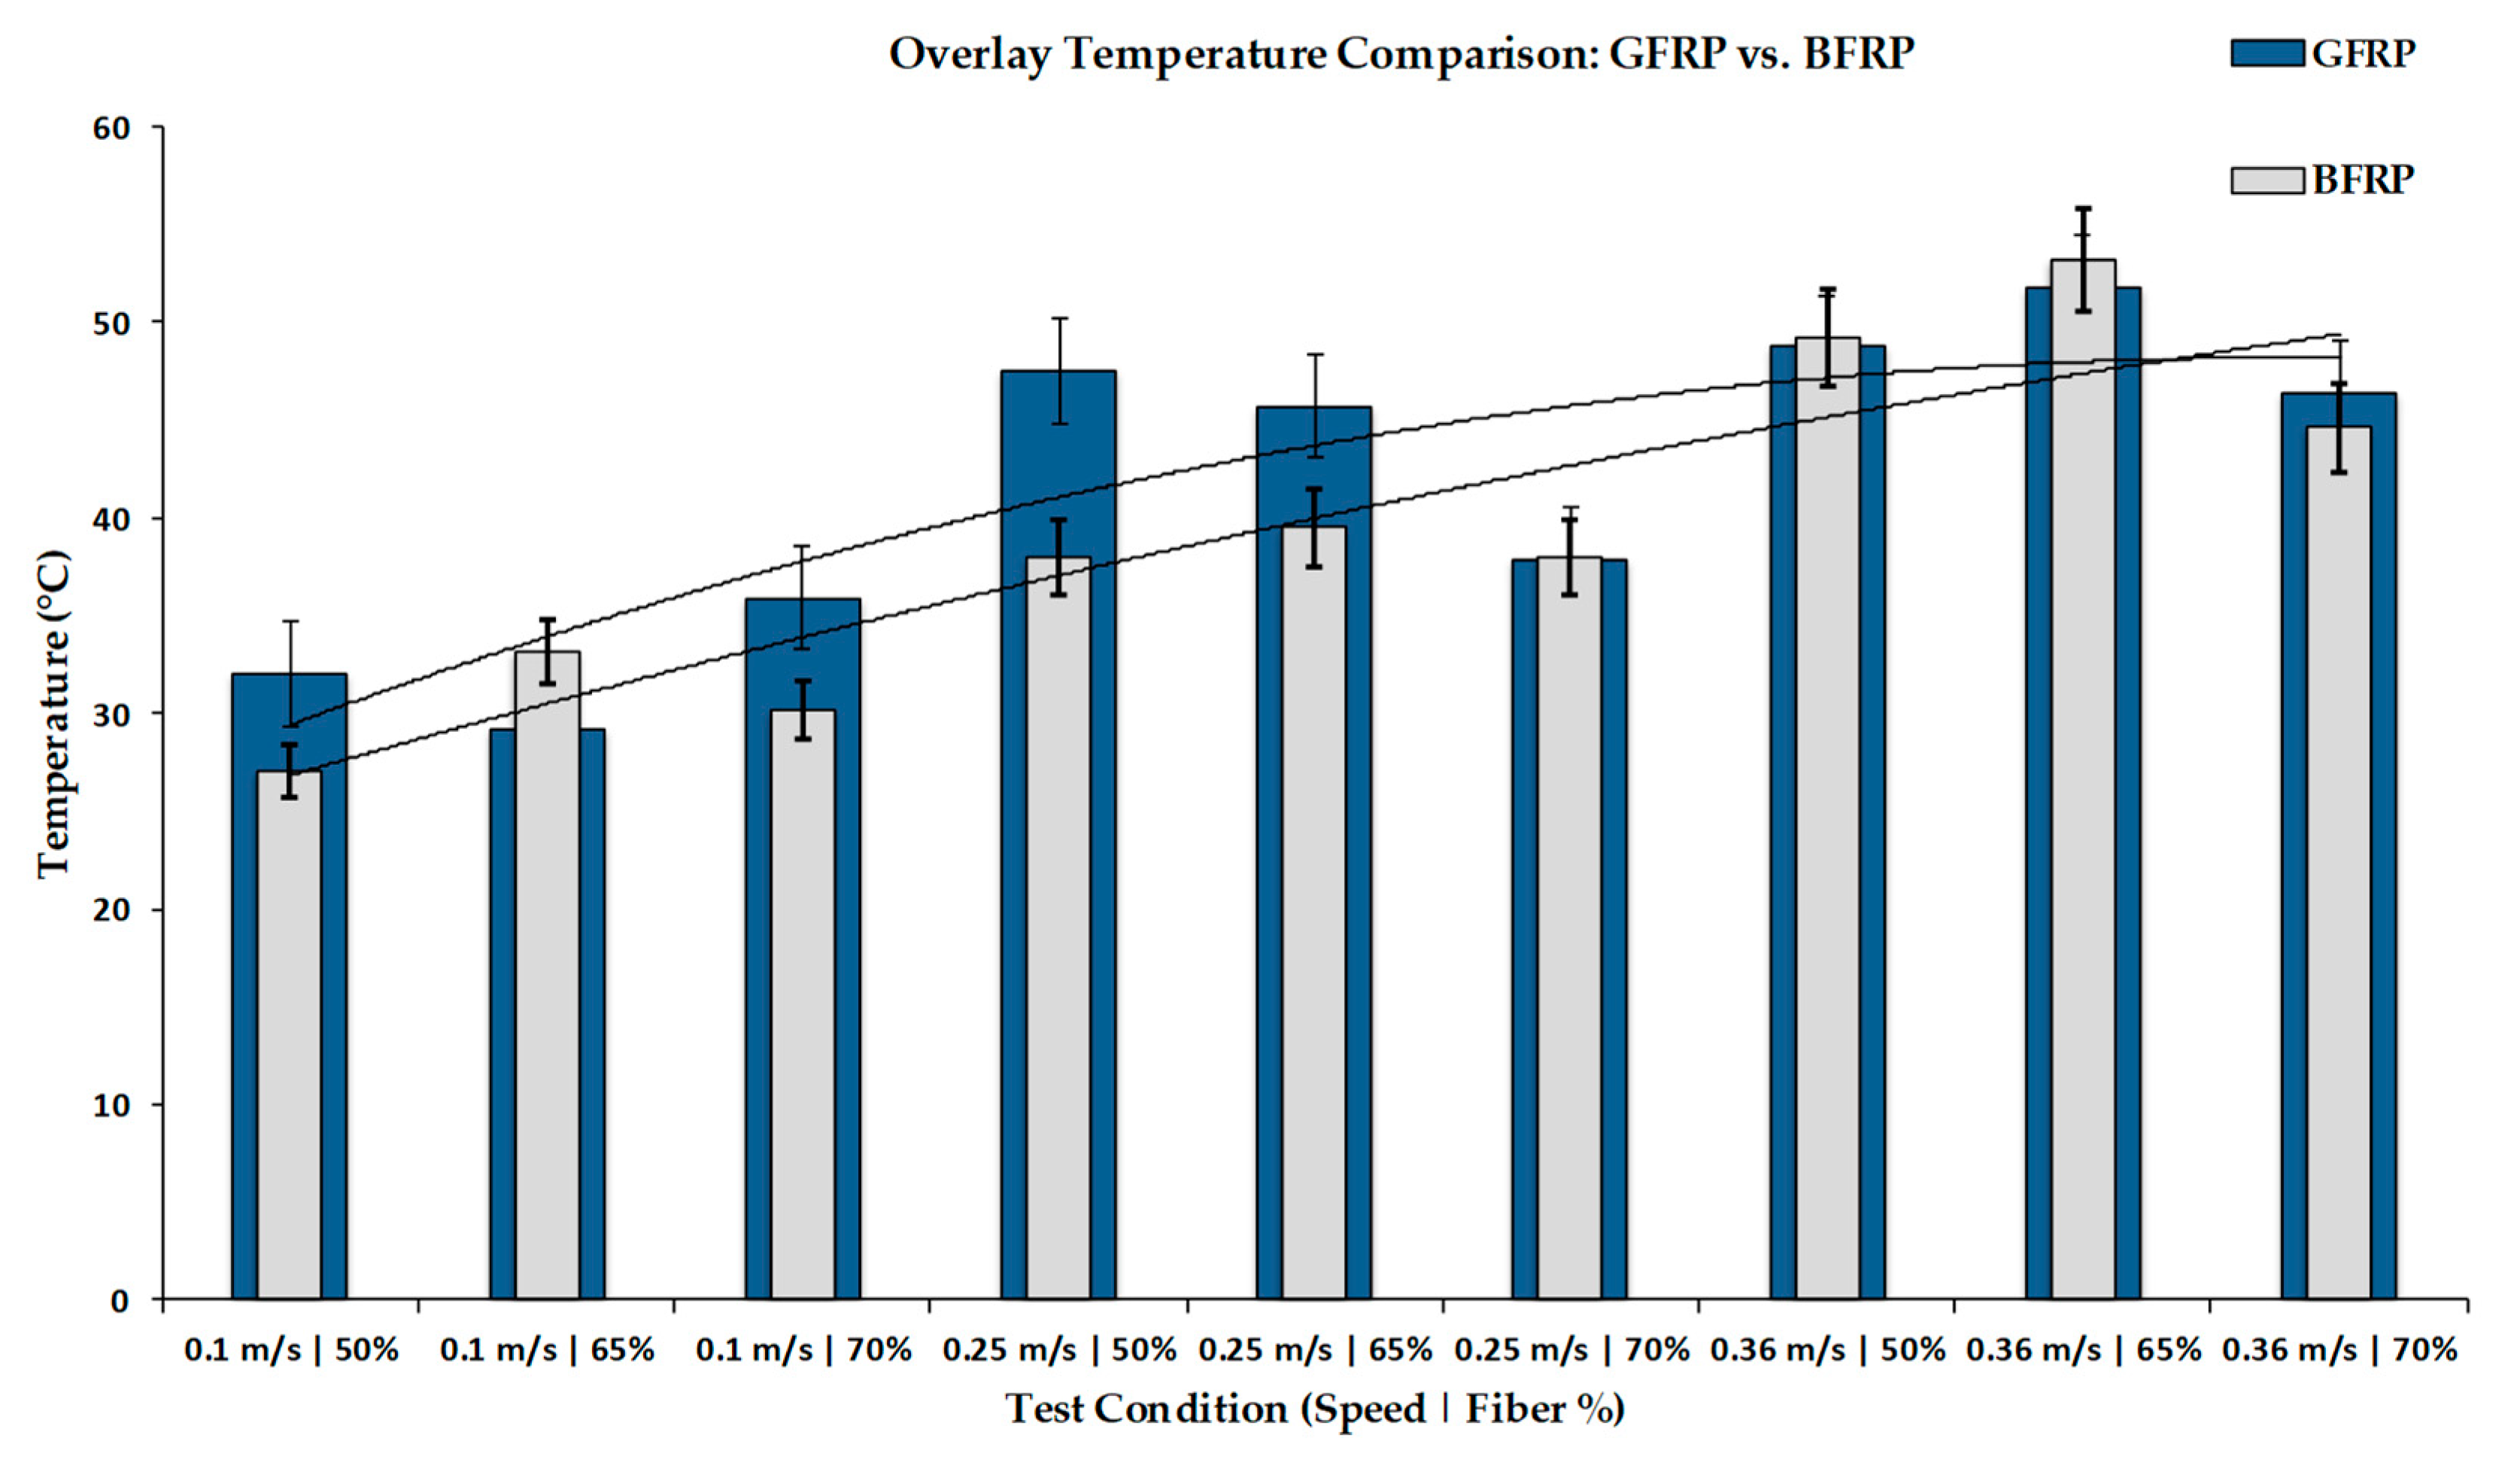
The contact temperature during dry sliding reflects the thermal stability of the composite materials and their capacity to dissipate friction-induced heat. As presented in
Figure 6, both sliding speed and fiber content significantly influence the surface temperature, with marked differences observed between the GFRP and BFRP composites.
At the lowest sliding speed (0.1 m/s), both material systems maintained relatively low and stable temperatures. For example, GFRP 50% reached 32 °C, while BFRP 50% recorded only 27 °C, indicating better thermal resistance in the basalt-based composite. However, as the speed increased to 0.25 m/s and 0.36 m/s, frictional heat accumulation became more pronounced, demonstrating more favorable wear, especially in matrix-rich samples with 50% fiber content.
At high reinforcement levels (70%), BFRP again demonstrated superior thermal performance. At 0.36 m/s, BFRP 70% maintained a lower surface temperature (44.6 °C) compared to GFRP 70%, which reached 46.3 °C. Across all fiber contents and sliding speeds, the BFRP bars in
Figure 6 are consistently equal to or lower than their GFRP counterparts, confirming that basalt fibers enhance heat dissipation efficiency.
This improved thermal response is attributed to the intrinsic properties of basalt fibers, such as higher thermal conductivity and thermal resistance relative to glass. These properties limit localized matrix softening, reduce thermal gradients, and help preserve the fiber–matrix interface integrity. As a result, BFRP samples exhibit better resistance to degradation and microcrack initiation under sustained frictional loading.
The findings in
Figure 6 also correlate with the wear and friction trends shown in
Figure 4 and
Figure 5, reinforcing the conclusion that effective thermal management contributes directly to reduced wear rates and more stable COF profiles—particularly in BFRP composites with higher fiber content.
In summary, BFRP composites provide better thermal stability than GFRP, especially under higher speeds and reinforcement levels. This makes basalt fiber-reinforced materials more suitable for applications involving prolonged or thermally intensive contact conditions.
3.2.4. Wear Mechanisms
At 50% fiber content, the wear track morphology reveals significant differences between the BFRP and GFRP composites. As shown in
Figure 7 (a1,b1 for BFRP, a2,b2 for GFRP), the BFRP surface appears relatively uniform and intact. The SEM micrographs indicate minor matrix displacement and small-scale abrasion, with localized resin softening but no major surface failure. Partially exposed fibers are visible, yet remain mostly anchored, suggesting a controlled degradation mechanism with minimal fiber–matrix delamination.
In contrast, the GFRP 50% sample shows clear evidence of severe wear. The surface in
Figure 7(a2,b2) is marked by prominent fiber pull-out, resin fragmentation, and surface cracking. Detached matrix debris and accumulation zones are visible, indicating unstable contact conditions and less effective fiber–matrix interaction. The observed features are consistent with thermally driven softening and mechanical fatigue, leading to the formation of a weak tribolayer.
These observations are supported by EDS spectra collected from regions b1 (BFRP) and b2 (GFRP). The GFRP surface exhibits intense carbon and silicon peaks—evidence of exposed glass fibers and extensive matrix breakdown—alongside detectable traces of iron and chromium, which suggest material transfer from the steel counterface. In contrast, the BFRP spectrum displays a more stable composition, with moderate basalt-related elements (Si, Al, and O) and reduced metallic or organic contamination, reflecting superior wear stability and lower adhesive interaction.
At 65% fiber content, the wear track morphology further emphasizes the superior performance of BFRP composites. As seen in
Figure 8(c1,d1 for BFRP, c2,d2 for GFRP), the BFRP sample presents a compact and well-preserved surface. The basalt fibers remain well embedded within the matrix, and resin removal is minimal, resulting in a continuous, smooth wear path with limited abrasive markings. The absence of surface fractures or delamination suggests stable sliding behavior and effective fiber–matrix bonding.
By contrast, the GFRP 65% composite exhibits significant surface deterioration. In
Figure 8(c2,d2), the SEM images show matrix cracking, localized melting, and rough, uneven wear zones. Fiber exposure and partial detachment are evident, accompanied by fragmented resin and thermally deformed areas. These features are indicative of an unstable tribological film and poor heat dissipation, leading to intensified surface damage under frictional stress.
Elemental EDS analysis further supports these morphological findings. The spectrum in
Figure 8(d1) (BFRP) reveals a balanced distribution of basalt-derived elements (Al, Si, and O) with low levels of carbon residue—signifying limited polymer degradation. In contrast, the GFRP sample (
Figure 8(d2)) displays strong carbon peaks and metallic traces, including iron and chromium, indicating matrix erosion and counterface material transfer. The presence of these signals confirms a less cohesive tribolayer and elevated adhesive interaction at the GFRP interface.
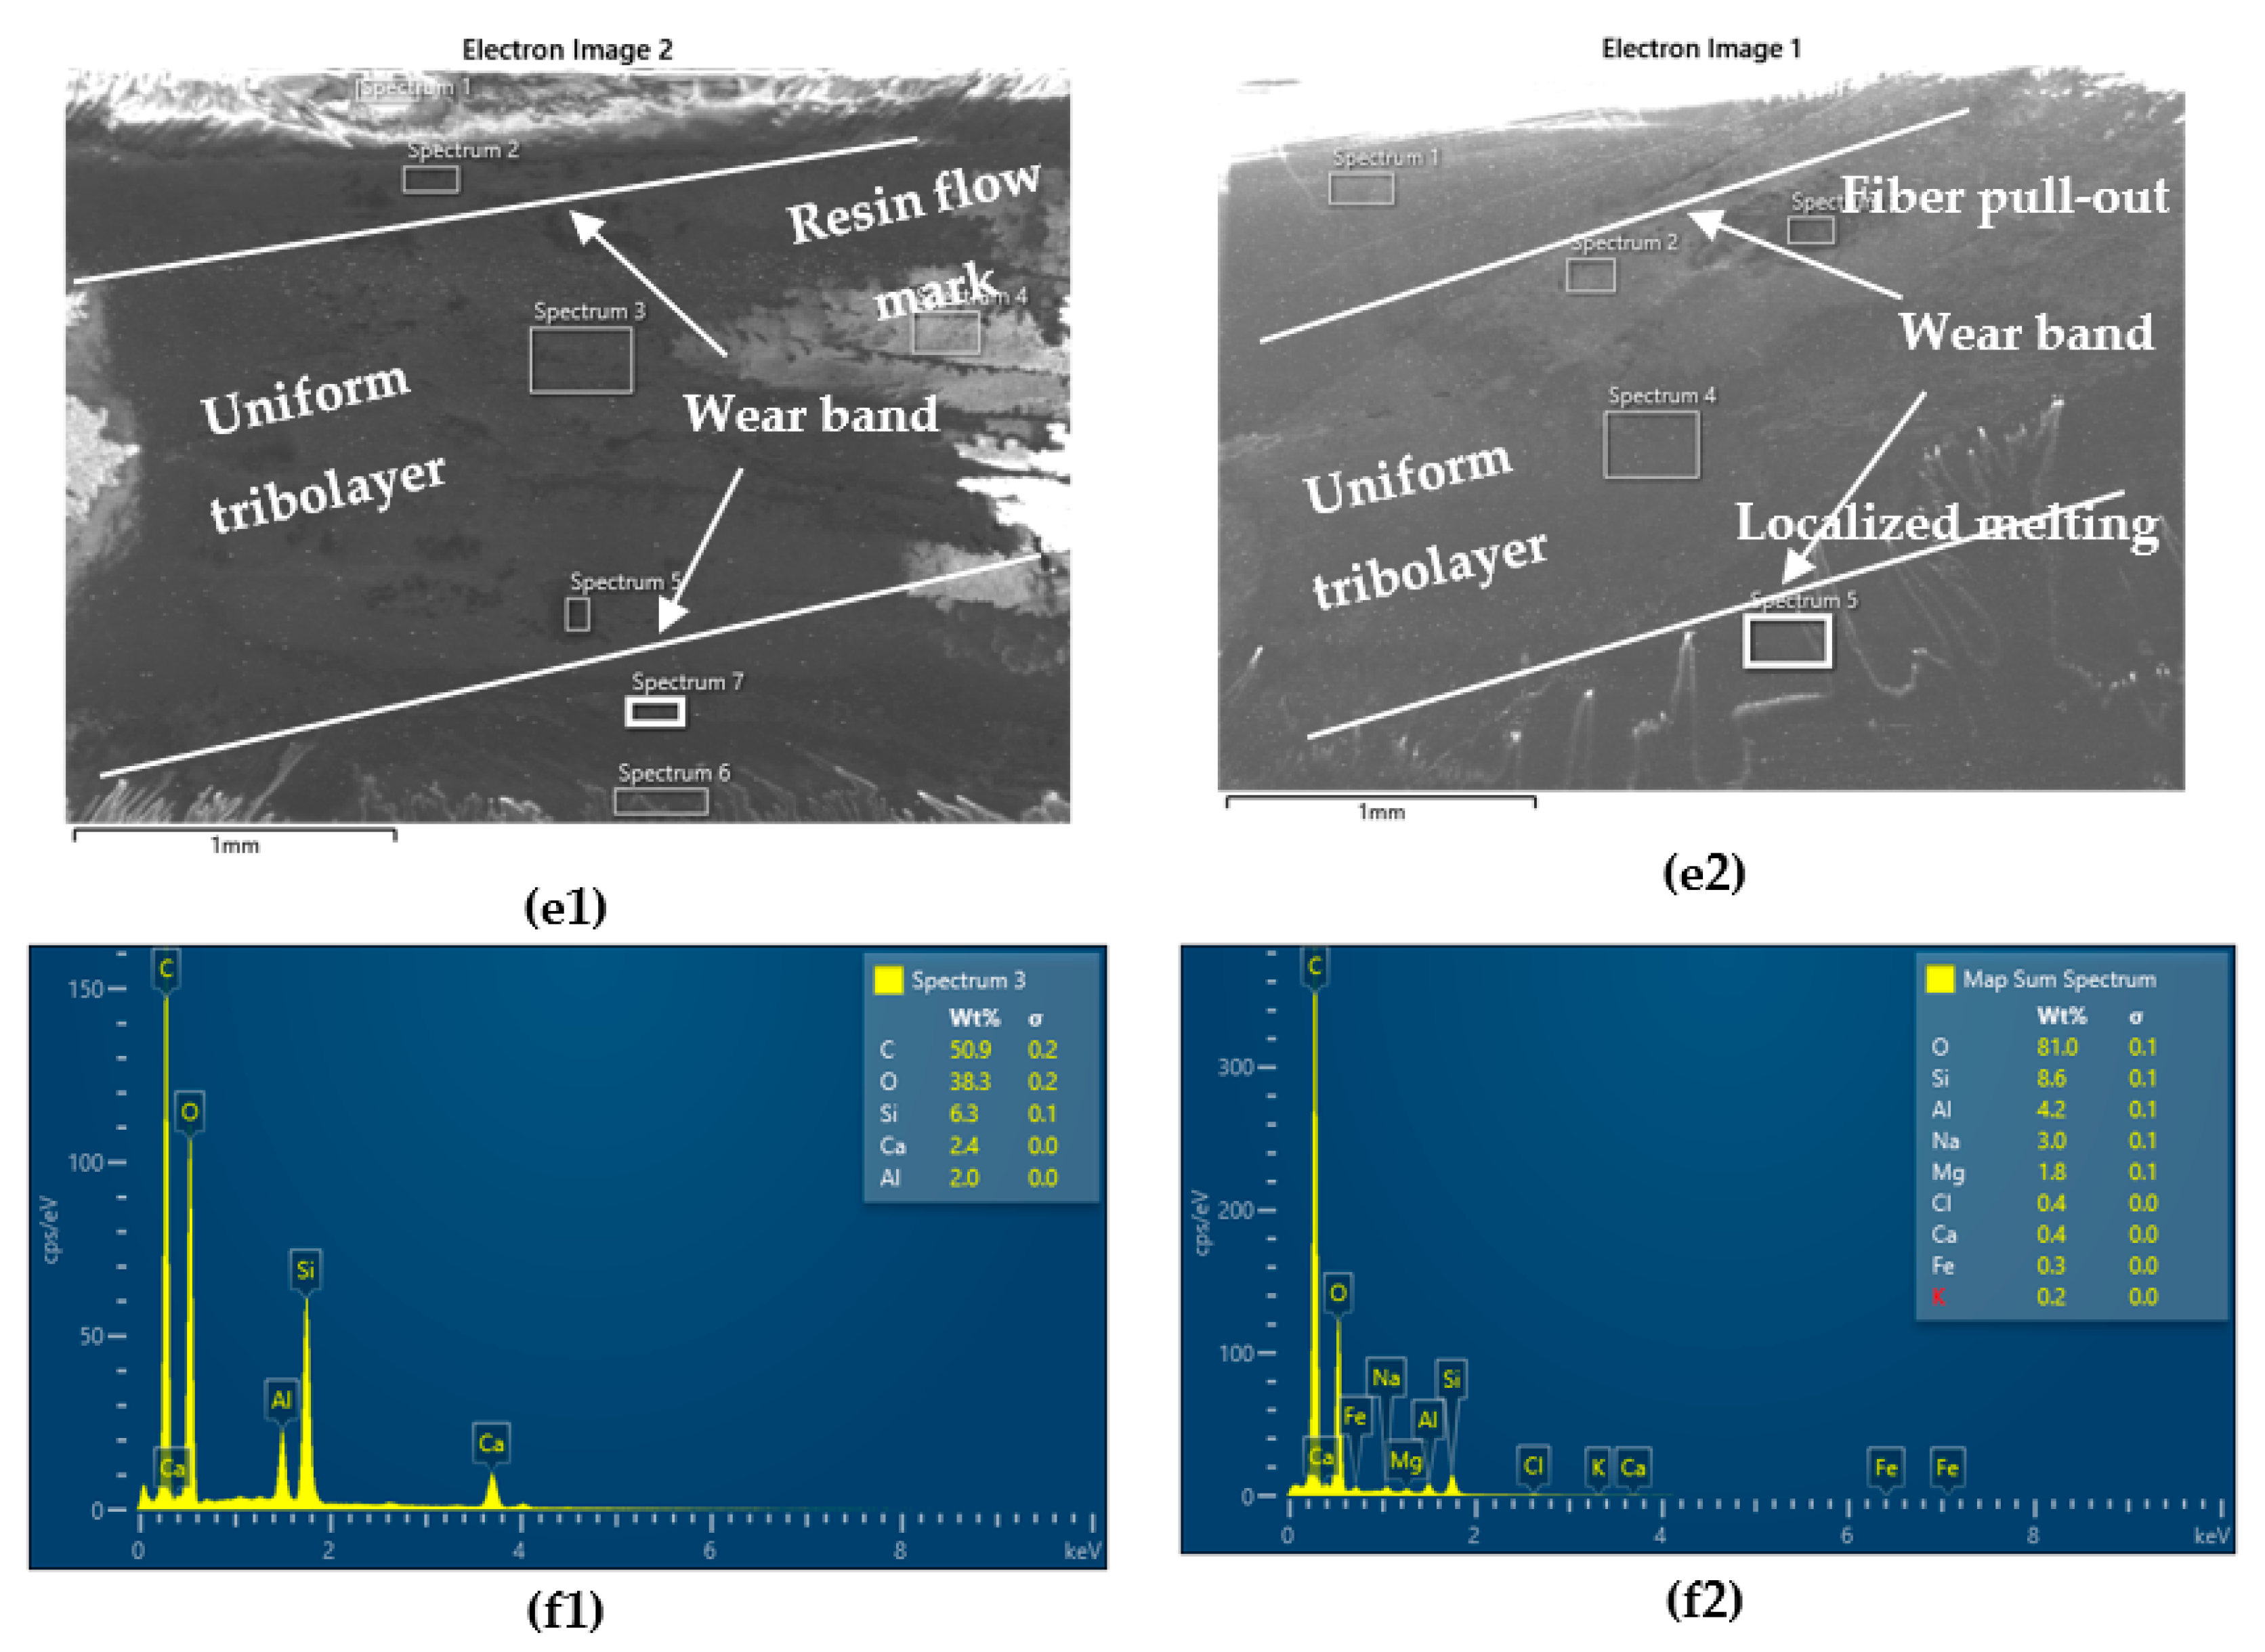
At 70% fiber content, the differences in wear resistance between BFRP and GFRP composites become most pronounced. As shown in
Figure 9(e1,f1 for BFRP, e2,f2 for GFRP), the BFRP surface maintains a laminated and continuous morphology, with minimal fiber disruption and no significant matrix fragmentation. The wear track appears smooth and uniform, suggesting the presence of a well-developed tribological film that stabilizes the interface during prolonged sliding.
Conversely, the GFRP sample shows substantial surface degradation under the same testing conditions. In
Figure 9(e2,f2), the SEM micrographs reveal clear signs of resin flow, localized melting, and fiber detachment. The surface is marked by plasticized regions, microcracks, and exposed glass fibers, all indicative of thermal instability and insufficient interfacial adhesion. These characteristics point to a less robust tribofilm and a lower capacity for heat dissipation in the GFRP composite.
The superior wear resistance of BFRP is further confirmed by EDS spectra. In
Figure 9(f1), the analysis reveals strong and stable signals for basalt-related elements (Si, Al, and O) and very low carbon content—signifying limited polymer degradation and no significant metal transfer. In contrast,
Figure 9(f2) (GFRP) exhibits elevated carbon peaks and traces of iron and chromium, indicating residual matrix breakdown and adhesive interactions with the steel counterface.
Taken together, the SEM and EDS results for the 70% reinforced samples clearly confirm that BFRP maintains a cleaner, more stable tribological interface, effectively resisting thermal and mechanical damage. The dense fiber architecture and enhanced thermal conductivity of basalt fibers allow for better structural cohesion and minimal third-body generation, making BFRP particularly suited for high-load, high-speed dry sliding applications.
Beyond the morphological differences described above, localized EDS analysis provided further insight into the chemical degradation mechanisms across all fiber contents (
Figure 7,
Figure 8 and
Figure 9 (b1–f2)). In GFRP samples, particularly at lower reinforcement levels, EDS spectra revealed high carbon content and strong signals of silicon and oxygen, indicating matrix fragmentation and extensive glass fiber exposure. The presence of iron and chromium also confirmed mild material transfer from the steel counterface, suggesting adhesive interactions and unstable tribolayer formation.
In contrast, BFRP samples exhibited more balanced elemental distributions. At 65% and 70% reinforcement, the EDS maps showed dominant signals from basalt constituents (Si, Al, and O) with minimal carbon or metallic contamination. This indicates limited resin degradation and a stable, low-adhesion contact interface, especially in the BFRP 70% configuration.
These findings confirm that wear mechanisms are closely linked to both fiber architecture and thermal stability. The superior behavior of BFRP can be attributed to its enhanced fiber–matrix cohesion, reduced adhesive wear, and the formation of more consistent tribofilms, which collectively contribute to lower wear rates and smoother friction profiles, as previously observed in
Figure 4,
Figure 5 and
Figure 6.
The dominant wear modes identified across all specimens include matrix delamination, fiber pull-out, micro-abrasion, and varying degrees of transfer film formation, each of which is modulated by fiber type and content. These observations strongly reinforce the quantitative findings and position BFRP composites, especially at 70% reinforcement, as mechanically and thermally more resilient under dry sliding conditions. Across all reinforcement levels, BFRP exhibited more cohesive surface behavior with reduced fiber pull-out, supporting a consistent wear mechanism less dependent on fiber volume fraction. The SEM/EDS analysis in this study focused on qualitative identification of wear mechanisms. Future work will incorporate quantitative image analysis to provide metrics such as fiber pull-out density, crack propagation length, and debris particle size distributions, which would further strengthen the mechanistic interpretation.
3.2.5. Transfer Layer Formation and Counterface Behavior
As shown in
Figure 10, the condition of the steel counterface (52,100 balls) after sliding against the composite discs reveals critical differences in transfer layer formation between GFRP and BFRP materials. EDS analysis of the ball surfaces highlights the extent and composition of wear-induced material transfer, which is closely linked to the composite structure and thermal stability.
After sliding against GFRP 50%, the steel ball exhibited extensive surface contamination. EDS spectra revealed strong peaks of iron (Fe) and chromium (Cr) from the ball itself, but also significant signals of silicon (Si), oxygen (O), and aluminum (Al) from the glass fibers and matrix, as well as carbon (C) deposits from the degraded epoxy resin. This composition confirms the formation of a heterogeneous, unstable tribolayer composed of fragmented matrix and fiber debris, leading to potential secondary abrasion and increased COF variability.
In contrast, the ball tested against BFRP 70% showed minimal residue and very weak or absent signals for Si, Al, and C. This clean surface condition indicates a low-adhesion interface and minimal third-body generation, reflecting the thermal stability and cohesive integrity of the basalt-reinforced composite. The sample corresponding to BFRP 65% exhibited intermediate behavior, with only light traces of fiber–matrix components.
The correlation between transferred material and composite performance is clear: greater material transfer in GFRP—especially at lower fiber contents—confirms more aggressive wear mechanisms, higher matrix ejection, and poor tribolayer stability. In contrast, BFRP promotes a more stable friction pair, with limited debris formation and efficient control of interfacial heat and mass flow. This indicates that BFRP systems are better suited for applications requiring extended dry contact without lubrication or frequent maintenance.
These findings reinforce the idea that tribological behavior is not only defined by the composite material but also by its interaction with the counterbody. The wear behavior of the steel ball acts as an indirect yet powerful indicator of interface quality. BFRP composites, particularly at high fiber fractions, exhibit reduced adhesive wear and maintain a cleaner tribological interface—key attributes for long-term durability in dry sliding applications.
In conclusion, the tribological evaluation of GFRP and BFRP composites under dry sliding conditions highlights the strong influence of fiber type and reinforcement level on frictional performance, wear resistance, and thermal stability. Across all tested parameters, BFRP consistently outperformed GFRP, particularly at higher fiber contents (65% and 70%), where it exhibited lower and more stable coefficients of friction, reduced wear rates, and improved thermal control.
The SEM and EDS analyses further confirmed these trends, revealing that BFRP surfaces maintained more cohesive wear tracks, less resin degradation, and fewer signs of fiber–matrix delamination. The steel counterface interactions, as seen in
Figure 10, showed significantly less material transfer in the case of BFRP—indicating a cleaner, more thermally stable interface with reduced adhesive wear.
These findings underscore the key role of basalt fiber architecture and thermal conductivity in preserving the mechanical and chemical integrity of the contact interface. In contrast, GFRP composites—especially at lower fiber contents—suffered from higher interfacial temperatures, unstable tribofilms, and more aggressive third-body interactions.
In conclusion, BFRP composites demonstrate superior tribological behavior under dry sliding, especially when reinforced at 70%. Their ability to limit surface degradation, minimize counterface contamination, and maintain stable friction profiles makes them well-suited for demanding contact applications where durability, heat resistance, and low wear are critical. It should be noted that all tribological tests were performed under a single normal load of 20 N. This load level was selected based on our previous studies [
19,
20], where GFRP and BFRP laminates were tested at 10, 20, and 30 N, demonstrating that 20 N provides a representative moderate load with stable frictional behavior. While this allowed a focused analysis of fiber fraction and sliding speed, tribological performance is strongly load-dependent. Future studies will extend the evaluation to multiple load levels to fully capture load-sensitive wear mechanisms.
In summary, the tribological behavior of BFRP is not only superior in quantitative metrics, but also more predictable and less sensitive to fiber content variations—an advantage in high-variability production environments. The superior tribological behavior of BFRP is primarily associated with its higher thermal conductivity and thermal stability, which limit matrix softening and third-body generation. In addition, improved fiber–matrix interface adhesion likely contributes to reduced fiber pull-out and enhanced frictional stability. A more detailed interfacial characterization will be addressed in future studies to fully elucidate these mechanisms.
3.3. Comparative Results of 3D Surface Profilometry for GFRP and BFRP
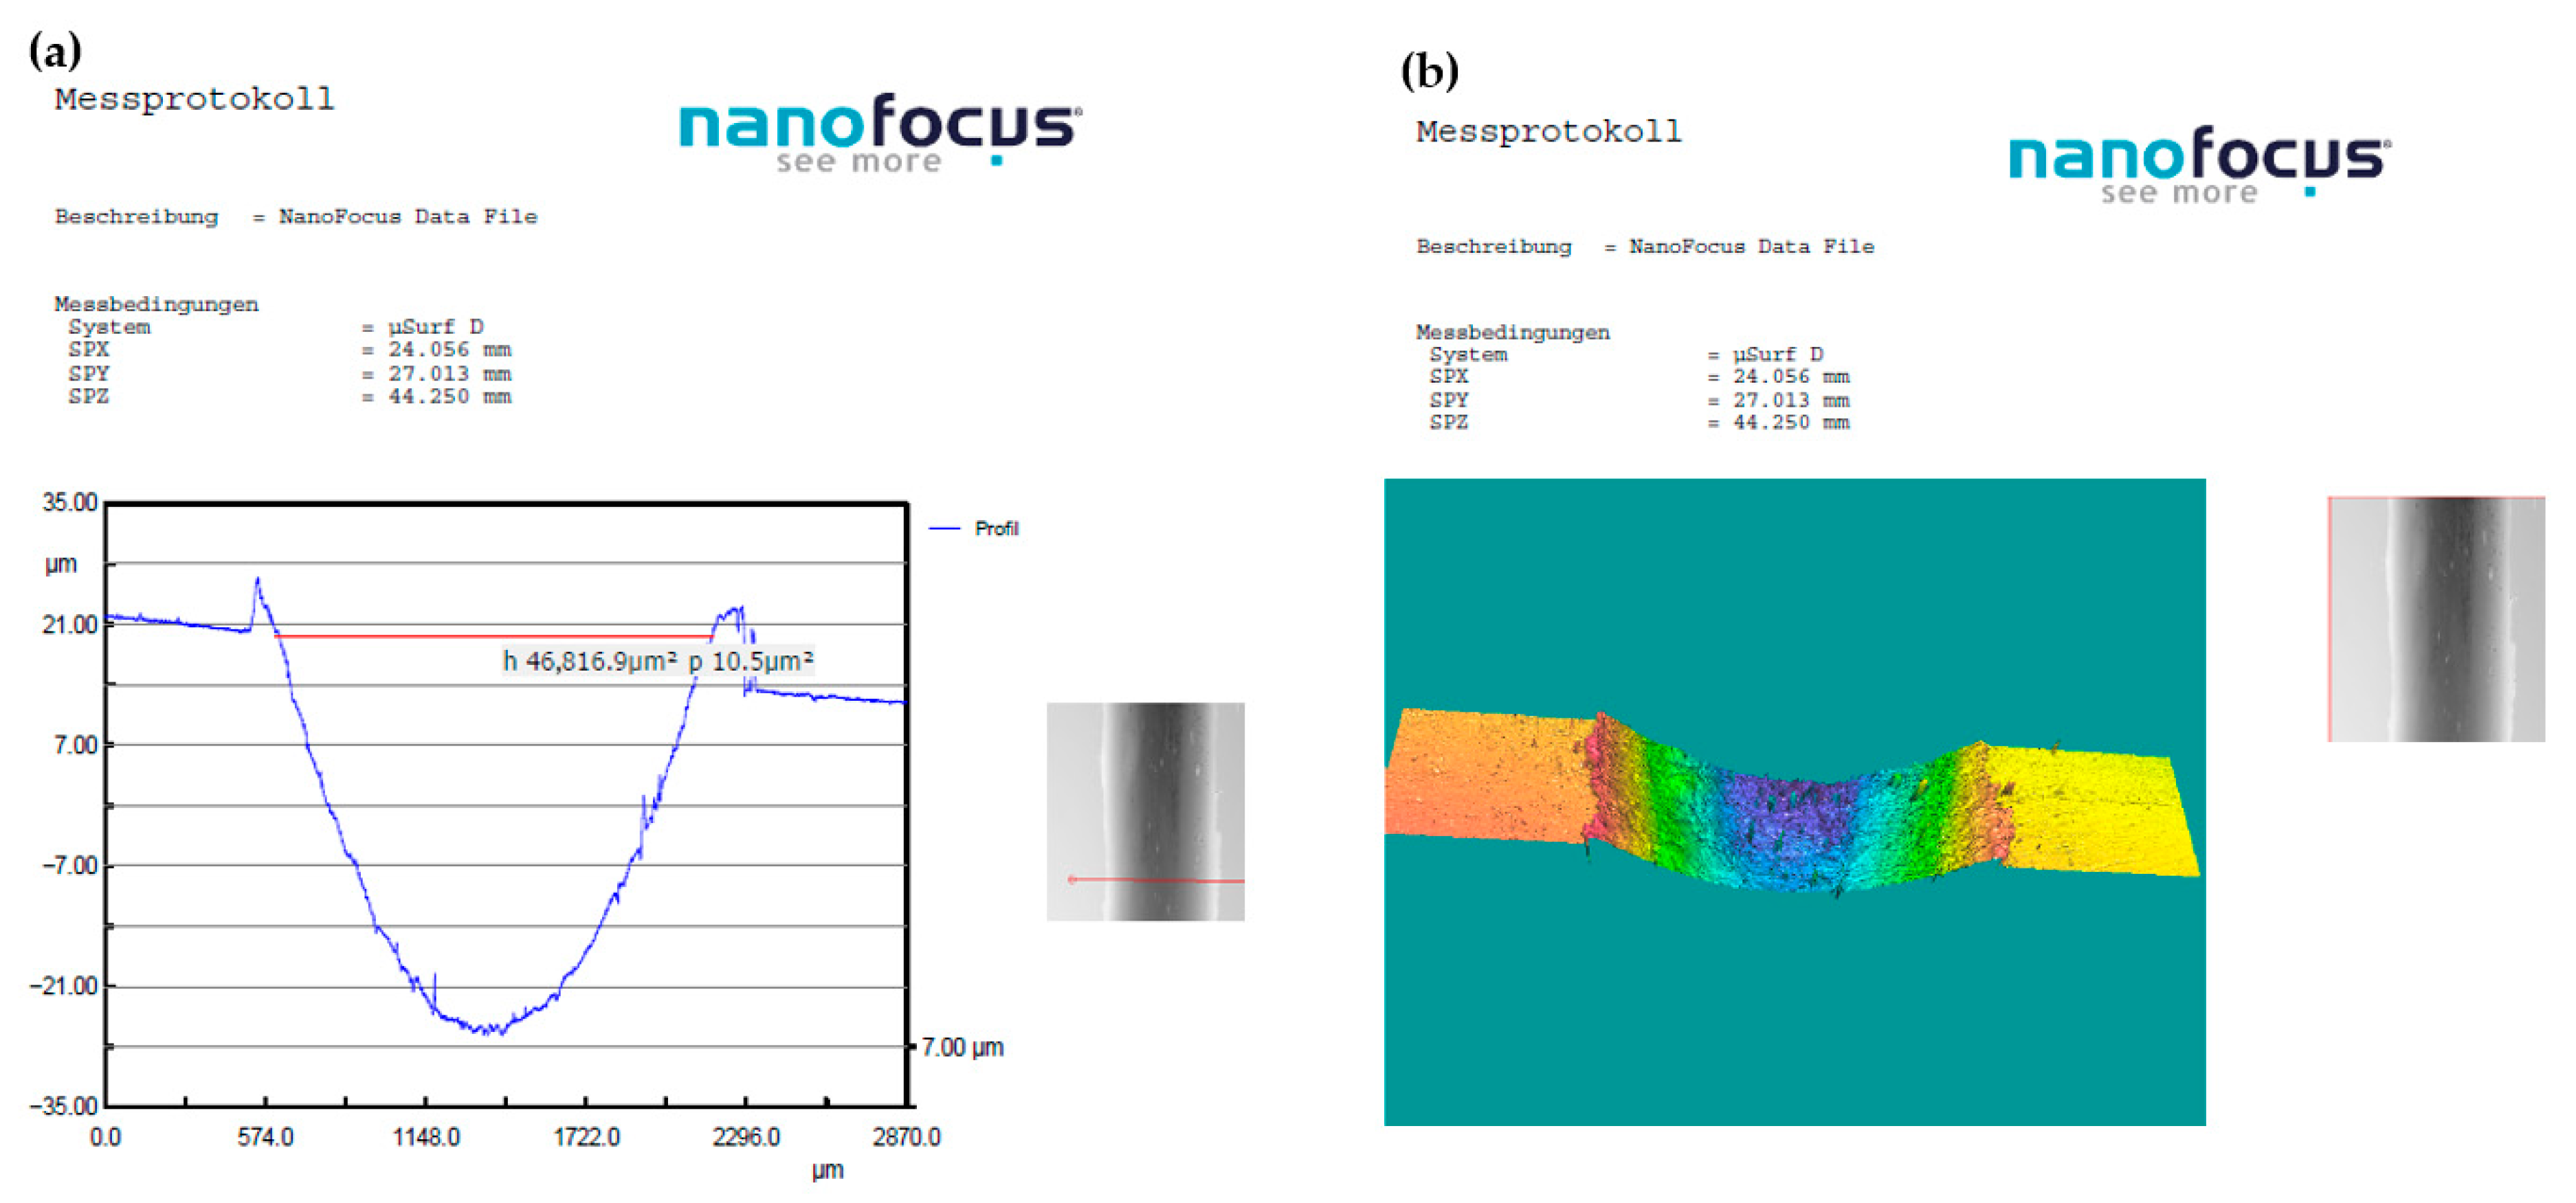
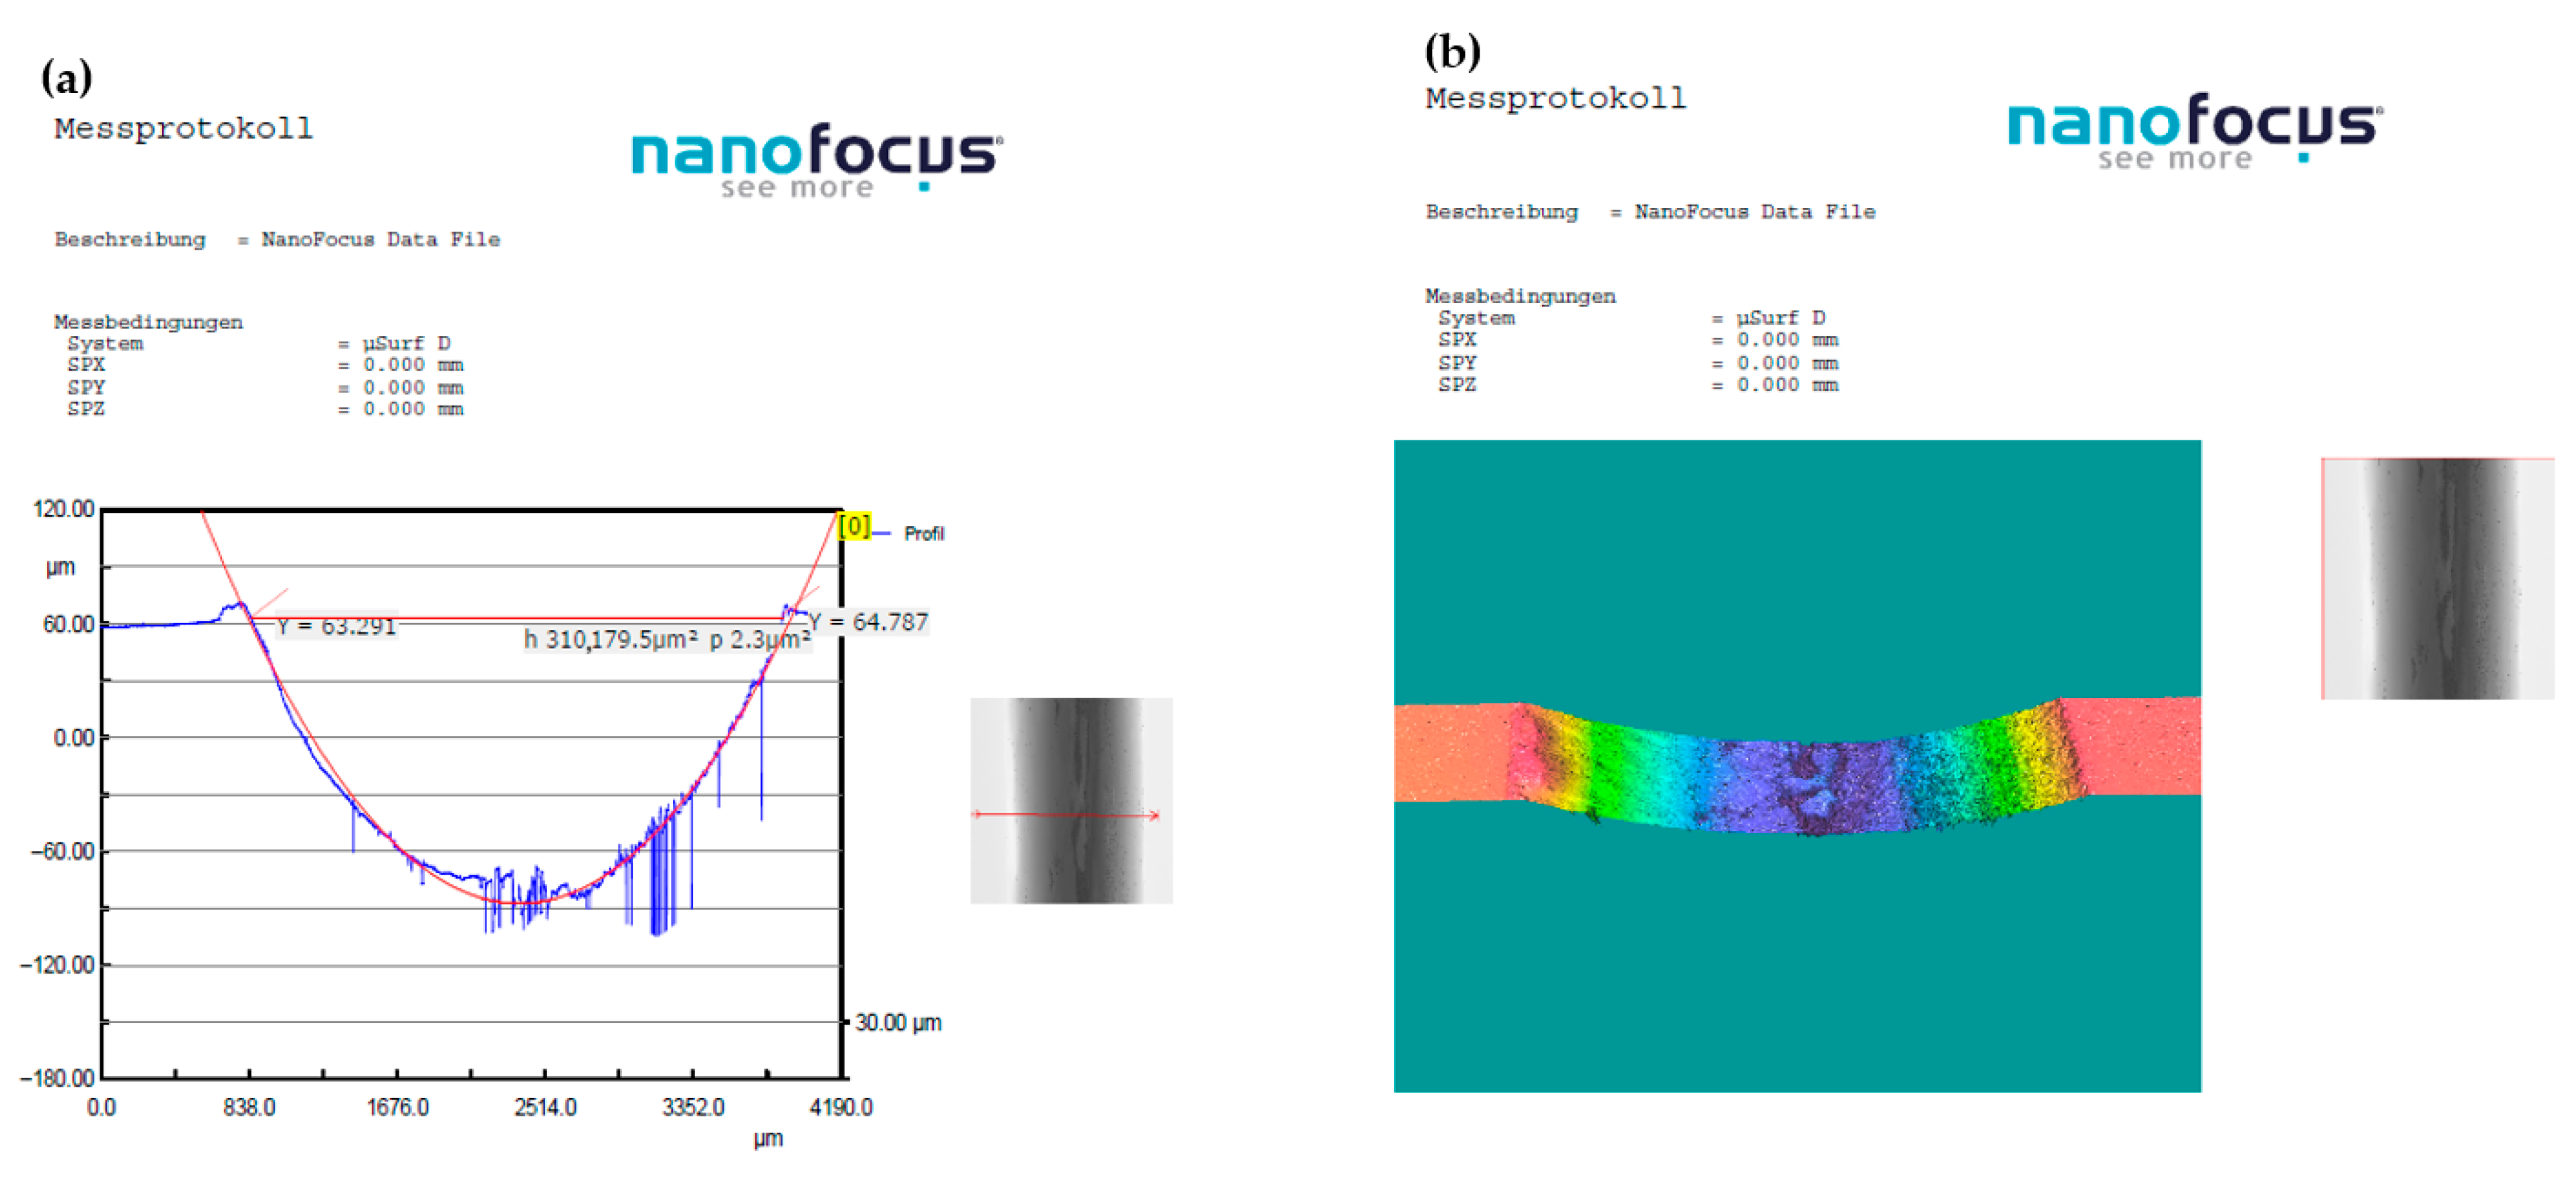
To quantitatively evaluate the extent and nature of wear damage, 3D optical profilometry was employed on the worn surfaces of all disc specimens. The wear volume and surface morphology were measured using a high-resolution Alicona Infinite Focus optical profiler. The profilometry data not only confirmed wear volume differences but also allowed the extraction of average track depth and cross-sectional wear area, which are valuable parameters for tribological modeling. For each tested disc, six radial cross-sections were analyzed at 60° angular intervals along the wear track circumference, ensuring a comprehensive representation of the wear geometry and consistency of the results.
Figure 11 and
Figure 12 present two illustrative examples corresponding to the GFRP 70% and BFRP 70% samples tested under identical conditions: 20 N load, 0.25 m/s sliding speed, and 120 min duration. These images were selected to exemplify the methodology and visualize the contrast in wear response between glass and basalt fiber-reinforced systems. However, it is important to emphasize that profilometric analysis was performed systematically for all six composite configurations (GFRP and BFRP at 50%, 65%, and 70% fiber contents).
In
Figure 11, the surface of the GFRP 70% specimen displays a relatively wide and deep wear track with visible surface irregularities. The corresponding profile in
Figure 9 highlights the non-uniform geometry and the presence of several localized valleys, suggesting microfractures and debris ejection as dominant wear features.
In contrast, the BFRP 70% sample (
Figure 12) exhibits a markedly smoother wear scar with reduced depth and a more uniform curvature. The profile line is less jagged and lacks the sharp troughs seen in the GFRP specimen, indicating better wear resistance and reduced material removal.
Across all tested samples, profilometric data showed that wear depth and cross-sectional area decreased consistently with increasing fiber content, with BFRP specimens exhibiting lower average wear volumes than their GFRP counterparts at each reinforcement level. These findings correlate directly with the specific wear rate values determined through volume-based calculations and reported in
Table 4.
Moreover, the surface morphology obtained through 3D scanning aligns with the SEM observations, confirming that GFRP samples are more susceptible to ploughing, cracking, and localized matrix loss, while BFRP surfaces exhibit a more cohesive and abrasion-resistant behavior, especially at higher fiber concentrations.
In summary, the 3D profilometry results not only validate the quantitative wear data but also provide critical spatial insight into how fiber type and fraction affect wear propagation. The GFRP samples show greater surface degradation, while BFRP composites benefit from a smoother, more stable wear morphology, supporting their superior tribological performance under dry contact conditions. These 3D surface features are consistent with the SEM images, where BFRP exhibited fewer microfractures and more uniform matrix integrity along the wear path. BFRP composites benefit from a smoother, more stable wear morphology. Such surface stability is critical in applications where controlled friction and minimal dimensional change are essential, such as precision guides or dry bearings.
3.4. Results of Statistical Analysis
The main statistical analysis results for the response variables are shown in
Table 4. A control factor has a significant influence on the target parameters when the
p-value is lower than the significance threshold of 0.05.
The most significant percentage contribution ratios on the coefficient of friction were 31.36%, obtained for the interaction between FRP type and v, 19.26% for the interaction between wf and v, and 15.85% for FRP type and wf interaction, as is shown in
Table 4. The FRP type, wf, and v factors also had a significant influence on the COF, but they had a lower percentage contribution than the interactions between the factors.
The R-squared values for the statistical models are determined as 99.47% for COF, 92.93% for K, and 96.37% for T (
Table 4). It was concluded that all three models had adequate predictive ability, which is essential for model assessment. Normal probability plots for residuals validated that the Generalized Linear Models for COF, K, and T were adequate. Thus, an example of a residual analysis plot for K is shown in
Figure 13. Similar normal probability plot distributions were determined for COF and T.
The weight fraction showed the most significant impact on the specific wear rate, contributing 22.04%, followed by the FRP at 18.19% and the interaction between FRP type and wf at 18.05%, as is shown in
Table 4. The sliding speed was the most influential factor affecting temperature, contributing to 82.88%. In contrast, the other factors and their interactions had lower contributions to temperature, as shown in
Table 4.
The maximum average values of COF were obtained for GFRP, wf 65%, and a sliding velocity of 0.1 m/s, as shown in
Figure 14a. A decreasing trend for COF in the case of BFRP was observed. Also, a large decrease in COF for sliding speed was determined.
The highest mean values for COF, K, and T were determined for GFRP, which were greater than the mean values obtained for BFRP, as shown in
Figure 14a–c. The lowest mean values of K were observed for BFRP, with a weight fraction (wf) at level 3 (70%), and a sliding speed at level 1 (0.1 m/s), as illustrated in
Figure 14b. The specific wear rate slowly increased, and it decreased with an increase in glass weight fraction.
It was identified that the temperature slowly decreased in the case of BFRP compared with GFRP, as shown in
Figure 14c. Additionally, it was observed that the temperature increased as the sliding speed increased.
The interval plots with standard error bars for each fiber type (FRP) in relation to the COF, K, and T are presented in
Figure 15. The difference between the means for K was significant because the interval bars had only a small overlap (
Figure 15b). The differences between the means for COF and T were probably not significant because all the interval bars overlapped (
Figure 15a,c).
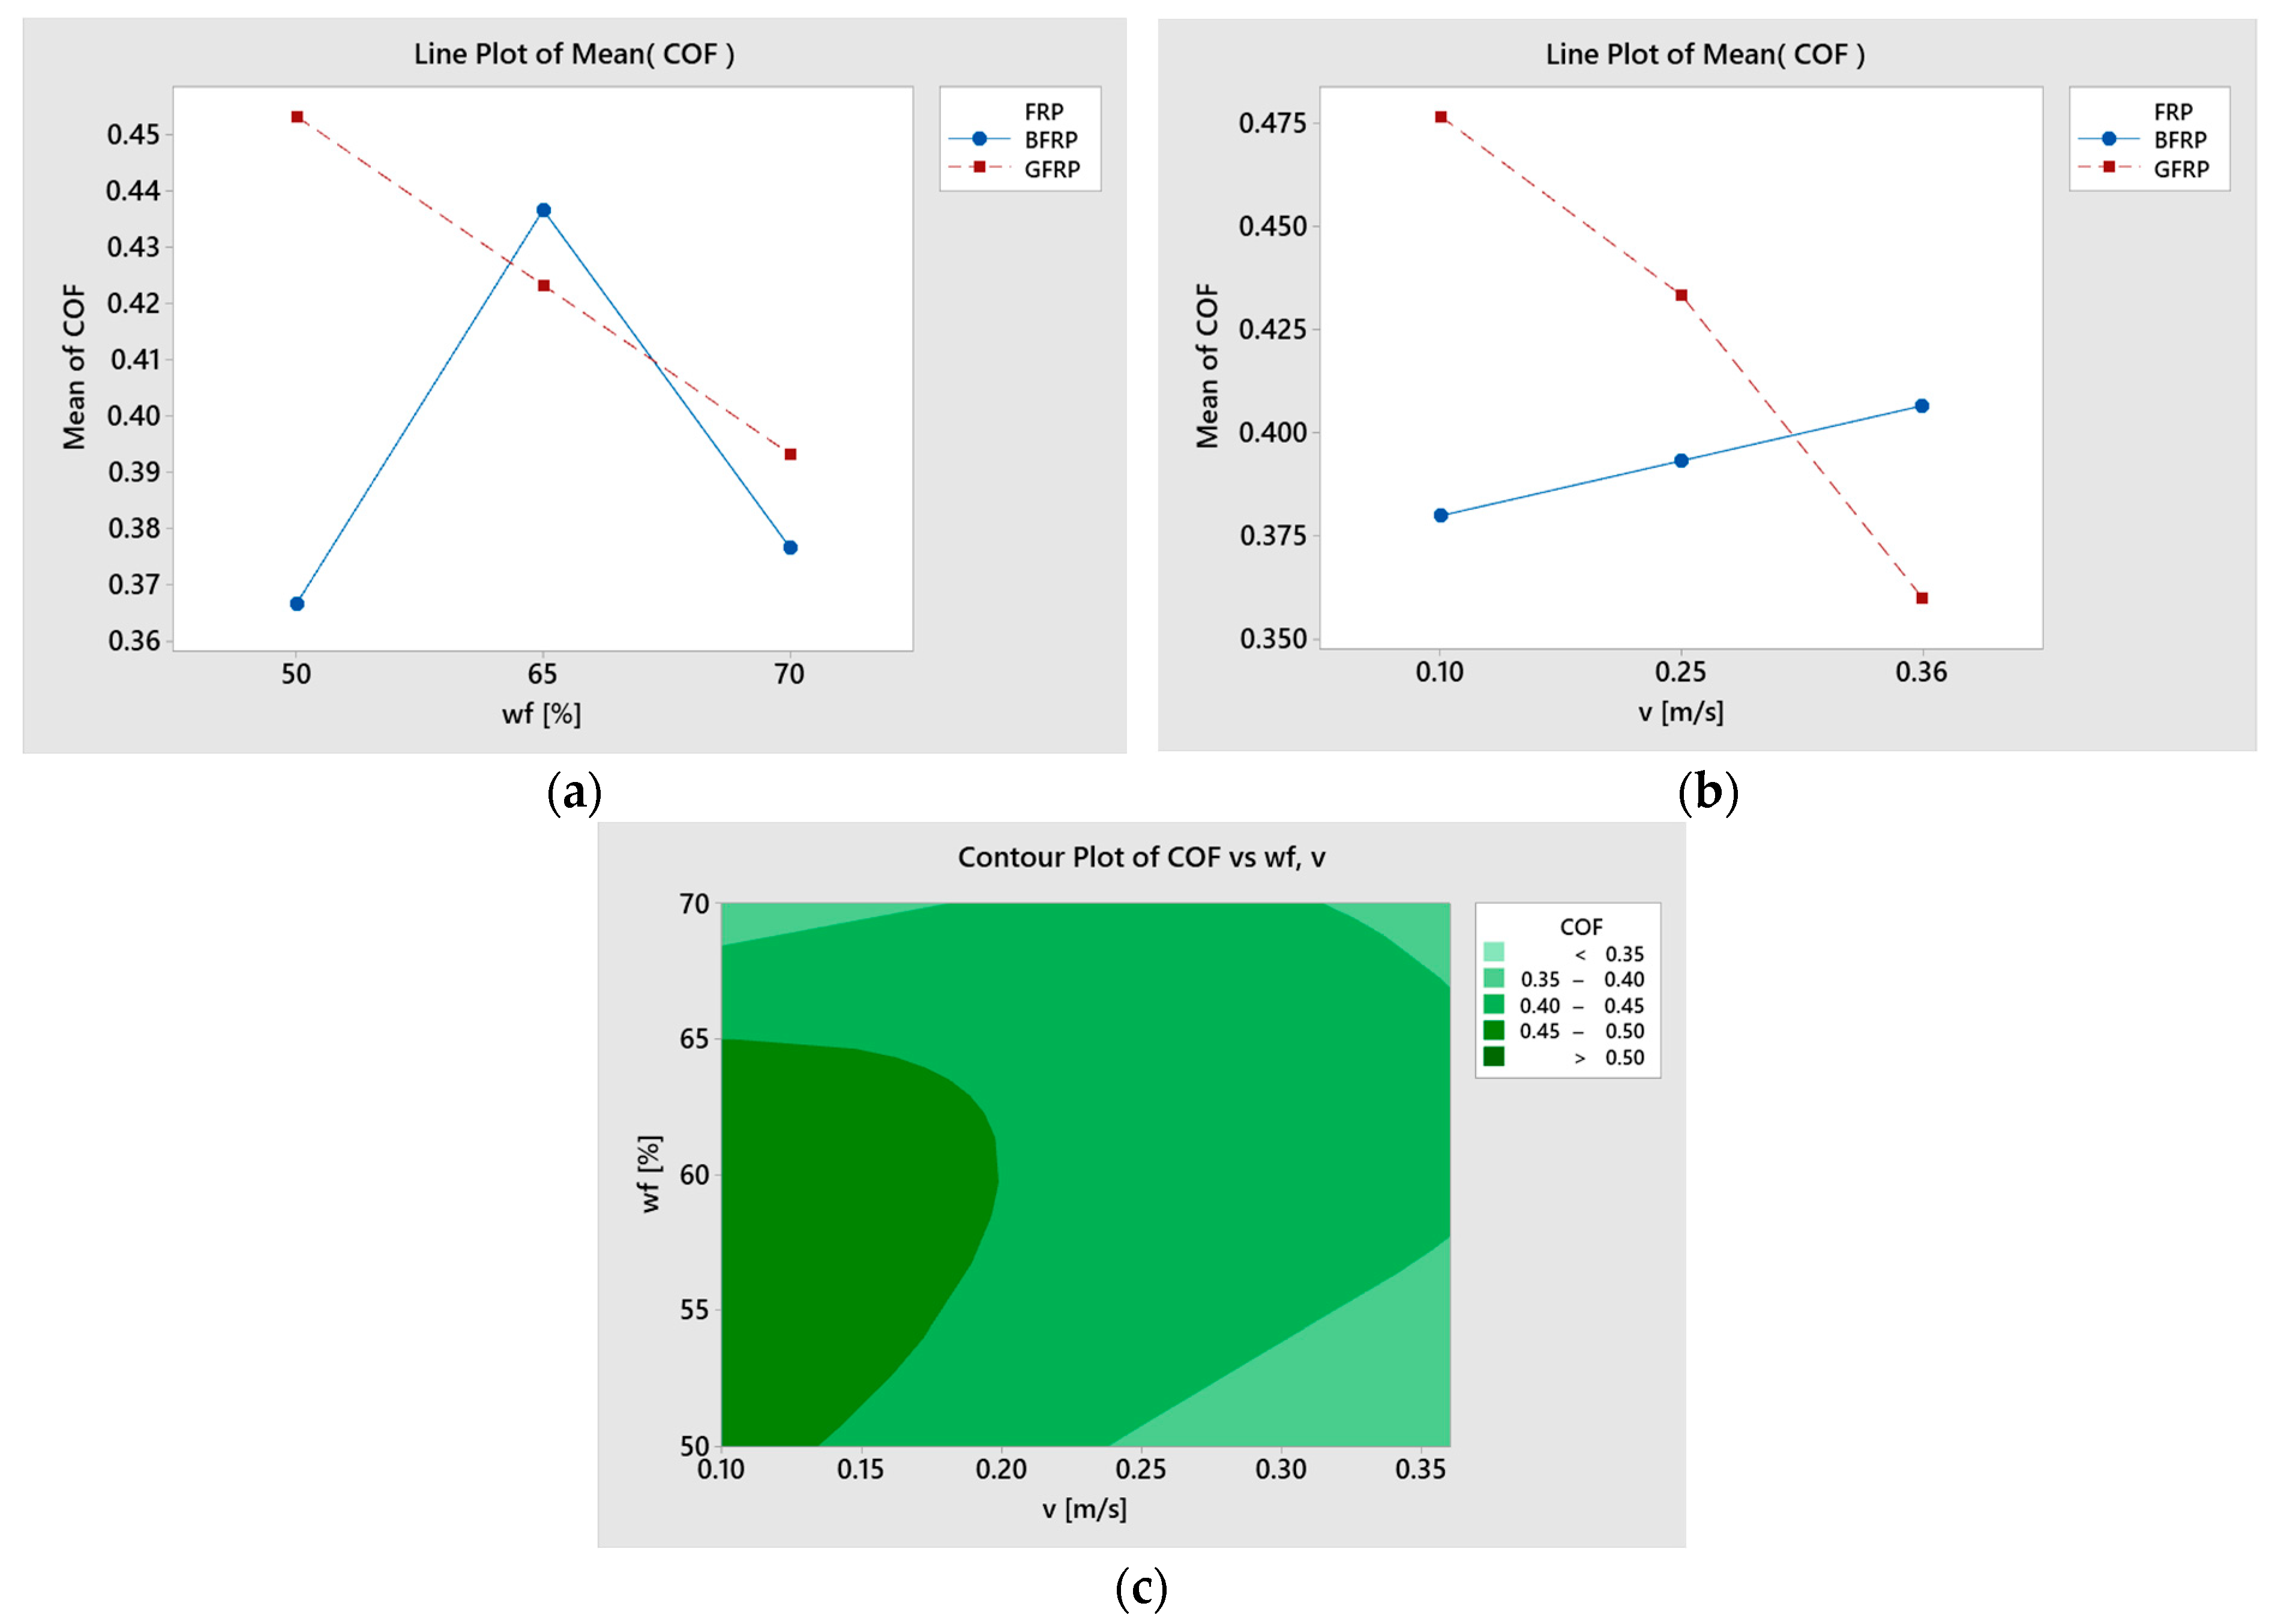
The interaction between FRP type with sliding speed, and FRP type with wf had a significant effect on the coefficient of friction, as illustrated in
Figure 16a,b.
Figure 16c illustrates the predicted behavior of the COF as a contour plot function of parameters, weight fraction (wf), and sliding speed (v).
Interaction effects were less prominent for the specific wear rate; a small interaction was detected at level 3 of wf (70%), as seen in
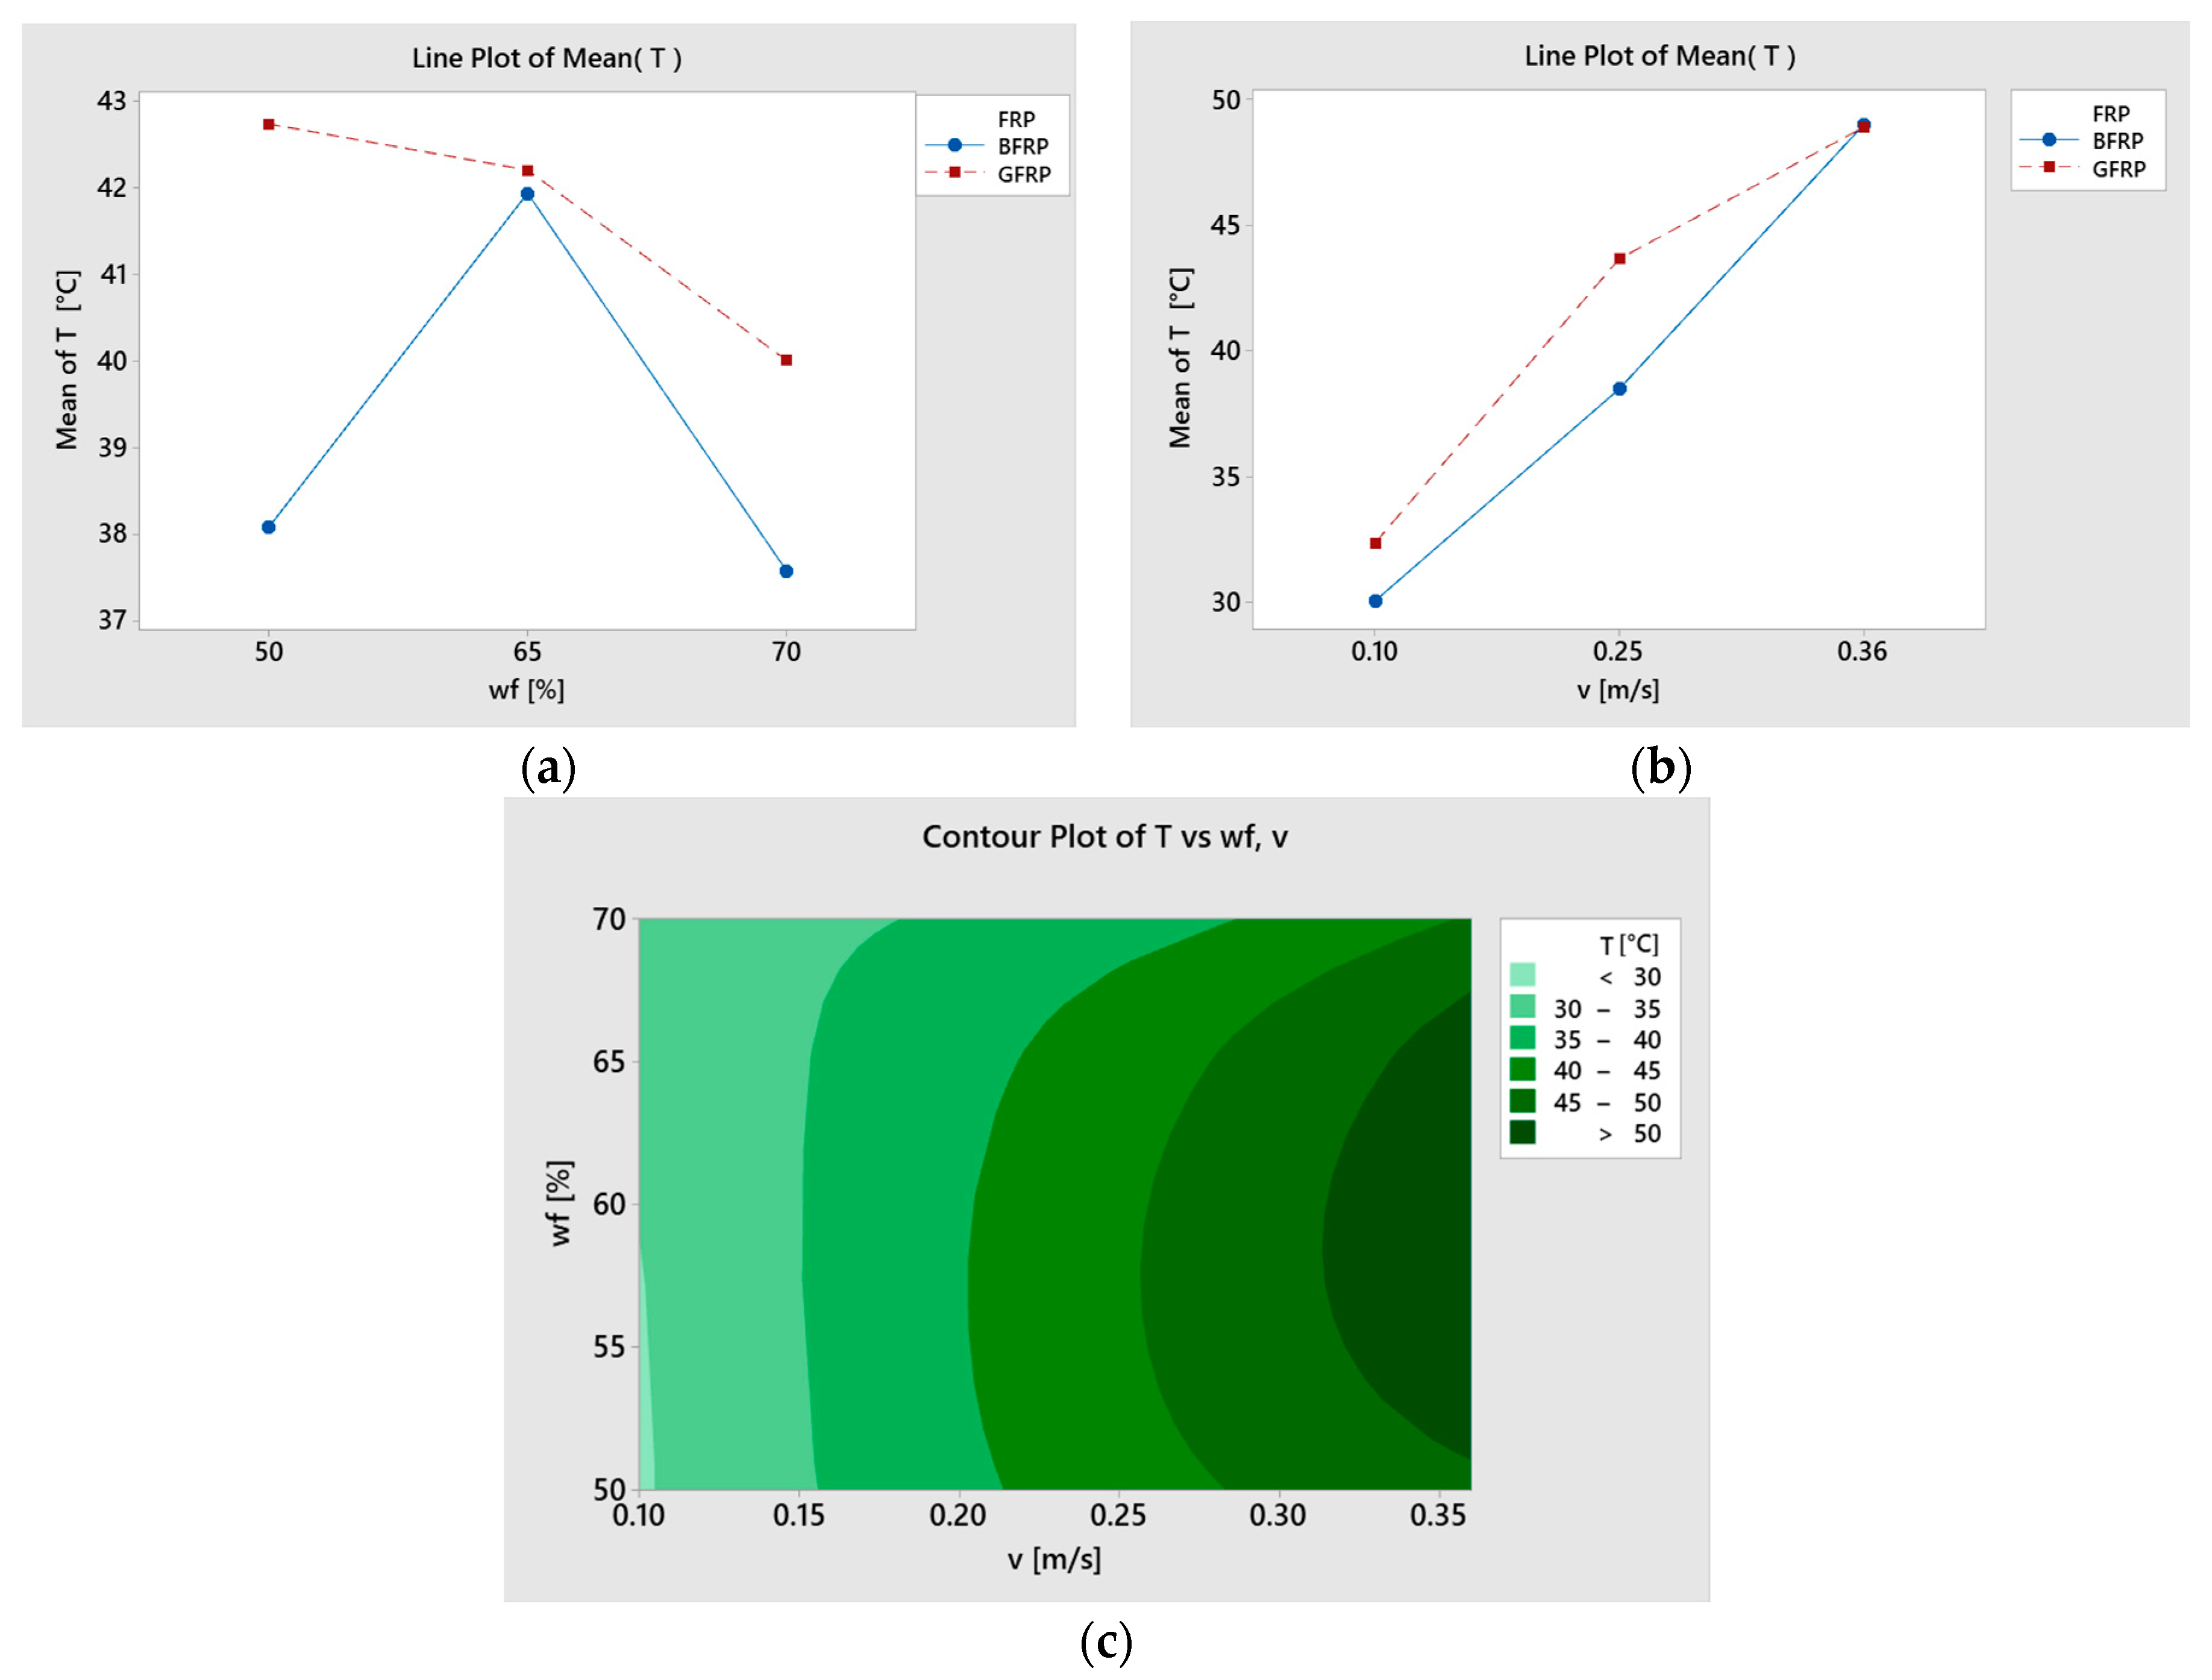
Figure 17a,b. No interactions were detected in the case of the temperature, as is illustrated in
Figure 18a,b, and confirmed in
Table 4.
Figure 16a,b illustrate the interaction effects between the fiber type (FRP) and two key control factors: sliding speed (v) and fiber weight fraction (wf), with respect to the coefficient of friction (COF). The plots reveal that both interactions are statistically significant, as previously confirmed by the ANOVA results (
Table 4,
p < 0.05). Notably, the interaction between FRP type and sliding speed shows a pronounced divergence in COF behavior: while GFRP maintains higher COF values at low and moderate speeds, BFRP exhibits a substantial reduction in COF, particularly as speed increases.
In
Figure 16b, the interaction between FRP type and fiber content (wf) suggests that COF decreases with increased reinforcement, especially for BFRP, which displays better frictional performance at 70% fiber content. Conversely, GFRP shows less consistent behavior, with higher COF values even at increased wf levels.
The contour plot in
Figure 16c further emphasizes these trends, showing that the lowest predicted COF values occur in the region combining high fiber content (wf = 70%) and high sliding speed (v = 0.36 m/s), especially for BFRP. These contour plots provide design engineers with a straightforward visual tool for parameter selection based on desired tribological outcomes. This graphical prediction supports the earlier experimental results and confirms that optimizing both reinforcement and speed parameters is critical for minimizing friction.
Figure 17a,b depict the interaction effects of the same factors (FRP type × wf and FRP type × v) on the specific wear rate (K). Unlike in the COF case, these interactions are less pronounced and were not statistically significant according to the ANOVA
p-values (
Table 4). However, a minor interaction is visible at the highest fiber content level (wf = 70%), where BFRP consistently shows lower wear rates than GFRP across all conditions.
The contour plot in
Figure 17c supports this observation, identifying BFRP 70% combined with low sliding speed (0.1 m/s) as the region of lowest wear rate prediction. This aligns with experimental data in
Figure 5 and confirms that basalt fiber reinforcement offers superior wear resistance, particularly when fiber content is maximized and speed is minimized.
Figure 18a,b demonstrate the interaction effects for surface temperature. As confirmed by the statistical analysis in
Table 4, no significant interactions were detected (
p > 0.05 for all combinations), and this is clearly reflected in the flat or nearly parallel curves of the interaction plots. Both fiber type and fiber content have minimal influence on temperature compared to sliding speed, which dominates the temperature response (with a contribution of 82.88%).
In the contour plot shown in
Figure 18c, the highest predicted temperatures occur at high sliding speeds, regardless of fiber content or material type. However, BFRP tends to produce slightly lower temperatures, which are overall consistent with its higher thermal conductivity and more efficient heat dissipation capacity.
Figure 16,
Figure 17 and
Figure 18 confirm that COF is strongly affected by interactions, especially between fiber type and sliding speed, while wear rate (K) shows more modest interaction effects. Temperature (T) is dominated almost exclusively by sliding speed, with limited contribution from other factors. These statistical insights reinforce and validate the experimental observations discussed in previous sections.
The statistical evaluation confirms the critical role of interaction effects in determining the tribological behavior of GFRP and BFRP composites. Among all parameters, the interaction between FRP type and sliding speed was found to be the most influential factor affecting the coefficient of friction, with a contribution of 31.36%. The influence of fiber content (wf) and its interactions was also notable, especially in minimizing COF when combined with basalt reinforcement and high fiber loading.
For the specific wear rate, the fiber content itself was the dominant factor, contributing 22.04% to the observed variability. While interaction effects were less significant, the results confirm that BFRP at 70% fiber content remains the most wear-resistant configuration.
In the case of temperature, the analysis revealed a clear dominance of sliding speed, accounting for over 82% of the total variation, while other factors had negligible influence. This underscores the importance of speed control in managing thermal stability during dry sliding.
The main effects plots, interaction plots, and contour predictions presented in
Figure 14,
Figure 15,
Figure 16,
Figure 17 and
Figure 18 provide a consistent visual validation of the numerical ANOVA results. Together, they highlight that optimized combinations of fiber type, reinforcement level, and sliding conditions are essential for enhancing frictional performance, reducing wear, and controlling heat generation in polymer composite systems. Overall, the statistical analysis confirms that tribological performance is governed not only by material selection, but also by the interplay between reinforcement content and operating conditions. These findings support the integration of statistical design tools in the early stages of composite component development.


