Article

Kinetic Analysis of Thermal Degradation of Styrene–Butadiene Rubber Compounds Under Different Aging Conditions

1
Department of Biochemistry, Chemistry, Physic and Forensic Science, Université du Québec à Trois-Rivières (UQTR), 351 Boulevard des Forges, Trois-Rivières, QC G8Z 4M3, Canada
2
Laboratory of Advanced Materials for Energy and Environment, Université du Québec à Trois-Rivières (UQTR), 3351 Boulevard des Forges, Trois-Rivières, QC G8Z 4M3, Canada
3
Hydro-Québec Research Center, 1800, Boul. Lionel Boulet, Varennes, QC J3X 1S1, Canada
*
Author to whom correspondence should be addressed.
J. Compos. Sci. 2025, 9(8), 420; https://doi.org/10.3390/jcs9080420
Submission received: 3 July 2025 / Revised: 28 July 2025 / Accepted: 28 July 2025 / Published: 6 August 2025
(This article belongs to the Special Issue Mechanical Properties of Composite Materials and Joints)

Abstract

This study examined the impact of storage and operational aging on the thermal stability, structural degradation, and electrical properties of styrene–butadiene rubber (SBR) compound by analyzing three distinct materials: a laboratory-stored sample, an operationally aged one, and an original unaged reference. Thermal degradation was analyzed through thermogravimetric analysis (TGA), which examined weight loss as a function of temperature and time at different heating rates. Results showed that the onset temperature and peak position in the 457 °C to 483 °C range remained stable. The activation energy (Ea) was determined using the Kissinger–Akahira–Sunose (KAS), Flynn–Wall–Ozawa (FWO), and Friedman methods, with the original unaged sample’s (OUS) Ea averaging 203.7 kJ/mol, decreasing to 163.47 kJ/mol in the laboratory-stored sample (LSS), and increasing to 224.18 kJ/mol in the operationally aged sample (OAS). The Toop equation was applied to estimate the thermal degradation lifetime at a 50% conversion rate. Since the material had been exposed to electricity, the evolution of electrical conductivity was studied and found to have remained stable after storage at around 0.070 S/cm. However, after operational aging, it showed a considerable increase in conductivity, to 0.321 S/cm. Scanning Electron Microscopy (SEM) was employed to analyze microstructural degradation and chemical changes, providing insights into the impact of aging on thermal stability and electrical properties.

1. Introduction

Styrene–Butadiene Rubber (SBR) is a synthetic rubber copolymer crafted from styrene and butadiene. It stands out as one of the most widely used synthetic rubbers, owing to its exceptional properties and adaptability [1,2,3]. SBR offers outstanding abrasion resistance, stability over time, and elasticity, making it a perfect fit for a diverse array of applications, including the production of automobile tires, conveyor belts, gaskets, hoses, and shoes. In addition, SBR offers excellent heat, cold, and moisture resistance, although its resistance to oil and chemicals is not as robust as other synthetic rubbers. In some cases, rubbers are used to conduct electricity, facilitated by the presence of carbon black, a conductive material. When added to rubber, it forms a network of conductive particles within the rubber matrix [4,5]. This can transform the normally insulating rubber into a semiconducting or even conducting material, depending on the concentration of carbon black. Other additives are present in these industrial samples, such as silica, which is often used as a reinforcing filler, anti-oxidant and anti-resonant agents, oils added to improve flexibility, and vulcanizing agents and their acceleration agents, which can modify the crosslinking of rubber [6,7,8].
Thermal stability studies, which analyze how elastomers respond to temperature changes, play a key role in understanding their degradation patterns and lifespan [9]. These studies are often conducted using TGA methods to evaluate weight loss and changes in material composition at different temperatures [10,11]. By comprehensively understanding the thermal stability of elastomers, manufacturers can improve product formulations, enhance durability, and ensure safety in critical applications. This knowledge is vital for developing materials that can withstand the demanding conditions of various industrial and consumer environments.
Several studies have examined the thermal stability of elastomers to estimate their lifetime of thermal degradation. Researchers have utilized various analytical techniques, such as those by Tuhin et al., to investigate the high-temperature degradation of butadiene-based model elastomers, specifically polybutadiene (BR) and SBR, using reactive molecular dynamics simulation (ReaxFF). This study aims to understand these elastomers’ thermal degradation mechanisms and activation energies under extreme service conditions [12]. In line with these efforts, Huda Alfannakh et al. and Guanqun Luo et al. investigate the thermal stability and decomposition behavior of polymeric materials using additives to enhance stability and promote the formation of value-added products. The first article examines the impact of lead on the thermal stability of ethylene–propylene–diene monomer (EPDM) rubber composites, while the second article studies the effect of calcium oxide (CaO) on the pyrolysis of waste tires [13]. These additives, which are not limited to rubber applications, modify various polymeric materials to improve thermal stability, accelerate depolymerization, and promote the formation of valuable chemicals. Both studies employ TGA to assess thermal decomposition and utilize iso-conversional kinetic models, such as the OFW, KAS, and Friedman methods, to evaluate the reaction kinetics.
Furthermore, in another study on the thermal stability of Nitrile Butadiene Rubber (NBR), Syam Prasad Ammineni et al. examined the effects of physical aging on its viscoelastic properties using dynamic mechanical analysis (DMA) and TGA [14]. The results showed a significant decrease in activation energy, from 529.77 kJ/mol in virgin NBR to 280.15 kJ/mol in aged NBR, indicating reduced thermal stability. This degradation was attributed to the breakdown of polymer chains over time affecting the material’s structural integrity and damping capabilities.
To further explore the application of iso-conversional methods in analyzing thermal degradation, Draksharapu Rammohan et al. investigated the kinetics and thermodynamics of the pyrolysis of butyl rubber waste under nitrogen gas from 25 to 1000 °C, using five iso-conversional approaches. Their findings revealed a multistep degradation process involving various reaction models, and allowed a detailed estimation of thermodynamic parameters such as activation energy, enthalpy, and Gibbs free energy [15].
In addition to kinetic modeling, recent studies have emphasized the importance of understanding the chemical and structural changes during aging. Bahrololoumi et al. proposed a physically-based model that couples thermo-oxidative and hydrolytic aging with diffusion–reaction mechanisms in elastomers. Johlitz et al. developed a finite strain thermodynamic framework to describe oxidative aging by tracking changes in internal variables such as chain scission and crosslinking. These works underscore the complexity of aging, which involves competing mechanisms including oxidation, gas evolution, and molecular scission, ultimately altering the network structure and mechanical properties of rubber [16,17].
Moreover, the incorporation of lignocellulosic fillers has attracted increasing interest, due to their environmental benefits and their role in reducing fire hazards and toxic emissions. Rybiński et al. demonstrated that partial replacement of carbon black with natural fillers like beech wood and miscanthus not only reduces flammability and smoke density, but also lowers the emission of toxic compounds such as PCDD/Fs and PAHs. These developments align with the need for greener, recyclable rubber composites, and reinforce the importance of holistic material characterization [18].
Despite these advances, the long-term thermal and structural stability of SBR samples aged over decades under industrial storage or service conditions remains insufficiently documented. The thermal stability of an SBR elastomer sample, compounded with carbon black and other additives, has not yet been thoroughly investigated in this context. Therefore, this study examines the effect of 25 years of laboratory storage and operational aging on the thermal and kinetic stability of the material. Additionally, we analyzed changes in electrical conductivity and explored the mechanisms of decomposition and degradation in the samples. While the present article focuses primarily on thermal, kinetic, and electrical aspects, a complementary study dedicated to mechanical performance, including tensile properties, crosslink density, and hardness, is currently being developed. These additional results will be reported in a subsequent publication. This research also aims to statistically compare different iso-conversional models, to optimize the interpretation of the results and propose practical implications for future reuse of industrially stored elastomers.

2. Materials and Methods

2.1. Materials

In this study, three industry-supplied samples of styrene–butadiene rubber (SBR) were analyzed in depth to assess their composition and performance under different conditions. These cylindrical samples were meticulously prepared in small pieces and homogenized using a standardized method to ensure uniformity and representativeness of the bulk material. Precise preparation involved cutting the samples into small pieces and homogenizing them in a controlled environment to avoid any premature degradation or alteration.
  • Original Unaged Sample (OUS): This baseline sample represents the original material in its unaltered, as-supplied state, and serves as a control to identify property changes due to aging.
  • Laboratory-Stored Sample (LSS): Stored for 25 years under controlled laboratory conditions (23 °C ± 2 °C, 50% ± 5% relative humidity, and 1 atmosphere pressure), this sample was used to study the effects of natural, long-term aging without exposure to operational stressors.
  • Operationally Aged Sample (OAS): Exposed over 25 years to high-voltage electrical installations, this sample experienced continuous thermal fluctuations due to seasonal temperature changes and mechanical vibrations caused by wind, providing insights into material behavior under real-world operational stresses.
SBR is generally composed of styrene and butadiene polymers, the exact ratios of which remain confidential due to industrial restrictions. However, it is usually accepted that variations in these ratios can significantly impact rubber properties such as elasticity, tensile strength, and resistance to wear and tear. A higher butadiene content tends to increase elasticity and decrease hardness, while a higher styrene content improves the rubber’s strength and tensile resistance.
Preliminary GC-MS analyses were conducted prior to this study, to establish a baseline for the composition of the SBR samples, identifying several key additives crucial for enhancing the material’s performance. These analyses revealed the presence of diethylene glycol butyl ether, which serves as a crosslinking agent to significantly improve the material’s resilience and elasticity. Additionally, antioxidants such as BHT (butylated hydroxytoluene) and phenol (4-tert-butyl-2-phenyl) were found to effectively protect the polymer against thermal and oxidative degradation, thus extending the product’s lifespan. The use of di-n-octyl phthalate and stearic acid as plasticizers and activators, respectively, also contributes to the material’s flexibility and facilitates its process ability during vulcanization. The initial GC-MS findings provided essential data that informed the experimental design and focus of the current research, ensuring that the study was guided by a comprehensive understanding of the material’s chemical properties [19].

2.2. Thermogravimetric Analysis

Thermogravimetric analysis (TGA) was performed using the TA Perkin Elmer STA 8000 STA 8000 analyzer (PerkinElmer Inc., Waltham, MA, USA) under an inert gas flow of 20 mL/min. The measurements were conducted at various heating rates of 5, 10, 25, 20, and 25 °C/min. The sample weight ranged between 5 to 10 mg for each measurement.

2.3. SEM/EDX Analysis

The microscopic analysis was carried out using the Hitachi VP-SEM SU1510 scanning electron microscope (SEM) coupled with an Oxford Instruments (Abingdon, UK) X-Max 20 mm2 energy-dispersive X-ray spectroscopy (EDX) column.

3. Theoretical Approach

3.1. Thermal Kinetic Analysis

Thermal kinetic models are often based on the Arrhenius Equation (1) as a fundamental starting point. However, modified versions of this equation offer the flexibility needed to handle more complex real-world systems. These adaptations are essential for accurate predictions and a thorough understanding of thermal degradation processes [16].
K = A     e E a R T
where k is the rate constant of the reaction, A is the frequency factor or pre-exponential factor, Ea is the Ea, the minimum energy required for the reaction to occur, R is the universal gas constant, equal to 8.314 J mol−1K−1, and T is the absolute temperature in Kelvin (K).
The conversion function f(α) shown in Equation (2) describes the dependency of the reaction rate on the extent of conversion (α). For an n-th order reaction, the conversion function is given by
f α = ( 1 α ) n
In Equation (3), the rate of conversion ( d α d t ) is directly proportional to the conversion function f(α). This means that the rate of conversion for an n-th order reaction is
d α d t = k T     1 α n
It represents how quickly the conversion process is occurring at any given moment, and indicates the change in the extent of conversion (α) over time. The temperature-dependent rate constant k(T) incorporates the effect of temperature on the reaction rate. According to the Arrhenius Equation, k(T) increases with temperature, which in turn increases the rate of conversion [17,18]. To fully understand the reaction progress over time, we often need to integrate the differential form of the reaction rate. The integral form, shown in Equations (4) and (5), represents the accumulated progress of the reaction from the start (0) to a given extent of conversion (α).
Using the differential form of the reaction rate, f(α), which describes how the rate of conversion ( d α d t ) depends on the extent of conversion (α), to obtain the integral form g(α), we integrate 1 f ( α ) with respect to α from 0 to α. The integral form is defined as
g α = 0 α 1 f ( α ) d α
Substituting f (α) with (1 − α)n, we get
g α = 0 α 1 1 α n d α  

3.2. The Kissinger–Akahira–Sunose (KAS) Method

The KAS model is a practical approach frequently employed in the field of materials science to determine the Ea involved in a thermal decomposition process. It is particularly utilized for assessing data obtained from various temperatures using techniques like TGA [19]. With the KAS Equation (6), we can plot the l n ( β T 2 ) against   1 T for various degrees of conversion where β is the heating rate and T is the absolute temperature at a specific conversion point.
ln β T 2 = ln A R g α   E a R 1 T
The slope of the line, which is ( E a R ) , can be determined, thus allowing the Ea calculation. Knowing that R is the universal gas constant, the function g(α) represents the conversion function, which depends on the reaction mechanism and the degree of conversion α [6,19,20].

3.3. The Flynn–Wall–Ozawa (FWO) Method

The FWO method is a thermal analysis technique that can determine the Ea of a chemical reaction without assuming a specific reaction model. This involves performing TGA at different heating rates and measuring the temperature at which particular levels of degradation occur. The method then applies the FWO Equation (7) to these temperatures to calculate the Ea. To do this, plot the logarithm of the heating rate against the reciprocal of the absolute temperature and determine the slope of this curve. The FWO method is commonly used to study thermal degradation kinetics of polymers and other materials [6,20].
ln β = l n [ A E R g α ] 5.331 1.052 E R

3.4. The Friedman Method

The Friedman method is based on the Arrhenius Equation, which relates reaction rates to temperature and Ea. The Friedman Equation (8) can be written as follows:
ln d α d t = ln β d α d T = ln A f α E a R 1 T
The Friedman method is valued for its ability to provide information on the dependence of the Ea on the degree of conversion described by Equation (9). However, since it is a differential method, it is more sensitive to noise in experimental data than the integral method. Therefore, having high-quality TGA data is critical for accurate analysis [21].
α = w 0 w t w 0 w f
w0: the initial weight of the sample before the reaction or thermal analysis begins; wt: the weight of the sample at a given time, t, during the reaction or thermal analysis; wf: the final weight of the sample after the reaction or thermal analysis is complete.

3.5. Lifetime of Thermal Decomposition

The thermal endurance Equation (10) as described in ASTM E1877 (Toop equation) is derived from Arrhenius kinetics and TGA. It is used to calculate the estimated thermal life (tf) of materials based on activation energy (E), temperature (Tf), and heating rate (β) [22].
l o g   t f = E 2.303 R T f + log E R β α
where β is the heating rate, R is the gas constant, and Ea is the activation energy calculated for the degree of decomposition obtained through the iso-conversional models considered as the failure of the material, which, in this case, is 50%. Tf is the chosen service temperature for calculating the lifetime, and ’a’ is a function given by the values   E a R T c (where Tc is the temperature at the percentage of decomposition considered as failure, which is 50% according to numerical-integration constant tables provided in the standard). Finally, tf represents the estimated time to failure of the material, i.e., its service life [23].

3.6. Thermodynamic Analysis

In order to calculate the pre-exponential factor and obtain all the necessary data to calculate the changes in enthalpy, Gibbs free energy, and entropy, we use the Kissinger method. This method utilizes the maximum peak temperature Tm to calculate the overall Ea at different heating rates [6,24,25]. The Kissinger method is represented by the following Equation (11).
ln β T m 2 = ln A R E E R T m
By rearranging this equation, we can isolate and calculate the pre-exponential factor A using Equation (12).
A = β E e x p E R T m R T m 2  
After calculating the pre-exponential factor (A), we can estimate the thermodynamic parameters using the following Equations (13)–(15), including the change in enthalpy (∆H), Gibbs free energy (∆G), and entropy change (∆S), where β is the heating rate, Tm is the temperature corresponding to maximum decomposition, kB is the Boltzmann constant (1.38 × 10²³ J/K), and h is Planck’s constant (6.626 × 1034 J/s).
H = E R T
G = E + R T m l n ( k B T m A h )
S = H G T m

4. Results and Discussion

4.1. Thermal Analysis

The TGA and DTGA curves of OUS, LSS, and OAS are shown in Figure 1. These curves indicate that the onset temperature and peak position in the 450 °C to 480 °C range remained stable over time [6]. The effect of the heating rate on the thermal decomposition behavior of the samples is illustrated in Figure 1a–f of the TGA plot, which shows weight loss as a function of temperature. The main decomposition temperatures of the SBR samples, including the onset temperature, the temperature at 50% weight loss, and the maximum decomposition temperature, obtained at a heating rate of 20 °C/min, are summarized in Table 1. It is evident that as the heating rate increases, the onset of decomposition shifts to higher temperatures. Similarly, in the DTGA plot, the peaks representing the maximum degradation temperature also shift to higher temperatures and broaden with increasing heating rates, indicating a more gradual decomposition process. A comparable behavior was observed in the study by Alfannakh et al. [6]. This shift occurs because higher heating rates reduce the time available for thermal energy transfer into the sample, delaying the decomposition process. Consequently, the sample retains its initial weight until a higher temperature before significant weight loss begins [26].
In Figure 1b, the curves show that we can observe three distinct degradation zones [27]; the first zone is around 150 °C to 250 °C, which represents 16% of the weight, which may include stearic acid, plasticizers, oils, certain antioxidants, etc. Weight loss in this zone is due to the evaporation and decomposition of these volatile compounds. The second degradation zone represents the first stage in the thermal degradation of SBR itself. The butadiene units in the polymer chain are less thermally stable, due to the low stability of the aliphatic structure compared to the aromatic structure of styrene, so they degrade at lower temperatures [28]. The polymer structure begins to break down at 360 °C, resulting in significant weight loss. The third degradation starts at 425 °C. This zone corresponds to the final breakdown of the polymer structure and the decomposition of any remaining additives or fillers [29].
For the LSS shown in Figure 1c,d, there are subtle variations in degradation temperatures. These minimal shifts are likely to be due to the volatilization of certain additives, which may occur at different temperatures after 25 years of storage. Long-term storage can alter the concentration of each volatile component remaining in the material, affecting the initial stages of thermal decomposition [30]. In contrast, for the OAS in Figure 1e,f, the differences in degradation temperatures are more pronounced. These shifts result from both thermal and oxidative aging, which cause significant crosslinking and oxidation of the polymer matrix [31]. This aging process leads to the formation of additional degradation products, as secondary reactions are induced by prolonged exposure to high temperatures and mechanical stress. Notably, there is an almost complete disappearance of the first degradation zone, likely due to the volatilization and depletion of low-molecular-weight additives over 25 years of operational service [32].

4.2. Determination of Activation Energy

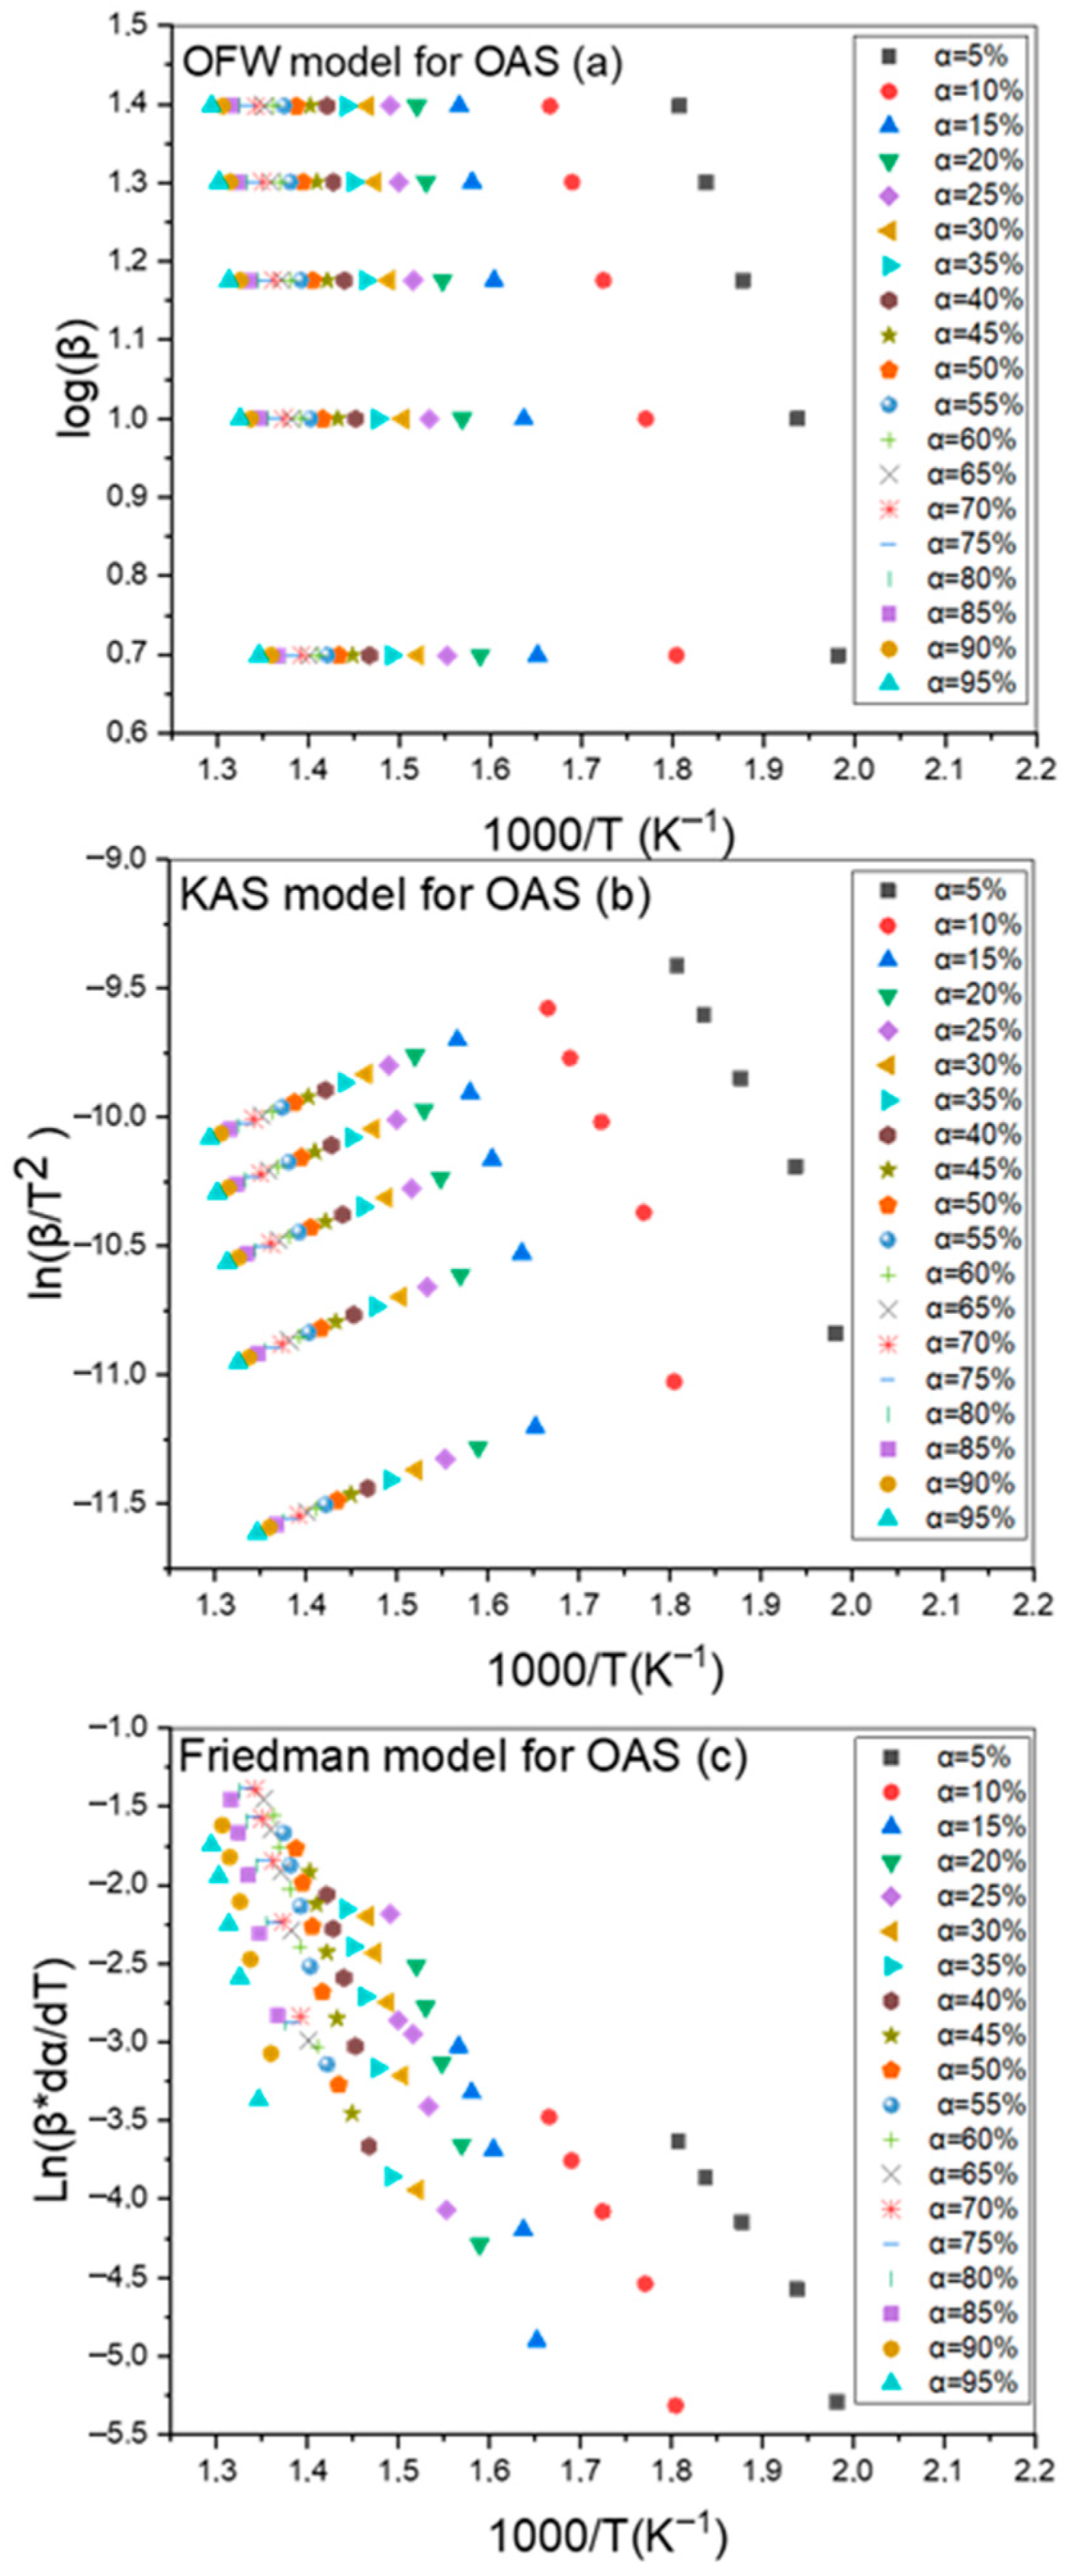
The decomposition of SBR occurs in three distinct stages, which can be better understood by calculating the Ea. Figure 2, Figure 3 and Figure 4 show the application of the FWO, KAS, and Friedman methods for the OUS, OAS and LSS respectively. The set of plots depicted above illustrates how the conversion rates (α) ranging from 5% to 95% are utilized to gather comprehensive data necessary for calculating the Ea [33]. We can observe different kinetic behaviors across the sample. This approach allows for a detailed analysis of the temperature-dependent reaction rates, facilitating a more accurate and encompassing determination of the Ea for each conversion step [34]. The lower conversion range (5% to 50%) primarily captures the initial stages of degradation, where volatile additives and less stable components decompose, requiring lower Ea. The higher conversion range (55% to 95%) focuses on the later stages, involving the breakdown of primary polymer chains and more stable components, which necessitate higher Ea [35].
In the Figure 2a,b shown, the FWO and KAS methods yield closely aligned results, demonstrated by the well-organized and parallel trends in their respective traces. This parallelism suggests that both methods are consistent in their estimation of Ea across different conversion rates, providing a reliable measure of the kinetic parameters under the same experimental conditions [36].
In the Friedman analysis, despite the observed overlapping trends, there remains an underlying parallelism. This subtlety is crucial, as it highlights the distinctive nature of the Friedman method, fundamentally a differential method [37]. Unlike the FWO and KAS methods, which are integral, the Friedman method calculates the derivative of the conversion rate concerning temperature, directly [38]. This approach allows for a more immediate reaction rate analysis at each specific temperature point, offering a dynamic insight into the kinetic processes. However, because it relies on the differential form of the rate data, it can be more susceptible to noise in the experimental data, which might explain the less clear separation between conversion rates [39,40].
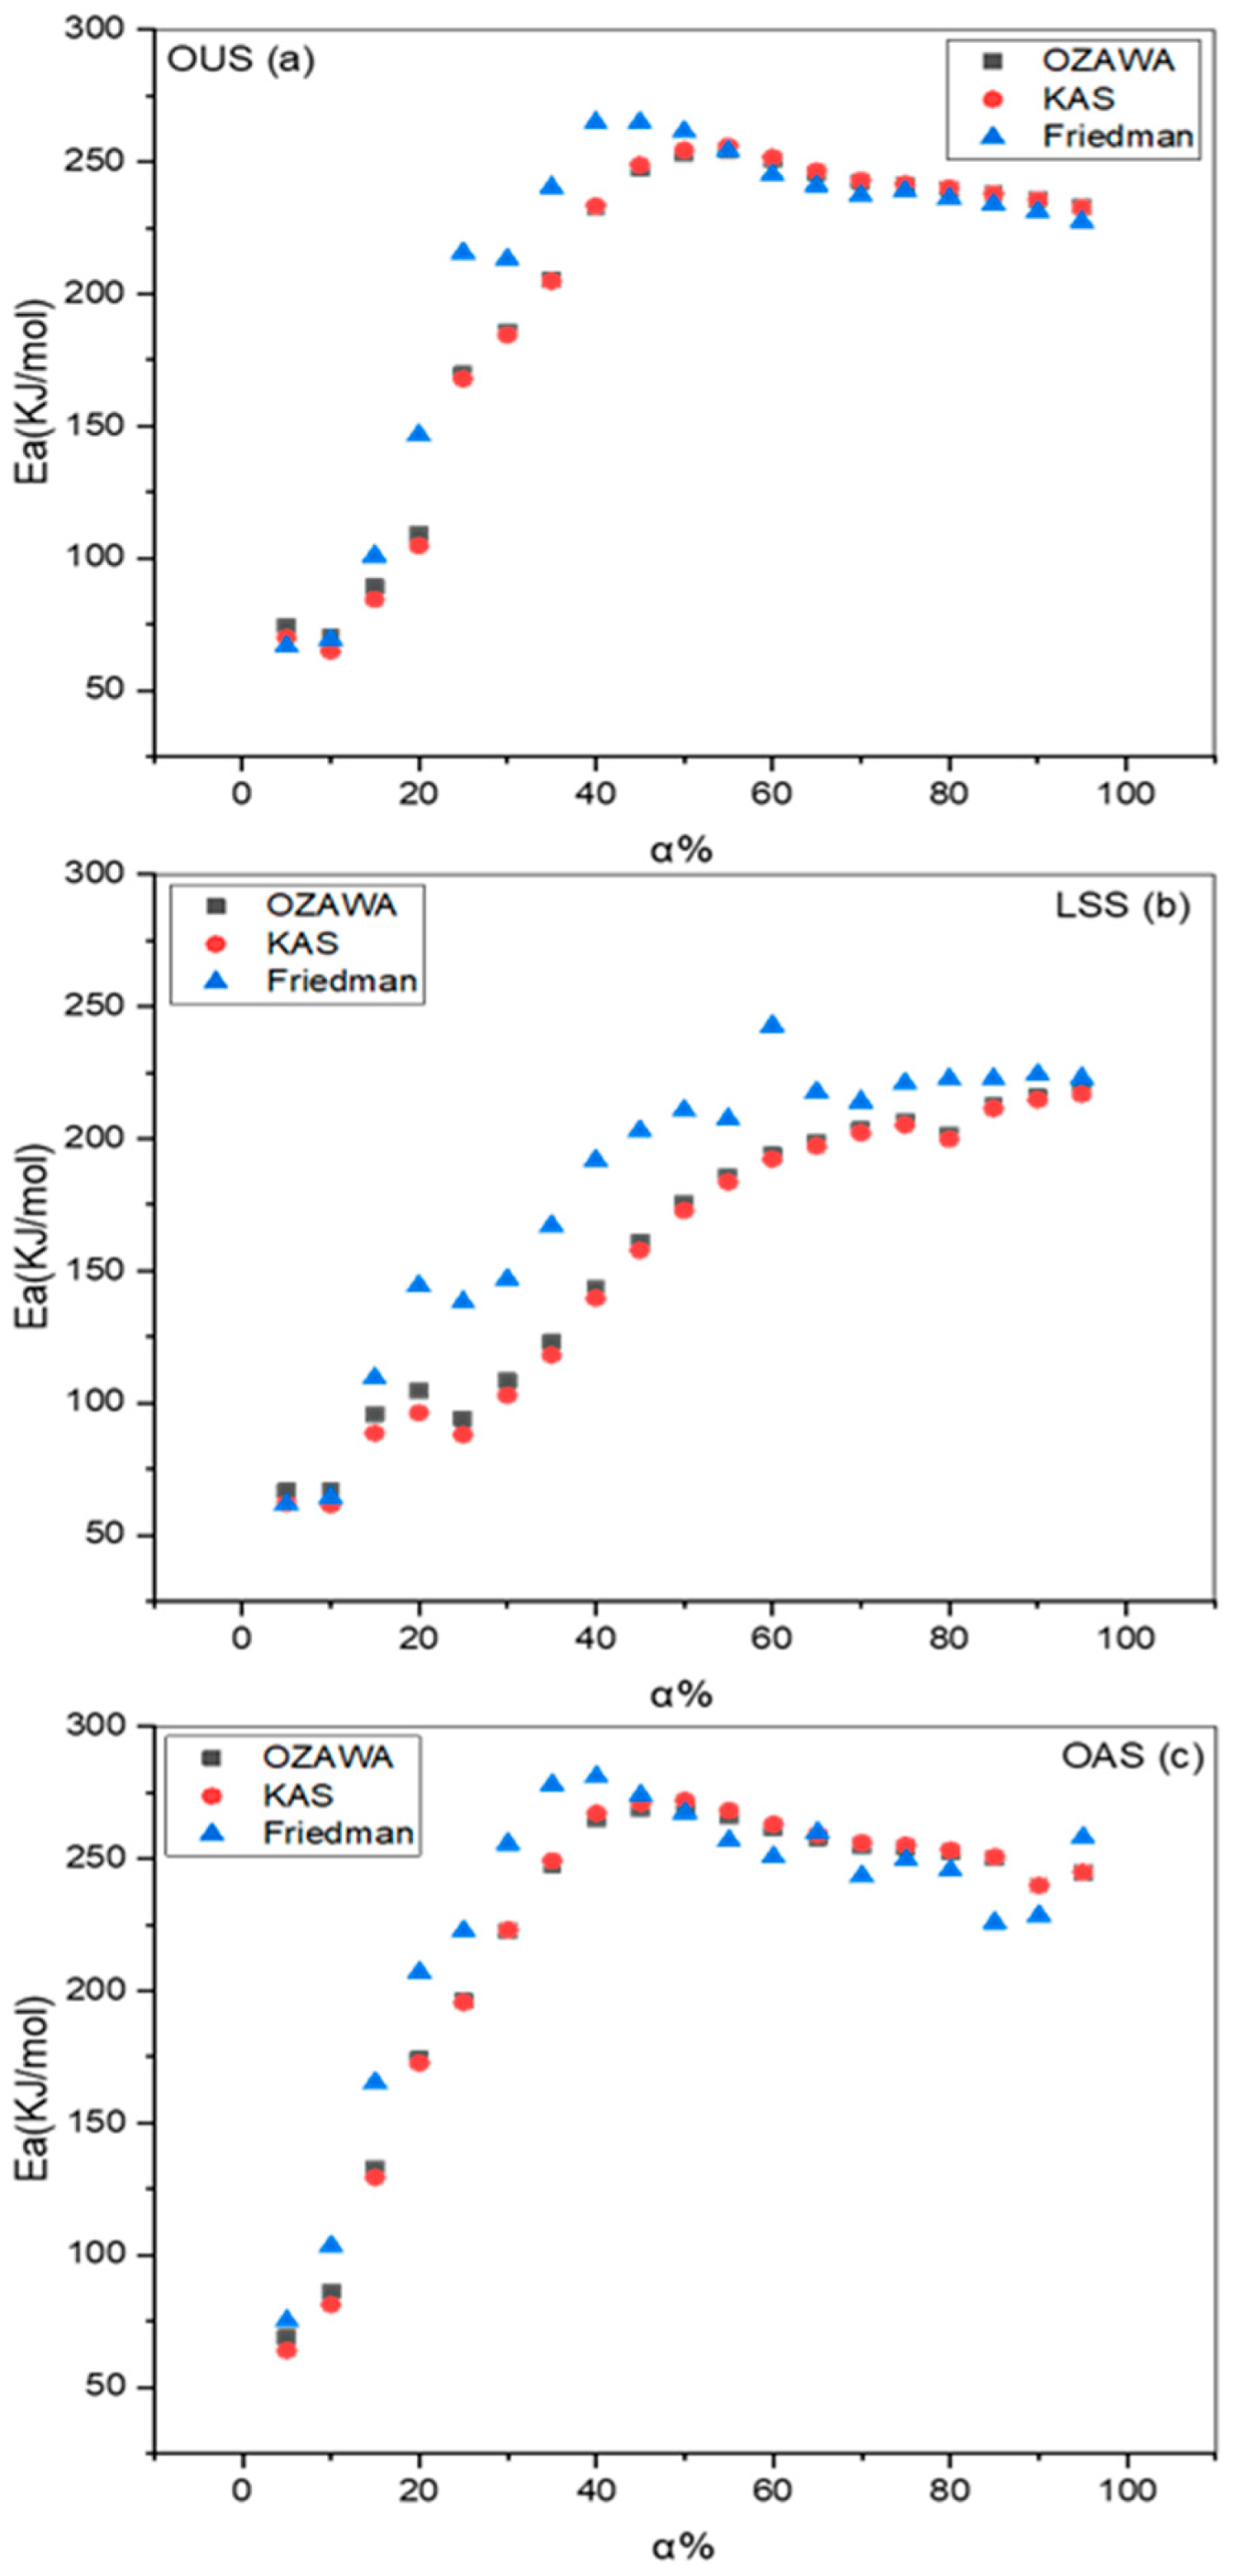
Figure 5 compares the evolution of Ea with the conversion rate. The three samples show a sharp increase in Ea for conversion rates below 50%. This indicates a significant energy barrier that must be overcome during the early stages of degradation, due to the dependence of Ea on the degree of conversion. However, in all three methods and for both samples, we observe that beyond a certain point (probably around α ≥ 50%), Ea values begin to stabilize with the increasing conversion rate. This plateau suggests that at high conversion rates, the Ea becomes largely independent of α, implying a dominant reaction mechanism or singular energy barrier governing the decomposition process at these stages [41].
During storage, several factors can influence the degradation kinetics of materials, such as the reduction in Ea observed in stored samples, by 22% compared to original samples. One key factor is the possibility of oxidative reactions occurring during the storage period. Exposure to air can lead to oxidation, especially as storage conditions are not strictly anaerobic. This oxidation process can alter the material’s chemical structure, making it more susceptible to degradation. In addition, the evaporation of low-molecular-weight additives, such as waxes and plasticizers, during storage, can also significantly affect material properties. Loss of these additives can lead to a stiffer, more brittle material, which may degrade more readily under thermal stress, reducing the Ea required for such processes [42,43].
The average increase in activation energy (Ea) for the OAS, of around 10.34% compared to the OUS sample, can be attributed to crosslinking phenomena within the material. This phenomenon is often induced by thermal or oxidative aging processes, where free radicals formed during polymer oxidation react with each other, creating new bonds between polymer chains. This cross-linked structure makes the material less flexible and more resistant to degradation.
As a result, more energy is required to overcome the energy barriers associated with thermal degradation reactions. Indeed, crosslinked polymer chains are more resistant to breakage, which increases the material’s stability in the face of degradation processes. In addition, the evaporation of plasticizing additives (which soften the material) during aging, combined with oxidation, helps to reinforce this crosslinked structure, making the material more rigid and resistant. This combination of crosslinking and loss of additives thus results in a rise in activation energy, reflecting the increased thermal and chemical resistance of the aged OAS sample compared to OUS. The Friedman method consistently showed higher Ea, as shown in Figure 5, suggesting that it is more sensitive [44]. To highlight these results, ANOVA tests were performed, illustrated in Figure 6 and Table 2, to assess the statistical significance of the observed changes in Ea across the samples. Although differences exist between methods within each sample, the overlapping confidence intervals indicate that these variations are not statistically significant.
These findings are consistent with the work of Burelo et al. [45], who investigated the thermal aging of polyurethane materials with saturated (SPU) and unsaturated (UPU) hard segments. After 30 days of thermal exposure at 150 °C, both materials exhibited mass loss, surface cracking, and a reduction in mechanical performance, with UPU showing greater susceptibility to degradation, due to the presence of unsaturated bonds. Similarly, our study observed structural degradation, reduced activation energy, and changes in surface morphology under long-term aging in SBR compounds. As in the PU study, SEM confirmed surface damage, and the thermogravimetric data supported aging-induced chemical changes. These comparisons emphasize the broader applicability of our findings to polymer degradation and the critical influence of molecular structure on thermal stability.

4.3. Determination of Thermodynamic Parameters

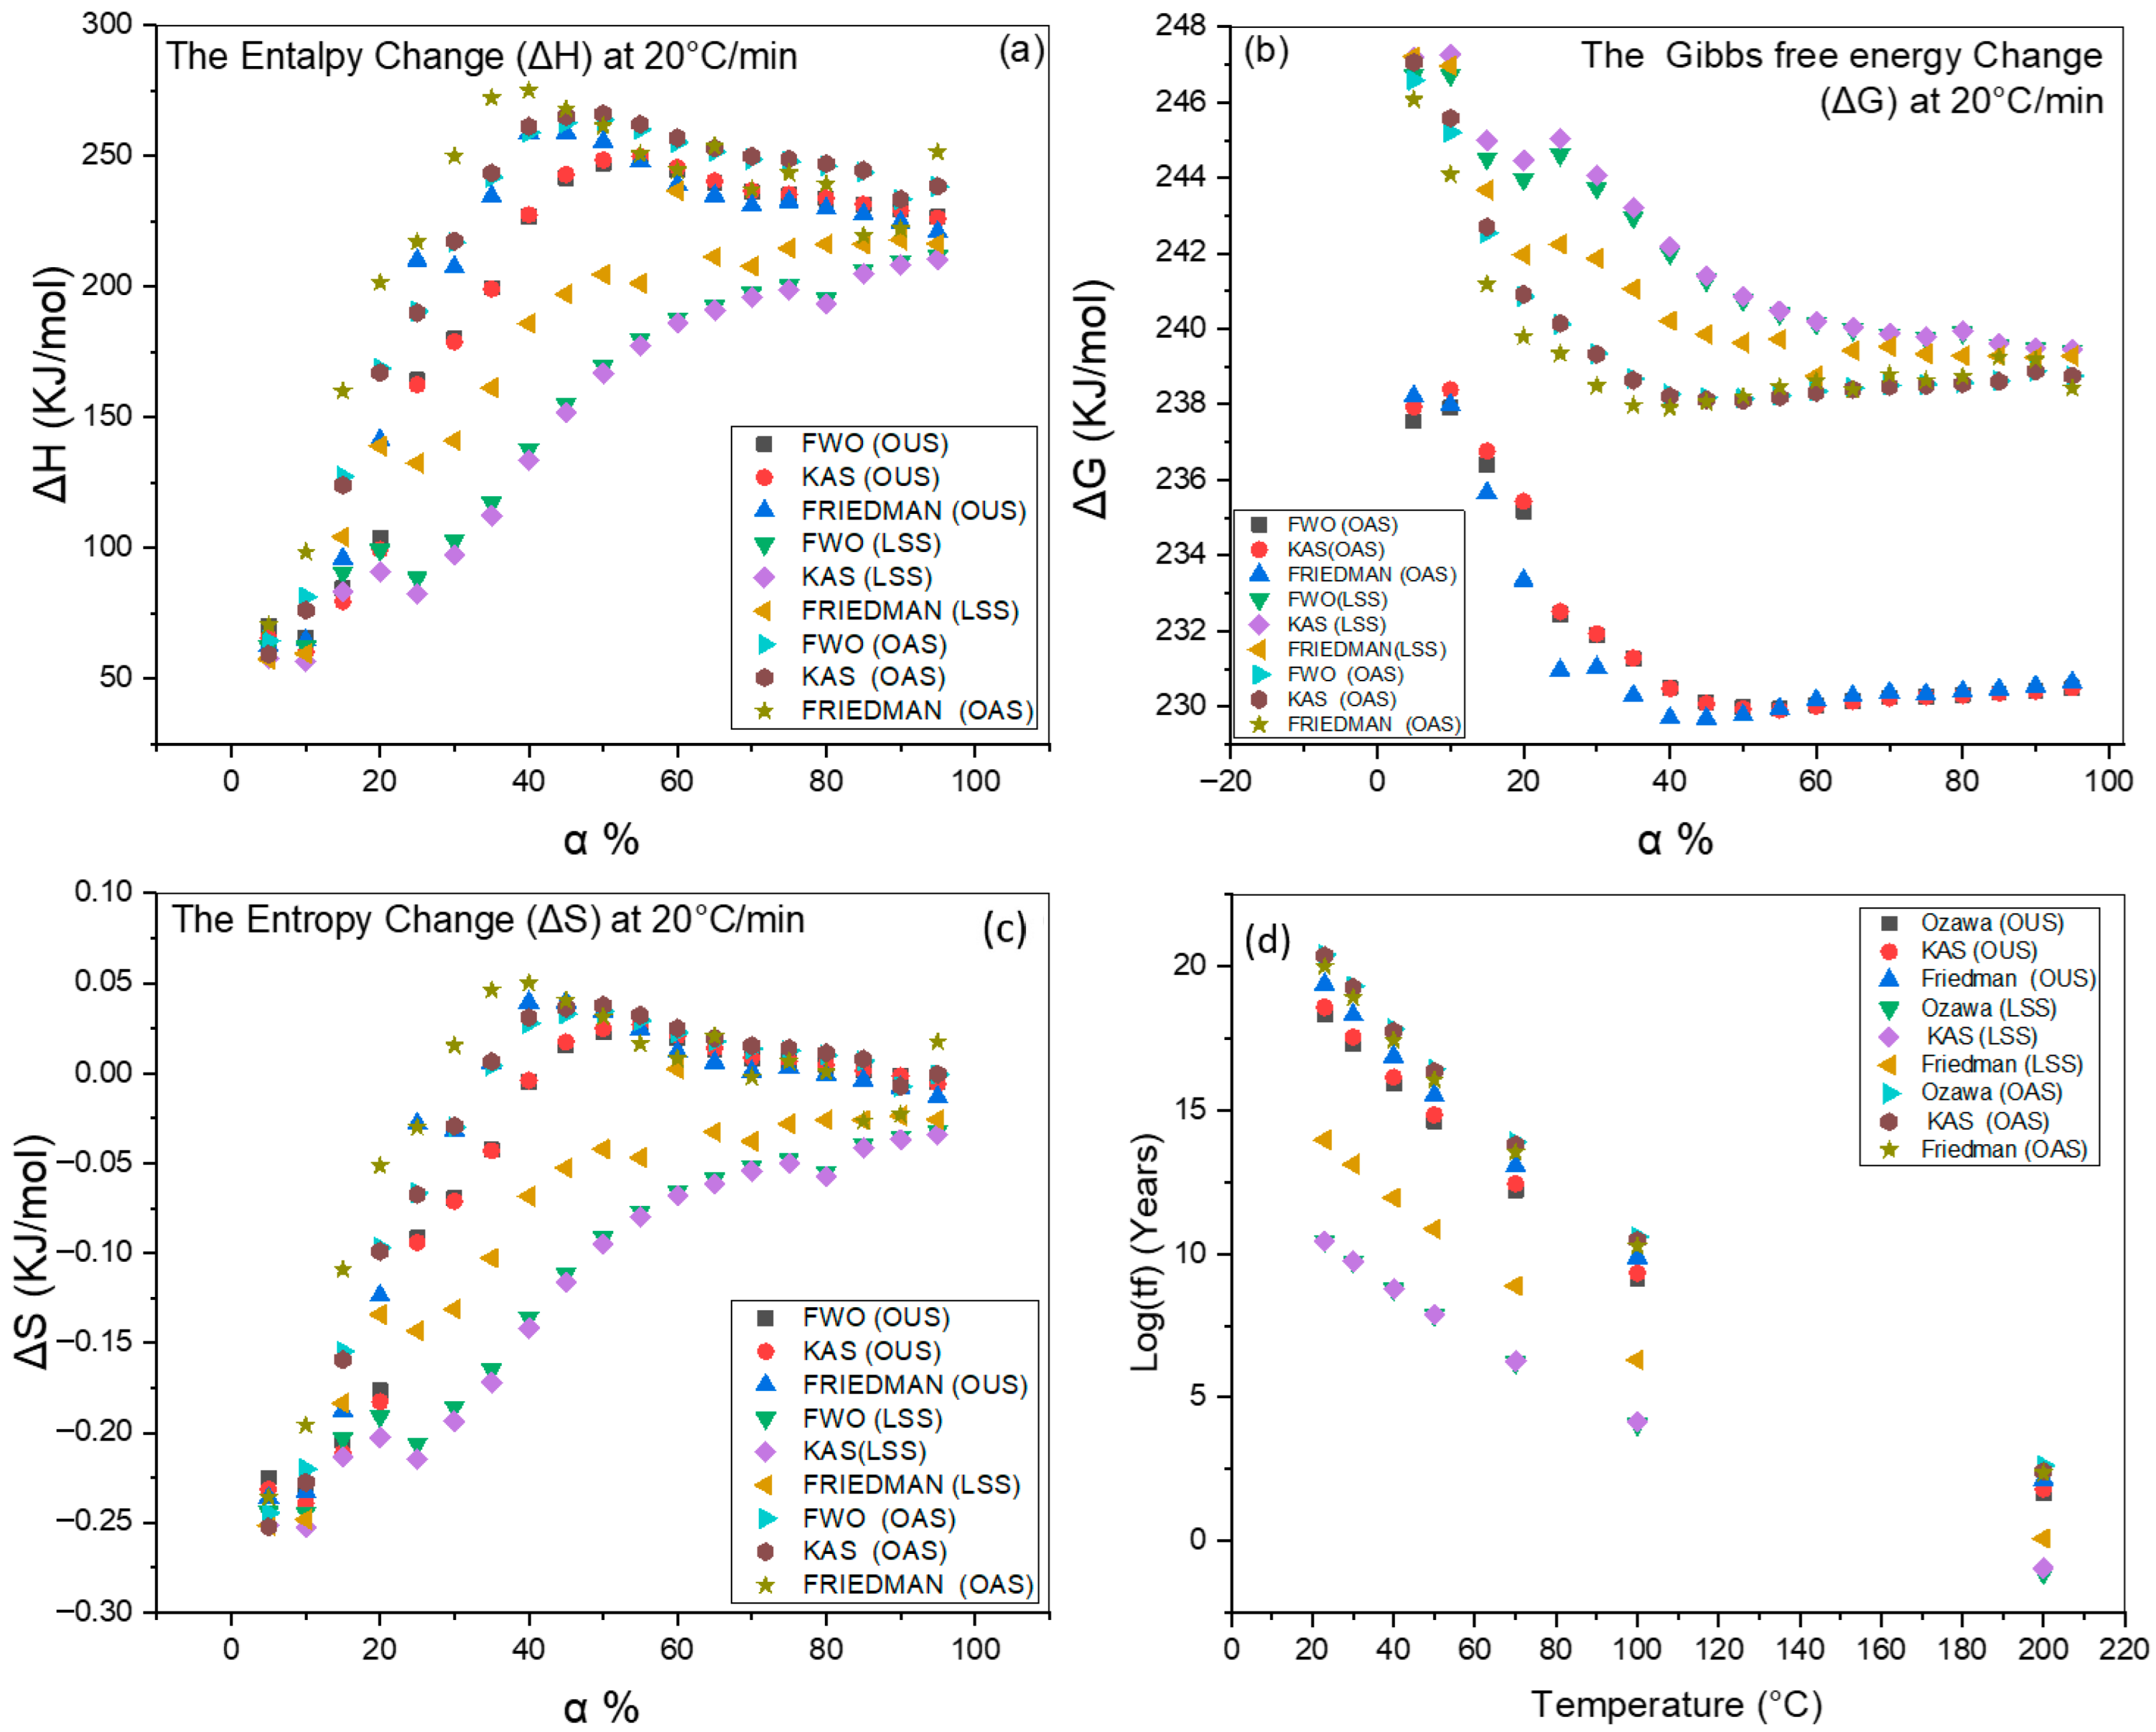
After calculating the Ea, a key parameter for studying the thermal stability of elastomers, we performed thermodynamic analysis, as shown in Figure 7. The Ea derived from the KAS, Friedman, and FWO methods is essential for understanding the degradation kinetics and predicting the material behavior under thermal stress. Using these Ea values, we can determine the pre-exponential factor (A) and other thermodynamic parameters such as enthalpy (∆H), which represents the total heat content of a system and is crucial for determining the amount of energy absorbed or released during thermal processes. Gibbs free energy (∆G), which indicates the spontaneity of a reaction, and entropy (∆S), which measures the degree of disorder or randomness in the system, were also evaluated. These calculations allow us to perform a comprehensive analysis of the thermal degradation mechanisms of elastomers. Starting with the first thermodynamic term, ∆H, which is directly related to Ea, we can explore how this relationship influences material behavior during degradation processes.
Enthalpy change reflects the energy involved in breaking and forming chemical bonds during a reaction. A higher Ea indicates that more enthalpy is required to initiate a reaction, making the process less spontaneous at low temperatures [33,46]. For LSS, the average ∆H for the three methods is around 158 kJ/mol, with a negative difference of 40 kJ/mol compared to the original sample, suggesting a reduced energy barrier for degradation. This means that changes within the material, perhaps through oxidation, loss of volatile additives, or minor degradation, reduce the energy required to initiate further chemical changes during storage. In contrast, the OAS sample shows a 10.29% increase in ∆H compared to the original, indicating that crosslinking and oxidation during operational aging lead to a more rigid and thermally resistant structure. This increased structural stability requires more energy to trigger decomposition reactions.
The average Gibbs free energy (∆G) for the original OUS sample is 231.79 kJ/mol. Both the LSS and OAS samples show an increase in ∆G compared to the original value, indicating that more energy is required to initiate degradation reactions. The LSS sample shows a 4.25% increase in ∆G, reaching 241.64 kJ/mol, while the OAS sample shows a 3.39% increase, based on the average values from the three iso-conversional methods. Although both samples exhibit an increase in ∆G, the thermodynamic mechanisms behind this increase differ. In the LSS sample, the rise in ∆G is primarily due to a decrease in entropy (∆S), likely caused by the loss of plasticizers and other volatile additives. This loss reduces molecular mobility, increases order, and shifts the system toward a more rigid and less entropically favorable state [47,48].
In contrast, the increase in ∆G for the OAS sample is largely due to oxidative processes and crosslinking, which create a denser network structure [49]. Regarding the entropy change (∆S) behavior, the initial decrease indicates that the system becomes more ordered as decomposition begins, likely due to the formation of intermediate products or the reorganization of molecular structures. As the conversion progresses, the increase in ∆S reflects greater disorder, as more bonds break and decomposition products form. The peak in entropy represents the point where the system reaches its maximum disorder, followed by a slight decrease in entropy as the reaction stabilizes at higher conversion rates [49].
These observations support the view that Gibbs free energy is influenced by a complex interplay between enthalpic and entropic factors that are specific to the aging conditions experienced by each material.

4.4. Lifetime of Thermal Degradation

The activation energy of SBR was calculated using iso-conversional models based on thermogravimetric analysis (TGA) data. At a 50% conversion rate, this energy was used to estimate the material’s lifetime under thermal degradation conditions, using the Toop equation [50]. Figure 7d presents the predicted lifetimes at different temperatures ranging from 23 °C to 200 °C under a constant heating rate of 20 °C/min. A logarithmic scale was adopted, to better visualize the variation across samples.
The results show that lifetime decreases significantly with increasing temperature, indicating a strong temperature dependence. For instance, the original unaged sample (OUS) exhibits the highest lifetime, of approximately 2.41 × 10¹⁹ years, at 23 °C (Friedman method), while it drops to 44.51 years at 200 °C (Ozawa method). Similarly, the LSS lifetime falls from 2.75 × 10¹⁰ years to only 0.075 years, and, for the OAS sample, from 4.32 × 10¹² years to 0.21 years, at the same temperatures.
However, it is essential to note that these estimations were performed under inert nitrogen atmosphere, without considering the presence of oxygen, mechanical stress, UV radiation, or other real-world conditions that can significantly impact degradation kinetics [51,52]. Therefore, while these lifetime predictions are helpful for comparative analysis, they do not reflect the actual service life of the materials.
We acknowledge that the predicted lifetimes, particularly at ambient temperatures, are unrealistically high, and do not account for oxidative or mechanical degradation processes that typically occur in service. Future work should include complementary approaches such as dynamic mechanical analysis (DMA), long-term thermo-oxidative aging, and mechanical fatigue testing, to build predictive models that better represent real operating conditions.

4.5. Microstructural and Compositional Analysis

Figure 8 shows the surfaces of the samples. There are some small particles or features for the original sample, but overall, the surface is relatively uniform and shows no significant damage or alteration [53]. The surface of the LSS is visibly rougher, compared to the original. There is an increase in surface texture, possibly due to the accumulation of particles or the formation of new surface features during storage. The OAS surface, as can be seen in Figure 8c, displays a network of cracks and rough textures. These features suggest significant changes in the material’s structure, due to aging. The presence of fine cracks and a more brittle appearance can be attributed to the oxidation and crosslinking processes that occur during aging, resulting in a stiffer, less flexible surface. This brittle texture is probably due to the loss of plasticizers and the formation of additional bonds between polymer chains, which increase the material’s rigidity and susceptibility to fracture [54].
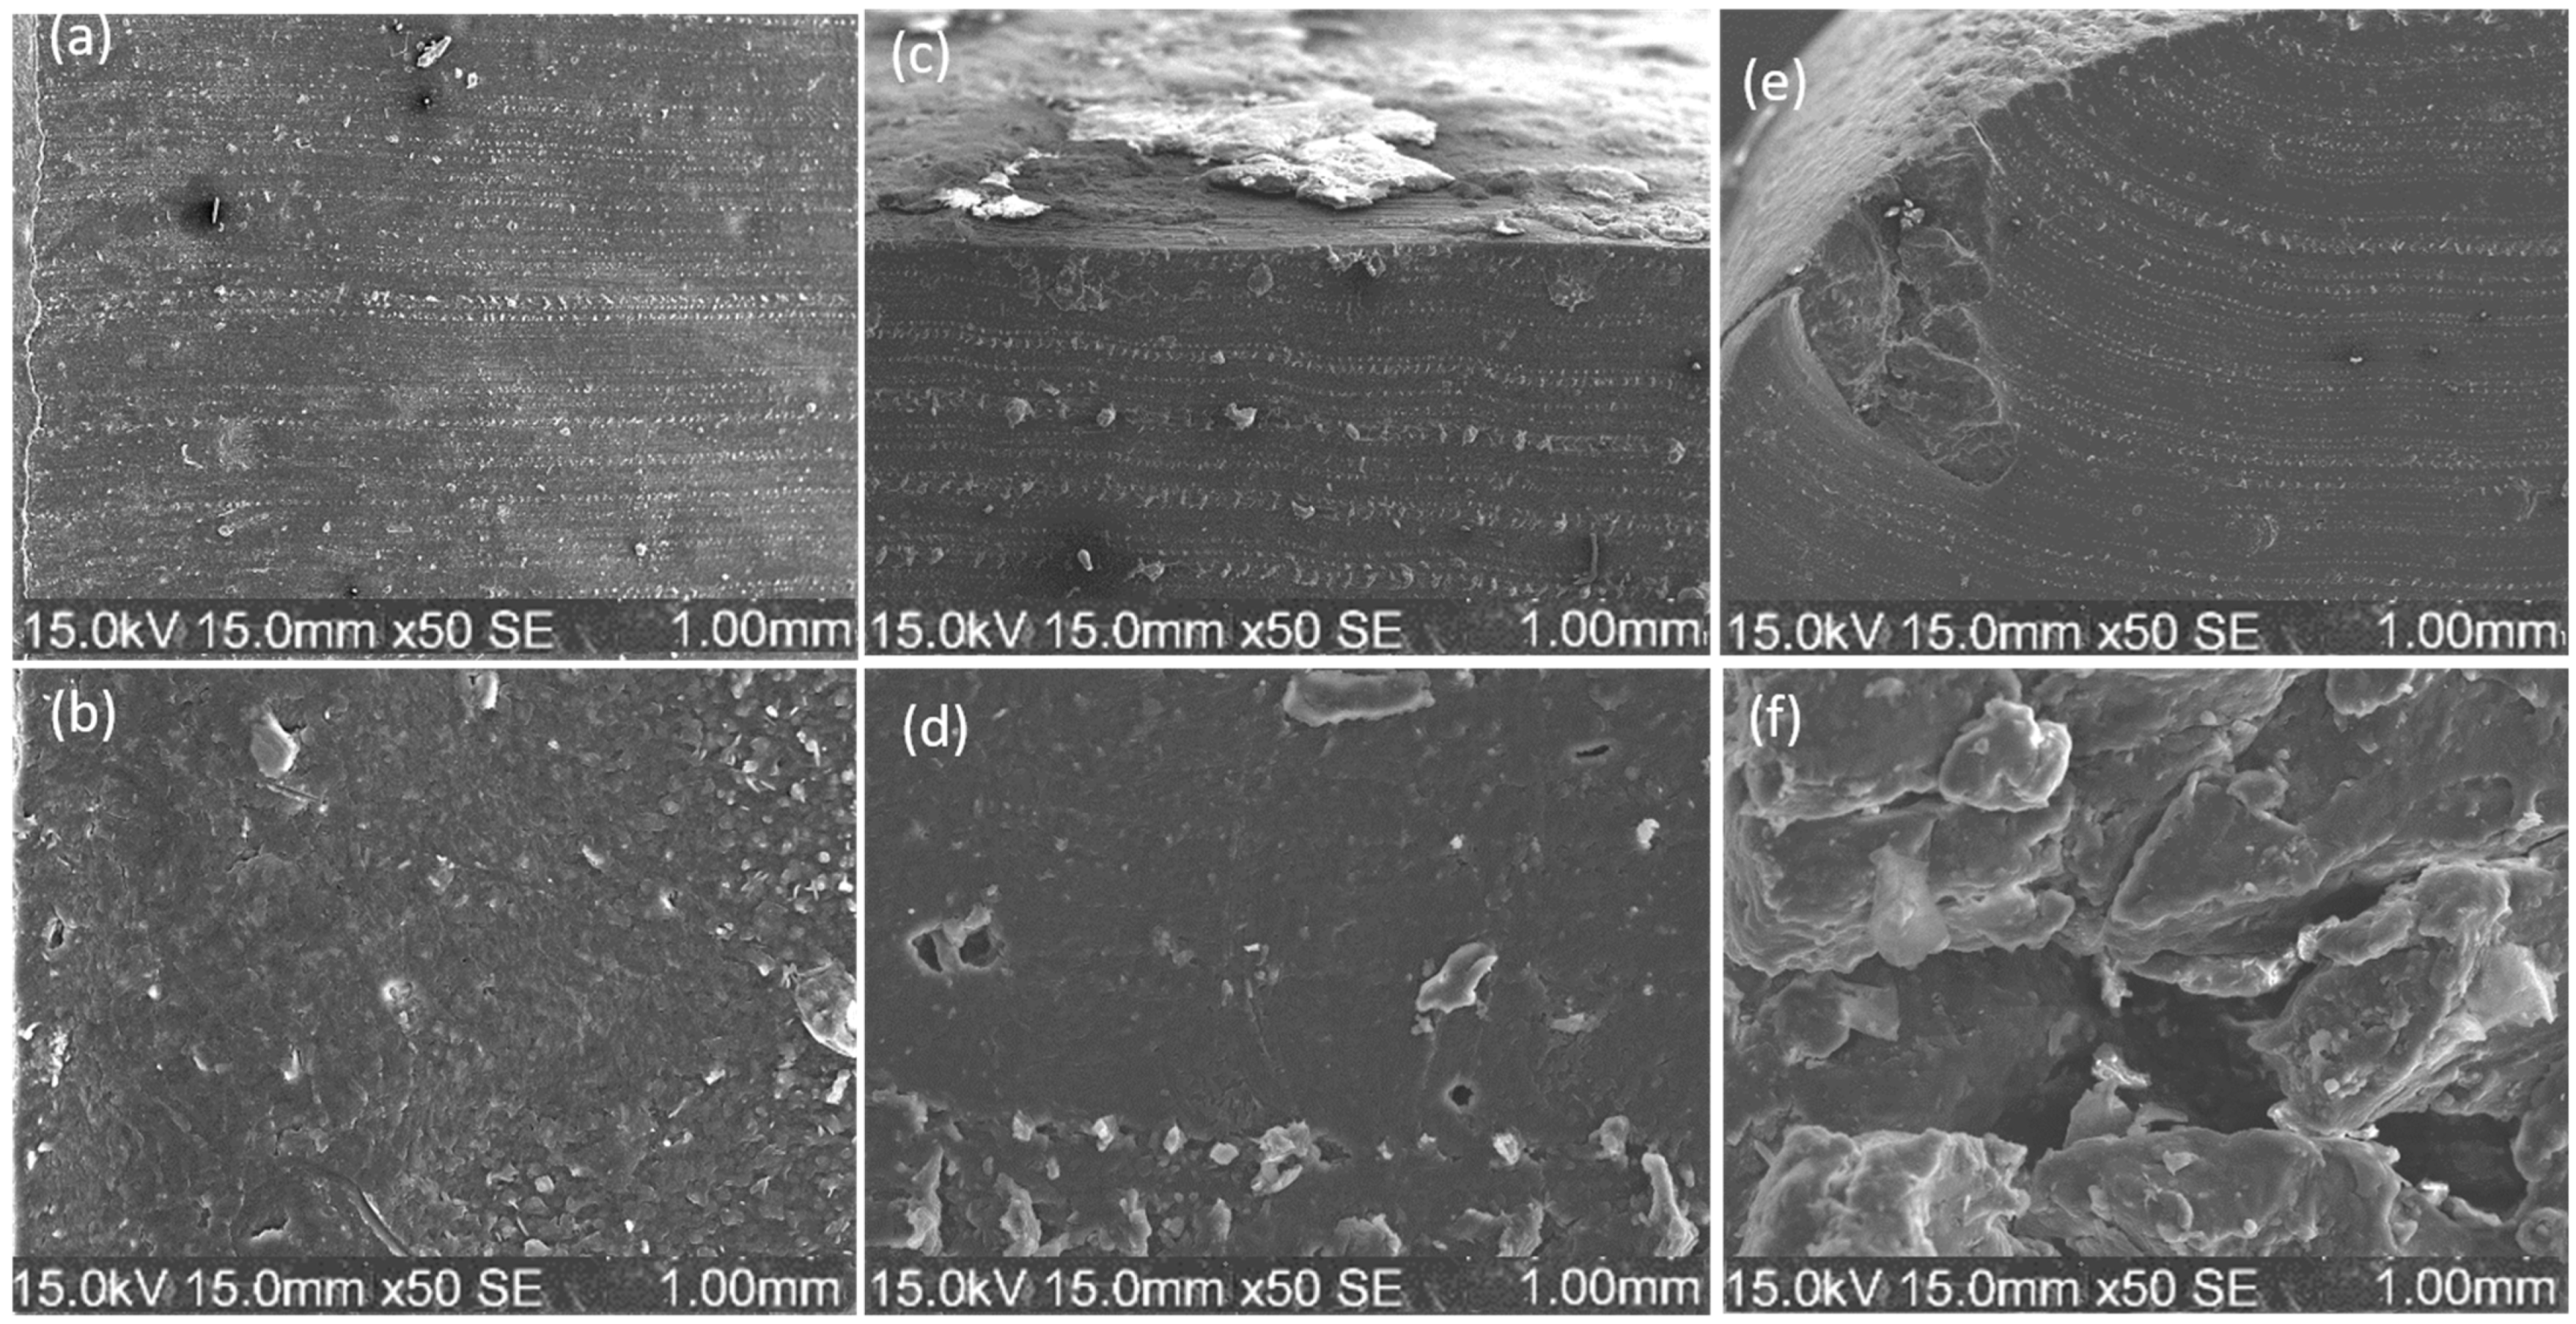
Figure 9 shows the cross-sectional images surfaces of OUS, LSS and OAS. We observed the samples with detailed enlargements. The cross-section of the OUS sample shows a smooth, uniform surface, indicating a well-preserved structure. In comparison, the LSS sample shows some initial signs of degradation, with increased roughness and small cracks. This degradation may be due to the migration of low-molecular-weight elements to the surface and the evaporation of plasticizers, resulting in a slight loss of flexibility. Over time, the polymer’s internal stresses may relax, resulting in minor structural modifications and reduced durability [55]. In the case of OAS, the cross-section exhibits more pronounced roughness, significant cracking, and a brittle appearance.
This change is probably due to oxidative aging and crosslinking processes, which create a denser, stiffer network structure. These transformations reduce the material’s elasticity, making it more susceptible to fracture under stress. The presence of these cracks and brittle zones suggests significant alteration of the polymer matrix, which further impacts the durability and service life of the sample.
The surface composition analysis of OUS, OAS, and LSS, shown in Figure 10, reveals distinct elemental distributions. Carbon constitutes the primary component across all samples, reflecting the carbon-rich nature of SBR elastomers. Oxygen content varies, indicating differences in oxidation levels, possibly due to exposure conditions. Notably, OAS shows higher oxygen levels compared to OUS and LSS, suggesting that OAS may have undergone additional oxidation or environmental exposure during storage [56].

4.6. Electrical Conductivity

Understanding and managing electrical conductivity is critical for ensuring the safety and functionality of rubber components used in applications involving exposure to electric fields. Insufficient insulation may result in unwanted electrical pathways, while excessive insulation could hinder desired conductive performance. Consequently, precise evaluation of the electrical conductivity of industrial rubber compounds is essential for optimizing their performance and reliability in such environments.
In our study, the original (OAS) sample exhibited a conductivity of approximately 0.068 S/cm, while the stored sample showed a slight increase, to 0.07 S/cm, likely due to mild compositional or morphological changes during storage. However, the aged sample displayed a substantial rise in conductivity, reaching 0.322 S/cm as shown in Figure 11. This significant variation suggests that aging leads to pronounced alterations in the rubber’s electrical behavior. These changes may result from the degradation or evaporation of insulating additives—such as silica, anti-ozonants, and crosslinking agents—or from microstructural modifications that facilitate the formation of conductive pathways.
As reported by Rybiński et al. [18], industrial SBR-based rubber composites often incorporate additives like carbon black, lignocellulosic fillers, and flame retardants, which can greatly affect both thermal and electrical properties. The evolution of conductivity over time can thus serve as a sensitive indicator of structural degradation and potential performance loss in service. Monitoring this parameter is therefore essential in assessing the long-term integrity of elastomeric components in electrically demanding industrial applications.

5. Conclusions

The thermal stability of SBR containing various additives such as silica, sulfur, stearic acid and, mainly, carbon black was examined by TGA at different heating rates. Storage and operated aging did not significantly alter the maximum temperature of degradation, but they did affect the degradation zones: indeed, there are no longer three precise degradation zones. Thermal kinetic analysis was carried out on undamaged samples, on operationally aged, and on stored ones over 25 years.
Average Ea values of around 200, 201 and 209 kJ/mol were obtained for the original SBR using the OFW, KAS and Friedman Methods, respectively. The Ea obtained by the iso-conversional methods was analyzed statistically, and we confirmed that the difference was not statistically significant, with a very high p-value. To focus the work on kinetically studying the behavior of elastomers, we chose the heating rate 20 °C/min to calculate the thermodynamic parameters. We first started by using the Kissinger model to calculate the pre-exponential factor and then introduced all unknown factors into the equations of thermodynamic parameters, such as enthalpy, Gibbs free energy, and entropy. We have a similar conversion progress for all samples that tend to converge towards similar values for all the parameters.
We also found that LSS and OAS degraded over 25 years through oxidation reactions, crosslinking, and additive volatilization. We also estimated the lifetime of thermal degradation using the Toop equation, and determined very high values that do not represent mechanical degradation or oxidation, as they were evaluated using the TGA test under nitrogen. We also studied the change in electrical conductivity. After 25 years of storage, we found no significant difference between the original and stored samples. The conductivity was about 0.070 S/cm. However, a significant increase in conductivity was observed after aging. To further confirm the results, we performed a scanning electron microscope with SEM\EDX to compare the samples at a microscopic level. This provides detailed insight into the microstructural degradation and elemental composition, helping to elucidate the observed thermal stability. Moreover, complementary work focusing on the mechanical characterization of these materials, including tensile properties, crosslink density, and hardness, is currently underway, and will be presented in a forthcoming publication, along with aging behavior under different environmental conditions.

Author Contributions

Conceptualization, I.H., M.E. and P.N.-T.; methodology, I.H.; software, I.H.; validation, I.H., M.T., M.E. and P.N.-T.; formal analysis, I.H. and M.T.; investigation, I.H.; resources, P.N.-T. and M.H.; data curation, I.H.; writing—original draft preparation, I.H.; writing—review and editing, I.H., M.T., M.E., M.H. and P.N.-T.; visualization, I.H. and P.N.-T. All authors have read and agreed to the published version of the manuscript.

Funding

This research was funded by the Natural Sciences and Engineering Research Council of Canada (NSERC), Prima-Quebec, Hydro-Québec, and Helix-Canada.

Data Availability Statement

Data available on request, due to privacy/ethical restrictions.

Conflicts of Interest

The authors declare no conflicts of interest.

Abbreviations

The following abbreviations are used in this manuscript:
ASTMAmerican Society for Testing and Materials
DTGADerivative Thermogravimetric Analysis
DMADynamic Mechanical Analysis
DSCDifferential Scanning Calorimetry
EDXEnergy-Dispersive X-ray Spectroscopy
FWOFlynn–Wall–Ozawa (iso-conversional kinetic method)
GC-MSGas Chromatography–Mass Spectrometry
KASKissinger–Akahira–Sunose (iso-conversional kinetic method)
LSSLaboratory-Stored Sample
OASOperationally Aged Sample
OUSOriginal Unaged Sample
SEMScanning Electron Microscopy
SBRStyrene–Butadiene Rubber
TGAThermogravimetric Analysis

References

  1. Li, C.; Li, L.; Yellezuome, D.; Cai, J.; Liu, R.; Hu, J. Physicochemical investigation and thermogravimetric analysis of bamboo and poplar wood residues and tire rubber waste: Kinetic and thermodynamic analyses. Ind. Crops Prod. 2023, 206, 117715. [Google Scholar] [CrossRef]
  2. Toiserkani, H. Fabrication and characterization of epoxidized natural rubber nanocomposites reinforced with mercapto-functionalized nano-zirconia filler. Polym. Compos. 2023, 44, 8063–8074. [Google Scholar] [CrossRef]
  3. Bensalem, K.; Eesaee, M.; Hassanipour, M.; Elkoun, S.; David, E.; Agbossou, K.; Nguyen-Tri, P. Lifetime estimation models and degradation mechanisms of elastomeric materials: A critical review. Polym. Degrad. Stab. 2024, 220, 110644. [Google Scholar] [CrossRef]
  4. Ikpeseni, S.C.; Orugba, H.O.; Efetobor, U.J.; Sada, S.O.; Ekpu, M.; Amagre, M.E.; Owamah, H.I. Pyrolysis characteristics and kinetics of the thermal degradation of elephant grass (Pennisetum purpureum): A comparative analysis using the Flynn–Wall–Ozawa and the Kissinger–Akahira–Sunose methods. Environ. Dev. Sustain. 2023, 27, 10549–11056. [Google Scholar] [CrossRef]
  5. Tayefi, M.; Eesaee, M.; Hassanipour, M.; Elkoun, S.; David, E.; Nguyen-Tri, P. Recent progress in the accelerated aging and lifetime prediction of elastomers: A review. Polym. Degrad. Stab. 2023, 214, 110379. [Google Scholar] [CrossRef]
  6. Zhang, Z.; Zheng, X.; Cai, J. Modified Friedman isoconversional kinetic method for effective activation energies of waste tires rubber pyrolysis. React. Kinet. Mech. Catal. 2024, 137, 1987–2001. [Google Scholar] [CrossRef]
  7. Wang, J.; Wang, X.; Lin, J. Natural rubber/styrene–butadiene rubber blend composites potentially applied in damping bearings. Polymers 2024, 16, 1945. [Google Scholar] [CrossRef]
  8. Alfannakh, H.; Alnaim, N.; Ibrahim, S.S. Thermal stability and non-isothermal kinetic analysis of ethylene–propylene–diene rubber composite. Polymers 2023, 15, 1890. [Google Scholar] [CrossRef]
  9. Cai, J.; Yang, X.; Jiao, R.; He, X.; Cao, X.; Xu, F.; Hou, Z.; Ma, Z.; Zhang, X. Effect of pulverized coal/carbon black hybrid fillers on mechanical properties and thermal stability of styrene-butadiene rubber composites. J. Appl. Polym. Sci. 2024, 141, e55363. [Google Scholar] [CrossRef]
  10. Sreethu, T.K.; Jana, S.; Jana, N.R.; Naskar, K. Influence of active, nano, and functionalized zinc oxide particles on the mechanical, cytotoxicity, and thermal stability of carbon-black-filled SBR/NR blends. Polym. Eng. Sci. 2023, 63, 2354–2370. [Google Scholar] [CrossRef]
  11. Ding, D.; Xu, W.; Qin, Z.; Cheng, Z.; Zhang, Z.; Qiao, M. Improvement of flame retardancy and thermal conductivity of SBR by piperazine-pyrophosphate-modified boron nitride synergistic expandable graphite. Iran Polym. J. 2024, 33, 209–222. [Google Scholar] [CrossRef]
  12. Saha, T.; Bhowmick, A.K. High-temperature degradation of butadiene-based model elastomers by reactive molecular dynamics simulation. J. Appl. Polym. Sci. 2020, 137, 48592. [Google Scholar] [CrossRef]
  13. Luo, G.; Wang, W.; Xie, W.; Tang, Y.; Xu, Y.; Wang, K. Co-pyrolysis of corn stover and waste tire: Pyrolysis behavior and kinetic study based on Fraser–Suzuki deconvolution procedure. J. Anal. Appl. Pyrolysis 2022, 168, 105743. [Google Scholar] [CrossRef]
  14. Ammineni, S.P.; Lingaraju, D.; Nagaraju, C. The effects of physical aging on the quasi-static and dynamic viscoelastic properties of nitrile butadiene rubber. Mech. Time-Depend. Mater. 2023, 27, 765–789. [Google Scholar] [CrossRef]
  15. Jovičić, M.; Bera, O.; Stojanov, S.; Pavličević, J.; Govedarica, D.; Bobinac, I.; Hollo, B.B. Effects of recycled carbon black generated from waste rubber on the curing process and properties of new natural rubber composites. Polym. Bull. 2023, 80, 5047–5069. [Google Scholar] [CrossRef]
  16. Bahrololoumi, A.; Mohammadi, H.; Moravati, V.; Dargazany, R. A Physically-Based Model for Thermo-Oxidative and Hydrolytic Aging of Elastomers. Int. J. Mech. Sci. 2021, 194, 106193. [Google Scholar] [CrossRef]
  17. Johlitz, M.; Diercks, N.; Lion, A. Thermo-oxidative ageing of elastomers: A modelling approach based on a finite strain theory. Int. J. Plast. 2014, 63, 138–151. [Google Scholar] [CrossRef]
  18. Rybiński, P.; Mirkhodjaev, U.Z.; Żukowski, W.; Bradło, D.; Gawlik, A.; Zamachowski, J.; Marzec, A.; Szadkowski, B. The effect of the lignocellulosic filler on the reduction of fire hazard of styrene-butadiene rubber composites, including the reduction of smoke, PCDD/F, PAH emissions and toxicity during its thermal decomposition. Polym. Test. 2023, 118, 107900. [Google Scholar] [CrossRef]
  19. Amrhar, R.; Eesaee, M.; Nguyen-Tri, P. Identification of the Elements of an Industrial Rubber of Unknown Formulation. In Materials for Sustainable Environmental, Energy, and Bioresource Applications; M2EBA 2023; Nguyen-Tri, P., Ed.; Springer Proceedings in Earth and Environmental Sciences; Springer: Cham, Switzerland, 2024. [Google Scholar] [CrossRef]
  20. Guo, X.; Yuan, X.; Hou, G.; Zhang, Z.; Liu, G. Natural aging life prediction of rubber products using artificial bee colony algorithm to identify acceleration factor. Polymers 2022, 14, 3439. [Google Scholar] [CrossRef]
  21. Saadatkhah, N.; Garcia, A.C.; Ackermann, S.; Leclerc, P.; Latifi, M.; Samih, S.; Patience, G.S.; Chaouki, J. Experimental methods in chemical engineering: Thermogravimetric analysis—TGA. Can. J. Chem. Eng. 2020, 98, 34–43. [Google Scholar] [CrossRef]
  22. Hamouda, I.; Eesaee, M.; Nguyen-Tri, P. Elastomer service life: The role of thermal and mechanical test data in predictive analysis. In Materials for Sustainable Environmental, Energy, and Bioresource Applications; Nguyen-Tri, P., Ed.; Springer: Cham, Switzerland, 2024; pp. 154–166. [Google Scholar] [CrossRef]
  23. Kasmiarno, L.D.; Panannangan, J.K.; Steven, S.; Rizkiana, J.; Hernowo, P.; Achmad, F.; Muraza, O.; Prakoso, T.; Istyami, A.N.; Pratiwi, M.; et al. Exploration of bio-hydrocarbon gases production via pyrolysis of fresh natural rubber: Experimental and volatile state kinetic modeling studies. J. Anal. Appl. Pyrolysis 2024, 177, 106275. [Google Scholar] [CrossRef]
  24. Ke, Q.; Wu, C.; Chen, X. Model-free cure kinetics of additional liquid silicone rubber. Thermochim. Acta 2020, 688, 178584. [Google Scholar] [CrossRef]
  25. Mallick, D.; Sharma, P.; Bora, B.J.; Baruah, D.; Bhowmik, R.; Barbhuiya, S.A.; Balakrishnan, D. Mechanistic investigation of pyrolysis kinetics of water hyacinth for biofuel employing isoconversional method. Sustain. Energy Technol. Assess. 2023, 57, 103175. [Google Scholar] [CrossRef]
  26. Abenojar, J.; Aparicio, G.M.; Butenegro, J.A.; Bahrami, M.; Martínez, M.A. Decomposition kinetics and lifetime estimation of thermoplastic composite materials reinforced with rCFRP. Materials 2024, 17, 2054. [Google Scholar] [CrossRef] [PubMed]
  27. Enciso, B.; Abenojar, J.; Aparicio, G.; Martínez, M. Decomposition kinetics and lifetime estimation of natural fiber reinforced composites: Influence of plasma treatment and fiber type. J. Ind. Text. 2019, 177, 106275. [Google Scholar] [CrossRef]
  28. Wan, H.; Huang, Z. Pyrolysis and oxidative thermal decomposition investigations of tennis-ball rubber wastes through kinetic and thermodynamic evaluations. Materials 2023, 16, 2328. [Google Scholar] [CrossRef]
  29. Smook, L.A.; Chatra, S.K.R.; Lugt, P.M. Evaluating the oxidation properties of lubricants via non-isothermal thermogravimetric analysis: Estimating induction times and oxidation stability. Tribol. Int. 2022, 171, 107569. [Google Scholar] [CrossRef]
  30. Jovanović, S.; Samaržija-Jovanović, S.; Jovanović, V.; Marković, G.; Vujaković, J.; Marinović-Cincović, M. Use of recycled rubber in carbon black as a filler in ternary blends of NR/BR/SBR for the automotive tire industry. J. Vinyl Addit. Technol. 2024, 30, 1341–1356. [Google Scholar] [CrossRef]
  31. Rantuch, P. The thermal degradation of polymer materials. In Ignition of Polymers; Springer Series on Polymer and Composite Materials; Springer: Cham, Switzerland, 2022. [Google Scholar] [CrossRef]
  32. Zhong, B.; Dong, H.; Luo, Y. Antioxidant-modified graphene oxide for robust and highly aging-resistant rubber composites. Compos. Commun. 2023, 37, 101443. [Google Scholar] [CrossRef]
  33. Hu, Q.; Chen, Q.; Song, P.; Gong, X.; Chen, J.; Zhao, Y. Performance of thermal-oxidative aging on the structure and properties of ethylene-propylene-diene-monomer (EPDM) vulcanizates. Polymers 2023, 15, 2329. [Google Scholar] [CrossRef]
  34. Wang, K.; Shan, T.; Zang, H.; Zhan, J.; Yang, S.; Tian, X.; Wang, C.; Peng, Z. Kinetic, thermodynamic and synergistic effects of pyrolysis of natural rubber, styrene-butadiene rubber and butadiene rubber. Fuel 2024, 372, 132088. [Google Scholar] [CrossRef]
  35. Wang, J.; Qi, X.; Dong, X.; Zhang, K.; Luo, S. Mechanistic insights into co-pyrolysis of waste tires and waste lubricating oil: Kinetics and thermal behavior study. Energy Sources Part A 2023, 45, 8568–8583. [Google Scholar] [CrossRef]
  36. Osorio-Vargas, P.; Lick, I.D.; Sobrevía, F.; Correa-Muriel, D.; Menares, T.; Manrique, R.; Casella, M.L.; Arteaga-Pérez, L.E. Thermal behavior, reaction pathways and kinetic implications of using a Ni/SiO2 catalyst for waste-tire pyrolysis. Waste Biomass Valor. 2021, 12, 6465–6479. [Google Scholar] [CrossRef]
  37. Jansen, A.A.; Van der Walt, I.J.; Crouse, P.L. Waste-tyre pyrolysis and gasification via the reverse Boudouard reaction: Derivation of empirical kinetics from TGA data. Thermochim. Acta 2022, 708, 179104. [Google Scholar] [CrossRef]
  38. Qu, B.; Li, A.; Qu, Y.; Wang, T.; Zhang, Y.; Wang, X.; Gao, Y.; Fu, W.; Ji, G. Kinetic analysis of waste-tire pyrolysis with metal-oxide and zeolitic catalysts. J. Anal. Appl. Pyrolysis 2020, 152, 104949. [Google Scholar] [CrossRef]
  39. Paran, S.M.; Naderi, G.; Movahedifar, E.; Jouyandeh, M.; Formela, K.; Colom, X.; Cañavate, J.; Saeb, M.R. Isothermal vulcanization and non-isothermal degradation kinetics of XNBR/Epoxy/XNBR-g-halloysite-nanotube nanocomposites. Materials 2021, 14, 2872. [Google Scholar] [CrossRef]
  40. Rammohan, D.; Kishore, N.; Uppaluri, R.V.S. Kinetics and thermodynamics investigation of pyrolysis of butyl-rubber tube waste. Eur. J. Sustain. Dev. Res. 2023, 7, em0215. [Google Scholar] [CrossRef]
  41. Mong, G.R.; Liew, C.S.; Idris, R.; Woon, K.S.; Chong, W.W.F.; Chiong, M.C.; Lim, J.W.; Chong, C.T.; Lee, C.T.; Wong, K.Y.; et al. Effective waste management through co-pyrolysis of EFB and tire waste: Mechanistic and synergism analysis. J. Environ. Manag. 2024, 368, 122172. [Google Scholar] [CrossRef]
  42. Nobis, C.; Mancini, M.; Fischlschweiger, M. Modelling binder degradation in the thermal treatment of spent lithium-ion batteries by coupling discrete-element method and isoconversional kinetics. Batteries 2024, 10, 63. [Google Scholar] [CrossRef]
  43. Wang, H.; Liu, X.; Erkens, S.; Skarpas, A. Experimental characterization of storage stability of crumb-rubber-modified bitumen with warm-mix additives. Constr. Build. Mater. 2020, 249, 118840. [Google Scholar] [CrossRef]
  44. Cvetinović, D.; Milutinović, N.; Erić, A.; Škobalj, P.; Andjelković, J.; Bakić, V. Optimisation of the operating parameters of a thermal-plasma system for converting PCB-containing waste by thermodynamic modelling. Energy Convers. Manag. 2023, 292, 117358. [Google Scholar] [CrossRef]
  45. Luo, Y.; Chen, X.; Liu, H.; Zhang, H.; Song, M.; Liu, J.; Luo, Z. Precisely tailoring the thermodynamic compatibility between single-walled carbon nanotubes and styrene-butadiene rubber via fully atomistic molecular-dynamics simulation and theoretical approach. Comput. Mater. Sci. 2021, 186, 109995. [Google Scholar] [CrossRef]
  46. Rubiera, F.; Pevida, C.; Pio, D.T.; Tarelho, L.A. Thermodynamic analysis of biomass gasification using Aspen Plus: Comparison of stoichiometric and non-stoichiometric models. Energies 2021, 14, 189. [Google Scholar] [CrossRef]
  47. Alam, M.N.; Kumar, V.; Lee, J.; Park, S. Styrene-butadiene-rubber-based nanocomposites toughened by carbon nanotubes for wide and linear electromechanical-sensing applications. Polym. Compos. 2024, 45, 2485–2499. [Google Scholar] [CrossRef]
  48. Plota, A.; Masek, A. Lifetime prediction methods for degradable polymeric materials—A short review. Materials 2020, 13, 4507. [Google Scholar] [CrossRef] [PubMed]
  49. Burelo, M.; Franco-Urquiza, E.A.; Martínez-Franco, E.; Moreno-Núñez, B.A.; Gómez, C.M.; Stringer, T.; Treviño-Quintanilla, C.D. Effect of thermal aging on polyurethane degradation and the influence of unsaturations in the hard segment. J. Polym. Sci. 2025, 63, 2639–2650. [Google Scholar] [CrossRef]
  50. Ammineni, S.P.; Lingaraju, D.; Nagaraju, C. Estimating shelf life and degradation mechanisms of nitrile-butadiene rubber for viscoelastic dampers. J. Elastomers Plast. 2024, 56, 434–453. [Google Scholar] [CrossRef]
  51. Lee, Y.S.; Ha, K. Effects of acrylonitrile content on thermal characteristics and thermal-aging properties of carbon-black-filled NBR composite. J. Elastomers Plast. 2020, 53, 402–416. [Google Scholar] [CrossRef]
  52. Aghapour, A.A.; Alizadeh, N.; Khorsandi, H. Biological degradation and mineralization of tetracycline antibiotic using SBR equipped with a vertical axially rotating biological bed (SBR-VARB). Biodegradation 2023, 34, 325–340. [Google Scholar] [CrossRef]
  53. Dileep, P.; Poornima, M.; Jacob, S.; Rappai, J.P.; Dominic, M. Accelerator-functionalized nanosilica for vulcanization efficiency and thermal resistance of SBR. Mater. Today Proc. 2022, 51, 2599–2603. [Google Scholar] [CrossRef]
  54. Lessa Belone, M.C.; Kokko, M.; Sarlin, E. Degradation of common polymers in a sewage-sludge purification process developed for microplastic analysis. Environ. Pollut. 2021, 269, 116235. [Google Scholar] [CrossRef] [PubMed]
  55. Lee, J.; Kim, J.; Jeong, M.H.; Ahn, K.H.; Lee, H.L.; Youn, H.J. Visualization of styrene-butadiene-rubber latex and large-scale analysis of the microstructure of lithium-ion-battery anodes. J. Power Sources 2023, 557, 232552. [Google Scholar] [CrossRef]
  56. Peidayesh, H.; Špitalský, Z.; Chodák, I. Electrical conductivity of rubber composites with varying cross-link density under cyclic deformation. Polymers 2022, 14, 3640. [Google Scholar] [CrossRef] [PubMed]
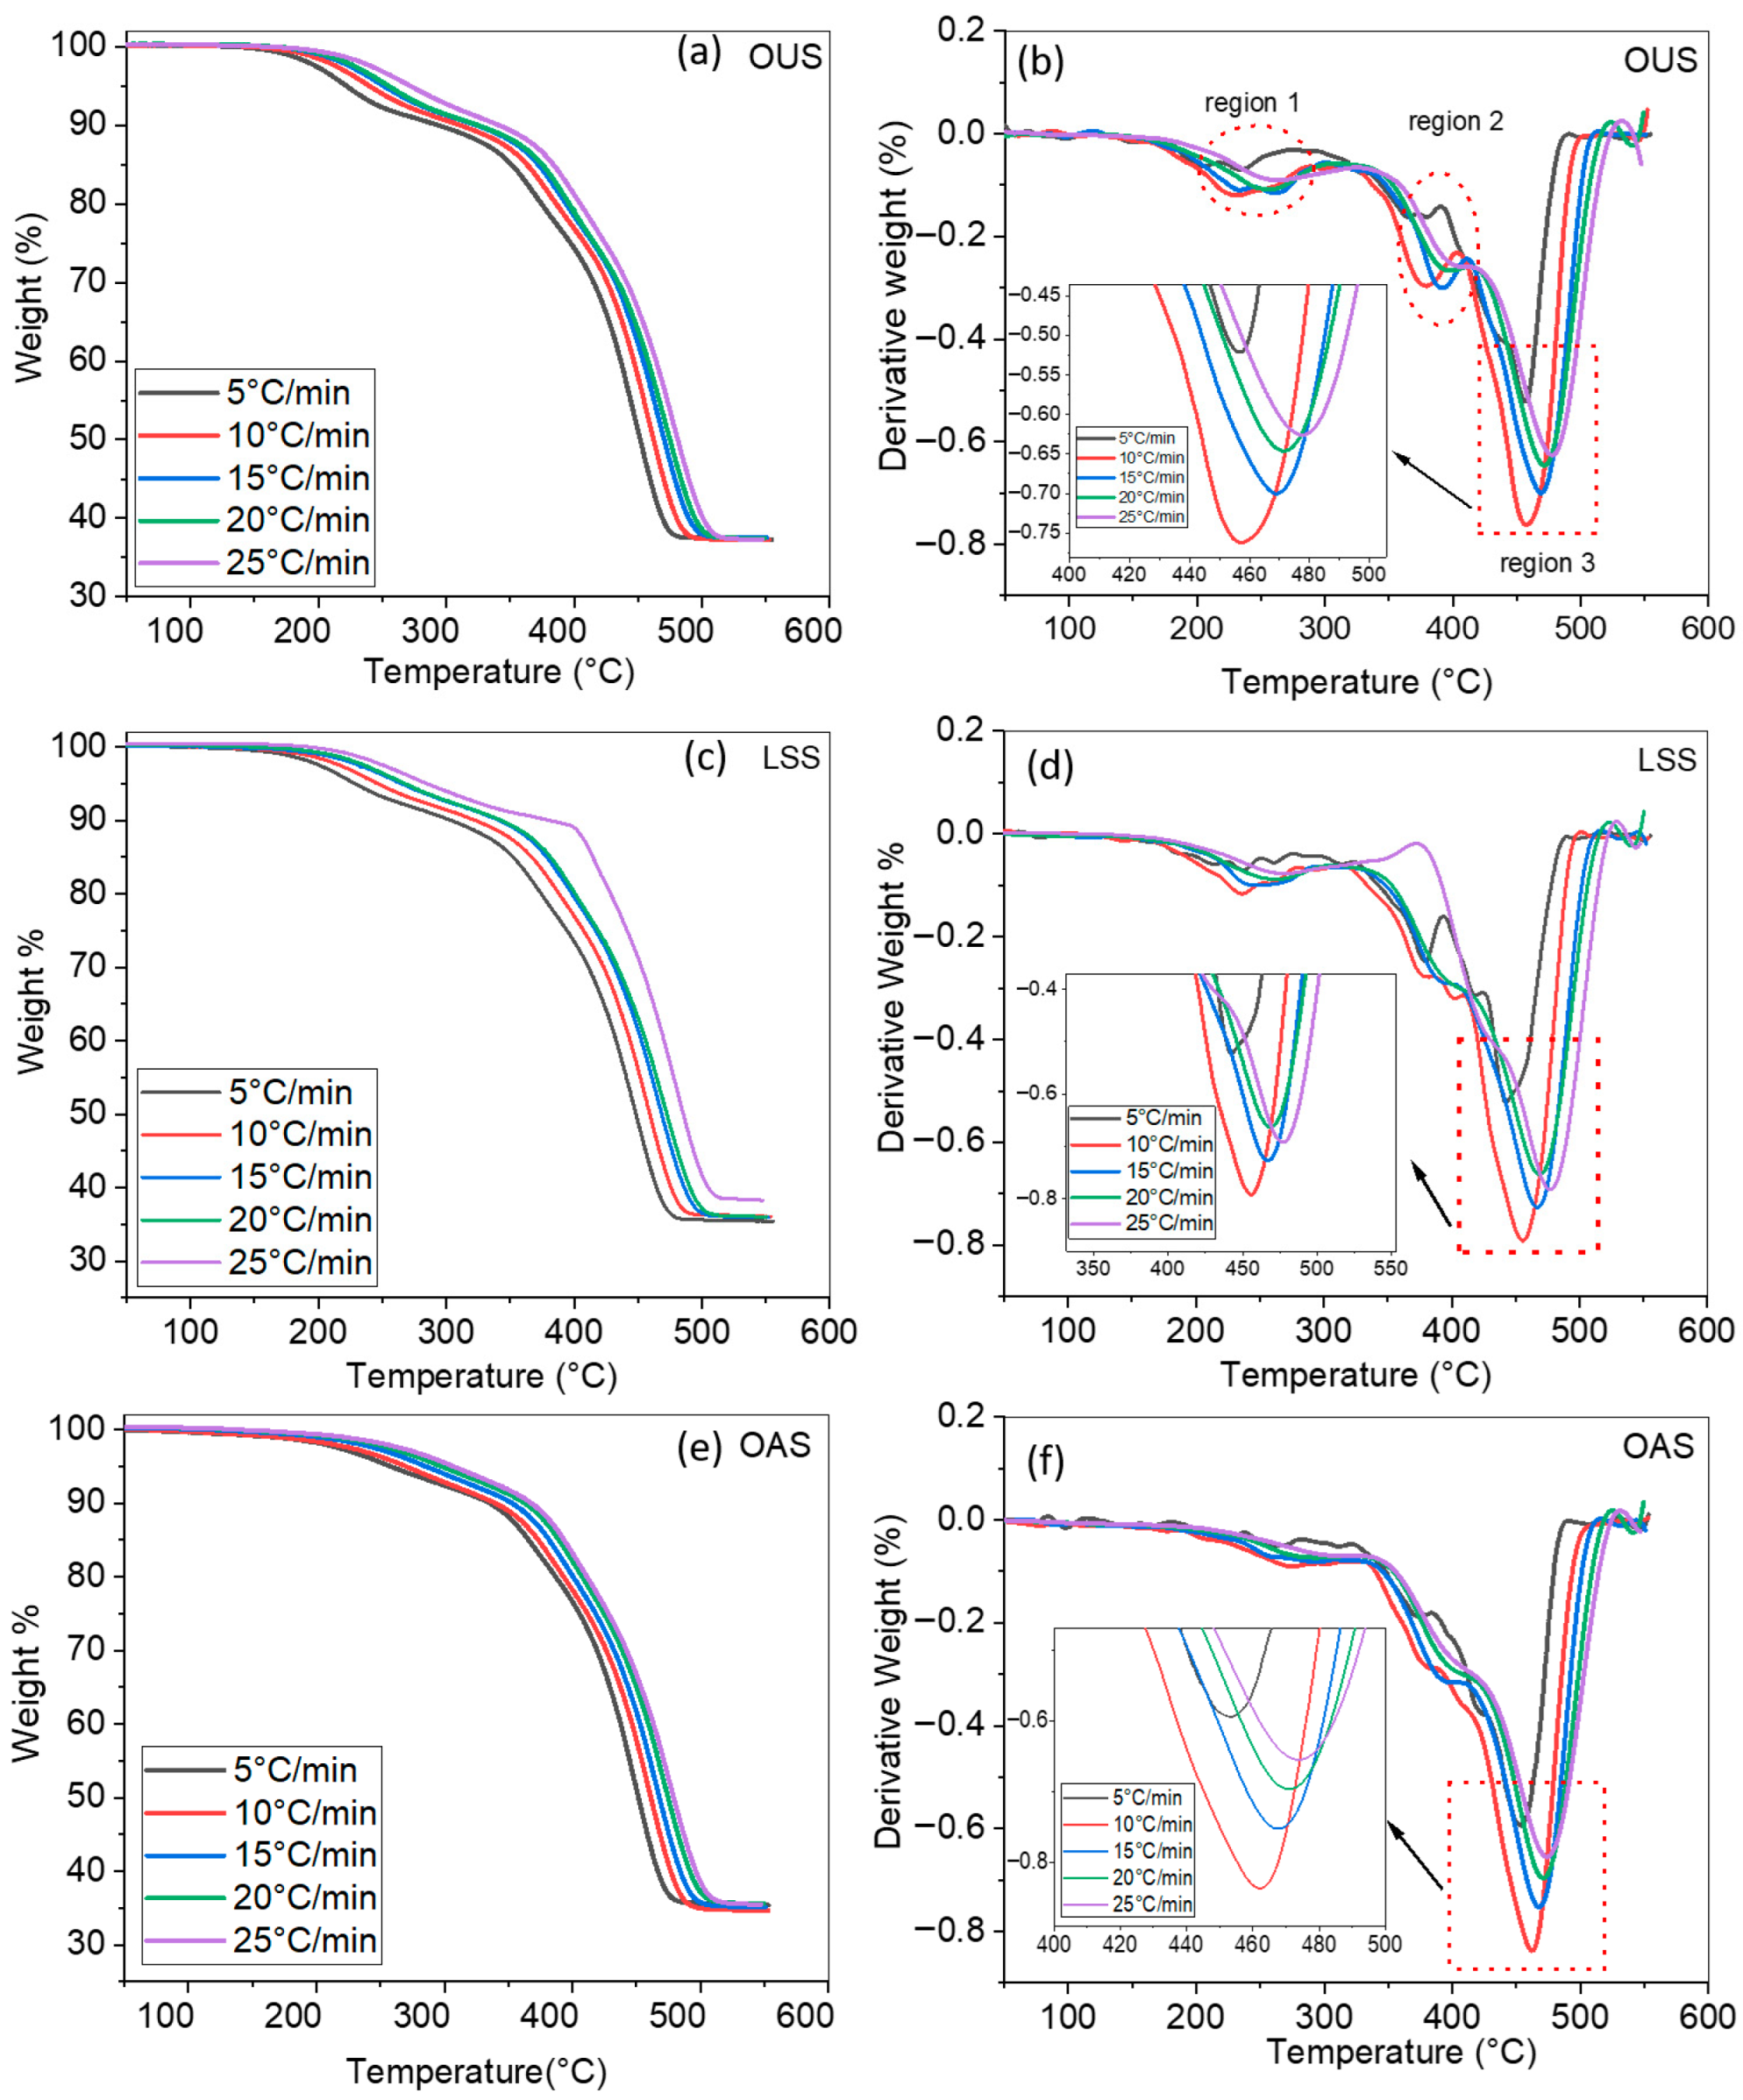
Figure 1. The TGA and DTGA curves: (a,b) of the OUS; (c,d) of the LSS and (e,f) of the OAS with different heating rates, 5, 10, 15, 20, and 25 °C/min. TGA curves; DTGA curves.
Jcs 09 00420 g001
Figure 2. Kinetic parameter of the original unaged sample by iso-conversional models: (a) OFW model; (b) KAS model; (c) Friedman model.
Jcs 09 00420 g002
Figure 3. Kinetic parameter of the laboratory-stored sample by iso-conversional models: (a) OFW model; (b) KAS model; (c) Friedman model.
Jcs 09 00420 g003
Figure 4. Kinetic parameter of the operationally aged sample by iso-conversional models: (a) OFW model; (b) KAS model; (c) Friedman model.
Jcs 09 00420 g004
Figure 5. The dependence of Ea on the rate of conversion: (a) OUS; (b) LSS; (c) OAS.
Jcs 09 00420 g005
Figure 6. Comparative analysis of activation energy (Ea) across different aging samples using Friedman, KAS, and Ozawa Methods: (a) original unaged sample; (b) laboratory-stored sample; (c) operationally aged sample.
Jcs 09 00420 g006
Figure 7. Comparative analysis of kinetic parameters for OUS, LSS, and OAS Samples at 20 °C/min heating rate: (a) Enthalpy Change (∆H); (b) Gibbs Free Energy Change (∆G); (c) Entropy Change (∆S); (d): thermal lifetime estimation for OUS, OAS and LSSS, as obtained for different operating temperatures at 20 °C/min and (α) = 50%.
Jcs 09 00420 g007
Figure 8. Microscopic examination of surface degradation in SBR samples at the same magnification (500 µm scale): (a) original unaged sample (OUS), (b) laboratory-stored sample (LSS), and (c) operationally aged sample (OAS).
Jcs 09 00420 g008
Figure 9. High-resolution scanning electron microscopy (SEM) characterization of SBR sample cross-sections: (a,b) cross-section of OUS; (c,d) cross-section of LSS; (e,f): cross-section of OAS.
Jcs 09 00420 g009
Figure 10. EDX surface analysis of SBR samples: (a) original unaged sample (OUS), (b) laboratory-stored sample (LSS), and (c) operationally aged sample (OAS).
Jcs 09 00420 g010
Figure 11. The electrical conductivity of the three samples.
Jcs 09 00420 g011
Table 1. Summary of key decomposition temperatures of SBR samples at 20 °C/min heating rate.
SampleTOnset °CT50 (°C)Tmax (°C)
OUS350460475
LSS370455470
OAS360465478
Table 2. Comparative statistical analysis of activation energy (Ea) and confidence intervals for different rubber samples using three iso-conversional methods (FWO, KAS, Friedman).
FWO KAS Friedman
ParametersOUSLSSOASOUSLSSOASOUSLSSOAS
Ea200.94156.64221.79200.16153.17221.91209.95180.63228.84
LCL170.73131.46193.74169.95127.98193.87179.75155.45200.80
SCS231.14181.82249.84230.36178.35249.96231.14205.81256.89
Ea: Activation energy (kJ/mol); LCL: lower confidence limit (95%); SCS: superior confidence limit (95%).
Disclaimer/Publisher’s Note: The statements, opinions and data contained in all publications are solely those of the individual author(s) and contributor(s) and not of MDPI and/or the editor(s). MDPI and/or the editor(s) disclaim responsibility for any injury to people or property resulting from any ideas, methods, instructions or products referred to in the content.