Article

Low-Velocity Impact Damage Behavior and Failure Mechanism of 2.5D SiC/SiC Composites

1
Xi’an Golden Mountain Ceramic Composites Co., Ltd., Xi’an 710118, China
2
Science and Technology on Thermostructural Composite Materials Laboratory, Northwestern Polytechnical University, Xi’an 710072, China
3
Advanced Power Research Institute, Northwestern Polytechnical University, Sichuan Tianfu New Area, Chengdu 610213, China
*
Authors to whom correspondence should be addressed.
These authors contributed equally to this work.
J. Compos. Sci. 2025, 9(8), 388; https://doi.org/10.3390/jcs9080388
Submission received: 23 June 2025 / Revised: 18 July 2025 / Accepted: 20 July 2025 / Published: 22 July 2025
(This article belongs to the Special Issue Functional Composites: Fabrication, Properties and Applications)

Abstract

Continuous SiC fiber-reinforced SiC matrix composites (SiC/SiC), as structural heat protection integrated materials, are often used in parts for large-area heat protection and sharp leading edges, and there are a variety of low-velocity impact events in their service. In this paper, a drop hammer impact test was conducted using narrow strip samples to simulate the low-velocity impact damage process of sharp-edged components. During the test, different impact energies and impact times were set to focus on investigating the low-velocity impact damage characteristics of 2.5D SiC/SiC composites. To further analyze the damage mechanism, computed tomography (CT) was used to observe the crack propagation paths and distribution states of the composites before and after impact, while scanning electron microscopy (SEM) was employed to characterize the differences in the micro-morphology of their fracture surfaces. The results show that the in-plane impact behavior of a 2.5D needled SiC/SiC composite strip samples differs from the conventional three-stage pattern. In addition to the three stages observed in the energy–time curve—namely in the quasi-linear elastic region, the severe load drop region, and the rebound stage after peak impact energy—a plateau stage appears when the impact energy is 1 J. During the impact process, interlayer load transfer is achieved through the connection of needled fibers, which continuously provide significant structural support, with obvious fiber pull-out and debonding phenomena. When the samples are subjected to two impacts, damage accumulation occurs inside the material. Under conditions with the same total energy, multiple impacts cause more severe damage to the material compared to a single impact.

1. Introduction

Continuous fiber-reinforced silicon carbide matrix composites (CMCs) have excellent properties such as a high specific strength, high modulus, high temperature resistance, oxidation resistance, and low density; they exhibit toughness against damage, having a high damage tolerance and a predictable damage height compared to ceramics [1,2,3,4]. These comprehensive properties have led to the widespread use of CMCs in the high-temperature components of aerospace vehicles [5]. However, as aerospace vehicle components, they are inevitably subjected to external impacts during their preparation and maintenance, and these impacts often cause non-negligible damage, so it is necessary to study the impact damage mechanism of CMCs [6,7]. Composites that suffer from impact events often cause many subsequent problems, such as stress concentration, delamination propagation, durability degradation, and dynamic property changes [8,9,10,11]. These problems can greatly affect the use of composites, for example, stress concentration can cause the fatigue performance of composites to be greatly degraded [8]. Ogi et al. [12] investigated the experimental characterization of high-speed impact damage behavior in a three-dimensionally woven SiC/SiC composite, and they observed that multiple pyramid-shaped cone cracks were generated beneath the crater when the impact speed was relatively low. At an impact speed exceeding the critical speed, a spall fragment was ejected from the back surface, while no internal damage was observed in the fragment. Herb et al. [13] investigated the low-velocity impact (LVI) behavior of three-dimensional braided SiC/SiC composites, and they observed cracks arising from the impact site during the impact process using an optical microscope; thermal imaging analyses and tensile tests were carried out after the impact, and the results showed that the impact damage was concentrated in the contact region between the impactor and the impacted material. Wu et al. [14] found that the main forms of failure of SiC/SiC composites subjected to a low-velocity impact were cone cracking, yarn fracture, delamination, and matrix spalling; visual damage occurred when the impact load reached the threshold force. Chen et al. [15] found that when SiC/SiC composites were prepared by polymer impregnation and pyrolysis, the SiC/SiC composites with a 40% mass fraction of liquid hyperbranched polycarbosilane had the best impact resistance. The study shows that the factors affecting the impact are the shape and size of the impactor and the impacted sample, the impact velocity, the impact energy, the sample weaving method, the thickness of the sample stack, etc. However, most of the current impact studies use large flat plate samples to simulate the impact damage of large-area, heat-resistant structures, and little attention is paid to the effect of the number of impacts, while the damage caused by low-speed impacts is often invisible. Our team [16] investigated the behavior of two low-velocity impacts on a narrow strip of C/SiC composites and found that the damage behavior was the same as that of a flat plate sample and the cumulative damage of the two impacts was greater than that of a single impact of the same energy.
Generally speaking, the core parameters of low-velocity impacts (LVIs) include the impact velocity, impact energy, sample geometry, and sample stacking configuration. While numerous studies have been conducted on low-velocity, low-energy impacts of SiC/SiC composites with varying preform structures—whether during or after a single impact event—relatively little focus has been placed on the direction of the impact or the number of impact cycles. For example, in relevant studies, research on 2.5D SiC/SiC composite plates is usually limited to single impacts in two directions. However, in practice, this type of composite material may be subjected to low-velocity impacts from other directions during service. Just as when a vehicle collides, its ribbed plates will suffer side impacts, and the impact resistance of the ribbed plates under such circumstances remains unclear. Therefore, it is necessary to investigate the in-plane impact behavior of SiC/SiC thin plates, including both single and multiple impacts. We plan to develop a drop-weight impact test method for strip samples and verify its consistency with the standard drop-weight impact test method. In order to determine the invisible damage of low-velocity impacts on the sharp leading edge parts of SiC/SiC composites and their effect on the subsequent impact damage, this paper takes 2.5D needled SiC/SiC composites as the research object. By comparing the displacement–load curves, energy–time curves, and CT images under different energies and different times with the same energy, the fiber fracture and crack propagation mechanisms were obtained, so as to determine the energy absorption modes. By comparing the SEM images under different energies and different times with the same energy, the fracture modes of fibers and matrix at the fracture surface of the specimens were observed, thus acquiring the impact fracture mechanism of SiC/SiC composites. However, in this experiment, only low-velocity impact tests were conducted on the 2.5D needled SiC/SiC composite, with the impact energy and impact direction being limited. Further research may be carried out in the future, such as increasing the impact energy or changing the impact direction.

2. Materials and Test Methods

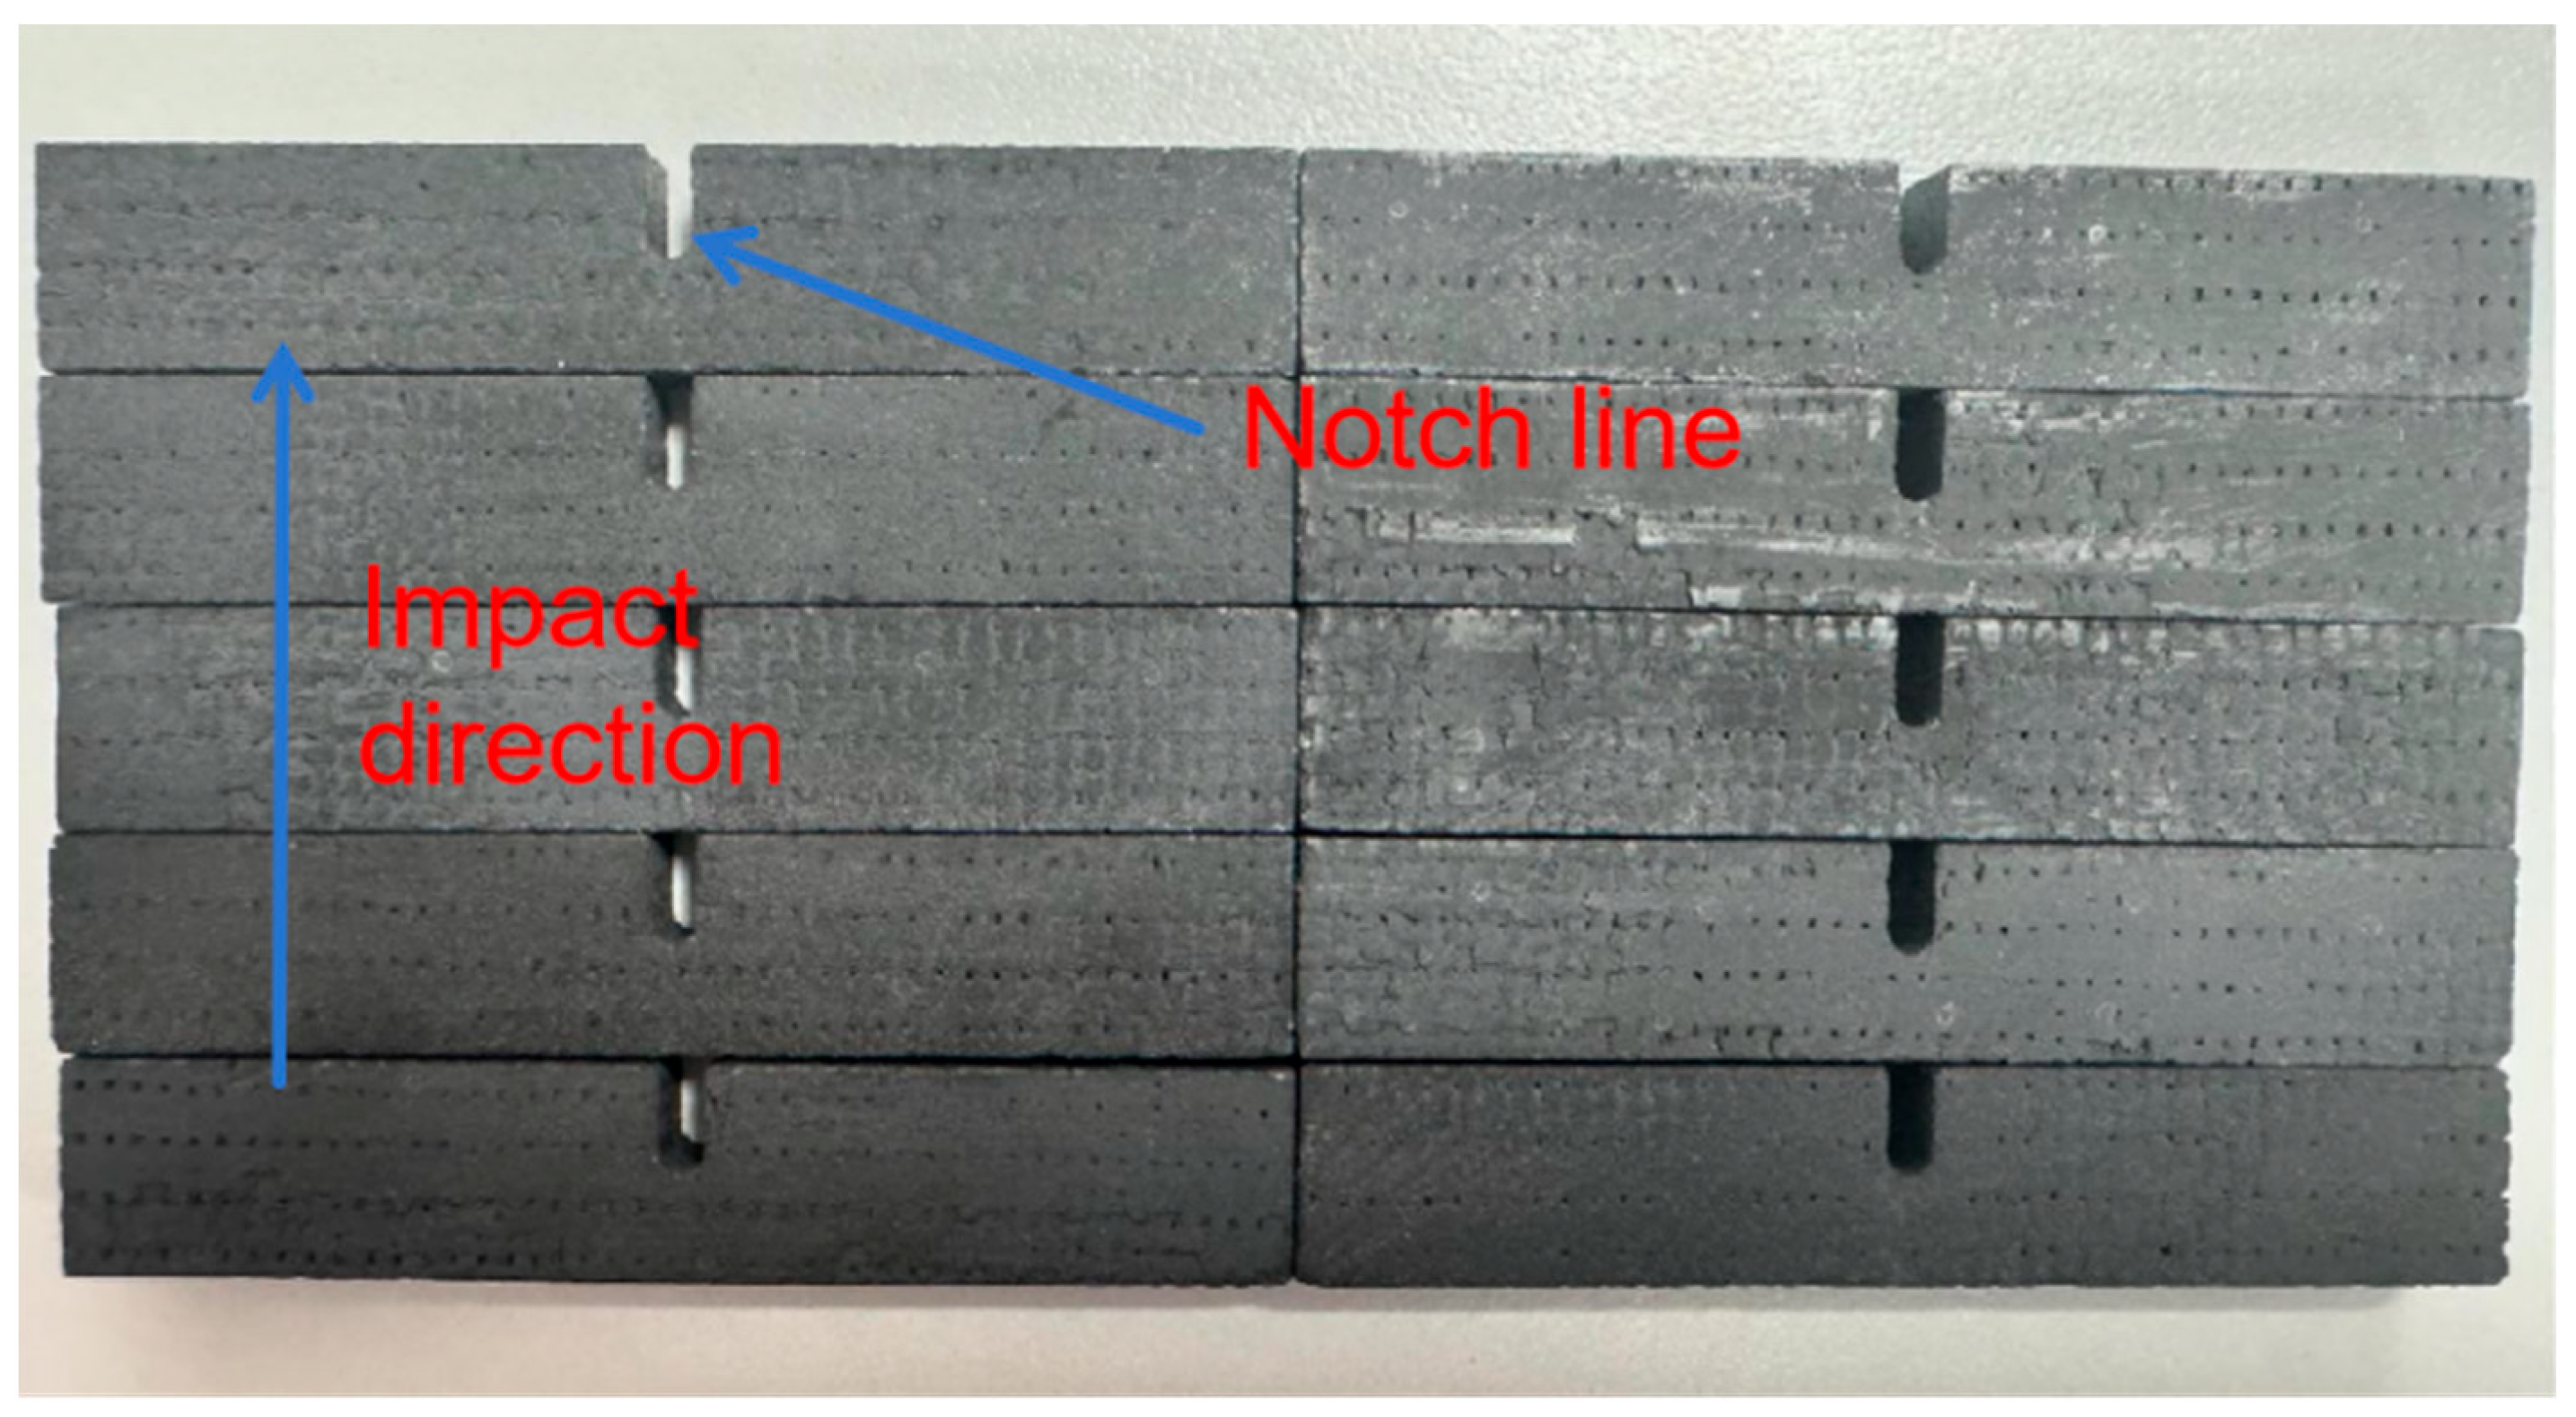
2.1. Sample Preparation

Preparation of SiC/SiC composite flat plate: The SiC fibers used in this work were purchased from Xiamen Torch Company, with a tensile strength of 3.2 GPa and a tensile modulus of 310 GPa. The 2.5D preform is woven from 90° fiber bundles in the weft direction and 0° fiber bundles in the warp direction and needle-punched fiber bundles. A BN interface (with a thickness of approximately 500 nm) was deposited via Chemical Vapor Infiltration (CVI), and then an SiC matrix was prepared through multiple CVI processes. Finally, a composite plate with a density of 2.35 g/cm3 and a porosity of 21.2% was obtained. Reparation of U-notched sample: The composite sheet was cut into samples with a size of 55 mm × 10 mm × 5 mm, and then the samples were U-notched with a notch depth of 5 mm and a radius of curvature at the bottom of 1 m. After processing, the SiC coating was then prepared by Chemical Vapor Deposition (CVD) to obtain the final sample, as shown in Figure 1.

2.2. Impact Test

Drop hammer testing machine (Instron CEAST 9340, Instron, Norwood, MA, USA) was used to conduct SiC/SiC impact tests. Before the start of the test, the sample was fixed at the bottom of the drop hammer using a self-designed mold, and the impact energy was controlled by setting the height of the drop hammer to 1.5 J, 2 J, 3 J, or 4 J. The velocity sensor on the top of the drop hammer impact bar was used to record the force and displacement of the sample during the impact process. Based on the force, displacement, time, and impact energy, the displacement–load curves, time–energy curves, and energy absorption rates of each sample can be obtained.

2.3. Impact Damage Detection

The fracture morphology of the fractured sample was observed by SEM (SEM, Tescan Clara GMH, CZ, TESCAN, Brno, Czech Republic), and the impact fracture mechanism of SiC/SiC composites was investigated by comparing the fracture morphologies under different impact energies and numbers of impacts. The damage mechanism of the material was obtained, the microstructural changes before and after the impact of the sample were observed by CT (AX-2000, Demark (Wuhan) Technology Co., Ltd., Wuhan, China), and the microstructural changes within the material were obtained by the different absorption ability of different materials for X-rays to study the energy absorption mode of SiC/SiC composites.

3. Results and Discussion

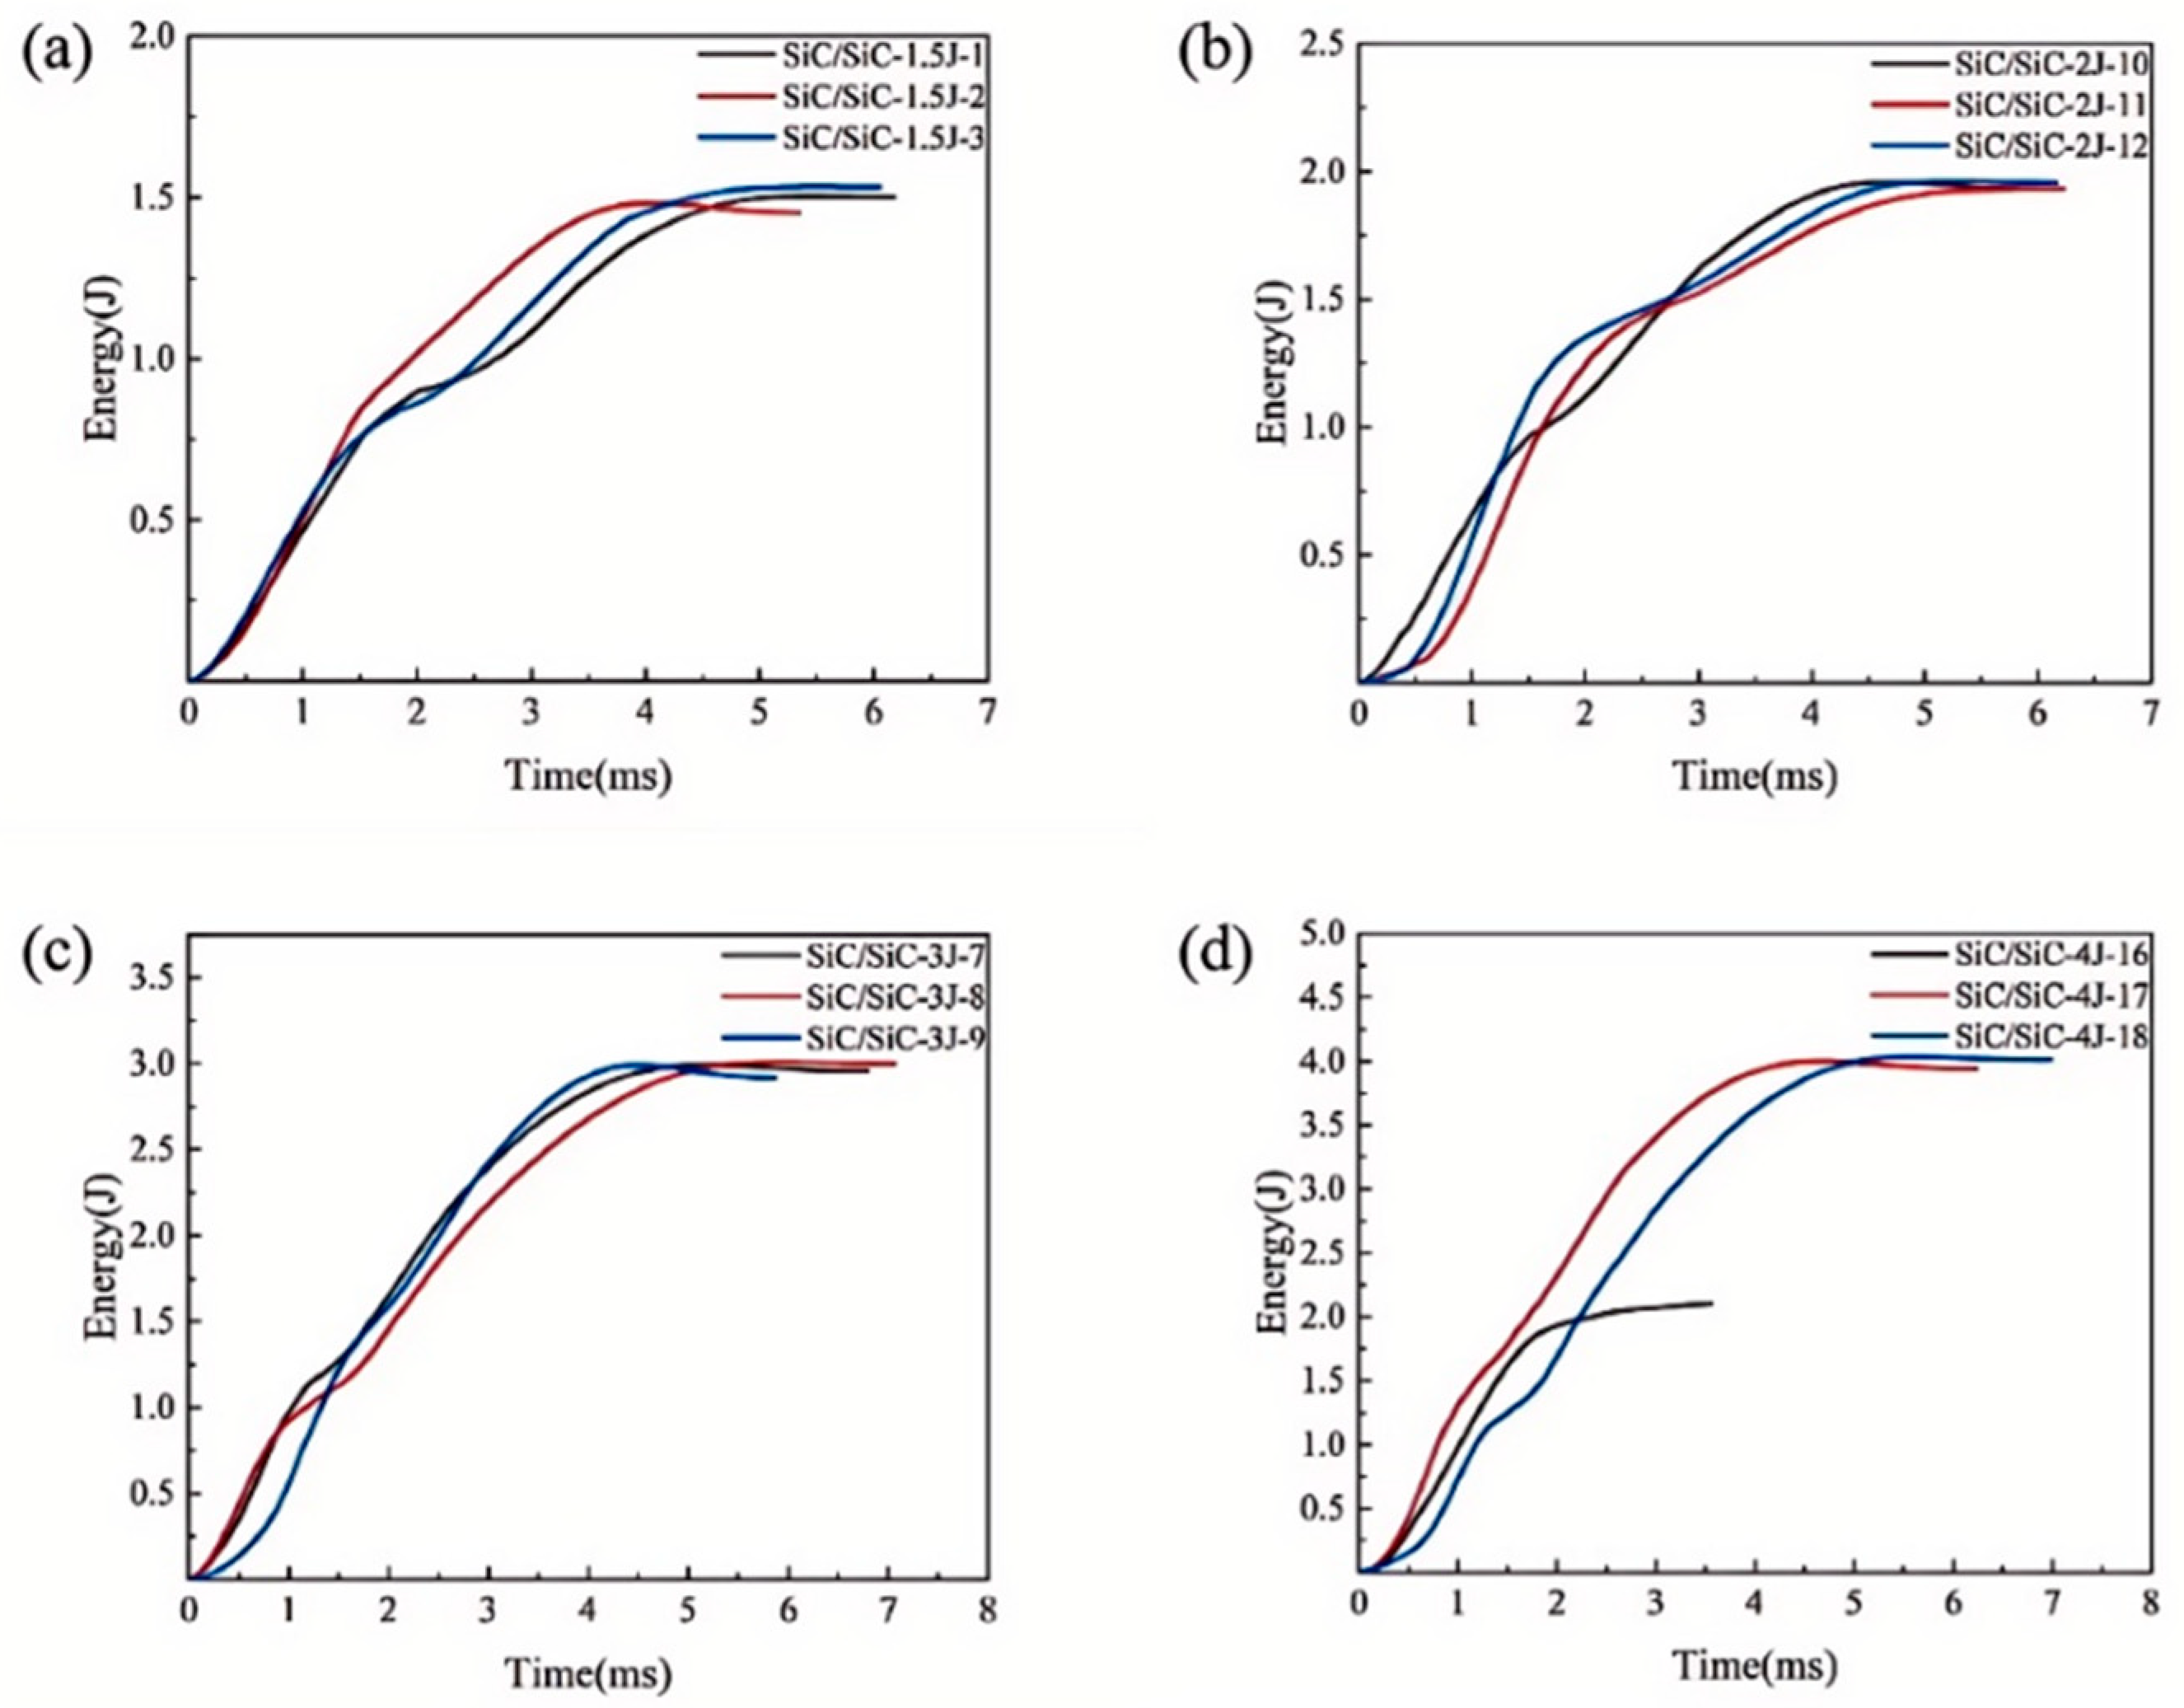
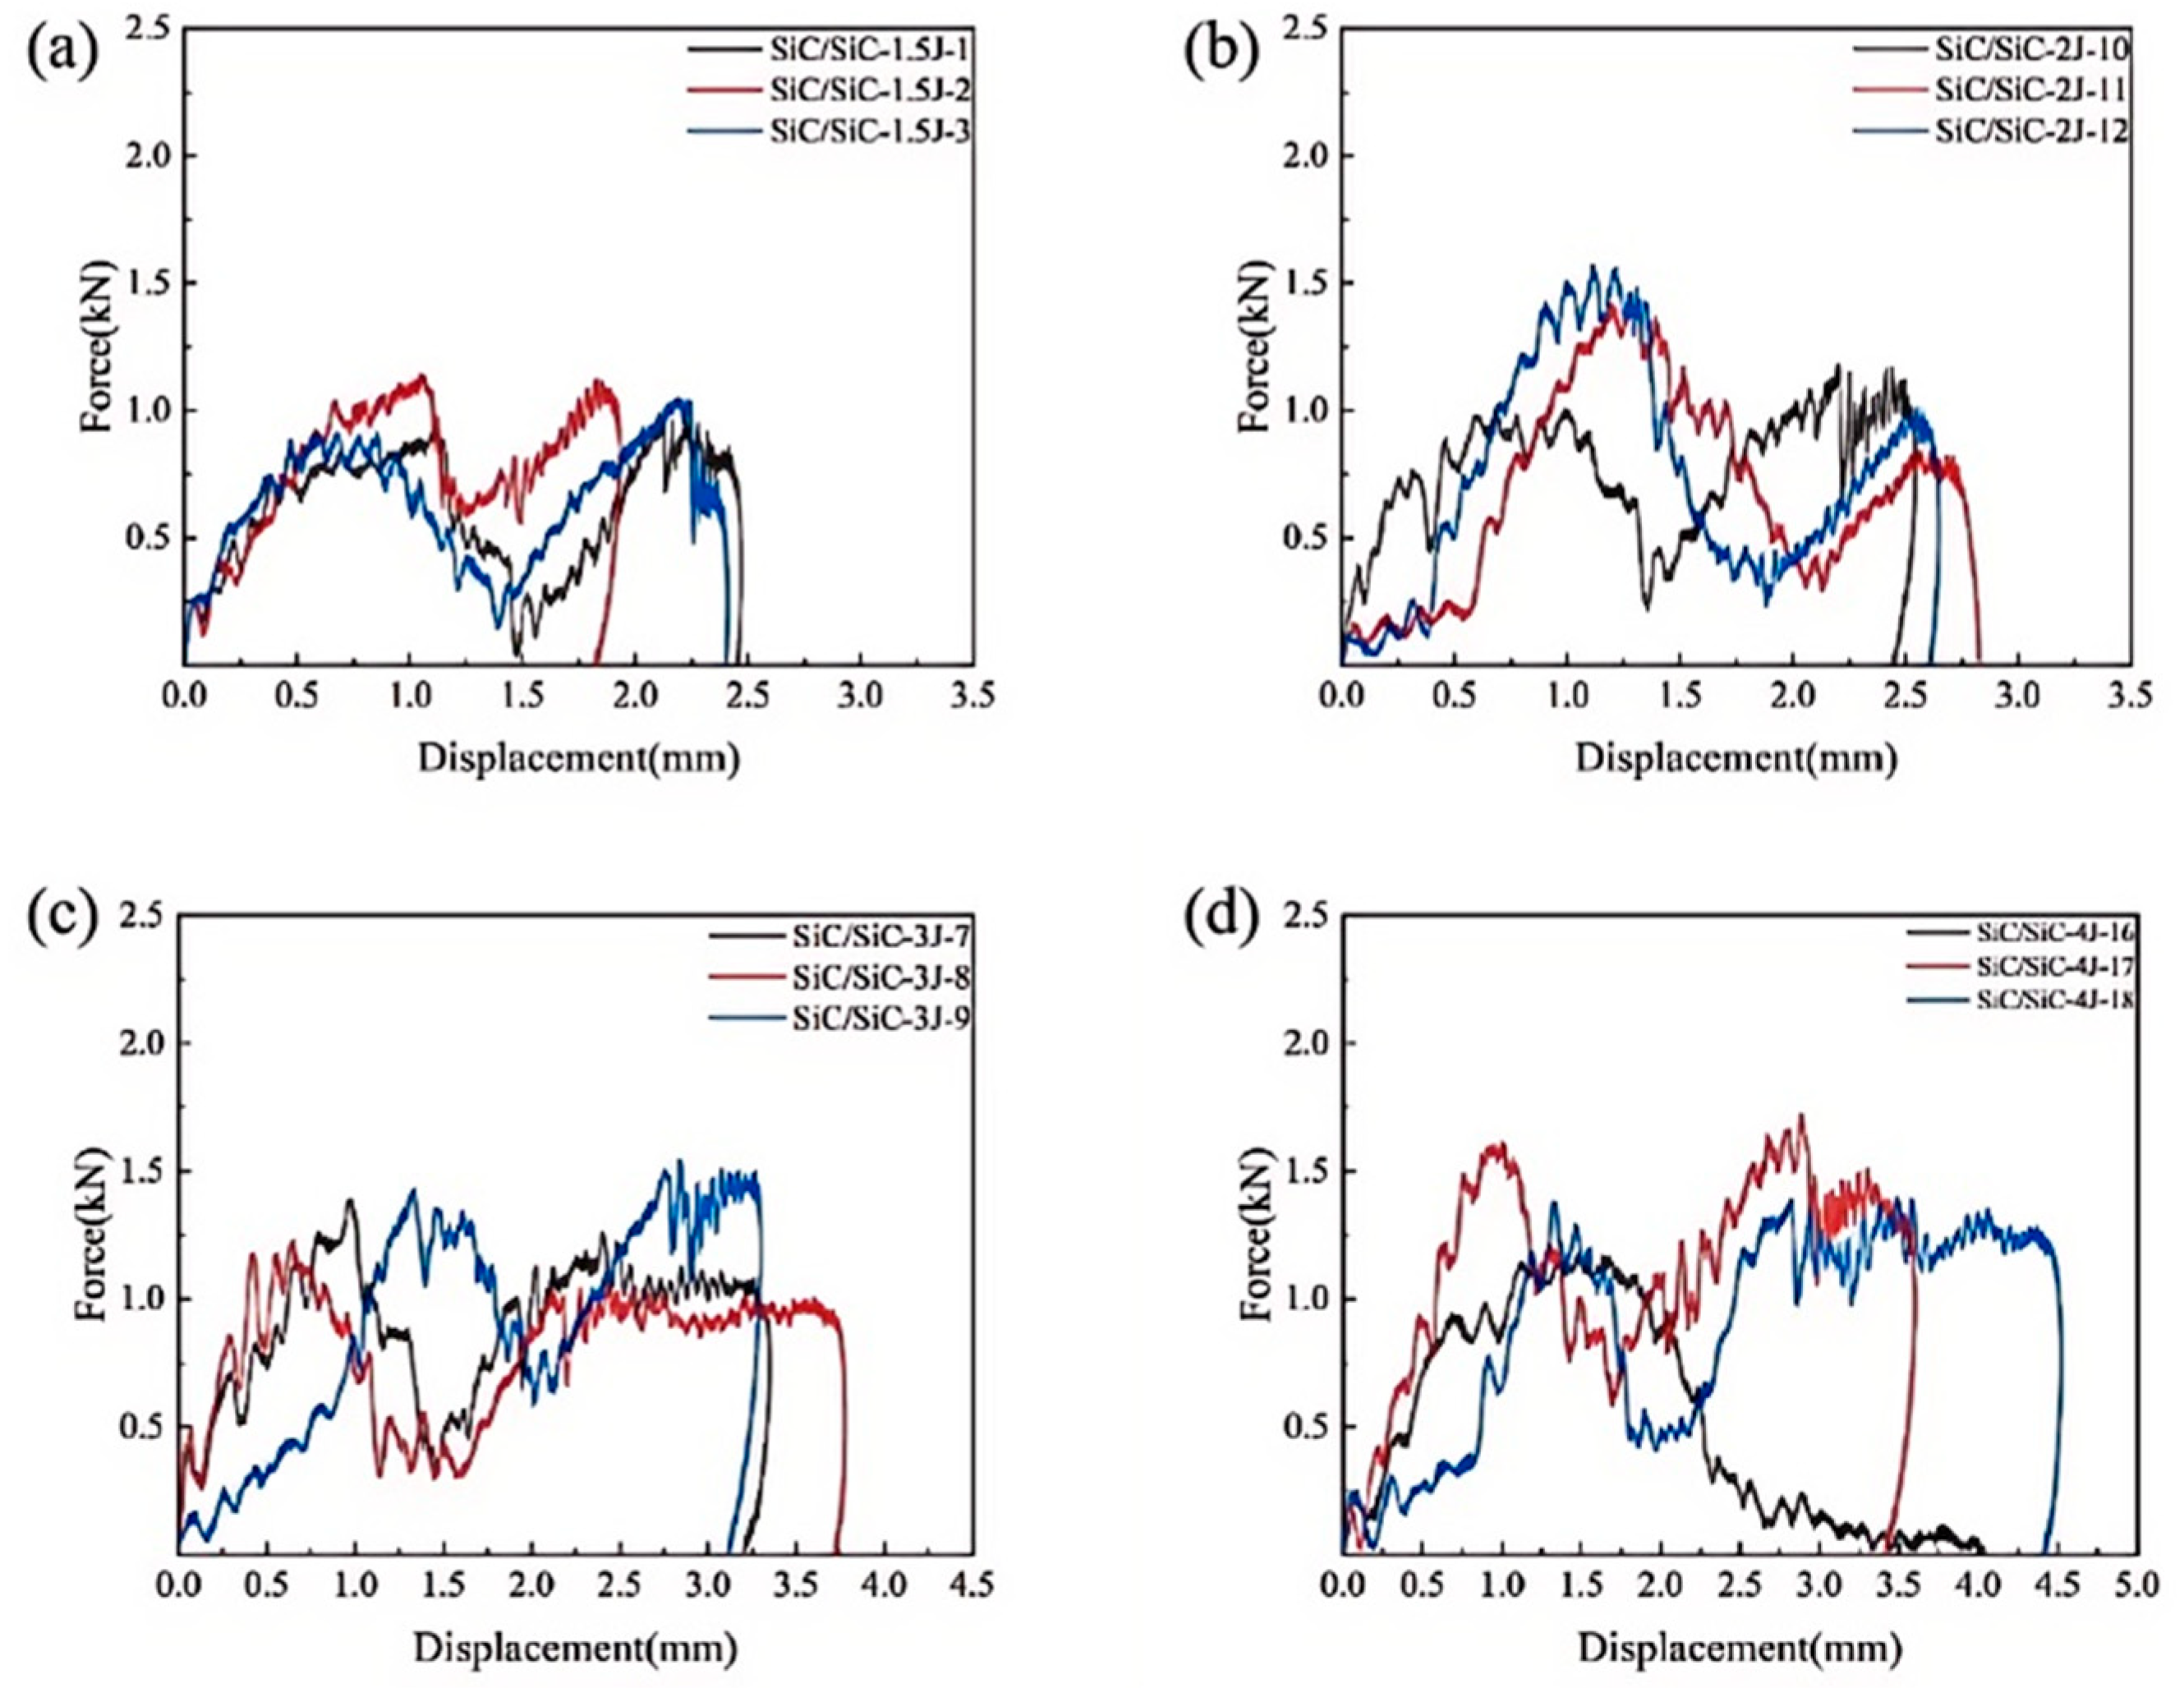
3.1. Impact Response Process
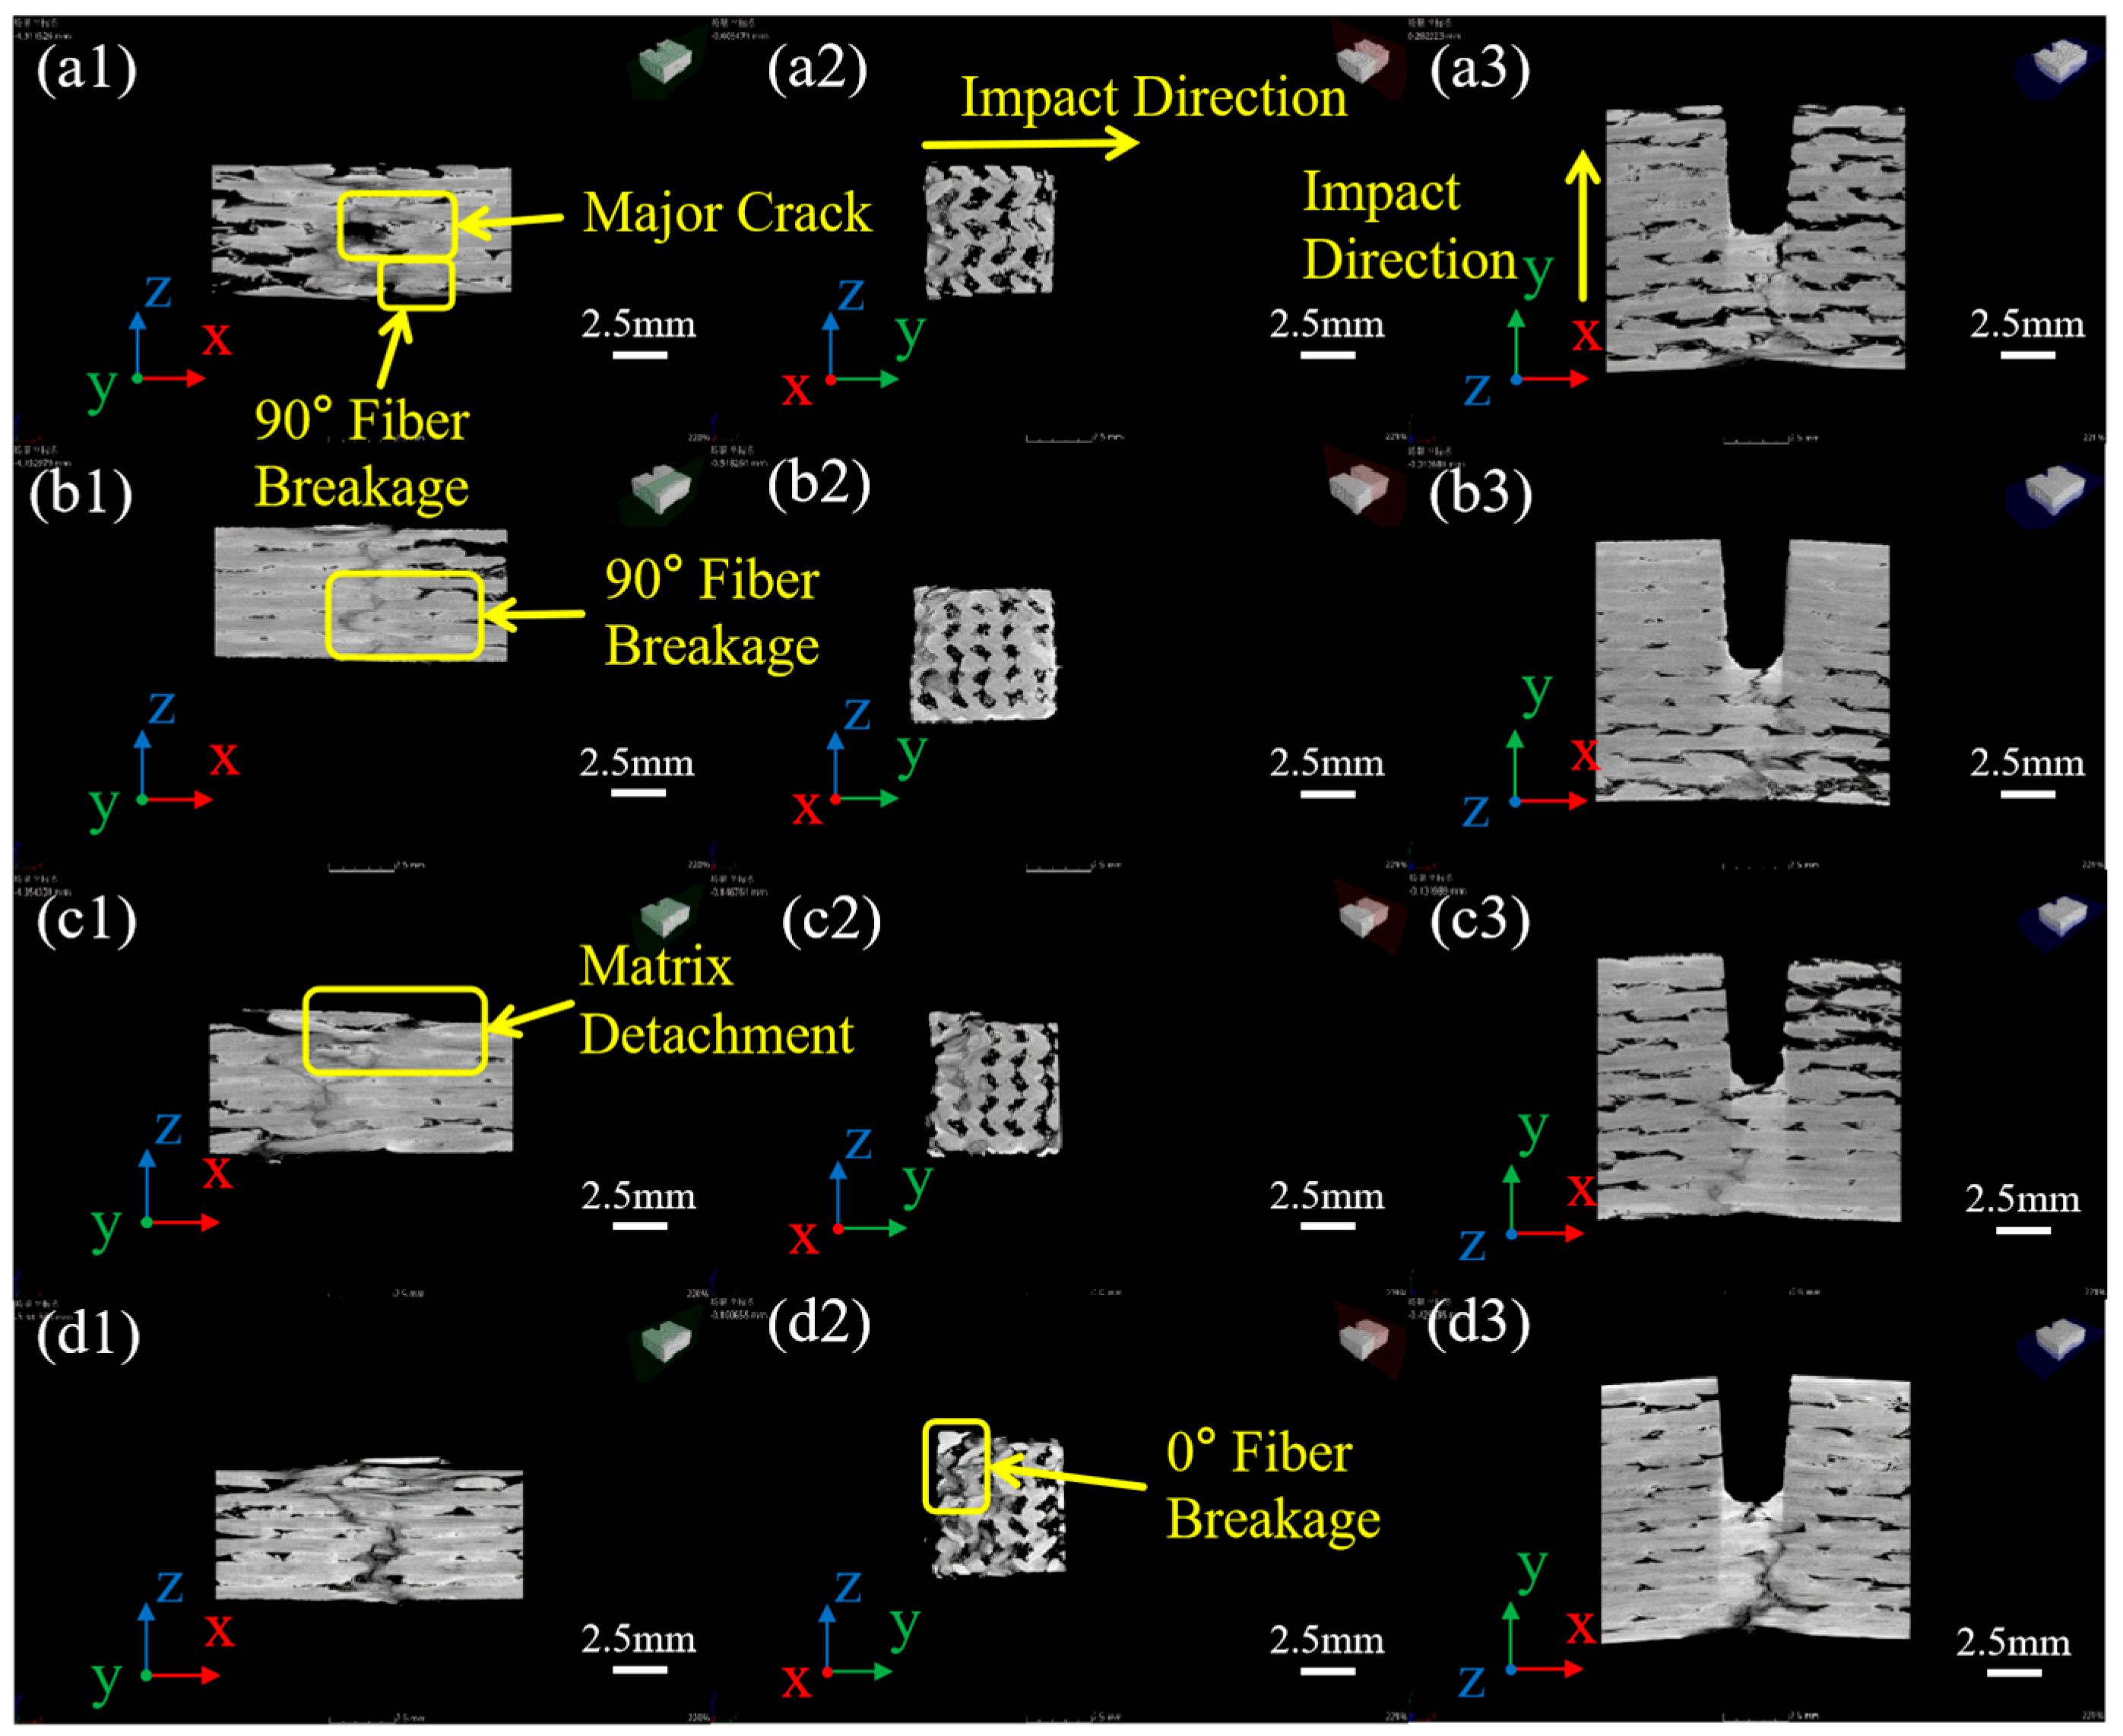
Figure 2 shows the impact curve of SiC/SiC—one sample after it was subjected to 1.5 J of impact energy. As shown in Figure 2a, according to the conventional three-stage curve, the energy–time curve of the sample can also be divided into a quasi-linear elastic region (black, blue), a severe load drop region (pink), and a rebound stage after the peak impact energy (green). However, different from the conventional three-stage law, there is a plateau stage (red) in the impact energy around 1 J. This stage is similar to the stage with a severe drop in load and the displacement rebound stage after the impact energy exceeds the peak. After this stage, the conventional three-stage curve reappears. Figure 2b shows the displacement–load curve for this sample, which is preceded by a near-linear stage (black in Figure 2b) corresponding to the quasi-linear elastic region of the energy–time curve, followed by a plateau stage (red in Figure 2b). After that, the conventional three-stage curve reappears. It is hypothesized that irreversible deformation of the sample occurs during the plateau stage, and that during the plateau stage and rebound stage, after the peak impact energy, some of the deformation of the sample is restored to give the falling hammer a force in the opposite direction of the impact to make the hammer rebound, and then the sample releases some of the impact energy. The energy at the end of the displacement rebound phase is the energy that is ultimately absorbed by the sample.

3.2. Impact Damage

Table 1 shows the impact energy absorption of the sample (impact energy absorption for all samples is given in Appendix A), and the energy absorbed by the sample E a is obtained by using the difference between the kinetic energy of the punch at the end of the impact and the kinetic energy of the initial punch, which is calculated using Equation (1). In order to measure the energy absorption of the sample during the impact, we define the ratio of the energy absorbed by the sample during the impact to the energy at the beginning of the impact as the energy absorption efficiency. The energy absorption efficiency E r of the sample is calculated from Equation (2).
E a = m g h 1 + m v 1 2 2 m g h 2 m v 2 2 2
E r = E a / ( E a + m v 2 2 / 2 )
where m is weight of the falling hammer, g is the acceleration of gravity, v 1 and v 2 are the velocities at the end and beginning of the hammer, and h 1 and h 2 are the heights at the end and beginning of the hammer.
For a sample with two impact energies of 1.5 J and 2 J, the difference between the kinetic energy of the punch at the end of the two impacts and the kinetic energy of the two initial punches is used to obtain the energy absorbed by the sample, E t a , which is calculated using Equation (3). Again the ratio of the energy absorbed by the sample during the impact to the energy at the beginning of the impact is defined as the energy absorption efficiency. The energy absorption efficiency E t r of the sample is calculated from Equation (4).
E t a = m g h 1 + h 3 + m v 1 2 + v 3 2 2 m g h 2 + h 4 m v 2 2 + v 4 2 2
E t r = E t a / [ E t a + m v 2 2 + v 4 2 / 2 ]
where m is the weight of the falling hammer, g is the acceleration of gravity, v 1 and v 3 are the speeds at the end and beginning of the first fall of the hammer, v 2 and v 4 are the speeds at the end and beginning of the second fall of the hammer, h 1 and h 3 are the heights at the end and beginning of the first fall of the hammer, and h 2 and h 4 are the heights at the end and beginning of the second fall of the hammer.

3.2.1. Effect of Impact Energy

Figure 3 shows the energy–time curves of the samples at different energies. Combined with Table 1, it can be seen that the energy absorption rate is the lowest under the impact energy of 4 J, and the end of the energy–time curve of the No. 16 sample shows a rising state, which indicates that the sample is fractured before the peak energy absorption. When the impact energy is 1.5 J, it can be seen from Figure 3a that the plateau stage of the samples all appeared below the impact energy of 1 J, near 1.5 ms, and the peak energy of the samples appeared around 4 ms; when the impact energy is 2 J (as shown in Figure 3b), the plateau stage of the samples appeared at the impact energy of 1 J, near 1.5 ms, and the peak energy appeared around 4 ms; when the impact energy is 3 J (as in Figure 3c), the plateau stage of the samples all appeared at an impact energy slightly larger than 1 J, near 1.5 ms, and the peak energy appeared around 4 ms; when the impact energy is 4 J (as in Figure 3d), the plateau stage of the samples all appeared at an impact energy of 1.25 J, near 1.5 ms, and sample No. 16 broke at the plateau stage, with the peak energy appearing around 4 m. It can be seen that, with the increase in impact energy, the peak energy appeared at about 4 ms. The impact energy slightly increased when the plateau stage appeared, so the slope of the energy–time curve in the on-line elasticity section increased, which also indicates that the rate of energy absorption increased.
Figure 4 shows the displacement–load curves of the samples under different impact energies, and it can be seen from the figure that a notch appears in the curve, corresponding to the plateau stage in the above energy–time curve. When the impact energy is 1.5 J (Figure 4a), there is a plateau stage, the displacement is lower than 1 mm, and at the end of the impact, the displacement is around 2.25 mm; when the impact energy is 2 J (Figure 4b), there is a plateau stage, the displacement is around 1 mm, and at the end of the impact, the displacement is around 2.75 mm; when the impact energy is 3 J (Figure 4c), there is a plateau stage, the displacement is around 1.25 mm, and at the end of the impact, the displacement is about 3.5 mm; and when the impact energy is 4 J (Figure 4d), when the plateau stage occurs, the displacement is about 1.5 mm, and at the end of the impact, the displacement is about 4 mm, and it can be seen that the displacement of sample No. 16 at the end of the sample is also up to 4 mm. As can be seen, with the increase in the impact energy, the displacement of the impacted part of the sample becomes larger when the plateau stage occurs; at the end of the impact, the displacement of the impacted part of the sample becomes larger.
Figure 5 shows the CT scanning results in the vicinity of damage for some unbroken samples after impact. These samples were fractured by the impact of the main crack along the Y-direction, in addition to the non-negligible damage seen in the X- and Z-directions. From Figure 5(a3,b3,c3,d3), in the XY plane view, it can be seen that the most damaged area is the area where the sample first made contact with the falling hammer. Since the impact direction is perpendicular to the weft direction, it can be seen in Figure 5(a1) that the breakage of the fiber bundle at 90° in the weft direction already occurs at an impact energy of 1.5 J. Combined with the plateau stage in the energy–time curve mentioned above, with the plateau stage occurring at about 1 J of impact energy, we can conclude that the reason for the plateau stage is the breakage of the fiber bundle at 90° in the weft direction. Compared with Figure 5(b1,c1,d1), with the increase in impact energy, the breakage of 90° fibers in the weft direction increases significantly, the crack extension paths of the samples become longer, and the matrix shedding phenomenon and the breakage of 0° fibers in the warp direction appear in the samples with the impact energies of 3 and 4 J. The above phenomena show that although the four samples did not break under the four impact energies, there are differences in their energy absorption mode. All four energies can penetrate the 90° fibers, but the impact energies of 1.5 J and 2 J cannot penetrate the 0° fibers, while the impact energies of 3 J and 4 J can penetrate the 0° fibers and cause the matrix to break and fall off.

3.2.2. Effect of Impact Times

Figure 6 shows the energy–time curve and displacement–load curve of the samples with a total impact energy of 3 J for different impact times. For the samples with two impacts of 1.5 J, the energy absorption rate and impact displacement of the second impact did not change significantly, and the total energy absorption rate of the two impacts was similar to that of the single 3 J impact, but the second impact did not show the plateau stage of the first impact, which further indicates that the 90° fiber bundle in the weft direction had already broken during the first impact, resulting in no subsequent plateau stage. Figure 7 shows the CT scanning results of some unbroken samples after two impacts of 1.5 J, and it can be seen that the samples subjected to 2 × 1.5 J energy impacts have obvious matrix shedding and 0° fiber bundle breakage in the direction of the warp yarns, and combined with Figure 5(a1), it can be observed that the first 1.5 J impact has already caused the breakage of the 90° fiber bundles, and with the second impact, matrix shedding and breakage of the 0° fiber bundle in the warp direction absorbs the energy of the impact, which results in no significant change in the energy absorption rate and impact displacement of the samples. Comparing Figure 5(c1,c2,c3), it can be seen that the fiber bundle breakage at 90° and 0° is more obvious and the matrix damage is more serious for the 2 × 1.5 J of impact energy compared with the 3 J of impact energy. This phenomenon suggests that multiple impacts may damage the sample more severely than a single impact with the same total energy.
Figure 8 shows the energy–time curve and displacement–load curve of the samples with different impact times and a total impact energy of 4 J. Except for sample No. 16, which broke before the peak of the absorbed energy, for the samples with two impacts of 2 J, the energy absorption rate and displacement of the second impact are similar to the first one. Comparing with a single impact of 4 J, the energy absorption rate of the remaining samples is similar to that of a single impact of 4 J. The total energy absorption rate of the two impacts is similar to that of a single 4 J energy impact, and it can also be seen that the second impact also does not show the plateau stage seen with the first impact, which can also be explained by the fact that the plateau stage does not occur due to the breakage of the 90° fiber bundles in the direction of the weft yarns. Figure 9 shows the CT scanning results of some unbroken samples after two impacts of 2 J, which show a similar situation to that of the 2 × 1.5 J and 3 J energy shocks. It can be seen that the samples subjected to the 2 × 2 J impacts have more obvious 90° and 0° fiber breaks and the crack extension paths of the samples have become significantly longer than those in the 4 J impacts in Figure 4.
Figure 10 shows the fracture morphology of the near U-port region of samples No. 4, 9, 13, and 16, from which it can be seen that there is an obvious brittle fracture and pullout of the 90° fibers, as well as a fracture of the matrix and debonding of the 90° needled fibers connecting the fibers and the matrix, enhancing the interfacial bonding force between the fibers and the matrix. A comparison of 2 × 1.5 J Figure 10(a2) and 2 × 2 J Figure 10(b2), along with 3 J Figure 10(c2) and 4 J Figure 10(d2), shows that the fracture and debonding of the 90° fibers are more severe with increasing impact energies. Also comparing the fiber debonding in Figure 10(a1) for 2 × 1.5 J and Figure 10(c1) for 3 J, along with Figure 10(b1) for 2 × 2 J and Figure 10(d1) for 4 J, it can be observed that under conditions with the same total impact energy, the fiber debonding becomes more severe as the number of impacts increases. This indicates that during the impact process, the internal damage of the composite material continues to accumulate, and the structural integrity is gradually destroyed. By comparing the fiber pull-out lengths in Figure 10(c1) for 3 J and Figure 10(d1) for 4 J, along with Figure 10(a1) for 2 × 1.5 J and Figure 10(b1) for 2 × 2 J, it can be observed that the fiber pull-out length increases with the increase in impact energy. This indicates that the friction between the fibers and the matrix increases during the impact process, thereby consuming more energy, which also demonstrates that fibers play a good reinforcing role in the composite material. Meanwhile, by comparing the fiber pull-out lengths in Figure 10(a1) for 2 × 1.5 J and Figure 10(c1) for 3 J, along with Figure 10(b1) for 2 × 2 J and Figure 10(d1) for 4 J, it was found that under conditions with the same total impact energy, the fiber length also increases with the increase in the number of impacts. This phenomenon suggests that during fiber fracture and pull-out under multiple impacts, more resistance needs to be overcome, which is consistent with the aforementioned conclusion that multiple impacts cause greater damage to the composite material.

4. Conclusions

The damage from a low-speed impact on 2.5D SiC/SiC composites cannot be ignored. At an impact energy of about 1 J, the 90° fiber bundles in the weft direction of the sample will be fractured, which leads to a plateau stage on the energy absorption–time curve. The second impact does not exhibit this stage, which is unique to 2.5D SiC/SiC composites under low-speed impact conditions. The 2.5D U-notch samples can be broken by a single impact with 3 J and 4 J. With the increase in impact energy, the breakage of 90° fibers in the weft direction increases significantly, and the crack extension path of the samples becomes longer. When matrix shedding and 0° fiber bundle breakage in the warp direction occur in samples with 3 J and 4 J of impact energy, it can be seen from the fracture morphology that as the impact energy increases, the pull-out length of the fibers and the occurrence of fiber debonding increases, indicating that the fiber fracture has overcome greater resistance. In the case of the same total impact energy, with an increase in the number of impacts, cumulative damage occurs inside the composite material, indicating that the damage to the samples is more serious in multiple impacts than in single impacts. A brittle fracture and debonding of 90° fibers at impact energies of 3 J, 4 J, 2 × 1.5 J, and 2 × 2 J can be seen in the fracture.

Author Contributions

Conceptualization, J.T. and X.L.; methodology, J.T.; software, X.D.; validation, J.T., X.L. and L.C.; formal analysis, X.D.; investigation, D.H.; resources, J.T.; data curation, X.D.; writing—original draft preparation, X.D.; writing—review and editing, X.L.; visualization, J.T.; supervision, X.L.; project administration, X.L.; funding acquisition, J.T. and X.L. All authors have read and agreed to the published version of the manuscript.

Funding

This research was funded by the Sichuan Science and Technology Program, grant No. 2024ZYD0259.

Data Availability Statement

The original contributions presented in this study are included in the article. Further inquiries can be directed to the corresponding author.

Acknowledgments

The authors are indebted to the Analytical and Testing Centre of Northwestern Polytechnical University for their invaluable support.

Conflicts of Interest

Author Jianyong Tu was employed by the company Xi’an Golden Mountain Ceramic Composites Co., Ltd. The remaining authors declare that the research was conducted in the absence of any commercial or financial relationships that could be construed as a potential conflict of interest. The company had no role in the design of the study; in the collection, analyses, or interpretation of data; in the writing of the manuscript, or in the decision to publish the results.

Appendix A

Table A1. Energy absorption capacity of all samples.
SampleImpact Energy/JEr/%Etr/%h/mmCase of Sample Fracture
11.599.88/2.453Unbroken
21.598.19/1.823Unbroken
31.599.97/2.402Unbroken
41.5(1)95.7497.862.738Unbroken
1.5(2)99.982.851Broken
51.5(1)97.6497.211.558Unbroken
1.5(2)96.772.478Unbroken
61.5(1)99.9799.162.008Unbroken
1.5(2)98.342.303Unbroken
7399.02/3.206Unbroken
8399.78/3.724Unbroken
9397.80/3.118Broken
10298.83/2.442Unbroken
11299.95/2.827Unbroken
12299.68/2.610Unbroken
132(1)97.7395.911.999Unbroken
2(2)94.091.626Broken
142(1)99.8599.402.831Unbroken
2(2)98.952.516Unbroken
152(1)99.2398.462.260Unbroken
2(2)97.691.911Unbroken
16453.03/4.039Broken
17498.67/3.412Unbroken
18499.48/4.413Unbroken
1.5(1), 1.5(2), 2(1), and 2(2) refer to the times of impact.

References

  1. Zhao, Z.; Zhu, L.; Xu, P.; Ning, J.; Yang, Z. Effect of SiC content on the process and properties of PDMS/SiC composites by direct ink writing. Ceram. Int. 2025, 51, 5241–5248. [Google Scholar] [CrossRef]
  2. Zhang, S.; Gao, X.; Chen, J.; Dong, H.; Song, Y. Strength model of the matrix element in SiC/SiC composites. Mater. Des. 2016, 101, 66–71. [Google Scholar] [CrossRef]
  3. Han, X.; Gao, X.; Song, Y. Effect of heat treatment on the microstructure and mechanical behavior of SiC/SiC mini-composites. Mater. Sci. Eng. A 2018, 746, 94–104. [Google Scholar] [CrossRef]
  4. Frankel, P.; Withers, P.; Preuss, M.; Wang, H.; Tong, J.; Rugg, D. Residual stress fields after FOD impact on flat and aerofoil-shaped leading edges. Mech. Mater. 2012, 55, 130–145. [Google Scholar] [CrossRef]
  5. Yin, D.; Deng, Y.; Ma, Y.; Fan, X. Effect of SiC content on the mechanical behaviour of a three-dimensional needled C/SiC composite. Ceram. Int. 2021, 47, 25067–25073. [Google Scholar] [CrossRef]
  6. Mei, H.; Yu, C.; Xu, Y.; Han, D.; Cheng, L. Effect of impact energy on damage resistance and mechanical property of C/SiC composites under low velocity impact. Mater. Sci. Eng. A 2017, 687, 141–147. [Google Scholar] [CrossRef]
  7. Yao, L.; Lyu, P.; Bai, G.; Augousti, A. Influence of low velocity impact on oxidation performance of SiC coated C/SiC composites. Ceram. Int. 2019, 45, 20470–20477. [Google Scholar] [CrossRef]
  8. Neto, J.; da Cunha, R.; Targino, T.; da Cunha, R.; de Amorim Jr, W.; Freire, R., Jr. Study of the Mechanical Behavior of Low-Velocity Impact Loading in the Presence of Stress Concentrators. J. Mater. Eng. Perform. 2023, 32, 10783–10792. [Google Scholar] [CrossRef]
  9. Kharghani, N.; Guedes Soares, C. Behavior of composite laminates with embedded delaminations. Compos. Struct. 2016, 150, 226–239. [Google Scholar] [CrossRef]
  10. Chen, X. Foreign object damage on the leading edge of a thin blade. Mech. Mater. 2005, 37, 447–457. [Google Scholar] [CrossRef]
  11. Ding, J.; Hall, R.; Byrne, J.; Tong, J. Fatigue crack growth from foreign object damage under combined low and high cycle loading. Part 1: Experimental studies. Int. J. Fatigue 2007, 29, 1339–1349. [Google Scholar] [CrossRef]
  12. Ogi, K.; Okabe, T.; Takahashi, M.; Yashiro, S.; Yoshimura, A.; Ogasawara, T. Experimental characterization of high-speed impact damage behavior in a three-dimensionally woven SiC/SiC composite. Compos. Part A 2010, 41, 489–498. [Google Scholar] [CrossRef]
  13. Herb, V.; Martin, E.; Couegnat, G. Damage analysis of thin 3D-woven SiC/SiC composite under low velocity impact loading. Compos. Part A 2012, 43, 247–253. [Google Scholar] [CrossRef]
  14. Wu, J.; Xu, P.; Jing, R.; Zhang, D.; Fei, Q. Experimental Study on Low-velocity Impact and Residual Strength of SiC/SiC Composite Laminates. J. Inorg. Mater. 2024, 39, 51–60. [Google Scholar] [CrossRef]
  15. Chen, M.; Qiu, H.; Chen, Y.; Zhang, Q.; Liu, S. Study on fracture toughness and impact toughness of SiCf/SiC composites. J. Aust. Ceram. Soc. 2023, 59, 325–332. [Google Scholar] [CrossRef]
  16. Liu, B.; Gao, Y.; Tan, Z.; Ye, F.; Cheng, L. Low energy level impact damage on 2D C/SiC composites: Experimental study. Acta Aeronaut. Astronaut. Sin. 2021, 42, 224202. [Google Scholar]
Figure 1. Picture of U-notched samples.
Jcs 09 00388 g001
Figure 2. Impact response of 2.5D SiC/SiC sample subjected to 1.5 J impact: (a) Displacement–load curve and (b) energy–time curve.
Jcs 09 00388 g002
Figure 3. Energy–time curve of samples at different impact energies: (a) 1.5 J, (b) 2 J, (c) 3 J, and (d) 4 J.
Jcs 09 00388 g003
Figure 4. Displacement–load curve of samples at different impact energies: (a) 1.5 J, (b) 2 J, (c) 3 J, and (d) 4 J.
Jcs 09 00388 g004
Figure 5. CT scan results of 2.5D SiC/SiC samples after impact. XZ plane: (a1) 1.5 J, (b1) 2 J, (c1) 3 J; and (d1) 4 J; YZ plane: (a2) 1.5 J, (b2) 2 J, (c2) 3 J, and (d2) 4 J; XY plane: (a3) 1.5 J, (b3) 2 J, (c3) 3 J, and (d3) 4 J.
Jcs 09 00388 g005
Figure 6. Energy–time curve and displacement–load curve of 2.5D SiC/SiC samples at different impact times with total energy of 3 J. Energy–time curve: (a) 2 × 1.5 J and (b) 3 J; displacement–load curve: (c) 2 × 1.5 J and (d) 3 J.
Jcs 09 00388 g006
Figure 7. CT scan results of 2.5D SiC/SiC samples after two impacts of 1.5 J each: (a) XZ plane, (b) YZ plane, and (c) XY plane.
Jcs 09 00388 g007
Figure 8. Energy–time curve and displacement–load curve of 2.5D SiC/SiC samples at different impact times with total energy of 4 J. Energy–time curve: (a) 2 × 2 J and (b) 4 J; displacement–load curve: (c) 2 × 2 J and (d) 4 J.
Jcs 09 00388 g008
Figure 9. CT scan results of 2.5D SiC/SiC samples after two impacts of 2 J each: (a) XZ plane, (b) YZ plane, and (c) XY plane.
Jcs 09 00388 g009
Figure 10. Fracture morphology of samples at different energies: (a1,a2) 2 × 1.5 J sample No. 4, (b1,b2) 2 × 2 J sample No. 13, (c1,c2) 3 J sample No. 9, and (d1,d2) 4 J sample No. 16.
Jcs 09 00388 g010
Table 1. Energy absorption capacity of samples.
SampleImpact Energy/JEr/%Etr/%h/mmCase of Sample Fracture
11.599.88/2.453Unbroken
41.5(1)95.7497.862.738Unbroken
1.5(2)99.982.851Broken
9397.80/3.118Broken
10298.83/2.442Unbroken
132(1)97.7395.911.999Unbroken
2(2)94.091.626Broken
16453.03/4.039Broken
1.5(1), 1.5(2), 2(1), and 2(2) refer to the times of impact.
Disclaimer/Publisher’s Note: The statements, opinions and data contained in all publications are solely those of the individual author(s) and contributor(s) and not of MDPI and/or the editor(s). MDPI and/or the editor(s) disclaim responsibility for any injury to people or property resulting from any ideas, methods, instructions or products referred to in the content.

