

Numerical Far-Field Investigation into Guided Waves Interaction at Weak Interfaces in Hybrid Composites


Abstract
1. Introduction
2. Problem of Investigation
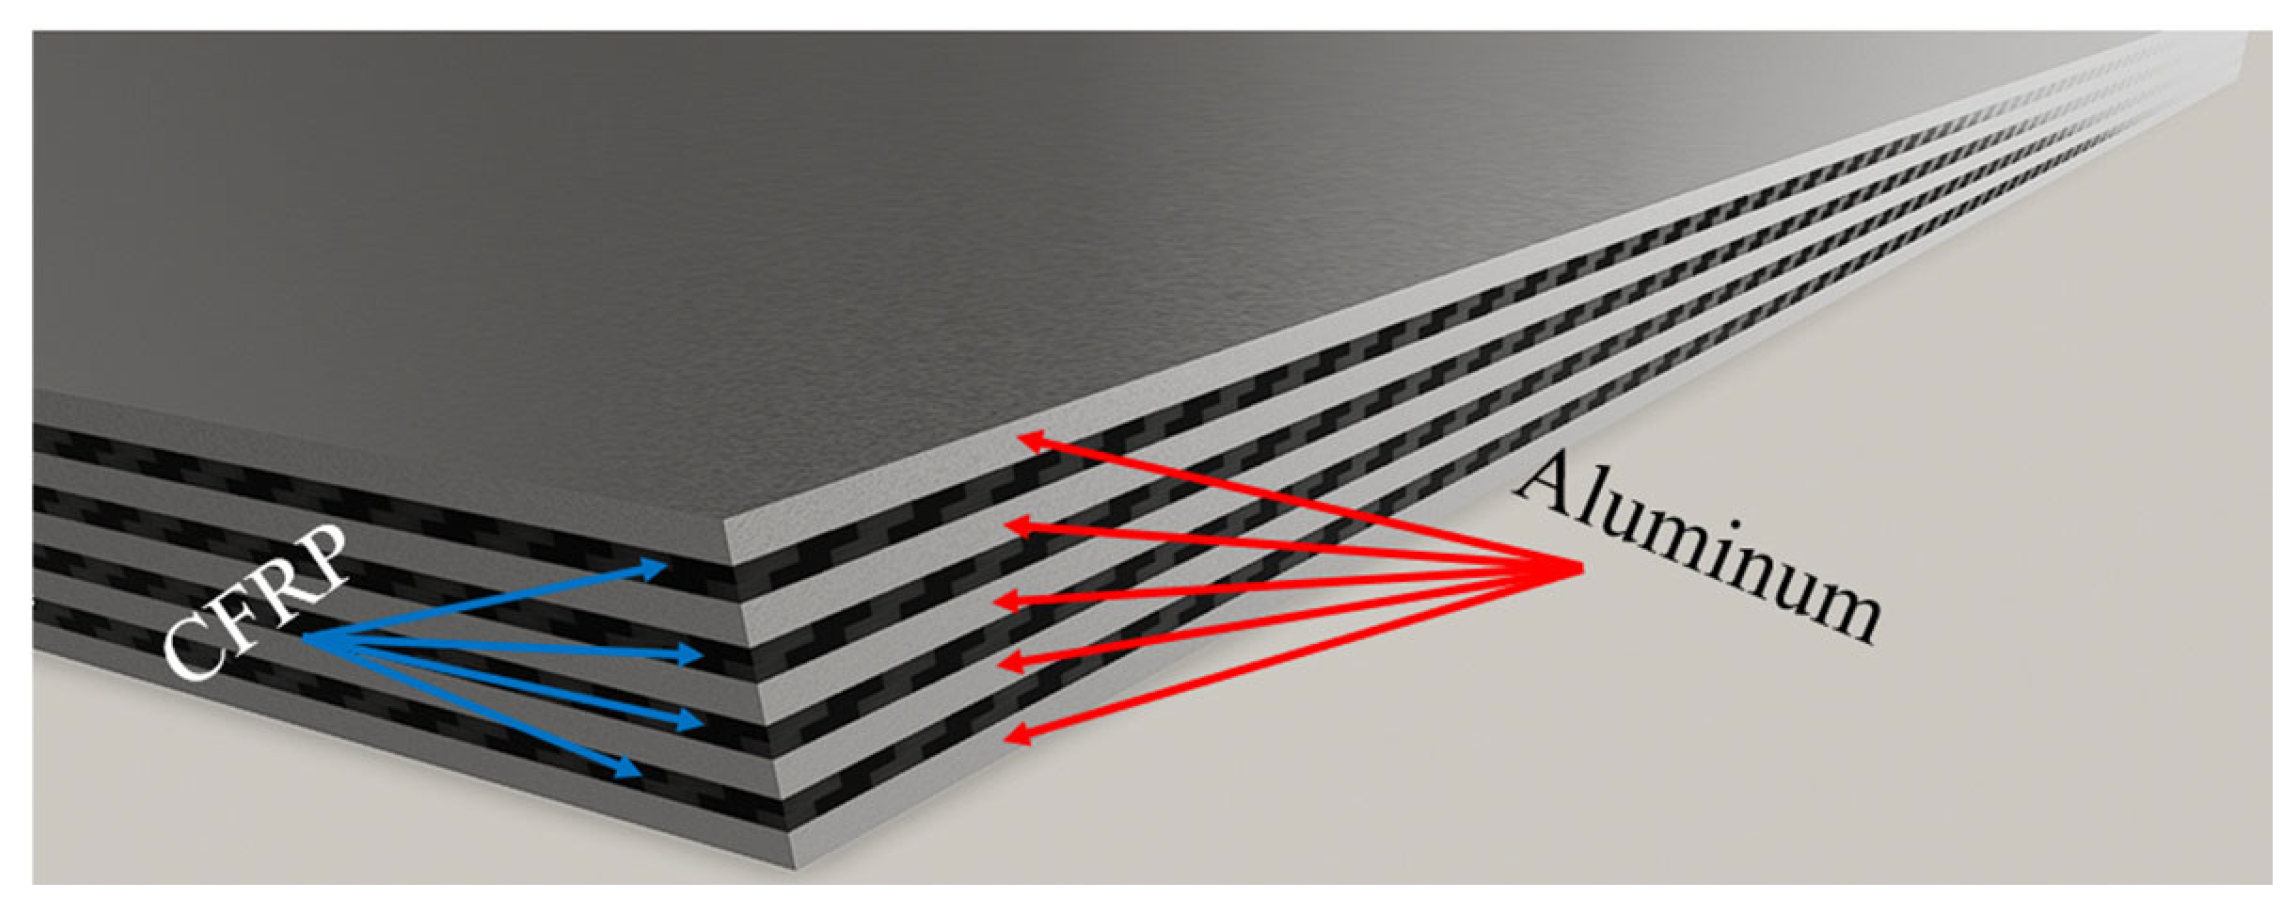
2.1. Material Domain Under Investigation
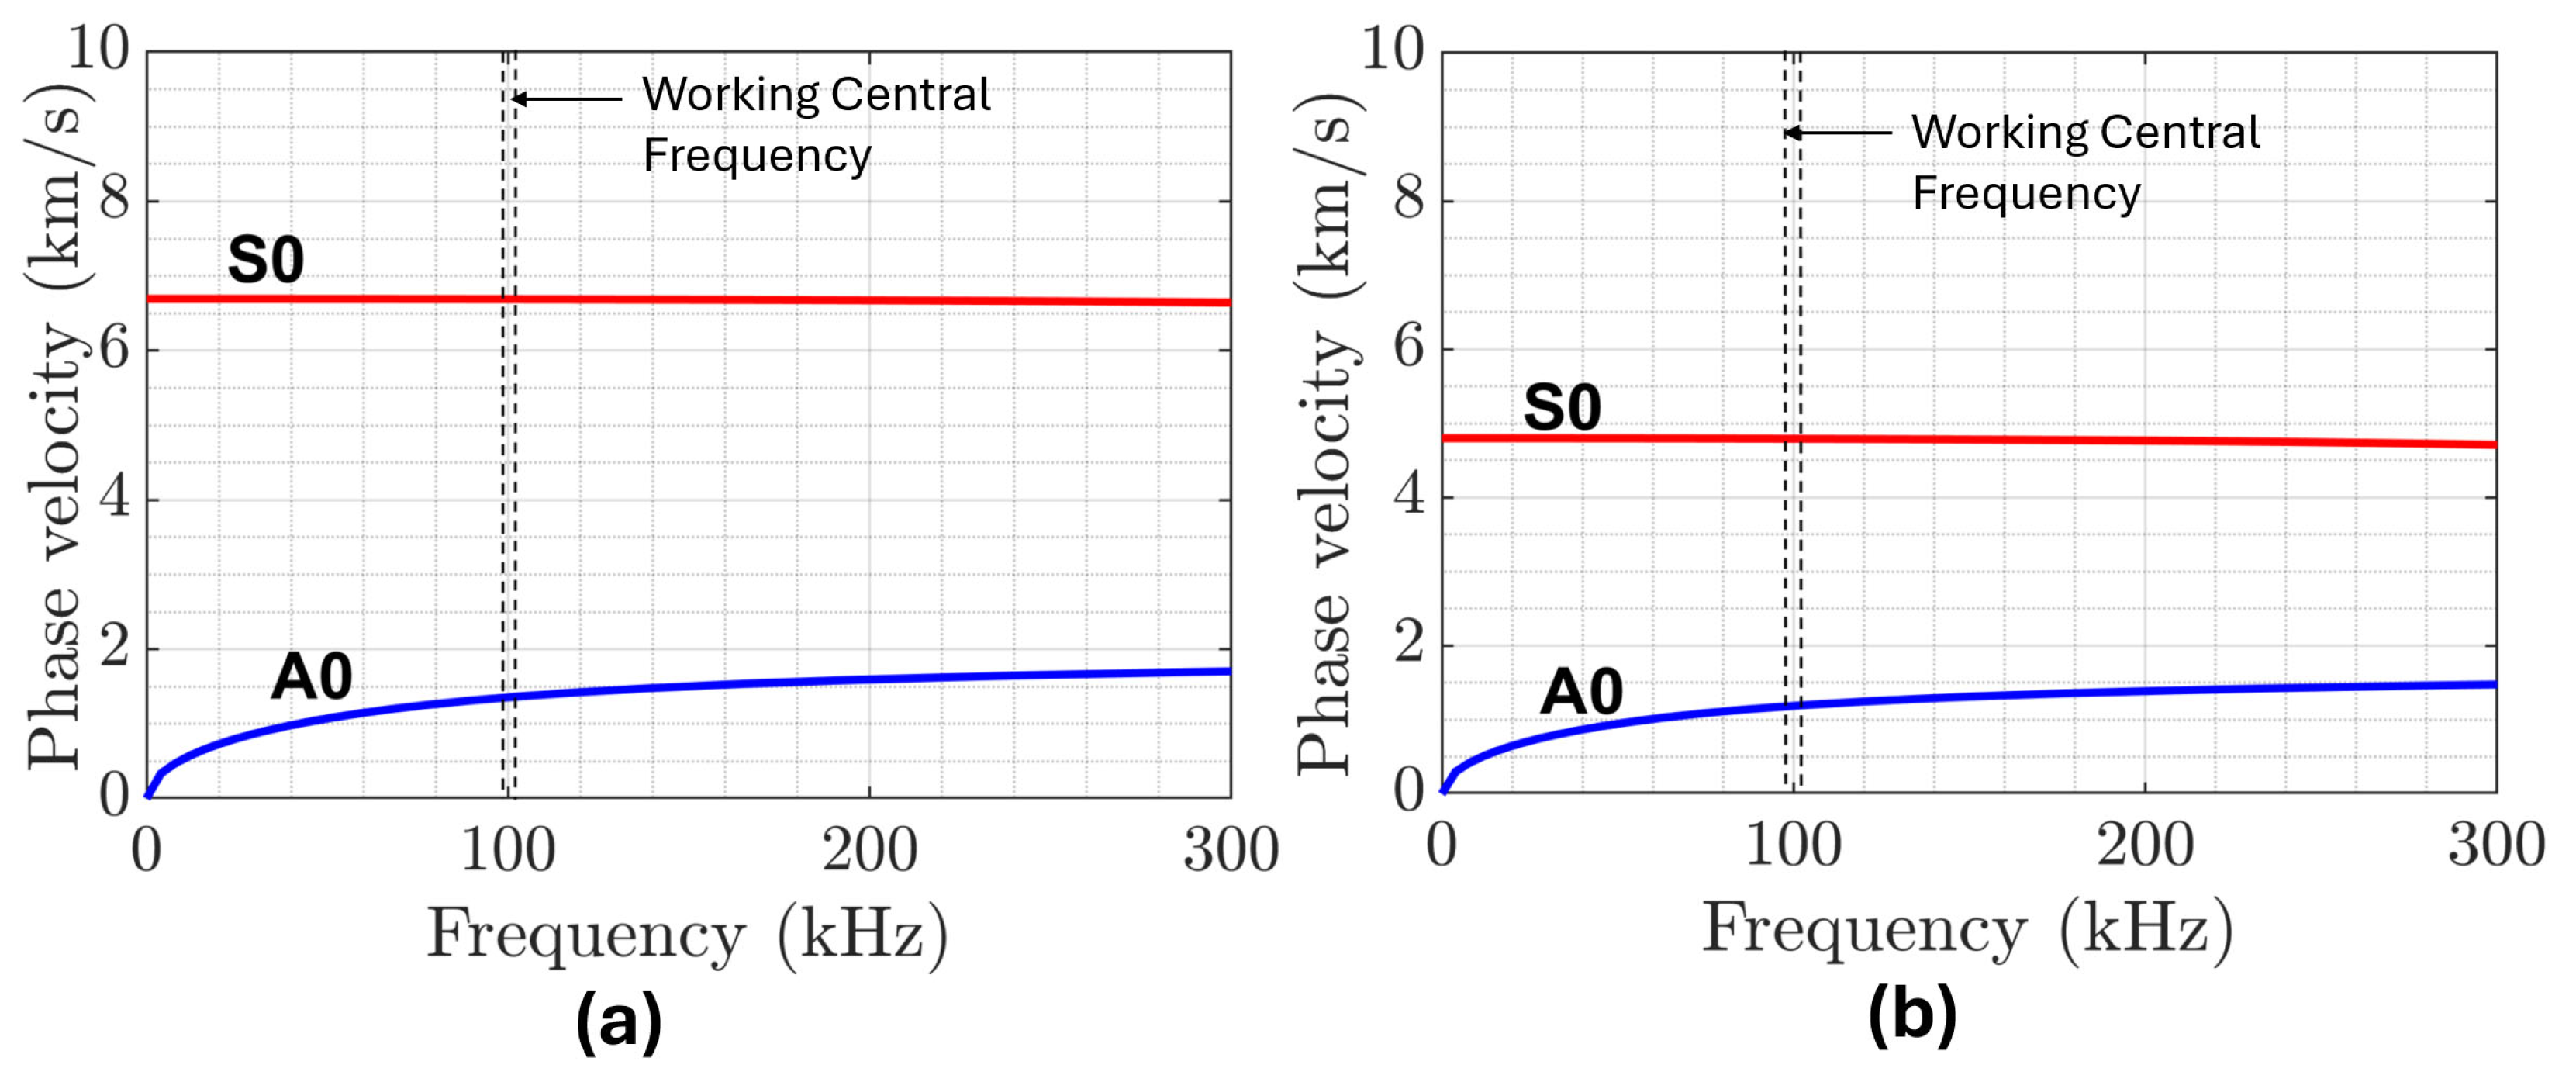
2.2. Dispersion
2.3. Launching of A0 Lamb Mode
3. 3D FE Methodology
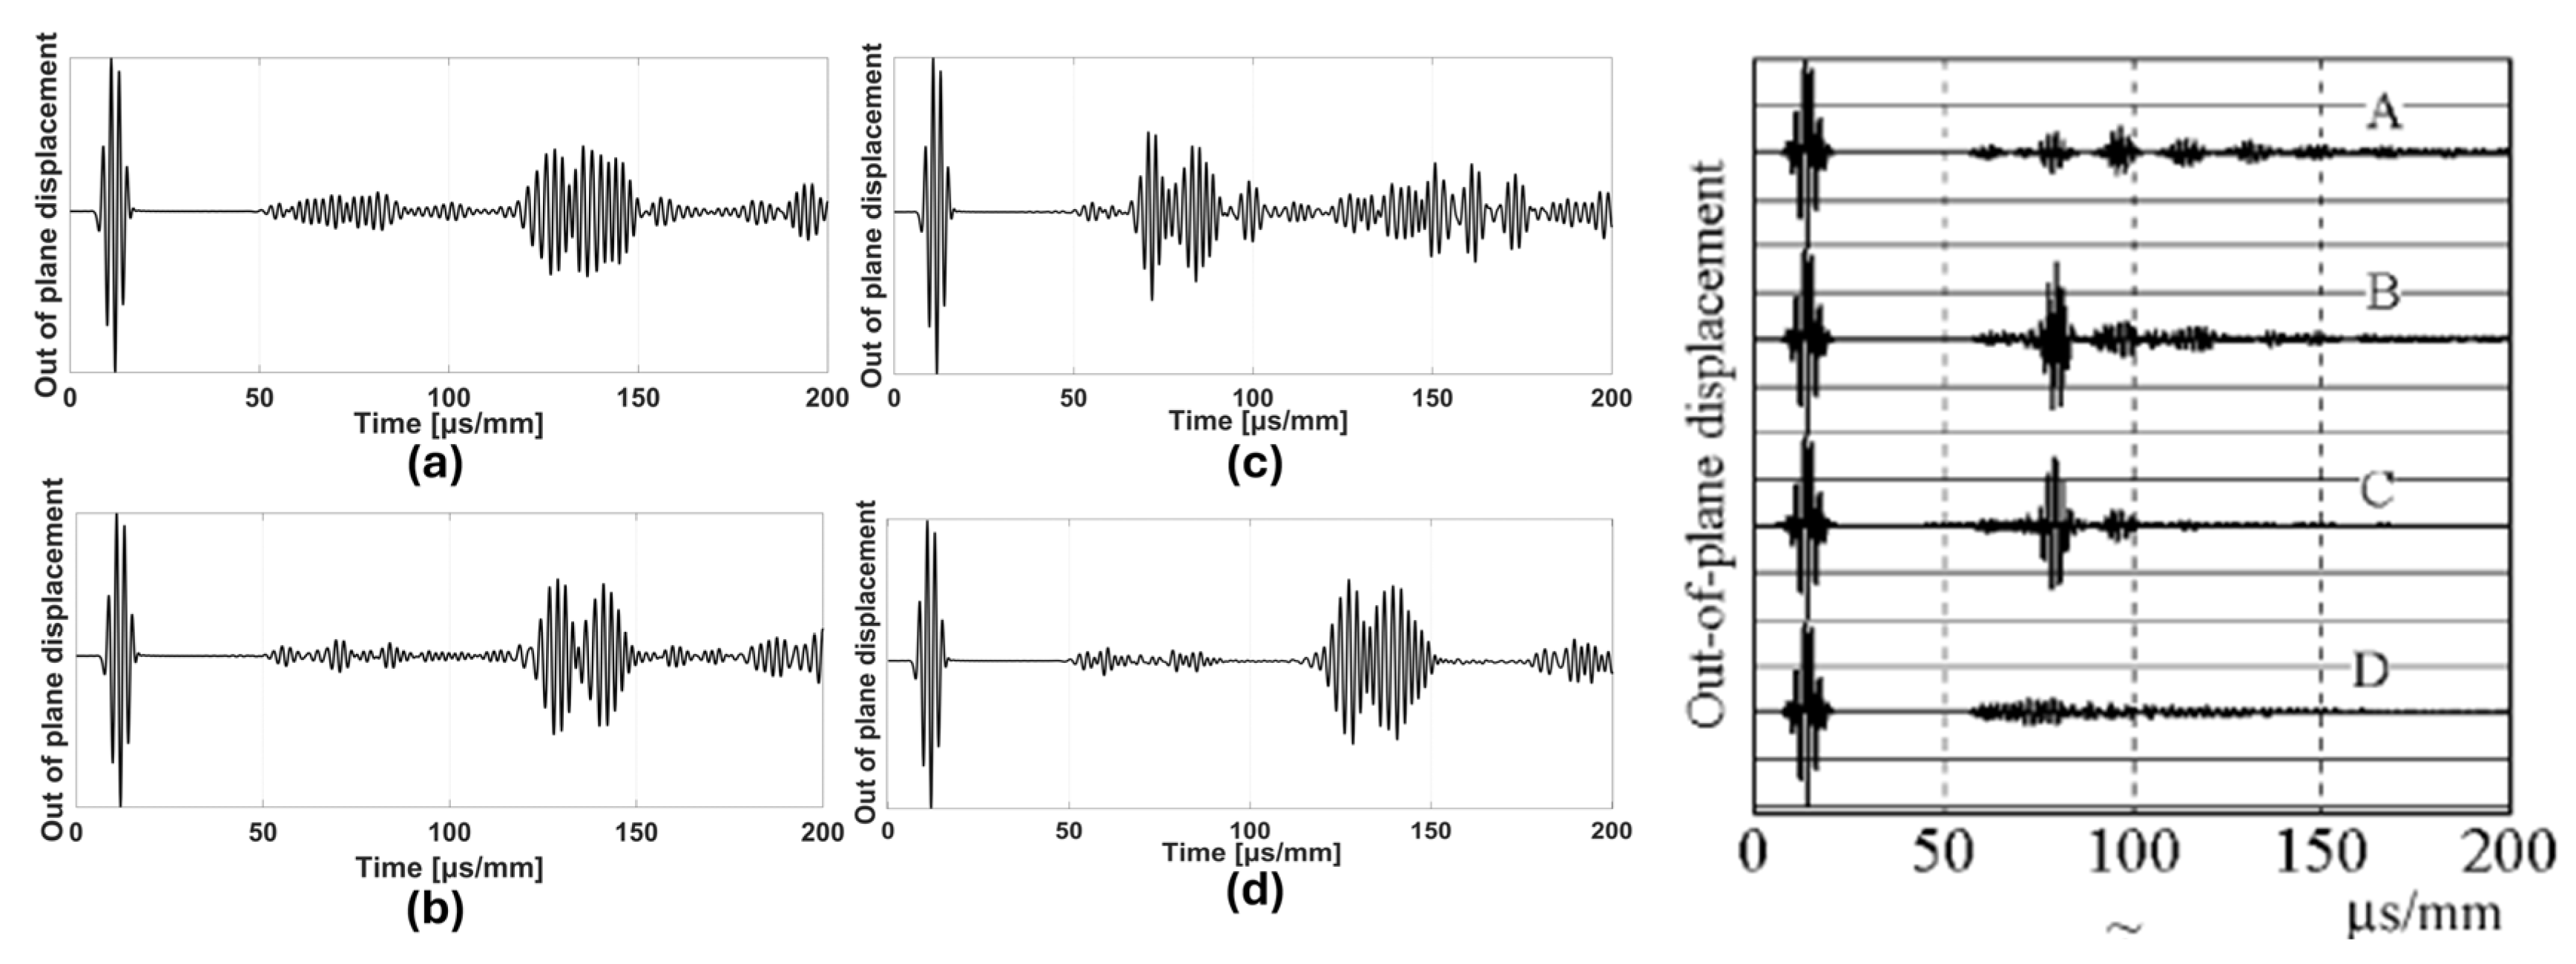
4. Validation
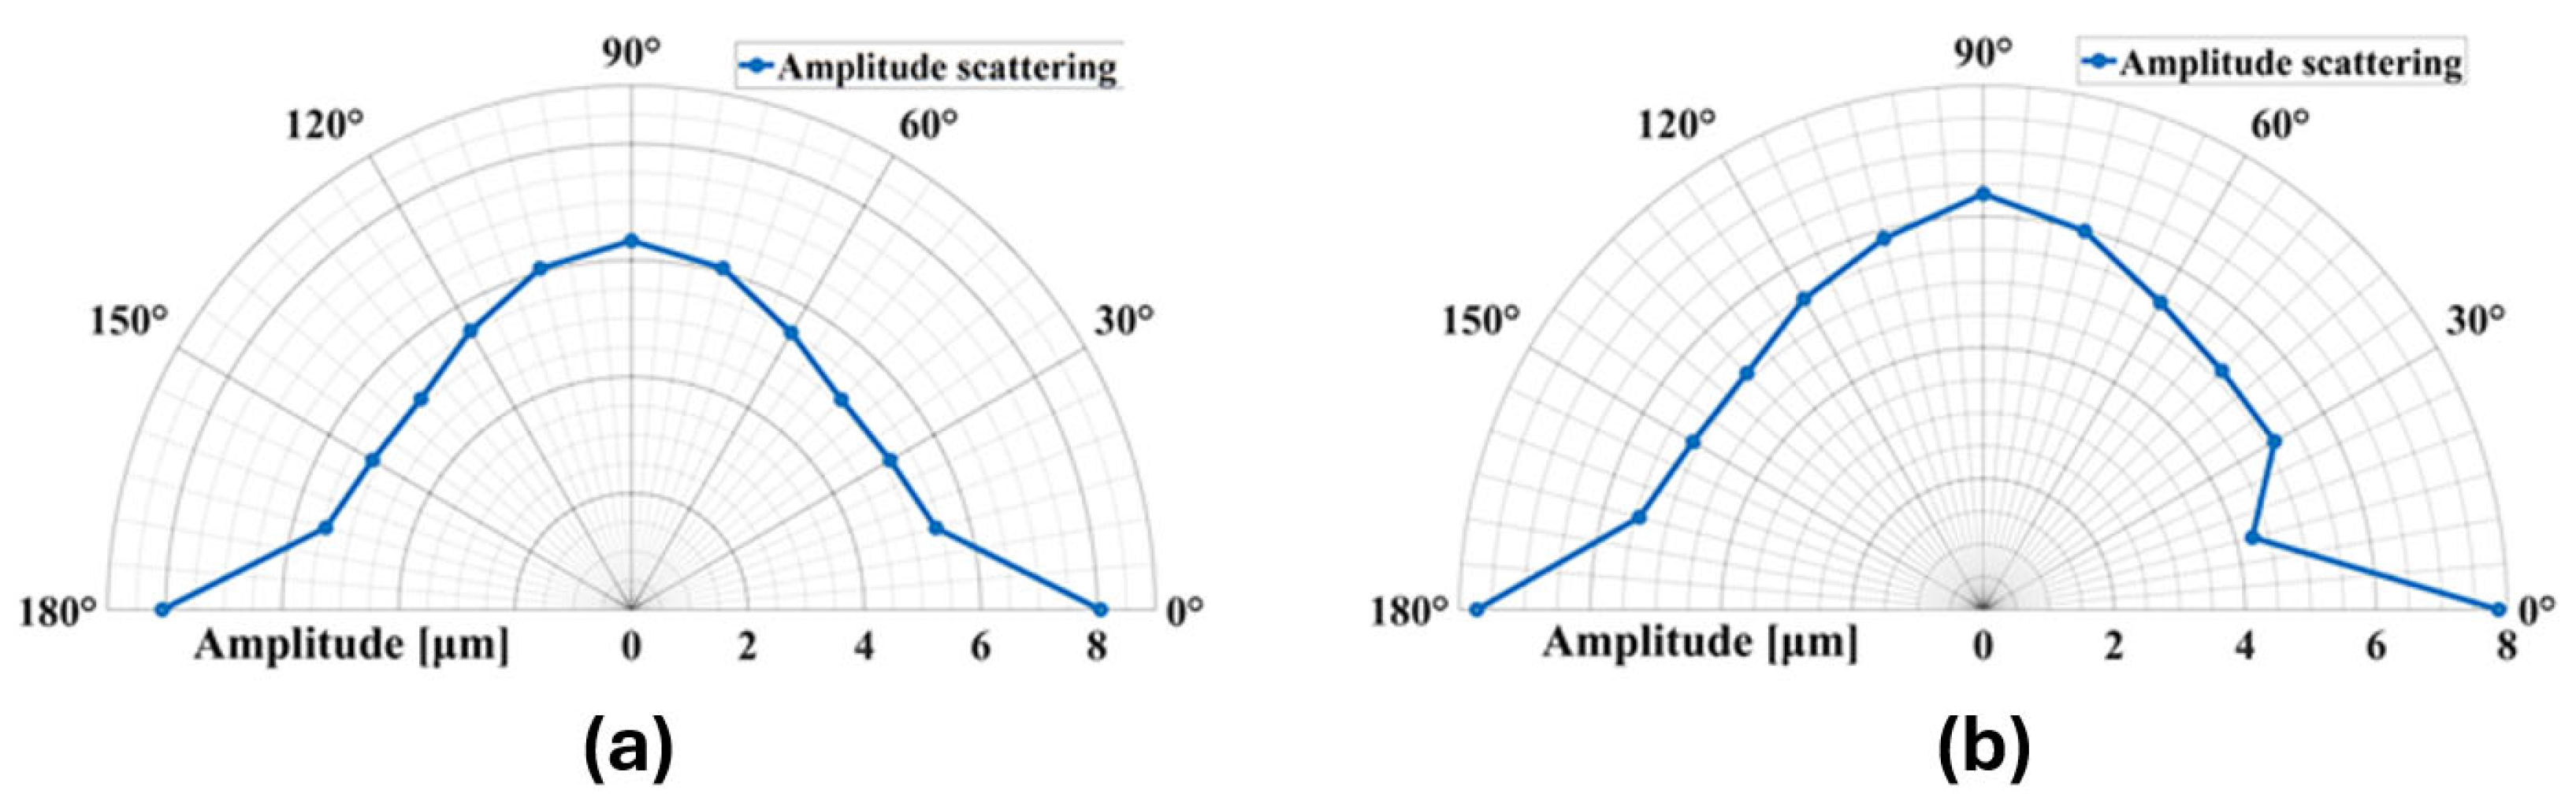
5. Results
6. Discussion
6.1. Dispersion Analysis
6.2. Detectability Resolution of Delamination Extent
7. Conclusions and Future Directions
Author Contributions
Funding
Data Availability Statement
Acknowledgments
Conflicts of Interest
Abbreviations
| NDT/E | Nondestructive testing and evaluation |
| Carall1 | 0/0 (Typical Grade Standard) |
| Carall2 | 0/90/90/0 (Typical Grade Standard) |
| CFRP | Carbon Fiber Reinforced Polymer |
| UT | Ultrasonics |
| ACUT | Acoustic Ultrasonic Testing |
| FML | Fiber Metal Laminates |
| FFT | Fast Fourier Frequency Transform |
| TW | Time Window—Recorded Wave Field Range in Time Domain |
| GTMM | Global Transfer Matrix Method |
| GW | Guided Waves |
| RC | Reflection Coefficient |
| Input Hanning Windowed Tone Burst Impulse | |
| Number of Cycles | |
| Operating Central Frequency | |
| Phase Velocity | |
| Group Velocity | |
| Distance Between Two Sensor Nodes | |
| Time Acquisitions for the Recorded Wavefield at the Same Phase | |
| A0 | Fundamental Antisymmetric |
| S0 | Fundamental Symmetric |
| λA0 | A0 Wavelength |
| M1 | Set M1/Nodes |
| M2 | Set M2/Nodes |
| Delamination Entry, Delamination Left End | |
| Delamination Exit, Delamination Right | |
| Delamination Left End, Right End, Delamination Extent/Delamination Length | |
| SW | Side Walls in Three-Dimensional Plate |
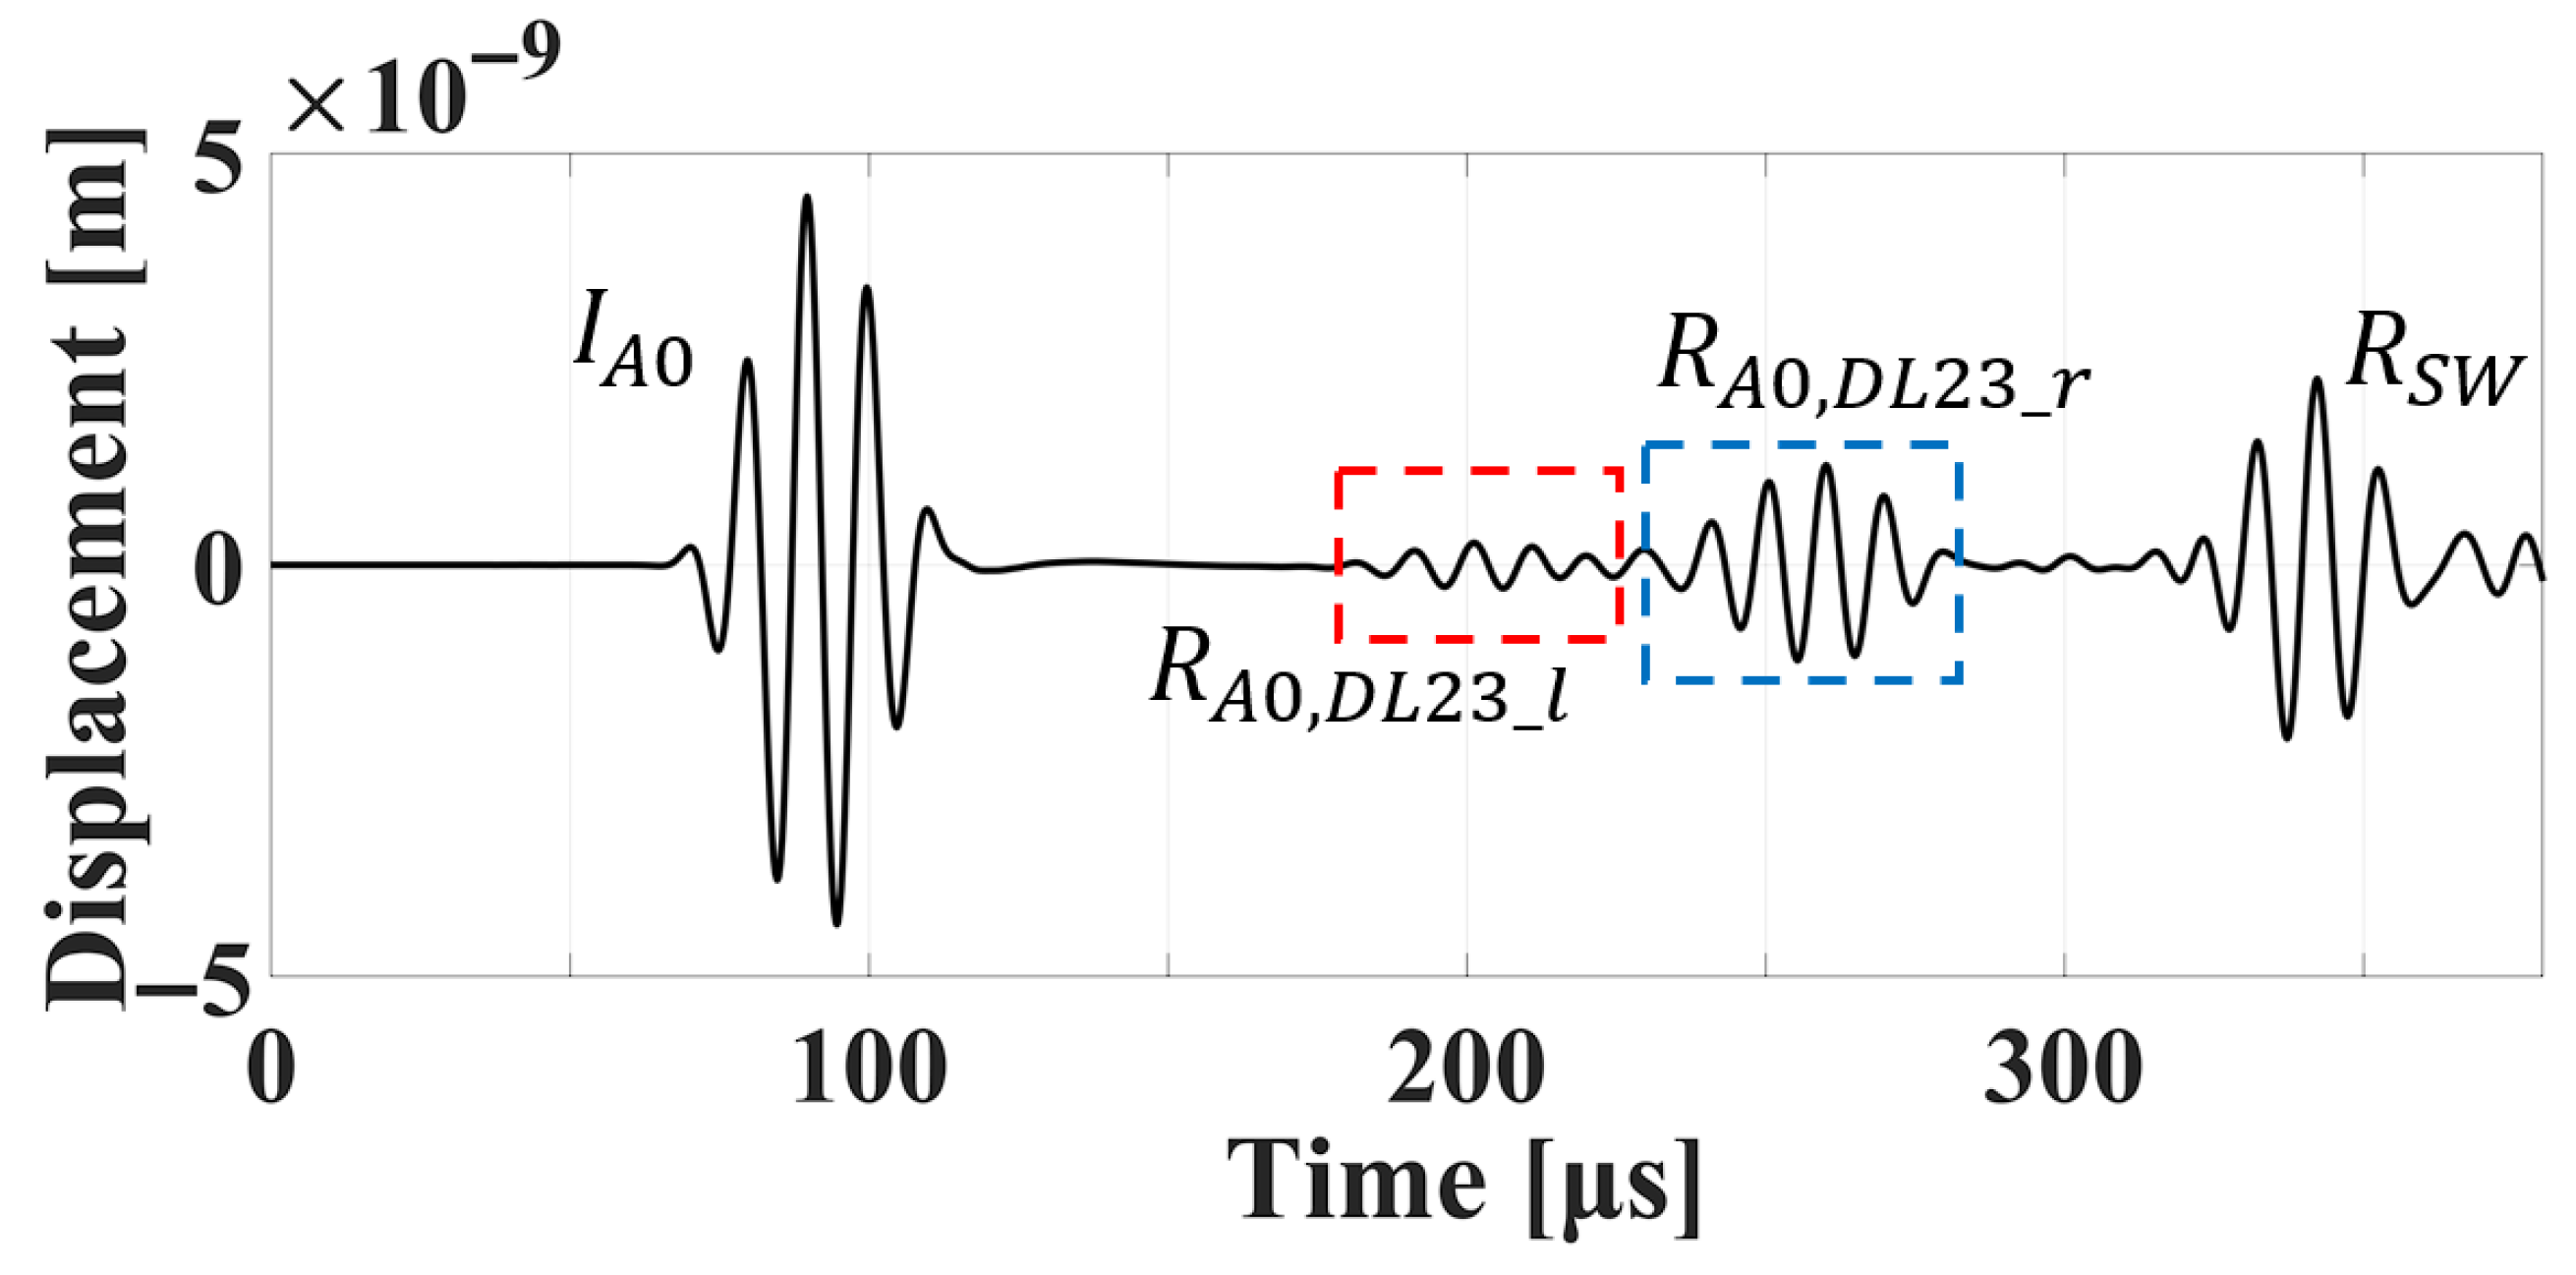
| IA0 | Incident A0 Wavefield |
| RA0 | Reflected A0 Wavefield |
| Reflected A0 Wavefield from DL12 Right End | |
| Reflected A0 Wavefield from DL12 Left End | |
| TSL | Top Sub-Layer |
| BSL | Bottom Sub-Layer |
| ) | FFT of Reflected Wave Field |
| Node displacement component in the y direction | |
| ) | FFT of Incident Wave Field |
| FFT of the TW from Entry to Exit of Delamination | |
| DL12 | Delamination Position |
| Interface between layer 1 and 2 |
References
- Vogelesang, L.B.; Vlot, A. Development of fibre metal laminates for advanced aerospace structures. J. Mater. Process. Technol. 2000, 103, 1–5. [Google Scholar] [CrossRef]
- Das, S. Life cycle assessment of carbon fiber-reinforced polymer composites. Int. J. Life Cycle Assess. 2011, 16, 268–282. [Google Scholar] [CrossRef]
- Straznicky, P.V.; Laliberté, J.F.; Poon, C.; Fahr, A. Applications of fiber-metal laminates. Polym. Compos. 2000, 21, 558–567. [Google Scholar] [CrossRef]
- Wu, G.; Yang, J.-M. The mechanical behavior of GLARE laminates for aircraft structures. JOM 2005, 57, 72–79. [Google Scholar] [CrossRef]
- Bienias, J.; Jakubczak, P.; Dadej, K. Low-velocity impact resistance of aluminium glass laminates—Experimental and numerical investigation. Compos. Struct. 2016, 152, 339–348. [Google Scholar] [CrossRef]
- Lin, C.T.; Kao, P.W.; Yang, F.S. Fatigue behaviour of carbon fibre-reinforced aluminium laminates. Composites 1991, 22, 135–141. [Google Scholar] [CrossRef]
- Lin, C.T.; Kao, P.W. Effect of fiber bridging on the fatigue crack propagation in carbon fiber-reinforced aluminum laminates. Mater. Sci. Eng. A 1995, 190, 65–73. [Google Scholar] [CrossRef]
- Bieniaś, J.; Jakubczak, P.; Surowska, B.; Dragan, K. Low-energy impact behaviour and damage characterization of carbon fibre reinforced polymer and aluminium hybrid laminates. Arch. Civ. Mech. Eng. 2015, 15, 925–932. [Google Scholar] [CrossRef]
- Remmers, J.; De Borst, R. Delamination buckling of fibre–metal laminates. Compos. Sci. Technol. 2001, 61, 2207–2213. [Google Scholar] [CrossRef]
- Sadighi, M.; Alderliesten, R.C.; Benedictus, R. Impact resistance of fiber-metal laminates: A review. Int. J. Impact Eng. 2012, 49, 77–90. [Google Scholar] [CrossRef]
- Sugiman, S.; Crocombe, A.D.; Katnam, K.B. Investigating the static response of hybrid fibre–metal laminate doublers loaded in tension. Compos. Part B Eng. 2011, 42, 1867–1884. [Google Scholar] [CrossRef]
- Song, S.H.; Byun, Y.S.; Ku, T.W.; Song, W.J.; Kim, J.; Kang, B.S. Experimental and numerical investigation on impact performance of carbon reinforced aluminum laminates. J. Mater. Sci. Technol. 2010, 26, 327–332. [Google Scholar] [CrossRef]
- Alderliesten, R.C.; Homan, J.J. Fatigue and damage tolerance issues of Glare in aircraft structures. Int. J. Fatigue 2006, 28, 1116–1123. [Google Scholar] [CrossRef]
- Dhaliwal, G.S.; Newaz, G.M. Effect of layer structure on dynamic response and failure characteristics of carbon fiber reinforced aluminum laminates (CARALL). J. Dyn. Behav. Mater. 2016, 2, 399–409. [Google Scholar] [CrossRef]
- Frizzell, R.M.; McCarthy, C.T.; McCarthy, M.A. An experimental investigation into the progression of damage in pin-loaded fibre metal laminates. Compos. Part B Eng. 2008, 39, 907–925. [Google Scholar] [CrossRef]
- Gupta, R.K.; Mahato, A.; Bhattacharya, A. Damage analysis of carbon fiber reinforced aluminum laminate under short beam and single edge notch beam bend test. Int. J. Mech. Sci. 2021, 198, 106393. [Google Scholar] [CrossRef]
- Chen, Y.; Wang, Y.; Wang, H. Research progress on interlaminar failure behavior of fiber metal laminates. Adv. Polym. Technol. 2020, 2020, 3097839. [Google Scholar] [CrossRef]
- Dragan, K.; Bieniaś, J.; Sałaciński, M.; Synaszko, P. Inspection methods for quality control of fibre metal laminates in aerospace components. Composites 2011, 11, 130–135. [Google Scholar]
- Ibarra-Castanedo, C.; Avdelidis, N.P.; Grinzato, E.G.; Bison, P.G.; Marinetti, S.; Plescanu, C.C.; Bendada, A.; Maldague, X.P. Delamination detection and impact damage assessment of GLARE by active thermography. Int. J. Mater. Prod. Technol. 2011, 41, 5–16. [Google Scholar] [CrossRef]
- Fahr, A.; Chapman, C.E.; Forsyth, D.S.; Poon, C.; Laliberté, J.F. Nondestructive evaluation methods for damage assessment in fiber-metal laminates. Polym. Compos. 2000, 21, 568–575. [Google Scholar] [CrossRef]
- Cho, S.; Shin, M.H.; Kim, Y.K.; Seo, J.-E.; Lee, Y.M.; Park, C.-H.; Chung, J.H. Effects of infrared radiation and heat on human skin aging in vivo. J. Investig. Dermatol. Symp. Proc. 2009, 14, 15–19. [Google Scholar] [CrossRef]
- Moyano, D.B.; Paraiso, D.A.; González-Lezcano, R.A. Possible Effects on Health of Ultrasound Exposure, Risk Factors in the Work Environment and Occupational Safety Review. Healthcare 2022, 10, 423. [Google Scholar] [CrossRef] [PubMed]
- Taqi, A.H.; Faraj, K.A.; Zaynal, S.A. The effect of long-term X-ray exposure on human lymphocyte. J. Biomed. Phys. Eng. 2019, 9, 127–132. [Google Scholar] [CrossRef] [PubMed]
- Rose, J.L. Ultrasonic Waves in Solid Media; Cambridge University press: Cambridge, MA, USA, 2000. [Google Scholar] [CrossRef]
- Gupta, S.; Yu, X.; Fan, Z.; Rajagopal, P. Interaction of guided waves with delaminations in composite plate structures. AIP Conf. Proc. 2017, 1806, 030011. [Google Scholar] [CrossRef]
- Veidt, M.; Ng, C.-T. Influence of stacking sequence on scattering characteristics of the fundamental anti-symmetric Lamb wave at through holes in composite laminates. J. Acoust. Soc. Am. 2011, 129, 1280–1287. [Google Scholar] [CrossRef]
- Hu, N.; Shimomukai, T.; Yan, C.; Fukunaga, H. Identification of delamination position in cross-ply laminated composite beams using S0 Lamb mode. Compos. Sci. Technol. 2008, 68, 1548–1554. [Google Scholar] [CrossRef]
- Gupta, S.; Rajagopal, P. S0 Lamb mode scattering studies in laminated composite plate structures with surface breaking cracks: Insights into crack opening behavior. Ultrasonics 2023, 129, 106901. [Google Scholar] [CrossRef]
- Gupta, S.; Rajagopal, P. Feasibility of ultrasonic guided waves for detecting surface-breaking cracks in laminated composite plate structures. ISSS J. Micro Smart Syst. 2020, 9, 97–102. [Google Scholar] [CrossRef]
- Mardanshahi, A.; Shokrieh, M.M.; Kazemirad, S. Identification of matrix cracking in cross-ply laminated composites using Lamb wave propagation. Compos. Struct. 2020, 235, 111790. [Google Scholar] [CrossRef]
- Dafydd, I.; Khodaei, Z.S. Damage severity assessment in composite structures using ultrasonic guided waves with chirp excitation. In Sensors and Smart Structures Technologies for Civil, Mechanical, and Aerospace Systems; SPIE: Bellingham, WA, USA, 2018; Volume 10598, pp. 83–93. [Google Scholar] [CrossRef]
- Hayashi, T.; Kawashima, K. Multiple reflections of Lamb waves at a delamination. Ultrasonics 2002, 40, 193–197. [Google Scholar] [CrossRef]
- Gupta, S.; Rajagopal, P. Effect of ply orientation and through-thickness position of delamination on the reflection of fundamental symmetric S0 Lamb mode in GFRP composite plate structures. Ultrasonics 2018, 90, 109–119. [Google Scholar] [CrossRef]
- Ng, C.-T.; Veidt, M. Scattering of the fundamental anti-symmetric Lamb wave at delaminations in composite laminates. J. Acoust. Soc. Am. 2011, 129, 1288–1296. [Google Scholar] [CrossRef] [PubMed]
- Rittmeier, L.; Losch, T.; Sinapius, M.; Lammering, R. Investigation on the influence of material interfaces and impedance changes on the propagation of guided waves in laminated steel layers. Procedia Manuf. 2018, 24, 196–202. [Google Scholar] [CrossRef]
- Okabe, Y.; Hirakawa, H.; Nakatani, H.; Ogihara, S. Delamination detection in fiber metal laminates using the mode conversion of Lamb waves. In EWSHM-7th European Workshop on Structural Health Monitoring; INRIA Rennes-Bretagne Atlantique: Rennes, France, 2014. [Google Scholar]
- Yan, F.; Qi, K.X.; Rose, J.L.; Weiland, H. Delamination defect detection using ultrasonic guided waves in advanced hybrid structural elements. AIP Conf. Proc. 2010, 1211, 2044–2051. [Google Scholar]
- Huang, Q.; Balogun, O.; Yang, N.; Regez, B.; Krishnaswamy, S. Detection of disbonding in glare composites using Lamb wave approach. AIP Conf. Proc. 2010, 1211, 1198–1205. [Google Scholar]
- Fattahi, A.; Shokrieh, M.M.; Kazemirad, S. Computational Study for Delamination Detection in Fiber-Metal Laminates Using Lamb Wave Propagation. In Proceedings of the 7th International Conference on Composites: Characterization, Fabrication and Application (CCFA-7), Tabriz, Iran, 23–24 December 2020. [Google Scholar]
- Gupta, S.; Haq, M.; Karpenko, O.; Udpa, L. Delamination Detection and Investigation at Far-Field in Glare Laminates Using Lamb Waves. In Proceedings of the 51st Annual Review of Progress in Quantitative Nondestructive Evaluation, 21–24 July 2024, Denver, CO, USA; American Society of Mechanical Engineers: New York, NY, USA; Volume 88162, p. V001T05A002.
- Barth, T.; Wiedemann, J.; Roloff, T.; Behrens, T.; Rauter, N.; Hühne, C.; Sinapius, M.; Lammering, R. Experimental determination of dispersion diagrams over large frequency ranges for guided ultrasonic waves in fiber metal laminates. Smart Mater. Struct. 2023, 32, 085011. [Google Scholar] [CrossRef]
- Gardner, C.; Ko, Y.; Koutoumbas, M.; Flynn, E.; Cummings, I.; Cornwell, P. Delamination detection in fiber metal laminates using ultrasonic wavefield imaging. In Rotating Machinery, Optical Methods & Scanning LDV Methods, Volume 6: Proceedings of the 39th IMAC, A Conference and Exposition on Structural Dynamics 2021; Springer International Publishing: Berlin/Heidelberg, Germany, 2022; pp. 59–72. [Google Scholar]
- Tai, S.; Kotobuki, F.; Wang, L.; Mal, A. Modeling ultrasonic elastic waves in fiber-metal laminate structures in presence of sources and defects. J. Nondestruct. Eval. Diagn. Progn. Eng. Syst. 2020, 3, 041102. [Google Scholar] [CrossRef]
- Nikiema, W.F.; Rauter, N.; Lammering, R. A two-dimensional analysis of the influence of delamination on the wave propagation in a fiber metal laminate. PAMM 2023, 23, e202200181. [Google Scholar] [CrossRef]
- Barth, T.; Wiedemann, J.; Roloff, T.; Hühne, C.; Sinapius, M.; Rauter, N. Investigations on guided ultrasonic wave dispersion behavior in fiber metal laminates using finite element eigenvalue analysis. PAMM 2023, 23, e2022001. [Google Scholar] [CrossRef]
- Pavlakovic, B.; Lowe, M.; Alleyne, D.; Cawley, P. Disperse: A general purpose program for creating dispersion curves. In Review of Progress in Quantitative Nondestructive Evaluation; Springer: Boston, MA, USA, 1997; Volume 16A, pp. 185–192. [Google Scholar] [CrossRef]
- Rautela, M.; Senthilnath, J.; Huber, A.; Gopalakrishnan, S. Toward deep generation of guided wave representations for composite materials. IEEE Trans. Artif. Intell. 2022, 5, 1102–1109. [Google Scholar] [CrossRef]
- Spada, A.; Capriotti, M.; di Scalea, F.L. Global-Local model for guided wave scattering problems with application to defect characterization in built-up composite structures. Int. J. Solids Struct. 2020, 182, 267–280. [Google Scholar] [CrossRef]
- Chronopoulos, D. Calculation of guided wave interaction with nonlinearities and generation of harmonics in composite structures through a wave finite element method. Compos. Struct. 2018, 186, 375–384. [Google Scholar] [CrossRef]
- Huber, A.; Sause, M.G. Classification of solutions for guided waves in anisotropic composites with large numbers of layers. J. Acoust. Soc. Am. 2018, 144, 3236–3251. [Google Scholar] [CrossRef]
- Graff, K.F. Wave Motion in Elastic Solids; Courier Corporation: North Chelmsford, MA, USA, 2012. [Google Scholar]
- ABAQUS Analysis User’s Manual, Version 6.10-1. Dassault Systems Simulia Corp. Available online: https://www.3ds.com/products/simulia/abaqus (accessed on 1 June 2025).
- Pain, H.J. The Physics of Vibrations and Waves; John Wiley & Sons: Hoboken, NJ, USA, 2005. [Google Scholar]


| Delamination Positions | Depth of Delamination (from Top Surface) [mm] |
|---|---|
| DL12 | 0.3 |
| DL23 | 0.55 |
| DL34 | 0.85 |
| DL45 | 1.1 |
| DL56 | 1.4 |
| DL67 | 1.65 |
| DL78 | 1.95 |
| DL89 | 2.2 |
| NDL | undefined |
| CFRP Mechanical Properties | |||||||||
|---|---|---|---|---|---|---|---|---|---|
(GPa) | (GPa) | (GPa) | (GPa) | (GPa) | (GPa) | ρ (kg/m3) | |||
| 128.75 | 8.35 | 8.35 | 4.47 | 4.47 | 2.90 | 0.33 | 0.33 | 0.44 | 1517 |
| Incident Wave | Location of Delamination | Reflected Wave |
|---|---|---|
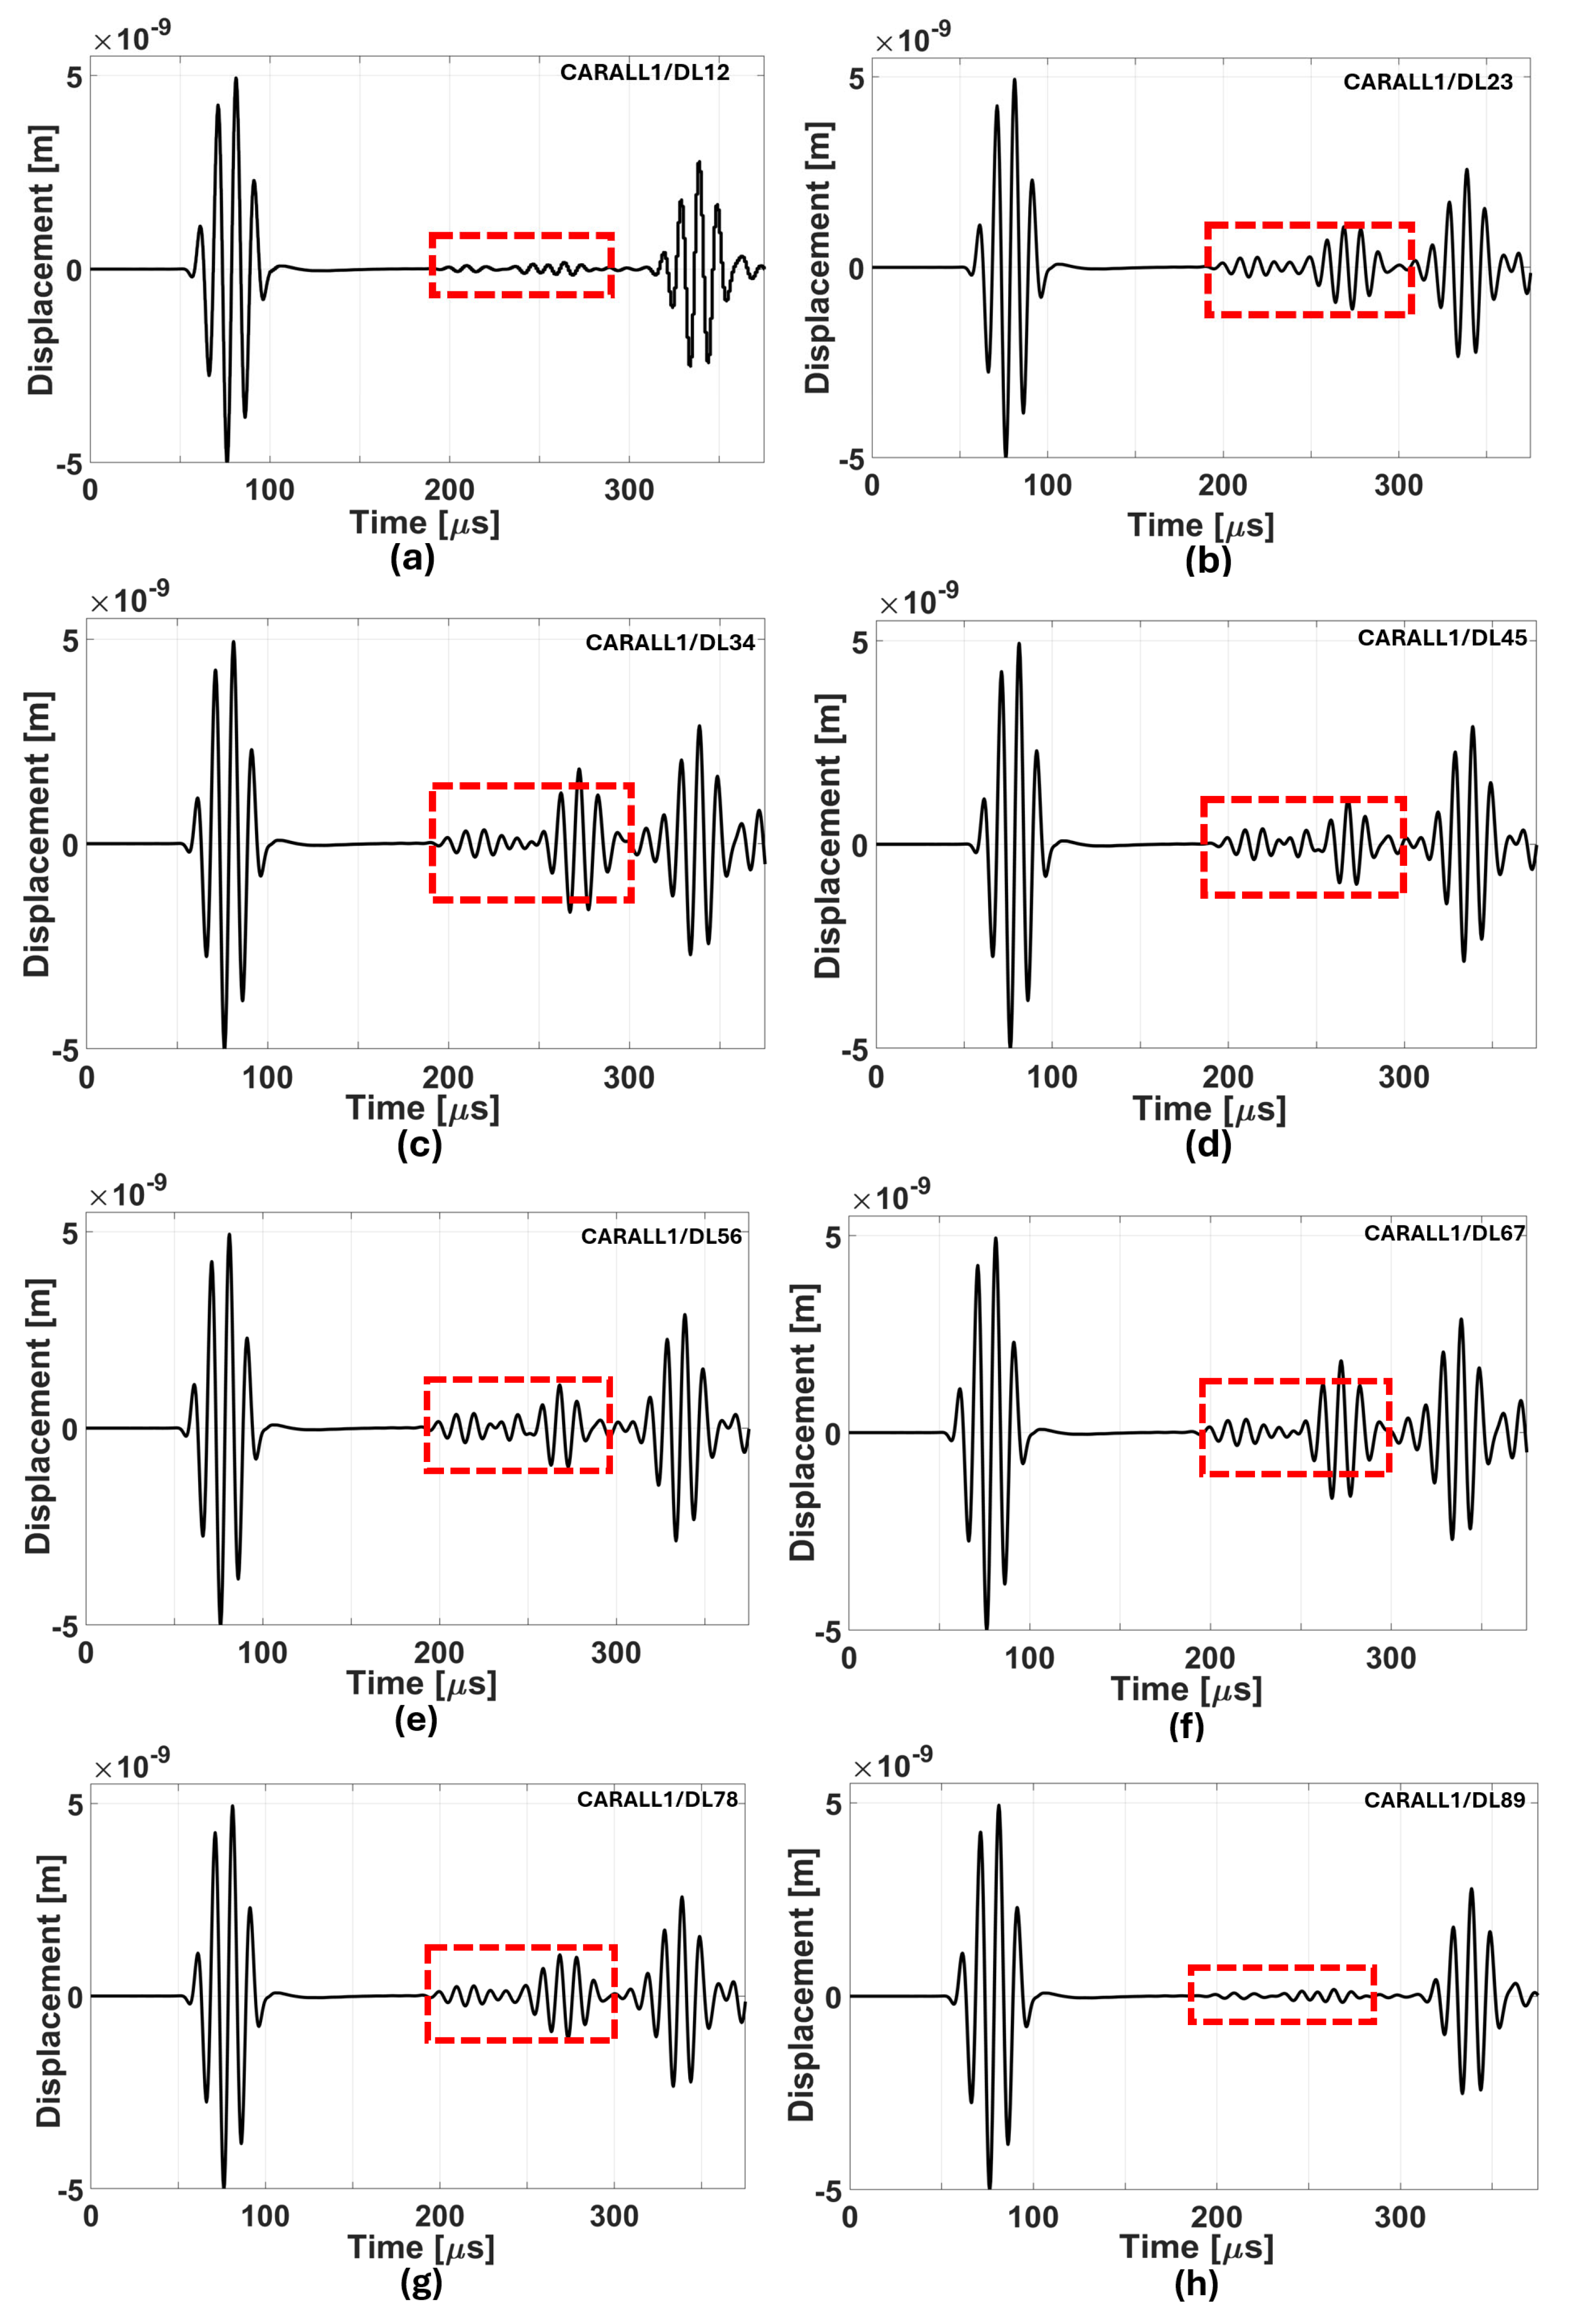
| A0 | 1–2 (interface) | Multiple reflections > 3-wave packets (highly dispersive) |
| 2–3 | Multiple reflections > 2-wave packets (moderate dispersion) | |
| 3–4 | Multiple reflections > 3-wave packets | |
| 4–5 (mid-plane) | Small (weak dispersion) |
| Materials | Sub-Layered Domains | |
|---|---|---|
| Carall1 | Al–DL12, TSL | 0/Al/0/Al/0/Al/0/Al–DL12, BSL |
| Al/0–DL23, TSL | Al/0/Al/0/Al/0/AL–DL23, BSL | |
| Al/0/Al–DL34, TSL | 0/Al/0/Al/0/Al–DL34, BSL | |
| Al/0/Al/0–DL45, TSL | Al/0/Al/0/AL–DL45, BSL | |
| Al/0/Al/0/AL–DL56, TSL | 0/Al/0/Al–DL56, BSL | |
| Al/0/Al/0/Al/0–DL67, TSL | Al/0/Al–DL67, BSL | |
| Al/0/Al/0/Al/0/AL–DL78, TSL | 0/Al–DL23, BSL | |
| Al/0/Al/0/Al/0/Al/0–DL89, TSL | Al–DL89, BSL | |
| Carall2 | Al–DL12, TSL | 0/Al/90/Al/90/Al/0/Al–DL12, BSL |
| Al/0–DL23, TSL | Al/90/Al/90/Al/0/AL–DL23, BSL | |
| Al/0/Al–DL34, TSL | 90/Al/90/Al/0/Al–DL34, BSL | |
| Al/0/Al/90–DL45, TSL | Al/90/Al/0/AL–DL45, BSL | |
| Al/0/Al/90/AL–DL56, TSL | 90/AL/0/AL–DL56, BSL | |
| Al/0/Al/90/Al/90–DL67, TSL | AL/0/AL–DL67, BSL | |
| Al/0/Al/90/Al/90/AL–DL78, TSL | 0/AL–DL78, BSL | |
| Al/0/Al/90/Al/90/Al/0–DL89, TSL | AL–DL89, BSL | |
Disclaimer/Publisher’s Note: The statements, opinions and data contained in all publications are solely those of the individual author(s) and contributor(s) and not of MDPI and/or the editor(s). MDPI and/or the editor(s) disclaim responsibility for any injury to people or property resulting from any ideas, methods, instructions or products referred to in the content. |
© 2025 by the authors. Licensee MDPI, Basel, Switzerland. This article is an open access article distributed under the terms and conditions of the Creative Commons Attribution (CC BY) license (https://creativecommons.org/licenses/by/4.0/).
Share and Cite
Gupta, S.; Haq, M.; Cvetkovic, K.; Karpenko, O. Numerical Far-Field Investigation into Guided Waves Interaction at Weak Interfaces in Hybrid Composites. J. Compos. Sci. 2025, 9, 387. https://doi.org/10.3390/jcs9080387
Gupta S, Haq M, Cvetkovic K, Karpenko O. Numerical Far-Field Investigation into Guided Waves Interaction at Weak Interfaces in Hybrid Composites. Journal of Composites Science. 2025; 9(8):387. https://doi.org/10.3390/jcs9080387
Chicago/Turabian StyleGupta, Saurabh, Mahmood Haq, Konstantin Cvetkovic, and Oleksii Karpenko. 2025. "Numerical Far-Field Investigation into Guided Waves Interaction at Weak Interfaces in Hybrid Composites" Journal of Composites Science 9, no. 8: 387. https://doi.org/10.3390/jcs9080387
APA StyleGupta, S., Haq, M., Cvetkovic, K., & Karpenko, O. (2025). Numerical Far-Field Investigation into Guided Waves Interaction at Weak Interfaces in Hybrid Composites. Journal of Composites Science, 9(8), 387. https://doi.org/10.3390/jcs9080387