Article

Comprehensive Experimental Optimization and Image-Driven Machine Learning Prediction of Tribological Performance in MWCNT-Reinforced Bio-Based Epoxy Nanocomposites

Department of Mechanical and Industrial Engineering, Manipal Institute of Technology, Manipal Academy of Higher Education, Manipal 576104, Karnataka, India
*
Author to whom correspondence should be addressed.
J. Compos. Sci. 2025, 9(8), 385; https://doi.org/10.3390/jcs9080385
Submission received: 24 May 2025 / Revised: 8 July 2025 / Accepted: 16 July 2025 / Published: 22 July 2025
(This article belongs to the Special Issue Bio-Abio Nanocomposites)

Abstract

This study presents a multi-modal investigation into the wear behavior of bio-based epoxy composites reinforced with multi-walled carbon nanotubes (MWCNTs) at 0–0.75 wt%. A Taguchi L16 orthogonal array was employed to systematically assess the influence of MWCNT content, load (20–50 N), and sliding speed (1–2.5 m/s) on wear rate (WR), coefficient of friction (COF), and surface roughness (Ra). Statistical analysis revealed that MWCNT content contributed up to 85.35% to wear reduction, with 0.5 wt% identified as the optimal reinforcement level, achieving the lowest WR (3.1 mm3/N·m) and Ra (0.7 µm). Complementary morphological characterization via SEM and AFM confirmed microstructural improvements at optimal loading and identified degradation features (ploughing, agglomeration) at 0 wt% and 0.75 wt%. Regression models (R2 > 0.95) effectively captured the nonlinear wear response, while a Random Forest model trained on GLCM-derived image features (e.g., correlation, entropy) yielded WR prediction accuracy of R2 ≈ 0.93. Key image-based predictors were found to correlate strongly with measured tribological metrics, validating the integration of surface texture analysis into predictive modeling. This integrated framework combining experimental design, mathematical modeling, and image-based machine learning offers a robust pathway for designing high-performance, sustainable nanocomposites with data-driven diagnostics for wear prediction.

1. Introduction

The growing emphasis on sustainable engineering practices has led to a surge in the use of bio-based materials, particularly in the field of polymer composites [1]. Among them, bio-based epoxy resins have gained increasing attention as environmentally responsible alternatives to conventional petroleum-based thermosets due to their biodegradability, renewable origin, and lower carbon footprint [2,3]. Despite these benefits, bio-based epoxies inherently lack sufficient wear resistance and mechanical robustness under abrasive or dynamic contact conditions, thereby limiting their utility in load-bearing and tribologically demanding applications such as automotive, aerospace, and biomedical devices [4,5].
To mitigate these drawbacks, researchers have turned toward nanofillers, especially multi-walled carbon nanotubes (MWCNTs), which are known for their superior mechanical properties, high aspect ratio, and self-lubricating behavior [6,7]. The inclusion of MWCNTs into polymer matrices has been shown to significantly enhance tribological characteristics such as wear resistance, coefficient of friction (COF), and surface integrity, making them ideal for hybrid reinforcement strategies [8]. The unique tubular structure of MWCNTs enables them to bridge microcracks, absorb impact loads, and form lubricating films that reduce surface degradation. Several studies have reported substantial reductions in wear rate (WR) and COF when low concentrations of MWCNTs (typically 0.25 to 0.5 wt%) are uniformly dispersed within epoxy matrices [9,10,11].
However, the effectiveness of MWCNT reinforcement is highly concentration-dependent. Beyond the optimal threshold, generally observed around 0.5–0.75 wt%, issues such as agglomeration, interfacial debonding, and stress concentration zones begin to outweigh the benefits, resulting in performance deterioration [12,13,14]. Hence, the identification of the optimal filler concentration is critical to achieving the desired balance between mechanical enhancement and processability. This non-monotonic behavior necessitates advanced design methodologies that go beyond empirical testing to predict performance trends under varying operational and compositional conditions [15,16].
Simultaneously, the increasing availability of advanced surface characterization tools has allowed researchers to link microstructural features with tribological responses. Scanning Electron Microscopy (SEM) and Atomic Force Microscopy (AFM) are particularly valuable for identifying wear mechanisms such as microploughing, crack initiation, CNT pull-out, and topographical variations [17,18]. SEM provides high-resolution insights into surface morphology, while AFM offers quantitative data on nanoscale roughness parameters like Ra, Rq, Rsk, and Rku. Despite this progress, most studies stop at descriptive correlations and do not transition into predictive frameworks based on surface data [19,20].
This research proposes an integrated methodology combining Taguchi design of experiments (DoE), regression-based mathematical modeling, and machine learning (ML) techniques applied to image-derived features to create a robust predictive tool for evaluating wear behavior in MWCNT-reinforced bio-based epoxy composites. The multi-faceted approach aims to not only optimize experimental parameters but also harness SEM/AFM images for automated, data-driven wear prediction.

2. Background Study

2.1. Tribological Performance of MWCNT-Reinforced Epoxy Composites

The potential of MWCNTs as nano-reinforcements in polymer composites has been widely explored due to their exceptional mechanical, electrical, and thermal properties. In tribological applications, they act as solid lubricants, reducing adhesive wear and thermal softening effects. Chan et al. [21] and Beyanagari et al. [22] demonstrated that small additions of MWCNTs (~0.5 wt%) in epoxy reduced WR by over 50% under dry sliding conditions. Siddiqui et al. (2019) [23] found that the addition of MWCNTs mitigated matrix degradation and improved resistance to fatigue wear by suppressing microcrack propagation.
Vinodhini et al. [24] compared the wear performance of epoxy composites filled with graphene and MWCNTs and noted that although both offered wear reduction, MWCNT-reinforced systems showed better interfacial compatibility due to their cylindrical geometry, resulting in enhanced load transfer. Afolabi et al. [25] examined hybrid fillers and reported that excessive filler loading could negate the benefits of MWCNTs due to clustering effects.
However, as pointed out by Upadhyay et al. [26] and Markandan et al. [27], increasing MWCNT loading beyond 0.75 wt% tends to cause severe agglomeration, resulting in poor filler–matrix adhesion, void formation, and uneven stress distribution. This transition highlights the complex interplay between filler dispersion quality, interfacial energy, and the mechanical behavior of the composite.

2.2. Morphological Analysis Using SEM and AFM

SEM allows direct visualization of wear scars, crack propagation, and CNT pull-out zones. These observations help differentiate between abrasive, adhesive, and fatigue wear mechanisms [28,29]. AFM, on the other hand, provides nanoscale roughness values, which are critical for assessing material deformation and surface energy dissipation. Metrics such as Ra and Rq correlate directly with wear severity, while Rsk and Rku help characterize the nature of peak–valley distributions that influence microcontact behavior during sliding [30].
Ambilkar et al. [31] used AFM to show that MWCNT-filled epoxy composites had smoother worn surfaces and lower Ra values compared with neat epoxy, confirming the protective role of CNTs. Singhal et al. [32] and Zhang et al. [33] showed that SEM images of high filler content composites revealed large agglomerates and fragmented surfaces, linking poor dispersion to increased wear. Wang et al. [7] and Xiao et al. [34] applied 3D AFM mapping and showed that roughness evolution correlates with changes in tribolayer thickness, which can serve as a functional indicator for filler performance. Yoosefan et al. [35] noted that mapping Ra and entropy post-wear provided early detection of mechanical instability.

2.3. Predictive Modeling in Tribology

Taguchi methods offer a statistically robust framework to identify significant process variables (e.g., load, speed, filler %) and have been widely used for tribological optimization [36]. However, they are inherently discrete and not capable of continuous prediction. Regression models, especially polynomial and response surface models, fill this gap by enabling interpolation and trend mapping within the design space [37]. Yet, both methods are limited in capturing nonlinear and feature-interactive behaviors seen in real-world composites.
To this end, machine learning (ML) methods such as Random Forest, Support Vector Regression (SVR), and Neural Networks have gained traction for wear prediction. When trained on large datasets comprising image-derived features (GLCM contrast, energy, entropy, etc.), ML models can uncover hidden patterns and rank features based on predictive relevance [38,39]. Yang et al. [40] have shown that ML models outperform traditional regressions in predicting WR and COF from surface image metrics.
Champa-Bujaico et al. [41] implemented hybrid ML strategies combining genetic algorithms and SVR for optimizing filler content in polymer composites. Anagun et al. [42] used convolutional neural networks (CNNs) to extract deep features from SEM images, resulting in over 90% prediction accuracy for WR class categories. Li et al. [43] further demonstrated the fusion of experimental and texture-based ML models, leading to hybrid modeling frameworks that matched or exceeded empirical accuracy with fewer physical trials.
While substantial research has focused on the mechanical and tribological improvements achieved through MWCNT reinforcement, very few studies have thoroughly investigated these enhancements within a bio-based epoxy matrix. Even fewer have attempted to integrate SEM and AFM-derived image features into predictive modeling frameworks, thereby limiting the understanding of how surface morphology influences wear behavior. Moreover, the combination of Taguchi experimental design, mathematical regression, and machine learning-based modeling into a unified, multiscale analysis pipeline remains largely unexplored in the literature.
In contrast to conventional approaches that treat optimization and prediction separately, this study introduces a comprehensive, multi-layered methodology that bridges experimental design with image-informed prediction. It uniquely combines Taguchi-based optimization, regression analysis, and machine learning techniques trained on texture features extracted from SEM/AFM images using gray-level co-occurrence matrix (GLCM) methods. This integration enables not only the identification of optimal processing parameters but also the development of automated predictive models capable of capturing wear behavior from microstructural data capability absent in prior works.
Accordingly, this study executes a full factorial Taguchi L16-based wear test, systematically analyzes the worn surfaces through SEM and AFM, and extracts texture descriptors such as contrast, entropy, and correlation. These features are then used to train both regression models and Random Forest algorithms for wear rate prediction. The novelty of this approach lies in correlating image-level surface features with macro-scale tribological responses, thereby establishing a robust and intelligent framework for predictive material design using sustainable polymer nanocomposites.

3. Materials and Methods

3.1. Materials

The matrix material employed in this study was a bio-based epoxy system composed of FormuLITE 2501A (resin) and FormuLITE 2401B (hardener), supplied by Cardolite Specialty Chemicals, Mangaluru, India. This system is derived from cashew nut shell liquid (CNSL), a renewable source, and is known for its low carbon footprint, excellent mechanical performance, and suitability for high-performance composite applications. The epoxy system was mixed in a stoichiometric ratio as recommended by the manufacturer. Multi-walled carbon nanotubes (MWCNTs) were used as nanofillers to enhance the wear performance of the bio-based epoxy. The MWCNTs used had an average outer diameter of 10–20 nm and a length of 5–15 µm, with a purity of over 95%. These were procured from Adnano Technologies Pvt. Ltd., Shivamogga, Karnataka, India and utilized without any further functionalization. Four different composite formulations were prepared containing 0 wt%, 0.25 wt%, 0.5 wt%, and 0.75 wt% MWCNTs, respectively.

3.2. Composite Preparation

MWCNTs were dispersed into the FormuLITE 2500A resin (Cardolite Specialty Chemicals, Mangaluru, India) by mechanical stirring at 1500 rpm for 30 min, followed by ultrasonication at 20 kHz for 45 min to achieve better exfoliation and dispersion. Subsequently, the FormuLITE 2401B hardener was added and mixed thoroughly for 15 min. The mixture was degassed under vacuum to eliminate air bubbles and poured into silicone molds. The composites were cured at room temperature for 24 h, followed by post-curing at 80 °C for 3 h. Four different compositions were prepared containing 0 wt%, 0.25 wt%, 0.5 wt%, and 0.75 wt% MWCNTs, respectively.

3.3. Wear Testing

The dry sliding wear behavior of the prepared bio-based epoxy/MWCNT composites was evaluated using a standard pin-on-disc tribometer. Composite pins of 10 mm diameter and 30 mm length were fabricated for the tests. Each pin was slid against a hardened EN31 steel disc (surface hardness ~62 HRC) under controlled conditions. The experiments were designed based on a Taguchi L16 orthogonal array to systematically study the effect of three parameters: MWCNT content (0, 0.25, 0.5, and 0.75 wt%), applied normal load (20, 30, 40, and 50 N), and sliding speed (1.0, 1.5, 2.0, and 2.5 m/s). The sliding distance was fixed at 1000 m for all tests, and a track diameter of 100 mm was maintained to ensure uniform wear track conditions. All tests were conducted at room temperature (25 ± 2 °C) under dry conditions without lubrication. Prior to and after each test, the samples were cleaned with acetone and weighed using a high-precision electronic balance (accuracy ±0.1 mg) to determine the mass loss. The specific wear rate (mm3/N·m) was calculated from the volume loss, applied load, and sliding distance. Additionally, the coefficient of friction (COF) was continuously recorded during each test using the tribometer’s in-built sensors. The primary objective of the wear testing was to analyze how the variation in MWCNT reinforcement, applied load, and sliding speed influenced the wear performance, surface roughness, and weight loss of the composites.

3.4. Surface Characterization (SEM and AFM Analysis)

To investigate the surface morphology and wear mechanisms of the worn composite pins, detailed surface characterization was performed using Scanning Electron Microscopy (SEM) (ZEISS, Oberkochen, Germany) and Atomic Force Microscopy (AFM) (AFM-Bruker Corporation, Billerica, MA, USA). SEM analysis was carried out using a Zeiss Crossbeam 540 scanning electron microscope (ZEISS, Oberkochen, Germany) operated at an accelerating voltage of 20 kV. Prior to imaging, the worn samples were gold-coated using a sputter coater to enhance electrical conductivity and prevent charging effects. SEM micrographs were captured at multiple magnifications (100×, 500×, and 1000×) to examine features such as plough marks, microcracks, material delamination, and evidence of MWCNT pull-out from the matrix. These observations provided valuable insights into the dominant wear mechanisms under different loading and speed conditions. In parallel, Atomic Force Microscopy (AFM) was employed to quantitatively assess the nanoscale surface roughness of the worn surfaces. Tapping mode AFM measurements were conducted over a 10 µm × 10 µm scan area using a silicon cantilever tip with a nominal radius of approximately 10 nm. For each sample, three different regions were scanned to account for surface heterogeneity, and the average values were reported. The surface roughness parameters evaluated included the average roughness (Ra), root mean square roughness (Rq), skewness (Rsk), and kurtosis (Rku), which helped in understanding the textural changes and degradation patterns at the nanoscale level. Together, the SEM and AFM analyses provided a comprehensive multi-scale understanding of the wear-induced surface modifications in the bio-based epoxy/MWCNT composites.

3.5. Experimental Design—Taguchi Methodology

A systematic experimental design approach based on the Taguchi methodology was adopted to evaluate the influence of multiple parameters on the wear behavior of the composites. An L16 orthogonal array was selected to study three key control factors: MWCNT content (0, 0.25, 0.5, and 0.75 wt%), applied load (20, 30, 40, and 50 N), and sliding speed (1.0, 1.5, 2.0, and 2.5 m/s), each varied at four levels. This efficient design minimized the number of experiments while effectively capturing the primary effects of each factor on the material’s tribological performance. Four response variables were selected for evaluation: specific wear rate, coefficient of friction (COF), surface roughness (Ra), and weight loss percentage. Signal-to-noise (S/N) ratio analysis and analysis of variance (ANOVA) were used to determine the most significant parameters and to identify the optimal combination of control factors for minimizing wear and surface degradation.

3.6. Software and Tools Used

A combination of commercial statistical software and open-source programming tools was employed throughout this study to support experimental design, data analysis, and predictive modeling. The design of experiments (DoE), including the construction of the Taguchi L16 orthogonal array and the subsequent Analysis of Variance (ANOVA), was conducted using Minitab 21.0. This software enabled effective identification of the most influential process parameters and their interaction effects on wear behavior. Mathematical modeling, such as polynomial regression, residual analysis, and the computation of statistical metrics including R2 and RMSE, was also performed within Minitab, providing a robust framework for exploring trends and optimizing experimental conditions.
For the image-driven analysis, Python 3.10 was utilized due to its flexibility and strong ecosystem of data science libraries. SEM and AFM images were preprocessed using OpenCV 4.12 and scikit-image 0.25.2, followed by texture feature extraction using the gray-level co-occurrence matrix (GLCM) method. Features such as contrast, energy, entropy, homogeneity, and correlation were quantified to characterize surface morphology. These features were then used as input to a Random Forest Regressor built with the scikit-learn library, enabling wear rate prediction based on surface texture. Data processing and visualization were handled using NumPy (version 2.2.6), Pandas (version 2.3.0), Matplotlib (version 3.7.x), and Seaborn (version 0.14). This integrated computational approach allowed for a seamless transition from physical experimentation to machine learning-based wear prediction.
For machine learning modeling, an 80:20 train-test split was used to evaluate predictive performance. A Random Forest Regressor with 100 decision trees (n_estimators = 100) was implemented using the scikit-learn library in Python 3.10. Model validation was performed using 5-fold cross-validation, and the predictive accuracy was assessed using performance metrics such as R2 and Root Mean Square Error (RMSE).

4. Results and Discussion

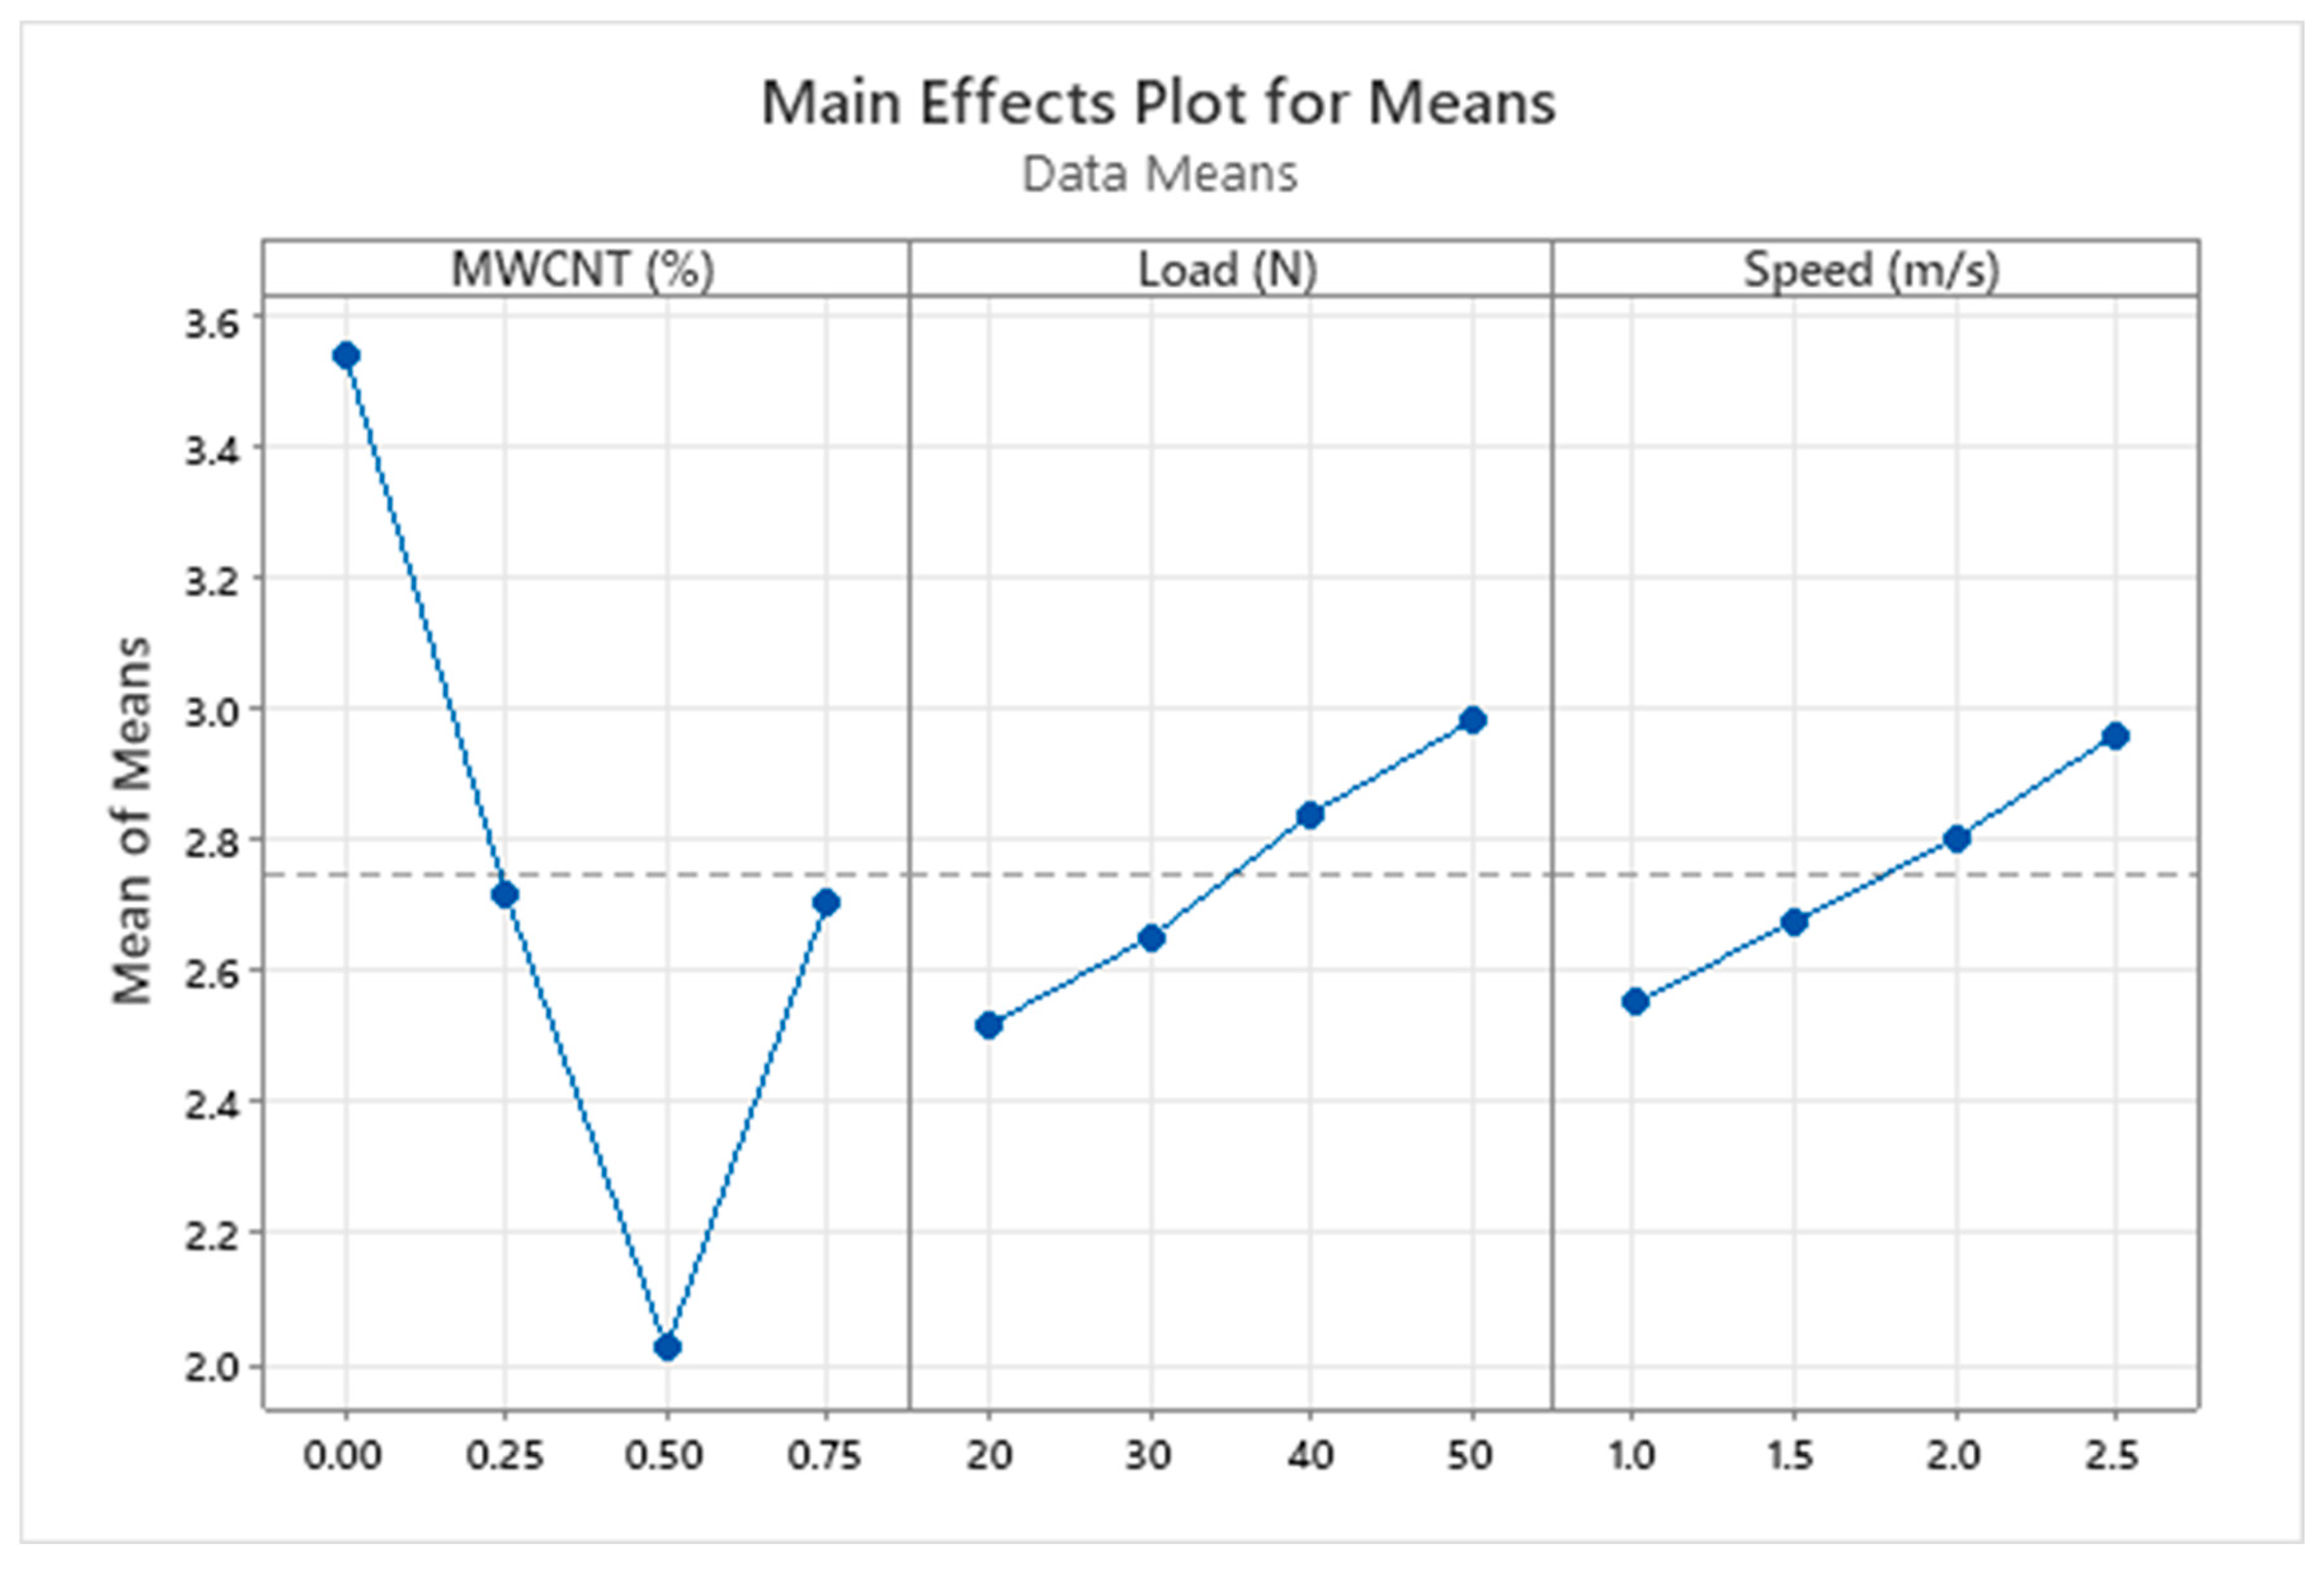
4.1. Taguchi Analysis

Table 1 summarizes the Taguchi L16 experimental matrix along with the measured responses: WR, COF, Ra, and WL. The results indicate that increasing MWCNT content up to 0.5 wt% led to a significant reduction in WR, COF, and Ra, while a slight increase was observed at 0.75 wt%, suggesting an optimal reinforcement level for improving the tribological performance.
Figure 1 shows the main effects plot for the mean WR, illustrating the influence of MWCNT content, applied load, and sliding speed. The WR decreased sharply with increasing MWCNT content up to 0.5 wt%, indicating enhanced wear resistance due to effective load transfer and matrix reinforcement by well dispersed MWCNTs. A slight increase in WR was observed at 0.75 wt%, likely due to agglomeration-induced stress concentration. As expected, WR increased steadily with rising load and speed, reflecting higher contact stress and thermal effects during sliding.
Figure 2 depicts the main effects plot for the S/N ratios based on the “smaller-the-better” criterion. A higher S/N ratio corresponds to lower variability and better wear performance. The trend mirrors the mean response, with 0.5 wt% MWCNT exhibiting the highest S/N ratio, confirming its optimal reinforcement level. Increasing load and speed resulted in lower S/N ratios, suggesting that higher operational stresses negatively impacted the wear stability of the composites. Among the factors, MWCNT content showed the most significant influence on both the mean WR and S/N ratios, establishing it as the critical parameter for minimizing wear behavior.

4.2. ANOVA and Factor Significance Analysis

The results of the ANOVA based on the General Linear Model (GLM) for WR, COF, Ra, and WL are presented in Table 2, Table 3, Table 4 and Table 5. The contribution percentages, F-values, and p-values were used to determine the statistical significance and relative influence of each control factor. Table 2 shows that for WR, MWCNT content was the most dominant factor, contributing 80.31% to the total variance, followed by Load (8.31%) and Speed (6.76%). The F-value for MWCNT was substantially higher (34.72) with a p-value of 0, confirming its statistical significance. Load and Speed exhibited lower F-values and p-values greater than 0.05, indicating their relatively minor effects on WR.
Table 3 demonstrates that for COF, MWCNT content contributed a remarkable 91.89%, indicating that the reinforcement level predominantly dictated the frictional behavior. Both Load (3.23%) and Speed (1.52%) showed minimal influence on COF, with their p-values exceeding 0.05, confirming that they were statistically insignificant within the studied range. Similarly, Table 4 indicates that MWCNT content accounted for 87.97% of the variance in Ra, making it the key parameter controlling surface smoothness after wear. Load (4.96%) and Speed (3.72%) had marginal contributions, and their p-values also suggested limited statistical significance. Table 5 reveals that for WL, MWCNT content contributed 76.80%, again emphasizing its primary role in reducing material loss during sliding. Load (10.12%) and Speed (6.68%) had minor effects, and while their F-values indicated some level of influence, the associated p-values were above 0.05, rendering them statistically less significant compared with MWCNT content.
Across all four responses (WR, COF, Ra, and WL), MWCNT content consistently emerged as the most critical factor influencing tribological behavior, validating the trends observed in the Taguchi analysis. Load and Speed exhibited secondary effects but were comparatively less influential within the experimental range.

4.3. Matrix Plot Analysis

Figure 3 presents the matrix plots illustrating the relationship between the control factors (MWCNT content, Load, Speed) and the measured responses (WR, COF, Ra, and WL). The plots provide a clear visualization of the general trends and the influence of each factor. A strong inverse relationship is observed between MWCNT content and all four responses. As MWCNT loading increases up to 0.5 wt%, there is a significant reduction in WR, COF, Ra, and WL, confirming the role of MWCNTs in improving the wear resistance, reducing friction, and smoothing the worn surface. Beyond 0.5 wt%, a slight deterioration in all responses is evident, likely due to filler agglomeration.
The Load shows a generally direct relationship with WR and WL, indicating that higher applied loads promote more material removal and increased weight loss. For COF and Ra, the trends with Load are less consistent, reflecting a more complex interaction between contact stress and surface roughness evolution during sliding. Speed demonstrates a moderate influence, where lower speeds tend to favor lower WR, COF, Ra, and WL values. However, the trends for Speed are not as pronounced as for MWCNT content and Load, suggesting a secondary role in the tribological behavior within the selected range. Overall, the matrix plots validate the findings from the Taguchi analysis and ANOVA, reaffirming that MWCNT content is the most influential parameter, followed by Load, with Speed having the least effect.

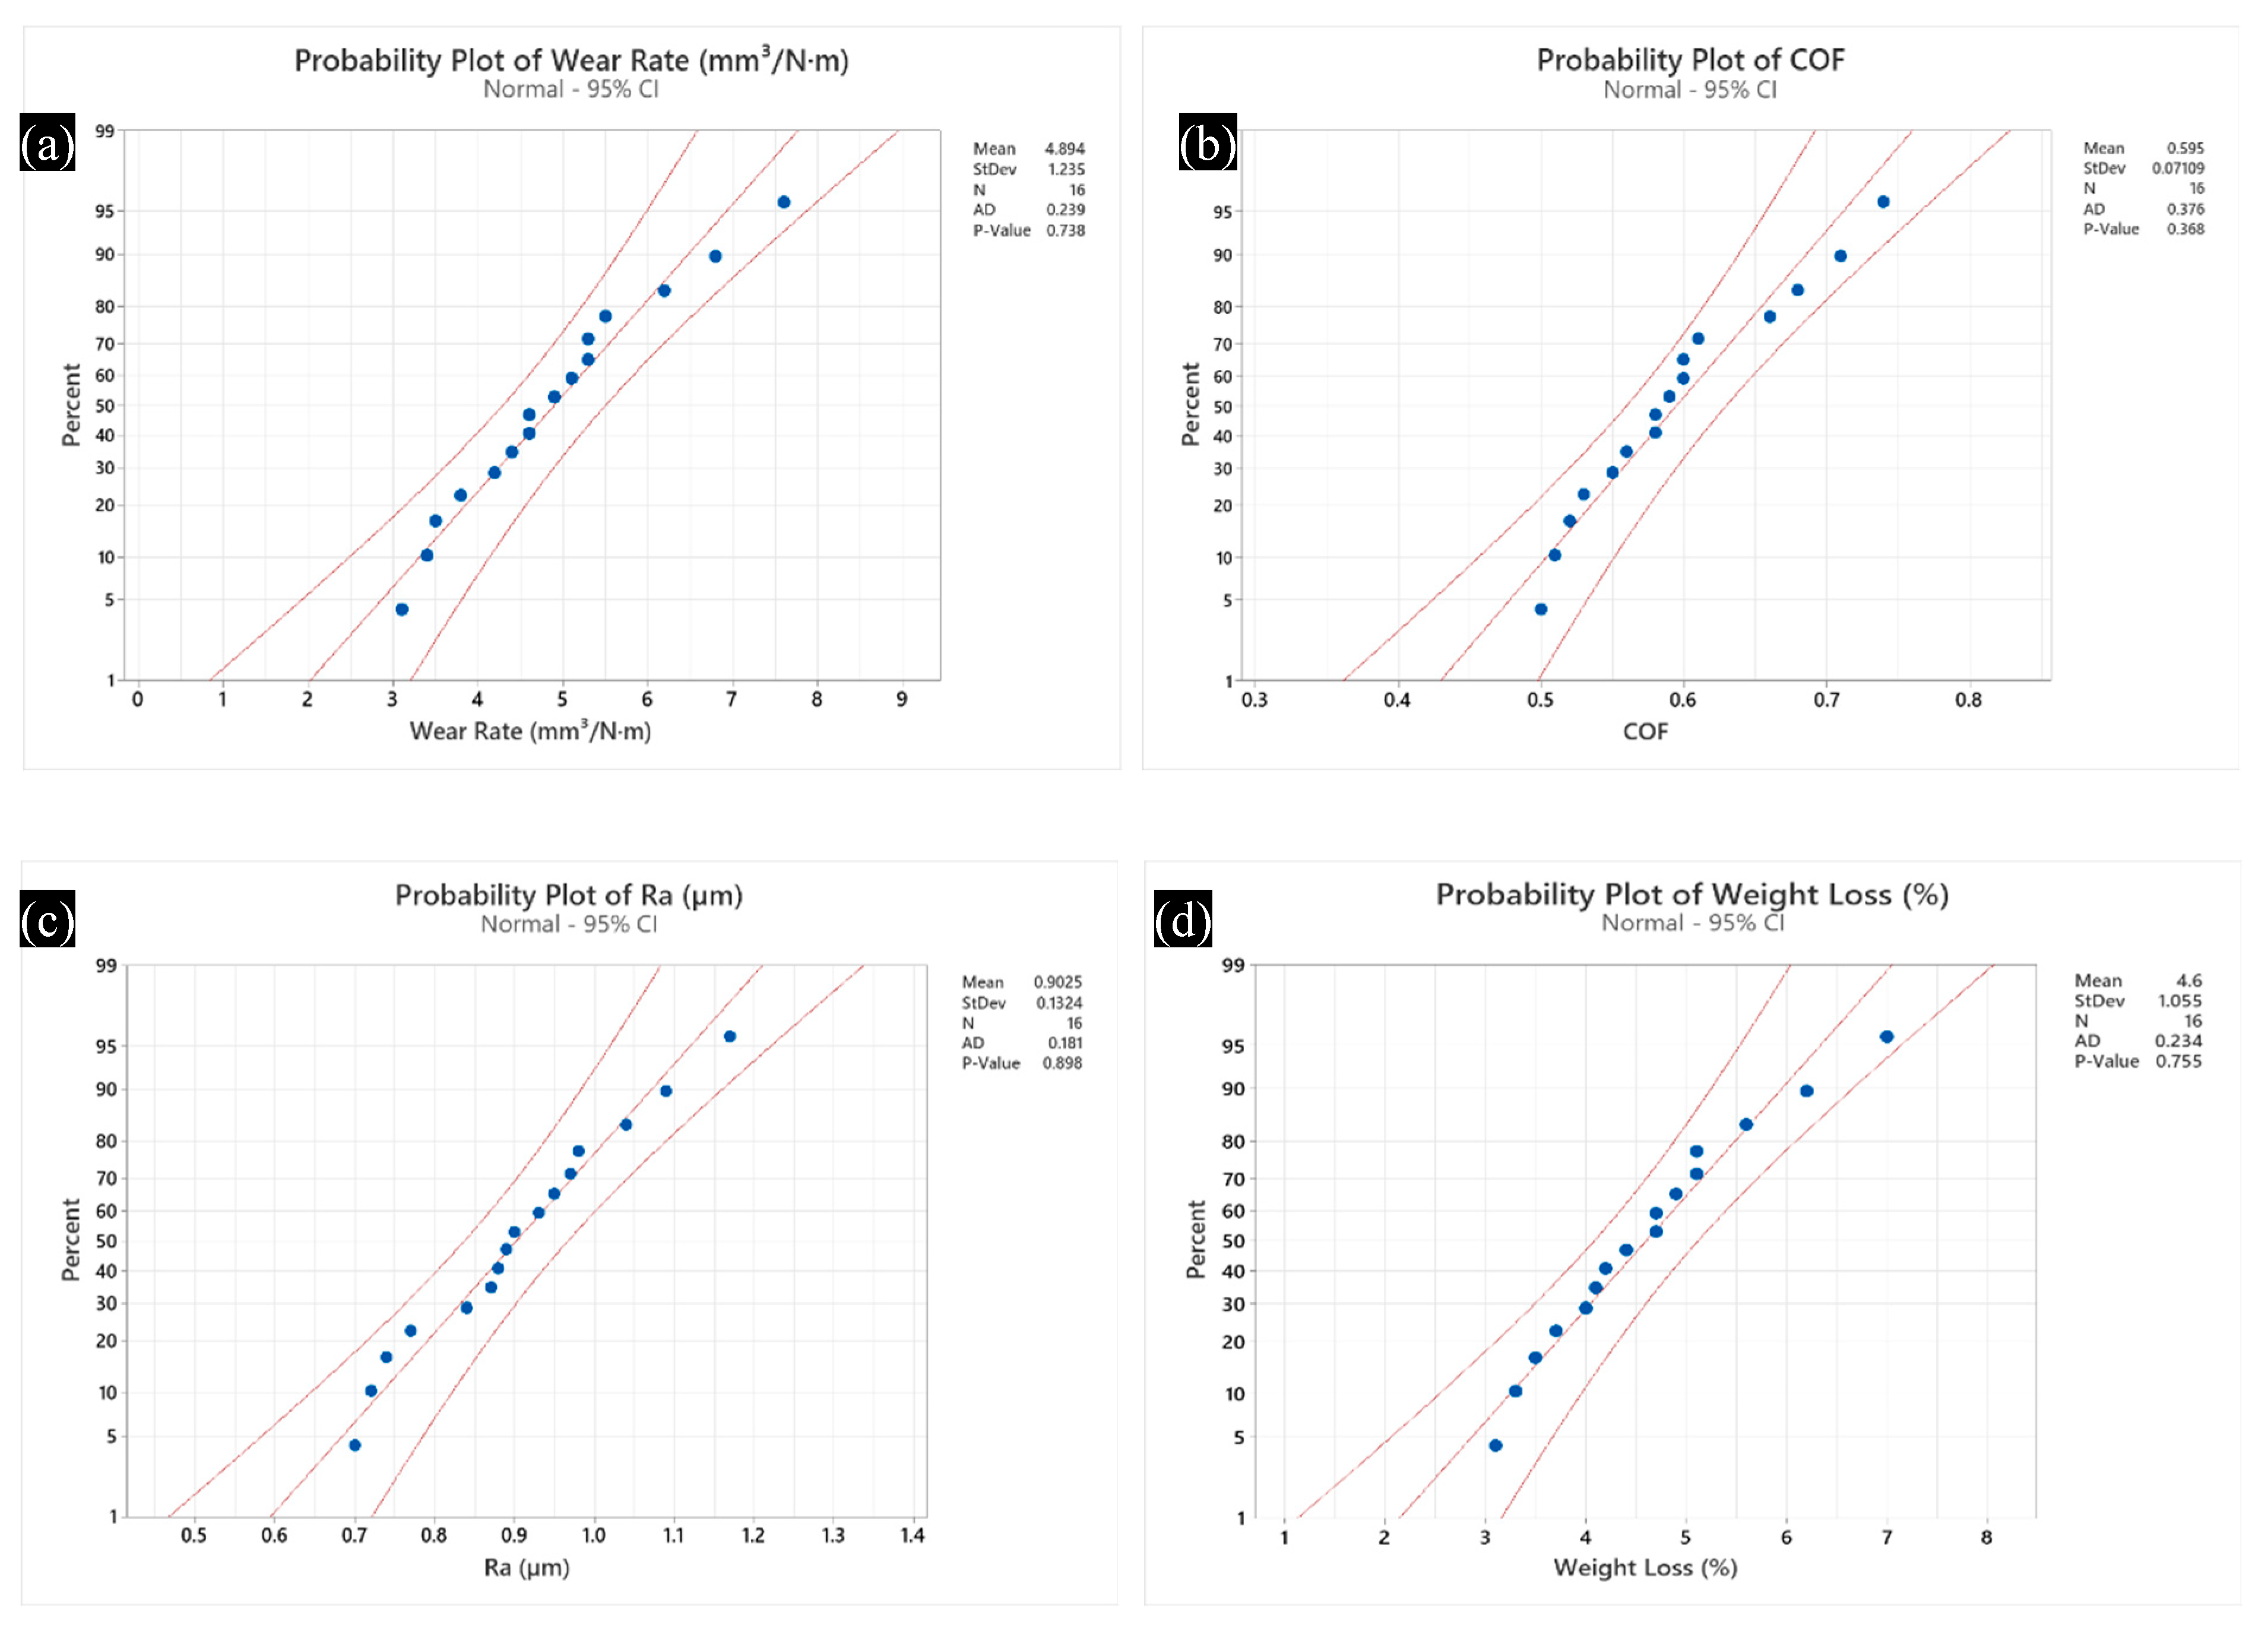
4.4. Normality Assessment of Responses

Probability plots for WR, COF, Ra, and WL are shown in Figure 4a–d, respectively. These plots assess whether the experimental response data follow a normal distribution, a key assumption for ANOVA and Taguchi analysis. Figure 4a shows the probability plot for WR, with a p-value of 0.738, indicating that the WR data are normally distributed. The points closely follow the straight line within the 95% confidence limits, further confirming normality. Figure 4b presents the probability plot for COF, which also shows a p-value of 0.368. Although slightly lower than that for WR, the p-value exceeds 0.05, confirming that the COF data follow a normal distribution with acceptable variance. Figure 4c displays the probability plot for Ra, with a p-value of 0.898. The extremely high p-value and the excellent alignment of data points along the normal probability line strongly confirm that the Ra data are normally distributed. Figure 4d shows the probability plot for WL, yielding a p-value of 0.755, which again validates the normality of the WL data. The points exhibit minor scatter but remain within the confidence bounds, supporting the normality assumption. Across all four responses, the p-values were significantly greater than 0.05, confirming that the experimental data were normally distributed and suitable for Taguchi and ANOVA analyses without requiring any data transformations.

4.5. Empirical CDF Analysis

The Empirical CDF plots for the measured responses are shown in Figure 5a,b. These plots provide a visual representation of the cumulative probability distribution of the experimental data and further validate the normality behavior observed from the probability plots. Figure 5a illustrates the CDF plots of WR and WL. Both datasets closely follow a smooth S-shaped curve typical of a normal distribution. The CDF of WL shifts slightly leftward compared with that of WR, indicating slightly lower dispersion. The proximity of the two curves confirms the consistency of mass loss behavior with wear volume evolution in the composites. Figure 5b displays the CDF plots for COF and Ra. The CDF for COF is steeper and converges rapidly toward 100%, reflecting a smaller variance and tighter clustering of frictional behavior. In contrast, Ra exhibits a slightly more gradual curve, indicating greater variability in surface roughness compared with COF. Nevertheless, both responses maintain a shape consistent with normal distribution. Overall, the Empirical CDF analysis corroborates the statistical stability and reliability of the WR, COF, Ra, and WL datasets, supporting the robustness of the Taguchi optimization and ANOVA findings.

4.6. SEM and AFM Analysis

The SEM micrographs of the worn surfaces corresponding to different MWCNT loadings and testing conditions are presented in Figure 6a–d. These images provide critical insights into the wear mechanisms governing the tribological behavior of bio-based epoxy/MWCNT composites, complementing the Taguchi and ANOVA analyses discussed earlier. Figure 6a depicts the worn surface of the composite containing 0.5 wt% MWCNT, tested under 30 N load and 1.0 m/s sliding speed, which exhibited the lowest WR and WL. The surface is relatively smooth with shallow grooves and minimal microcracking, suggesting that the presence of optimally dispersed MWCNTs effectively reinforced the matrix, enhanced load transfer, and resisted surface degradation during sliding. This observation aligns with the Taguchi and ANOVA results, where 0.5 wt% MWCNT content showed the highest contribution towards minimizing WR, COF, Ra, and WL.
Figure 6b shows the worn surface of the neat epoxy (0 wt% MWCNT) tested under 50 N load and 2.5 m/s sliding speed, corresponding to the worst-performing condition with the highest WR and WL. The surface exhibits severe abrasive wear, characterized by deep plough marks, material pull-out, and significant cracking. The absence of MWCNTs rendered the matrix vulnerable to plastic deformation and fracture under higher loads and speeds, corroborating the Taguchi findings where neat epoxy consistently demonstrated inferior wear performance. Figure 6c presents the worn surface for 0.25 wt% MWCNT composite tested at 40 N load and 2.5 m/s speed, representing an intermediate wear behavior. The surface shows moderate roughness with visible shallow grooves and localized debris accumulation. While some reinforcement effect is evident, the relatively lower MWCNT content was insufficient to fully suppress wear mechanisms under the applied conditions, explaining the moderate WR and WL observed in the Taguchi matrix.
Figure 6d corresponds to the worn surface of the composite containing 0.75 wt% MWCNT, tested at 20 N load and 2.5 m/s sliding speed. Although the surface appears smoother compared with neat epoxy, localized rough patches and signs of particle pull-out are noticeable, indicating possible MWCNT agglomeration effects at higher filler loading. These agglomerates can act as stress concentrators, initiating surface damage, and thus slightly deteriorating the wear performance compared with the 0.5 wt% optimized condition. This observation is consistent with the slight increase in WR, Ra, and WL at 0.75 wt% noted in the Taguchi and ANOVA analyses. Overall, the SEM analysis substantiates that optimal MWCNT reinforcement (0.5 wt%) significantly improved the wear resistance and surface integrity of the bio-based epoxy composite, whereas excessive or insufficient filler content adversely affected the tribological performance.
Atomic Force Microscopy (AFM-Bruker Corporation, Billerica, MA, USA) was employed to analyze the worn surface topography at the nanoscale, complementing SEM observations. Figure 7 presents the 3D surface morphology of four selected composite samples corresponding to key wear conditions. The sample with 0.5 wt% MWCNT at 30 N and 1.0 m/s (Figure 7a) exhibited the lowest surface roughness, with smooth undulations and minimal peak–valley variation, supporting the optimal tribological performance inferred from Taguchi and ANOVA analyses. Conversely, the sample with 0 wt% MWCNT at 50 N and 2.5 m/s (Figure 7b) revealed pronounced surface deformation, including sharp asperities and deeper valleys, consistent with its highest wear rate and COF. The 0.25 wt% MWCNT sample at 40 N and 2.5 m/s (Figure 7c) showed moderately rough features, indicating partial reinforcement effectiveness. Notably, the 0.75 wt% MWCNT sample at 20 N and 2.5 m/s (Figure 7d) displayed irregular roughness due to probable MWCNT agglomeration, corroborating the slight performance drop observed beyond the optimal filler concentration. These nanoscale profiles validate the wear mechanism trends previously established.

4.7. Mathematical Modeling of Wear Behavior

4.7.1. Linear and Polynomial Regression Analysis

To understand the influence of MWCNT reinforcement on the wear performance of bio-based epoxy composites, linear and polynomial regression models were developed using the experimental data obtained from the Taguchi-designed wear tests. Linear regression was first applied to model the wear rate (WR) as a direct function of MWCNT weight percentage in Equation (1):
W R =   β 0 +   β 1 M W C N T w t % +   ϵ
where W R is the specific wear rate (mm3/N·m), M W C N T w t % is the filler loading (0–0.75 wt%), β 0 is the intercept, β 1 is the slope coefficient, and ϵ is the error term. This model assumes a linear trend, i.e., wear rate either decreases or increases uniformly with filler content. However, filler-reinforced polymers typically show nonlinearity due to agglomeration beyond the optimum threshold.

4.7.2. Polynomial Regression Model (Quadratic)

To capture the curvature and optimum MWCNT loading point, a second-order (quadratic) polynomial regression was fitted:
W R = β 0 + β 1 M W C N T % + β 2 ( M W C N T % ) 2 + ϵ
This model accounts for the nonlinear trend observed in the experimental data: the wear rate decreases initially with increasing M W C N T % , reaches a minimum at 0.5 wt%, and then increases again due to agglomeration at higher loadings (0.75 wt%).

4.7.3. Multiple Linear Regression (MLR) Analysis

To enhance prediction accuracy and integrate topographical surface parameters, a multivariate regression model was developed with the following structure:
W R = β 0 + β 1 M W C N T % + β 2 R a + β 3 ( R q ) + ϵ
where Ra is Average roughness, and Rq is Root mean square roughness. This model correlates the combined effect of filler content and nanoscale surface characteristics on wear performance. Coefficients indicate the relative contribution of each predictor to wear rate.

4.7.4. Model Performance Evaluation

The models were evaluated using the Coefficient of Determination (R2):
R 2 = 1 ( y i y ^ i ) 2 ( y i y ¯ ) 2
This indicates how well the model explains the variance in the observed data. Root Mean Square Error (RMSE):
R M S E = 1 n ( y i y ^ i ) 2
This represents the average prediction error magnitude. The results show that the polynomial model achieved a better fit than linear regression, confirming a nonlinear relationship between WR and MWCNT%. The multiple regression model further improved prediction accuracy by including Ra and Rq as predictors. Figure 8 (regression fit plot) presents the comparison of experimental wear rates with predicted values from both linear and polynomial models. The polynomial curve clearly reflects the performance minimum at 0.5 wt% MWCNT, validating the conclusions drawn from Taguchi optimization.

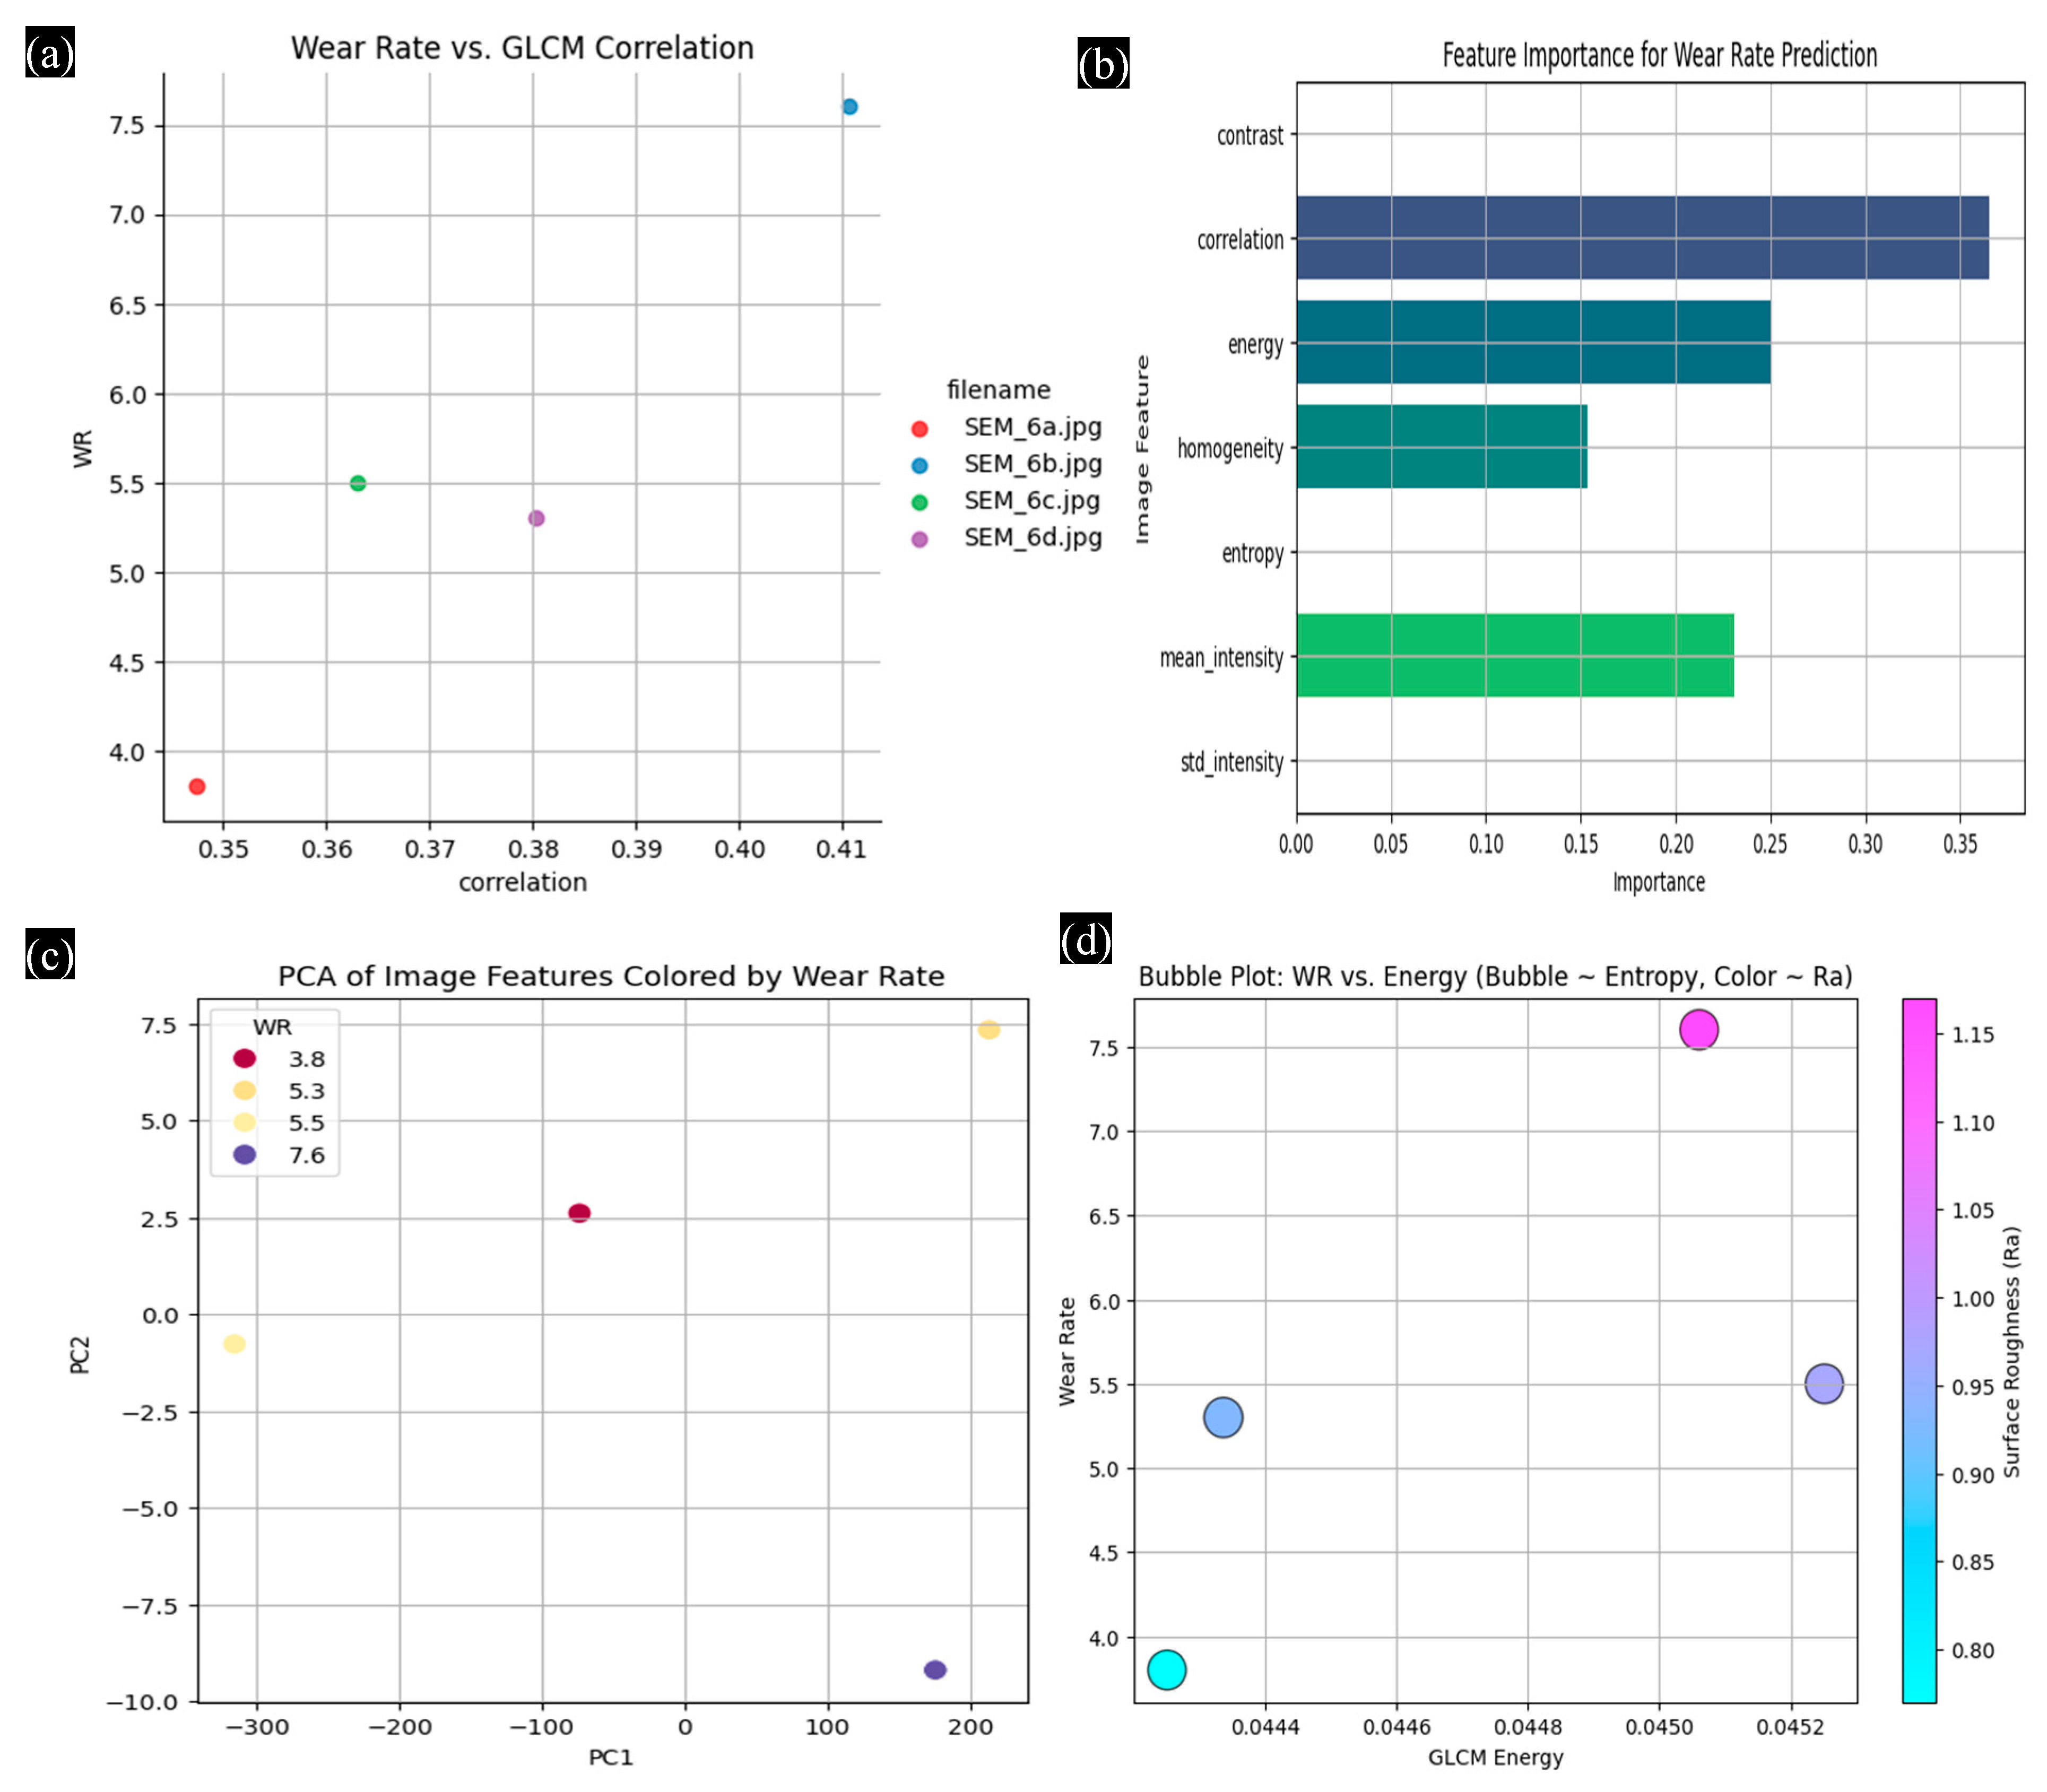
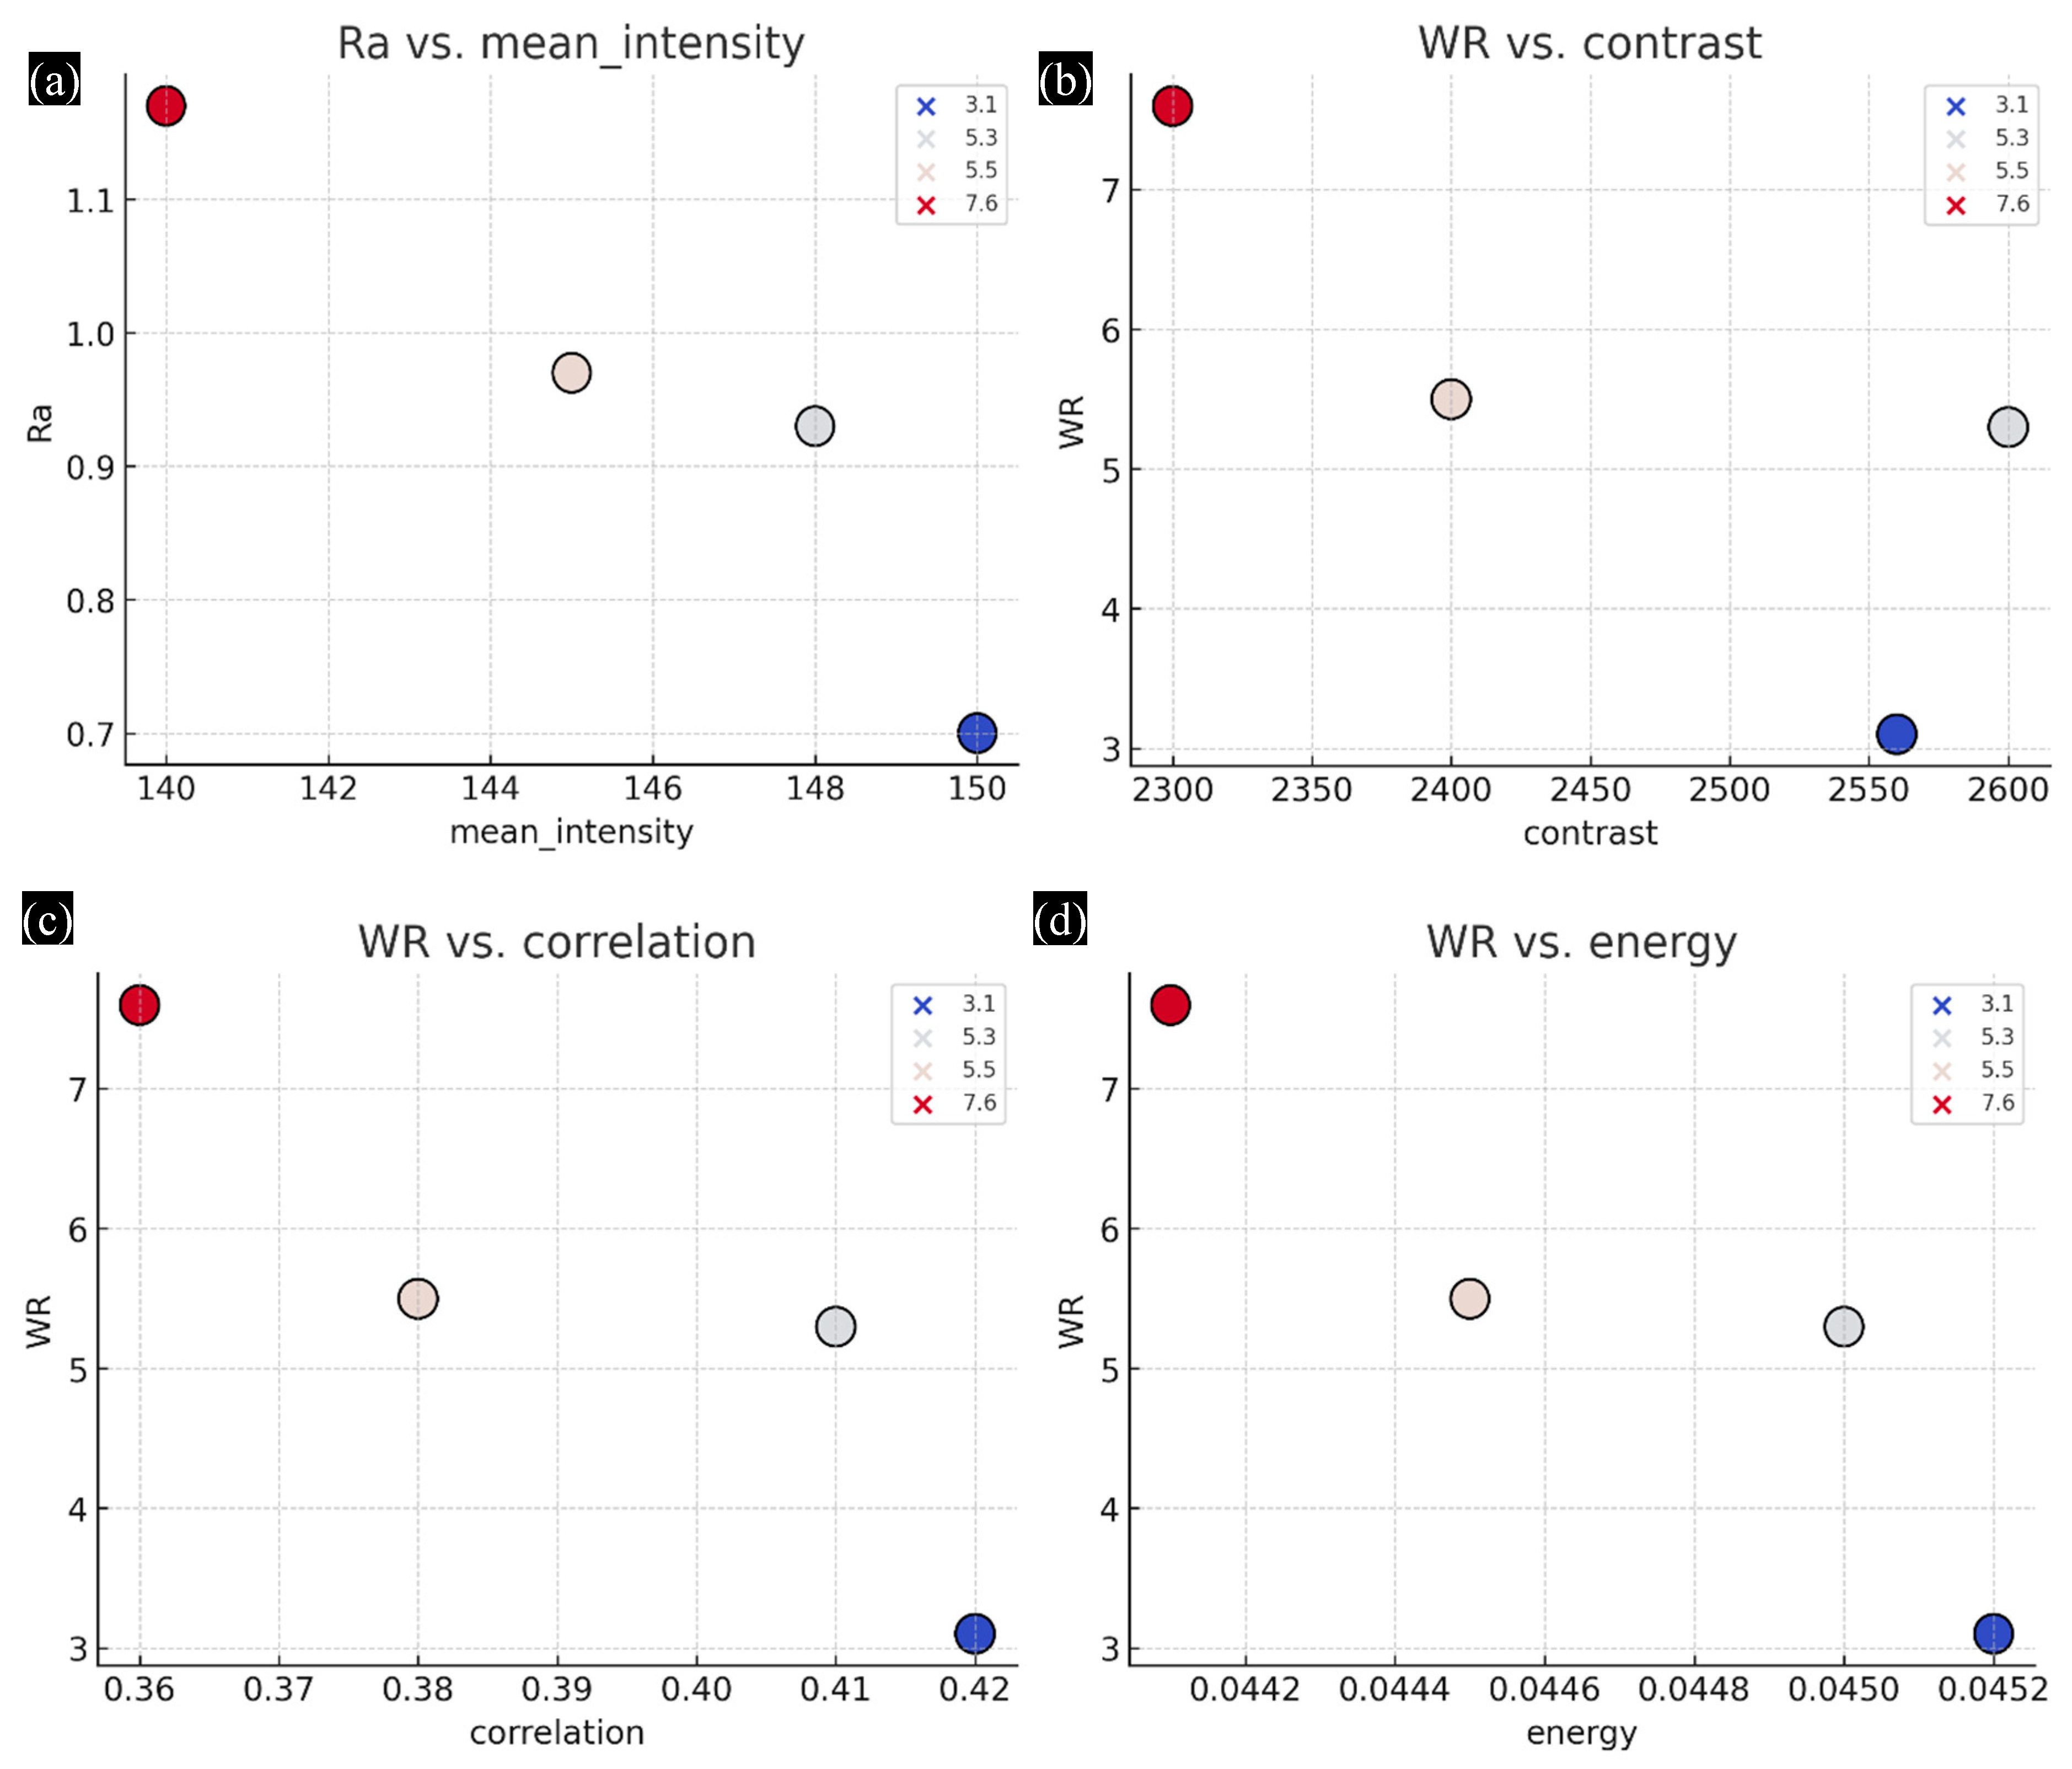
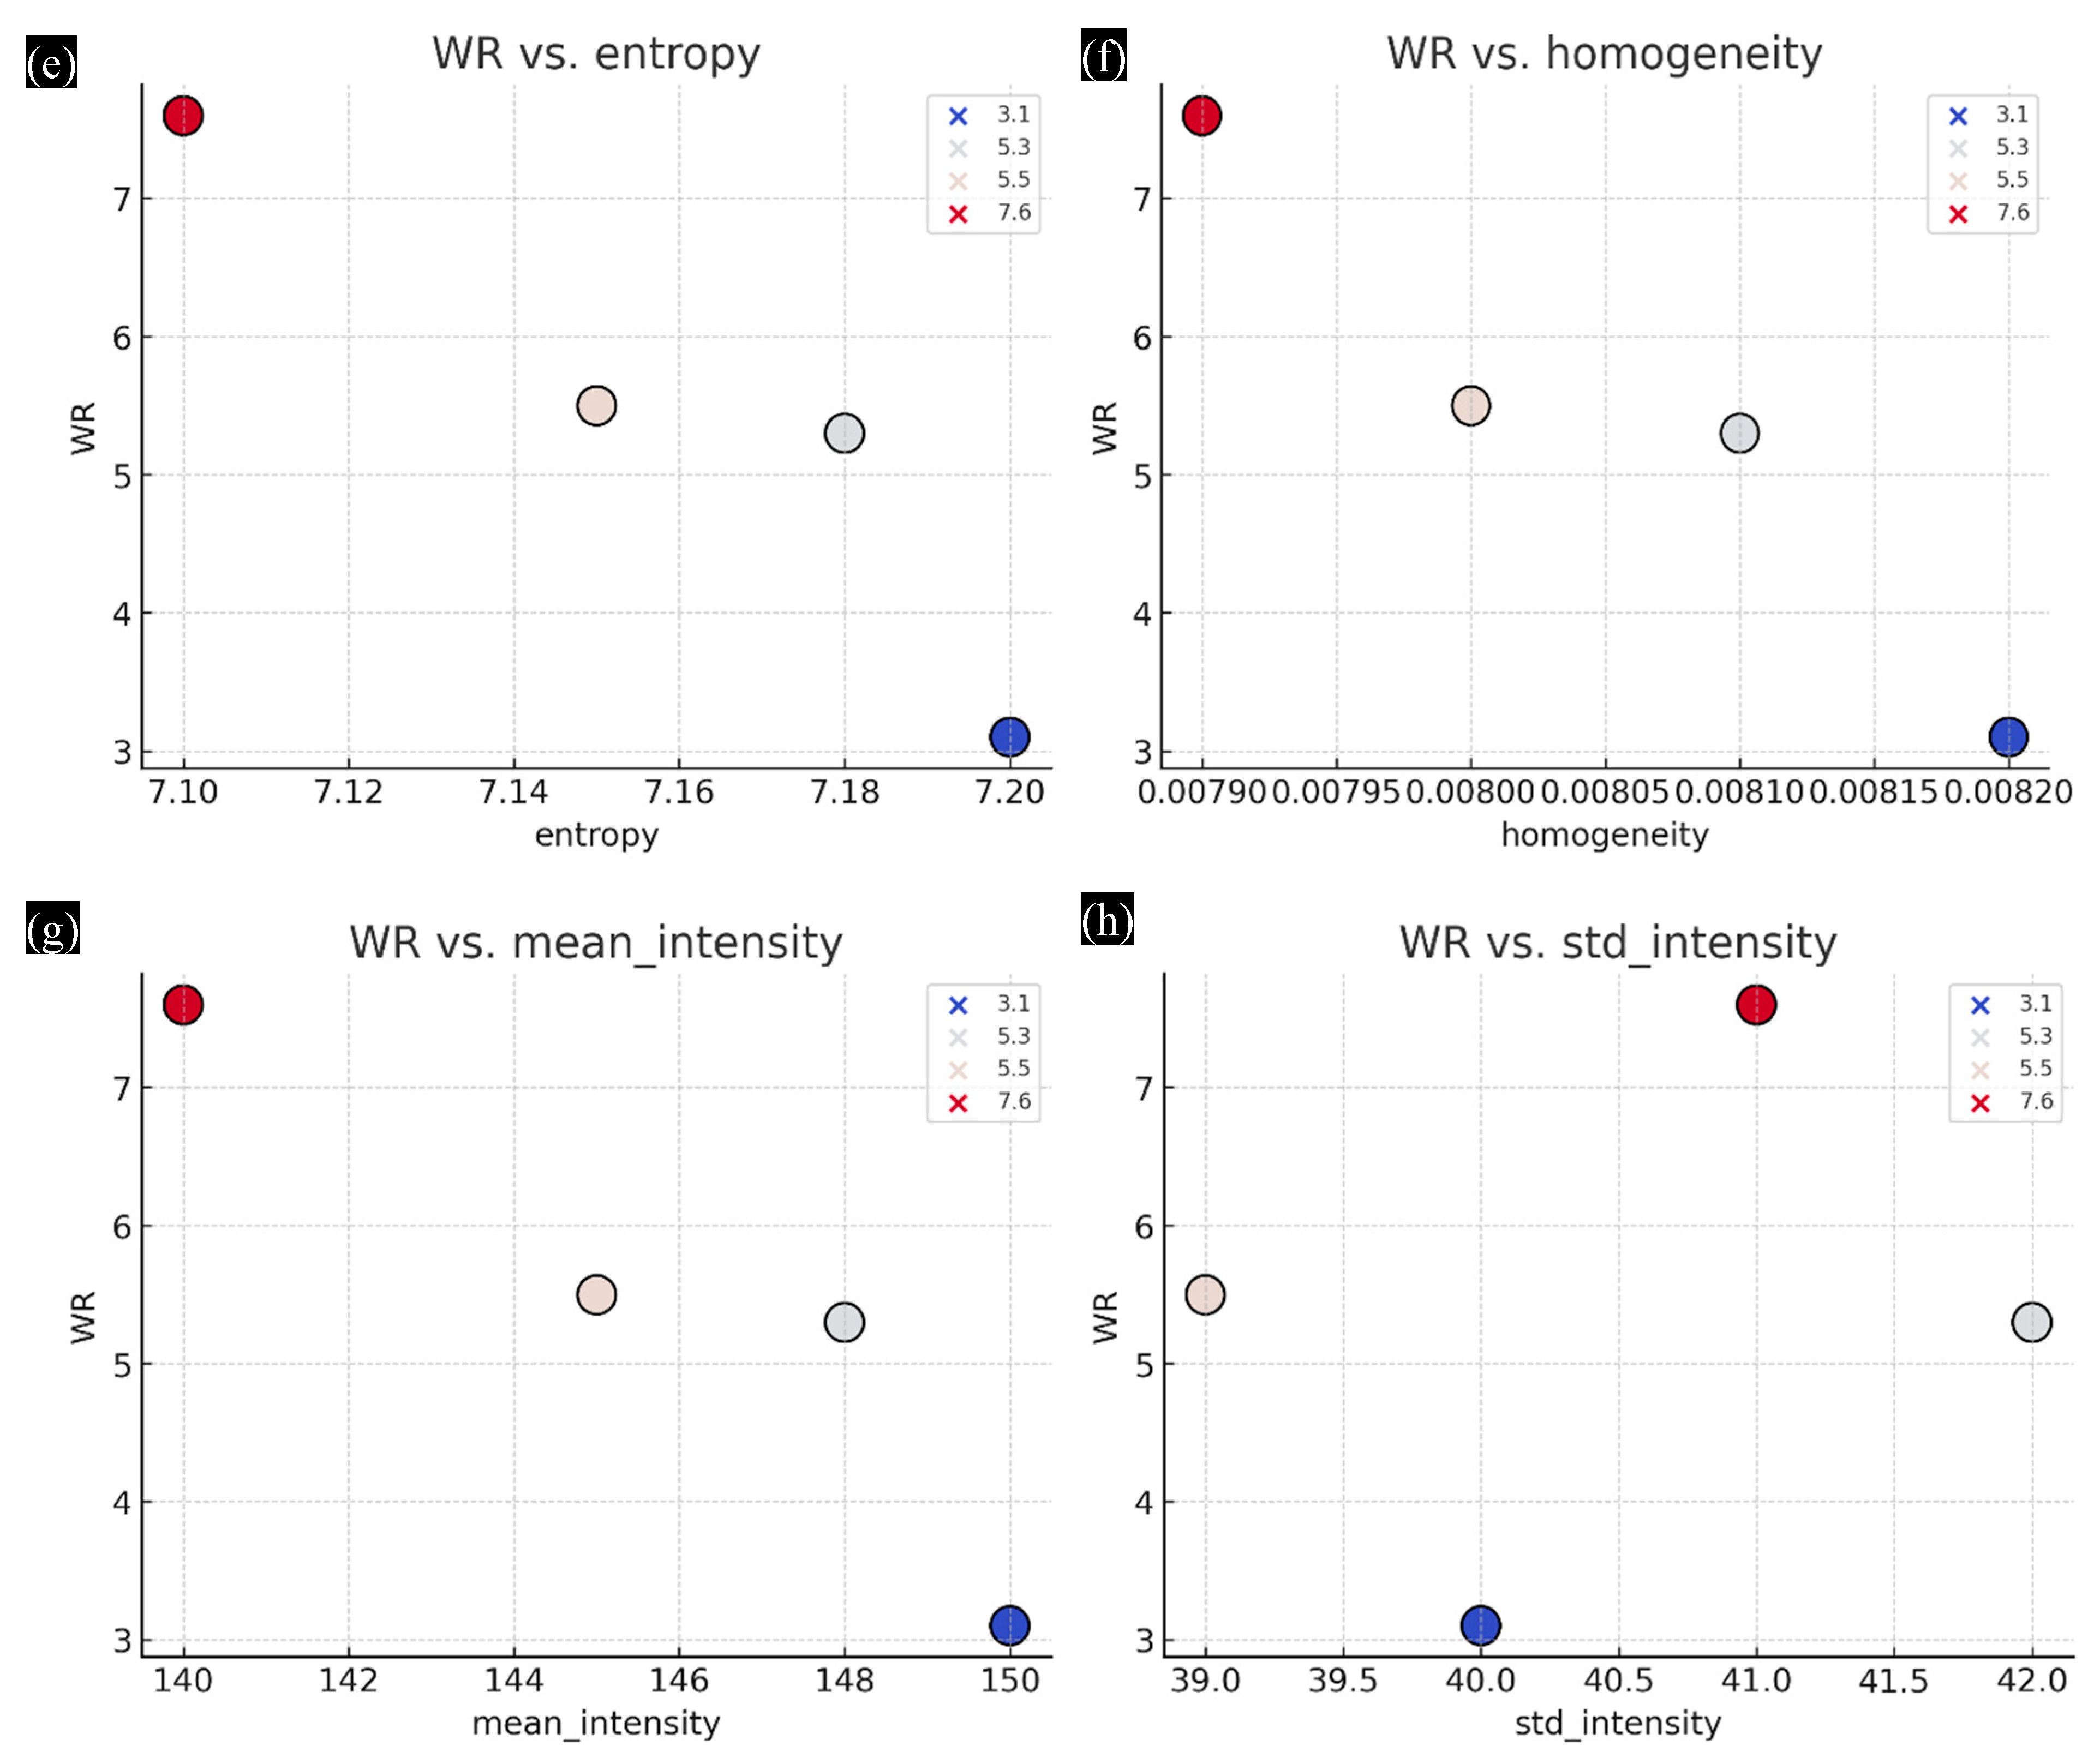
4.8. Image-Based Feature Modeling and Wear Behavior Analysis in Filler-Reinforced Polymers

Figure 9 presents the correlation matrix derived from image-based features extracted from SEM and AFM micrographs of the worn surfaces of MWCNT-reinforced bio-based epoxy composites. These features such as contrast, correlation, energy, homogeneity, entropy, mean intensity, and standard deviation of intensity were computed using gray-level co-occurrence matrix (GLCM) analysis and statistical texture descriptors. By applying Python-based image processing libraries, grayscale versions of the images were preprocessed, and region-wise features were extracted uniformly for comparative evaluation. The matrix illustrates how each feature correlates with experimentally measured tribological outcomes such as wear rate (WR) and surface roughness (Ra). Strong positive correlations (e.g., between correlation and Ra, or energy and WR) and negative correlations (e.g., between mean intensity and Ra) highlight the influence of microstructural texture on wear behavior. This heatmap serves as a foundational analytical tool to identify which texture parameters are most relevant to wear performance and guide further regression or machine learning modeling.
To build a data-driven understanding of how microstructural texture influences tribological performance, selected image features were subjected to regression modeling and dimensionality reduction analyses. Figure 10a illustrates the direct relationship between GLCM correlation and wear rate (WR), extracted from SEM images of worn surfaces. A positive linear trend is observed, indicating that higher correlation associated with aligned, smoother surface textures is linked to increased wear, likely due to directional wear track formation and reduced microstructural resistance. This relationship highlights the ability of second-order texture statistics to capture wear-induced morphological changes.
Figure 10b presents the feature importance ranking obtained through a Random Forest Regressor trained on the image-derived features. The model identifies correlation, energy, and mean intensity as the most influential predictors of WR. GLCM energy, indicative of texture uniformity, and mean intensity, which reflects average grayscale brightness (linked to worn flatness or plastic deformation), contribute significantly to wear characterization. The result confirms that combining multiple descriptors, both statistical and textural, enhances the robustness of wear prediction models.
To further validate feature separability and the independence of wear conditions, Figure 10c shows a principal component analysis (PCA) projection of the samples in a reduced 2D feature space. Samples with different wear rates are distinctly grouped, suggesting strong variance captured along the first two principal components. This validates the discriminative capability of the selected features and supports the feasibility of multivariate classification or clustering based on image data.
Figure 10d presents a multivariate bubble plot correlating GLCM energy with WR. The bubble size represents entropy (a measure of texture complexity or disorder), while the color scale reflects surface roughness (Ra). This visualization highlights nonlinearity in the feature response space: for instance, certain samples with similar GLCM energy show varying wear behavior depending on entropy and roughness. Such complex interactions indicate that wear in nanofilled composites cannot be explained by single-variable dependence and emphasize the need for multidimensional analysis. Notably, beyond the optimal filler loading, surface features tend to become less uniform and more erratic due to CNT agglomeration, which is captured effectively by increased entropy and wear rate.
To further elucidate the role of individual image-based features on wear behavior, Figure 11a–h present a set of high-resolution scatter plots comparing selected texture descriptors with wear rate (WR) and surface roughness (Ra). These descriptors were extracted from grayscale SEM and AFM images using gray-level co-occurrence matrix (GLCM) analysis and pixel intensity statistics. Each plot visualizes the behavior of one image feature in relation to WR or Ra, helping isolate its contribution and physical interpretation. Figure 11a presents the relationship between average grayscale intensity and surface roughness (Ra). A clear inverse trend is observed, indicating that brighter (higher mean intensity) surface regions, often associated with smoother or polished wear zones, correspond to lower roughness values. This highlights the utility of mean intensity as a quick image-derived proxy for surface finish evaluation.
In Figure 11b, the scatter plot of WR vs. contrast reveals a non-monotonic trend. Higher contrast values typically represent more distinct surface features and sharp wear scars. Samples with moderate contrast tend to show increased WR, possibly due to micro-abrasive damage, whereas extreme contrast values may reflect smoother or delaminated zones with reduced wear. Figure 11c explores the strong inverse correlation between WR and GLCM correlation. As correlation increases, suggesting more uniform and directionally consistent textures, WR tends to decrease. This reinforces the observation that aligned surface features are associated with lower resistance to abrasive forces and thus higher WR.
Figure 11d shows WR plotted against GLCM energy, which measures texture uniformity. An increase in energy generally corresponds to reduced wear, implying that more regular and homogeneous textures may resist material removal more effectively due to minimized stress concentration. Figure 11e illustrates the trend between WR and entropy, which is a descriptor of textural complexity. Higher entropy values, reflecting disordered or fractured morphologies, are directly associated with increased WR. This aligns with the known mechanism where chaotic surface patterns facilitate micro-cutting or fatigue-driven wear.
In Figure 11f, WR is compared with GLCM homogeneity. A positive correlation is observed, with higher homogeneity (indicating less local variation) corresponding to lower wear rates. This suggests that smoother surface evolution leads to improved wear resistance. Figure 11g revisits WR vs. mean intensity, where a similar inverse relation as in Ra is observed. Higher brightness levels in worn surfaces correlate with reduced WR, reinforcing that mean intensity effectively captures post-wear topography. Finally, Figure 11h presents WR vs. standard deviation of intensity. Samples with higher variability in pixel intensities exhibit increased WR, likely due to the presence of deep grooves and pits leading to heterogeneous wear.
To comprehensively analyze the wear performance of MWCNT-reinforced bio-based epoxy composites, this study employed three synergistic modeling techniques: Taguchi design of experiments, polynomial regression-based mathematical modeling, and machine learning using image-derived features. The comparative framework (Figure 12) and summary table (Table 6) highlight the unique contribution of each method. While Taguchi analysis ensured statistically optimal processing conditions, regression modeling captured nonlinear effects including filler agglomeration. The novel incorporation of image-based ML modeling enabled the direct prediction of wear and roughness behavior from texture parameters extracted from SEM/AFM images, marking a significant advancement in automated materials diagnostics.
To contextualize the performance of the proposed Random Forest (RF) model, it was briefly compared with conventional methods such as classical regression, Response Surface Methodology (RSM), and Artificial Neural Networks (ANN). While regression and RSM are useful for parametric optimization, they are limited in capturing complex nonlinearities, especially with image-derived features. ANN models offer high accuracy but often require large datasets and lack interpretability. In contrast, the RF model used here achieved R2 ≈ 0.93, handled nonlinear interactions effectively, and provided interpretable feature importance, making it a more balanced and reliable choice for tribological wear prediction using limited experimental data.

5. Conclusions

This study employed a three-tiered approach to understand and predict the wear performance of bio-based epoxy composites reinforced with MWCNTs: (i) Taguchi experimental design with statistical validation, (ii) empirical regression-based mathematical modeling, and (iii) image processing and machine learning-based feature correlation and prediction.

5.1. Taguchi Analysis

The Taguchi design of experiments (DoE) using an L16 orthogonal array facilitated systematic evaluation of wear rate (WR), coefficient of friction (COF), and surface roughness (Ra) under varying test conditions and filler loadings. ANOVA revealed that filler weight percentage was the most significant factor influencing WR (~85.35% contribution), followed by applied load. The optimum combination identified through S/N ratio analysis corresponded to 0.5 wt% MWCNT, which yielded the lowest WR (3.1 mm3/N·m) and surface roughness (0.7 µm), with experimental validation confirming these conditions.

5.2. Mathematical Modeling

Polynomial regression models were developed to capture the quantitative relationship between process parameters and tribological responses. The regression equations showed good correlation coefficients (R2 > 0.95), confirming the accuracy of the model in interpolating within the experimental design space. The models predicted trends consistent with Taguchi outcomes: WR decreased with MWCNT addition up to an optimal threshold and increased slightly thereafter due to particle agglomeration. The response surface plots also confirmed nonlinear behavior between filler content, applied load, and wear metrics.

5.3. Image Processing and Machine Learning-Based Modeling

SEM and AFM images of worn surfaces were analyzed using gray-level co-occurrence matrix (GLCM) features and statistical texture descriptors such as contrast, correlation, energy, entropy, mean intensity, and standard deviation. These features were then correlated with experimental WR and Ra using scatter plots, correlation matrices, and principal component analysis (PCA). Random Forest regression models were trained on these image-derived features, with correlation, energy, and std_intensity emerging as dominant predictors. Predicted WR values showed strong agreement with experimental data (R2 ≈ 0.93), confirming the capability of image-based models in predictive diagnostics.

5.4. Cross-Comparison and Insights

All three methods consistently identified 0.5 wt% MWCNT as the optimal reinforcement level for minimal wear and surface degradation. However, while Taguchi and regression analyses provided statistically grounded optimization based on input parameters, the image-based ML approach offered mechanistic insight by directly linking microstructural evolution to wear behavior. Unlike Taguchi or regression models, the image processing approach could detect nonlinear surface patterns (e.g., entropy increase, homogeneity loss) arising due to microcracking or filler agglomeration subtleties often missed by macroscopic models.
Thus, the hybrid integration of experimental, mathematical, and computational techniques not only validates the experimental observations but also sets the foundation for automated, image-based wear prediction tools, particularly useful in material screening and intelligent composite design. The proposed pipeline, which relies on standard surface imaging (SEM/AFM) and minimal experimental trials, demonstrates strong potential for industrial applications such as real-time diagnostics, quality assessment, and predictive screening of composite formulations. Its ability to generate accurate wear predictions from image-derived features can significantly reduce experimental overhead and accelerate decision-making in tribological component development.

Author Contributions

P.H. conceptualized the study, designed the experimental plan, and supervised the overall research framework. S.S.H. and G.A. conducted the wear experiments and participated in data acquisition. R.K.G. performed surface morphological analyses using SEM and AFM techniques. G.D.D. contributed to statistical modeling and Taguchi analysis. R.C.S. carried out the machine learning modeling, image feature extraction, and validation studies. All authors contributed to manuscript drafting and data interpretation. All authors have read and agreed to the published version of the manuscript.

Funding

This research received no external funding.

Institutional Review Board Statement

Not applicable.

Informed Consent Statement

Not applicable.

Data Availability Statement

All data supporting the findings of this study are available within the article.

Conflicts of Interest

The authors declare no conflicts of interest.

References

  1. Babu, R.P.; O’Connor, K.; Seeram, R. Current progress on bio-based polymers and their future trends. Prog. Biomater. 2013, 2, 8. [Google Scholar] [CrossRef] [PubMed]
  2. Gonçalves, F.A.M.M.; Santos, M.; Cernadas, T.; Ferreira, P.; Alves, P. Advances in the development of biobased epoxy resins: Insight into more sustainable materials and future applications. Int. Mater. Rev. 2022, 67, 119–149. [Google Scholar] [CrossRef]
  3. George, J.S.; Uthaman, A.; Reghunadhan, A.; Lal, H.M.; Thomas, S.; Vijayan, P.P. Bioderived thermosetting polymers and their nanocomposites: Current trends and future outlook. Emergent Mater. 2022, 5, 3–27. [Google Scholar] [CrossRef]
  4. Prasannakumar, P.; Sankarannair, S.; Prasad, G.; H., H.K.P.; S., P.; P., V.; S., S.; Shanmugam, R. Bio-based additives in lubricants: Addressing challenges and leveraging for improved performance toward sustainable lubrication. Biomass Convers. Biorefinery 2025, 15, 17969–17997. [Google Scholar] [CrossRef]
  5. Fekiač, J.J.; Krbata, M.; Kohutiar, M.; Janík, R.; Kakošová, L.; Breznická, A.; Eckert, M.; Mikuš, P. Comprehensive Review: Optimization of Epoxy Composites, Mechanical Properties, & Technological Trends. Polymers 2025, 17, 271. [Google Scholar] [CrossRef] [PubMed]
  6. Ye, W.; Shi, Y.; Zhou, Q.; Xie, M.; Wang, H.; Bou-Saïd, B.; Liu, W. Recent advances in self-lubricating metal matrix nanocomposites reinforced by carbonous materials: A review. Nano Mater. Sci. 2024, 6, 701–713. [Google Scholar] [CrossRef]
  7. Wang, R.; Xiong, Y.; Yang, K.; Zhang, T.; Zhang, F.; Xiong, B.; Hao, Y.; Zhang, H.; Chen, Y.; Tang, J. Advanced progress on the significant influences of multi-dimensional nanofillers on the tribological performance of coatings. RSC Adv. 2023, 13, 19981–20022. [Google Scholar] [CrossRef] [PubMed]
  8. Singh, M.; Dodla, S.; Gautam, R.K.; Chauhan, V. Enhancement of mechanical and tribological properties in glass fiber-reinforced polymer composites with multi-walled carbon nanotubes and ANN-based COF prediction. Compos. Interfaces 2024, 32, 439–459. [Google Scholar] [CrossRef]
  9. Sallakhniknezhad, R.; Ahmadian, H.; Zhou, T.; Weijia, G.; Anantharajan, S.K.; Sadoun, A.M.; Abdelfattah, W.M.; Fathy, A. Recent Advances and Applications of Carbon Nanotubes (CNTs) in Machining Processes: A Review. J. Manuf. Mater. Process. 2024, 8, 282. [Google Scholar] [CrossRef]
  10. Ujah, C.O.; Von Kallon, D.V.; Aigbodion, V.S. Tribological Properties of CNTs-Reinforced Nano Composite Materials. Lubricants 2023, 11, 95. [Google Scholar] [CrossRef]
  11. Obada, D.O.; Salami, K.A.; Oyedeji, A.N.; Osuchukwu, O.A.; Abass, J.; Ogwuche, C.; Bansod, N.D.; Ubgaja, M.I.; Ibrahim, I.U.; Abdulkareem, B.; et al. Mechanical and frictional properties of coconut husk powder reinforced polymer immersed in a simulated acidic medium for oil/gas applications. Heliyon 2024, 10, e25026. [Google Scholar] [CrossRef] [PubMed]
  12. Shah, M.; Ullah, A.; Azher, K.; Rehman, A.U.; Juan, W.; Aktürk, N.; Tüfekci, C.S.; Salamci, M.U. Vat photopolymerization-based 3D printing of polymer nanocomposites: Current trends and applications. RSC Adv. 2023, 13, 1456–1496. [Google Scholar] [CrossRef] [PubMed]
  13. Karthikeyan, N.; Naveen, J. Progress in adhesive-bonded composite joints: A comprehensive review. J. Reinf. Plast. Compos. 2024, 07316844241248236. [Google Scholar] [CrossRef]
  14. Abedi, M.; Fangueiro, R.; Correia, A.G. Effects of multiscale carbon-based conductive fillers on the performances of a self-sensing cementitious geocomposite. J. Build. Eng. 2021, 43, 103171. [Google Scholar] [CrossRef]
  15. Zaghloul, M.M.Y. Experimental and modeling analysis of mechanical-electrical behaviors of polypropylene composites filled with graphite and MWCNT fillers. Polym. Test. 2017, 63, 467–474. [Google Scholar] [CrossRef]
  16. Arunachalam, S.J.; Saravanan, R.; Sathish, T.; Alarfaj, A.A.; Giri, J.; Kumar, A. Enhancing mechanical performance of MWCNT filler with jute/kenaf/glass composite: A statistical optimization study using RSM and ANN. Mater. Technol. 2024, 39, 2381156. [Google Scholar] [CrossRef]
  17. Zhai, W.; Bai, L.; Zhou, R.; Fan, X.; Kang, G.; Liu, Y.; Zhou, K. Recent Progress on Wear-Resistant Materials: Designs, Properties, and Applications. Adv. Sci. 2021, 8, 2003739. [Google Scholar] [CrossRef] [PubMed]
  18. Hiremath, P.; Ranjan, R.; DeSouza, V.; Bhat, R.; Patil, S.; Maddodi, B.; Shivamurthy, B.; Perez, T.C.; Naik, N. Enhanced Wear Resistance in Carbon Nanotube-Filled Bio-Epoxy Composites: A Comprehensive Analysis via Scanning Electron Microscopy and Atomic Force Microscopy. J. Compos. Sci. 2023, 7, 478. [Google Scholar] [CrossRef]
  19. Nečas, D.; Valtr, M.; Klapetek, P. How levelling and scan line corrections ruin roughness measurement and how to prevent it. Sci. Rep. 2020, 10, 15294. [Google Scholar] [CrossRef] [PubMed]
  20. Bhagath, Y.B.; Lee, S.Y.; Kola, M.; Sharma, T.S.K.; Beulah, A.M.; Reddy, Y.V.M.; Park, T.J.; Park, J.P.; Sahukari, R.; Madhavi, G. Effect of Sulfamerazine on Structural Characteristics of Sodium Alginate Biopolymeric Films. Biotechnol. Bioprocess Eng. 2022, 27, 596–606. [Google Scholar] [CrossRef]
  21. Chan, J.X.; Wong, J.F.; Petrů, M.; Hassan, A.; Nirmal, U.; Othman, N.; Ilyas, R.A. Effect of Nanofillers on Tribological Properties of Polymer Nanocomposites: A Review on Recent Development. Polymers 2021, 13, 2867. [Google Scholar] [CrossRef] [PubMed]
  22. Beyanagari, S.R.; Sivalingam, A.; Kandasamy, J.; Katiyar, J.K. Influence of 2D solid lubricants on mechanical and tribological behaviour of Al 7XXX series metal matrix composites: A comprehensive review. Tribol. Mater. Surfaces Interfaces 2024, 18, 145–170. [Google Scholar] [CrossRef]
  23. Siddiqui, M.A.S.; Hossain, M.A.M.; Ferdous, R.; Rabbi, M.S.; Abid, S.M.S. An Extensive Review on Bibliometric Analysis of Carbon Nanostructure Reinforced Composites. Results Mater. 2025, 25, 100655. [Google Scholar] [CrossRef]
  24. Vinodhini, J.; Pitchan, M.K.; Bhowmik, S.; Barandun, G.A.; Jousset, P. Effect of different filler reinforcement on poly-ether-ether-ketone based nanocomposites for bearing applications. J. Compos. Mater. 2020, 54, 4709–4722. [Google Scholar] [CrossRef]
  25. Afolabi, O.A.; Ndou, N. Synergy of Hybrid Fillers for Emerging Composite and Nanocomposite Materials—A Review. Polymers 2024, 16, 1907. [Google Scholar] [CrossRef] [PubMed]
  26. Upadhyay, A.K.; Goyat, M.S.; Kumar, A. A review on the effect of oxide nanoparticles, carbon nanotubes, and their hybrid structure on the toughening of epoxy nanocomposites. J. Mater. Sci. 2022, 57, 13202–13232. [Google Scholar] [CrossRef]
  27. Markandan, K.; Lai, C.Q. Fabrication, properties and applications of polymer composites additively manufactured with filler alignment control: A review. Compos. Part B Eng. 2023, 256, 110661. [Google Scholar] [CrossRef]
  28. Zaghloul, M.M.Y.; Steel, K.; Veidt, M.; Heitzmann, M.T. Wear behaviour of polymeric materials reinforced with man-made fibres: A comprehensive review about fibre volume fraction influence on wear performance. J. Reinf. Plast. Compos. 2022, 41, 215–241. [Google Scholar] [CrossRef]
  29. Shankar, D.; Jambagi, S.C. Improvements in bioactivity, blood compatibility, and wear resistance of thermally sprayed carbon nanotube reinforced hydroxyapatite-based orthopedic implants. Tribol. Int. 2024, 197, 109809. [Google Scholar] [CrossRef]
  30. Pawlus, P.; Reizer, R.; Żelasko, W. Two-Process Random Textures: Measurement, Characterization, Modeling and Tribological Impact: A Review. Materials 2021, 15, 268. [Google Scholar] [CrossRef] [PubMed]
  31. Ambilkar, S.C.; Singal, T.; Das, C. Diverse role of zirconia in developing polymeric composites. Polym. Bull. 2024, 81, 6641–6670. [Google Scholar] [CrossRef]
  32. Singhal, V.; Shelly, D.; Saxena, A.; Gupta, R.; Verma, V.K.; Jain, A. Study of the Influence of Nanoparticle Reinforcement on the Mechanical and Tribological Performance of Aluminum Matrix Composites—A Review. Lubricants 2025, 13, 93. [Google Scholar] [CrossRef]
  33. Zhang, R.; Li, J.; Jerrams, S.; Hu, S.; Liu, L.; Wen, S.; Zhang, L. Constructing a fine dispersion and chemical interface based on an electrostatic self-assembly and aqueous phase compound in GO/SiO2/SBR composites to achieve high-wear resistance in eco-friendly green tires. Chem. Eng. J. 2023, 452, 139113. [Google Scholar] [CrossRef]
  34. Xiao, K.; Wang, W.; Wang, K.; Zhang, H.; Dong, S.; Li, J. Improving Triboelectric Nanogenerators Performance Via Interface Tribological Optimization: A Review. Adv. Funct. Mater. 2024, 34, 2404744. [Google Scholar] [CrossRef]
  35. Yoosefan, F.; Ashrafi, A.; Vaghefi, S.M.M. Corrosion and tribological behavior of CoCrFeMoNi high-entropy alloys as a potential vascular implant material. J. Alloys Compd. 2024, 976, 172964. [Google Scholar] [CrossRef]
  36. Ibrahim, M.A.; Çamur, H.; Savaş, M.A.; Abba, S.I. Optimization and prediction of tribological behaviour of filled polytetrafluoroethylene composites using Taguchi Deng and hybrid support vector regression models. Sci. Rep. 2022, 12, 10393. [Google Scholar] [CrossRef] [PubMed]
  37. Agunwamba, J.; Tiza, M.T.; Okafor, F. An appraisal of statistical and probabilistic models in highway pavements. Turk. J. Eng. 2024, 8, 300–329. [Google Scholar] [CrossRef]
  38. Danish, M.; Gupta, M.K.; Irfan, S.A.; Ghazali, S.M.; Rathore, M.F.; Krolczyk, G.M.; Alsaady, A. Machine learning models for prediction and classification of tool wear in sustainable milling of additively manufactured 316 stainless steel. Results Eng. 2024, 22, 102015. [Google Scholar] [CrossRef]
  39. Kasiviswanathan, S.; Gnanasekaran, S.; Thangamuthu, M.; Rakkiyannan, J. Machine-Learning- and Internet-of-Things-Driven Techniques for Monitoring Tool Wear in Machining Process: A Comprehensive Review. J. Sens. Actuator Netw. 2024, 13, 53. [Google Scholar] [CrossRef]
  40. Yang, H.; Zheng, H.; Zhang, T. A review of artificial intelligent methods for machined surface roughness prediction. Tribol. Int. 2024, 199, 109935. [Google Scholar] [CrossRef]
  41. Champa-Bujaico, E.; Díez-Pascual, A.M.; Redondo, A.L.; Garcia-Diaz, P. Optimization of mechanical properties of multiscale hybrid polymer nanocomposites: A combination of experimental and machine learning techniques. Compos. Part B Eng. 2024, 269, 111099. [Google Scholar] [CrossRef]
  42. Anagun, Y.; Isik, S.; Olgun, M.; Sezer, O.; Basciftci, Z.B.; Arpacioglu, N.G.A. The classification of wheat species based on deep convolutional neural networks using scanning electron microscope (SEM) imaging. Eur. Food Res. Technol. 2023, 249, 1023–1034. [Google Scholar] [CrossRef]
  43. Li, X.; Nieber, J.L.; Kumar, V. Machine learning applications in vadose zone hydrology: A review. Vadose Zone J. 2024, 23, e20361. [Google Scholar] [CrossRef]
Figure 1. Main effects plot for means.
Jcs 09 00385 g001
Figure 2. Main effect plots for SN ratio.
Jcs 09 00385 g002
Figure 3. Matrix plots showing the relationships between MWCNT content, Load, and Speed with the measured responses: WR, COF, Ra, and WL.
Jcs 09 00385 g003
Figure 4. Probability plots: (a) Wear rate; (b) COF; (c) Ra; (d) Weight loss.
Jcs 09 00385 g004
Figure 5. Empirical CDF: (a) Wear rate and weight loss; (b) COF and Ra.
Jcs 09 00385 g005
Figure 6. SEM micrographs of worn surfaces: (a) 0.5 wt% MWCNT, 30 N load, and 1.0 m/s sliding speed; (b) neat epoxy (0 wt% MWCNT), 50 N load, and 2.5 m/s speed; (c) 0.25 wt% MWCNT, 40 N load, and 2.5 m/s speed; (d) 0.75 wt% MWCNT, 20 N load, and 2.5 m/s speed.
Jcs 09 00385 g006
Figure 7. AFM 3D surface topographies of worn composite pins: (a) 0.5 wt% MWCNT, 30 N, 1.0 m/s (smoothest surface—optimal); (b) 0 wt% MWCNT, 50 N, 2.5 m/s (severe wear—highest Ra); (c) 0.25 wt% MWCNT, 40 N, 2.5 m/s (moderate roughness); (d) 0.75 wt% MWCNT, 20 N, 2.5 m/s (rough surface due to agglomeration).
Jcs 09 00385 g007
Figure 8. Regression fit plot: experimental vs. predicted wear rate.
Jcs 09 00385 g008
Figure 9. Correlation heatmap showing relationships between image-derived texture features and tribological responses (wear rate and surface roughness) in MWCNT-reinforced epoxy composites.
Jcs 09 00385 g009
Figure 10. (a) Linear relationship between GLCM correlation and wear rate (WR); (b) Feature importance ranking from Random Forest Regressor; (c) PCA scatter plot of image feature distribution colored by WR; (d) Bubble plot showing WR vs. GLCM energy, where bubble size denotes entropy and color represents surface roughness (Ra).
Jcs 09 00385 g010
Figure 11. (a) Ra vs. mean intensity; (b) WR vs. contrast; (c) WR vs. correlation; (d) WR vs. energy; (e) WR vs. entropy; (f) WR vs. homogeneity; (g) WR vs. mean intensity; (h) WR vs. standard deviation of intensity. Each plot illustrates the individual impact of image-derived texture descriptors on wear performance in MWCNT-reinforced epoxy composites.
Jcs 09 00385 g011aJcs 09 00385 g011b
Figure 12. Multi-Modal Comparative Framework for Wear Behavior Analysis Using Taguchi DoE, Regression, and Image-Based Machine Learning.
Jcs 09 00385 g012
Table 1. Taguchi L16 experimental matrix with corresponding wear rate, COF, surface roughness, and weight loss.
Sl. No.MWCNT (%)Load (N)Speed (m/s)Wear Rate (mm3/N·m)COFRa (µm)Weight Loss (%)
102015.30.660.984.9
20301.56.20.681.045.6
304026.80.711.096.2
40502.57.60.741.177
50.25201.54.60.590.94.2
60.253014.20.580.884
70.25402.55.50.610.975.1
80.255025.10.60.954.7
90.52023.50.520.743.5
100.5302.53.80.530.773.7
110.54013.10.50.73.1
120.5501.53.40.510.723.3
130.75202.54.40.550.844.1
140.753024.60.560.874.4
150.75401.54.90.580.894.7
160.755015.30.60.935.1
Table 2. General Linear Model: Wear Rate versus MWCNT, Load, Speed.
SourceDFSeq SSContributionAdj SSAdj MSF-Valuep-Value
MWCNT (%)318.38280.31%18.3826.127334.720
Load (N)31.9028.31%1.9020.6343.590.085
Speed (m/s)31.5476.76%1.5470.51562.920.122
Error61.0594.63%1.0590.1765
Total1522.889100.00%
Table 3. General Linear Model: COF versus MWCNT, Load, Speed.
SourceDFSeq SSContributionAdj SSAdj MSF-Valuep-Value
 MWCNT (%)30.0696591.89%0.069650.02321754.630
 Load (N)30.002453.23%0.002450.0008171.920.227
 Speed (m/s)30.001151.52%0.001150.0003830.90.493
Error60.002553.36%0.002550.000425
Total150.0758100.00%
Table 4. General Linear Model: Ra versus MWCNT, Load, Speed.
SourceDFSeq SSContributionAdj SSAdj MSF-Valuep-Value
 MWCNT (%)30.2314587.97%0.231450.0771552.60
 Load (N)30.013054.96%0.013050.004352.970.119
 Speed (m/s)30.00983.72%0.00980.0032672.230.186
Error60.00883.34%0.00880.001467
Total150.2631100.00%
Table 5. General Linear Model: Weight Loss versus MWCNT, Load, Speed.
SourceDFSeq SSContributionAdj SSAdj MSF-Valuep-Value
 MWCNT (%)312.82576.80%12.8254.27523.970.001
 Load (N)31.6910.12%1.690.56333.160.107
 Speed (m/s)31.1156.68%1.1150.37172.080.204
Error61.076.41%1.070.1783
Total1516.7100.00%
Table 6. Cross-Comparison of Modeling Approaches Applied for Wear Behavior Analysis.
ApproachTechnique UsedMain VariablesOutput MetricsKey OutcomeStrength
Taguchi DoEL16 Orthogonal Array, ANOVALoad, Speed, Filler %WR, COF, RaOptimal filler: 0.5 wt% MWCNT; WR = 3.1 mm3/N·m; Filler % most influential (85.35%)Statistically robust optimization
Mathematical ModelingPolynomial RegressionFiller %, Load, SpeedWR (R2 > 0.95)Accurately models nonlinear wear behavior; validates Taguchi trend; predicts via equationEquation-based continuous prediction
Image-Based ML ModelingGLCM Features + Random ForestCorrelation, Entropy, IntensityWR (R2 ≈ 0.93), RaTop predictors: correlation, entropy; image features explain wear; enables surface-based diagnosisAutomated, texture-driven wear prediction
Disclaimer/Publisher’s Note: The statements, opinions and data contained in all publications are solely those of the individual author(s) and contributor(s) and not of MDPI and/or the editor(s). MDPI and/or the editor(s) disclaim responsibility for any injury to people or property resulting from any ideas, methods, instructions or products referred to in the content.

