1. Introduction
Polypropylene (PP) M110 is a homopolymer-grade thermoplastic characterized by a melt flow index of 11 g/10 min, a density of 0.900 g/cm
3, and a pellet size ranging from 3 to 5 mm, making it suitable for various processing applications [
1,
2]. The material’s linear isotactic chains form tightly packed crystallites, endowing PP with relatively high stiffness and moderate tensile strength [
2,
3]. Consequently, PP finds widespread use in packaging, automotive components, fibers, consumer goods, medical devices, and electrical insulations [
1,
4]. Its high melting point (~160–170 °C) compared to other polyolefins allows it to withstand moderate thermal stress [
5].
Despite its versatility, neat PP exhibits certain performance drawbacks. Its low-impact strength, especially at sub-ambient temperatures, renders it brittle under dynamic loading conditions [
6]. Furthermore, PP is inherently non-conductive, with very low thermal and electrical conductivity, restricting its application in heat dissipation or electromagnetic interference (EMI) shielding systems. Its surface inertness also results in poor adhesion with reinforcements or coatings, collectively reducing its applicability in structural or multifunctional engineering components that require a blend of mechanical integrity and functional properties [
7].
Over the past few decades, researchers have explored various strategies to enhance PP’s functional and mechanical performance. Common approaches include blending with elastomers, adding toughening agents, or incorporating inorganic and organic fillers [
8,
9]. Among these, the addition of carbon-based fillers has emerged as a particularly effective route to simultaneously enhance multiple properties such as stiffness, electrical conductivity, thermal conductivity, and barrier performance [
9,
10,
11]. For example, Sutar et al. have demonstrated that incorporating graphene nanoplatelets (GNPs) in PP can improve its thermal conductivity and crystallinity while maintaining mechanical integrity, depending on nanofiller geometry and dispersion [
12,
13].
Carbon-based fillers such as carbon black, carbon nanotubes (CNTs), graphene nanoplatelets (GNPs), and graphite differ in geometry, aspect ratio, conductivity, and surface chemistry [
3]. Carbon black, one of the earliest fillers used in plastics, can impart basic electrical conductivity and UV stability but requires high loading (nearly 15 wt%) and often compromises tensile strength. CNTs and GNPs, in contrast, can impart significant improvements even at low loadings due to their high aspect ratio and surface area [
10]. For example, graphene (single-layer graphite) has an intrinsic Young’s modulus of nearly 2.4 TPa and a thermal conductivity of around 5000 W/m.K [
3]. These nanofillers also help in forming conductive networks at low percolation thresholds. However, challenges such as high cost, difficult dispersion, and batch-to-batch property variations limit their industrial application [
11,
14].
Graphite, due to its lamellar structure, high in-plane thermal conductivity, and electrical conductivity, offers a unique balance of performance and processability. It is more cost-effective than nanocarbons and available in natural and synthetic forms, making it suitable for industrial-scale use [
15,
16]. Its planar geometry facilitates ease of dispersion during melt processing, and the anisotropic structure enables directional transport of heat and charge. Additionally, graphite improves wear resistance and dimensional stability, enhancing the durability of PP-based composites [
17].
The use of graphite as a reinforcing agent in polymer matrices has been extensively investigated [
12,
13] due to its favorable properties and commercial accessibility. Graphite’s high aspect ratio (in the form of flakes or micro-sheets) facilitates the formation of thermally and electrically conductive networks within the matrix [
16,
18]. Unlike CNTs and graphene, graphite does not require functionalization, which reduces processing complexity and minimizes potential degradation of its properties. Graphite particles can be easily incorporated into PP through melt blending or extrusion processes, making the approach scalable and cost-efficient [
16].
Graphite also influences the crystalline behavior of PP. At optimal concentrations, graphite particles can act as nucleating agents and improve crystallinity. However, excessive filler loading often leads to filler aggregation, increased viscosity, and compromised mechanical integrity [
17]. Therefore, identifying the optimal graphite loading is crucial to balance performance enhancements with processability. Thermal and electrical conductivities typically improve with increasing graphite content, but there is a corresponding trade-off in terms of impact resistance and elongation at break [
18,
19]
Several studies have explored the addition of graphite to polypropylene [
20,
21,
22]. Panwar et al. [
23] prepared PP–graphite composites via melt processing and observed a sharp rise in electrical conductivity at nearly 5 wt% loading, indicating the percolation threshold. Feng et al. [
24] demonstrated that aligning graphite flakes through shear-induced orientation during processing leads to a peak thermal conductivity of 5.4 W/m.K at 21.2 vol% graphite. Similarly, Mirzadeh et al. [
25] observed improvements in both tensile and flexural strength in PP composites containing graphite, though the ductility decreased with higher filler concentrations.
However, most prior work has focused on high filler loadings (20–40 wt%) to achieve significant conductivity, which often compromises ductility and results in processing difficulties [
23,
24,
25,
26]. The lack of optimized processing parameters and poor filler dispersion at high loadings further limit their commercial feasibility. Additionally, many studies target either electrical or thermal property enhancement without a simultaneous evaluation of mechanical behavior or structure–property relationships [
27]. Recent works suggest that processing strategies, such as those based on Taguchi optimization, can significantly affect composite performance and provide more holistic insights into structure–property interactions [
28].
In terms of methodology, few studies have employed statistical tools such as the Taguchi method or design of experiments (DoE) to optimize composite performance based on a multiple parameter [
29,
30] approach. Furthermore, limited attention has been paid to characterizing the interfacial morphology between the matrix and the filler, which plays a critical role in load transfer and energy dissipation under stress.
The present work addresses the research gaps by investigating PP–graphite composites with varying graphite loadings (3, 6, 9, 12 and 15 wt%) prepared via melt blending and injection molding. Emphasis is placed on optimizing processing conditions using a Taguchi L25 orthogonal array, which enables statistical identification of the best filler–parameter combination for maximizing tensile strength while retaining processability. Key properties such as thermal conductivity, electrical resistivity, and tensile strength are evaluated and correlated with filler morphology and dispersion using SEM analysis.
Unlike previous studies [
25,
26] that focus solely on achieving percolation thresholds or thermal conductivity, this work aims to strike a balance between structural and functional properties. The use of readily available micrographite makes the system scalable and economically viable. In addition, the integration of optimization methodology with multi-property characterization offers new insights into the development of cost-effective, multifunctional PP-based materials for automotive, electrical housing, and thermal management applications.
2. Materials and Methods
To ensure scientific reliability and industrial applicability, all materials and testing protocols were selected based on their relevance to real-world processing and application conditions. Experiments were carried out using calibrated equipment and standardized methodologies. The aim was to prepare, optimize, and evaluate PP-μG composites using scalable techniques and ASTM-certified test procedures. The following subsections describe the materials used, processing methods, experimental design, and testing procedures in detail.
2.1. Materials
2.1.1. Polypropylene (PP)
The polypropylene used in this study (source: Haldia Petrochemicals, Haldia, India) is a homopolymer-grade (M110) thermoplastic widely recognized for its favorable processing characteristics and mechanical properties. It was also used in an earlier study of ours related to PP-graphite composites [
1]. It has a melt flow index (MFI) of 11 g/10 min as per ASTM D 1238 standards, indicating good flowability during melt processing. The density of the material is 0.900 g/cm
3, and it is supplied in pellet form with a size range of 3–5 mm. Its consistent quality and ease of use make it suitable for compounding and composite fabrication [
1].
2.1.2. Graphite
The graphite used as a filler in this study (procured from Otto Chemicals, Mumbai, India) exhibits a molecular weight of 12.01 and a particle size greater than 50 µm. It has a bulk density ranging from 20 to 30 g/100 mL, which reflects its loosely packed structure in powder form. Additionally, the material possesses a BET surface area of 28.35 m
2/g, indicating a relatively high specific surface area that can influence interaction with the polymer matrix. These characteristics make graphite a suitable candidate for enhancing the physicochemical and functional properties of polymer composites [
1].
2.2. Composite Fabrication
PP–graphite composites were prepared using a co-rotating twin-screw extruder (model-PTW 16, Thermo Electron Corporation, Dreieich, Germany) at our in-house laboratory. Prior to extrusion, the PP granules and graphite powder were dried at 80 °C for 6 h to eliminate moisture. Blending was performed at five different graphite weight fractions: 3, 6, 9, 12, and 15 wt%.
Table 1 reports the detailed composite compositions.
The μG and PP components were weighed using a calibrated analytical balance (BSA-224S-CW, Sartorius, Göttingen, Germany) with ±0.001 g accuracy, ensuring precise control of the filler content across all compositions. Each batch was formulated to a total of 700 g.
Extrusion (PTW 16, Thermo Electron Corporation, Dreieich, Germany) was carried out at a screw speed of 100 rpm and a temperature profile ranging from 180 °C (feeding zone) to 210 °C (die zone). The extrudate was water-cooled and pelletized. The resulting composite granules were molded into standard test specimens using an injection molding machine (Endura-90 injection molding machine, Pune, India) under the following conditions: mold temperature 40 °C, injection temperature 200 °C, injection pressure 80 bar, and cooling time 20 s.
2.3. Characterization Techniques
2.3.1. Mechanical Testing
Tensile properties were evaluated using a universal testing machine (UTM3382, Instron, Norwood, MA, USA) following ASTM D638 standards. Dog-bone shaped specimens were tested at room temperature with a crosshead speed of 10, 20, 30, 40, and 50 mm/min.
2.3.2. Thermal Analysis
Thermal conductivity was measured using TCi (C-Therm Technologies Ltd., Fredericton, NB, Canada) with the Modified Transient Plane Source (MTPS) technique, which is compliant with ASTM D7984. Samples were cut into discs of approximately 50 mm diameter and 4 mm thickness to ensure consistent contact area with the sensor surface.
2.3.3. Electrical Testing
Electrical resistivity (viz volume and surface resistivity) was measured using a Keithley electrometer (Keithley 6517B Electrometer, Tektronix, Beaverton, OR, USA) based on ASTM D257. Composite samples were cut into rectangular bars and surface-coated with silver paste to ensure uniform contact.
2.3.4. Abrasion Testing
Abrasion resistance of the composites was evaluated using a Taber Abraser (Taber 5135, Taber Industries, New York, NY, USA) following the ASTM D1044 standard. Test specimens were prepared in square form and securely mounted on the rotating platform. The test was carried out for 2000 cycles at a rotational speed of 60 rpm, employing standardized abrasive wheels under a constant load. The weight loss of each sample post-testing was measured to determine the material’s resistance to surface wear. This evaluation provides critical data on the composite’s durability and performance under abrasive conditions, simulating real-world mechanical wear scenarios.
2.3.5. Morphological Characterization
Scanning Electron Microscopy (SEM) analysis was carried out using a field emission scanning electron microscope (model: Sigma 300, ZEISS, Oberkochen, Germany) to examine graphite dispersion and interfacial bonding. Fractured surfaces from tensile tests were gold-coated prior to imaging to enhance conductivity and resolution.
2.4. Design of Experiments
To optimize the composite formulation and processing parameters, the Taguchi method was employed using an L25 orthogonal array. Two key factors were considered: graphite content (3, 6, 9, 12, and 15 wt%) and crosshead speed (10 to 50 mm/min). The objective was to maximize the tensile strength while maintaining acceptable thermal and electrical performance. The signal-to-noise (S/N) ratio was calculated based on the “larger-the-better” criterion, and analysis of variance (ANOVA) was conducted to determine the statistical significance of each factor. Minitab-16 software was used for the entire process.
3. Results
3.1. Tensile Strength Analysis
The tensile test results presented in
Table 2 demonstrate the influence of micrographite (μG) filler content and elongation speed on the tensile strength of the polypropylene (PP) composites. The data reveal that incorporating μG significantly affects the tensile strength at both the yield point and the break point across varying speeds ranging from 10 to 50 mm/min.
For the tensile strength at the yield point (see
Table 2), a general trend of increasing strength is observed, with increasing elongation speed for most composites. Among them, the PP-3G and PP-6G formulations exhibit the highest values at 50 mm/min, with 35.95 MPa and 35.29 MPa, respectively, followed closely by PP-15G (34.74 MPa). Notably, the PP-6G composite not only demonstrates the second-highest tensile yield strength but also maintains relatively consistent values across the speed range. This indicates that up to 6 wt% of μG, the filler facilitates effective stress transfer and enhances load-bearing capacity without compromising mechanical stability across different deformation rates.
In terms of tensile strength at the break point, the values tend to increase with speed as well, with PP-6G and PP-12G composites showing strong performance across the speed range, reaching maximum values of 32.25 MPa and 33.12 MPa, respectively, at 50 mm/min. The tensile strength at break is generally lower than at the yield point but shows a consistent upward trend with speed, indicating improved toughness and elongation capability at higher strain rates.
The mechanical behavior can be attributed to the microstructural dispersion of μG particles in the PP matrix. At a lower μG content (3–6 wt%), the filler is well dispersed, enhancing interfacial bonding and stress transfer efficiency, which is further facilitated at moderate to higher elongation speeds. Beyond 9 wt%, some reduction in tensile yield strength at lower speeds suggests particle agglomeration may begin to impede effective load distribution. However, the composites still maintain competitive strength at higher speeds due to strain rate effects enhancing polymer chain orientation and filler interaction. The results underscore the complex interplay between filler content and deformation rate, with optimal mechanical performance observed at around 6 wt% μG and speeds of 30–50 mm/min. This highlights the importance of considering both composition and testing conditions when designing graphite-filled polypropylene composites for applications requiring balanced strength and toughness.
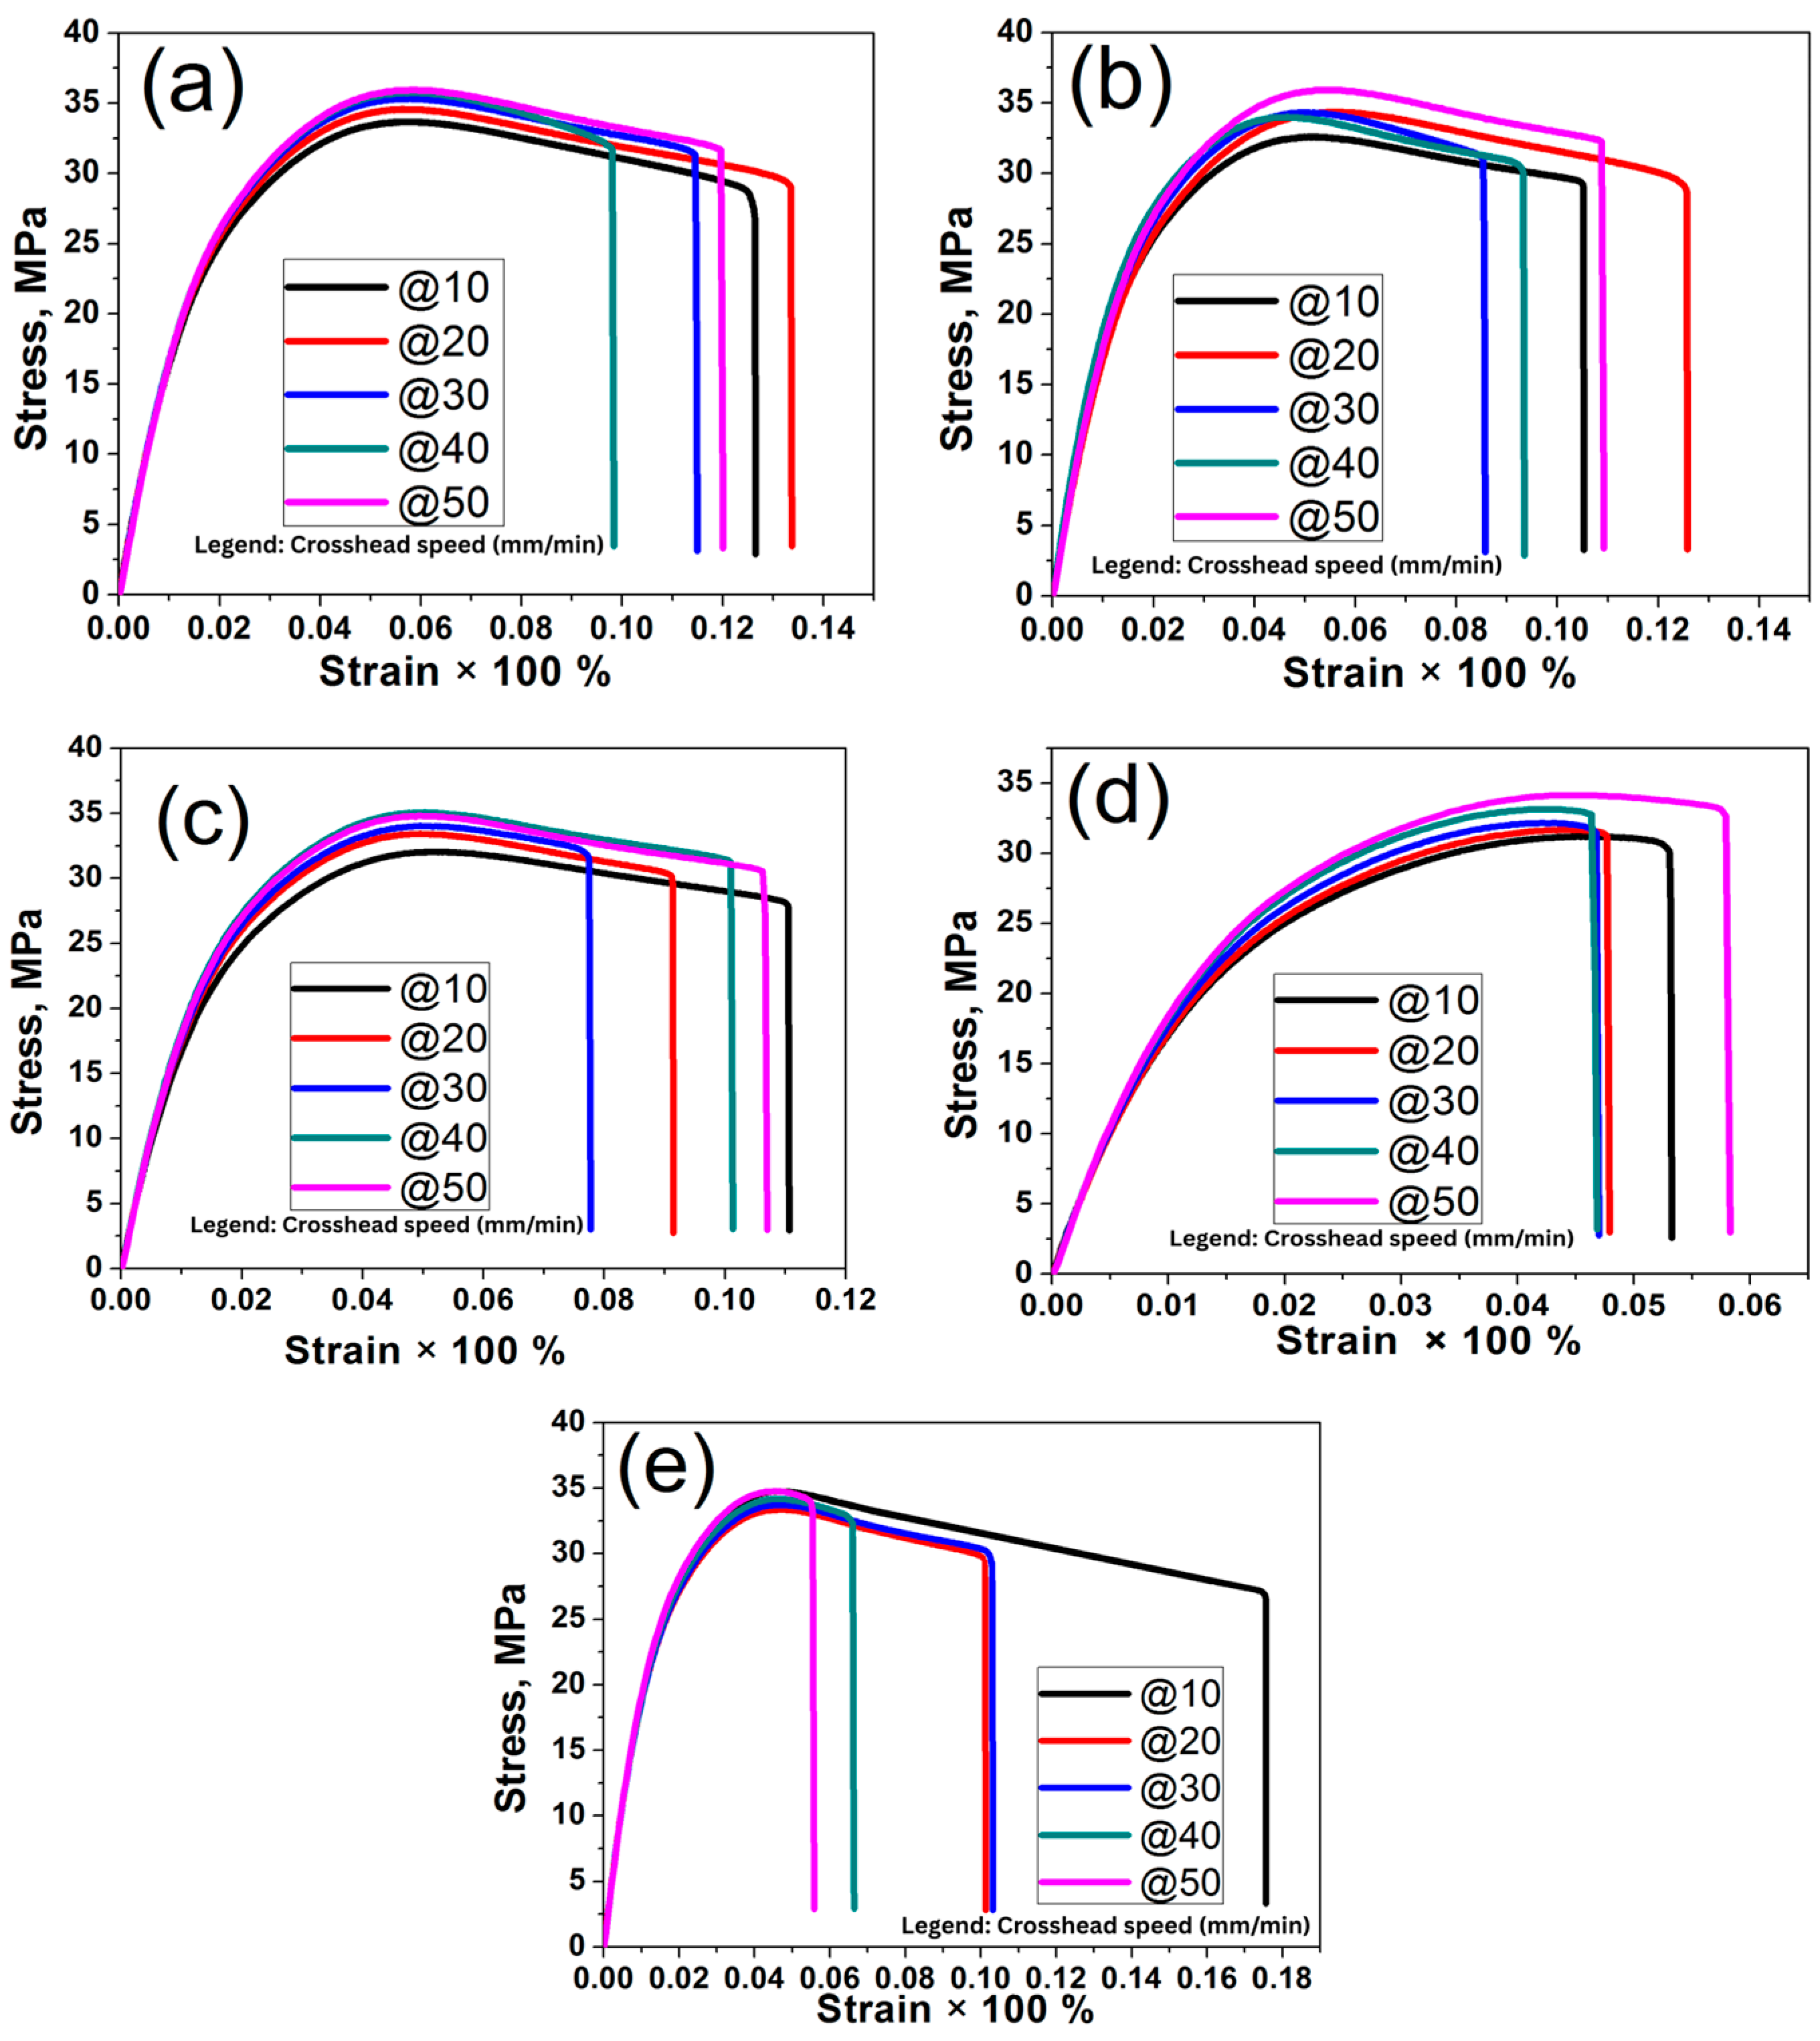
3.2. Stress–Strain Behavior
Further insights into the mechanical behavior of the composites are provided by examining the stress–strain curves obtained during tensile testing, as illustrated in
Figure 1. The curves for PP and PP-μG composites exhibit distinct differences in their elastic and plastic deformation regions, offering valuable information about the effect of μG on stiffness and ductility.
With increasing μG content, the initial slope of the stress–strain curve becomes noticeably steeper, indicating a significant increase in stiffness. This is quantitatively represented by the Young’s modulus, which shows a marked rise with higher filler loadings, peaking at 6 wt% μG. The rigid nature of the μG particles contributes to this enhanced stiffness by restricting molecular mobility and resisting deformation under applied stress.
Conversely, the elongation at break (a key indicator of ductility) exhibits a declining trend as μG content increases. Pure PP demonstrates high elongation, reflective of its inherently ductile and flexible nature. However, as more rigid filler is added, the polymer chains’ ability to undergo plastic deformation is increasingly hindered. The composite materials progressively exhibit brittle behavior, especially beyond the 6 wt% μG thresholds.
Interestingly, the formulation with 6 wt% μG strikes an effective balance between tensile strength and ductility, offering significant stiffness and strength improvements while retaining a reasonable degree of flexibility. This composition appears to be optimal for applications where both mechanical robustness and moderate flexibility are essential.
3.3. Electrical Properties
The addition of graphite filler not only influences the mechanical behavior of the PP-µG composites but also brings about substantial changes in their electrical properties. These changes are measured in terms of volume resistivity, surface resistivity, and dielectric strength.
- (a)
Volume Resistivity
A pronounced and progressive reduction in volume resistivity (see
Figure 2) is observed with increasing graphite content in the polypropylene (PP) matrix. For the unfilled PP (0 wt% graphite), the volume resistivity is remarkably high at 13.6 × 10
15 Ω.cm, consistent with its inherently insulating nature. However, as graphite is incrementally introduced into the polymer matrix, a substantial drop in resistivity is recorded. At 15 wt% graphite, the resistivity sharply declines to 2.49 × 10
15 Ω.cm, representing an 81.69% enhancement in electrical conductivity.
This significant reduction is primarily attributed to the intrinsically conductive nature of graphite, which introduces efficient charge transport pathways throughout the polymer matrix. The graphite particles act as conductive bridges, promoting the formation of interconnected networks or percolation clusters, which facilitate electron hopping and tunneling mechanisms across adjacent conductive sites. This effect becomes more pronounced with higher graphite loadings, as the filler–filler contact probability increases, reducing the interparticle distance and allowing for enhanced delocalization of charge carriers.
Table 3 can be referred to for the results.
Moreover, the improvement in conductivity is not merely a linear function of graphite content but rather suggests that the composite approaches or surpasses the percolation threshold—a critical point where a continuous conductive network is formed, drastically altering the composite’s electrical properties. Such behavior underscores the effectiveness of graphite as a filler for tailoring the electrical performance of polymer composites, making the PP-Gr system a promising candidate for antistatic applications, electromagnetic shielding, and sensor-based materials where moderate conductivity is desired.
Figure 2 shows the trend in volume resistivity with respect to weight percentage of graphite in PP-µG composites.
- (b)
Surface Resistivity
Similar trends are evident in the surface resistivity measurements, aligning well with the observed volume resistivity behavior. The neat polypropylene (0 wt% graphite) exhibits a high surface resistivity of 12.9 × 10
14 Ω, characteristic of its insulating nature and limited capacity for surface-level charge dissipation. However, with the progressive incorporation of graphite, a significant and consistent decrease in surface resistivity is recorded. At 15 wt% graphite loading, the surface resistivity plummets to 1.77 × 10
14 Ω, marking an impressive 86.27% reduction.
Table 4 depicts these trends.
This drastic improvement is indicative of the enhanced charge dissipation pathways created by the conductive graphite particles along the surface of the composite. As the graphite content increases, the particles become more interconnected, forming a quasi-continuous conductive surface layer that enables more efficient electron flow and reduces the resistance to static charge movement. This transformation is particularly important in applications where surface electrostatic charge buildup can be problematic, such as in electronic packaging, flexible electronics, and EMI shielding materials.
Figure 3 highlights the variation of surface resistivity with the increasing percentage of graphite in PP-Gr composites.
Furthermore, this reduction in surface resistivity demonstrates that the composite is approaching a surface percolation threshold, where conductive filler particles span the surface in a network-like manner. This threshold is critical, as it marks the transition from an insulating to a semi-conductive or even conductive surface behavior. The 2D electron pathways formed by graphite facilitate rapid surface conduction, thereby validating the synergistic effect between filler dispersion and interfacial interaction with the polymer matrix. The identification of percolation behavior is based solely on experimental volume resistivity measurements, which show a sharp drop in resistivity beyond 9 wt% μG, indicating network formation. This trend aligns with classical percolation theory and similar experimental findings in the literature.
Collectively, these findings affirm that graphite not only enhances bulk conductivity but also plays a pivotal role in improving surface-level electrical performance, making graphite-infused PP composites suitable for advanced functional applications requiring static charge dissipation and surface current flow control.
- (c)
Dielectric Strength
An inverse trend is evidenced in the dielectric strength measurements with increasing graphite content in the polypropylene (PP) matrix (refer to
Table 5). For pure PP (0 wt% graphite), the dielectric strength is recorded at 18.31 kV/mm, reflecting its intrinsic insulating properties and high resistance to electrical breakdown. However, as the graphite loading increases progressively, a marked decline in dielectric strength is noted. At 15 wt% graphite, the dielectric strength drops sharply to 4.06 kV/mm, representing a 77.83% reduction.
Figure 4 conveys this graphically.
This substantial decrease can be attributed to the formation of electrically conductive pathways within the composite material. Graphite, being inherently conductive, introduces localized regions of charge mobility within the otherwise insulating polymer matrix. As the graphite particles become more interconnected at higher loadings, they facilitate electron tunneling and charge carrier migration, which significantly lowers the breakdown voltage of the composite. This phenomenon is particularly pronounced once the electrical percolation threshold is approached or crossed, where a continuous conductive network is established, disrupting the material’s ability to withstand high electric fields without failure.
Moreover, the inclusion of graphite introduces interface defects and voids at the filler–matrix boundary, which act as preferential sites for electric field concentration. These localized field intensities lead to early dielectric breakdown and further reduce the effective dielectric strength. Additionally, the reduction in resistivity that accompanies graphite addition enhances leakage currents within the composite, compounding the decline in dielectric performance.
This observed trade-off underscores the delicate balance between conductivity and insulation in multifunctional polymer composites. While higher graphite content promotes significant improvements in electrical conductivity due to the formation of percolation networks, it simultaneously deteriorates the dielectric strength of the composite. The inclusion of conductive fillers introduces pathways for charge mobility, reducing the material’s effectiveness as an insulator [
31]. As such, the optimization of filler content must be application-specific. Lower graphite loadings are generally more suitable for insulation-critical components such as high-voltage housings, capacitors, or cable insulations, where preserving dielectric integrity is paramount. In contrast, higher graphite concentrations may be advantageous in applications that require moderate conductivity, such as electromagnetic interference (EMI) shielding or static dissipation layers [
32].
3.4. Thermal and Abrasion Properties
In addition to mechanical and electrical modifications, the thermal and tribological properties of PP are also influenced by the inclusion of graphite filler.
3.4.1. Thermal Conductivity
The incorporation of graphite into the polypropylene (PP) matrix leads to a significant enhancement in the thermal conductivity of the resulting composites. From
Table 6, it is seen that the thermal conductivity of pure PP is 0.082 W/m.K, which is characteristic of typical polymers known for their poor heat transfer capabilities. However, with the gradual addition of graphite, a remarkable increase in thermal performance takes place. At 15 wt% graphite loading, the thermal conductivity improves to 0.148 W/m.K, representing a nearly 80% enhancement compared to the unfilled PP.
Figure 5 illustrates this.
This enhancement is primarily attributed to the high intrinsic thermal conductivity of graphite, which ranges between 80 and 500 W/m.K along its basal planes. When dispersed within the polymer matrix, graphite particles form thermally conductive channels, facilitating phonon transfer—the dominant mechanism of heat conduction in solids—across the composite. With increasing filler content, the probability of particle–particle contact increases, enabling the formation of continuous thermal percolation networks that significantly reduce the thermal resistance within the material.
Additionally, graphite’s layered structure and large aspect ratio allow for better alignment and heat transfer efficiency, especially when processing techniques such as extrusion or compression molding encourage partial orientation. These networks bridge the polymer chains, allowing heat to bypass the inherently low-conductivity polymer domains, resulting in a more thermally responsive and stable composite structure.
The improvement in thermal conductivity also highlights the potential of graphite-reinforced PP composites in heat-sensitive applications, where effective thermal management is critical. This includes automotive parts, electronic enclosures, battery casings, and heat sinks, where enhanced heat dissipation is essential to prevent thermal degradation and ensure functional reliability. However, it is crucial to maintain uniform dispersion and control agglomeration of the graphite powder in the polymer, as excessive clustering of graphite can act as thermal insulators and degrade the mechanical performance.
In conclusion, the observed increase in thermal conductivity confirms the functional versatility of graphite as a filler, offering a balance between mechanical reinforcement and thermal performance optimization, thus expanding the applicability of PP-based composites in thermal management systems.
3.4.2. Abrasion Resistance
The abrasion resistance of the PP-µG composites exhibits a gradual decline with increasing graphite content, revealing a nuanced tradeoff between improved lubricity and mechanical durability. This property is quantitatively assessed by measuring the weight loss after abrasion testing, where unfilled PP records a weight loss of 16.6 mg, indicative of relatively better wear resistance. However, as the graphite content increases, the weight loss also rises, reaching 19.1 mg for the 15 wt% graphite-filled composite, thus confirming a reduction in wear resistance with higher filler loading.
This trend may seem counterintuitive initially, given that graphite is well-known for its solid lubricating properties, which generally help reduce surface friction during sliding or dynamic contact. Indeed, graphite’s lamellar structure enables easy shearing between layers, imparting a low coefficient of friction to the composite surface. However, this very lubricity, while beneficial in lowering friction and heat generation, also appears to compromise the mechanical grip and interfacial adhesion within the polymer matrix during abrasive loading. The physical condition of samples before and after testing are shown in
Figure 6.
At higher concentrations, graphite particles may not always be well-bonded with the surrounding PP chains, especially if dispersion or interfacial compatibility is suboptimal. This can lead to micro-pullouts or filler detachment under abrasive forces, accelerating material loss. Furthermore, the addition of a brittle or semi-brittle filler like graphite can increase local stress concentration at the filler–matrix interface, which, under repeated abrasive cycles, can initiate microcracks and contribute to progressive surface degradation [
33,
34].
Therefore, while the graphite-filled composites may exhibit lower friction coefficients, making them suitable for sliding or dynamic applications (e.g., bushings, sliding pads, gears), their reduced resistance to aggressive surface wear could limit their long-term performance in abrasive environments, such as those involving continuous mechanical scraping, dust-laden surfaces, or rough contact.
This tradeoff highlights the need for careful composite design, potentially involving hybrid fillers (e.g., combining graphite with harder reinforcements like silica or ceramic particles) or surface treatments to balance lubrication with structural wear resistance. Ultimately, application-specific decisions must weigh the benefits of friction reduction against the drawbacks in abrasion endurance when selecting graphite content in PP-based composites. All the data is available in
Table 7 and graphically represented in
Figure 7.
3.5. Taguchi Optimization
The Taguchi method is a widely adopted statistical approach for optimizing process parameters by systematically evaluating the influence of multiple control factors on a desired output response. It involves conducting experiments using specially designed orthogonal arrays, which efficiently reduce the number of trials while maintaining analytical precision. This approach is especially effective in identifying key factors and their optimal levels for performance improvement [
35]. In this study, the Taguchi optimization approach is applied to determine the optimal processing parameters that enhance tensile strength, using MINITAB-16 software for analysis. Tensile strength at the point of failure is selected as the key response variable. The experimental setup and operating conditions are outlined in
Table 8. A full-factorial experimental design is implemented following an L25 (5 levels × 6 factors) orthogonal array. To identify the best settings for maximizing tensile strength, signal-to-noise (
S/
N) ratios are calculated using the “larger-the-better” criterion, where the
S/
N ratio is derived from the logarithmic transformation of the loss function, as detailed below. The “larger-the-better” characteristic is as follows:
In Equation (1), ‘n’ is the repeated number of trial conditions and ‘Y’ is the data pertaining to tensile strength at the break point.
Using Taguchi’s signal-to-noise (S/N) ratio analysis, the study assesses and ranks the influence of various processing parameters on the tensile strength of the composites. The average S/N ratio across all experiments is found to be 29.5808 dB, which serves as a quantitative indicator of the overall system performance in relation to tensile strength. In this analysis, the “larger-the-better” quality characteristic is chosen, as the primary goal is to maximize tensile strength to ensure superior mechanical performance.
Further insights into the contribution of each parameter are provided in
Table 9, which presents the response table for
S/
N ratios. This table allows for a clear comparison of the parameters by evaluating the delta (Δ) value, calculated as the difference between the highest and lowest
S/
N ratios corresponding to each factor level. The delta value effectively quantifies the degree of influence each parameter exerts on the tensile strength. Consequently, the parameters are ranked in descending order based on their delta values to identify which has the most significant impact on the output property.
The analysis reveals that the graphite content (composition) significantly outweighs the effect of crosshead speed (elongation rate) in determining the tensile strength. This finding emphasizes that precise control and optimization of the filler loading within the polymer matrix is far more crucial for enhancing mechanical strength than modifying the elongation speed during testing. The graphite acts as a reinforcing agent that strongly influences the material’s structural integrity, while variations in crosshead speed appear to have a relatively minor effect in comparison.
These quantitative conclusions are further supported by the visual data presented in
Figure 8 and
Figure 9.
Figure 8 displays the main effects plot for the
S/
N ratio, which clearly illustrates the trend of increasing tensile strength with optimized graphite loading. Meanwhile,
Figure 9 shows the mean
S/
N ratio values, reinforcing the statistical evidence that filler content is the dominant factor influencing tensile strength in the composites. Collectively, these findings underscore the critical role of filler concentration in the design and processing of polypropylene–graphite composites aimed at achieving superior mechanical properties.
A multiple linear regression model is developed to evaluate the influence of graphite filler content and crosshead speed on the tensile strength at the break point (TSb) of the composite. The model incorporates both composition (C) and speed (S) as independent variables to predict the mechanical response of the material under different testing conditions.
The analysis indicates that composition has a more pronounced effect on
TSb compared to speed. The increase in filler content contributes significantly to strengthening the composite, while speed plays a secondary role, primarily refining the tensile response. This suggests that optimizing the filler loading is more critical for enhancing mechanical performance than varying the elongation rate. The final regression equation derived from the analysis is as follows
In Equation (2), TSb represents the tensile strength at break in MPa, S is the crosshead speed in mm/min, and C is the graphite content in weight percent. Equation (2) provides a practical tool for predicting the tensile strength at break based on known processing and formulation parameters. The model emphasizes that the mechanical integrity of PP–μG composites is primarily governed by the filler composition, with speed acting as a modulating factor to fine tune the performance.
To optimize the tensile strength of the PP–graphite composites, a Taguchi L25 design is implemented, the details of which are presented in
Table 9. Based on the results in
Table 10, the optimum levels for each factor are identified by comparing the average
S/
N ratios, following the “larger-the-better” criterion. A statistical analysis of variance (ANOVA) is carried out to determine the significance of each parameter on tensile strength, as illustrated in
Table 11.
The Taguchi method is used to optimize the tensile properties of polypropylene–micrographite (PP-μG) composites. An L25 orthogonal array is employed considering two critical control factors: graphite composition (3%, 6%, 9%, 12%, and 15% by weight) and crosshead speed (10, 20, 30, 40, and 50 mm/min). The response variable analyzed is tensile strength at break.
The results in
Table 12 confirm that the selected levels for graphite content and crosshead speed yield a significant improvement in tensile strength, aligning with the Taguchi prediction.
The optimization is conducted using the “larger-is-better” signal-to-noise (
S/
N) ratio approach to maximize tensile strength. The main effects plot for the
S/
N ratios (
Figure 8) indicate that the tensile strength increases significantly with graphite content up to 12 wt%, after which no major gain is observed. Speed has a more pronounced effect than composition, as confirmed by the delta (Δ) values in the response table:
The response table for means similarly supports that higher speeds and a composition of around 12 wt% graphite deliver maximum strength. ANOVA analysis further backs this, showing that speed contributes more strongly (F = 13.18) compared to composition (F = 2.01) toward tensile strength. This indicates that tensile strength improves with increases in both speed and composition, but speed has a greater impact numerically.
3.5.1. Confirmation Experiment
Using the optimal settings (C4S5 → 12% graphite and 50 mm/min speed), the predicted S/N ratio is 30.40 dB, which is superior to the initial process parameter set (C4S5 → 3% graphite and 30 mm/min speed), which yielded 29.68 dB.
3.5.2. Final Optimized Conditions
Optimal graphite composition: 12 wt%, optimal crosshead speed: 50 mm/min, tensile strength at break: maximized under these conditions, verified through S/N ratio improvement.
3.6. Breaking Mechanism Analysis
To gain a comprehensive understanding of the failure mechanisms and internal structural behavior of PP-μG composites under mechanical loading, scanning electron microscopy (SEM) analysis is performed on the fractured tensile specimens. This microscopic examination allows for detailed observation of the fracture surfaces, enabling correlation between macro-scale tensile behavior and microstructural characteristics such as filler dispersion, interfacial adhesion, void presence, and crack initiation and propagation paths. Such insights are crucial in distinguishing between ductile and brittle fracture modes and in explaining variations in mechanical response across different processing conditions.
Importantly, SEM analysis is specifically conducted for samples with 12% graphite content across all crosshead speeds and for specimens tested at 50 mm/min crosshead speed across all compositions. This selective approach is guided by the results of the Taguchi optimization, which identify 12% graphite loading and a 50 mm/min crosshead speed as the most favorable conditions for achieving maximum tensile strength. Focusing SEM analysis on these optimal levels provides the most relevant microstructural data for validating mechanical test outcomes and informs the development of improved composite formulations with enhanced performance.
3.6.1. Breaking Mechanism Analysis at 12% Graphite PP Composite
- (a)
Elongation Rate: 10 mm/min (Brittle Fracture Mechanism)
At this low strain rate, the composite experiences a brittle fracture. The SEM image shows relatively flat fracture surfaces with large, featureless regions and some signs of cleavage planes, indicating minimal plastic deformation. The
Figure 10a morphology suggests that the polymer matrix does not have enough time for molecular chain alignment or energy absorption prior to failure. The stress concentration around graphite particles likely leads to premature crack initiation. Additionally, due to limited mobility of the polymer chains at this low rate, the filler–matrix interfacial bonding cannot dissipate energy through debonding or plastic flow. Instead, cracks propagate rapidly through the weakest zones, typically around poorly dispersed graphite clusters or at the matrix–filler interface. Thus, the breaking mechanism is dominated by stress concentration, microcrack initiation, and rapid crack propagation, with little to no chain elongation.
- (b)
Elongation Rate: 20 mm/min (Transition Zone: Brittle to Ductile)
At 20 mm/min, the composite begins to show signs of transitioning from brittle to ductile behavior. The fracture surface becomes slightly more irregular, with localized roughness and the appearance of some tearing and micro-voids. While brittle failure is still prominent, limited plastic deformation starts to occur before the final fracture. It is seen in
Figure 10b that the polymer chains are allowed slightly more time to respond to the applied stress, enabling partial orientation and stretching. Moreover, some of the graphite particles begin to debond or get pulled out, creating tiny voids and disrupting the crack path. This mixed-mode failure involves both crack initiation and limited crack blunting, caused by polymer chain disentanglement and energy dissipation through micro-voiding. The mechanism thus involves interfacial debonding, micro-void formation, and moderate chain slippage, marking a shift toward ductility.
- (c)
Elongation Rate: 30 mm/min (Semi-Ductile Fracture)
At 30 mm/min, a clear semi-ductile fracture pattern emerges. The SEM image in
Figure 10c displays an increasingly rough fracture surface with a fibrous texture, indicating more significant plastic deformation. Micro-void coalescence, shear band formation, and filler debonding are prominent. The higher elongation rate gives the polymer chains more time to undergo molecular orientation and stretching, resulting in a more energy-absorbing fracture process. Graphite particles now serve dual roles: as reinforcement to carry some load and as stress relievers when they debond and absorb energy. The overall mechanism involves matrix yielding, plastic deformation, and shear yielding at the filler–matrix interface, where cracks are deflected or blunted by graphite particles, improving toughness. This stage reflects a good balance between stiffness and ductility in the composite.
- (d)
Elongation Rate: 40 mm/min (Ductile Fracture Dominates)
At 40 mm/min, the fracture surface becomes highly irregular and rough, with abundant fibrils, torn edges, and micro-voids, all characteristic of a fully ductile failure mechanism. The increased elongation rate allows extensive molecular chain alignment and disentanglement before failure. As seen in
Figure 10d, there is a visible increase in the number and size of voids formed by filler–matrix debonding. These voids then grow and coalesce into larger cavities under tensile stress, requiring more energy to propagate cracks. The graphite particles are effectively pulled out from the polymer matrix, indicating strong filler–matrix bonding and interaction prior to debonding. The crack path becomes highly tortuous, and energy is dissipated through plastic yielding, void formation, and matrix tearing. This complex interaction leads to a toughened fracture process, where energy is absorbed at multiple levels (chain motion, filler pull-out, and interfacial separation).
- (e)
Elongation Rate: 50 mm/min (Highly Ductile with Maximum Energy Absorption)
At the highest strain rate (50 mm/min), the fracture surface exhibits extensive fibrillation, large-scale tearing, and deep void formation, indicating maximum plastic deformation before fracture. The high elongation rate provides ample time for the PP molecular chains to fully orient and extend, contributing to the high toughness. As reflected in
Figure 10e, graphite particles are visibly pulled out or separated from the matrix, creating large voids that absorb significant fracture energy. The breaking mechanism is controlled by chain slippage, matrix shear yielding, and interfacial debonding, which work in tandem to slow crack propagation and enhance the composite’s ductile response. The fracture surface is rugged and full of ridges, indicating that crack paths are repeatedly deflected or blunted by the graphite fillers. This behavior results in superior mechanical performance and confirms effective stress transfer between filler and matrix. The composite, at this stage, demonstrates excellent strain-rate sensitivity and toughness enhancement due to optimal filler matrix interaction and molecular mobility.
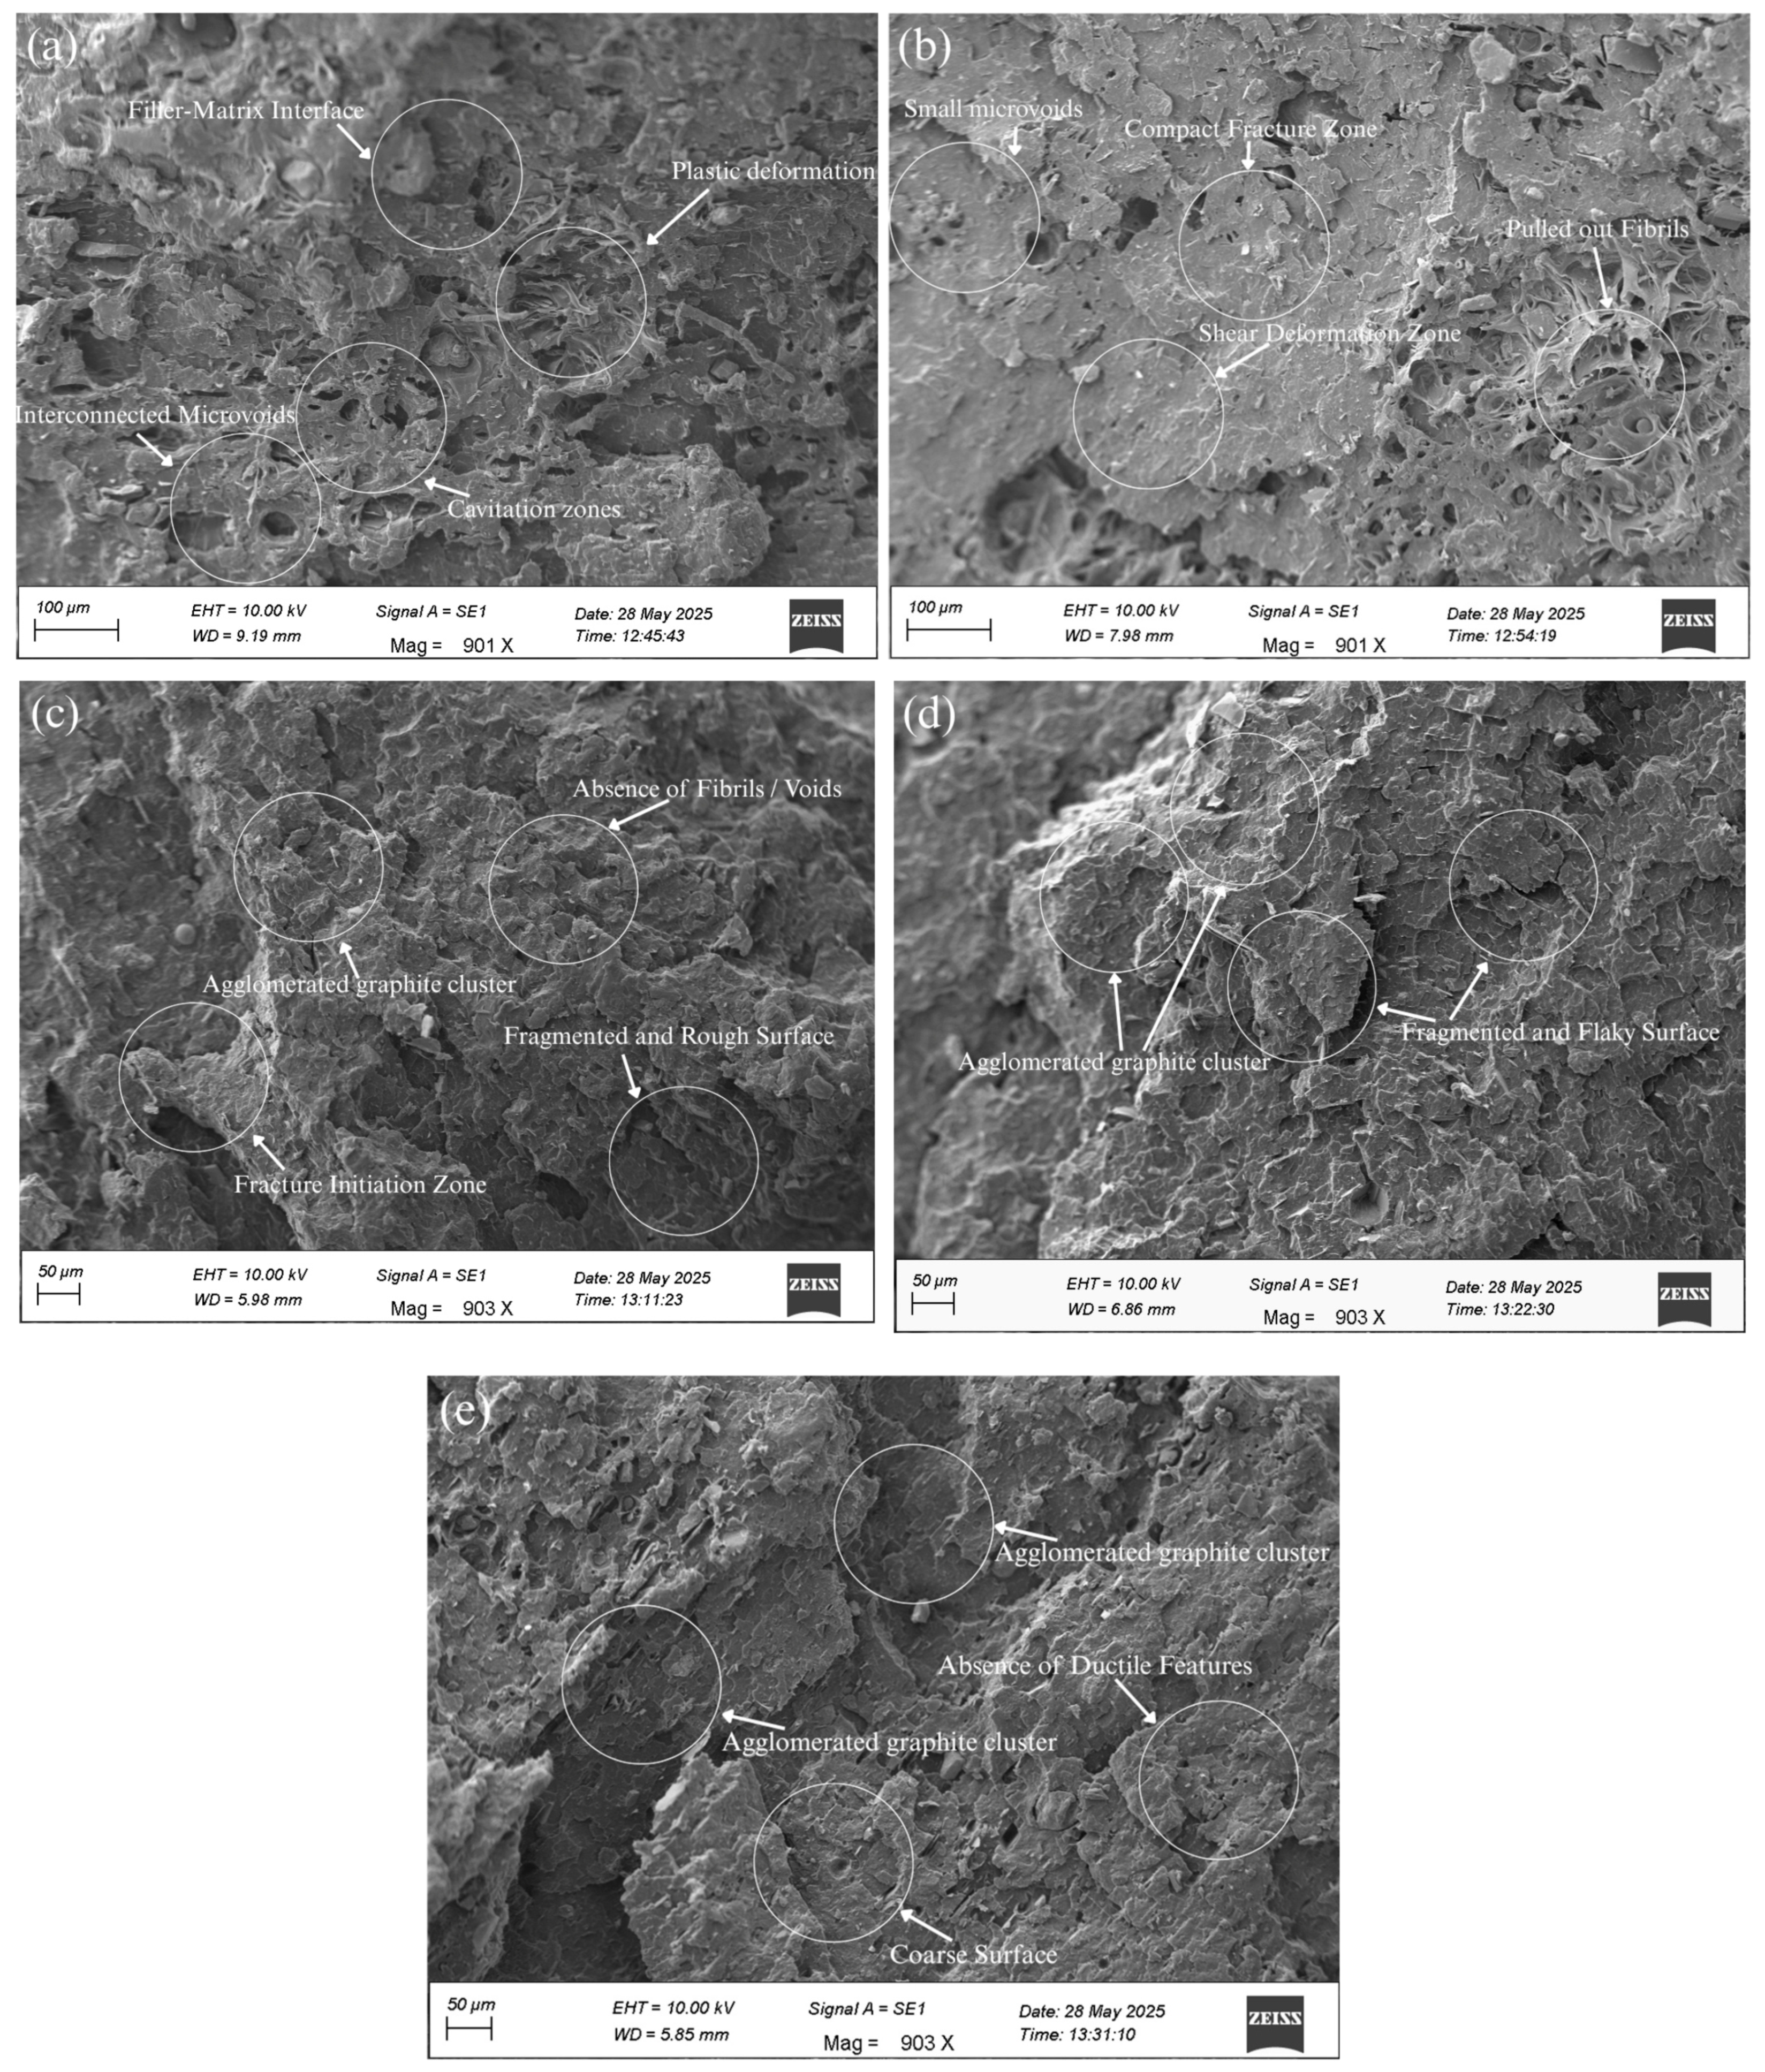
3.6.2. Breaking Mechanism Analysis at 50 mm/min (Crosshead Speed)
The scanning electron micrographs in
Figure 11a–e illustrate the fracture surface morphology of PP–graphite composites subjected to tensile loading at a fixed elongation rate of 50 mm/min, with increasing graphite content (3% to 15%).
- (a)
3 wt% Graphite—Ductile Fracture Dominance
The fracture surface of the composite containing 3 wt% graphite displays a highly porous and extensively fibrillated morphology, indicative of significant plastic deformation prior to failure. As visible in
Figure 11a, numerous elongated fibrils and interconnected micro-voids are evident, reflecting a classical ductile fracture mechanism. This microstructure suggests that the polymer chains are able to stretch and reorient under tensile stress, absorbing considerable energy before rupture. The uniform dispersion of graphite particles at this low loading level contributes positively to stress distribution without hindering polymer chain mobility. The good interfacial adhesion between the matrix and filler allows for effective load transfer while still permitting matrix yielding. The presence of cavitation zones and extensive fibrillation underscores the flexibility retained in the matrix, making this formulation ideal for applications requiring toughness and ductility.
- (b)
6 wt% Graphite—Semi-Ductile Fracture (Transition Region)
At 6 wt% graphite, the fracture surface becomes more compact, with a noticeable reduction in porosity compared to the 3 wt% sample. However,
Figure 11b shows that pulled-out fibrils and small micro-voids are still present, indicating that the composite undergoes a semi-ductile fracture. The fibrillar network is partially disrupted, revealing that the graphite fillers have begun to constrain the mobility of the polymer chains. This is the transition point where the composite starts to lose some of its plastic deformation capacity yet retains enough flexibility to delay crack propagation. The partial debonding of graphite particles and micro-void coalescence suggest moderate energy absorption through interfacial interactions and shear deformation. This composition represents a delicate balance between stiffness and toughness, making it a suitable candidate for applications where moderate mechanical strength and some flexibility are desired.
- (c)
9 wt% Graphite—Brittle Fracture Onset
The fracture surface at 9 wt% graphite demonstrates a significant departure from ductile features, with a notable decrease in voids and fibrillation. As seen in
Figure 11c, the morphology becomes rough and fragmented, and lacks the telltale signs of plastic deformation. This shift strongly indicates the onset of brittle fracture behavior. The graphite particles at this loading level tend to agglomerate, leading to poor dispersion and the formation of stress concentrators. These agglomerates disrupt the matrix continuity, reduce interfacial adhesion, and compromise the composite’s ability to absorb stress through matrix deformation. As a result, cracks initiate and propagate more easily along the matrix–filler interface, leading to premature and abrupt failure. The ineffective load transfer and lack of crack blunting mechanisms explain the inferior toughness observed in mechanical testing.
- (d)
12 wt% Graphite—Advanced Brittle Fracture
Referring to
Figure 11d, the fracture morphology of the composite with 12 wt% graphite is dominated by sharp, irregular features and fractured flakes, further reinforcing the brittle failure mode. The surface is highly fragmented, with minimal evidence of matrix yielding or ductile stretching. The rigid graphite network severely restricts polymer chain mobility, and filler matrix debonding becomes more frequent. The stress imposed on the material is rapidly concentrated around the filler clusters, leading to abrupt crack initiation and propagation without significant energy dissipation. Additionally, the SEM micrographs reveal that the graphite particles may be forming interlocking structures, which hinder deformation and promote a catastrophic failure mechanism. This confirms that the interfacial compatibility at higher filler content is insufficient to accommodate deformation, resulting in a brittle, non-energy-absorbing fracture process.
- (e)
15 wt% Graphite—Catastrophic Brittle Fracture
At the highest graphite loading of 15 wt%, the composite displays a dense, heavily fragmented fracture surface with a coarse and rigid appearance, typical of catastrophic brittle failure. There is an absence of ductile features such as voids or fibrils, and the fracture seems to propagate straight through the matrix with little resistance. The SEM images reveal that the filler content is high enough to form a continuous, rigid percolated network that severely disrupts the polymer matrix’s continuity. The graphite agglomerates dominate the microstructure and create weak points where crack initiation is highly probable. Moreover, the poor filler dispersion and inadequate matrix–filler bonding lead to interfacial debonding and straight-line fracture paths, allowing cracks to propagate rapidly. This loading condition sacrifices all ductility for rigidity, making the composite prone to sudden failure under tensile loads.
Figure 11e illustrates this.
These images provide direct morphological evidence of filler agglomeration at higher μG contents: At 3 wt% and 6 wt%, μG is relatively well-dispersed within the PP matrix. However, starting at 9 wt% and more prominently at 12 wt% and 15 wt%, the micrographs reveal the presence of larger μG clusters (~10–20 µm), which is indicative of particle–particle interaction and poor interfacial adhesion.
Although crystallinity is not directly measured, the morphology suggests that micrographite may promote nucleation at lower loadings and disrupt crystalline order at higher contents due to agglomeration.
3.7. Mechanisms and Comparative Analysis
The enhanced performance of PP–μG composites can be primarily attributed to improved filler–matrix interactions and microstructural effects induced by graphite incorporation. At lower μG loadings (3–6 wt%), uniform dispersion of graphite flakes promotes effective stress transfer, void bridging, and conductivity pathway formation. This results in improved tensile strength, reduced resistivity, and increased thermal conductivity. The graphite platelets facilitate phonon and electron transport while reinforcing the polymer network.
However, at higher concentrations (≥9 wt%), the tendency of μG particles to agglomerate leads to stress concentration sites, polymer chain mobility restriction, and interfacial weakening [
1]. These effects reduce mechanical integrity, increase melt viscosity, and contribute to matrix–filler debonding, as evidenced by SEM fractography. The reduced abrasion resistance is also explained by the inherent lubricity of graphite, which becomes more pronounced at elevated filler levels.
When compared with prior literature, the present study demonstrates comparable or superior performance using relatively coarse graphite and a simpler melt-processing route. For instance, the percolation threshold (~6 wt%) aligns with Panwar et al. [
23], yet our system achieves this without nanoscale fillers or alignment treatments. Similarly, the drop in tensile strength at high loadings mirrors trends observed by Mirzadeh et al. [
25], reinforcing the role of agglomeration. Compared to high-alignment or nanofiller systems reported by Feng et al. [
24] and Sutar et al. [
12], the current PP–μG composites offer a practical trade-off between performance and scalability.
Optimization using the Taguchi method further underscores the synergistic effects of filler content and deformation speed. A loading of 12 wt% μG and an elongation speed of 50 mm/min are found to be optimal for maximizing tensile strength, highlighting the interplay between filler structure and testing conditions.


 ,
, 


