Article

The Progressive Damage Modeling of Composite–Steel Lapped Joints

1
Civil Engineering, Southern Illinois University Edwardsville, Edwardsville, IL 62026, USA
2
Civil and Environmental Engineering, University of Missouri, Columbia, MO 65211, USA
*
Author to whom correspondence should be addressed.
J. Compos. Sci. 2025, 9(7), 350; https://doi.org/10.3390/jcs9070350
Submission received: 1 June 2025 / Revised: 29 June 2025 / Accepted: 30 June 2025 / Published: 7 July 2025
(This article belongs to the Special Issue Characterization and Modelling of Composites, Volume III)

Abstract

In advanced structural applications—aerospace and automotive—fiber-laminated composite (FRP) materials are increasingly used for their superior strength-to-weight ratios, making the reliability of their mechanical joints a critical concern. Mechanically fastened joints play a major role in ensuring the structural stability of FRP Composite structures; however, accurately predicting their failure behavior remains a major challenge due to the anisotropic and heterogeneous nature of composite materials. This paper presents a progressive damage modeling approach to investigate the failure modes and joint strength of mechanically fastened carbon fiber-laminated (CFRP) composite joints. A 3D constitutive model based on continuum damage mechanics was developed and implemented within a three-dimensional finite element framework. The joint model comprises a composite plate, a steel plate, a steel washer, and steel bolts, capturing realistic assembly behavior. Both single- and double-lap joint configurations, featuring single and double bolts, were analyzed under tensile loading. The influence of clamping force on joint strength was also investigated. Model predictions were validated against existing experimental results, showing a good correlation. It was observed that double-lap joints exhibit nearly twice the strength of single-lap joints and can retain up to 85% of the strength of a plate with a hole. Furthermore, double-lap configurations support higher clamping forces, enhancing frictional resistance at the interface and load transfer efficiency. However, the clamping force must be optimized, as excessive values can induce premature damage in the composite before external loading. The stiffness of double-bolt double-lap (3DD) joints was found to be approximately three times that of single-bolt single-lap (3DS) joints, primarily due to reduced rotational flexibility. These findings provide useful insights into the design and optimization of composite bolted joints under tensile loading.

1. Introduction

In composite structures, bolt joints are commonly preferred due to their advantages, such as ease of assembly, disassembly, and maintenance. Despite these benefits, they are often considered the weakest link in the structural system, primarily because the drilling of bolt holes introduces significant stress concentrations, which can initiate damage and lead to failure [1]. The design and analysis of bolted joints in fiber-reinforced polymer (FRP) composites are particularly challenging due to the anisotropic, inhomogeneous, and viscoelastic nature of the materials involved. As a result, these joints require special attention to detail and a deep understanding of the underlying material behavior.
The key parameters influencing the performance of composite bolted joints include joint geometry, bolt preload, fiber orientation, and stacking sequence, all of which must be carefully optimized to achieve reliable and high-performance connections [2]. Extensive research has been conducted to identify and classify the various failure modes and their associated causes in composite bolted joints [3]. Figure 1 illustrates some of the most common failure mechanisms [4].
Tensile failure is typically associated with a reduced joint width and arises from stress concentrations within the fiber and matrix materials. In contrast, shear-out failure arises primarily from inadequate edge distance and is marked by localized shear and compressive damage in both the fibers and matrix. This failure mode is especially critical due to its sudden onset and limited warning signs. However, it can be effectively mitigated through appropriate design choices, such as optimizing lay-up orientations and increasing the edge distance, thereby reducing stress concentrations and enhancing joint durability.
In composite bolted joints, cleavage failure tends to occur when both the edge distance and joint width are insufficient, causing stress to concentrate near the fastener and promoting crack growth in the load direction. On the other hand, pull-through failure is typically associated with a low ratio of laminate thickness to bolt diameter, leading to the fastener tearing through the composite material. This mode, along with direct fastener failure, is rarely observed in well-designed structural applications and is usually considered secondary. Bearing failure occurred due to intense localized compressive stresses at the bolt-hole interface, particularly when the width-to-hole diameter ratio is inadequate. Among the various failure modes, net tension and shear-out are the most catastrophic, whereas bearing failure progresses gradually and often allows the joint to retain a portion of its load-carrying capability, rather than leading to immediate structural collapse [5].
Experimental investigations on single- and double-lap composite joints have evaluated their mechanical performance, particularly in terms of stiffness and strength [6,7,8,9,10,11,12,13]. The results showed that the edge distance does not affect the bearing stiffness of the joint. Additionally, specimens with smaller dimensions and increased axial fiber content demonstrated enhanced bearing stiffness [6,7,8,9,10]. With increasing joint size, joint strength tended to decrease, often accompanied by larger displacements before failure, highlighting the joint’s potential for enhanced energy absorption [7,8,9,10,11].
It was observed that higher bolt torque significantly increased the required edge distance-to-diameter (e/D) and width-to-diameter (W/D) ratios for optimal joint performance. However, the initial stiffness of single-bolt joints was largely influenced by the W/D ratio, while the effects of clamping torque and e/D ratio were found to be minimal [6,7,8]. Irreversible bearing damage, marked by a noticeable change in joint stiffness, was identified as the damage load. The peak load, occurring before the final failure, was attributed to delamination beneath the washer. Finite element models were able to predict the first peak load but were less accurate in capturing the ultimate failure load [9,10,11,12]. Optimal joint performance was achieved when both e/D and W/D ratios were equal to or greater than 4. However, increasing these ratios resulted in a reduction in fatigue strength, reaching as low as 63% of the corresponding static strength [10,11,12,13,14].
Several works studied the effect of bolt-hole clearance [12,13,14,15,16]. Increasing the bolt-hole clearance consistently reduced the stiffness of the joints, while promoting higher ultimate strain levels across all configurations [12,13,14,15]. In joints with finger-tightened bolts, a relationship between bolt-hole clearance and joint strength was identified. Load–load displacement curves typically exhibited two main regions: linear and nearly linear. Although bolt-hole clearance had little influence on the joint’s maximum load capacity, reducing the clearance resulted in a lower maximum displacement. All joints exhibited initial bearing failure, with stiffness progressively decreasing as bolt-hole clearance increased [13,14,15,17]. In a recent study, numerical analysis of riveted and hybrid joints showed that clearance between the rivet and hole can reduce joint strength by up to 21%, depending on its position [16]. The study emphasizes the importance of fit tolerance and suggests hole calibration or specialized rivets to prevent strength loss.
Additional studies explored the influence of clamping force on joint stiffness and strength [14,15,17,18,19]. The results showed that bolt tightening led to a 22% increase in initial bearing stress and a 105% increase in maximum bearing stress [14,15,17,18]. Significantly higher strains were observed in dowel pin joints relative to finger-tightened bolted joints. While increased clamping pressure enhanced post-peak stiffness, it also reduced both bolt-hole elongation and initial stiffness. While ultimate bearing strength increased to a saturation point with higher clamping pressures, delamination-related bearing strength continued to increase [15,17,18,19]. An elevated clamping pressure suppressed delamination and interlaminar cracking, transitioning failure from catastrophic fracture to a more progressive mode.
The role of lateral supports in composite bolted joint failure was also experimentally examined [17,18,19,20]. The results show that clamping force increased with applied tensile load, influenced by Poisson’s effect before bearing failure. After bearing failure, lateral constraints played a crucial role in maintaining or increasing clamping force, thereby delaying material degradation [17,18,19,20].
Further studies investigated the effect of bolt pretension on net-tension failure in bolt-filled composite laminates [17,18,19,20,21]. For hole-filled samples, higher clamping pressure reduced tensile strength, while in bolted joints, tensile strength improved with increased clamping pressure.
To model the progressive failure of composite materials, various approaches have been adopted [20,21,22,23,24,25,26,27,28,29,30,31,32,33,34]. The simplest method is the ply discount technique, which involves an instantaneous reduction in stiffness upon meeting a failure criterion [20,21,22,23,24,25,26,35]. While easy to implement, this approach’s assumption of sudden, complete failure does not align well with experimental results [23]. More advanced models incorporate internal damage state variables that degrade stiffness progressively based on the extent of damage [24,25,26,27]. These methodologies have evolved into physically based models under the damage mechanics framework, offering a more accurate representation of progressive damage in composites [28,29,30,31,32,33,34].
Despite extensive efforts in modeling and the experimental evaluation of composite bolted joints, key challenges remain unaddressed, particularly in terms of capturing progressive failure behavior, accurately simulating interfacial damage, and evaluating the effects of clamping force and joint configuration under realistic boundary conditions. Moreover, limited work has been conducted on the comparison between single- and double-lap joints considering friction, preload, and geometric parameters using validated progressive damage models. This paper aims to address these gaps by presenting a comprehensive numerical investigation of mechanically fastened composite joints, focusing on the effects of clamping force, friction, bolt-hole clearance, and joint geometry. A three-dimensional finite element model incorporating a continuum damage mechanics (CDM) approach was developed to simulate various joint configurations, including single- and double-lap configurations with different material combinations. The model is validated through existing experimental data from the literature to ensure accurate prediction of joint strength, stiffness, strain distribution, and failure mechanisms. A parametric study is also conducted to quantify the influence of joint parameters on load transfer, damage evolution, and overall mechanical performance.

2. Numerical Modeling

This section presents the finite element modeling approach used to simulate composite bolted joints, incorporating a progressive damage model, three-dimensional (3D) layered elements, realistic contact definitions, and clamping force application. The models capture the mechanical response of single- and double-lap joints under tensile loading.

2.1. Progressive Damage Model

To describe the material degradation process, a simplified damage mechanics model was adopted, incorporating three distinct variables (di) that individually control energy dissipation in tensile and compressive states. The damage law was modified using a damage activation function (DAF) based on the maximum strain criterion. The progression of damage during the material response was represented using quadratic functions.
Six damage variables, denoted as di for i = {1,2,3,4,5,6}, were introduced to capture the degradation of material properties. d1, d2, and d3 were used to represent normal stiffness degradation while d4, d5, and d6 were used to represent shear stiffness degradation in 12, 23, and 13 shear directions. Only three of these variables are independent, as the damage associated with the shear stiffness components is derived from the normal damage components, as described in Equation (1).
d 4 = 1 1 d 1 1 d 2 d 5 = 1 1 d 2 1 d 3 d 6 = 1 1 d 1 1 d 3
The damage tensor d relates the nominal stress σ to the effective stress. σ ^ , i.e., σ = ( I I : d ) : σ ^ Where I is the identity tensor. The stress–strain relation is derived from a modified Matzenmiller [23,32] complementary free energy density of a damaged orthotropic lamina ψ , Equation (2);
ψ = σ 1 2 2 ( 1 d 1 ) E 1 + σ 2 2 2 ( 1 d 2 ) E 2 + σ 3 2 2 ( 1 d 3 ) E 3 + υ 12 E 1 σ 1 σ 2 + υ 13 E 1 σ 1 σ 3 + υ 23 E 2 σ 2 σ 3 + σ 12 2 ( 1 d 4 ) G 12 + σ 23 2 ( 1 d 5 ) G 23 + σ 13 2 ( 1 d 6 ) G 13
where Ei, υi, and Gi are Young’s modulus, Poisson’s ratio, and shear modulus for the elastic undamaged material, respectively. The corresponding three-dimensional (3D) can come from the partial derivative of Equation (3) that gives compliance tensor H, Equation (3);
ε = ψ σ = 1 ( 1 d 1 ) E 1 υ 21 E 2 υ 31 E 3 υ 12 E 1 1 ( 1 d 2 ) E 2 υ 32 E 3 υ 13 E 1 υ 23 E 2 1 ( 1 d 3 ) E 3 0 0 1 ( 1 d 4 ) G 12 0 0 0 1 ( 1 d 5 ) G 23 0 0 0 1 ( 1 d 6 ) G 13 · σ
It can be seen that the degradation parameters d1 to d6 were applied directly to the material constitutive tensor, not to the material parameters. In the strain–stress relationship, the damage parameters were applied to the diagonal elements. The tensor of stiffness, which links the effective stress σ to the strain ε, is obtained by inverting the three-dimensional compliance tensor, σ = H 1 : ε .
The function that controls the elastic domain is the Damage Activation Function [36], as seen below.
g m = g ^ m γ ^ m 0
In this formulation, g ^ m denotes the positive (tensile) loading function, which is a function of the current stress state, while γ ^ m represents the updated damage threshold function for failure mode mmm. The specific criteria are summarized in Table 1. Shear stiffness degradation is defined as a function of the normal-stress damage variables d1, d2, and d3. Consequently, the onset of damage in any normally stressed component will concomitantly trigger degradation in the associated shear stress components.
Where St1, St2, and St3 are the axial tensile strength in the fiber direction, the lateral direction, and the thickness direction, respectively, and Sc1, Sc2, and Sc3 are the axial compressive strength in the fiber direction, the lateral direction, and the thickness direction, respectively.
The damage threshold evolution values of γ ^ m is expressed by the three conditions of Kuhn–Tucker, i.e., γ ^ m ˙ 0 ,   g m 0 ,   a n d   g m .   γ ^ m = 0 [25,26], where γ ^ m ˙ = γ ^ m T , in which the time is T. Neglecting viscous effects, the damage activation functions of Equation (4) always have to be nonpositive. While g m is negative, the material response is elastic. When the strain state activates the criterion g m = 0 , it is necessary to evaluate the gradient g ^ m ˙ [25,26]. If the gradient is not positive, the state is one of unloading or neutral loading. If the gradient g ^ m ˙ is positive, there is damage evolution, and the consistency condition has to be satisfied, i.e.,
g m ˙ = g ^ m ˙ γ ^ m ˙ = 0
Under tensile loading, crack formation does not influence the material’s behavior under compression; as a result, the compression elastic domains remain independent of γ ^ m for m = {t1, t2, t3}. Accordingly, the compression damage thresholds can be expressed by the following relations:
γ ^ m = max 1 , max g ^ m τ w h e r e   τ = 0 : T , a n d   m = { c 1 , c 2 , c 3 }  
In contrast, when the material is under compressive loading, crack formation directly influences the tensile response. Hence, the tensile elastic domains become dependent on γ ^ m . The tension damage thresholds can therefore be written as follows:
γ ^ m = max 1 , max g ^ m τ ,   g ^ n τ w h e r e   τ = 0 : T , m = t 1 , t 2 , t 3   a n d   n = { c 1 , c 2 , c 3 }
Based on Bazant’s crack band theory, the damage energy dissipated per unit volume, Gm, under either shear or uniaxial loading is related to the critical strain energy release rate, GCG, and the finite element characteristic length, LC, by the following expression [27,28]:
G m = G C m L C
where the failure mode number is m.
This requirement guided the formulation of the damage evolution laws. In this study, we employed an analytical approach to derive an appropriate degradation model. We begin by assuming a two-parameter constitutive law for the stress–strain response, denoted as σ i ( ε i ) . The two parameters in this model are determined by solving the following pair of conditions: 1. the first equation governing the elastic limit or initial stiffness; 2. the second equation enforcing energy dissipation or post-peak softening behavior.
The explicit forms of these two equations depend on matching (a) the undamaged elastic response at small strains and (b) the total fracture energy (via Bazant’s crack band concept) over the characteristic element length.
σ m ϵ m = S m ;
G m = 0   σ m ε i ε i = G C m L c
Here, i denotes the directional index associated with mode m. By substituting the constitutive relation σ m ϵ m , into the damage threshold function, one obtains an alternative formulation expressed in terms of the damage variable d m   a n d   γ ^ m , rather than the original stress σi and strain εi. In tensor notation, the effective stress becomes [37]
d m = 1 1 γ ^ m e α m 1 γ ^ m
where α is the adjustment parameter of the damage law.
To evaluate α, a MATLAB 2024a symbolic algorithm was developed. In this algorithm, Equations (9) and (10) were solved to obtain the expression for α.

2.2. Bolted Joint Model Description and Boundary Conditions

A series of three-dimensional finite element models was developed to analyze single- and double-lap joint behavior. The joint configurations analyzed in this study are presented in Figure 2. The 3D model for the single-lap joint (3DS) includes two plates, PL1 and PL2, whereas the double-lap joint (3DD) configuration comprises three plates: one PL1 and two PL2 layers. PL1 is always modeled as a composite laminate, while PL2 may be either a composite laminate or a metal plate, depending on the specific case. Three-dimensional SOLID186 elements with 20 nodes were used to model the bolts and plates. The layered element feature of SOLID186 was activated to accurately simulate the composite layup [38,39].
For the case of the composite plate, the user material was selected in which the elastic orthotropic damage model was used, while for the case of steel, aluminum, and titanium, the material properties can be found in Table 2. Where E and ν are the elastic modulus and Poisson’s ratio.
For the 3DS joint, one symmetric boundary condition was imposed along the YZ plane to reduce computational effort. This boundary condition constrains the Ux degree of freedom (DOF). While for the 3DD model, two symmetric boundary conditions were imposed, corresponding to the XY and YZ planes to constrain displacement DOF Uz and Ux, respectively. PL2 was constrained at its bottom end in the X, Y, and Z directions, while PL1 was restrained at its top end in the X and Z directions and subjected to incremental loading in the Y direction, either through displacement (δ) or force (P). A high-density mesh of ~12,750 higher-order SOLID186 elements was generated with concentration near the bolt-hole rims to improve the accuracy of the numerical results. A mesh convergence study was conducted to determine the optimal mesh density. The number of elements varied from 10,000 to 13,000 in increments of approximately 250 elements. It was observed that beyond 12,500 elements, the variation in both load and strain energy was less than 3%. Therefore, a mesh with 12,750 elements was selected for the analysis.
The FE meshes of 3DD and 3DS are found in Figure 3a,b. It can be seen that most of the finer mesh was used in the composite plate (PL1) around the bolt to capture the high nonlinear material effects due to damage.

2.3. Contact Properties

To model the interaction between different joint components, surface-to-surface contact definitions were implemented. The defined contact interfaces included those between the bolt head and the plate, nut and plate, washer and plate, between the two plates, and between the bolt shank and the hole wall. In ANSYS, 2025 R2 these contacts were defined using CONTA174 elements on the contact surfaces and TARGE170 elements on the target surfaces to ensure proper simulation of the mechanical behavior under load. The contact behavior was governed by a Coulomb friction model with a friction coefficient set to 0.2 for validation [39] and 0.1 for the parametric study. In this study, a no-clearance condition was assumed between the bolt shank and the bolt hole.

2.4. Clamping Force

The clamping force was introduced using the ANSYS 2025 R2 pretension element, applied at the midpoint of the bolt shank [4,40]. Three levels of pretension stress, 7.2, 14.4, and 21.6 MPa, were considered for analysis. The simulation process was divided into two sequential load steps: first, the pretension load was applied and fixed; second, the tensile load was incrementally introduced to simulate joint loading conditions.

2.5. Effect of Clamping Force and Friction Coefficient

To evaluate the behavior of single- and double-lap joints in three dimensions, a set of finite element models was developed. Figure 2 illustrates the configurations for both 3DS and 3DD joints, including all relevant dimensions and components. The joints were characterized by a plate width (W) of 25.4 mm and an overall height (excluding grip length) of 35 mm. The joint design incorporated a side distance (S) of 12.7 mm and an end distance (e) of 15 mm. The bolt had a diameter (D) of 6.35 mm, and its head measured 0.5 mm in diameter. Washers had internal and external diameters of 6.75 mm and 12 mm, respectively.
As mentioned before, a half model with one symmetric boundary condition was built for 3DS, while the quarter model with two symmetric boundary conditions was built for 3DD. The thickness of the composite plate (PL1) was 2.616 mm for 3DS and 1.308 mm (half thickness due to symmetry) for 3DD, constructed with a symmetric quasi-isotropic layup using a [0/(±45)3/903]s stacking sequence.
Composite plates with the same dimensions and hole diameter were tested under tensile force without the bolt in previous work [17]. Table 3 summarizes the elastic properties of the lamina used in the analysis. Where E1 and E2 are the elastic moduli in fiber and matrix, and G12 is the shear modulus. ν12 is the in-plane Poisson’s ratio. St1 and Sc1 are the fiber direction tension and compression strengths. St2 and Sc2 are the matrix direction tension and compression strengths, and St12 is the shear strength. Finally, Gt1 and Gc1 are the fiber direction fracture toughness. Gt2 and Gc2 are the matrix direction tension and compression fracture toughness, and Gt12 is the fracture toughness. The steel plate (PL2) had a thickness of 2.6 mm in the 3DS configuration and 1.3 mm in the 3DD. The results of this parametric study will be presented in the next sections.

3. Results and Discussion

This section presents and discusses the findings of the finite element parametric study conducted to evaluate the mechanical performance of single- and double-lap composite joints. The key parameters investigated include clamping force levels, joint strength, stiffness behavior, and the mechanisms of load transfer.

3.1. Validation of Finite Element Model

In this part, three comparisons with previously published experimental works were introduced. The first comparison was introduced to validate the CDM model, while the second and third were introduced to validate the joint modeling technique.
Riccio et al. tested a group of composite–composite and composite–metal samples to investigate the effects of geometrical and material properties on the joint damage [38,39]. In this paper, configuration 4, which consists of a composite–aluminum joint connected with one titanium protruding bolt, will be used to validate the numerical model.
Features on Damage: The specimen geometry for this validation is a typical 3DS joint, as shown in Figure 2, with the following dimensions: width (W) = 28.8 mm, length (L) = 150.0 mm, height (H = Lg) = 60.0 mm, edge distance (e) = 14.4 mm, bolt diameter (d) = 4.8 mm, and plate thicknesses (tPL1 = tPL2) = 4.16 mm [38]. A titanium bolt was used with an elastic modulus of 110 MPa and a 0.29 Poisson’s ratio. Unfortunately, the type of titanium alloy or the yield strength was not reported in the previous work, so an elastic material was assumed for metal parts.
The joint was manufactured using HTA 7/6376 carbon–epoxy composite for PL1 and aluminum alloy for PL2. Only elastic properties are available for the aluminum alloy as listed in Table 2.
The lay-up was quasi-isotropic with a stacking sequence of [(0/±45/90)4]S. Each ply had a nominal thickness of 0.13 mm, resulting in a laminate thickness of 4.16 mm. The unidirectional stiffness properties of the composite are listed in Table 4. The damage model described in Section 2.1 was used to analyze this joint, requiring the identification of the strain energy release rate for each failure mode.
Figure 4a–c present the FE mesh and the corresponding deformation of the validated FEM model as well as a comparison between the failure models of numerical and experimental works. A half-model was constructed by applying a symmetrical boundary condition, which is appropriate for this single-lap joint configuration, as seen in Figure 4a. To enhance computational efficiency, the extension regions of the joint were modeled using larger elements, which is justified by the absence of significant nonlinear material behavior in these areas. Since strain localization primarily occurs in the vicinity of the bolt, a finer mesh was employed in that region to accurately capture the localized deformation. Figure 4a shows the deformed shape of the bolt area. Due to the single-lap configuration, secondary stresses were produced and caused the joint to tilt. Figure 4c shows a comparison between the failure modes of experimental and numerical results. It can be seen that similar failure modes were observed, including fiber crushing and delamination.
Figure 5 presents a comparison between the load deformation curves numerical and experimental results. Similarly to the experimental study, the deformation was measured at the relative deformation between two points above and below the bolt by 25 mm [39]. The predicted failure load from the present model was 11.01 kN, higher than the experimentally measured value of 10.76 kN, corresponding to an error of approximately 3%. The current model does not include plasticity effects, which, if incorporated, could potentially improve accuracy and enhance solution convergence [28]. The numerical curve exhibits a slight load drop at approximately 8 kN, which is not observed in the experimental data. This minor reduction occurs just after the bolt head begins to penetrate the composite material, as seen in Figure 6. In the numerical model, the edges of the bolt and nut heads are modeled with perfectly sharp 90° corners, which may be more severe than those present in the actual test specimens. In practice, the manufacturing process typically introduces slight curvatures or filets at these edges, which help to reduce localized bearing stresses. This discrepancy between the model and the physical setup is discussed in detail in the paper.

3.2. Strength of Single and Double-Lapped Joint

Table 5 shows the load–displacement curves with different values of clamping forces for the 3DD and 3DS joints. For 3DD, it can be found that by applying a 600 N clamping force, the strength of the joint increased by about 44%. The clamping force produced pressure over the composite plate, which suppressed the delamination and the interlaminar cracking process. The observed improvement in joint performance was no longer maintained for clamping forces above 1600 N. The failure load remained nearly constant for clamping forces (Pcl) ranging from 1600 to 3200 N, highlighting the existence of an optimal clamping range beyond which performance may decline.
Figure 7a,b illustrate the relationship between the applied clamping force and the corresponding failure load. The failure load (Pu) is normalized by the free-hole plate strength (Ph) obtained from experimental tests conducted under the same configuration [21].
In Figure 7a, it is observed that the failure load corresponding to a clamping force of Pcl = 3200 N is slightly lower than that for Pcl = 2400 N. This reduction is likely attributed to material degradation or localized damage resulting from excessive clamping pressure. The failure mechanism appears to be governed by interfacial shear stress, rather than by sliding of the washer. The 3DS results are in Figure 7b; increasing the clamping force up to 2800 N results in a 26.5% increase in the ultimate load. It can be concluded that the beneficial effect of clamping force on the ultimate load is less pronounced in the 3DS configuration compared to the 3DD configuration, suggesting a stronger interaction between clamping and structural response in the latter. One of the primary effects observed is the secondary bending in the single-lap joint, which causes plate separation and reduces the effectiveness of the clamping force, as shown in Figure 4a. Additionally, direct contact between the bolt assembly and the composite material leads to premature damage.
To clarify the difference between the 3DD and 3DS models, the through-thickness strain (Z-direction) for both cases is presented in Figure 8a under the same loading condition, specifically, the failure load of the 3DS model. As shown, the 3DD model maintained a compressive strain throughout the thickness, reaching values below −1136 µε. In contrast, the 3DS model exhibited tensile strain across most of the thickness. This tensile behavior led to delamination beneath the bolt, which in turn triggered premature failure in the 3DS configuration. This can also be seen when comparing the damage d3 (tension) in the 3DD and 3DS models as seen in Figure 8b,c. It can be seen that 3DS is almost totally damaged in the thickness direction, while 3DD has minimal damage.
This effect may result from secondary bending in the single-lap joint, which introduces additional bending stresses within the laminate. The bending causes the bolt shank to penetrate through the composite plate from one side more than the other side, which produces more stress concentration on the edge of the bolt hole (see Figure 9). It is important to note that, for the 3DS joint, the highest compressive strain occurred along the outer surface at a 30° inclination, as shown in Figure 9.

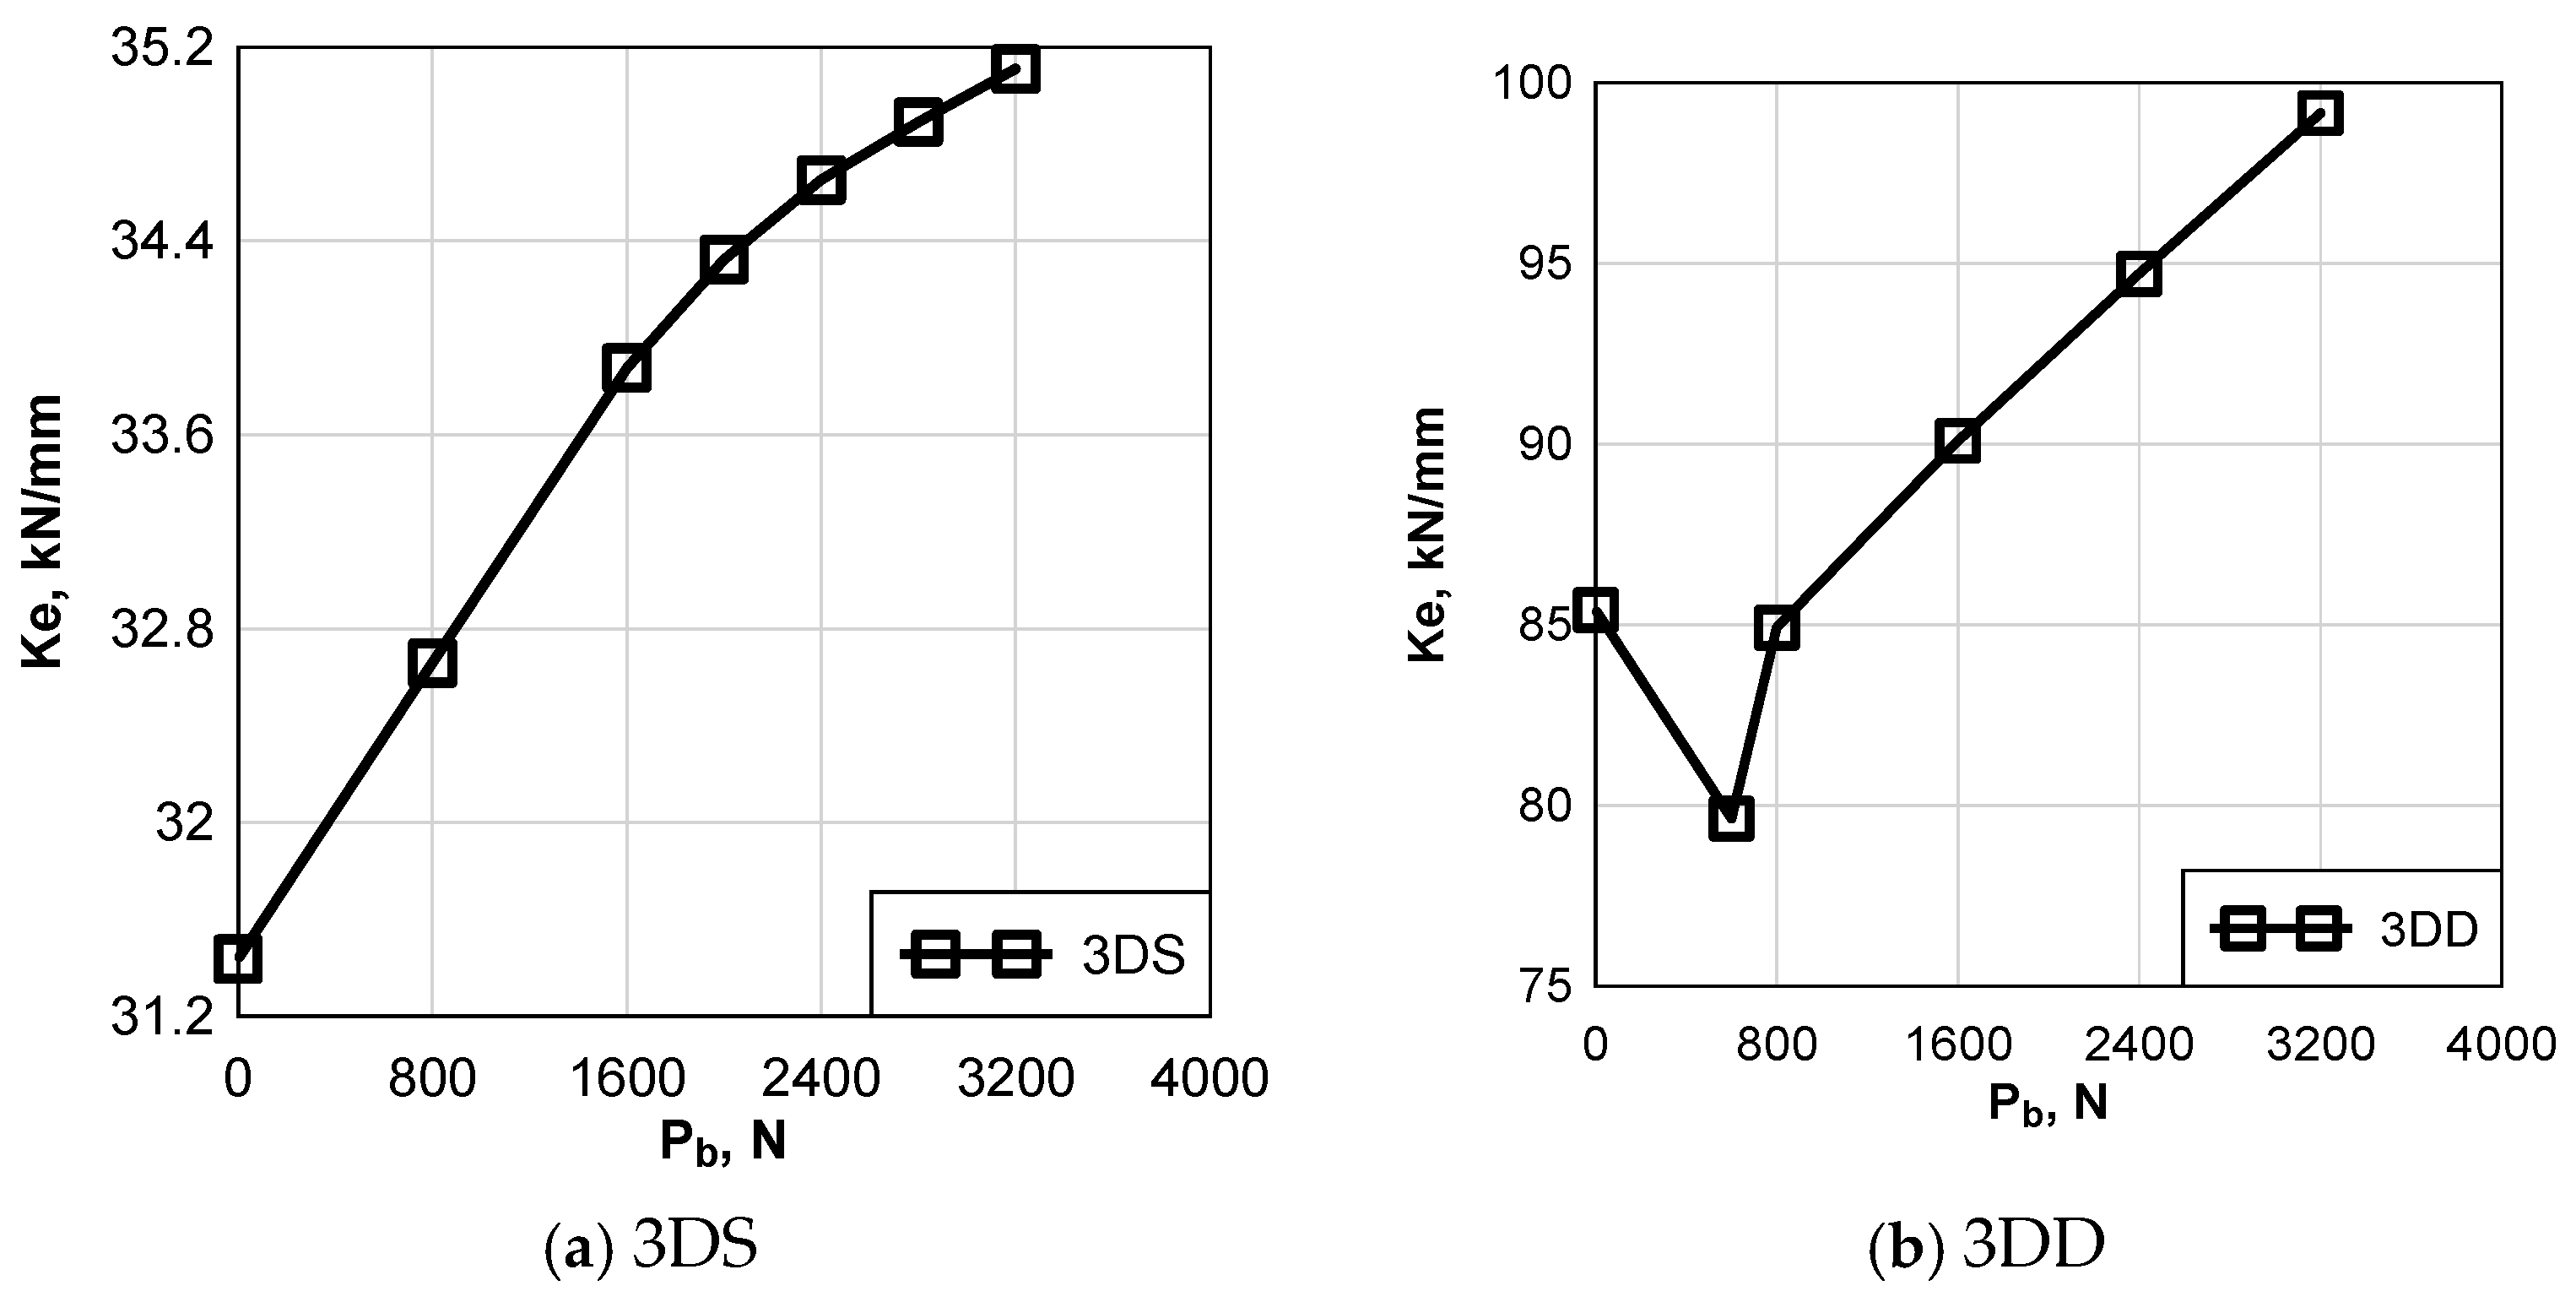
3.3. Stiffness of Single and Double-Lapped Joint

By increasing the load (the end-displacement), the stiffness of the joint was decreased. This behavior occurred as a result of secondary stresses and localized damage in the material beneath the bolt following the progression of damage. The same softening behavior was observed in both the 3DS and the 3DD joints. The stiffness can be described by two linear equations, which are explained in Figure 10.
As shown in Figure 11a,b, it was observed that increasing the clamping force from 0 to 3200 kN resulted in a stiffness increase of 16% for the 3DD configuration and 16% for the 3DD configuration. This improvement is attributed to the additional frictional resistance generated by the bolt pre-tension. Rotation caused by secondary bending in the single-lap joint leads to detachment between the plate interfaces, resulting in a loss of frictional resistance.

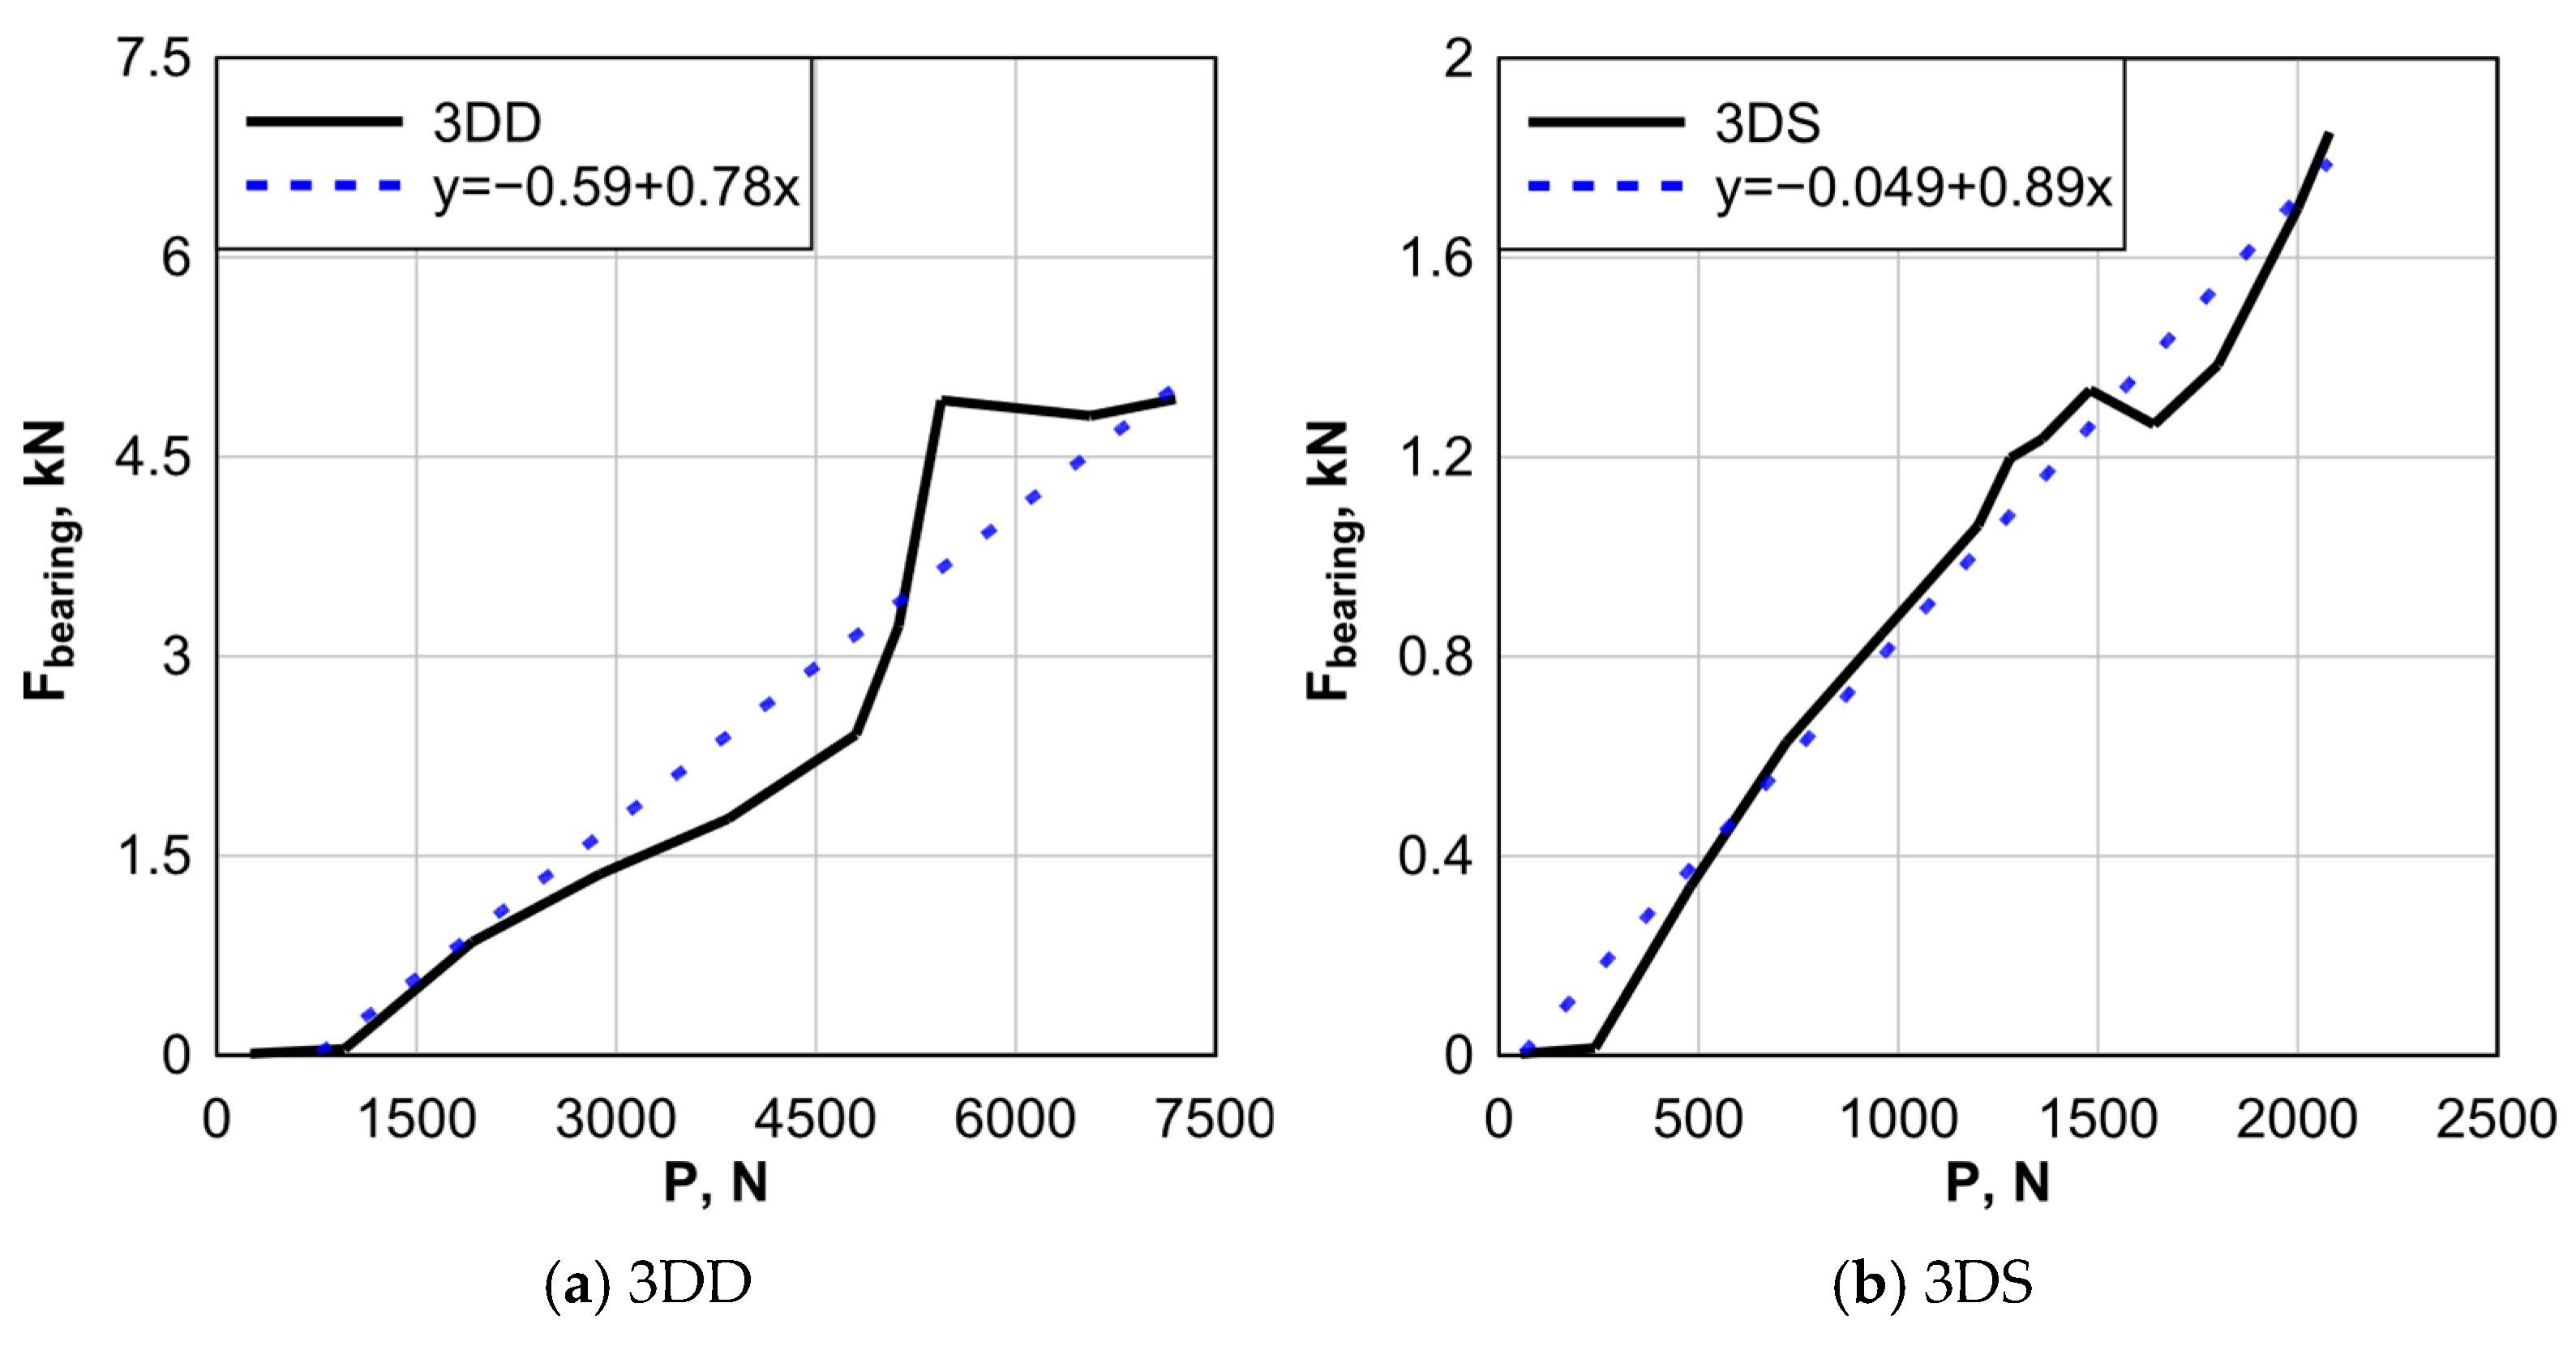
3.4. Load Transferee Analysis

The applied load can be transferred by two components: the bearing component and the friction component. The friction component depends on the applied clamping force plus the additional force amount produced from the deformation of the joint. Figure 12a,b show a relation between the applied load and the bearing force component for the case of 400 N clamping forces. It can be observed that at the beginning of loading that a low amount of force was transferred by the bearing. When the load increases and exceeds the friction resistance limit, the joint starts to resist the load by bearing force. The friction resistance limit depends on the initial clamping force; after this limit, the bearing load increases by increasing the joint load increases. An increase in clamping force was observed during loading, attributed to joint deformation and the influence of Poisson’s effect. At maximum load, it was found that the average percentage of load transferred by friction in the case of 3DS is about 20%, while this percentage was 12% for the 3DS joint.

4. Conclusions and Recommendations

In this study, the mechanical behavior of single- and double-lap composite joints was investigated. A three-dimensional damage mechanics-based constitutive model was developed, implemented, and validated. Additionally, a detailed 3D finite element model was developed to simulate the response of bolted joints. The proposed numerical models were evaluated against experimental data from the literature, demonstrating good agreement and confirming the reliability of the modeling approach. The effect of clamping force and type of joint on strength, load transfer, and stress distribution was analyzed. Based on the findings of this study, the following conclusions have been drawn:
  • The material model was developed and used to build an FE model that was able to predict the experiment with a difference of 3%.
  • Using a double-lap joint configuration, where the composite plate is positioned between two steel plates, increased the joint capacity by more than 200%.
  • Increasing the clamping force led to a significant improvement in the strength of both 3DS and 3DD joints, up to a certain limit.
  • Increasing the clamping force from 0 to 1600 N increased the capacity of the double-lapped joint by 96% while increasing that clamping force to 3200 N led only to the capacity increase of less than 1%. However, increasing the clamping force did not significantly affect the single-lapped joint.
  • The stiffness of the 3DD joint was found to be nearly three times greater than that of the 3DS joint, primarily due to the rotational flexibility of the single-lap configuration, due to the asymmetry of the joint.
  • Increasing the clamping force from 0 to 3200 N resulted in a stiffness increase of 16% for the 3DD configuration and 11% for the 3DS configuration. This improvement is attributed to the additional frictional resistance generated by the bolt pre-tension.
  • Future research should focus on developing an advanced 3D coupled plasticity-damage model to more accurately simulate the nonlinear behavior of bolted joints. Additionally, incorporating viscoelastic-damage coupling will enable realistic modeling of polymer matrix behavior under cyclic and long-term loading conditions. Enhancing the framework to account for fatigue degradation mechanisms is also essential for predicting the durability and service life of composite bolted joints.

Author Contributions

Conceptualization, Investigation, Methodology, Validation, Formal analysis Visualization, Supervision, and writing—review and editing: A.E.-S.; Conceptualization, Formal analysis, Supervision, and writing—review and editing: H.S.; Formal analysis, Software, Investigation, Writing—original draft preparation: A.E. (Ahmed Elkilani); Formal analysis, Investigation, Software, Writing—original draft preparation: A.E. (Ahmed Elbelbisi); All authors have read and agreed to the published version of the manuscript.

Funding

This research received no external funding.

Data Availability Statement

All data generated or analyzed during this study are included in this published article.

Conflicts of Interest

The authors declare no conflicts of interest.

References

  1. Kradinov, V.; Madenci, E.; Ambur, D.R. Combined In-Plane and through-the-Thickness Analysis for Failure Prediction of Bolted Composite Joints. Compos. Struct. 2007, 77, 127–147. [Google Scholar] [CrossRef]
  2. Camanho, P.P.; Matthews, F.L.; Running, D.M.; Ligon, J.B.; Miskioglu, I.; Camanho, P.P.; Matthews, F.L. A Progressive Damage Model for Mechanically Fastened Joints in Composite Laminates. J. Compos. Mater. 1999, 33, 2248–2280. [Google Scholar] [CrossRef]
  3. Camanho, P.P.; Bowron, S.; Matthews, F.L. Failure Mechanisms in Bolted CFRP. J. Reinf. Plast. Compos. 1998, 17, 205–233. [Google Scholar] [CrossRef]
  4. El-Sisi, A.E.-D.; Sallam, H.E.-D.; Salim, H.; El-Husseiny, O. Structural Behavior of Hybrid CFRP/Steel Bolted Staggered Joints. Constr. Build. Mater. 2018, 190, 1192–1207. [Google Scholar] [CrossRef]
  5. Sun, H.-T.; Chang, F.-K.; Qing, X. The Response of Composite Joints with Bolt-Clamping Loads, Part I: Model Development. J. Compos. Mater. 2002, 36, 47–67. [Google Scholar] [CrossRef]
  6. Vangrimde, B.; Boukhili, R. Bearing Stiffness of Glass Fibre-Reinforced Polyester: Influence of Coupon Geometry and Laminate Properties. Compos. Struct. 2002, 58, 57–73. [Google Scholar] [CrossRef]
  7. Hou, L.; Liu, D. Size Effects and Thickness Constraints in Composite Joints. J. Compos. Mater. 2003, 37, 1921–1938. [Google Scholar] [CrossRef]
  8. Cooper, C.; Turvey, G.J. Effects of Joint Geometry and Bolt Torque on the Structural Performance of Single Bolt Tension Joints in Pultruded GRP Sheet Material. Compos. Struct. 1995, 32, 217–226. [Google Scholar] [CrossRef]
  9. Oh, J.H.; Kim, Y.G.; Lee, D.G. Optimum Bolted Joints for Hybrid Composite Materials. Compos. Struct. 1997, 38, 329–341. [Google Scholar] [CrossRef]
  10. Aktas, A.; Husnu Dirikolu, M. An Experimental and Numerical Investigation of Strength Characteristics of Carbon-Epoxy Pinned-Joint Plates. Compos. Sci. Technol. 2004, 64, 1605–1611. [Google Scholar] [CrossRef]
  11. Aktaş, A. Bearing Strength of Carbon Epoxy Laminates under Static and Dynamic Loading. Compos. Struct. 2005, 67, 485–489. [Google Scholar] [CrossRef]
  12. McCarthy, M.A.; Lawlor, V.P.; Stanley, W.F.; McCarthy, C.T. Bolt-Hole Clearance Effects and Strength Criteria in Single-Bolt, Single-Lap, Composite Bolted Joints. Compos. Sci. Technol. 2002, 62, 1415–1431. [Google Scholar] [CrossRef]
  13. Lawlor, V.P.; McCarthy, M.A.; Stanley, W.F. Experimental Study on Effects of Clearance on Single Bolt, Single Shear, Composite Bolted Joints. Plast. Rubber Compos. 2002, 31, 405–411. [Google Scholar] [CrossRef]
  14. Girard, C.; Dano, M.-L.; Picard, A.; Gendron, G. Bearing Behavior of Mechanically Fastened Joints in Composite Laminates--Part II: Failure Mechanisms. Mech. Adv. Mater. Struct. 2003, 10, 23–42. [Google Scholar] [CrossRef]
  15. Park, H.-J.J. Effects of Stacking Sequence and Clamping Force on the Bearing Strengths of Mechanically Fastened Joints in Composite Laminates. Compos. Struct. 2001, 53, 213–221. [Google Scholar] [CrossRef]
  16. Sadowski, T.; Golewski, P. Effect of Tolerance in the Fitting of Rivets in the Holes of Double Lap Joints Subjected to Uniaxial Tension. Key Eng. Mater. 2014, 607, 49–54. [Google Scholar] [CrossRef]
  17. Sun, H.-T.; Chang, F.-K.; Qing, X.; Mc, A.; Sun, H.-T.; Chang, F.-K.; Qing, X. The Response of Composite Joints with Bolt-Clamping Loads, Part II: Model Verification. J. Compos. Mater. 2002, 36, 69–92. [Google Scholar] [CrossRef]
  18. Yan, Y.; Wen, W.-D.; Chang, F.-K.; Shyprykevich, P. Experimental Study on Clamping Effects on the Tensile Strength of Composite Plates with a Bolt-Filled Hole. Compos. Part A Appl. Sci. Manuf. 1999, 30, 1215–1229. [Google Scholar] [CrossRef]
  19. Khashaba, U.A.; Sallam, H.E.M.; Al-Shorbagy, A.E.; Seif, M.A. Effect of Washer Size and Tightening Torque on the Performance of Bolted Joints in Composite Structures. Compos. Struct. 2006, 73, 310–317. [Google Scholar] [CrossRef]
  20. Pietropaoli, E. Progressive Failure Analysis of Composite Structures Using a Constitutive Material Model (USERMAT) Developed and Implemented in ANSYS. Appl. Compos. Mater. 2012, 19, 657–668. [Google Scholar] [CrossRef]
  21. Tan, S.C. A Progressive Failure Model for Composite Laminates Containing Openings. J. Compos. Mater. 1991, 25, 556–577. [Google Scholar] [CrossRef]
  22. Nuismer, R.J.; Tan, S.C. Constitutive Relations of a Cracked Composite Lamina. J. Compos. Mater. 1988, 22, 306–321. [Google Scholar] [CrossRef]
  23. Matzenmiller, A.; Lubliner, J.; Taylor, R.L. A Constitutive Model for Anisotropic Damage in Fiber-Composites. Mech. Mater. 1995, 20, 125–152. [Google Scholar] [CrossRef]
  24. Lonetti, P.; Zinno, R.; Greco, F.; Barbero, E.J.E.; Zinno, R.; Greco, F. Interlaminar Damage Model for Polymer Matrix. J. Compos. Mater. 2003, 37, 1485–1504. [Google Scholar] [CrossRef]
  25. Maimí, P.; Camanho, P.P.; Mayugo, J.A.; Dávila, C.G. A Continuum Damage Model for Composite Laminates: Part I—Constitutive Model. Mech. Mater. 2007, 39, 897–908. [Google Scholar] [CrossRef]
  26. Maimí, P.; Camanho, P.P.; Mayugo, J.A.; Dávila, C.G. A Continuum Damage Model for Composite Laminates: Part II—Computational Implementation and Validation. Mech. Mater. 2007, 39, 909–919. [Google Scholar] [CrossRef]
  27. Chen, J.F.; Morozov, E.V.; Shankar, K.; Technology, I. Plastic Damage Model for Progressive Failure Analysis of Composite Structures. In Proceedings of the 18th International Conference on Composite Materials, Jeju Island, Republic of Korea, 21–26 August 2009. [Google Scholar]
  28. Chen, J.F.; Morozov, E.V.; Shankar, K. A Combined Elastoplastic Damage Model for Progressive Failure Analysis of Composite Materials and Structures. Compos. Struct. 2012, 94, 3478–3489. [Google Scholar] [CrossRef]
  29. Kim, E.-H.; Rim, M.-S.; Lee, I.; Hwang, T.-K. Composite Damage Model Based on Continuum Damage Mechanics and Low Velocity Impact Analysis of Composite Plates. Compos. Struct. 2013, 95, 123–134. [Google Scholar] [CrossRef]
  30. Bažant, Z.P.; Oh, B.H. Crack Band Theory for Fracture of Concrete. Matériaux Constr. 1983, 16, 155–177. [Google Scholar] [CrossRef]
  31. Turon, A.; Da’vila, C.G.; Camanho, P.P.; Costa, J. An Engineering Solution for Mesh Size Effects in the Simulation of Delamination Using Cohesive Zone Models. Eng. Fract. Mech. 2007, 74, 1665–1682. [Google Scholar] [CrossRef]
  32. Frank, A. Leone Full-Scale Testing and Progressive Damage Modeling of Sandwich Composite Aircraft Fuselage Structure. Ph.D. Thesis, Drexel University, Philadelphia, PA, USA, 2010. [Google Scholar]
  33. ANSYS, Inc. ANSYS Release 2025 Documentation; ANSYS, Inc.: Canonsburg, PA, USA, 2025. [Google Scholar]
  34. Suemasu, H.; Takahashi, H.; Ishikawa, T. On Failure Mechanisms of Composite Laminates with an Open Hole Subjected to Compressive Load. Compos. Sci. Technol. 2006, 66, 634–641. [Google Scholar] [CrossRef]
  35. Shan, M.; Liu, F.; Fang, Z.; Zhao, L.; Zhang, J. A Bi-Material Property Based FE Modelling Method for Progressive Damage Analyses of Composite Double-Lap Bolted Joints. Results Phys. 2018, 11, 674–683. [Google Scholar] [CrossRef]
  36. Barbero, E.J. Finite Element Analysis of Composite Material by Using ABAQUS; CRC Press: Boca Raton, FL, USA, 2013. [Google Scholar]
  37. El-Sisi, A.E.-D.A.; El-Emam, H.M.; Salim, H.A.; Sallam, H.M. Efficient 3D Modeling of Damage in Composite Materials. J. Compos. Mater. 2014, 49, 817–828. [Google Scholar] [CrossRef]
  38. Riccio, A.; Marciano, L. Effects of Geometrical and Material Features on Damage Onset and Propagation in Single-Lap Bolted Composite Joints under Tensile Load: Part I—Experimental Studies. J. Compos. Mater. 2005, 39, 2071–2090. [Google Scholar] [CrossRef]
  39. Riccio, A. Effects of Geometrical and Material Features on Damage Onset and Propagation in Single-Lap Bolted Composite Joints under Tensile Load: Part II—Numerical Studies. J. Compos. Mater. 2005, 39, 2091–2112. [Google Scholar] [CrossRef]
  40. El-Sisi, A.E.-D.A.; Salim, H.A.; El-Hussieny, O.M.; Sallam, H.E.-D.M. Behaviors of a Cracked Lapped Joint under Mixed Mode Loading. Eng. Fail. Anal. 2014, 36, 134–146. [Google Scholar] [CrossRef]
Figure 1. Failure Modes in Composite Bolted Joints: (a) Net-Tension, (b) Shear-Out, (c) Transverse splitting, (d) Cleavage, (e) Bearing, and (f) Pull-out [4].
Jcs 09 00350 g001
Figure 2. Specimen Components and Geometry.
Jcs 09 00350 g002
Figure 3. Mesh around the Bolt of (a) 3DD and (b) 3DS Models.
Jcs 09 00350 g003
Figure 4. Validated FE Model; (a) Mesh, (b) Total Deformation (mm), and (c) Failure Comparison.
Jcs 09 00350 g004
Figure 5. Comparison between numerical and experimental results.
Jcs 09 00350 g005
Figure 6. Bolt head edge penetration into the composite plate.
Jcs 09 00350 g006
Figure 7. Effect of clamping force on failure load in (a) 3DD, and (b) 3DS.
Jcs 09 00350 g007
Figure 8. Comparison between 3DD and 3DS; (a) Thickness Strain Comparison, (b) 3DD d3 damage (Half Thickness), and (c) 3DS d3t damage.
Jcs 09 00350 g008
Figure 9. Elastic strain under bolt load and position of maximum strain.
Jcs 09 00350 g009
Figure 10. Effect of clamping force on joint stiffness for 3DS.
Jcs 09 00350 g010
Figure 11. Effect of clamping force on the initial joint stiffness.
Jcs 09 00350 g011
Figure 12. Bearing force under the bolt.
Jcs 09 00350 g012
Table 1. Loading Functions g ^ m .
Damage DirectionTensionCompression
Fiber Direction 1 g ^ t 1 = σ 1 S t 1   F o r   σ 1 > 0 σ 1 S c 1   F o r   σ 1 < 0
Matrix Direction 2 g ^ t 1 = σ 2 S t 2   F o r   σ 2 > 0 σ 2 S c 2   F o r   σ 2 < 0
Matrix Direction 3 g ^ t 3 = σ 3 S t 3   F o r   σ 3 > 0 σ 3 S c 3   F o r   σ 3 < 0
Table 2. Metals properties of bolts, nuts, and washers [38,39].
ItemE (GPa)ν
Steel Plates, Nuts, and Washers2000.3
Aluminum Alloy Plates700.29
Titanium Bolts1100.29
Table 3. Carbon–Epoxy Composite T300/1034-C Lamina Properties [17].
Stiffness Parameters Strength Parameters Fracture Toughness
E1146.8 GPaSt11730 MPaGt189.83 N/mm
E211.4 GPaSc11370 MPaGc178.27 N/mm
G126.1 GPaSt266.5 MPaGt20.43 N/mm
ν120.3Sc2268.2 MPaGc20.76 N/mm
Ss1258.2 MPaGs120.46 N/mm
Table 4. Material Properties for Composite Plates HTA 7/6376 [38,39].
Stiffness Parameters Strength Parameters, MPa
E1145 GPaSt12250
E210.30 GPaSc11600
G125.30 GPaSt164
ν120.3Sc2290
Ss12120
Table 5. Effect of Clamping Force on Joint Strength.
Clamping Force (N)Failure Load (kN)
3DD3DS
17.261.90
60010.482.05
80011.582.09
160014.242.23
240014.42.41
320014.42.45
Disclaimer/Publisher’s Note: The statements, opinions and data contained in all publications are solely those of the individual author(s) and contributor(s) and not of MDPI and/or the editor(s). MDPI and/or the editor(s) disclaim responsibility for any injury to people or property resulting from any ideas, methods, instructions or products referred to in the content.

