1. Introduction
Carbon-fiber-reinforced polymer (CFRP) components serve as critical enablers to achieving structural lightweighting in aerospace, rail transportation, and related industries, where manufacturing quality directly dictates the good service performance of the equipment and operational safety [
1,
2,
3]. During the compression molding process for CFRP components, the key manufacturing stages typically involve the multi-axis layup of core-layer prepreg, orientation-controlled fiber alignment in the reinforcement layers, and thermoset curing under hot-press conditions. Due to the synergistic effects of interlaminar shear stress and thermal gradients during hot-press molding, the outer surfaces of the components are prone to the formation of defects, including delamination, porosity, and fiber misalignment [
4]. If left unaddressed, these defects can induce inhomogeneity in the resin flow in subsequent vacuum-assisted resin transfer molding (VARTM) processes, ultimately compromising the cured components’ capacity to meet the prescribed load distribution patterns and fatigue life requirements under operational conditions [
5]. In severe cases, such defects may trigger degradations in the global stiffness, substantially diminishing the mass-specific load-bearing efficiency of structural components. Consequently, to mitigate the detrimental impacts of fiber fracture and interlaminar debonding on the structural integrity of large composite assemblies, it is imperative to implement robust online surface yarn (warp and weft) alignment defect detection systems. Such systems enable timely defect remediation and process parameter optimization by manufacturing personnel. Unlike the conventional non-destructive testing, CFRP prepreg inspection resembles a modern form of textile woven fabric analysis, as CFRP prepregs constitute specialized woven structures [
6,
7]. Due to the interlacing of warp and weft yarns following specific weaving patterns, their surface exhibits a periodic texture defined by the yarn arrangement. The current computer vision methods for identifying surface yarn alignment defects in such materials are classified into image-feature-based [
8,
9], database-driven [
10], and weave-pattern-based approaches [
11,
12,
13,
14].
Kang et al. [
15] first introduced image-feature-based recognition, suitable for fabrics with similar warp/weft thicknesses. Zheng et al. [
16] utilized a Markov Random Field (MRF) model to infer the texture element locations and classify structures by shape. Jing et al. [
17] represented fabric images using binary weave diagrams and digital matrix coding, employing an Improved Distance Matching Function (IDMF) to characterize woven structures. These three approaches rely on recognizing woven patterns through pixel repetitions in the fabric features and yarn feature correlation coefficients. Xiao et al. [
18] extended this by extracting feature vectors from weave points on each yarn and calculating the cross-yarn correlation coefficients, deriving the structure and dimensions from the correlation peak sequences. While image-feature-based methods achieve high accuracy, they demand high-quality images, as the uniformity of the illumination and clarity of the texture significantly influence their performance.
Currently, database-driven recognition methods have gained traction in fabric inspections and vision applications. Kuo et al. [
19] leveraged the cumulative pixel gray-level values to extract warp/weft texture features, employing a two-stage backpropagation neural network for woven structure classification. Salem et al. [
20] compared Gabor wavelets, Local Binary Pattern (LBP) operators, and Gray-Level Co-Occurrence Matrices (GLCMs) for feature extraction, establishing a three-elementary weave database and using Support Vector Machines (SVMs) for classification. Bao et al. [
21] developed an improved KIII stimulation model via an Olfactory Neural Network (ONN) to enhance the recognition speed for three-elementary weaves. Pan et al. [
22,
23] created a comprehensive fabric texture database, achieving recognition by comparing the classification results with database template similarity coefficients—a method applicable to both three-elementary weaves and derived structures. However, a common limitation of these approaches is their heavy reliance on the database’s size and comprehensiveness.
Given the distinct weaving characteristics of different structures, the current research has predominantly focused on weave-pattern-based methods, with periodic texture repeat units serving as critical indicators for woven structure recognition. Zhou et al. [
24,
25] employed a statistical approach to extracting weave/color repeat units, identifying full weave structures, and detecting/correcting color pattern misrecognitions when present. Wang et al. [
26] utilized a principal component analysis (PCA) to optimize the GLCM-based texture features and computed 2D autocorrelation matrices of pre-recognized weave structures for classification. Notably, both methods exhibited a promising performance only when the weave pattern repeat size was below a certain threshold.
When applied to automatic placement production lines, the aforementioned three methods (image-feature-based, database-based, and weave-pattern-based) suffer from poor robustness, low efficiency, and unstable accuracy. Moreover, due to the inherent complexity of woven structures, defect detection in CFRP prepregs remains an unsolved challenge in real-time manufacturing. The commonly employed approaches (filtering-based, feature-based, and learning-based methods) are primarily suitable for pure woven fiber fabrics composed of single-fiber spun yarns, making them poorly suited to inspecting CFRP prepregs [
27,
28,
29,
30,
31]. Therefore, there is a critical need to develop a systematic, highly integrated framework for recognizing surface yarn alignment defects in prepregs, thereby enhancing the online detection efficiency and quality control in automated placement processes. This paper presents a yarn defect detection machine vision framework applied in the forming process of CFRP components. In order to optimize the acquisition of the surface geometry and weaving characteristics of carbon fiber prepregs, texture feature enhancements, a DFT-based yarn quantity detection method, and the artistic conception drawing (ACD) revert algorithm were used. Furthermore, identification rules for defect area extraction were designed to facilitate real-time monitoring and evaluation of manufacturing processes, avoiding potential defects that could affect the structural quality and consistency of CFRP components.
2. Materials and Methods
CFRP prepregs are typically shaped in hyperbolic molds during manufacturing. During automatic placement, inadequate in-plane deformation of the laminate stack to conform to the mold geometry causes the yarns to compress toward the center, inducing buckling that propagates and generates defects such as wrinkles and bubbles [
32,
33,
34,
35,
36]. A flowchart of the surface yarn alignment defect detection process is presented in
Figure 1.
First, five preprocessing algorithms enhance the texture features in the original images. Next, grayscale integral projection and discrete Fourier transform are employed to detect warp and weft yarns, with texture structure identification achieved via the artistic conception drawing (ACD) revert method [
37,
38]. The ACD revert algorithm generates the matrix
Ozo, which serves as the input for calculating the classification metrics. These metrics are compared against templates using predefined rules to derive the ACC matrix, which encapsulates core data for defect recognition, localization, and classification. Defect images are identified by comparing element-wise thresholds in the ACC matrix, while defect localization is achieved through detecting and merging defective sub-regions. The specific implementation process is as follows.
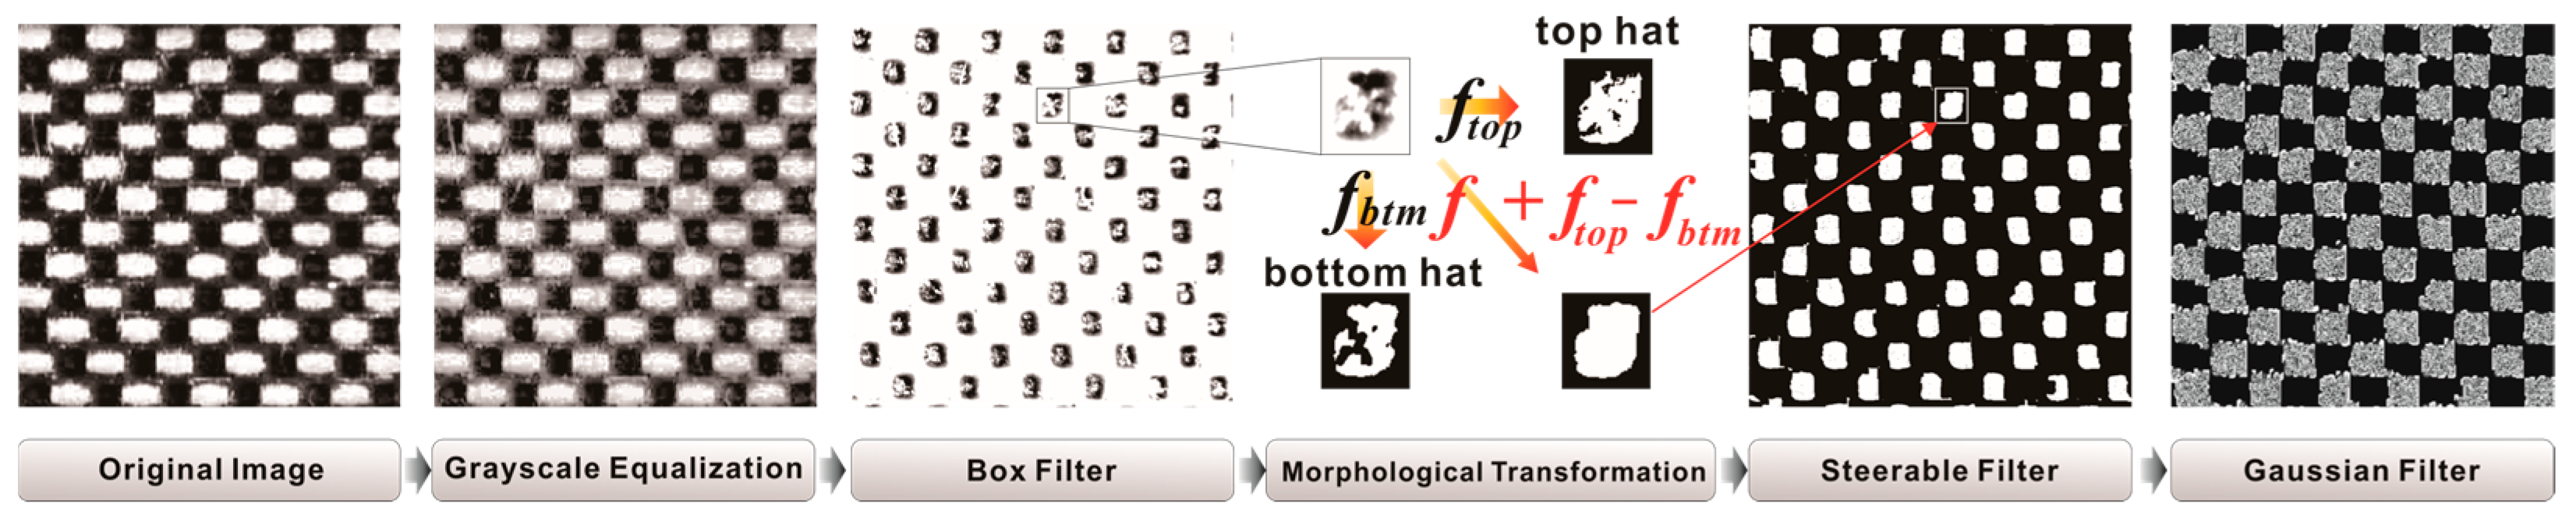
2.1. Texture Feature Enhancement
During the image acquisition process, electronic noise, shadows, and light pollution can interfere with image processing [
39]. In order to accurately identify the geometric features of the texture structure, warp and weft yarn contours, and warp and weft weave point edges, this paper uses the following preprocessing methods to enhance the texture features. The flowchart is shown in
Figure 2.
Step 1. Grayscale equalization: The original image is subjected to grayscale transformation using the cumulative distribution function, aiming to achieve grayscale equalization. To prevent discontinuity and excessive enhancement, an interpolation method is employed to expedite the equalization of the grayscale histogram. This approach accentuates the defect contour without compromising the overall contrast, thereby facilitating the extraction of defect features.
Step 2. Box filter: The box filter can effectively distinguish warp and weft weave points in the prepreg image by calculating the sum of pixels near these points. Additionally, this method suppresses noise while preserving textural features.
Step 3. Morphological transformation: The bottom-hat image was subtracted from the sum of the original and top-hat images to maximize the contrast between objects and gaps, allowing them to be distinguished.
Step 4. Steerable filter: The steerable filter is capable of arbitrary rotation, enabling the extraction of linear combinations at various angles based on the warp or weft direction. This capability facilitates accurate edge detection for the yarns, thereby aiding in the extraction of texture features.
Step 5. Gaussian filter: This filter eliminates Gaussian noise and background texture interference to optimize the extraction of the feature information on the texture structure.
2.2. Detection of Weft and Warp Yarns
During the process of the automatic recognition of surface defects in CFRP components, the captured image will be affected by the material weaving structure, fiber type, resin content, and external temperature and will present different warp and weft yarn densities in the same image size. Therefore, the detection of the number of warp and weft yarns on the surface of a prepreg is the core step in detecting defects. This paper uses the methods of grayscale integral projection and discrete Fourier transform to segment the prepreg image and detect the number of warp and weft yarns.
Step 1. Grayscale integral projection: The pixel values of each row in the grayscale image matrix enhanced by texture features can be summed up to obtain the horizontal integrated projection, which is the grayscale integrated projection of the weft yarn. Similarly, by summing up the pixel values in each column of the matrix, a vertical integrated projection can be obtained, which is the grayscale integrated projection of the warp yarn. The distribution characteristics of warp and weft yarn weaving are displayed in the integrated projection maps in these two directions [
40,
41].
Owing to the elliptical cross-sectional shape of the yarn, there is brighter imaging at the axis position and darker imaging at the concave edge position under the illumination of the light source. This leads to a discernible gap between adjacent weft yarns or warp yarns, as illustrated in
Figure 3. Therefore, the grayscale integration projection of yarns and gaps with different surface structures can reflect the trend in the grayscale variation in the gaps, which is particularly important for detecting the number of yarns. The expression of the grayscale integrated projection in the horizontal and vertical directions is shown in Equations (1) and (2).
where
I(x,
y) is the grayscale image;
x and
y are the pixel index values in the horizontal and vertical directions (grayscale image matrix coordinates); and
nx and
ny are the total rows and columns of the image, respectively.
G(
y) is the grayscale integrated projection value in the horizontal direction of row
nx, and
G(
x) is the grayscale integrated projection value in the vertical direction of row
ny. The ratio to 255 in the equation is used for data normalization.
Step 2. Discrete Fourier transform (DFT): The grayscale pixel values of warp and weft are transformed from the time domain into the frequency domain using the DFT [
31]. Firstly, a one-dimensional discrete Fourier transform is applied to the integrated grayscale projection signals in both the vertical and horizontal directions, as shown in Equation (3).
where the original signal
x(
t) is the input sampled signal
x(
n), which is output as
X(
k) after the discrete Fourier transform, with a sampling frequency of
N. Since the sampled signal data are all real numbers, the above equation can be expanded into Equation (4):
In addition, since
X(
0) is the DC component of the signal without imaginary parts, there will be a large-amplitude phenomenon in the amplitude diagram, which affects the extraction of the coordinates of the maximum amplitude point. Therefore, the operation process of removing the 0-frequency component needs to be carried out, as shown in Equation (5):
Therefore, a frequency spectrum corresponding to the projection curve can be obtained, where the vertical and horizontal directions, respectively, reflect the cyclic periods of warp and weft yarns. The frequency corresponding to the point of the maximum amplitude in the spectrum represents the number of cyclic periods for either the warp or the weft yarns, which is the quantity of warp and weft yarns.
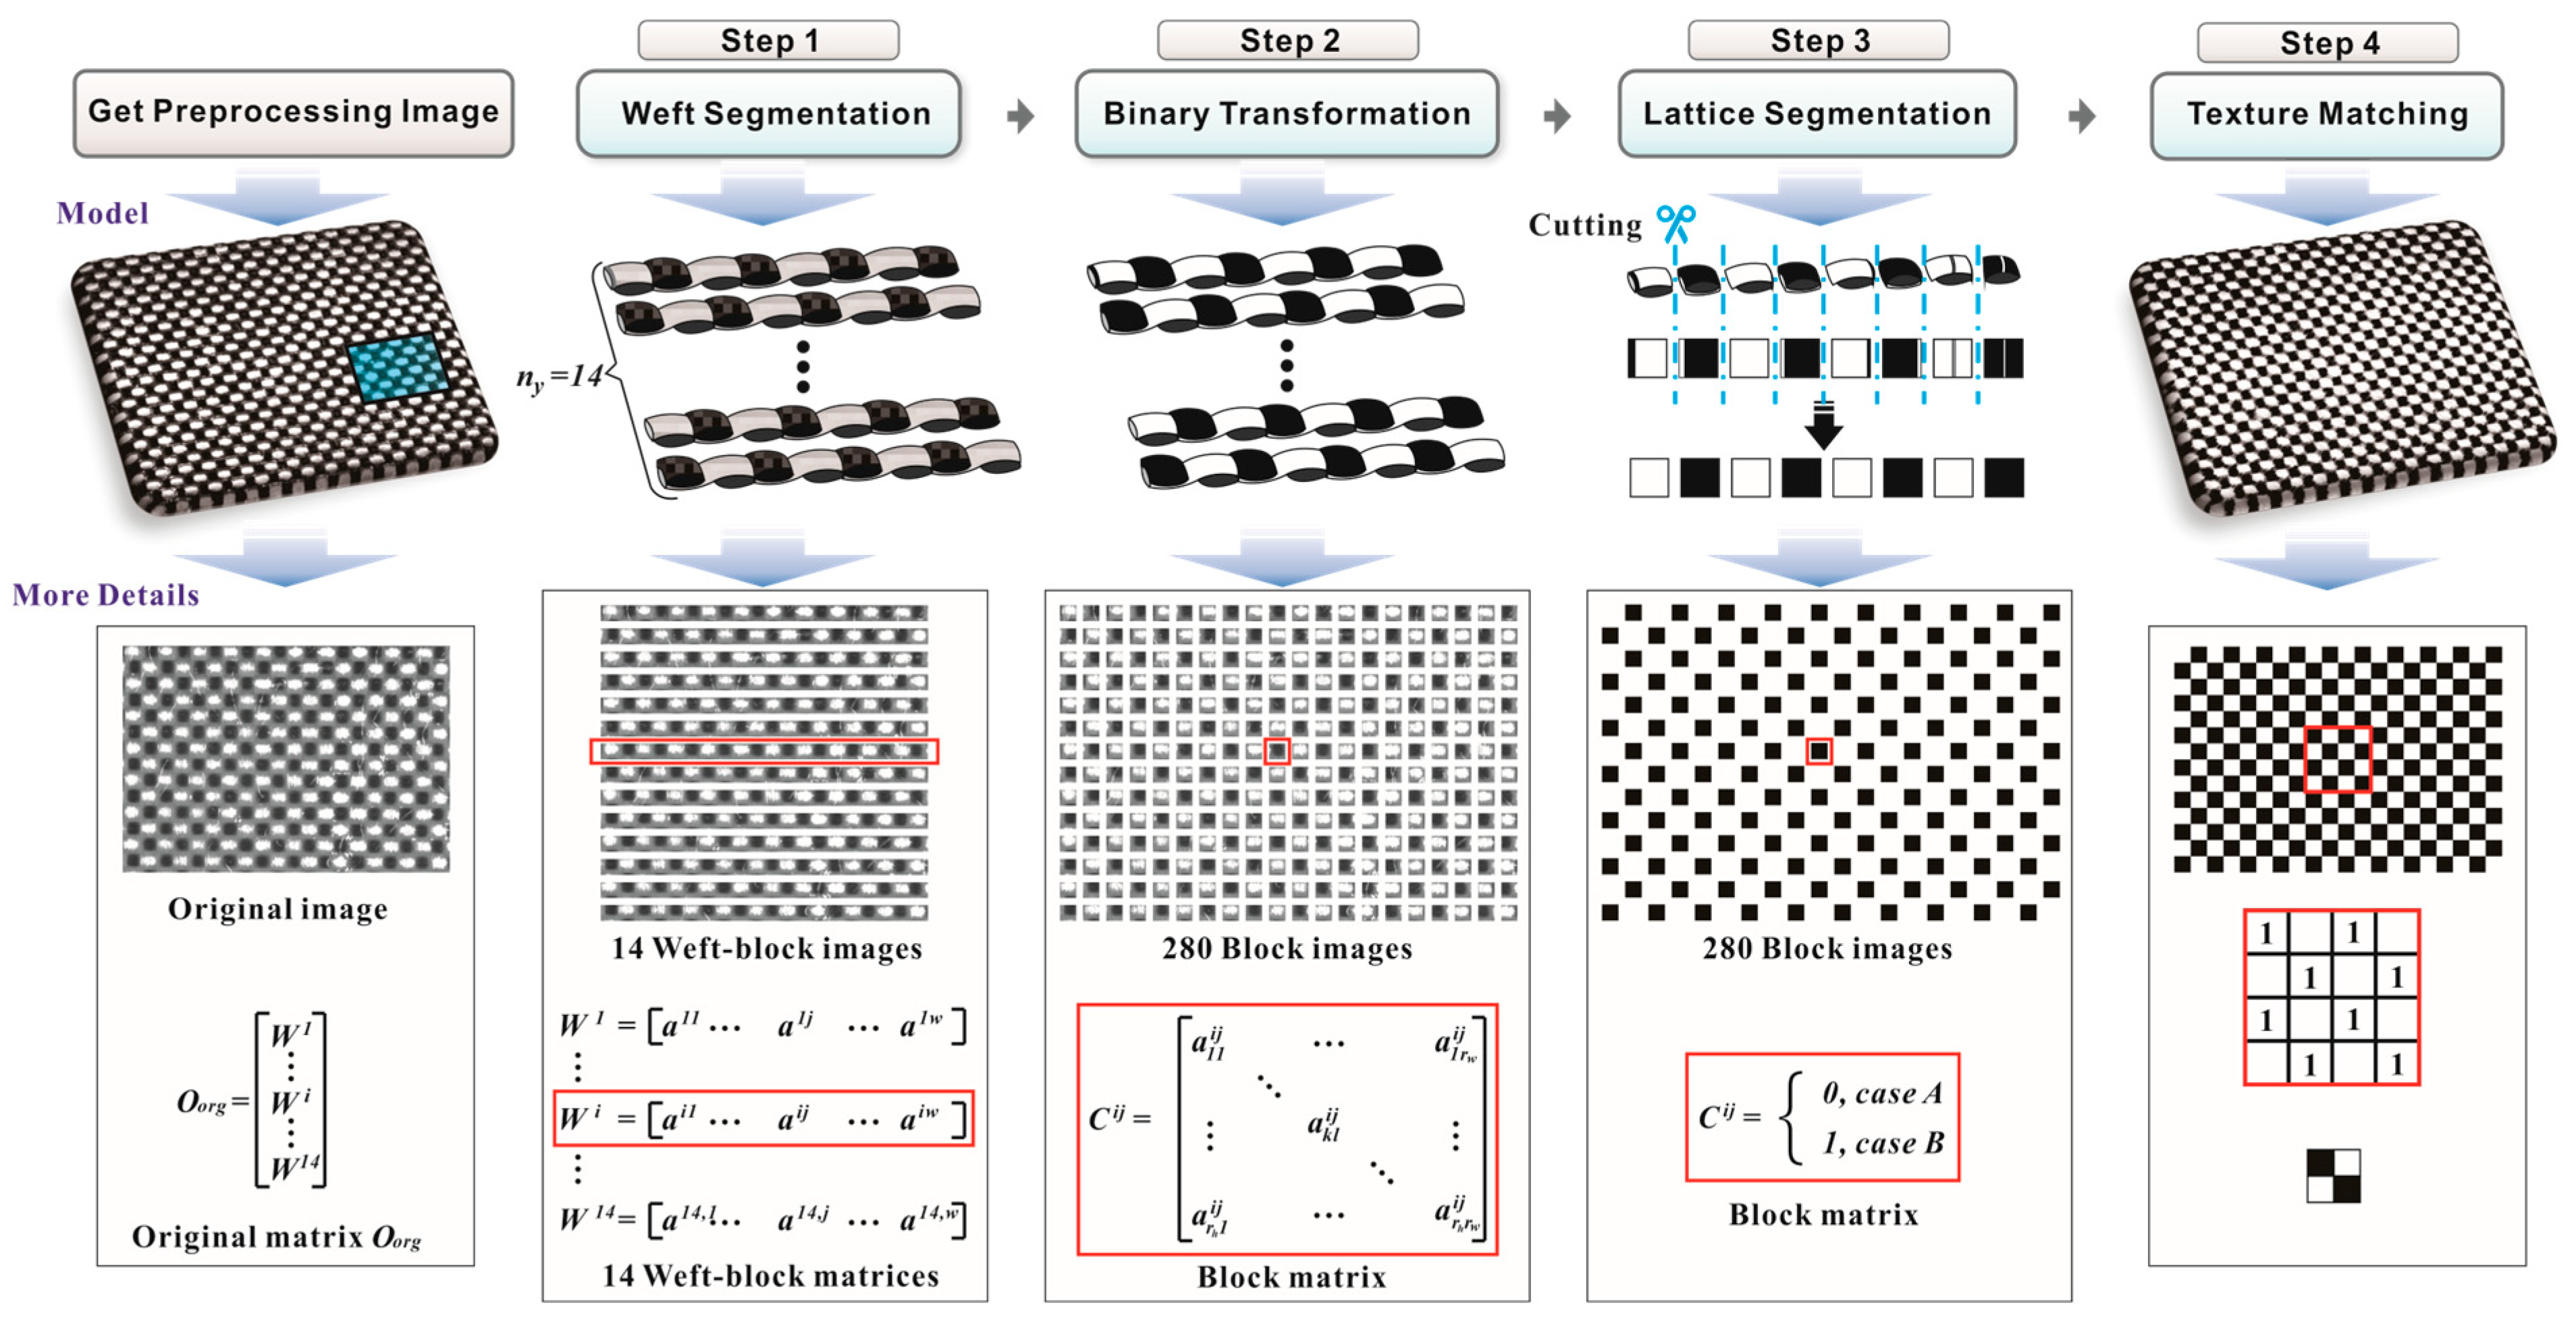
2.3. Texture Structure Recognition
The surface texture of a woven carbon fabric prepreg is complex, meaning surface defects are easily misidentified [
42,
43]. Therefore, in order to accurately and quickly detect surface defects on CFRP components, recognition of the surface texture structure of the tank body is crucial. This article utilizes previous research findings: the texture recognition method is based on the ACD revert and applied in the aforementioned machine vision framework. This method compresses the surface structure feature-enhanced image matrix while preserving the texture features, converts the complex grayscale image matrix into a simple binary matrix, and matches the data distribution of the binary matrix with the surface structure of the ACD image to identify the texture structure. The specific recognition process will go through steps such as weft segmentation, threshold calculation, binary transformation, lattice segmentation, and texture matching. The matrix
OACD that reflects the texture structure can ultimately be obtained. A schematic of this texture structure recognition is shown in
Figure 4.
2.4. Defect Location
In order to accurately and efficiently detect defects on the entire surface of CFRP components, the detection process as shown in
Figure 5a was designed: Firstly, the starting point’s position is determined, and then the robot arm is equipped with a visual inspection frame to collect the image area by area. The moving speed of the robot is 500–800mm/s, the size of a single-frame image is 150 × 180 mm, the motion trajectory is used to determine the scanning direction, and then line-by-line inspection is started until surface image acquisition for the whole composite component is completed.
Moreover, carbon fabric prepregs may experience buckling due to pressure during the preform process, resulting in varying degrees of in-plane deformation in different regions. The distribution of the warp (weft) weave points in defect areas is irregular, while other areas without defects still conform to the weaving rules of the design. Therefore, it is necessary to extract defect features from the image, establish feature vectors, and achieve rapid defect localization during the preforming process, as shown in
Figure 5b,c. Firstly, based on the distribution characteristics of the latitude and longitude organization points (black-and-white block grids), the defective image is compared with the defect-free image pixel by pixel in numerical terms. Measurement indicators (ACC = (TP + TN)/(TP + FN + FP + TN)) are used to calculate the accuracy of each 4 × 4 pixel area. The complete accuracy matrix M
ACC of the image is obtained by integrating all areas. Finally, the element values of the precision matrix M
ACC are compared with the defect segmentation matrix M
LOC. According to the results of the comparison, the non-defect area and the defect area are divided into two subsets, M1 and M2, respectively. Then, the minimum submatrix G2 containing all elements within the M2 region as the target matrix for the defect area is constructed, and the contours of the defect area are extracted through the following boundary tracking algorithm.
The rules of the boundary tracking algorithm are shown in
Figure 6. Firstly, the element with the smallest row and column values in the
M2 index area is defined as the starting point for boundary tracking. Then, the eight neighboring adjacent points of the starting point are explored, and a clockwise element-by-element judgment is performed from the twelve o’clock direction to determine whether it is a boundary point. If it is a boundary point, the loop is terminated, and this point is marked as the starting point for the next boundary tracking and placed in the boundary matrix. If it is the previous boundary point, it is rotated 180° counterclockwise for edge searching until the next boundary point is found or coincides with the starting point. Using this rule, we search for all boundary points in sequence and then extract the index values of all elements in the boundary matrix to define the defect boundary set
D. All elements in the set are connected to obtain the contour of the defect area. Then, the defect boundary set
D is used to find the center position of the defect according to the following rules:
Step 1: Traverse all elements of D, calculate the distance between all two elements, and return the two elements with the largest distance.
Step 2: Set the line segment D2D8 connecting these two elements as the initial diameter of the circumcircle and obtain the initial center O1.
Step 3: Calculate the distance from all other elements to the center O1. If they are all less than or equal to the radius of the initial circle, O1 is the center position of the defect.
Step 4: If there are other elements whose distance from the initial center of the circle is greater than the initial radius of the circle, then this element and the initial two elements are rounded at three points, and the position of the minimum circumcircle center O2 is determined again.
Step 5: Repeat step 3 until the center position of the minimum circumcircle is found, which is the center position of the defect.
Finally, based on the current position relationship between the camera and the defect center in the world coordinate system, the motion control system can interpolate the two coordinates to rapidly position the defect center.
3. Results and Discussion
The acquisition and processing of high-quality images are essential for extracting surface defects during the preforming process for CFRP components. Nevertheless, several challenges arise in the actual detection process. Firstly, a preforming process workshop typically employs a brightfield light source installed on the roof, leading to an uneven distribution of illumination across the detection target. Additionally, the movement of the wire winding device generates trailing shadows on the surface of the prepreg, resulting in light spots, noise, and impurities that detrimentally impact the imaging quality. Finally, the prepreg is a woven fabric produced by impregnating continuous fibers with a resin matrix under strictly controlled conditions. Each bundle of carbon fiber yarn in the prepreg can contain thousands of fibers. When light strikes the surface of the prepreg, its dense layered structure creates multiple optical reflection layers, leading to overexposure and compromising the quality of image collection. To address the above problems, this study proposes a machine vision detection framework building upon previous research findings [
44], as depicted in
Figure 7, which leverages visual illumination techniques such as darkfield, low-angle, and linear symmetry lighting [
45]. The framework mainly consists of a camera, a servo motor, an LED source, and an angle adjustment and slewing mechanism. An angle-adjustable cantilever driven by a servo unit is used as the main motion structure. It can dynamically switch between darkfield, low-angle, linear symmetric light and multi-angle stereo vision light and can adjust and transform the relative position of the light source in the process of detecting surface defects so that it is convenient to extract the three-dimensional space position of the projection image and the shooting field of view, the pitch angle of the shot, and other parameter information. In addition, the flange at the end of the device can be installed in the end effector of any automatic preforming system, achieving collaborative work between automatic preforming and automatic detection.
In order to evaluate the detection performance of the proposed method in this article, the visual inspection system collected 1500 images of different types of prepregs on site as the experimental samples. The collected images were 256 colors with a resolution of 1440 × 1080, and there were nine patterns with typical features, as shown in
Figure 8. The experiment comprised two steps: The first stage was to apply grayscale integration projection to the warp and weft yarns of the feature-enhanced image to obtain pixel grayscale projection images and then extract the number of warp and weft yarns in the image through the DFT method to detect material parameters such as density and size. In the second stage, the proposed ACD revert algorithm was applied to transforming the feature enhanced image into an ACD image, and then the defect patterns were distinguished through clustering methods. We demonstrate the feasibility and accuracy of this method for defect detection, location, and classification in detecting the three-elementary woven structure of a carbon fabric prepreg.
Furthermore, this paper describes the approaches to capturing surface images of CFRP prepregs during component preparation; presents identification results for three basic woven structures; details the defect recognition and classification outcomes; and evaluates the performance of the proposed automatic detection method. The three types of testing samples were 1/1 plain, 2/2 twill, and 4hs satin, and they were obtained from Weihai Guangwei Composite Material Co., LTD. These fabric styles had identical fabric parameters in terms of the number of fibers per tow, the number of fibers per inch in the warp and weft directions, and fabric weight (g m
−2). The fabric parameters are listed in
Table 1. The image, which was captured using a CCD camera (MV-CH050-10UM, HIKROBOT), had 8-bit gray levels and was 896 × 702 pixels wide. The platform was built using Python 3.9 and OpenCV modules with an i7-8565U (1.8 GHz) CPU and 16 GB of RAM.
3.1. The Results and Analysis of Warp and Weft Yarn Detection
Six types of carbon fabric woven prepreg patterns were collected on site, and
Table 2 shows a comparison of the results between the automatic detection algorithm proposed in this paper and the manual detection by professionals. Using the results of manual detection as the experimental truth, it can be seen that the error in the number of warp and weft yarns detected automatically is relatively small. The error rate for the defect-free pattern is less than 1%, and the plain-weave defect-free pattern has the smallest error rate. The error rate for patterns with defects is slightly higher, with the largest being that fir satin-weave (defect) patterns, but this error rate is only 2.12%. This is due to the different stacking stability of different surface structures. When defects occur, structures with poor stability are prone to yarn fluctuations, which can have an impact on automatic detection. But it does not affect the overall detection effect because the detection method in this paper divides the target into blocks for detection, and the yarn parameters of the same prepreg remain unchanged. The detection data for defect-free areas can be extracted to replace the data for defect areas, and these errors are maintained within a small range. The data extraction process for the automatic detection of yarn quantity is illustrated further in
Figure 9: grayscale integration projection is performed on individual warp and weft yarns in the three original tissue structure images. This shows that in plain-weave images, the gaps between warp yarns are brighter and have larger grayscale pixel values compared to those for the warp yarn axis, while the gaps between weft yarns are dimmer and have smaller grayscale pixel values compared to those for the weft yarn axis. This rule also applies to twill-weave images, but the warp and weft weave points in twill-weave images present a diagonal structure at a certain angle on the fabric’s surface, so there is a texture of diagonal yarns in the gaps, and the brightness and darkness of the gaps are not as obvious as in plain-weave. The difference lies in the satin pattern images, where the warp yarns of the satin fabrics are denser than the weft yarns, resulting in more pronounced gaps between the weft yarns. The gaps between the warp yarns exhibit a texture of alternating light and dark, and both types of gaps have differences in their grayscale values with their corresponding yarns.
Furthermore, grayscale integration projection was applied to all warp and weft yarns in the three-elementary woven structure images, as shown in
Figure 10. It can be seen that the curve follows the superposition of the grayscale distribution patterns of single rows or single columns mentioned above, showing the periodic distribution pattern of the time domain signal. The frequency of occurrence of the local maximum or minimum values is the same as the number of yarns in the corresponding image. Although the horizontal and vertical grayscale projections have obvious peaks and valleys, the range of the peak changes in different areas of the curve varies greatly, and there is also interference from noise peaks and valleys. Therefore, it is necessary to apply the one-dimensional DFT to the grayscale projection integration signal to detect the number of yarns with different surface structures, as shown in
Figure 11. The maximum amplitude frequencies of the warp and weft yarns can be found to be 32 and 26, respectively. This means that the number of warp and weft yarns in the image is 32 and 26, which is the same as the actual number of warp and weft yarns in
Figure 8. Therefore, in the discrete signal of the grayscale projection curve of the weft yarn (warp yarn) with a length N of the image height (width), for the pixel index sequence
k = (0, 1, 2…), the maximum weight of the triangular wave component that vibrates for k cycles within the length N is found to be the number of weft yarns (warp yarns) present in the image, and thus the yarn quantity value can accurately be obtained. In summary, the frequency corresponding to the point with the highest amplitude in the spectrum is the number of cycles of the warp or weft yarn.
3.2. The Results and Analysis of Defect Morphology Recognition and Detection
In order to verify the effectiveness of defect recognition and classification, 200 samples of bubbles and wrinkles with different texture structures were selected from the collected image set. The defect morphologies were allocated at a ratio of 6:4, 5:5, and 4:6. The initial and final center points of the clustering results are shown in
Table 3 and
Table 4, respectively.
Three different internal validation indices were used to evaluate the clustering performance and find the optimal clustering center: the Davis–Bouldin Index (DBI), the Calinski–Harabasz Index (CH), and the silhouette coefficient (SC) [
46]. The DBI is the ratio of the sum of the intragroup distance and the intergroup distance. The smaller the DBI value, the better the clustering effect. The CH is the ratio of the spacing between classes to the compactness within a class. The SC combines the cohesion and separation of the clusters. The larger the CH and SC values, the closer the clusters are to each other, and the more dispersion within the clusters, the better the clustering results that can be obtained. A comparative analysis of the clustering indices is shown in
Table 5. It can be observed that within the same surface structure, there is little difference in the clustering index among samples with different defect morphology ratios, with the best clustering effect observed at a 6:4 ratio. Therefore, a clustering center with a ratio of 6:4 is considered the final aggregation center in various weaving structures.
Furthermore,
Figure 12 shows the images collected and detected by the visual platform designed in this paper at the actual production site. It can be clearly seen from the human–computer interaction interface that the defect area has been boxed out. By comparing this with the actual center position in the two-dimensional image modeling, the deviation from the defect center, the recognition rate, and the detection speed are shown in
Table 6. From the perspective of the defect types, the average position error for wrinkle defects is higher than that for bubbles. This is because the volume of wrinkles is larger than that of bubbles, resulting in a higher degree of fiber buckling. From the perspective of the weaving structure, plain-weaves have high stability, low formability, and the smallest average positional errors. On the contrary, satin-weaves have better formability and are more prone to being affected by the defect morphology, resulting in the highest average positional error. The overall central error for all samples in the table is 3.244%. This is because there is a significant deviation in the defect edge position, which affects the overall central error but does not affect the main position of the defect.
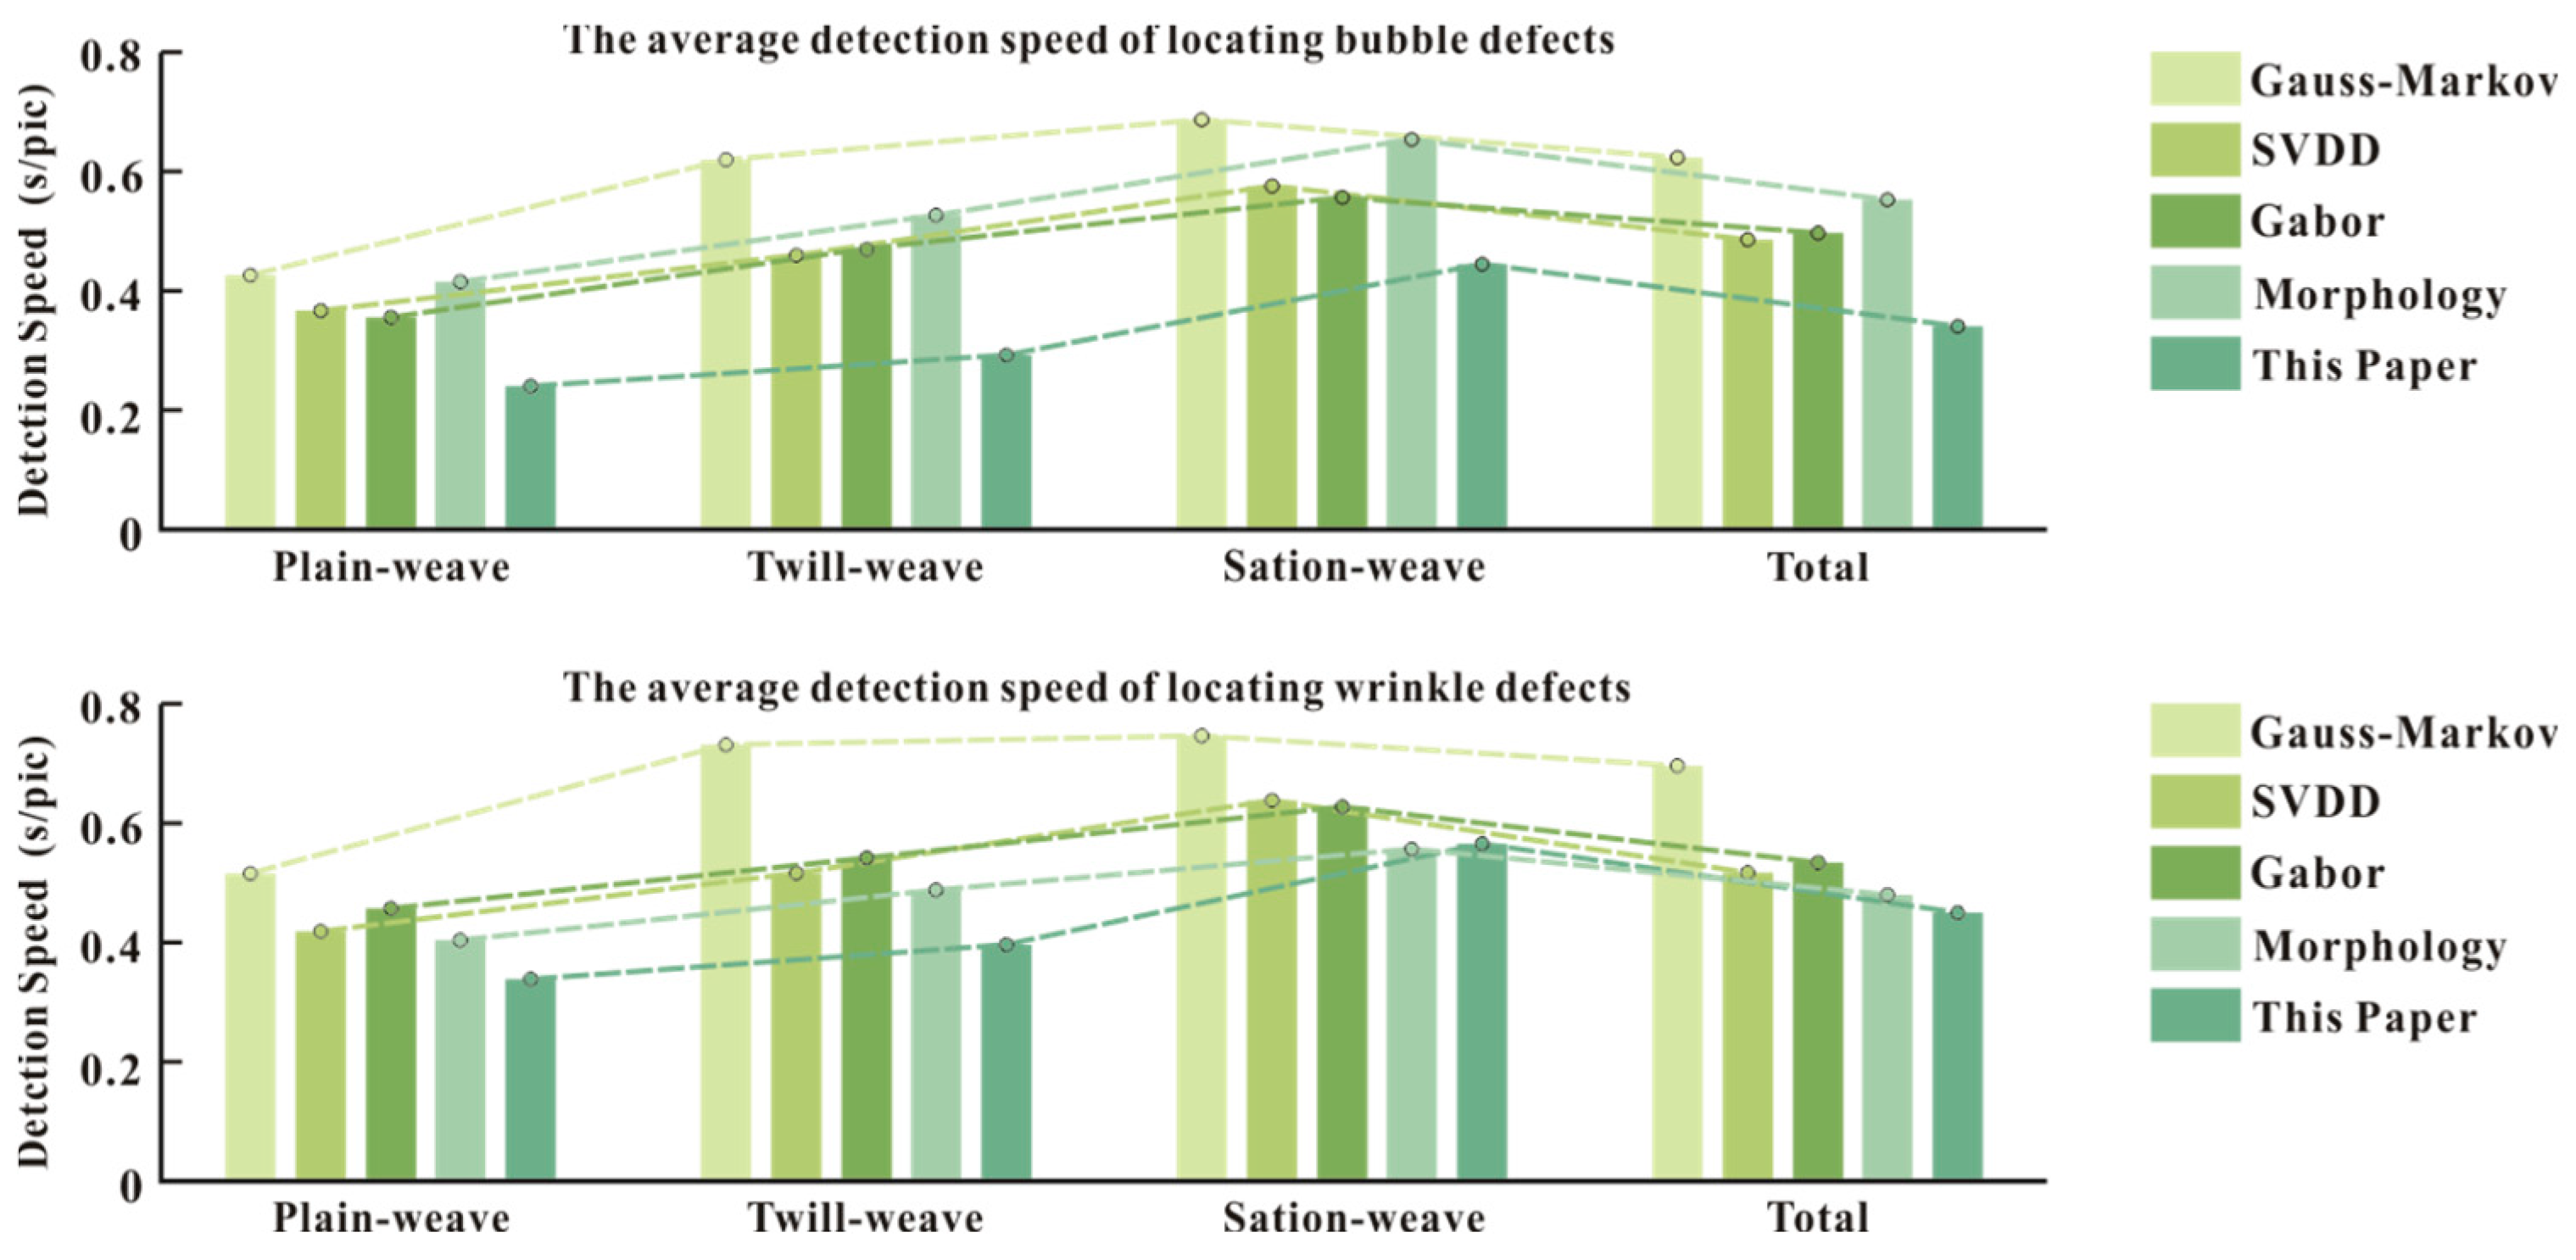
The defect detection performance of this method is evaluated by comparing its running time and accuracy with those of four other commonly used fabric defect localization methods. The defect detection speed for bubble and wrinkle defects is shown in
Figure 13, and a comparison of the defect detection accuracy is shown in
Table 7. The Gauss–Markov method [
34] matches the distribution of the models through defect-free texture models and defective texture models. Although it can accurately describe the surface textures, implementation of the algorithm involves a large computational load, complex data processing, and a high average running time. The Support Vector Description (SCDD) method [
47,
48] is a type of dictionary learning method that reduces the dimensionality of the projection matrix and applies the Support Vector Machine (SVM) method to defect localization and description. However, the adaptability of this method is not high. The Gabor transform method [
49] is a commonly used method in spectral analyses which comprehensively considers the relationship between the local and global characteristics of the image. However, its localization effect relies too much on filters, and the defect localization effect in complex texture images is poor. Morphological methods [
50] utilize the differences in the grayscale distribution characteristics between defect areas and the overall image for localization, which is a common form of spatial statistical method. But the image noise has a significant impact on the localization performance. This paper uses precision matrices for threshold segmentation, element comparison, and defect localization. By maximizing the texture feature values, the data volume is greatly compressed. From the figures and tables, it can be seen that the detection speed (0.38s/pic) and the detection accuracy (97.02%) of our method for defect localization are superior to those of other methods. Therefore, the proposed machine vision framework and method can be applied to real-time CFRP preform inspection in the composite manufacturing and aerospace/automotive sectors. Future work could enhance its robustness via multi-sensor fusion and Industry 4.0 integration.
4. Conclusions
This study establishes a scientific correlation between anomalies in yarn alignment and machine-vision-based texture analyses in CFRP preforms, providing new insights into the mechanisms of defect formation in composite materials from the perspective of materials science. It reveals that removing the zero-frequency component from the projection curves enables precise identification of the warp/weft yarn cycle numbers via a frequency spectrum analysis, while the ACD revert method effectively distinguishes complex surface textures from defects.
The developed machine vision framework integrates five preprocessing algorithms, grayscale integral projection with the DFT for yarn detection, texture structure recognition via the ACD revert, and an LDA-based defect boundary tracking algorithm. This framework achieves the real-time detection of surface yarn alignment defects in CFRP preforms with a 97.02% recognition rate and a 0.38 s per image processing time, outperforming the traditional inspection methods.
The proposed method provides an engineering solution for automated quality control in composite manufacturing, enabling data-driven defect localization and classification in industrial production lines. Its modular design supports its integration with robotic inspection systems, facilitating real-time monitoring during CFRP component preforming to prevent the degradations in structural quality caused by yarn buckling and in-plane deformation.


