Article

Micromechanical Analyses on Three-Dimensional Response of Compressive Failure in Unidirectional CFRP

1
Department of Mechanical Engineering, Nippon Institute of Technology, 4-1 Gakuendai, Miyashiro-Machi, Minamisaitama-gun 345-8501, Saitama Prefecture, Japan
2
Department of Mechanical Engineering, Meiji University, 1-1-1 Higashi-Mita, Tama-ku, Kawasaki-shi 214-8571, Kanagawa Prefecture, Japan
3
Aviation Technology Directorate, Japan Aerospace Exploration Agency, 6-13-1, Osawa, Mitaka-shi 181-0015, Tokyo, Japan
*
Author to whom correspondence should be addressed.
J. Compos. Sci. 2025, 9(6), 265; https://doi.org/10.3390/jcs9060265
Submission received: 1 April 2025 / Revised: 25 April 2025 / Accepted: 28 April 2025 / Published: 27 May 2025
(This article belongs to the Special Issue Carbon Fiber Composites, 4th Edition)

Abstract

:
Significant reductions in the compressive strength of CFRP are attributed to a specific failure process, which is a combination of the compressive failure of fibers and the shear failure of the matrix. To further understand the mechanism of compressive failure, micromechanical numerical models were developed to reproduce the three-dimensional response, consisting of contraction by the compressive load and in-plane and out-of-plane shear deformation due to the rigid rotation of broken fibers. The feasibility of the model was confirmed by comparing the numerical results to theoretical results. The validated models were used to investigate the failure response under not only compressive loading but also in combination with in-plane and out-of-plane shear loadings. The variation in fiber misalignments and the strength of fibers were considered. The numerical model reproduced the trend of results from experiments in previous studies, in which the compressive strength of CFRP decreased with the increase in fiber misalignment. Moreover, the present results reveal that the ratio of in-plane and out-of-plane shear loadings is an important factor for the compressive strength and direction of shear deformation induced by compressive loading.

1. Introduction

Unidirectional carbon fiber-reinforced plastics (CFRPs), nowadays, play a fundamental role in building light-weight structures of flight vehicles without losing strength and stiffness in the aerospace industry [1]. Carbon fiber is one of the strongest materials on earth and, thus, makes CFRP significantly strong when used as reinforcement for polymer matrices, being as strong as steel at less than 70% of its weight [1].
However, the distinctive characteristics of the narrow shape of the fibers inevitably reduce the compressive strength. It is often reported that the strength of CFRP under compressive loading is less than half of that under tensile loading [1]. A schematic of the failure process reported in the literature [2] is shown in Figure 1. When CFRP is subjected to compressive loading, the fiber is mainly broken as a result of the stress concentration due to small misalignment. The broken fibers with inclination to the loading direction cause shear stress in the matrix. When the shear stress exceeds the allowable value, the fibers start to rigidly rotate. The region formed by this failure process is called the kink-band and is reportedly the main cause of the reduction in compressive strength [2].
The relationship between compressive strength and the kink-band has long been studied with physical experiments. Rosen first studied the formation of the kink-band in experiments on specimens with carefully aligned fibers [2]. Chaplin et al. showed that the compressive strength of CFRP was governed by shear failure and can be expressed as a function of the shear modulus of the matrix and fiber volume fraction [3]. Harn et al. conducted compressive tests with specimens with various types of fibers, including carbon and E-glass fibers. It was successfully observed in the study that debonding between the fibers and matrix followed fiber buckling [4]. Kyriakides et al. showed that compressive strength is highly dependent on the misalignment of fibers [5]. High-resolution video recording conducted by Moran et al. revealed the detailed process of compressive failure, supporting the hypothesis that shear failure and subsequent kink-band formation represent the dominant mode of compressive failure [6].
Since the effect of the kink-band on the reduction in compressive strength has been considerably revealed through many studies [7,8,9,10,11,12], one of the important points to be clarified further is the interaction between the kink-band and other failure modes, such as matrix cracks and delaminations. Figure 2 shows the cross-section of CFRP after compressive failure [13]. Scanning electron microscopies from in-plane and out-of-plane directions are shown in Figure 2a and Figure 2b, respectively. It is likely that the matrix crack above the kink-band in Figure 2a developed from the kink band due to in-plane shear deformation. Similarly, it can be presumed that the delamination in the vicinity of the kink-band in Figure 2b occurred due to the out-of-plane shear deformation of the kink-band. Although Schultheisz et al. mentioned longitudinal cracking in the matrix during compressive failure in their literature review [14], it is not the case that studies focusing on this issue are sufficiently conducted.
Theoretical models for predicting compressive strength were developed with the consideration of kink-band formation. Budiansky et al. proposed an analytical model in which all fibers were aligned with the inclined direction from compressive loading and obtained an expression of compressive strength [15]. Kyrakides et al. obtained a similar expression for strength and demonstrated its validity by comparing the analytical results and physical experimental results [5]. Budiansky et al. expanded their theory to express the propagation of the kink-band and proposed an expression for shear deformation under compressive loading [16]. Hsu et al. proposed an expression for the contraction of the composite in the direction of compressive loading [17]. Soutis proposed an analytical model to predict fracture toughness under compressive failure by considering dissipated energy during the failure process [18].
Due to the complexity of the process of compressive failure, there are limitations in theoretical analyses when trying to fully reproduce the phenomena. Thus, numerical models intended to fill the gaps were proposed [19,20,21,22]. However, the methods discussed in these studies are limited to two-dimensional problems, although one of the models proposed by Pinho et al. copes with in-plane response on a plane inclined from the loading direction [18]. A micromechanics numerical model proposed by Naya et al. showed the failure process in detail, including the formation of a kink-band [23]. Herraez et al. expanded the model considering the debonding between fibers and matrix and the interfacial properties obtained by specially designed tests for the purpose [24]. Although some studies adopted a similar approach of the micromechanics numerical models [25,26,27], there are still no studies that address the compressive failure response considering three-dimensional in-plane and out-of-plane shear, which appear to be important factors for matrix crack and delamination developed from the kink-band. The differences between numerical models in the abovementioned studies are summarized in Table 1.
It was also reported that the strength of CFRP is sensitive to defects caused by machining processes such as drilling [28]. Therefore, novel machining methods have been actively studied to reduce the manufacturing defects [29]. In addition to the removal process, the additive manufacturing of CFRP has significantly progressed. By using 3D printers, unidirectional CFRP is not only used as a shell structure, which is fabricated by the conventional manufacturing process using prepreg sheets, but also as a bulk structure with complex shapes. In a 3D printer for continuous fiber-reinforced composites with the Filament Deposition Modeling (FDM) method, thermo-plastic resin heated to the melting temperature and continuous fibers are simultaneously provided through a moving nozzle. The position of the nozzle is numerically controlled so that the materials fed from the moving nozzle form a layered structure [30]. Although the manufacturing method significantly increased the flexibility of shapes of CFRP products, many challenges remain from the viewpoint of mechanical characteristics. One of the important disadvantages of this approach is its strength, which necessitates detailed studies [31]. In the previous studies, it is reported that the strength is significantly affected by the fiber waviness. Because the continuous fiber cannot be placed without curvature in the structure with this manufacturing method, the fiber easily buckles under compression. Therefore, it is difficult to make this material as strong as conventional CFRP [30]. If a clearer understanding of the relationship between strength and fiber waviness, which is one of our important goals, can be achieved, it will contribute to the research field of the manufacturing process.
To make more meaningful steps for understanding the interaction between the kink-band and other failure modes as addressed above, the three-dimensional failure response under compressive loading must be further investigated. Since no numerical model that can cope with such a problem has been proposed yet, as shown in Table 1, this study aims to develop a numerical model that has the required capability to reproduce the response of the compressive failure. Specifically, the developed models are used to three-dimensionally express a combination of deformations in in-plane and out-of-plane directions due to the failure under not only simple compressive loading but also combined loadings of compression and shearing.
This paper is organized as follows. In Section 2, the developed numerical models are described from the aspects of geometry, constitutive equations for constituents of the composite and boundary conditions. In Section 3, the feasibility of the proposed model is validated by comparing the numerical and theoretical results. In Section 4, numerical analyses are conducted using a model with various parameters to determine the important factors affecting the response during the process of compressive failure.

2. Numerical Models

2.1. Geometry and Finite Element Mesh

Carbon fiber-reinforced plastics consisting of unidirectional carbon fiber and epoxy resin as matrix were modeled by a commercial FEA solver, MSC Marc 2023 (MSC Software, Newport Beach, CA, USA). A numerical model of the microstructure of the material system was developed as shown in Figure 3. Under an assumption that the material system had periodic microstructure, one unit of the periodic microstructure was extracted as a Representative Volume Element (RVE). The RVE size was determined by fiber volume fraction vf = 60%. The coordinate system was selected so that the fiber orientation and thickness direction were along the x and z axis, respectively. Axis y was aligned to the transverse direction of the lamina.
Fiber misalignment was incorporated by sinusoidal function with amplitude aT and cycle λL, expressed as
m x = a T 2 sin   ( 2 π · x λ L )
Since it is reported that fiber misalignment mainly occurs in the in-plane direction during the manufacturing processes of laminates [4], the amplitude of misalignment was placed in axis y. This model normally deforms in the xy-plane when subjected only to compressive load in the x direction, and it can be simulated in a two-dimensional manner. In the present model, however, the effect of shear stress from the surrounding material is studied three-dimensionally by applying shear loading in the xy and zx plane that cause in-plane and out-of-plane shear deformations, as discussed in a later section.
Eight-node isoparametric hexahedral solid elements were used for the fibers and matrix. A finer mesh was used in the radial direction of the fiber than in the longitudinal direction to capture the stress distribution due to the bending deformation of the materials. A thin layer of eight-node cohesive elements was inserted between the constituent materials.
Because a significant number of repetitive computations with different values of parameters were required in the present study, the number of meshes was determined so that the computational cost could be reduced as much as possible, without significant loss of accuracy. The numbers of elements and nodes adopted in this study were 12,336 and 16,041, respectively. To verify the mesh density was appropriate, a model with 22,896 elements and 26,841 nodes, which had almost doubled mesh density, was analyzed. It was confirmed that the change in the maximum longitudinal stress of the fiber due to the refinement of mesh was about 1.4%, despite the fact that the model with fine mesh required 35% longer CPU time. Therefore, the abovementioned mesh was adopted for all analysis in the following sections.

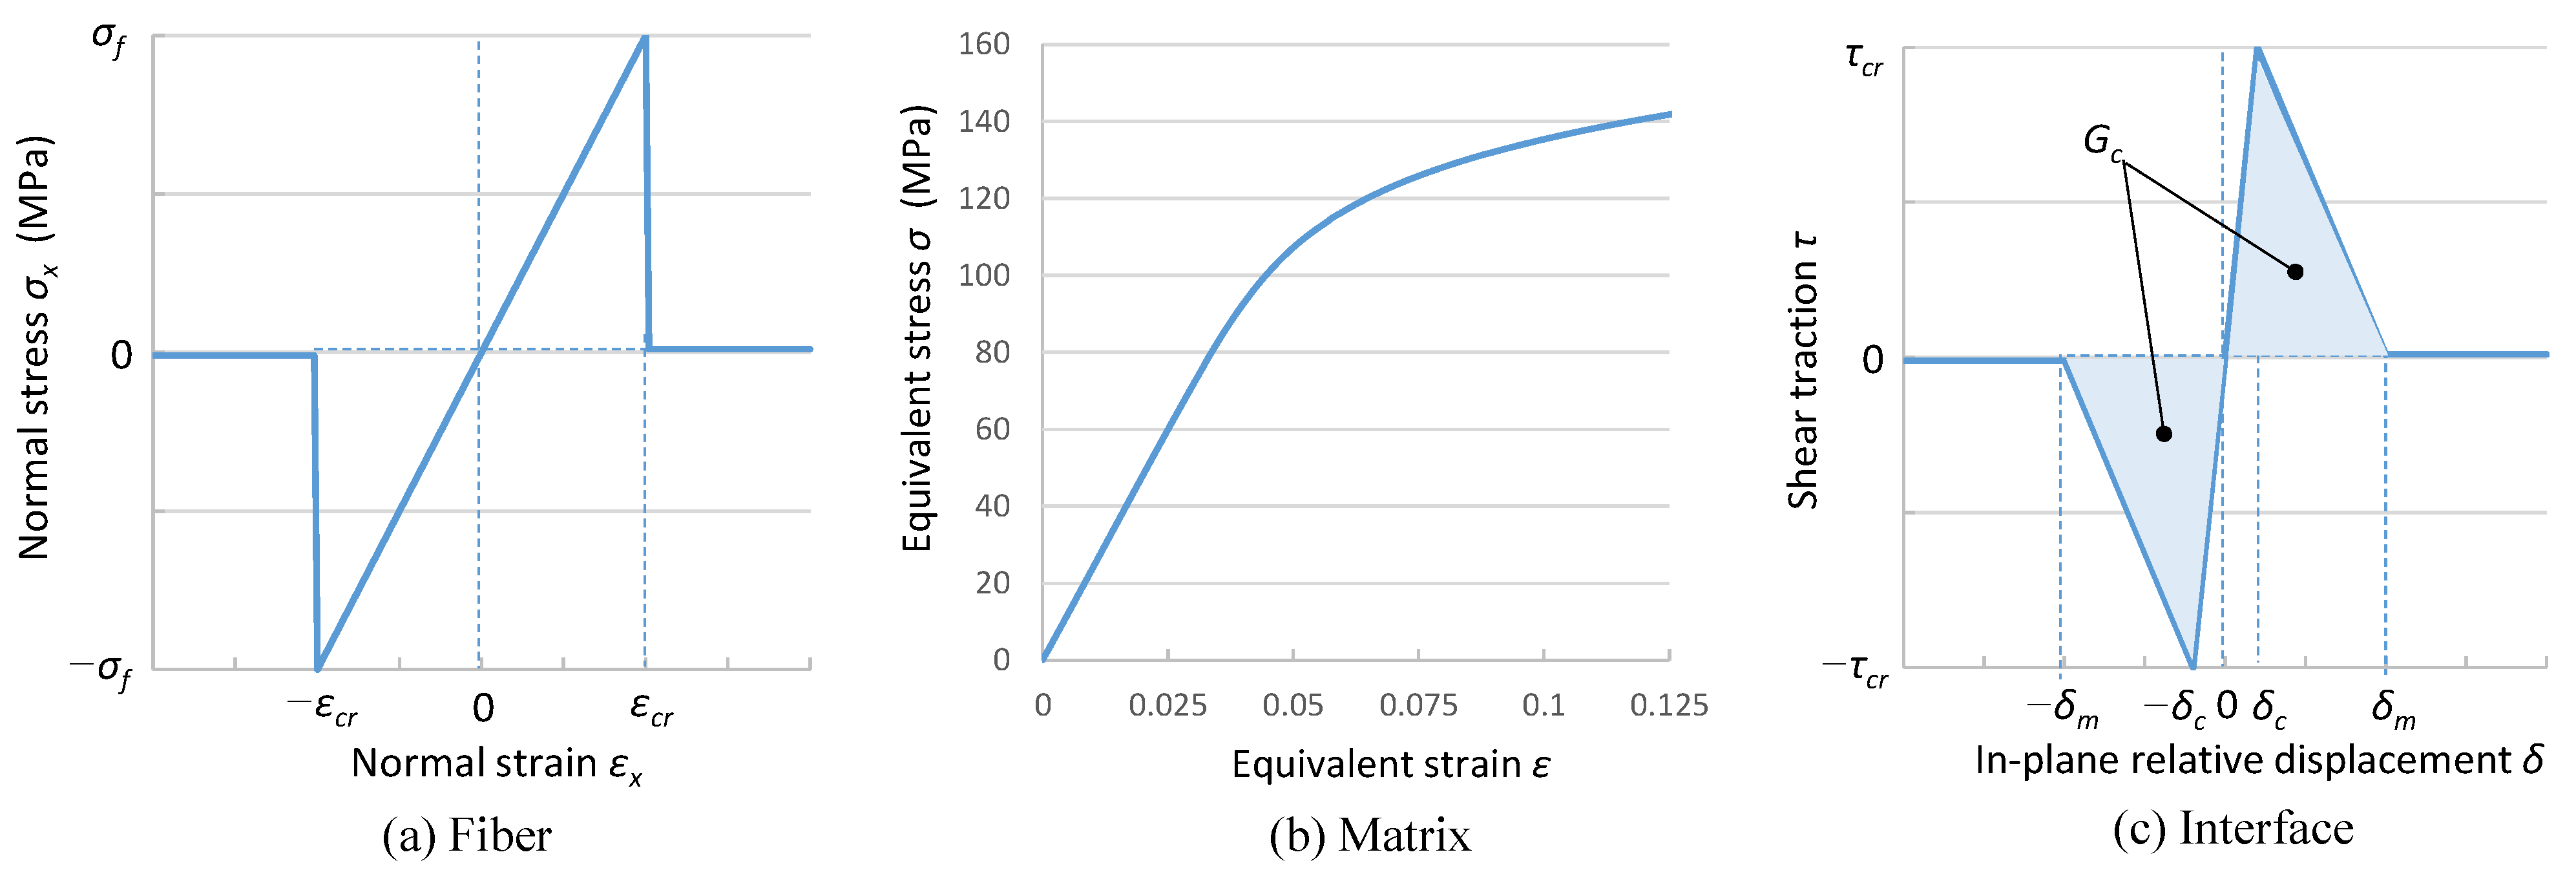
2.2. Material Models of Constituent Materials

The nonlinear response of the constituents of this material system was incorporated into the model as follows. The carbon fibers were modelled using a linear isotropic elastic material considering the allowable stress, as shown in Figure 4a. The mechanical properties of the material models are shown in Table 2. To model fiber breakage by compressive and tensile stress due to bending deformation and stiffness of the fiber was decreased to 1/1000 of the original value once the normal stress reached the threshold, i.e., the strength of the fiber. The effect of the fiber strength was studied by using two different values of the strengths, σf = 1.0 GPa and 3.0 GPa.
The matrix resin was modeled as an isotropic elastic–plastic material with the Von-Mises yield function. As shown in Figure 4b, the hardening curve was fitted to the result of the tensile test of Epoxy resin in [32] with the Ramberg–Osgood relationship [33]
ε m = σ m E m + α σ m E m σ m σ 0 n 1
The failure of the fiber–matrix interface was considered by inserting cohesive elements. As its constitutive model, the bilinear traction-relative displacement relationship of the Dugdale model was adopted, as shown in Figure 4c. The area below the curve corresponds to the dissipated energy during a unit area of crack growth, i.e., fracture toughness of the interface Gc [34].

2.3. Boundary Conditions

It is important to apply appropriate boundary conditions to model the response of the periodic microstructure by using RVE. There are three pairs of oppositely faced surfaces when the RVE is modelled as a hexahedron. In our case, the surfaces are numbered so that the surfaces normal to the x, y and z axes are number 1, 2 and 3, respectively. The numbers on opposite surfaces of the pairs range from 4 to 6. Representative nodes corresponding to each surface were assigned, as shown in Figure 5a.
The deformed shapes of the oppositely faced surfaces should be continuous under the assumption of the periodicity in the microstructure. Therefore, the following conditions must be satisfied on the surface of the RVE.
u i + 3 u i = u ¯ i + 3 u ¯ i
v i + 3 v i = v ¯ i + 3 v ¯ i   ( i   = 1 ,   2 ,   3   )
w i + 3 w i = w ¯ i + 3 w ¯ i
where u, v and w are displacements in the RVE along the x, y and z axes, and u ¯ , v ¯ and w ¯ are displacements of the representative nodes. The subscripts represent the number of the surfaces. These conditions were incorporated in the model by the multipoint constraints (MPC) in the FEA code [35]. However, the conditions on the edges and corners of the RVE cannot be straightforwardly applied using Equations (3)–(5) because they are intersections of the two or three surfaces of the RVE. The equations for MPC had to be modified by removing redundant terms from the system of the equations, as shown in Figure 5b,c.
We analyzed the longitudinal response under compressive normal stress and its dependency on in-plane and out-of-plane shear loadings from the surrounding material, as mentioned before. The boundary conditions to apply these conditions are defined on the representative nodes of the RVE, as shown in Figure 6. Compressive loading was applied by enforced displacement at the first and fourth representative nodes. In-plane shear loading was subjected by applying point loads on the second and fifth representative nodes in the x direction. Similarly, out-of-plane shear loading was applied through point loads at the third and sixth representative nodes.
The loading sequence is shown in Figure 7. Shear loading was applied before application of the compressive loading in order to ensure the shear loading was maintained at its maximum value during the compressive failure. First, the shear loading was applied to the level shown as point (a) in the figure without compressive loading, and slight shear deformation was caused. Then, the compressive loading was applied to the level of point (b) in the figure while maintaining its maximum shear loading value.

2.4. Evaluation of Results

As well as stress and strain at the microscopic scale, macroscopic stresses and strains were evaluated based on the quantities calculated on representative nodes as follows.
The macroscopic stress is considered the average value of the microscopic stress in the RVE. Because the reaction forces calculated on the representative nodes are integral values of stress acting on the corresponding surface of the RVE, the macroscopic stress can be obtained by dividing by the surface area, which is expressed as
σ ¯ x = p ¯ 1 A 1
where p ¯ 1 is the applied load on the first representative node, and Ai is the areas of the ith surface of the RVE. Other components of stress can be similarly obtained as
τ ¯ x y = p ¯ 2 A 2
τ ¯ z x = p ¯ 3 A 3
where p ¯ 2 and p ¯ 3 are reaction forces on the second and third representative nodes, which correspond to the shear loads in xy and zx planes, respectively.
Strain components were evaluated from displacements of the representative nodes, which are average displacements on the corresponding surfaces. Based on the definition of engineering strains, the components of macroscopic strains are approximately obtained as
ε ¯ x = u x u ¯ 1 l x
γ ¯ x y = u y + v x u ¯ 2 l y + v ¯ 1 l x
γ ¯ z x = u z + w x u ¯ 3 l z + w ¯ 1 l x
where lL, lT and lZ are the length of the RVE in corresponding axes.

3. Validation

In this section, the results of the present numerical results are compared with a theoretical model to validate the feasibility of the proposed model. The theoretical model developed by Hsu et al. [17] was chosen because it was reported in the literature that the results well reproduced the results of the experiments.

3.1. Theoretical Model

Budiansky et al. [16] proposed a theoretical model under the assumption that the fiber remained straight and constantly inclined from the loading direction. When the fiber is initially inclined with angle θ0, the relationship between applied compressive stress σ ¯ and induced shear strain γ ¯ is obtained from mechanical equilibrium as
σ ¯ = G ^ σ e m γ ¯ θ 0 + γ ¯
where G ^ is expressed as a function of equivalent stress in the matrix, as discussed below.
As already mentioned in Section 2.2, the nonlinear stress–strain response of the matrix is expressed with the Ramberg–Osgood relationship, which is written as Equation (2). By incorporating the secant modulus E ^ m , the relationship can be expressed as
σ m = E ^ m σ e m ε m
where the equivalent stress σ e m is calculated by
σ e m = σ m 2 + 3 τ m 2
By applying the rule of mixture, the shear modulus of the composite is obtained as
1 G ^ σ e m = v f G f + 1 v f E m 3 E m E ^ m σ e m + 2 ν m 1
The relationship between the applied compressive stress σ ¯ and induced shear strain γ ¯ can be obtained by iteratively solving Equations (12) and (15).
Hsu et al. expanded the theory of Budiansky et al. and proposed a formula for the contraction of a material considering the inclination of the fiber by the applied compressive stress, expressed as [17]
ε ¯ = θ 0 γ ¯ + 1 2 γ ¯ 2 + ε
In our numerical model, the fiber misalignment is expressed by the amplitude of the sinusoidal curve aT. Therefore, the conversion from the amplitude aT to the initial angle θ0 is approximately conducted by an expression for the maximum slope of Equation (1), written as [16]
θ 0 m x x x = λ L = a T π λ L

3.2. Comparison Between Numerical and Theoretical Models

The relationship between macroscopic normal stress and strain in the longitudinal direction is shown in Figure 8a, and the relationship between macroscopic normal stress and shear strain induced by compressive loading is shown in Figure 8b. The dashed line indicates the theoretical result with fiber misalignment aT = 2 μm, and the solid blue line indicates the numerical results of the present model with the same misalignment. The relationship between σ ¯ and ε ¯ plotted in the figure was calculated using Equations (12) and (16), with the parameters described in Section 2.2. A case with a larger misalignment is also shown in red as a reference.
The initial elastic response of the numerical results agreed well with the theory because the elastic response was dominantly influenced by the rule of mixture. The numerical model reproduced the maximum stress of the theoretical model. Normal and shear strains at the peak point were calculated in the present numerical analysis with a small difference from the theory, which is less than 10%.
However, since constantly increased compressive displacement was applied as a boundary condition of the present numerical model, the snap-back of the displacement observed after the peak point in the theoretical model could not be reproduced in the numerical model. Instead, the displacement in the numerical model leaped to the equilibrium state with the increased displacement. This result is natural because it is quite difficult to trace the decrease in both stress and strain in physical tests, and the same response in the present numerical result can be observed in a compressive test with displacement-controlled loading. After the point of the leap, the relationships between compressive stress and normal strain and that between the stress and shear strain were correctly captured.
These results indicate that the feasibility of the present numerical model was considered to be acceptable. The response of compressive failure under different conditions is discussed using this numerical model in the next section.

4. Results and Discussions

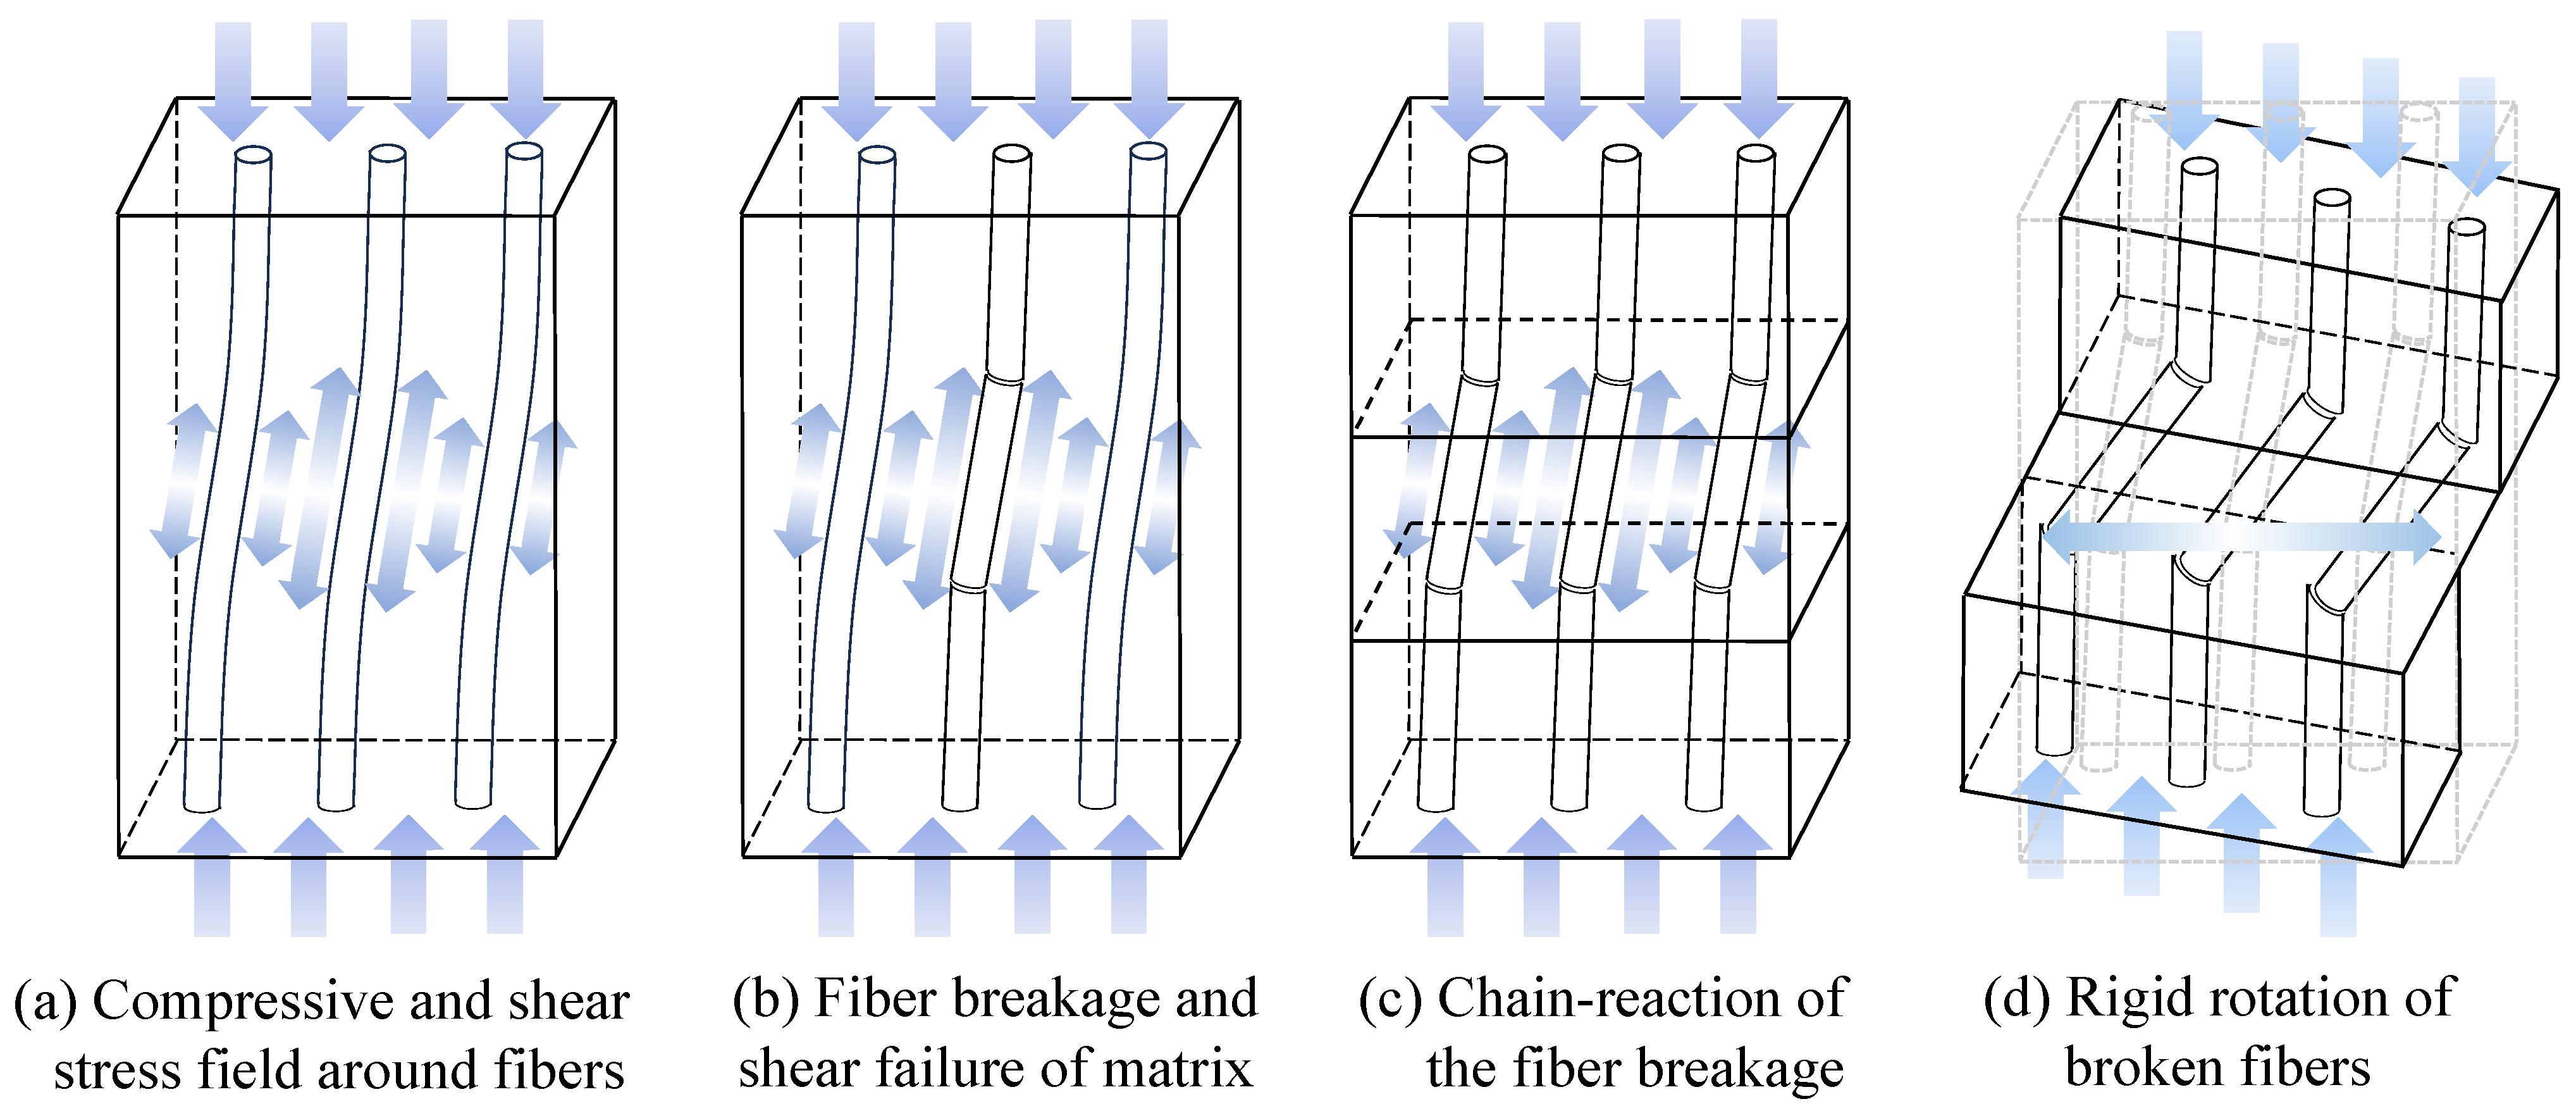
4.1. Process of Compressive Failure

The relationships between stress and normal strain and those between stress and shear stress are plotted in a single graph on the left in Figure 9. In the graph, the stress levels at which important failure events occurred are marked as (a) to (d). The distributions of equivalent stress in the fiber at the marked points are shown on the right in Figure 9. The range of the contour band was set such that the stress above the allowable value is shown in red. Macroscopic shear stress τxy = 50 MPa had already been applied when the application of the compressive loading was started.
At point (o), a small shear deformation due to shear stress from the surrounding material was observed before the macroscopic compressive stress was applied. Although a slight stress concentration at the antinodes of the sinusoidal misalignment was observed, it was far lower than the allowable stress. The macroscopic compressive stress increased with increasing macroscopic strains. At point (a), the compressive stress of the fiber reached its allowable value and failed. At point (b), the macroscopic compressive stress reached its maximum value and began to decrease. This process is the same as that expressed in the theoretical model.
However, the macroscopic stress dropped abruptly from point (c) to point (d). This behavior was not observed in the theoretical model, and it was confirmed that it was caused by failure of the interface between the fiber and matrix by checking the status of cohesive elements, which was only considered in the numerical model. Figure 9c′,d′ show the distribution of damage in the cohesive elements, where the failed region is shown in blight color. Small regions with slightly damaged interfaces were found at the location of fiber failure in Figure 9c′, and then the interface completely failed around the broken fiber in Figure 9d′.
Figure 10 shows the distribution of stress in the matrix and fiber with a deformed shape at point (d). Since the RVE is one unit of the periodic structure, it was duplicated in the y and z directions under the condition of the periodic symmetricity. Since Figure 10a shows the exact deformed shape without a multiplication factor, it can be clearly confirmed that the kink-band was formed at the final phase of the failure process. Figure 10b shows that the stress in the fiber was discontinuous at the points of the breakage and stress relaxation occurred due to the fiber breakage. As mentioned earlier, the interface between the fiber and matrix was completely debonded around the region of fiber breakage, and the material system had almost no capability to carry the compressive load. Therefore, this point is important to determine the total dissipated energy during the process of compressive failure.

4.2. Depending Factors of Failure Response

The analyses were conducted with different values of fiber misalignment and external shear stress. Figure 11a shows the relationship between applied compressive stress and induced compressive strain. The solid and dashed lines indicate the results with misalignment aT = 2.0 μm and 4.0 μm, respectively. The results with different values of external shear stress τxy = 0.0, 12.5 and 25.0 MPa are shown in different colors. The maximum compressive stress decreased with the increase in the fiber misalignment. This trend was the same as that reported in previous experiments [5]. The maximum stress also depended on the external shear, and it decreased with the increase in the external shear.
Figure 11b shows the relationship between compressive stress and induced shear strain. After the compressive stress reached its maximum value, the shear strain rapidly increased with the decrease in compressive stress. This indicates that the compressive failure develops instantly once initiated, as is often reported in the literature [6]. It is important to note that the compressive stress in all cases converged to almost the same value, regardless of the amount of the misalignment and external shear in the later stage of the compressive failure.
The dependency of the maximum compressive stress, i.e., compressive strength of the composite, on the different factors is summarized in Figure 12. A group of three bars indicates the difference in strength caused by the variation in fiber misalignments. In each group, the blue and red portions indicate the strengths of the composites with different fiber strengths. It can be observed that the effect of differences in fiber strength is not significant compared with that of fiber misalignment. This supports the hypothesis stated in previous studies that the compressive failure of the unidirectional composite is dominated by the shear failure of the matrix [2,3,4,5,6,7].
The external shear stress in the out-of-plane direction τ ¯ z x was also applied as in the in-plane direction τ ¯ x y . Macroscopic shear deformation was induced in the same direction as the external shear strain by the compressive loading, as shown in the next section. The effect of external shear on the compressive strength was significant since fiber misalignment at the beginning of compressive loading had been increased from its initial value due to the response of the composite to the external shear stress.
In the cases of in-plane shear, the decrease in strength due to the increase in external shear stress was more than that in out-of-plane cases. This trend occurred because the direction of fiber misalignment and deformation by external shear was the same. The variation in fiber misalignment hardly affected the strength in the cases of out-of-plane external shear. This is likely because the deformation induced by external shear loading occurred in different directions from that of the fiber misalignment.

4.3. General Three-Dimensional Response of Compressive Failure

The shear responses induced by compression are shown as a three-dimensional plot in Figure 13. Figure 13a is taken from the isometric viewpoint, and Figure 13b is seen from the top. The z axis indicates compressive stress, and the x and y axes indicate macroscopic components of shear strain induced by compression in the in-plane and out-of-plane direction, respectively. The fiber misalignment aT for these cases was set to 4.0 μm, which is comparatively large among all the cases, and was incorporated in the in-plane direction of the composite. Therefore, when the external shear stress in the out-of-plane direction τ ¯ z x was small, compression-induced shear deformation mainly occurred in the in-plane direction, as shown in dark blue. With the increase in the out-of-plane component of external shear stress, the direction of macroscopic shear deformation changes toward the out-of-plane direction, and it occurred almost completely in the out-of-plane direction with τ ¯ z x = 30 MPa, as shown in yellow. It should be noted that the maximum compressive stress decreased with the increase in the external shear stress.

4.4. Comparison Between Results of Experiments and Present Numerical Analysis

Figure 14a shows the results of present analysis and experiments obtained in a previous study by Jelf and Fleck [7] for comparison. In the previous study, compressive tests under a combination of longitudinal compressive loading and in-plane shear loading were conducted, and the dependency of compressive strength on the shear loading was studied. In the figure, compressive strengths σ normalized by the maximum value σc are shown on the vertical axis, and shear stresses τ normalized by the shear yield stress τc are shown on the horizontal axis. The gray circle markers in the figure show the results of the experiments, and the results of the present numerical analyses, which are shown in Figure 12, were normalized in the same manner as the experiments and plotted as rectangle markers. The authors of the previous study concluded that the compressive strength linearly decreased with the increase in the shear stress, as shown as a dashed line in the figure. It can be seen that the present numerical results are consistent with the trend of the experimental results.
Figure 14b shows a cross-section of failed CFRP under compressive loading, which is also shown in Figure 2b, and the kink-band is additionally marked as a while line. It has been reported that the kink-band is usually formed with a specific angle to the longitudinal direction of a lamina called kink-angle β, and the angle is in range from 10 to 20 degrees in the case of CFRP [5]. Kink-angle β in this study, which is shown in Figure 10a, was consistent with that in Figure 14b. It is likely that the delamination marked red in Figure 14b occurred during the formation of the kink-band. Because the shear deformation during the formation of the kink-band was significantly large and occurred locally in a small region in the lamina, the delamination was supposed to be caused by this out-of-plane deformation. In a similar mechanism, matrix cracks would occur if the shear deformation occurred in the in-plane direction. Therefore, the formation of the kink-band can be a trigger for other types of failure, i.e., matrix cracks in the case of in-plane shear and delaminations in the case of out-of-plane shear. In a further study, this model will be used to analyze the interaction between the failure modes at the macroscopic scale.

5. Conclusions

Micromechanical analyses using the finite element method were conducted to analyze the failure response of the unidirectional fiber-reinforced composite under longitudinal compressive loading. The three-dimensional periodic microstructure of the material system was extracted as the Representative Volume Element, considering periodic boundary conditions. The relationships between compressive stress and compressive normal strain and that between compressive stress and shear strain were analyzed using different parameters, including the fiber misalignment, fiber strength and macroscopic shear stress in the in-plane and out-of-plane directions. From these analyses, the following conclusions were obtained.
  • Comparisons of the present results with those of the established theoretical model showed the feasibility of the present model.
  • The present results show that the compressive strength of the composite decreases with the increase in the fiber misalignment, which is often pointed out in experiments in studies.
  • The applied macroscopic shear stress had a significant effect, decreasing the compressive strength of the composites because it caused extra inclination of the fiber at the beginning of the compression.
  • The direction of shear deformation induced by the compressive loading was three-dimensionally changed according to the components of the macroscopic shear stress, indicating that compressive failure can trigger matrix cracks and delaminations in the vicinity of the compressive failure.

Author Contributions

Conceptualization, A.K.; methodology, A.K.; validation, Y.W., W.M., Y.I., E.H. and H.K.; writing—original draft preparation, A.K.; writing—review and editing, Y.W., W.M., Y.I., E.H. and H.K.; project administration, E.H. and H.K. All authors have read and agreed to the published version of the manuscript.

Funding

This research received no external funding.

Data Availability Statement

Data are contained within the article.

Acknowledgments

The numerical analyses in the present study were conducted on computer resources offered by the Institute for Information Management and Communication, Kyoto University.

Conflicts of Interest

The authors declare no conflicts of interest.

References

  1. Jones, R.M. Mechanics of Composite Materials, 2nd ed.; Taylor & Francis: New York, NY, USA, 1999. [Google Scholar]
  2. Rosen, B.W. Mechanics of composite strengthening: Fibre composite materials. Am. Soc. Met. 1965, 72, 75. [Google Scholar]
  3. Chaplin, C.R. Compressive fracture in unidirectional glass-reinforced plastics. J. Mater. Sci. 1977, 12, 347–352. [Google Scholar] [CrossRef]
  4. Hahn, H.T.; Sohi, M.M. Buckling of a fiber bundle embedded in epoxy. Compos. Sci. Technol. 1986, 27, 25–41. [Google Scholar] [CrossRef]
  5. Kyriakides, S.; Arseculeratine, R.; Perry, E.J.; Liechti, K.M. On the compressive failure of fiber reinforced composites. Int. J. Solids Struct. 1995, 32, 689–738. [Google Scholar] [CrossRef]
  6. Moran, P.M.; Liu, X.H.; Shih, C.F. Kink band formation and band broadening in fiber composites under compressive loading. Acta Metall. Mater. 1995, 43, 2943–2958. [Google Scholar] [CrossRef]
  7. Jelf, P.M.; Fleck, N.A. The failure of composite tubes due to combined compression and torsion. J. Mater. Sci. 1994, 29, 3080–3084. [Google Scholar] [CrossRef]
  8. Effendi, R.R.; Barrau, J.J.; Degeorges, D.G. Failure mechanism analysis under compression loading of unidirectional carbon/epoxy composites using micromechanical modelling. Compos. Struct. 1995, 31, 87–98. [Google Scholar] [CrossRef]
  9. Sutcliffe, M.P.F.; Fleck, N.A. Microbuckle propagation in fibre composite. Acta Mater. 1997, 45, 921–932. [Google Scholar] [CrossRef]
  10. Barbero, E.J. Prediction of compression strength of unidirectional polymer matrix composites. J. Compos. Mater. 1998, 32, 483–502. [Google Scholar] [CrossRef]
  11. Fleck, N.A.; Liu, D.; Shu, J.Y. Microbuckle initiation from a hole and from the free edge of a fibre composite. Int. J. Solids Struct. 2000, 37, 2757–2775. [Google Scholar] [CrossRef]
  12. Yokozeki, T.; Ogasawara, T.; Ishikawa, T. Nonlinear behavior and compressive strength of unidirectional and multidirectional carbon fiber composite laminates. Compos. Part A 2006, 37, 2069–2079. [Google Scholar] [CrossRef]
  13. Takahashi, M.; Shirakashi, N.; Iwahori, Y.; Hara, E.; Katoh, H.; Kondo, A. Filled-hole Compressive Strength and Fracture Behavior of CFRP Laminates: Discussion by Experiments and Observations. J. Jpn. Soc. Compos. Mater. 2024, 50, 99–106. [Google Scholar] [CrossRef]
  14. Schultheisz, C.R.; Waas, A.M. Compressive failure of composites, Part I: Testing and micromechanical theories. Prog. Aerosp. Sci. 1996, 32, 1–42. [Google Scholar] [CrossRef]
  15. Budiansky, B. Compressive failure of fibre composites. J. Mech. Phys. Solids 1993, 41, 183–211. [Google Scholar] [CrossRef]
  16. Budiansky, B.; Fleck, N.A.; Amazigos, J.C. On kink-band propagation in fiber composites. J. Mech. Phys. Solids 1998, 46, 1637–1653. [Google Scholar] [CrossRef]
  17. Hsu, S.Y.; Vogler, T.J.; Kyriakides, S. Compressive strength predictions for fiber composites. J. Appl. Mech. 1998, 65, 7–16. [Google Scholar] [CrossRef]
  18. Soutis, C.; Curtis, P.T. A method for predicting the fracture toughness of CFRP laminates failing by fibre microbuckling. Compos. Part A 2000, 31, 733–740. [Google Scholar] [CrossRef]
  19. Pinho, S.T.; Davila, C.G.; Camanho, P.P.; Ianucci, L.; Robinson, P. Failure Models and Criteria for FRP Under In-Plane or Three-Dimentional Stress States Including Shear Non-Linearity; TM-2005-213530; NASA Technical Memorandum; NASA Langley Research Center: Hampton, VA, USA, 2005. [Google Scholar]
  20. Pinho, S.T.; Ianucci, L.; Robinson, P. Physically based models and criteria for laminated fibre-reinforced composites with emphasis on fibre kinking: Part I: Development. Compos. Part A 2006, 37, 63–73. [Google Scholar] [CrossRef]
  21. Pinho, S.T.; Ianucci, L.; Robinson, P. Physically based models and criteria for laminated fibre-reinforced composites with emphasis on fibre kinking: Part II: FE implementation. Compos. Part A 2006, 37, 766–777. [Google Scholar] [CrossRef]
  22. Ataabadi, A.; Toudenhky, H.H.; Rad, S.Z. Experimental and analytical study on fiber-kinking failure mode of laminated composites. Compos. Part B 2014, 61, 84–93. [Google Scholar] [CrossRef]
  23. Naya, F.; Herraez, M.; Lopes, C.S.; Gonzalez, C.; Van der Veen, S.; Pons, F. Computational micromechanics of fiber kinking in unidirectional FRP under different environmental conditions. Compos. Sci. Technol. 2017, 144, 26–35. [Google Scholar] [CrossRef]
  24. Herraez, M.; Bergan, A.C.; Lopes, C.S.; Gonzalez, C. Computational micromechanics model for the analysis of fiber kinking in unidirectional fiber-reinforced polymers. Mech. Mater. 2020, 142, 103299. [Google Scholar] [CrossRef]
  25. Zhang, M.; Guan, Z.; Sun, W.; Han, G. Micro-mechanical simulation of longitudinal compression in composites considering stochastic fiber strength. In Proceedings of the 2016 7th International Conference on Mechanical and Aerospace Engineering (ICMAE), London, UK, 18–20 July 2016; pp. 3–8. [Google Scholar]
  26. Bishara, M.; Rolfes, R.; Allix, O. Revealing complex aspects of compressive failure of polymer composites—Part I: Fiber kinking at microscale. Compos. Struct. 2017, 169, 105–115. [Google Scholar] [CrossRef]
  27. Tojaga, V.; Skovsgaard, S.P.H.; Jensen, H.M. Micromechanics of kink band formation in open-hole fibre composites under compressive loading. Compos. Part B 2018, 149, 66–73. [Google Scholar] [CrossRef]
  28. Persson, E.; Eriksson, I.; Zackrisson, L. Effects of hole machining defects on strength and fatigue life of composite laminates. Compos. Part A 1997, 28, 141–151. [Google Scholar] [CrossRef]
  29. Zhao, Y.; Yang, X.; Lu, Y.; Duan, X. Electrical discharge-mechanical hybrid drilling of micro-holes in carbon fibre-reinforced polymers. Int. J. Mach. Tools Manuf. 2025, 205, 104243. [Google Scholar] [CrossRef]
  30. Bendine, K.; Gibhardt, D.; Fiedler, B.; Backs, A. Experimental characterization and mechanical behavior of 3D printed CFRP. Eur. J. Mech.—A/Solids 2022, 94, 104587. [Google Scholar] [CrossRef]
  31. Zeng, J.; Yan, Z.; Jiang, Y.; Li, P. 3D printing of FRP grid and bar reinforcement for reinforced concrete plates: Development and effectiveness. Compos. Struct. 2024, 335, 117946. [Google Scholar] [CrossRef]
  32. Nakamura, T.; Tabuchi, H.; Hirai, T.; Fujii, S.; Nakamura, Y. Effects of silane coupling agent hydrophobicity and loading method on water absorption and mechanical strength of silica particle-filled epoxy resin. J. Appl. Polym. Sci. 2020, 137, 48615. [Google Scholar] [CrossRef]
  33. Anatolyevich, B.P.; Yakovlevna, G.N. Generalization of the Ramberg–Osgood Model for Elastoplastic Materials. J. Mater. Eng. Perform. 2019, 28, 7342–7346. [Google Scholar] [CrossRef]
  34. Stormont, C.W.; Gonzalez, H.; Brinson, H.F. The ductile fracture of anisotropic materials. Exp. Mech. 1972, 12, 557–563. [Google Scholar] [CrossRef]
  35. Zienkiewicz, O.C.; Taylor, R.L. The Finite Element Method, 4th ed.; McGraw-Hill: New York, NY, USA, 1989. [Google Scholar]
Figure 1. Failure process of CFRP under longitudinal compressive loading.
Jcs 09 00265 g001
Figure 2. SEM observation of cross-section of CFRP after the compressive failure [13].
Jcs 09 00265 g002
Figure 3. Geometry of numerical models for Representative Volume Elements.
Jcs 09 00265 g003
Figure 4. Constitutive relation for constituent materials of the composite.
Jcs 09 00265 g004
Figure 5. Boundary conditions to impose periodic symmetric conditions.
Jcs 09 00265 g005
Figure 6. Boundary conditions for macroscopic compressive and shear loadings.
Jcs 09 00265 g006
Figure 7. Time history of applied loadings.
Jcs 09 00265 g007
Figure 8. Comparison between results of the present numerical model and the theoretical model.
Jcs 09 00265 g008
Figure 9. Process of compressive failure reproduced by the present numerical model.
Jcs 09 00265 g009
Figure 10. Deformed shape and stress distribution in matrix and fibers after the compressive failure plotted considering symmetricity.
Jcs 09 00265 g010
Figure 11. Relationship between applied stress and strain components and its dependence on fiber misalignments and fiber strengths.
Jcs 09 00265 g011
Figure 12. Dependence of compressive strength on macroscopic components of shear stress.
Jcs 09 00265 g012
Figure 13. Three-dimensional response of compressive failure with various ratios of macroscopic shear stress components.
Jcs 09 00265 g013
Figure 14. Comparison between results of experiments and present numerical analysis [13,31].
Jcs 09 00265 g014
Table 1. Comparison between numerical models for compressive failure of unidirectional FRP.
Reference #Scale of
Models
Material
Nonlinearity
Interface
Debonding
Kink-Band Formation
GeometryResponse
[22]MacroscopicNoNo2D2D
[19,20,21]MacroscopicYesNo2D3D *
[25,26,27]MicroscopicYesNo3D2D
[23,24]MicroscopicYesYes3D2D
PresentMicroscopicYesYes3D3D
* A model presented as a 3D model in the study is extended version of the 2D model on inclined kink-plane.
Table 2. Material properties used for numerical models.
FibersMatrixInterface
Elastic
Modulus
Poisson’s RatioStrength
σf
Elastic
Modulus
Poisson’s RatioYield
Stress
Cohesive
Energy Gc
Critical Disp. δcMaximum Disp. δm
230 GPa0.31.0, 3.0 GPa2.4 GPa0.3as shown in the figure5.0 × 10−2 kJ/m21.0 × 10−7 mm1.0 × 10−4 mm
Disclaimer/Publisher’s Note: The statements, opinions and data contained in all publications are solely those of the individual author(s) and contributor(s) and not of MDPI and/or the editor(s). MDPI and/or the editor(s) disclaim responsibility for any injury to people or property resulting from any ideas, methods, instructions or products referred to in the content.

