Abstract
This paper tackles the important issue of the flexural strength of continuous fiber-reinforced ceramic composite. Estimates of the flexural strength of 2D woven SiC/SiC composite are extracted from symmetric and asymmetric 3-point bending test results using three independent approaches: (1) the equations of elastic beam theory for homogeneous solids, (2) finite element analysis of the stress state, (3) stress–strain relations in the tensile outer surface of specimens. Furthermore, the flexural strength is predicted from the ultimate tensile strength using a bundle failure model based on the fracture of the critical filament. It is shown that the equation of elastic beam theory significantly overestimates the flexural strength of the 2D SiC/SiC (620 MPa), while the alternate approaches and the predictions from the ultimate tensile strength converged to ≈340 MPa. The variability of strength data was approached using the construction of p-quantile diagrams that provide an unbiased assessment of the normal distribution function. Pertinent Weibull parameters are derived using the first moment equations. Important trends in the effects of the size, stress gradient, tension–flexure relations, strength of critical filament in a tow, and populations of critical flaws are established and discussed.
1. Introduction
Composite materials are critical in many applications, and they can replace metallic materials in many systems or goods. The potential applications of ceramic matrix composites reinforced with long, continuous ceramic fibers range from room temperature to very high temperature, in ambient or severe environments [1]. The large variety of possible combinations of matrix and fiber types allows the design of composite materials tailored to application requirements and performances. The composite engineering provides materials with properties superior to the properties of constituents considered separately. Fiber-reinforced composites are heterogeneous and anisotropic materials. Taking into account the respective contribution of constituents (fibers, matrix, flaws, and interfaces) in the mechanical behavior requires multiscale approach-based analyses [2]. Questions relative to proper characterization and safe prediction of the mechanical behavior and the failure of composite components are still open.
Tensile testing is a simple and fundamental materials science and engineering test that provides direct mechanical characteristics of materials. However, some extrinsic difficulties may arise from specimen gripping, alignment, and material high cost. Therefore, certain authors recommend the flexural test during the development stage of a ceramic-fiber composite system, arguing that it can be carried out on small, easily prepared specimens using simple jigs [3]. Authors were also interested in flexural testing with a view to predicting ultimate tensile strength. But, material-induced intrinsic difficulties arise, such as the calculation of the flexural strength from the experimental force data; the damage prior to ultimate failure; and the influence of stress gradient, specimen size, and fabric orientation on the mechanical behavior.
In tensile specimens, during uniaxial tension, a uniform stress state operates at the macroscopic level, and diffuse matrix cracking occurs prior to ultimate failure from a critical fiber [4]. The following mechanisms during flexural tests on relatively long thin specimens were described [5]: « First, multiple cracking occurs on the tensile surface at the same stress as in the tension test. Following matrix cracking, the neutral axis of the beam shifts toward the compressive surface. The compressive stresses are enlarged, whereas the tensile stresses are relaxed compared to the stresses in the uncracked beam. After further loading, the peak load is dictated by damage in the compressive side of the beam, and involves fiber buckling and matrix fragmentation ». A numerical analysis of the flexural behavior of a laminated ceramic matrix composite, considering the constitutive tensile-compressive behavior of each layer and the constitutive shear behavior of the interlaminar regions, showed that the neutral axis of the flexure beam migrates towards the compressive side due to progressive fiber failure in the tensile layers [6]. Delamination cracks were observed on Nicalon SiC/Al2O3 [7], in both transverse and edge-on orientations on Nextel/SiC [8], and in transverse orientation on Nicalon/SiC [8], leading to specimen collapse rather than separation. By contrast, a specimen fracture in two pieces was observed on Nicalon/SiC composites in edge-on orientation [8,9] (the SiC matrix of which is twice as stiff as the Nicalon fibers). The load was reported to be transferred equally between the plies [8].
Several values of ultimate flexural strength (UFS) have been reported in the literature for various composites, including C/C-SiC [10], Nicalon/C, Nicalon/CAS, Nicalon/LAS [11], Nicalon/SiC [5,8,9,12,13,14], Nextel/SiC [8], and carbon-reinforced Borosilicate glass [15].
The UFS was found to be larger than the UTS (Ultimate Tensile Strength). Certain authors attributed this trend to the shift of the neutral axis [7]. Using an experimental and numerical approach [10], it was shown that the trend is partially explained by the differing tensile and compression stress–strain behaviors and further by the work of fracture beyond maximum load. In [16], a higher strength ratio was observed the more the load-deflection curve deviated from linearity. The strength ratio depended most strongly on the behavior of the uniaxial stress–strain curve after the ultimate tensile strength; materials that failed gracefully tended to exhibit a higher strength ratio.
The UFS/UTS ratio displayed variability and depended on the method of determination of flexural strengths. Values of UFS/UTS < 1.5 were obtained using micromechanics-based approaches [11,12]. Much larger ratios (>3) and a larger UFS were obtained when the flexural strength was calculated using the simple elastic beam equation [3,8,9,13,14,17,18]. In [6], it was shown that ordinary beam equations cannot be used to describe the behavior. These equations led to the following high values of the flexural strength of Nicalon/SiC:
- -
- In transverse configuration: 320 MPa (2D woven) [8,9], 180 MPa (2D woven) [14], and 350 MPa (1D) [14];
- -
- In edge-on configuration (2D woven): 500 MPa [9] and 430 MPa [8];
- -
- On 3D fabric-reinforced composite: 514 MPa [13].
Smaller values were obtained using the micromechanics-based approach in the edge-on configuration (2D woven): 213 and 187 MPa (UFS/UTS ratio~1.26) were obtained from only two tensile tests and two four-point flexure tests [12]. Additionally, it is worth mentioning that a composite Weibull modulus of ~15 was derived from these experimental data through Monte Carlo simulations [12]. The authors recognized that a large number of tests is needed to ascertain the composite Weibull modulus accurately.
It was observed that the UFS of the Nicalon/Al2O3 and the Nicalon/SiC composites calculated using ordinary beam equations was not noticeably affected by a specimen length increase [8], whereas there was a significant increase in the UFS of the Nicalon/SiC composite when the specimen width was increased [8].
The tension-bending relations are required for predicting the tensile strength from the flexural strength, or vice versa. The bending moment and neutral axis shifting were introduced in models that did not include the physics-based damage phenomena and required assumptions on the stress profile in the bending specimens [12,16,17,19]. The tensile behavior derived from the bending curve showed qualitative but not satisfactory agreement with the experimental tensile behavior. The experimental database was scarce and not statistically significant [12,16,17]. A few authors recognized the contribution of fiber to flexural ultimate fracture [11,12,20]. The Foster’s analysis [20] related the nominal bend strength of Titanium/SiC Metal Matrix Composite to the fiber bundle strength and matrix yield strength, and used a Local Load-Sharing simulation model to study the evolution of fiber damage.
In most cases, the vicious circle in the analysis of flexural strength data was not broken. This means that models of flexural behavior could not be compared to experimental behavior due to the lack of an accepted equation for the calculation of empirical flexural stresses from experimental forces. In comparison, this exercise is straightforward for tensile strengths that are calculated from experimental forces using a simple and accepted equation. An attempt to overcome this difficulty is proposed in the present paper by using three different and independent approaches for the determination of flexural strength: (1) finite element analysis of the stress state, (2) a fiber bundle-based approach, (3) the stress–strain Hooke relation. The simple equation of elastic beam theory was also used for evaluation purposes.
The present paper investigates the flexural strength of CVI 2D woven SiC/SiC composite with respect to available tensile strength results [4]. It proposes a multiscale approach that recognizes the underlying contribution to failure of fiber tows, single filaments, and the critical filament in a tow after matrix damage. The variability of strength data is characterized using the construction of p-quantile diagrams and the Weibull approach. An exact relation between tensile and flexural strengths is proposed. Important trends in the effects of size, stress gradient, tension–flexure relations, strength of critical filament in a tow, and populations of critical flaws are established and discussed
2. Background: The Ultimate Failure Under Tensile Loading Parallel to a Fiber Direction
During tensile tests parallel to a principal fiber direction, ceramic matrix composites exhibit a response depending on the respective Young’s moduli of fibers and matrix. Those composites like the SiC/SiC with a high matrix modulus and quite strong fiber/matrix interfaces display non-linear deformations that result from transverse cracking in the matrix (the cracks are perpendicular to fibers in the loading direction) and limited fiber/matrix debonding. Saturation of matrix damage is indicated by a point of inflection at about 0.4% strain for those composites with a weak interphase, whereas it occurs at higher stress on those composites with a strengthened fiber/matrix interphase. Figure 1 shows the correlative decrease in the composite elastic modulus, which reflects the increasing damage and the decreasing load-carrying capacity of the matrix [1]. The load is transferred to longitudinal tows that carry the whole load after matrix cracking saturation. The analysis of acoustic emission signals indicates that the fracture of filaments starts at strains > 0.6%. The composite elastic modulus reaches the minimum dictated by the debonded longitudinal filaments according to the following rule of mixture:
Emin = Ef Vf
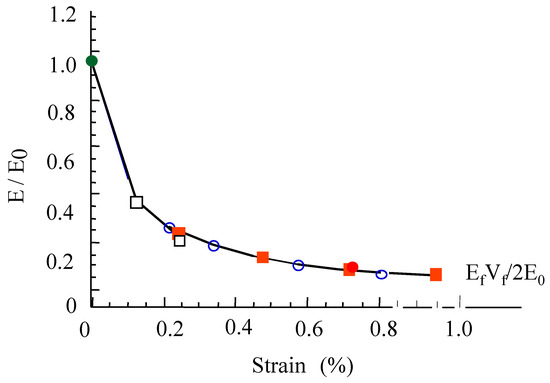
Figure 1.
Relative elastic modulus versus strain during tensile tests on 2D woven SiC/SiC composite.
Vf is the volume fraction of fibers oriented in the loading direction, Ef is the fiber elastic modulus.
It was established [4] that the ultimate failure of the composite under strain-controlled conditions of tensile loading is caused by an overload resulting from the friction of broken pull-out fibers against the matrix and transferred evenly to the surviving fibers. The overload increases steadily with the number of broken fibers so that the reinforcing tows are subjected to a force-controlled process, although a constant strain rate is applied. The critical fiber that initiates the instability is when the overload exceeds the filament strength gradient in a tow. The closed-form equations that were established for the criterion of initiation and propagation of filament failure in a tow led to a closed-form equation for tow and composite strength. The theoretical strength of the critical filament is defined by its rank in the cumulative distribution of filament strengths in a tow and by the maximum on the tow force–strain curve. The following exact equation of the theoretical strength σf(P = αc) was found to lead to satisfactory predictions of composite tensile ultimate strength [4]:
where P is the failure probability, αc is the failure probability of the critical filament strength, m and σ0 are the Weibull statistical parameters pertinent to filament strengths, V is the volume, V0 is the reference volume (1 m2), μ is h of the critical filament in the tow, and Γ is the gamma function.
Equation (2) was found to be more appropriate than the equations proposed in the literature, which significantly misestimated the strength [4]. It is worth pointing out that Equation (2) shows that the theoretical strength σf(P = αc) takes a unique value when statistical parameters are invariant with fiber tow specimens of identical dimensions [4,21]. However, experimental results show that the rank and the strength of the critical filament are affected by structural effects like local friction. The associated strength scatter was attributed to the variation in friction-induced overload resulting from variability in fiber/matrix interface characteristics and filament surface roughness.
Under these conditions of strain-controlled loading, and in the absence of pull-out friction from broken fibers, the fracture would be dictated by the strength of the strongest filament. The force–strain curve would exhibit a smooth and stable force decrease.
3. Experimental Section: Materials and Procedure
The experimental results were generated in a previous paper [22,23]. The 3-point bending tests were performed on 2D woven SiC/SiC composite specimens made via chemical vapor infiltration (CVI) [22,23]. SiC/SiC was reinforced by SiC Nicalon fibers in a plain weave configuration. The test specimens were cut out of plates 3.3 mm thick. Two batches of straight bars (8 × 80 × 3.3 mm3) for the symmetric and asymmetric tests generated symmetric and asymmetric stress gradients.
The flexural specimens were loaded edge-on, parallel to the woven plies, in order to prevent delamination between layers and, thus, proper tension and bending results were compared. Furthermore, the specimens were relatively thin (height/span length = 0.1) so that the relative shear stress was minimized. The displacement rate was chosen so as to obtain the same strain rate of 4 10−4%/s in the outer tensile face as for the tensile test specimens. Strains in the outer tensile face were measured using an extensometer with a 10 mm gauge length (Figure 2a).
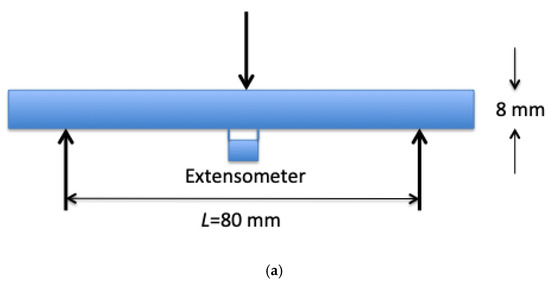
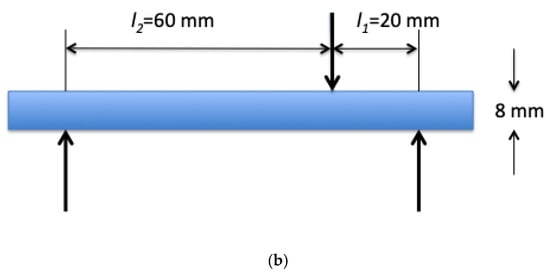
Figure 2.
The 3-point bending tests: (a) symmetric, (b) asymmetric tests.
The experimental results of tensile tests were reported in a previous paper. The two batches of each 12-tensile SiC/SiC dog-bone-shaped-specimen were manufactured together with the batches of bending specimens: there were a batch of small specimens (V1 = 8 × 30 × 3.3 mm3) and a batch of large specimens (V2 = 16 × 120 × 3.3 mm3) [22,23]. The flexural and the smaller tensile specimens had identical cross-section dimensions. The strain rate was 4 10−4%. Strains were measured using an extensometer over a 25 mm gauge length.
4. Determination of Flexural Strength
4.1. Finite Element Analysis
A mesh of 4 × 40 quadrilateral elements (size: 2 × 2 mm2) was constructed for the finite element analysis of the stress state [16]. The size of elements was selected according to that of the Representative Volume Element. The boundary conditions reproduced the loading conditions in the 3-point bending tests, as described above: (i) displacements applied through the upper roller, (ii) plane stress conditions. The compressive behavior was taken to be linear, although a slight non linearity has been reported by McNulty and Zok [5].
The contribution of damage to deformations in the tensile part of specimens was taken into account using the Young’s modulus–strain relationship determined from the strain–stress behavior obtained during tensile tests [1] (Figure 1). For this purpose, a non-linear relation without coupling between tow directions was used to describe the relation between stresses [σ] and strains [ε] in the presence of matrix damage: [σ] = K(ε)[ε]. Since the specimens were loaded parallel to the plies, the transverse properties were neglected.
The finite element computations provided the strain and stress fields for various applied forces. The force–strain curves relate the applied forces and the corresponding strains located in the outer face on the force axis. The ultimate strength is given by the maximum tensile stress computed for the failure force measured during the tests.
4.2. Elastic Beam Theory
The flexural strength under symmetric 3-point bending was alternately derived using the following formulae based on the elastic beam theory for a homogeneous isotropic solid [24,25]:
where Fm is the maximum applied force; L is the outer span length; b is the mean width; and h is the mean thickness of the test specimen.
This equation is based on the following assumptions [24,25]:
- -
- The beam is symmetrical about the neutral plane;
- -
- The beam is a straight bar of homogeneous and linearly elastic material;
- -
- The transverse plane sections remain plane and normal to the longitudinal fibers after bending (Bernoulli’s assumption);
- -
- The fixed relationship between stress and strain (Young’s modulus) for the beam material is the same for tension and compression.
The behavior of beams made of CFRC composites is different from that of homogeneous elastic materials as soon as matrix damage initiates. This equation was used, although its applicability to fiber-reinforced CMC is questioned, in order to evaluate error on estimated strength.
4.3. Strength Estimated from Measured Strain at Failure
The flexural strength is related to the maximum strain at failure in the outer tensile surface of the bending specimen by the Hooke equation:
where εmax is the maximum strain in the outer surface of the specimens, and E(εmax) is the corresponding value of Young’s modulus, which was derived from tensile tests, after saturation of matrix cracking [1]: E(εmax) = Emin is given by Equation (1). Ef is the Young’s modulus of filaments, Vf is the fraction of fibers in the longitudinal axis direction. Assuming a linear strain gradient, εmax was derived from the measured strain εmeasured using the following equation:
where z is the abscissa of ε(z) on the longitudinal axis of the specimen, z = 0 for εmax at midspan, z = 5 mm for εmeasured (half gage length). L is the span length. The flexural strength was calculated using Equations (4) and (5) for the SiC/SiC experimental data given in Table 1.

Table 1.
Values of experimental data used for the determination of the flexural strength.
4.4. Prediction: The Bundle-Based Approach
It was assumed that the critical tow is completely debonded after the saturation of matrix cracking, which is also supported by several results [1,2]. It was assumed that failure due to shear is not an issue, and our concern is the longitudinal direction stress and its resulting distribution. The fibers are subjected to a bending moment, which generates a stress gradient. The principle of the approach is to define a volume equivalent to the fiber’s stressed volume under uniform tension on the basis of Weibull statistics, and then to derive the bending strength from the tensile strength for the critical fiber in the tow. It has been shown that multifilament tows are elastic and damage tolerant, whereas single fibers are brittle. The multifilament tows exhibit a non-linear force–strain relation resulting from successive individual fiber breaks under a controlled deformation rate [21]. The fraction of fiber fractures at maximum force defines the critical filament that can initiate the failure of the tow [21]. It is widely accepted that the Weibull model satisfactorily describes the statistical distribution of failure strengths of single filaments under tensile loads [26,27].
4.4.1. Symmetric 3-Point Bending
The approach is founded on the following assumptions:
- -
- A tensile stress gradient operated along the specimen length;
- -
- The stress was considered to be constant through the cross-section of filaments in the tensile part of beam. The through thickness stress gradient can be neglected because the fiber diameter (12 μm) is negligible compared to the specimen thickness (4 mm in the tensile part).
- -
- The highest stresses are operated on the extreme ply close to the specimen outer surface under tension.
- -
- As discussed in previous papers, the fracture is initiated from a critical fiber in the ply subjected to the highest tensile longitudinal stresses after the saturation of matrix cracking.
- -
- A linear tensile stress gradient on filaments located at the bottom side of the beam was assumed. It is symmetric with respect to the loading axis:
where σmax is the peak tensile stress in the ply. L is the span length. The origin is the center of the specimen; −L/2 < z<L/2, L is the stressed fiber length.
The volume of a statistically equivalent ply subjected to peak tensile stress operating uniformly was defined using the cumulative Weibull distribution of filament strengths σ [26]:
where σ0 is the scale factor, m is the Weibull modulus, S is the cross-sectional area of a filament, and V0 is a reference volume (V0 = 1 m3).
Introducing Equations (6) into (7), and integrating results in
Equation (9) gives the equivalent filament stressed volume subjected to σmax operating uniformly:
The cumulative distribution of filament strengths under uniform tension is
where σt is fiber tensile strength and lt is the gauge length.
The relation between the bending and the tensile filament strengths is obtained from equating probabilities:
For the volume fraction of longitudinal fibers Vf, the flexural strength of the composite is related to the strength of the tensile specimen by the following expression:
and σflex. σflex is the composite flexural strength, is the strength of the critical filament in the flexural specimen, σtr is the strength of the tensile specimen, is the tensile strength of the critical fiber in the tensile specimen having gauge length lt, and mc is the Weibull modulus of the critical filament strength.
It is important to point out that Equations (7) to (10) are relative to filament distribution, whereas Equations (11) and (12) are derived from equations relative to filaments having the same specified probability. Equation (12) corresponds to the critical filament that fails in critical tow at the fracture of a tensile or flexural composite test specimen: σt(P = αc) is given by Equation (2).
4.4.2. Asymmetric 3-Point Bending
The approach is founded on the same assumptions as above. The following asymmetric linear tensile stress gradient on fibers located at the bottom side of the beam was assumed:
The origin is located on the loading axis, −l2 < z < l1, with l2 + l1 = L. l2 and l1 are defined in Figure 2.
The probability of failure of a filament under stress σ, is given by
Introducing Equations (13) and (14) into (15) and integrating results in
The effective volume defined by Equation (16) is given by the same equation as above for symmetric bending: . As a consequence, the flexural strength is also given by Equation (12), which indicates that it is not affected by the asymmetric stress gradient.
5. Strength Variability
Strength variability was approached using p-quantile diagrams that provide a proper and unbiased way to evaluate the pertinence of the normal distribution function. Thus, it was demonstrated that when the plot of the p-quantile zp vs. strength σp is linear, it can be concluded that the strength is a Gaussian variable [27].
The equation of the p-quantile diagrams is
where P = i/(n + 1), μ = mean, s = standard deviation, σp is the value of the strength with probability P, and Φ is the cumulative standard normal distribution of variable z.
The normal cumulative distribution function (CDF) was calculated using Equation (18) for the values of the mean μ and standard deviation s of the sets of experimental strength data.
The Weibull parameters were derived from μ and s, using first moment equations:
where σl is the characteristic strength. The Weibull cumulative distribution function was calculated using the following equation:
The Weibull function was then validated by comparing the CDF to the reference normal distribution of experimental strength data.
6. Results
6.1. The Stress–Strain Curve
Ultimate failure was characterized by specimen fracture into two pieces. It occurred systematically under the loading points from the outer surface of beams, at the expected location of maximum tensile stress. The force–strain curves exhibited non-linear deformations at strains increasing from values < 0.1% (Figure 3), like the behavior in traction [4]. This reflects matrix cracking and the associated interface debonding. The strains at maximum forces were of the same order of magnitude as the strains-to-failure of fiber tows (0.8%) [28]. Figure 3 shows that the computed force–strain curve reproduces well the experimental flexure behavior that validates the finite element analysis of strains and stresses. Note that the experimental behavior is plotted with respect to force values since a reference stress–strain curve cannot be extracted from force data because well-accepted exact equations of stresses are not available.
Figure 3.
Example of force stress–strain curve obtained experimentally using symmetric 3-point bending tests. Comparison with computed flexure behavior.
6.2. Flexural Ultimate Strengths
Table 2 and Figure 4 compare the flexural strengths determined using the different approaches. All the approaches provided flexural strength magnitudes that exceed the tensile strength value (Table 2, Figure 4). They converge consistently to a value of about 340 MPa, unlike the equation of elastic beam theory, which estimated the value to be very nearly double. The flexural strengths predicted from tensile strength (Equation (12)) compare quite well with the results of Finite Element Analysis and the values derived from failure strains.
Table 2.
Average estimates of flexural ultimate strengths and predictions using Equation (12) of bundle model. Also reported is the tensile strength.
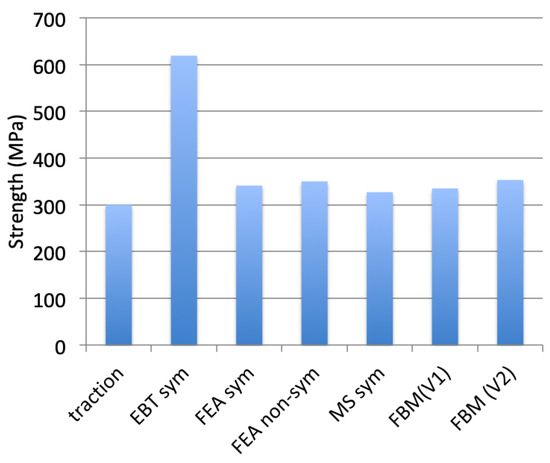
Figure 4.
Average values of flexural strengths determined using various methods: EBT (Elastic Beam Theory), FEA (Finite Element Analysis), MS (Measured Strain), FBM (Fiber Bundle Model). Also plotted is the strength measured using tensile test (traction).
6.3. Strength Variability
Figure 5 shows that the plots of p-quantiles versus strengths fit straight lines. The goodness of fit is characterized by high values of coefficients of linear regression (R2 > 0.96) (Table 3). It can be inferred from these results that the flexural strength distributions can be approximated by the normal distribution function. The plots indicate clearly the respective means (for zp = 0) and the magnitude of dispersion of strength data (by the slope = 1/s). The statistical parameters of normal and Weibull distribution functions are given in Table 4.
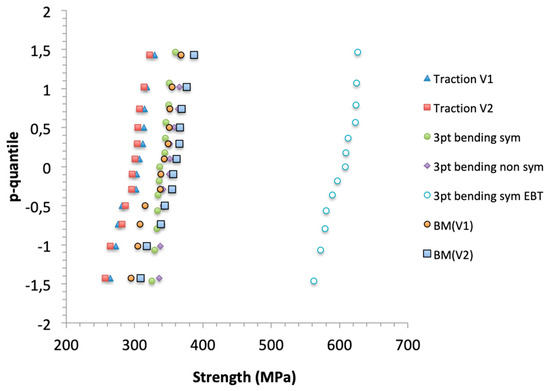
Figure 5.
Plots of p-quantiles vs. strengths in traction and in bending. BM(V1) and BM(V2) refer to strengths predicted using bundle model from tensile strengths of specimens having volume V1 or V2.
Table 3.
Coefficients of correlation relative to p-quantiles-strength diagrams, and normal vs. Weibull CDF.
Table 4.
Statistical parameters of composite strength distributions.
The p-quantile diagrams of FEA flexural strengths are distinct from the tensile ones, indicating a small dependence on dimensions and stress state (Figure 5). Figure 5 also shows the p-quantile diagrams of flexural strengths predicted from tensile strengths using Equation (12) for the mc estimates given in Table 4, and the current gauge lengths of tensile specimens (lt) and span length (L). The predictions agree satisfactorily with the FEA flexural strengths.
The p-quantile diagrams of tensile strengths are superposed (Figure 5), indicating that the tensile strength is independent of specimen dimensions. As mentioned above, the results based on the equation of Elastic Beam Theory were overestimated.
The p-quantile vs. strains-to-failure diagrams display a small dependence on the size of the equivalent stressed volume (Figure 6).
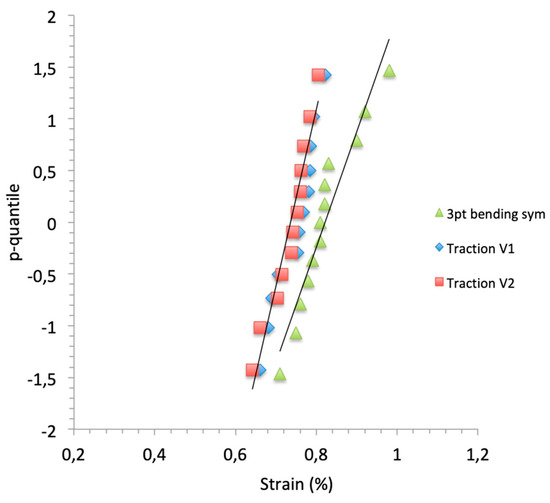
Figure 6.
Plots of p-quantile vs. strains-to-failure.
Figure 7 shows that the Weibull distributions of strengths fit the normal distributions. The goodness of fit is confirmed by the high values of the coefficients of correlation R2 (Table 3). Visually, it is less satisfactory for the strength data estimated using the equation of elastic beam theory. Since the validity of normal distribution was assessed by the linearity of p-quantile diagrams, it can be inferred that the strength data follow the Weibull distribution function. However, it is worth pointing out that the Weibull parameters were not constant, which implies that the Weibull equation was not unique.
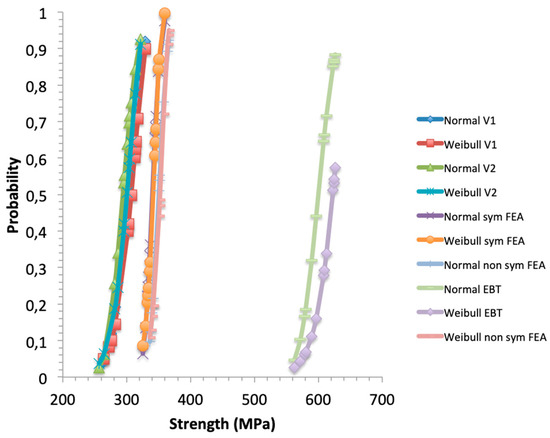
Figure 7.
Normal and Weibull cumulative distributions of traction (referred to as Normal V1 or V2, Weibull V1 or V2), and flexural strengths.
6.4. Critical Filament
The strengths of critical filaments were derived from the composite strengths (σcomp) using the following commonly accepted mixtures law equation [4,29]:
Figure 8 compares the strengths of critical filaments in the composite (σf) given by Equation (22) to the strengths of filaments extracted from the typical force–strain curve of SiC Nicalon tows displayed in [28]. It is worth pointing out that the estimated values of σϕ were close to the theoretical strength of the critical filament in the tow defined by σf(P = αc) (Equation (2)), which is consistent with the analysis. By contrast, the results from EBT were close to the high extreme of filament strength distribution, which corresponds to values of strains around 1.7%. Such strain magnitudes are not consistent with the experimental composite strains at ultimate failure (around 0.9%).
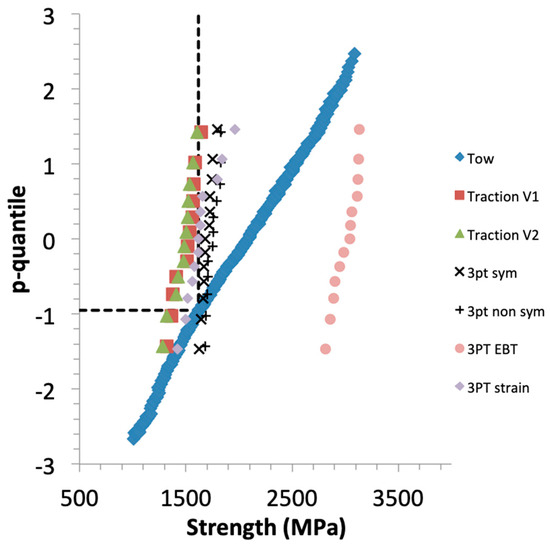
Figure 8.
Plot of filament strengths derived from a tow test, and filament strengths derived from composite strengths. Also indicated (dotted line) is the theoretical strength of a tow under loading at a constant stressing rate σf(P = αc).
7. Discussion
7.1. Flexural Strength
The elastic beam theory-based equation provided significantly overestimated flexural strengths when comparing with the values obtained using the alternative approaches. This trend was confirmed by the corresponding ratio of flexural-to-tensile strengths (Table 2), which was > 2. A similar strength ratio was obtained with the EBT equation on a first generation of SiC/SiC with low strain-to-failure (<0.2%) and on C/SiC [30]. Such high ratios suggest that the composites are as sensitive to flaws as monolithic ceramics on which the strength ratio is 2 for m ≈ 6 [31]. Such a degree of sensitivity looks paradoxical since composite tensile strengths were found to be independent of specimen dimensions, and large values of the composite Weibull modulus (mc > 18; Table 2) were observed in this paper. The flexural/tensile strength ratios obtained with the three alternative approaches are around 1.15 (Table 2). The value of 1.26 was reported in [12]. Values of 1.4–1.5 were obtained on glass-fiber-reinforced polymers in [32,33]. These results contradict the following trend stated by several authors that the flexural strength can exceed the tensile strength by a factor of 3 [16,17,19].
By analogy with the tensile behavior under strain-controlled conditions, it is reasonable to consider that the flexural strength of composites results from overloading by local friction due to the distributive pull-out of broken fibers, owing to the tensile stress state operating parallel to the longitudinal fiber axis. Furthermore, more fibers are increasingly subjected to tensile stresses as the neutral axis of the beam shifts toward the compressive surface. It is important to note that the loading mode was strain-controlled in both the tensile and flexural tests, so that the resulting stress operating on a fiber before failure was not transferred to the surviving fibers [34]. Therefore, the scatter of experimental strengths of critical filaments was logically attributed to variability in interface characteristics and fiber surface roughness. Furthermore, it is worth pointing out that the high strength extreme in the distribution of filament critical strengths coincided with the theoretical value (Figure 8).
The linearity of p-quantile diagrams seems to be acceptable, which means that the strength distributions can be approximated by normal distribution functions. The Weibull CDF showed good agreement with the corresponding normal distributions. The tensile strength distributions did not display dependence on tensile specimen dimensions, which can be attributed to the fact that the flaw populations were reproducible; in other words, each tensile specimen contained the full population of flaws inherent to the considered fiber type. This results from the huge number of critical flaws/filaments in a tensile composite test specimen that contains roughly 30,000 filaments, as pointed out in a previous paper [4]. The statistical parameters of composite tensile strengths were quite close. From this feature, it can be inferred that the tensile strength data can be characterized by unique normal and Weibull distribution functions.
The flexural strength statistical parameters were significantly different from the tensile strength ones. This feature can be attributed to the stress gradient that induces an equivalent stressed volume much smaller than that of tensile specimens. According to Equation (9) of the equivalent volume, the equivalent gauge length was 13 mm. It is significantly smaller than the critical size above which the full population of critical flaws is present. This critical size was shown to be around 60 mm for SiC fiber tows [35]. Therefore, the population of critical flaws in the tensile stressed volume of flexural specimens probably differed from the full population. It was less heterogeneous, and the strengths of critical filaments were larger in the CDF, as big flaws are less frequently present in small volumes. This effect is reflected by the increase in Weibull parameters. It can be simulated by truncating the strength distribution.
Nevertheless, the bundle model (Equation (12)) predicted flexural strengths that compared well with the experimental strengths, although the Weibull parameters of tensile and flexural specimens were significantly different (Figure 5). This goodness of fit results from the limited influence of mc increases at high values (Equation (12)). Figure 9 depicts the variations of the ratio of flexural to tensile strengths as a function of Weibull modulus mc for various ratios of gauge/span lengths. It shows a ratio of flexural to traction strengths < 1.2 when mc > 10, and <1.1 for the current values of mc: 18 for traction, and 40 for bending. Figure 9 also shows that the influence of mc becomes significant for mc < 3.
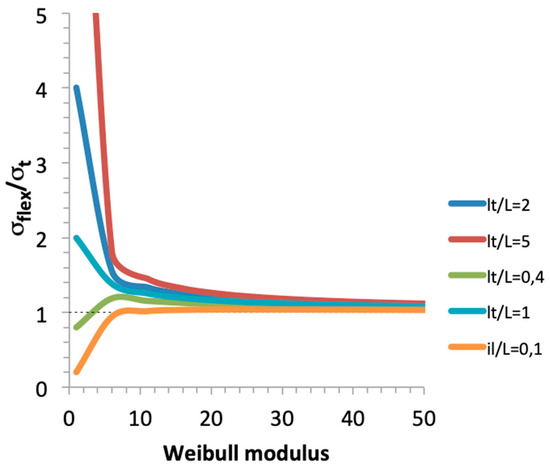
Figure 9.
Influence of composite Weibull modulus on ratio of flexural to tensile strengths, for various ratios of gauge/span lengths.
7.2. Implications for the Prediction of Tensile Strength from Bending Strength Data
Concerning the prediction of tensile strength from flexural test results, it appears from the above that large flexural test specimens would be preferred in order to impair the size effect. However, the use of large specimens may limit the interest of flexural tests with respect to the practical disadvantages of traction tests on composites. With large test specimens, the flexural strength may be a good estimate of tensile strength when the specimens contain the full population of critical flaws or when the Weibull modulus mc is quite large (typically mc > 20).
When small flexural test specimens are used, Equation (12) should allow the prediction of tensile strength when the Weibull moduli of flexural and tensile strengths do not exhibit significant variation. If any, the difference in Weibull moduli will not affect the predictions when mc > 20.
7.3. Reproducibility of Flaw Population
Is it reasonable to expect a reproducible flaw population at small gauge lengths below the tow critical size, so that the distribution functions are unique (constant statistical parameters). This issue can be examined by considering the relation between the sizes of crack-like critical flaws at increasing volume.
At a given value of probability in the CDF, filament tensile strengths at increasing volume are related by the following equation derived from Equation (10), for constant statistical parameters:
where σ2i and σ1i are the strengths at volumes V2 > V1, respectively. a2i and a1i are the corresponding flaw sizes related to strengths by the fracture mechanics equation; i is the rank of strengths in the CDF:
where Y is a constant and KIC is the critical stress intensity factor.
The flaw sizes at constant probability are scaled according to the following equation as the volume increases.
Equation (25) expresses the requirement that must be met by flaw sizes so that the Weibull parameters are invariant and, consequently, that the tensile strength distributions follow the Weibull distribution whatever the dimensions. It can be reasonably conjectured that the probability of this event is very small. Therefore, it seems reasonable to draw the conclusion that, in most cases, the Weibull distribution function depends on specimen dimensions below the critical size. This is an additional disadvantage for the use of small size test specimens.
8. Conclusions
Various original results were obtained in this paper on the flexural strength of fiber-reinforced SiC/SiC, on its relation with tensile strength and with the strength of the critical filament that triggers failure of a fiber tow. The determination of flexural strengths of fiber-reinforced composites is not straightforward, as the classical equation for homogeneous materials and elastic beams was found to significantly overestimate the SiC/SiC value by a factor of 2. The alternative approaches based on either finite element analysis or strain measurement, as well as the predictions from tensile strength led to an estimate close to 340 MPa, slightly larger than the value obtained using tensile tests.
The scatter of flexural strengths was characterized satisfactorily by normal and Weibull distribution functions. It was attributed to the sources of variability identified on tensile tests, i.e., the variability in the overloading of filaments governed by fiber/matrix interface characteristics. The strengths were related to the scatter of critical filament strength around the theoretical value.
The flexural strengths were slightly larger than the tensile strengths, reflecting a limited specimen size effect. This size effect was attributed to the small equivalent stressed volume of flexural specimens, such that the gauge length was probably below the critical size when the full population of critical flaws was present. The relation between flexural and tensile strengths was satisfactorily predicted using the fiber tow-based model. This model appears to be pertinent for those composites that fail from debonded tows after saturation of matrix cracking (which means that they didn’t experience premature failure).
From these results it can be anticipated that small flexural test specimens may not be appropriate for estimating tensile strengths, except when the flexural and tensile strengths follow a unique distribution function. A prerequisite for this is to assess the validity of distribution functions using an unbiased approach like the p-quantile-based method. Then, the pertinence of prediction of tensile strengths will depend on the magnitude of the Weibull modulus, as the Weibull modulus is expected to exhibit variability below a critical specimen size. Variability at high values will not affect the predictions. Because of these limitations, small flexural specimens cannot be recommended.
Bending tests on damage-tolerant CMCs must be regarded as tests on components. A sophisticated analysis is required to derive stress data. By contrast, tensile testing is more appropriate to determine some generic properties that are useful for material evaluation or as input for models.
Funding
This research received no external funding.
Data Availability Statement
Data are available upon request.
Conflicts of Interest
The author declares no conflicts of interest.
References
- Lamon, J. CVI SiC/SiC Composites. In Handbook of Ceramics and Glasses; Bansal, N.P., Ed.; Kluwer Academic Publishers: New York, NY, USA, 2005; Chapter 3; pp. 55–76. [Google Scholar]
- Lamon, J. Approach to microstructure-behavior relationships for ceramic matrix composites reinforced by continuous fibres. In Ceramic Matrix Composites: Materials, Modeling and Applications; Bansal, N.P., Lamon, J., Eds.; John Wiley and Sons, Inc.: Hoboken, NJ, USA, 2014; Chapter 18. [Google Scholar]
- Davidge, R.W. The mechanical properties and Fracture behavior of ceramic matrix composites reinforced with continuous fibers. In Application of Fracture Mechanics to Composite Materials; Friedrich, K., Ed.; Elsevier Science Publishers: Amsterdam, The Netherlands, 1989; Volume 6, Chapter 13; pp. 547–569. [Google Scholar]
- Lamon, J. The Ultimate Tensile Strength of SiC/SiC Composites: Multiscale Approach. J. Compos. Sci. 2025, 9, 45. [Google Scholar] [CrossRef]
- Marshall, D.B.; Ritter, J.E. Reliability of Advanced structural ceramics and ceramic matrix composites. Ceram. Bull. 1987, 66, 309–317. [Google Scholar]
- Raghuraman, S.; Lara Curzio, E.; Ferber, M.K. Modeling of flexural behavior of continuous fiber ceramic composites. Ceram. Eng. Sci. Proc. 1996, 17, 47–156. [Google Scholar]
- Miriyala, N.; Liaw, P.K.; McHargue, C.J.; Selvaratinam, A.; Snead, L.L. The effect of fabric orientation on the flexural behavior of CFCCs: Experiment and theory. In Advances in Ceramic Matrix Composites IV. Ceramic Transactions; Singh, J.P., Bansal, N.P., Eds.; The American Society: Westerville, OH, USA, 1999; pp. 451–463. [Google Scholar]
- Chawla, N.; Liaw, P.K.; Lara-Curzio, E.; Ferber, M.K.; Lowden, R.A. Effect of fiber fabric orientation on the flexural monotonic and fatigue behavior of 2D woven ceramic matrix composites. Mater. Sci. Eng. A 2012, 557, 77–83. [Google Scholar] [CrossRef]
- Miriyala, N.; Liaw, P.K.; McHargue, C.J.; Snead, L.L. Specimen size effects on the flexural behavior of CFCCs. In Ceramic Engineering and Science Proceedings; Bray, D., Ed.; The American Society: Westerville, OH, USA, 1998; Volume 19, pp. 199–209. [Google Scholar]
- Hofmann, S.; Öztürk, B.; Koch, D.; Voggenreiter, H. Experimental and numerical evaluation of bending and tensile behaviour of carbon-fibre reinforced SiC. Compos. Part A Appl. Sci. Manuf. 2012, 43, 1877–1885. [Google Scholar] [CrossRef]
- Hild, F.; Domergue, J.-M.; Leckie, F.A.; Evans, A.G. Tensile and flexural ultimate strength of fiber-reinforced ceramic-matrix composite. Int. J. Solids Struct. 1994, 31, 1035–1045. [Google Scholar] [CrossRef]
- McNulty, J.C.; Zok, F.W. Application of weakest-link fracture statistics to fiber-reinforced ceramic-matrix composites. J. Am. Ceram. Soc. 1997, 80, 1535–1543. [Google Scholar] [CrossRef]
- Chulya, A.; Gyekenyesi, J.Z.; Gyekenyesi, J.P. Failure mechanisms of 3-D woven SiC/SiC composites under tensile and flexural loading at room and elevated temperatures. In Proceedings of the 16th Annual Conference on Composites and Advanced Ceramic Materials, Cocoa Beach, FL, USA, 8 January 1992; Ceramic Engineering and Science Proceedings; The American Society: Westerville, OH, USA, 1992; pp. 421–432. [Google Scholar]
- Caputo, A.J.; Lackey, W.J.; Stinton, D.P. Development of a New, Faster Process for the Fabrication of Ceramic Fiber-Reinforced Ceramic Composites by Chemical Vapor Infiltration. Ceram. Eng. Sci. Proc. 1985, 6, 694–706. [Google Scholar]
- Morrell, R.; McCartney, L.N. Measurement of properties of brittle matrix composites. Br. Ceram. Trans. 1993, 92, 1–7. [Google Scholar]
- Steif, P.S. Trojnacki, Bend strength versus tensile strength of fiber-reinforced ceramic composites. J. Am. Ceram. Soc. 1994, 77, 221–229. [Google Scholar] [CrossRef]
- Laws, V. Derivation of the tensile stress-strain curve from bending data. J. Mater. Sci. 1981, 16, 1299–1304. [Google Scholar] [CrossRef]
- Aveston, J.; Mercer, R.A.; Sillwood, J.M. Composites–Standard Testing and Design. In Proceedings of the Conference Proceedings, NPL, New York, NY, USA, 8–9 April 1974; IPC: London, UK, 1974; Volume 3. [Google Scholar]
- Chuang, T.-J.; Mai, Y.-W. Flexural behavior of strain-softening solids. Int. J. Solids Struct. 1989, 25, 1427–1443. [Google Scholar]
- Foster, G.C. Tensile and Flexure Strength of Unidirectional Fiber-Reinforced Composites: Direct Numerical Simulations and Analytic Models. Master’s Thesis, Virginia Polytechnic Institute and State University, Blacksburg, Virginia, 20 February 1998. [Google Scholar]
- Calard, V.; Lamon, J. Failure of fibres bundles. Compos. Sci. Technol. 2004, 64, 701–710. [Google Scholar] [CrossRef]
- Calard, V. Approches Statistiques-Probabilistes du Comportement Mécanique des Composites à Matrice Céramique. Ph.D. Thesis, University of Bordeaux, Bordeaux, France, 1948. Volume 199. [Google Scholar]
- Calard, V.; Lamon, J. A probabilistic approach to the ultimate failure of ceramic-matrix composites-part I: Nexperimental investigation of 2D woven SiC/SiC composite. Compos. Sci. Technol. 2002, 62, 385–393. [Google Scholar] [CrossRef]
- Timoshenko, S. History of Strength of Materials; McGraw-Hill: New York, NY, USA, 1953. [Google Scholar]
- Gere, J.M.; Timoshenko, S.P. Mechanics of Materials; PWS Pub Co.: Boston, MA, USA, 1997. [Google Scholar]
- Weibull, W. A statistical distribution function of wide applicability. J. Appl. Mech. 1951, 18, 293–297. [Google Scholar] [CrossRef]
- Lamon, J.; R’Mili, M. Investigation of flaw strength distributions from tensile force-strain curves of fiber tows. Compos. Part A 2021, 145, 106262. [Google Scholar] [CrossRef]
- R’Mili, M.; Godin, N.; Lamon, J. Flaw strength distributions and statistical parameters for ceramic fibers: The normal distribution. Phys. Rev. E 2012, 85, 1106–1112. [Google Scholar] [CrossRef]
- Knowles, K.M.; Yang, X.F. Mathematical Modeling of the strength and toughness of unidirectional fiber-reinforced cetamics. Ceram. Eng. Sci. Proc. 1991, 12, 1375–1388. [Google Scholar]
- Inghels, E.; Lamon, J. An approach to the mechanical behavior of SiC/SiC and C/SiC ceramic matrix composites. 1- Experimental results. J. Mater. Sci. 1991, 26, 5403–5410. [Google Scholar] [CrossRef]
- Lamon, J. Brittle Fracture and Damage of Brittle Materials and Compsites: Statistical–Probabilistic Approaches; Elsevier Ltd.: Oxford, UK; ISTE Press Ltd.: London, UK, 2016. [Google Scholar]
- Wisnom, M.R. The effect on specimen size on the bending strength of unidirectional carbon fiber-epoxy. Compos. Struct. 1991, 18, 47–63. [Google Scholar] [CrossRef]
- Wisnom, M.R. Relationship between strength variability and size effect in unidirectionall carbon fiber/epoxy. Composites 1991, 22, 47–52. [Google Scholar] [CrossRef]
- Lamon, J. The Unstable Fracture of Multifilament Tows. J. Compos. Sci. 2024, 8, 52. [Google Scholar] [CrossRef]
- Lamon, J.; R’Mili, M. Investigation of Specimen Size Effects on P-Quantile Diagrams and Normal Distributions of Critical Flaw Strengths in Fiber Tows. J. Compos. Sci. 2022, 6, 171. [Google Scholar] [CrossRef]
Disclaimer/Publisher’s Note: The statements, opinions and data contained in all publications are solely those of the individual author(s) and contributor(s) and not of MDPI and/or the editor(s). MDPI and/or the editor(s) disclaim responsibility for any injury to people or property resulting from any ideas, methods, instructions or products referred to in the content. |
© 2025 by the author. Licensee MDPI, Basel, Switzerland. This article is an open access article distributed under the terms and conditions of the Creative Commons Attribution (CC BY) license (https://creativecommons.org/licenses/by/4.0/).