Article

Assessment of Sustainable Structural Concrete Made by Composite Waste for the Concrete Industry: An Experimental Study

by
Jamal K. Nejem
1,
Mohammad Nadeem Akhtar
1,*,
Amin H. Almasri
2 and
Mohd Salman Rais
3
1
Department of Civil Engineering, College of Engineering, Fahad Bin Sultan University, Tabuk 71454, Saudi Arabia
2
Civil Engineering Department, Faculty of Engineering, Jordan University of Science and Technology, P.O. Box 3030, Irbid 22110, Jordan
3
Department of Civil Engineering, Vivekananda College of Technology & Management, Aligarh 202002, Uttar Pradesh, India
*
Author to whom correspondence should be addressed.
J. Compos. Sci. 2025, 9(6), 279; https://doi.org/10.3390/jcs9060279
Submission received: 17 April 2025 / Revised: 19 May 2025 / Accepted: 26 May 2025 / Published: 30 May 2025
(This article belongs to the Special Issue Composites: A Sustainable Material Solution, 2nd Edition)

Abstract

:
Natural sand and high OPC utilization in the concrete industry have affected our environment and caused climate change. This study developed a novel methodology to prepare modified sand by adding (50% R-Sand + 50% M-Sand) to replace 100% natural sand. The two SCMs (5–20% of FA) and 10% of optimized SF were added to the four newly developed concrete mixes. The developed sustainable design mix concrete achieved the design and target strength after a curing period of 28 days. The findings for flexural strength showed comparable trends. Significant strength improvement was also seen at later curing ages, till 182 days. The water absorption and sulfuric acid attacks of the design mix concrete at the hardened stage were also measured. The analysis reveals that water absorption percentages tend to decline as the curing age progresses. The developed mixes show better resistance against sulfuric acid attacks than the reference mix NAC*. A mass loss of around 5% was discovered, much closer to the published studies. The developed mix 15FASFRSC showed consistent results when the modified sand (50% R-Sand + 50% M-Sand) was combined with the SCMs of (15% FA + 10% SF). Hence, the mix 15FASFRSC is the best sustainable mix for the concrete industry.

1. Introduction

Sand used in the construction industry comes from regional quarries and rivers, but those sources are now depleted. River sand is a vital ingredient in concrete. The worldwide demand for river sand is much higher than the availability [1]. The construction activities are removing sand from the natural habitat, threatening the environment and the ecosystem. For instance, sand extraction has significantly impacted rivers over the past decade. The severe floods experienced in India, Bangladesh, and China in recent decades have been linked to extensive sand mining, as reported by [2]. This practice can lead to accelerated riverbed and bank scouring, widening channel areas, and weakening nearby bridge foundations. Therefore, exploring alternative sources of natural sand is crucial to protect the environment and preserve the ecosystem. Recent studies on using solid waste as sand in concrete to replace the river sand are popular. The recycled sand from demolished concrete, natural dune sand from the desert, and PET waste from waste polythene are some options experimentally studied by [3,4,5].
Supplementary cementitious materials (SCMs) like fly ash (FA) and silica fume (SF) in place of cement can contribute to conserving limestone and other natural resources, as highlighted by [6]. The partial replacement of FA and SF concrete has reduced its reliance on cement. Additionally, including FA and SF in concrete manufacturing has enhanced the material’s strength and longevity [7,8]. Recent studies showed up to 10% inclusion of SF in place of ordinary Portland cement (OPC), which showed that optimal strength was reported by [9,10]. Past studies revealed that the optimum level of FA replacement in concrete production was about 25% [11,12]. The studies observed that when optimal percentages of FA and SF were added to newly prepared mixes, an enhancement in strength was reported [13,14]. It has been observed from past published studies that FA and SF are ideal SCMs for the optimal level of the design mix concrete. The literature review of detailed experimental data can provide a new direction for research on sustainable concrete made by SCMs.
This section discusses experimental data to replace the natural river sand with sustainable sand and FA and SF with OPC in concrete manufacturing. Studies have shown that incorporating recycled aggregates from waste concrete into new concrete formulations can enhance their engineering properties and environmental benefits [15,16]. A recent study demonstrated that up to 30% replacement of sand prepared by recycling concrete with natural sand in new concrete results in a slight reduction of about 5% in hardened concrete compressive strength [9]. The study further revealed that incorporating more recycled sand beyond 50% significantly reduced compressive strength. In addition, the rate of gaining strength was reduced with the increased amount of recycled sand. The study concluded that longer curing durations are required to reach the intended design strength [9,17]. Similar findings on recycled sand substitution with natural river sand found the same pattern of reduction in compressive strength with the increment of recycled sand. At the replacement ratio of 50%, a (15–20%) reduction in the compressive strength was noted. The studies concluded that the concrete’s strength, such as compressive and tensile, was reduced when a higher replacement of recycled sand was added [9,18,19]. Several recent studies showed that the SCMs FA and SF helped to improve concrete strength. The optimal level of FA and SF affected compressive strength, and it is revealed from the published studies that about a 20–30% increment was reported in new design mix concrete [9,20,21,22,23]. Adding higher percentages of recycled aggregates to new concrete reduced the strength characteristics. However, even with higher percentages of recycled aggregates, optimal dosages of SF showed increased strength characteristics. Up to 50% replacement of recycled sand with natural sand and 10% SF reported slight higher strength than control mix with natural aggregates [15,24,25]. Recent studies have also reported the durability of using recycled sand in concrete manufacturing. The water absorption in recycled sand is higher than that of natural sand. The porous behavior of recycled sand increased the absorption capacity, and ultimately, this phenomenon affected the hardened strength of concrete made with a higher amount of recycled sand. For this reason, the studies do not recommend 100% replacement of recycled sand with natural sand [9,26,27].
It has been reported from the literature reviewed that recycled sand can be substituted in new concrete without any change in the engineering properties of up to 30%. A higher amount of recycled sand showed a reduction in the strength characteristics. However, some studies revealed that up to 50% can be utilized. Furthermore, incorporating FA and SF can significantly improve the engineering properties. This study has filled a gap in studying the combined effect of recycled sand with SCMs of FA and SF together. This study aims to minimize the strength reduction of recycled sand concrete by adding optimized SCMs (FA and SF) together. This study explores the feasibility of utilizing recycled sand, FA, and SF as alternatives to river sand and OPC to develop novel concrete mix designs for the concrete industry. Hence, this research was planned to study the strength properties of the developed concrete mixes, including compressive strength, flexural strength, stress-strain behavior, and durability in an acidic environment.

2. Materials and Methods

2.1. Materials

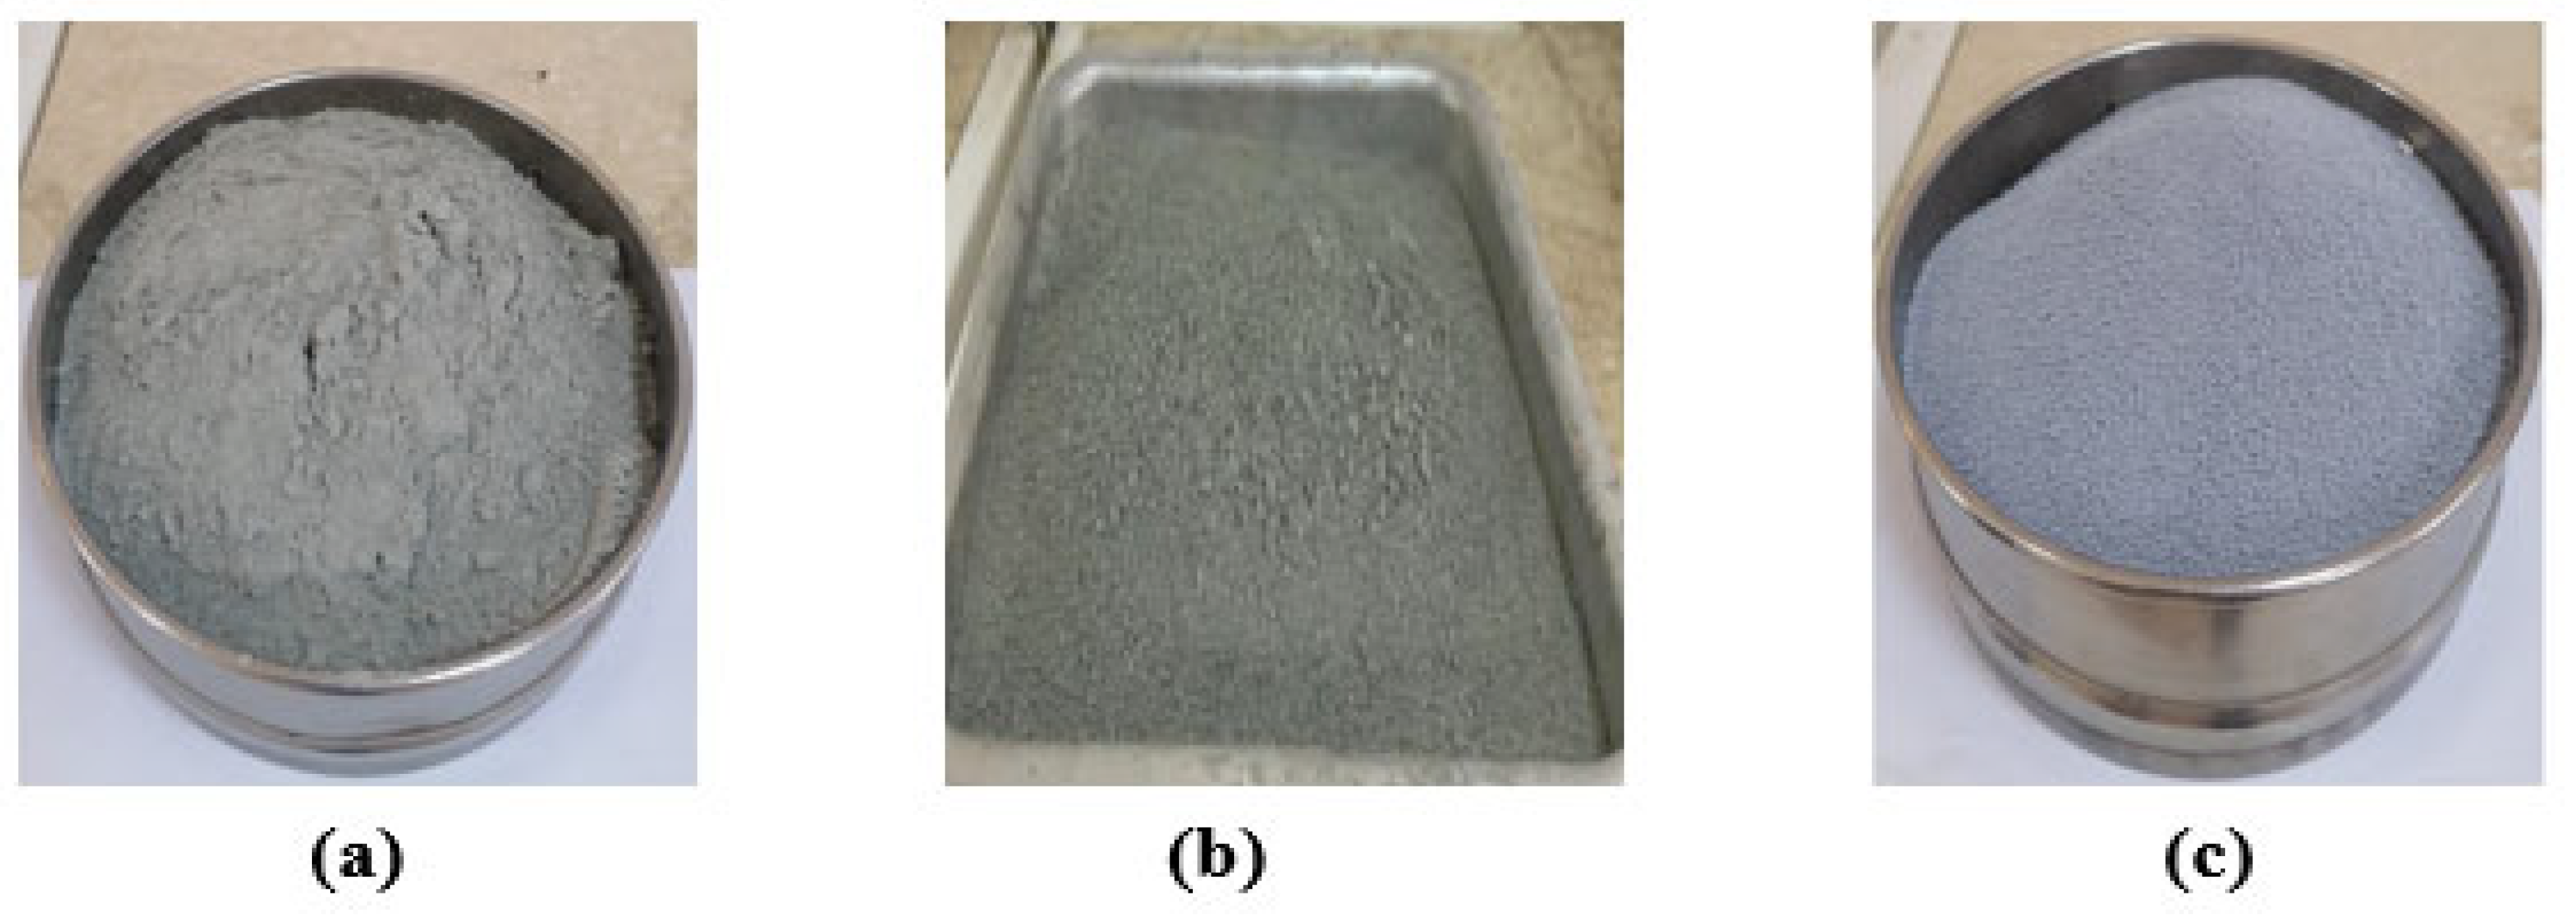
2.1.1. Cement and Supplementary Cementitious Materials

In this study, OPC, FA, and SF are the binding materials, as depicted in Figure 1a–c. In the current research, FA and SF were sourced from Abdin Construction Company in Tabuk, Saudi Arabia, and from Elkem Pvt. Ltd. Microsilica is the most revolutionary concrete additive discovered recently.

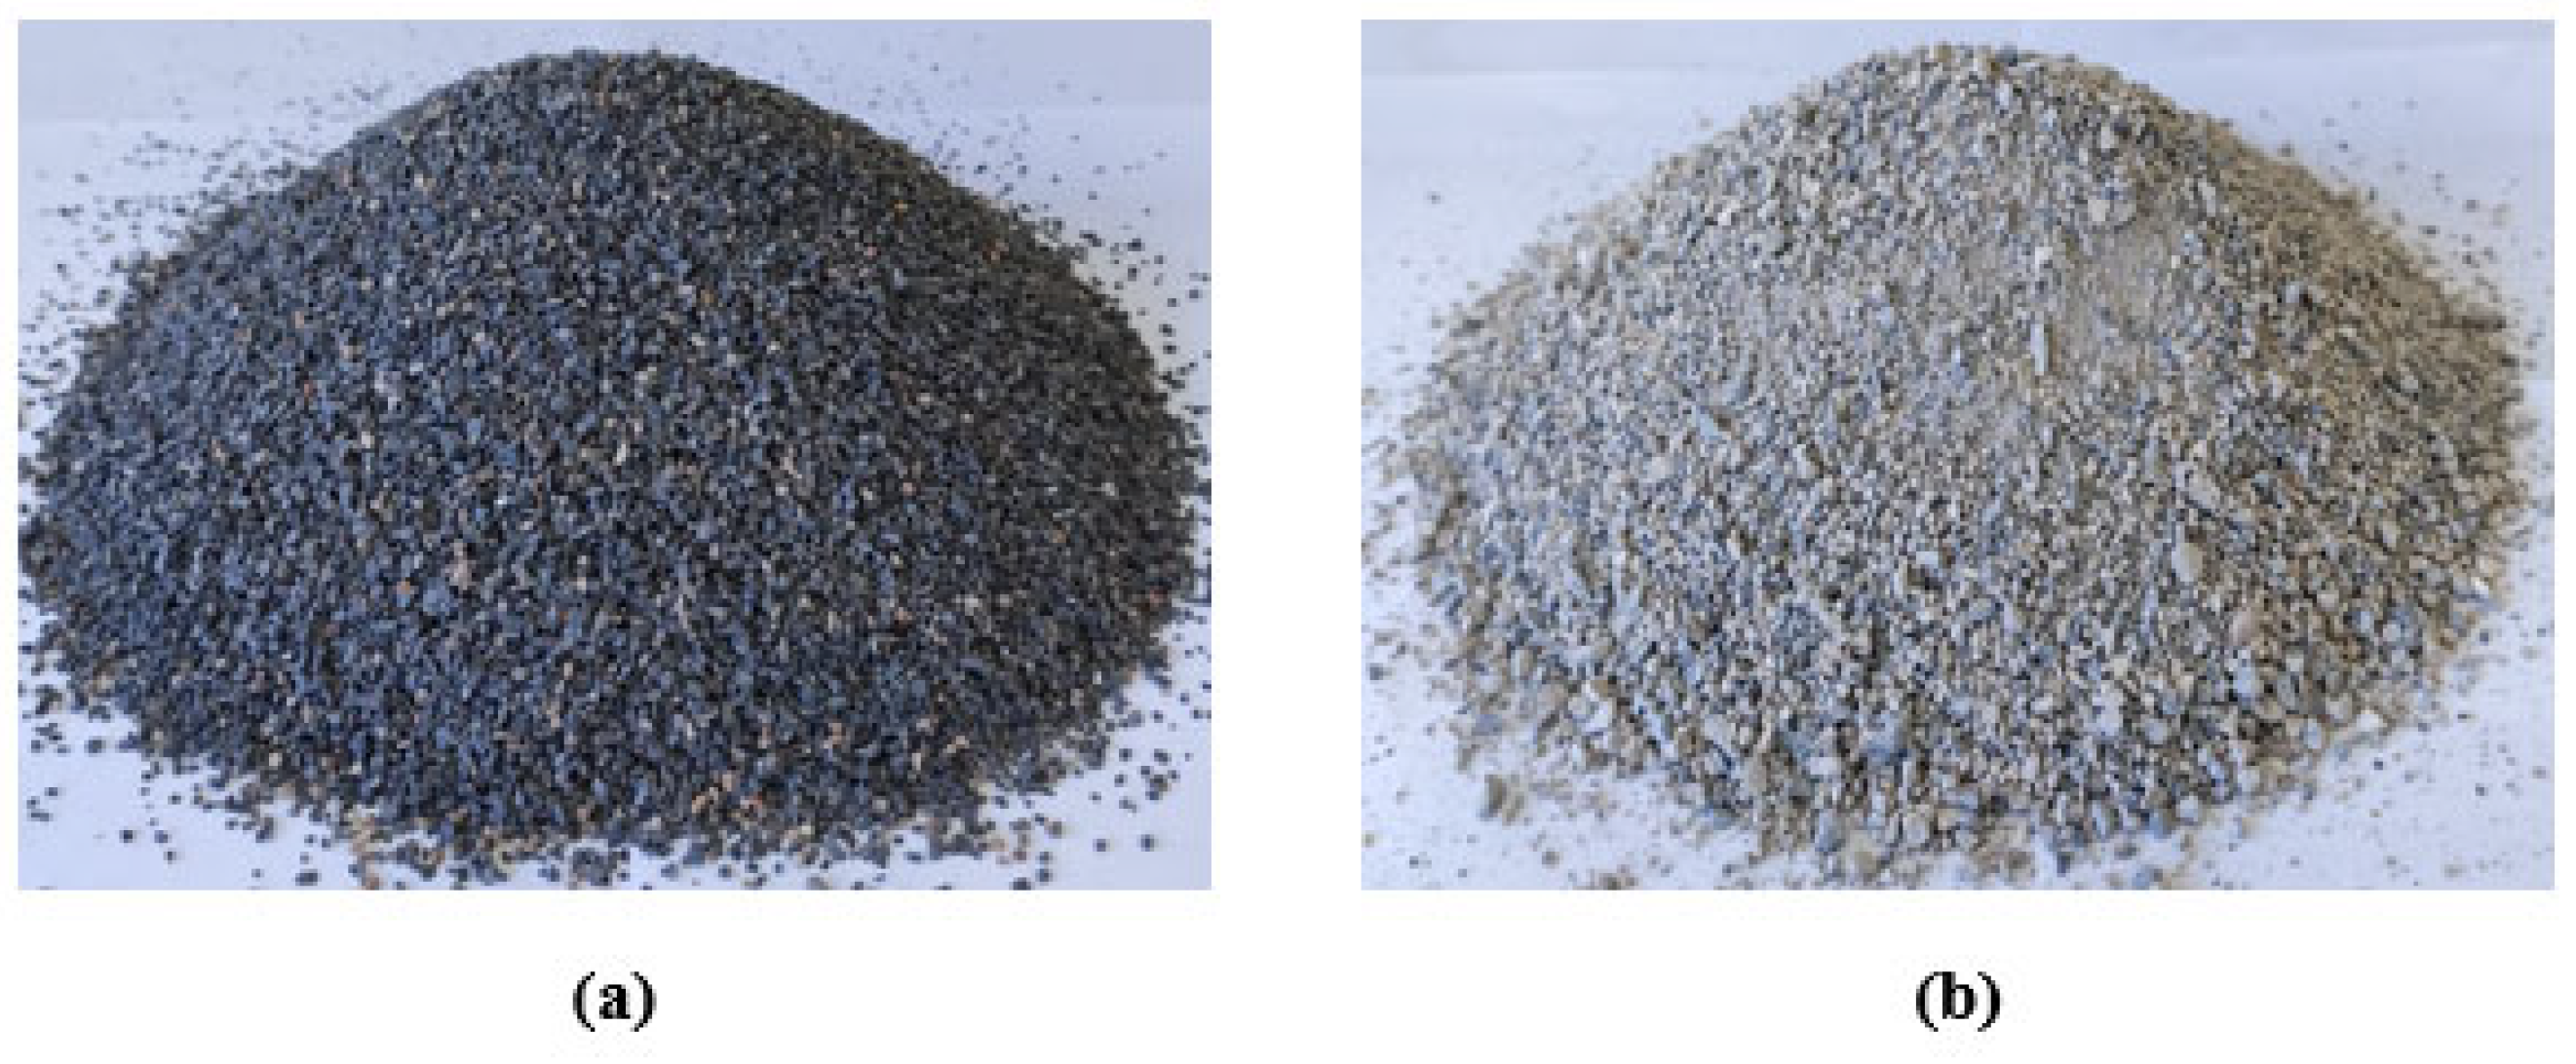
2.1.2. M-Sand and R-Sand

The manufactured sand (M-Sand) of size (≤5 mm) was obtained from Abdin Construction Company, Tabuk, Saudi Arabia. The residue materials generated in the processing plant while breaking down the naturally fractured rocks for natural coarse aggregate (NCA) were collected and sieved in the laboratory to produce M-Sand. The M-Sand is the waste material from the crushing plant that replaces natural river sand, which is considered sustainable sand.
The second fine aggregate, recycled sand (R-Sand), was developed from demolished concrete samples from multiple sites. These chosen samples of demolished concrete must comply with the strength standards specified by [28]. The concrete samples that fulfilled the specified criteria in [28] were collected and subsequently crushed at the aggregate processing facility of Abdin Construction Company. In Figure 2, part (a) displays M-Sand, while part (b) presents R-Sand.

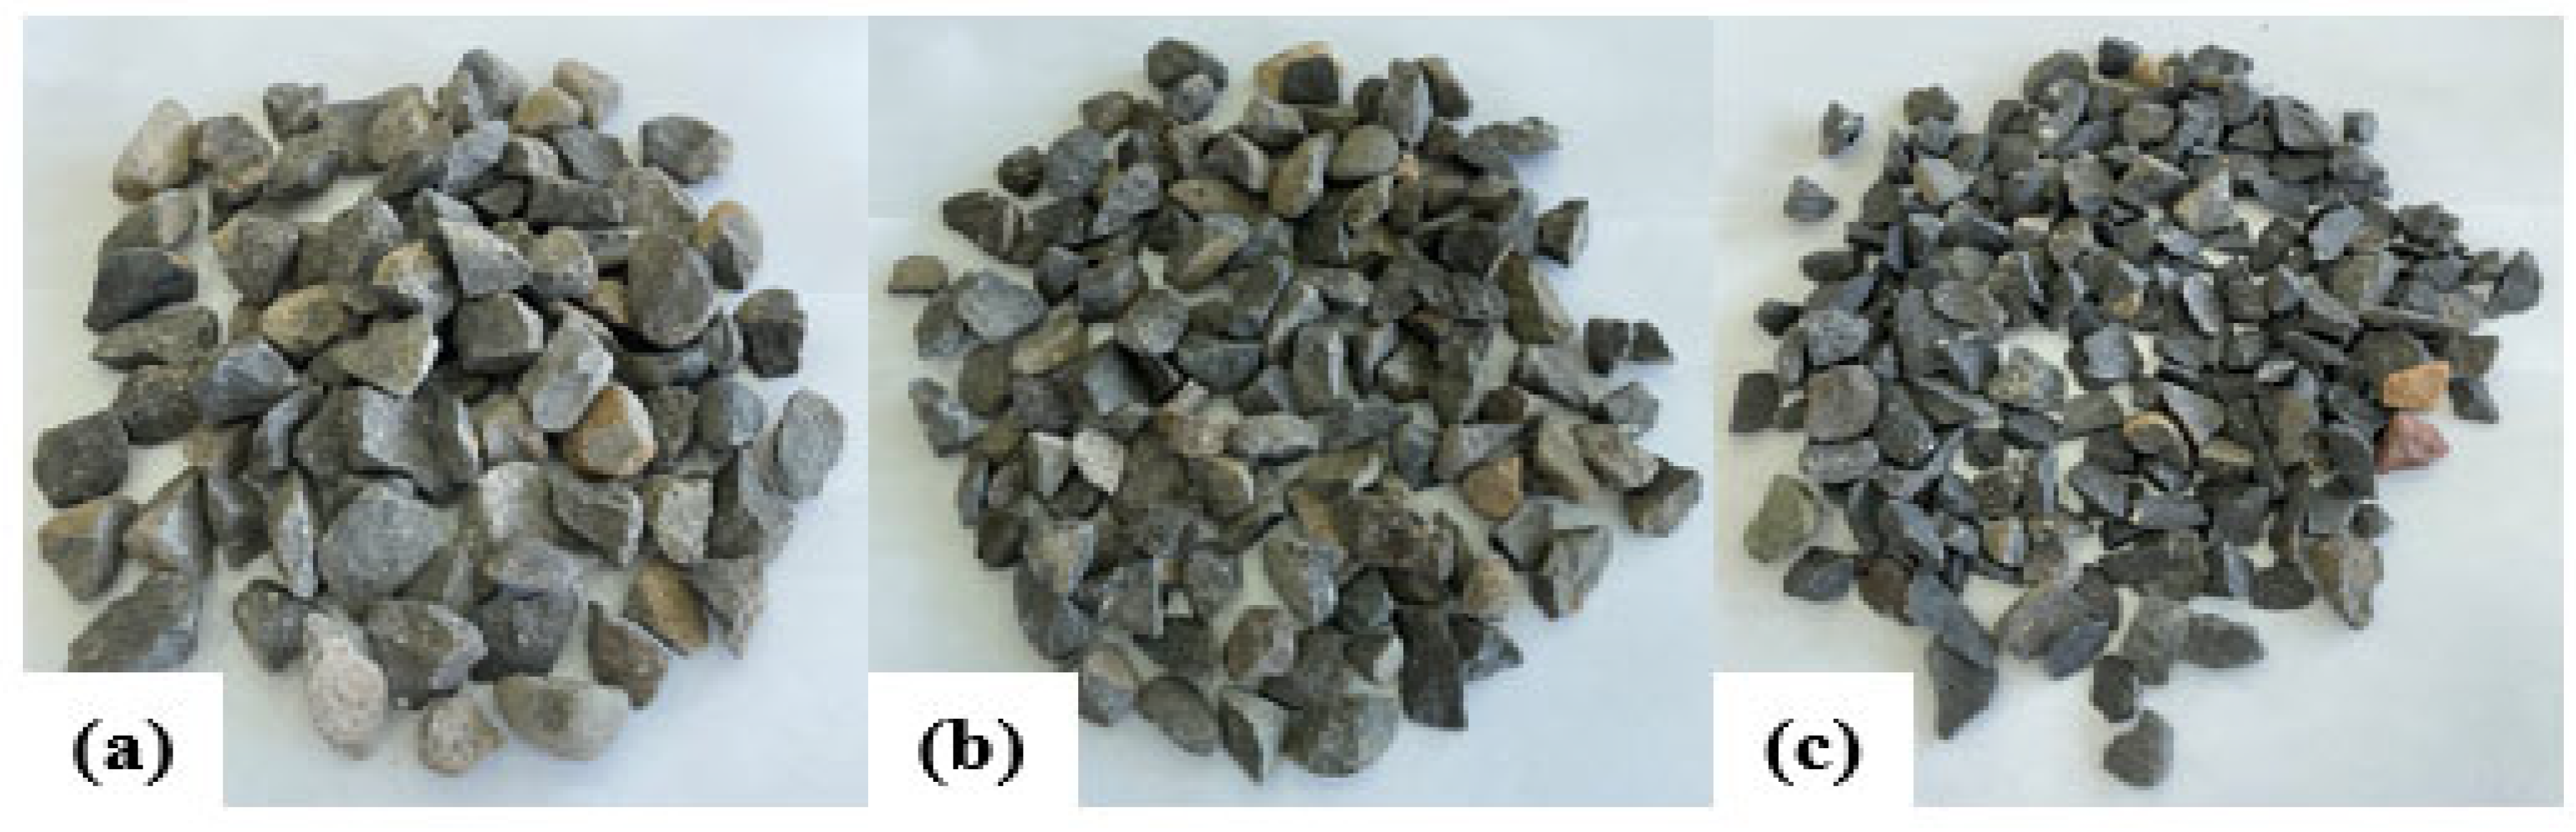
2.1.3. Coarse Aggregate
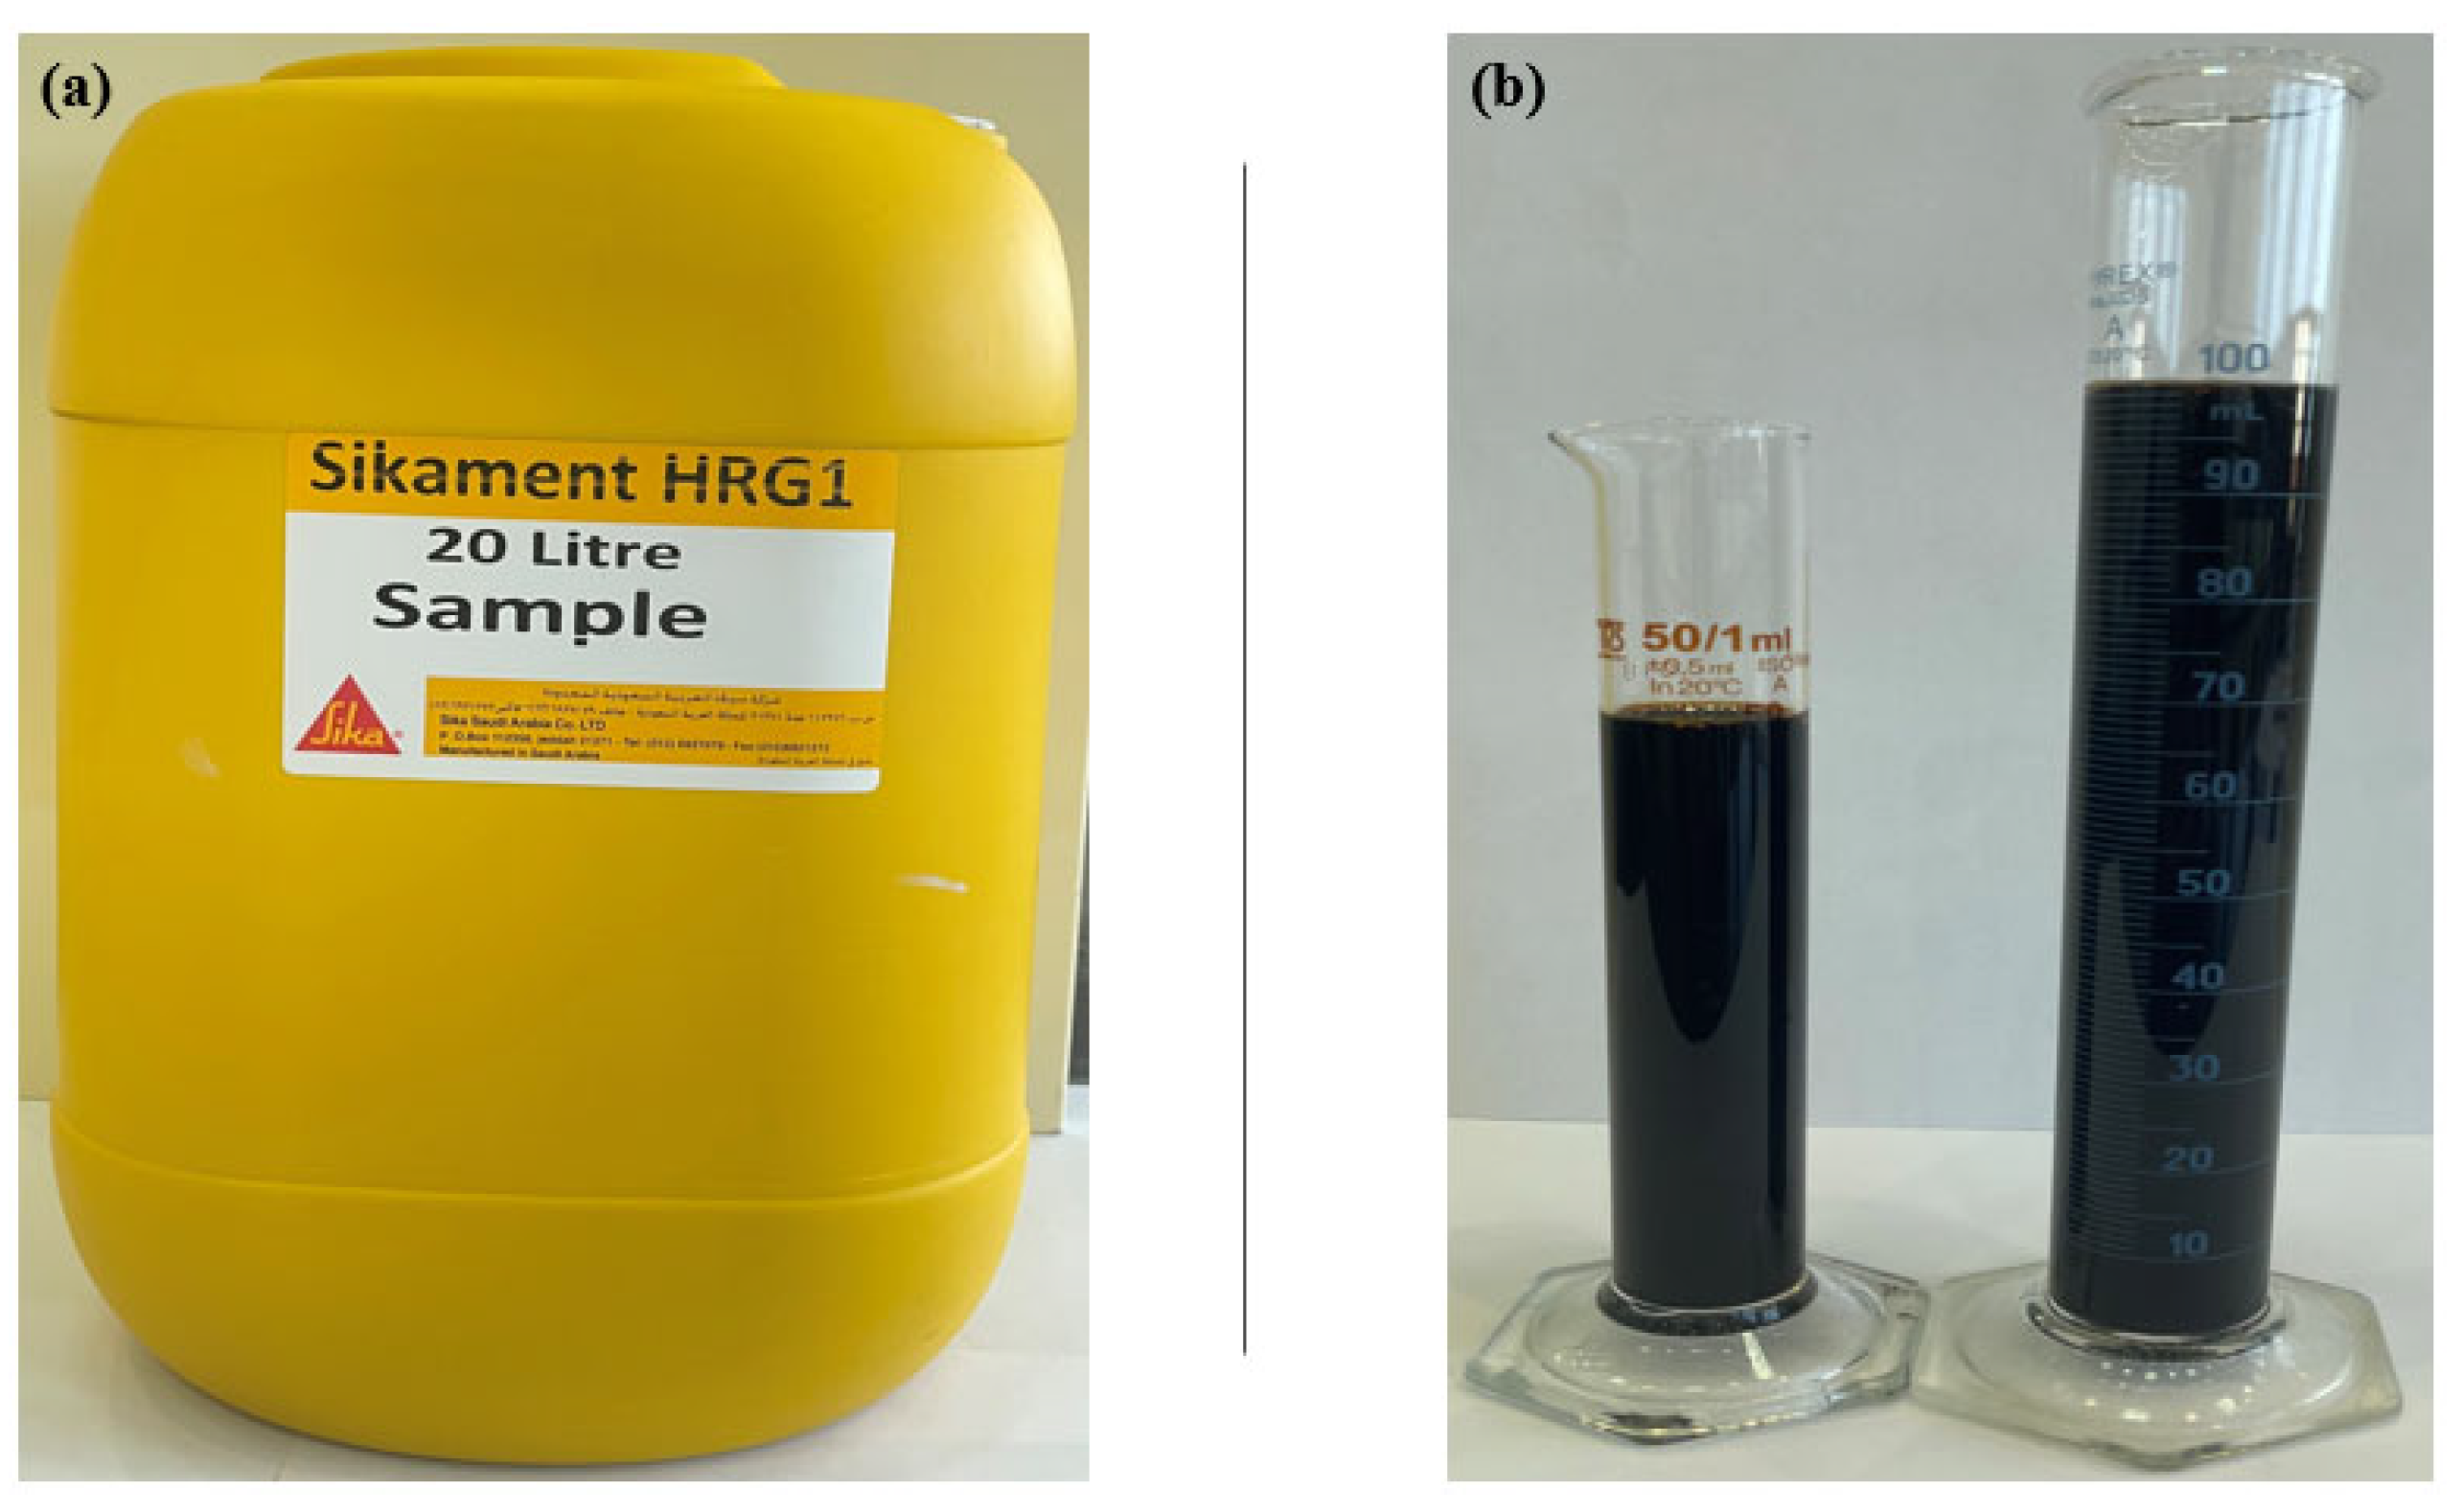
This study focused on developing sustainable modified concrete by incorporating natural coarse aggregate (NCA) of particle sizes 19 mm, 12.5 mm, and 9.5 mm, blended in a proportion of 3:2:1, as shown in Figure 3a–c.

2.1.4. Admixture

As per the standard [29], the slump-maintaining admixture was utilized to maintain the 100 mm slump for all prepared mixes of this study. Figure 4a,b show F-type water-reducing, high-range admixtures (20 L container) with measuring cylinders.

2.2. Methodologies

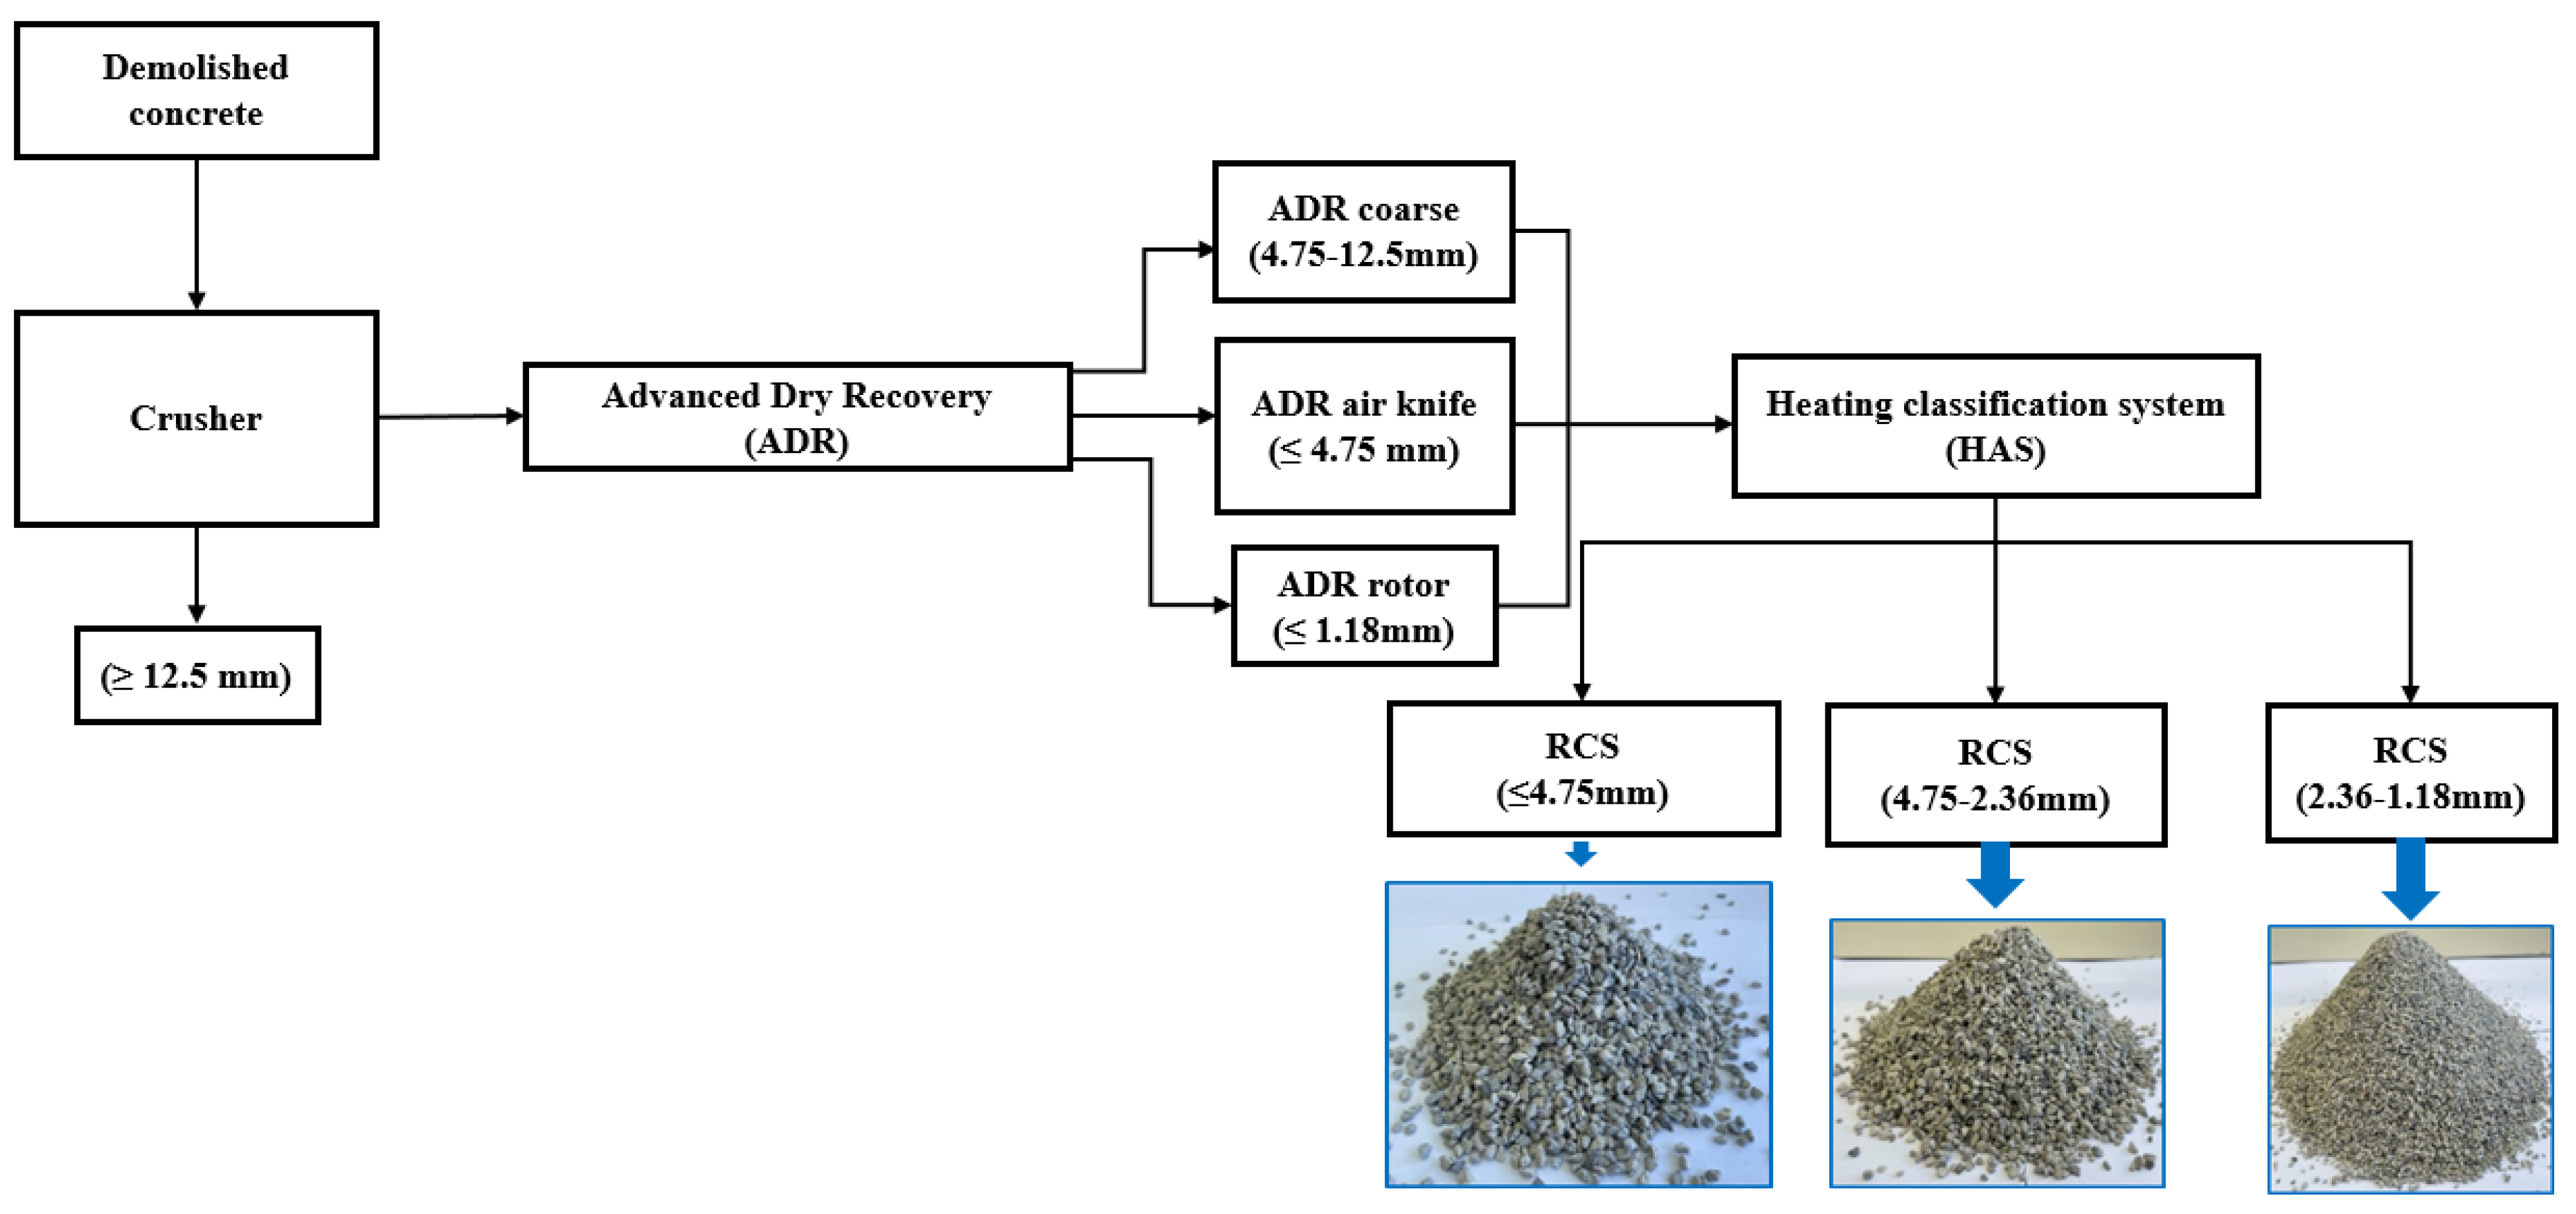
2.2.1. Developed Methodology for Recycled Sand Preparation

Demolished concrete primarily consists of aggregate and cement dust. In the initial stage of processing aggregates from concrete that has been demolished, selective demolition plays a crucial role by enabling the sorting of waste materials according to their characteristics, type, and composition. Even once other materials are separated from the use of machinery, the future of demolished concrete (DC) remains uncertain. Landfills require a lot of space to dispose of concrete waste. Consequently, reusing is deemed the most viable option for handling this type of waste.
Around 100 kg of the sample was taken from the primary stockpile for laboratory analysis to investigate the physicochemical characteristics. In the lab, samples were screened using sieves with openings of 12.5 mm or larger. As depicted in Figure 5, any material exceeding 12.5 mm was designated for use as coarse aggregate. The crushing proceeded until 95% of the particles could pass through a 12.5 mm sieve, achieving a P95 value of 95%. In this research, the fine aggregate was sorted into three size categories: coarse recycled sand that fits through a 4.75 mm sieve, medium recycled sand that passes through a 4.75 mm sieve but is held by a 2.36 mm sieve, and fine recycled sand that goes through a 2.36 mm sieve but is retained by a 1.18 mm sieve.

2.2.2. Properties of Concrete Ingredient

The cement characteristics incorporated into this study’s design mix are within the prescribed limits. Table 1 illustrates the detailed physicochemical attributes of the OPC employed in this research. This research involved partially replacing OPC with FA and SF. Table 1 shows that the specific gravity of FA is approximately 2.1, and that of SF is around 2.3, which is lower than the specific gravity of OPC. Neither fly ash nor silica fume meets the requirements for being classified as hazardous. Wherein microsilica may contain small amounts of crystalline quartz (<0.5%).
The evaluation of water absorption and specific gravity for R-Sand and M-Sand was performed as shown in Table 1. All the modified sand samples, including R-Sand and M-Sand, exhibited specific gravity values within the acceptable limits. In every sample, R-Sand (composed entirely of recycled sand) exhibited a notably higher water absorption rate than M-Sand. The enhanced absorption in R-Sand is due to its higher porosity. Table 1 presents the sand equivalent values of 92% for R-Sand and 95% for M-Sand, both of which fall within the permissible limits. A specimen is considered appropriate for concrete production if its sand equivalent value exceeds 75%.
Table 1 also presents key chemical parameters such as pH, TDS, sulfate, chloride, and salinity, which are essential for assessing the strength and longevity of hardened concrete. As shown in Table 1, all the chemical properties of the mixing water are within the permissible range.

2.2.3. Optimization of Materials and Design Mixes

Optimization of Sand and Silica Fume

Recycled sand (R-sand) contains numerous fine particles, notably impacting the fineness modulus (FM). To address this, manufactured sand (M-sand) was utilized to enhance the R-sand, ensuring it meets the FM requirements specified by the design mix using the absolute volume method [30]. Four distinct proportions of R-sand and M-sand were employed to refine the sand composition in the concrete mix design. These varying proportions were selected to assess the FM of the composite sand mixture (R-sand + M-sand). A sieve analysis of the selected sand combination was carried out to determine its fineness modulus. As detailed in Table 2, R-Sand was substituted with 20%, 30%, 40%, and 50% of M-Sand. Fineness modulus values showed a continuous enhancement with the incorporation of 20, 30, 40, and 50% M-sand, with the most favorable outcome occurring when 50% R-sand was mixed with 50% M-sand.
Various amounts of SF were used as a substitute for OPC in the standard mix to find the optimal SF content for the concrete mix design. Based on previous studies, the dosages were set at 5%, 10%, and 15%. The maximum increase in compressive strength was observed with 10% SF dosage; hence, 10% SF was decided to be incorporated in the preparation of the mixes in this study.

Proportioning of Materials and Specimen Preparation

In this research, various trail mixes were prepared to assess the strength and longevity of modified sustainable concrete. A reference mix, natural aggregate concrete (NAC*), used entirely natural components with 100% OPC to benchmark against the sustainable concrete developed in this study. Four distinct concrete mixtures were developed, incorporating fly ash, silica fume, and recycled sand (FASFRSC). Each mix contained different amounts of fly ash (ranging from 5% to 20%), silica fume (10%), and a combination of recycled and manufactured sand (50% R-sand + 50% M-sand). These mixes were labeled as 5FASFRSC, 10FASFRSC, 15FASFRSC, 20FASFRSC, and 25FASFRSC, respectively. The study involved replacing river sand entirely with a (50% R-sand + 50% M-sand) blend. Table 2 presents the designations for sustainable concrete mixes and specifies the quantities employed for each mix. The strength of cylindrical specimens under both compression and tension was measured using a compression machine with a capacity of two thousand kN and a universal tensile testing machine with a capacity of one hundred kN. Figure 6 illustrates the arrangement used to determine the compressive strength of concrete formulations. The process of preparing the samples with a sulfur cap is depicted in Figure 6a. Figure 6b,c display the prepared samples and the samples under testing. The flexural strength experimental setup is presented in Figure 7. Figure 7a,b show the beam sample in testing and the dimensions of the sample as per the standard requirement of [31].

3. Results and Discussion

3.1. Strength Properties

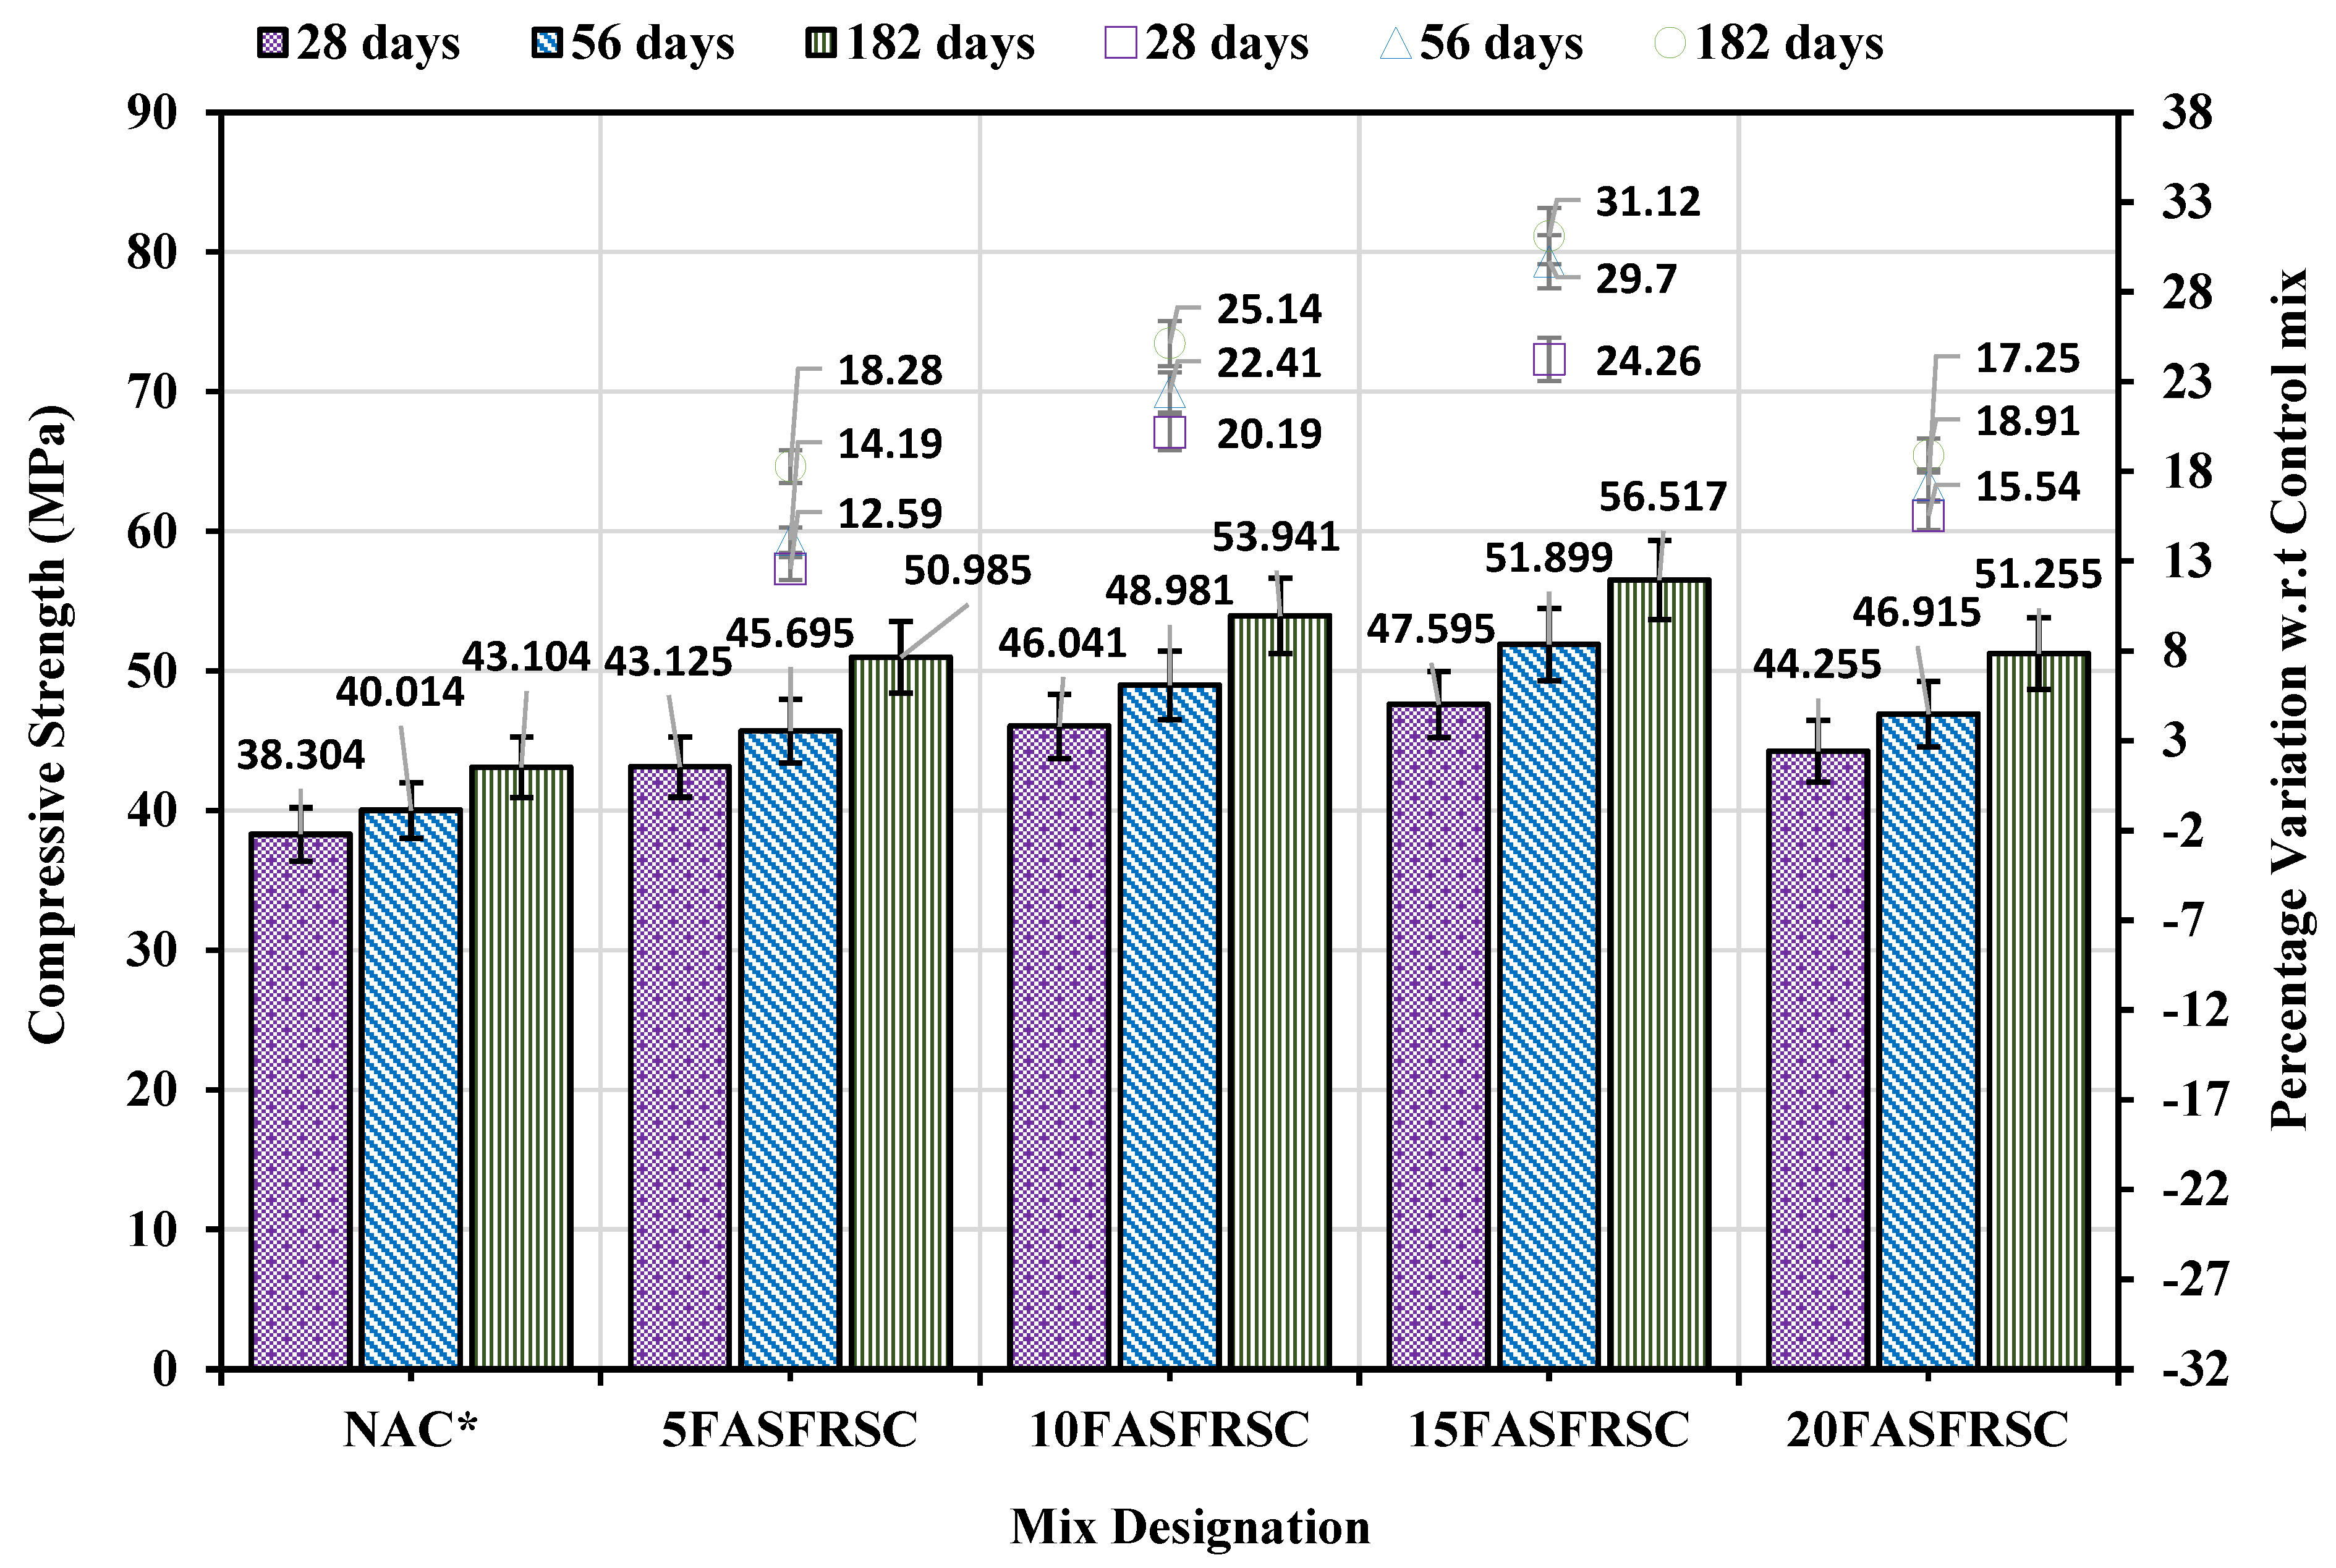
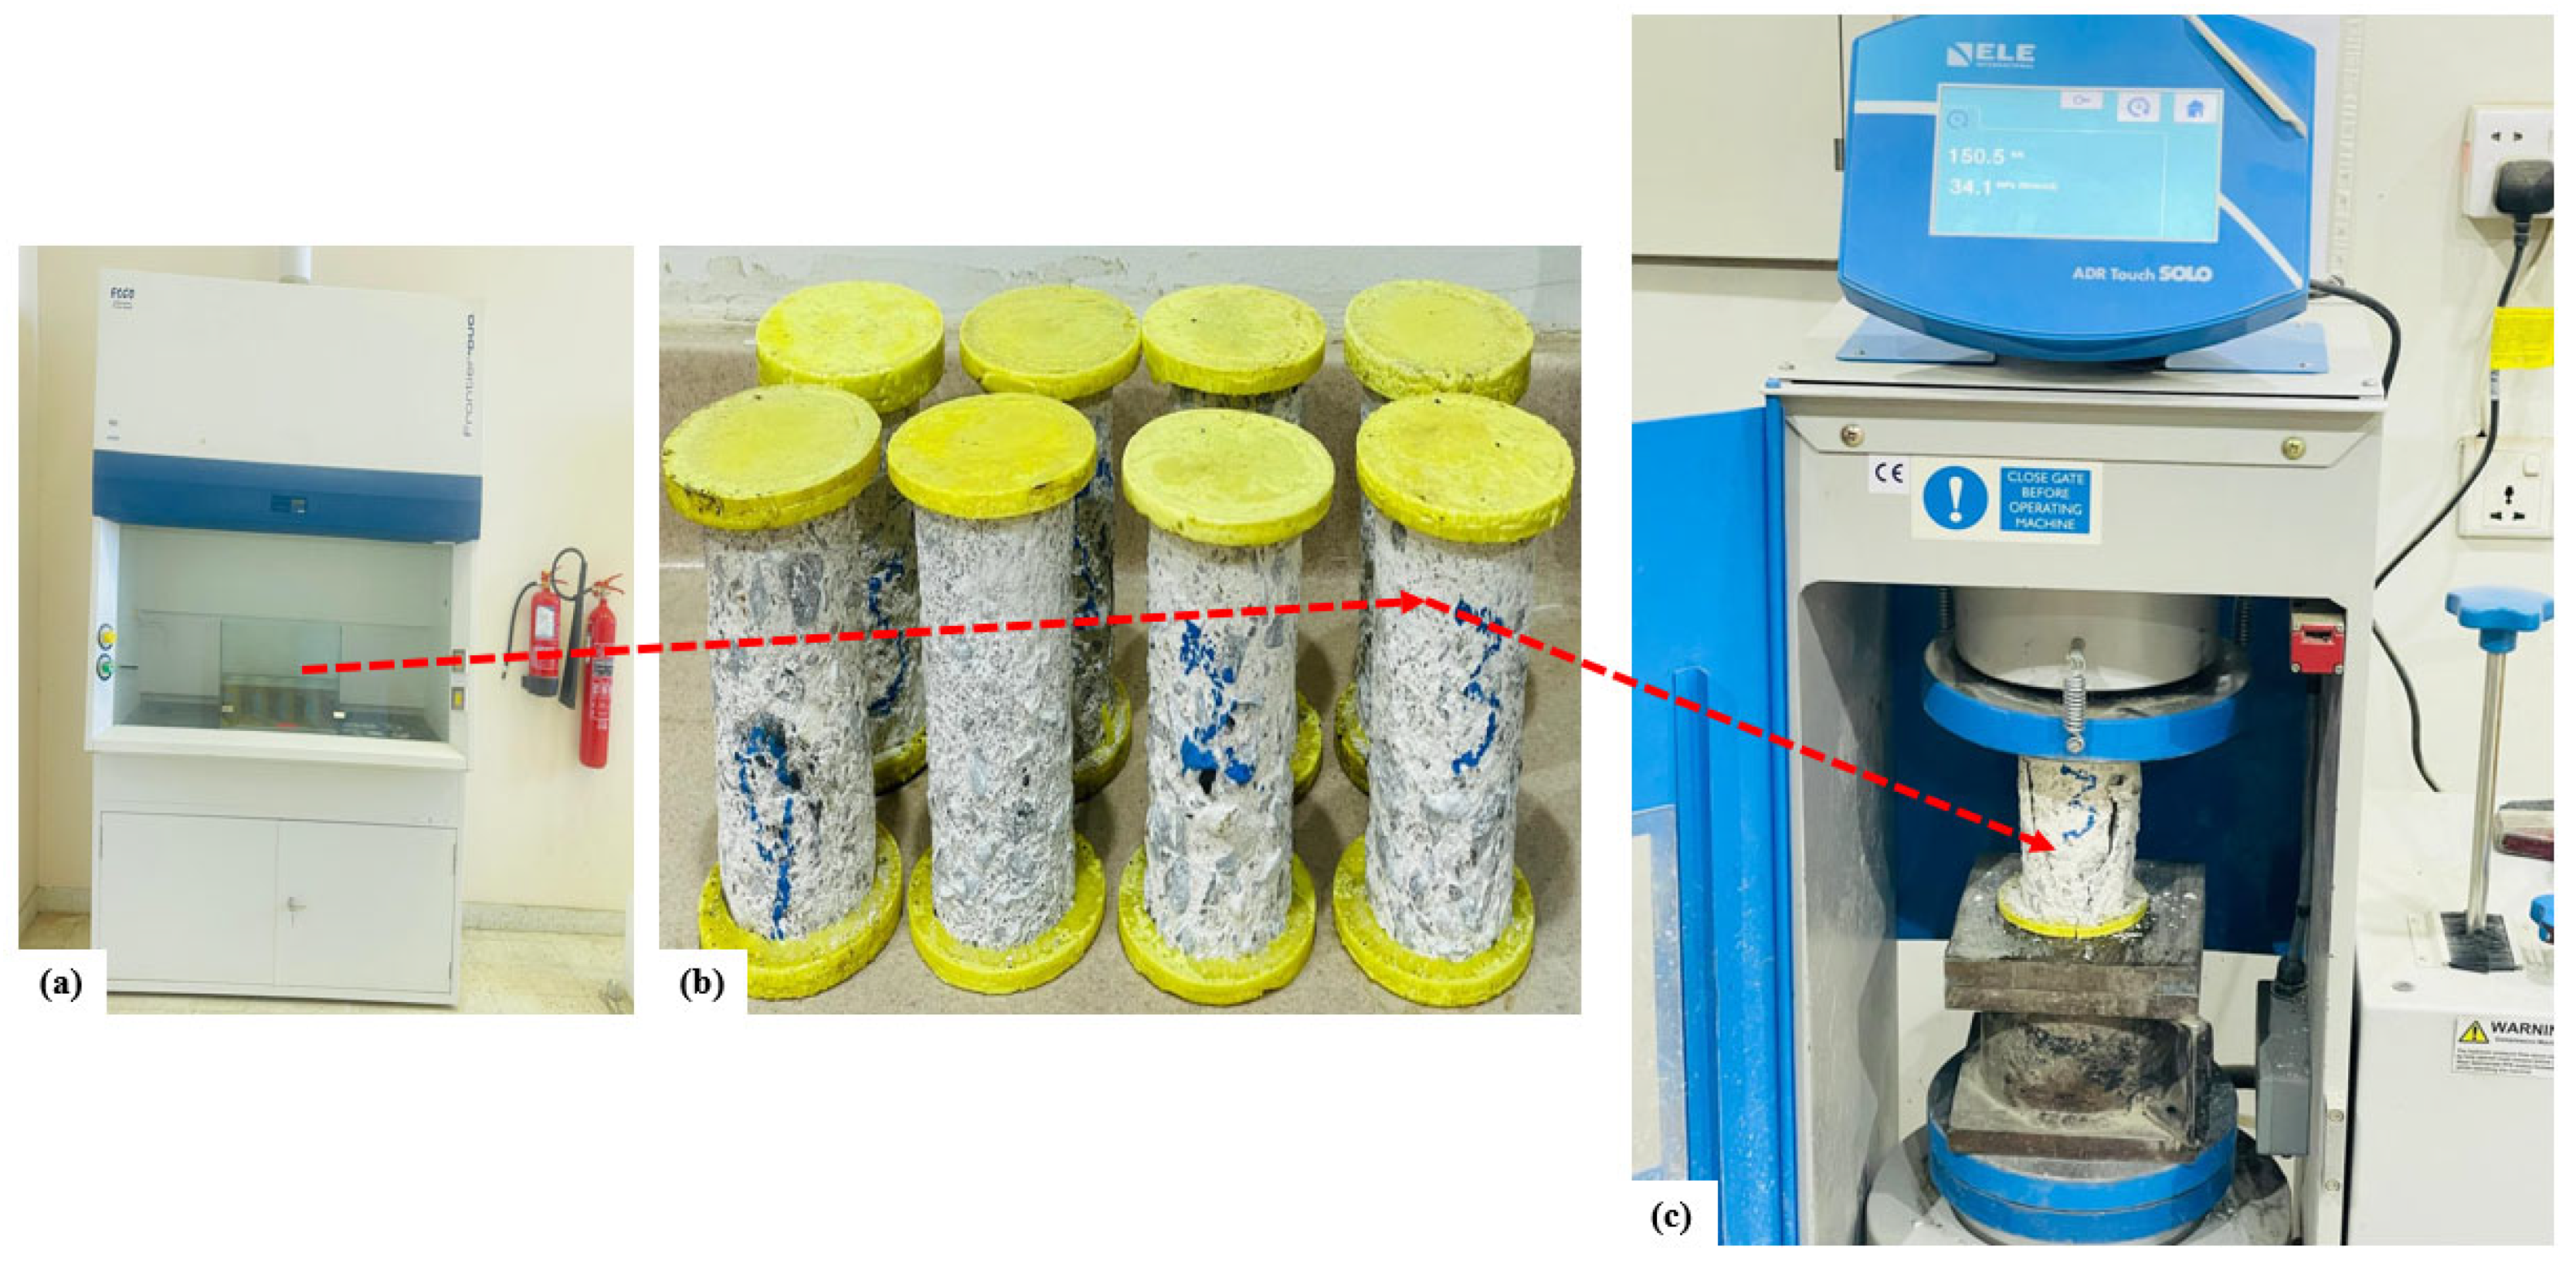
3.1.1. Analysis of Compressive Strength Results

Concrete’s compressive strength at 28 days is commonly regarded as a benchmark in standard codes of practice for assessment. Past studies reveal that SCMs such as FA, SF, and R-Sand gain strength over time [9,10,17,32]. The published studies recommended evaluating the compressive strength at 28, 56, and 182 days. For this reason, in this study, the compressive was measured at 28, 56, and 182 days. In the mix, NAC*, containing 100% M-sand, was marked as a reference mix of the study. The newly prepared mixes 5FASFRSC, 10FASFRSC, 15FASFRSC, and 20FASFRSC, with varying percentages of (5–20% of fly ash), optimized (10% of silica fume), and 100% substitution of natural sand, were made with modified sand (50% R-sand + 50% M-sand), respectively.
In the mixtures labeled NAC*, 5FASFRSC, 10FASFRSC, 15FASFRSC, and 20FASFRSC, the compressive strength values recorded after a 28-day curing period were 38.304, 43.125, 46.041, 47.595, and 44.255 MPa, respectively. In the mixtures 5FASFRSC, 10FASFRSC, 15FASFRSC, and 20FASFRSC, the increase compared to the conventional concrete mixt NAC* was observed to be 12.59%, 20.19%, 24.26%, and 15.54%, as illustrated in Figure 8. The design and target strength f’c and f’cr of the mixes 5FASFRSC, 10FASFRSC, 15FASFRSC, and 20FASFRSC conform to 30 and 38 MPa. The findings indicated that these concrete mixtures performed effectively, satisfying the design strength standards at 28 days. During the 28-day curing period, the prepared mixes 5FASFRSC, 10FASFRSC, 15FASFRSC, and 20FASFRSC met all standard design and target strength criteria.
By the time 56 days of curing had passed, the compressive strengths of the formulations NAC*, 5FASFRSC, 10FASFRSC, 15FASFRSC, and 20FASFRSC were recorded as 40.014, 45.695, 48.981, 51.899, and 46.915 MPa, respectively. Each mix exceeded the target strength (f’cr) of 38 MPa at 56 days. Figure 8 illustrates the percentage increases in the mixes 5FASFRSC, 10FASFRSC, 15FASFRSC, and 20FASFRSC after a curing period of 56 days relative to the reference mix NAC*. These increases were recorded as 14.19%, 22.41%, 29.7%, and 18.91%, respectively. The mix 15FASFRSC exhibited the most significant percentage increase at 56 days, reaching approximately 29.7% compared to the reference blend NAC*. The combination of modified sand, consisting of 50% R-Sand and 50% M-Sand, along with a mix of 15% FA and 10% SF, demonstrates good performance for up to 56 days in the 15FASFRSC mix.
Following a curing interval of 182 days, the compressive strengths for the mixes NAC*, 5FASFRSC, 10FASFRSC, 15FASFRSC, and 20FASFRSC were recorded as 43.104, 50.985, 53.941, 56.517, and 51.255 MPa, respectively. The data indicated a consistent increase in strength as time progressed. Figure 8 illustrates the percentage increments in compressive strength for the formulations 5FASFRSC, 10FASFRSC, 15FASFRSC, and 20FASFRSC at 182 days compared to the reference mix NAC, which were 18.28%, 25.14%, 31.12%, and 17.25%, respectively. At 182 days, the percentage increases for the mixes 10FASFRSC and 15FASFRSC surpassed those of 5FASFRSC and 20FASFRSC. It suggests that the optimal percentage of SCMs was between 10–15% FA and 10% optimized SF. Additionally, it has been noted that compressive strength continues to rise at later stages.
Figure 8 clearly illustrates that the compressive strength of the 5FASFRSC, 10FASFRSC, 15FASFRSC, and 20FASFRSC mixtures was improved by substituting OPC with a blend of FA and SF. The study’s findings indicate a consistent enhancement in the compressive strength of the mixtures, as mentioned above. The mix labeled 15FASFRSC exhibited the highest level of compressive strength, which included modified sand with a composition of 50% R-Sand and 50% M-Sand, along with SCMs (15% FA + 10% SF). A decline in compressive strength was observed when the mixture was composed of 20% FA and 10% SF. The analysis has concluded that the optimal strength is attained when 25% of the overall OPC content is replaced with SCMs, comprising 15% FA and 10% SF, in the 15FASFRSC mixture.
Another factor in increasing strength was the precise percentage of R-Sand utilization. When the optimized R-Sand was mixed with cement, a large surface area of finely ground particles of R-Sand was created, ultimately increasing the cement-sand bond. As a result, the mixtures’ compressive strength was increased. Additionally, the increase in strength in the mixture might be attributed to the continued hydration of the remaining cement particles within the R-Sand. Initially, the amended R-Sand within the mixtures surrounding the aggregates remains weak. It also relies on the amount of R-Sand that still contains the visible cement matrix from the old concrete. Over time, the gel interacts with the cement that remains non-hydrated from the previous layer. This secondary hydration of R-Sand could occur due to the combination of (FA + SF) with R-Sand. Ultimately, it can be concluded that the mix 15FASFRSC, which combines SCMs (15% FA + 10% SF) with 100% natural sand replaced by (50% R-Sand + 50% M-Sand), exhibited the highest strength at all curing stages compared to the other mixes.

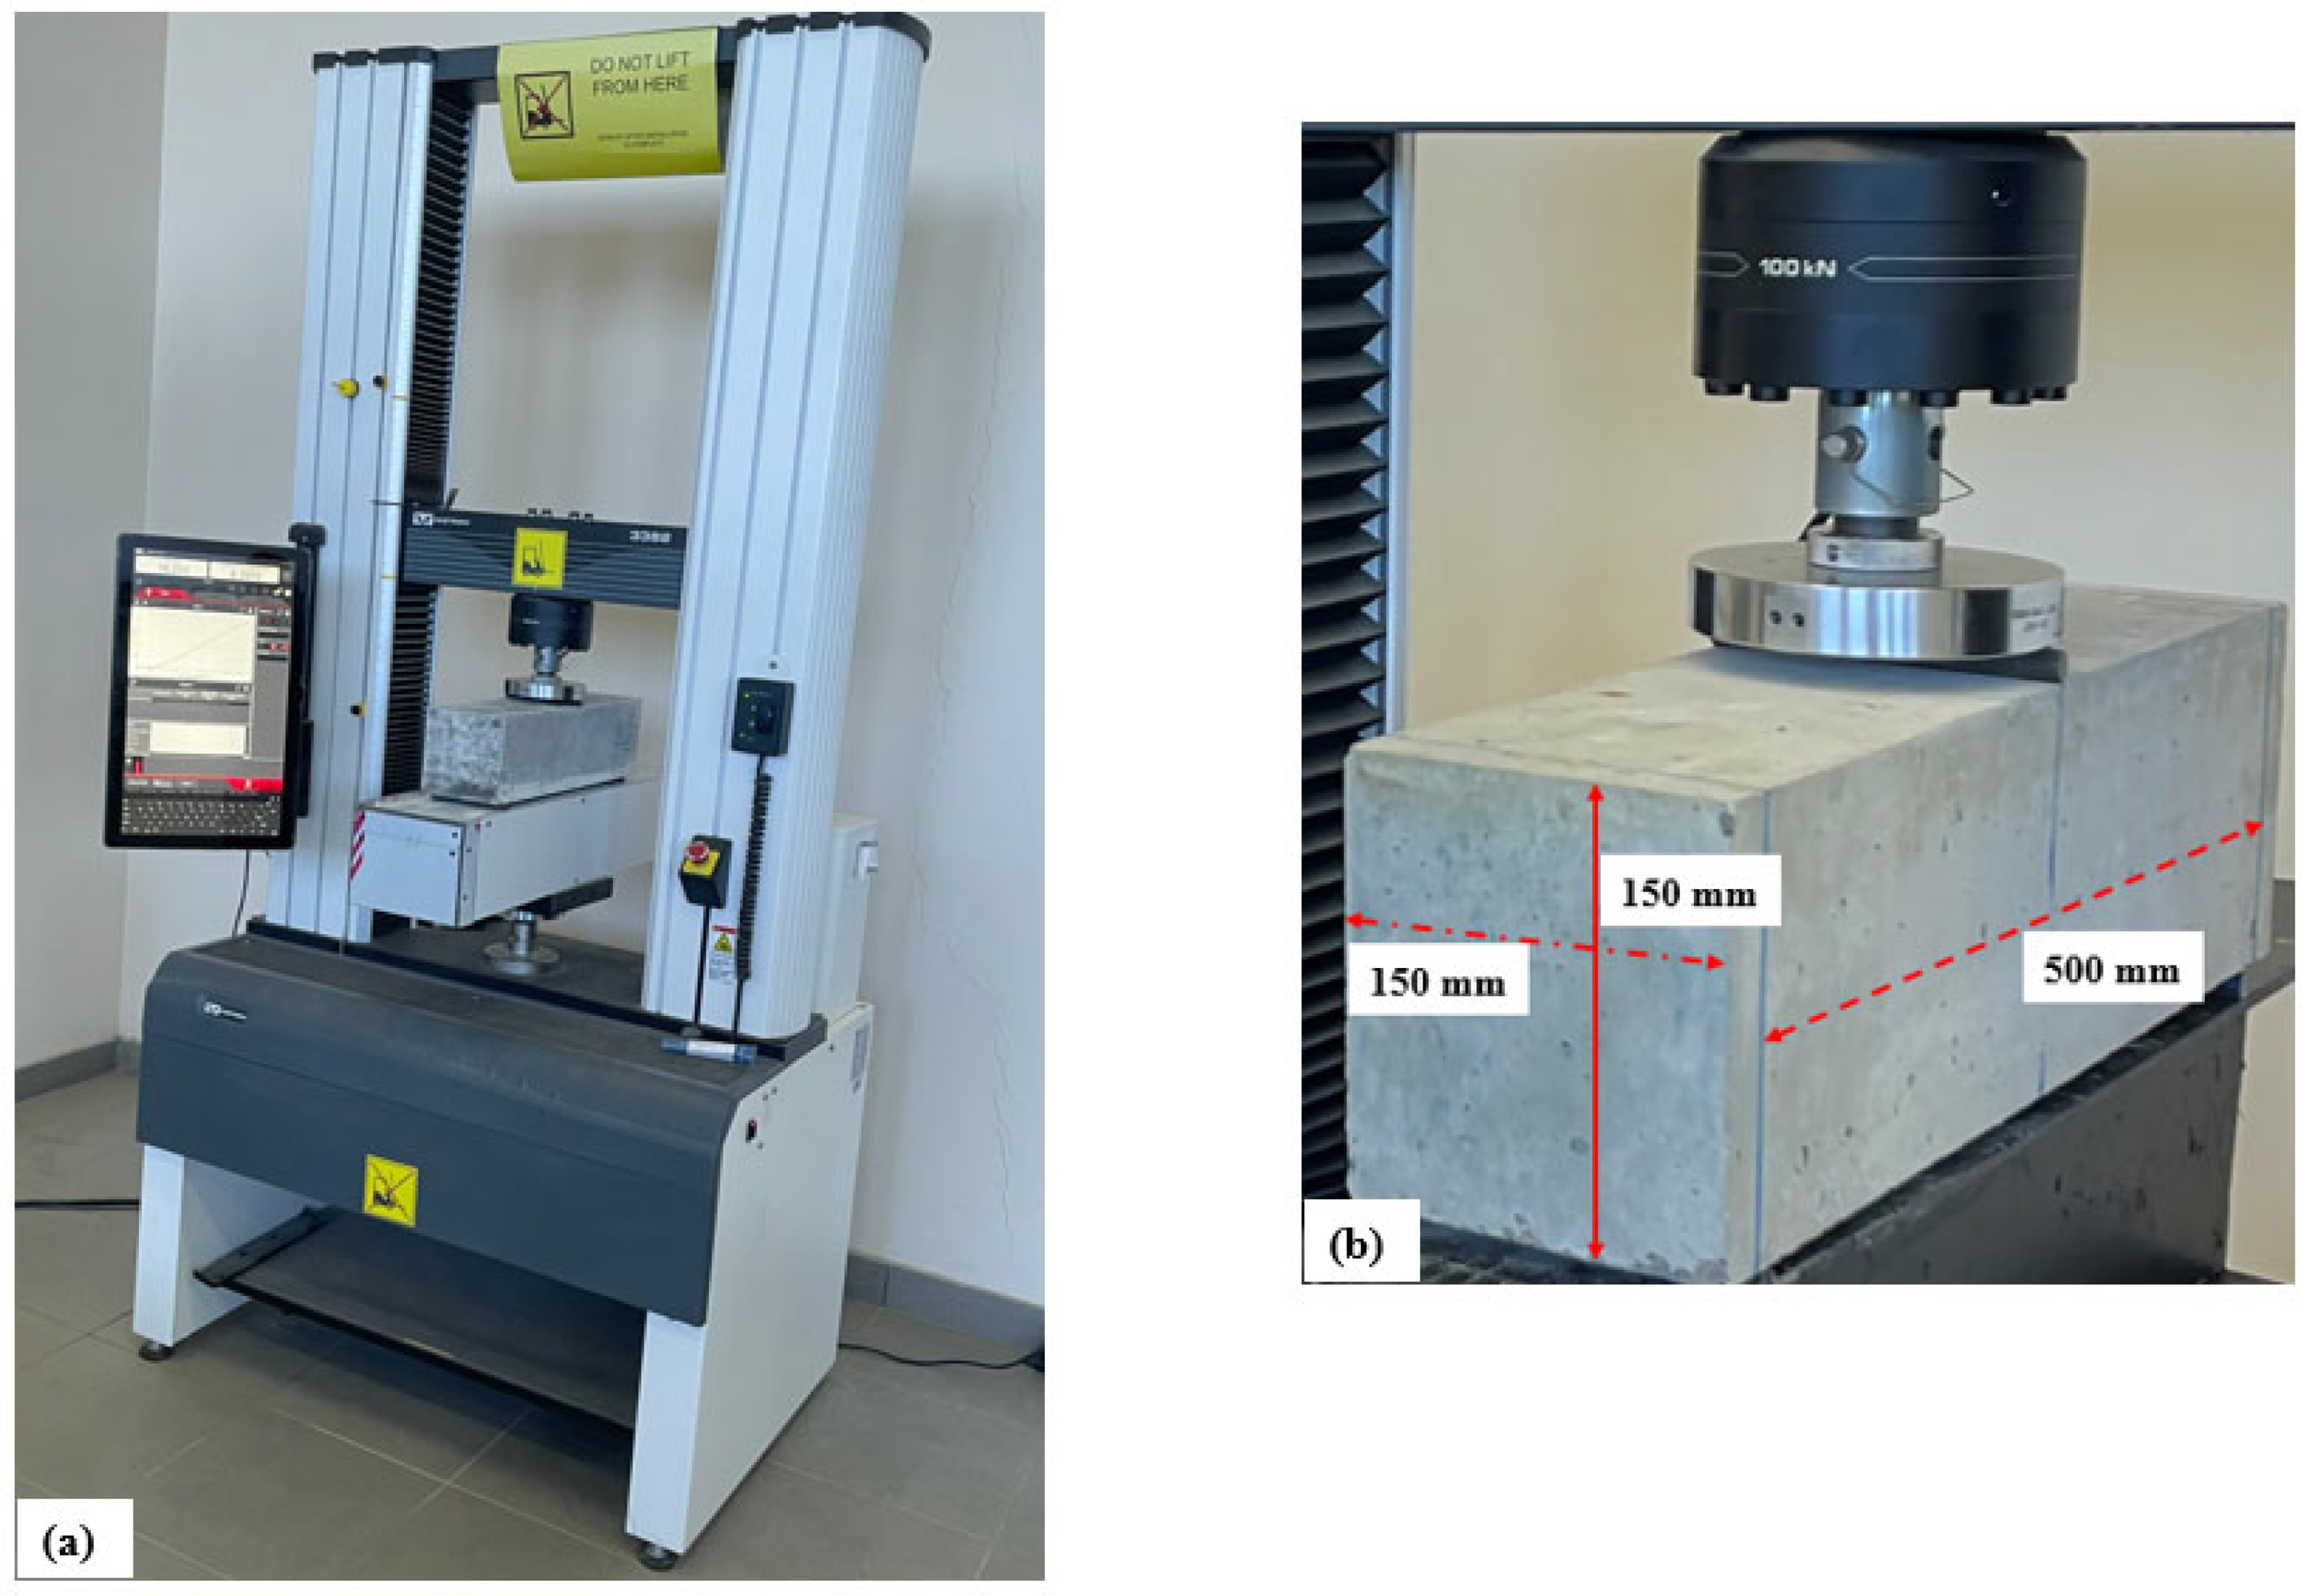
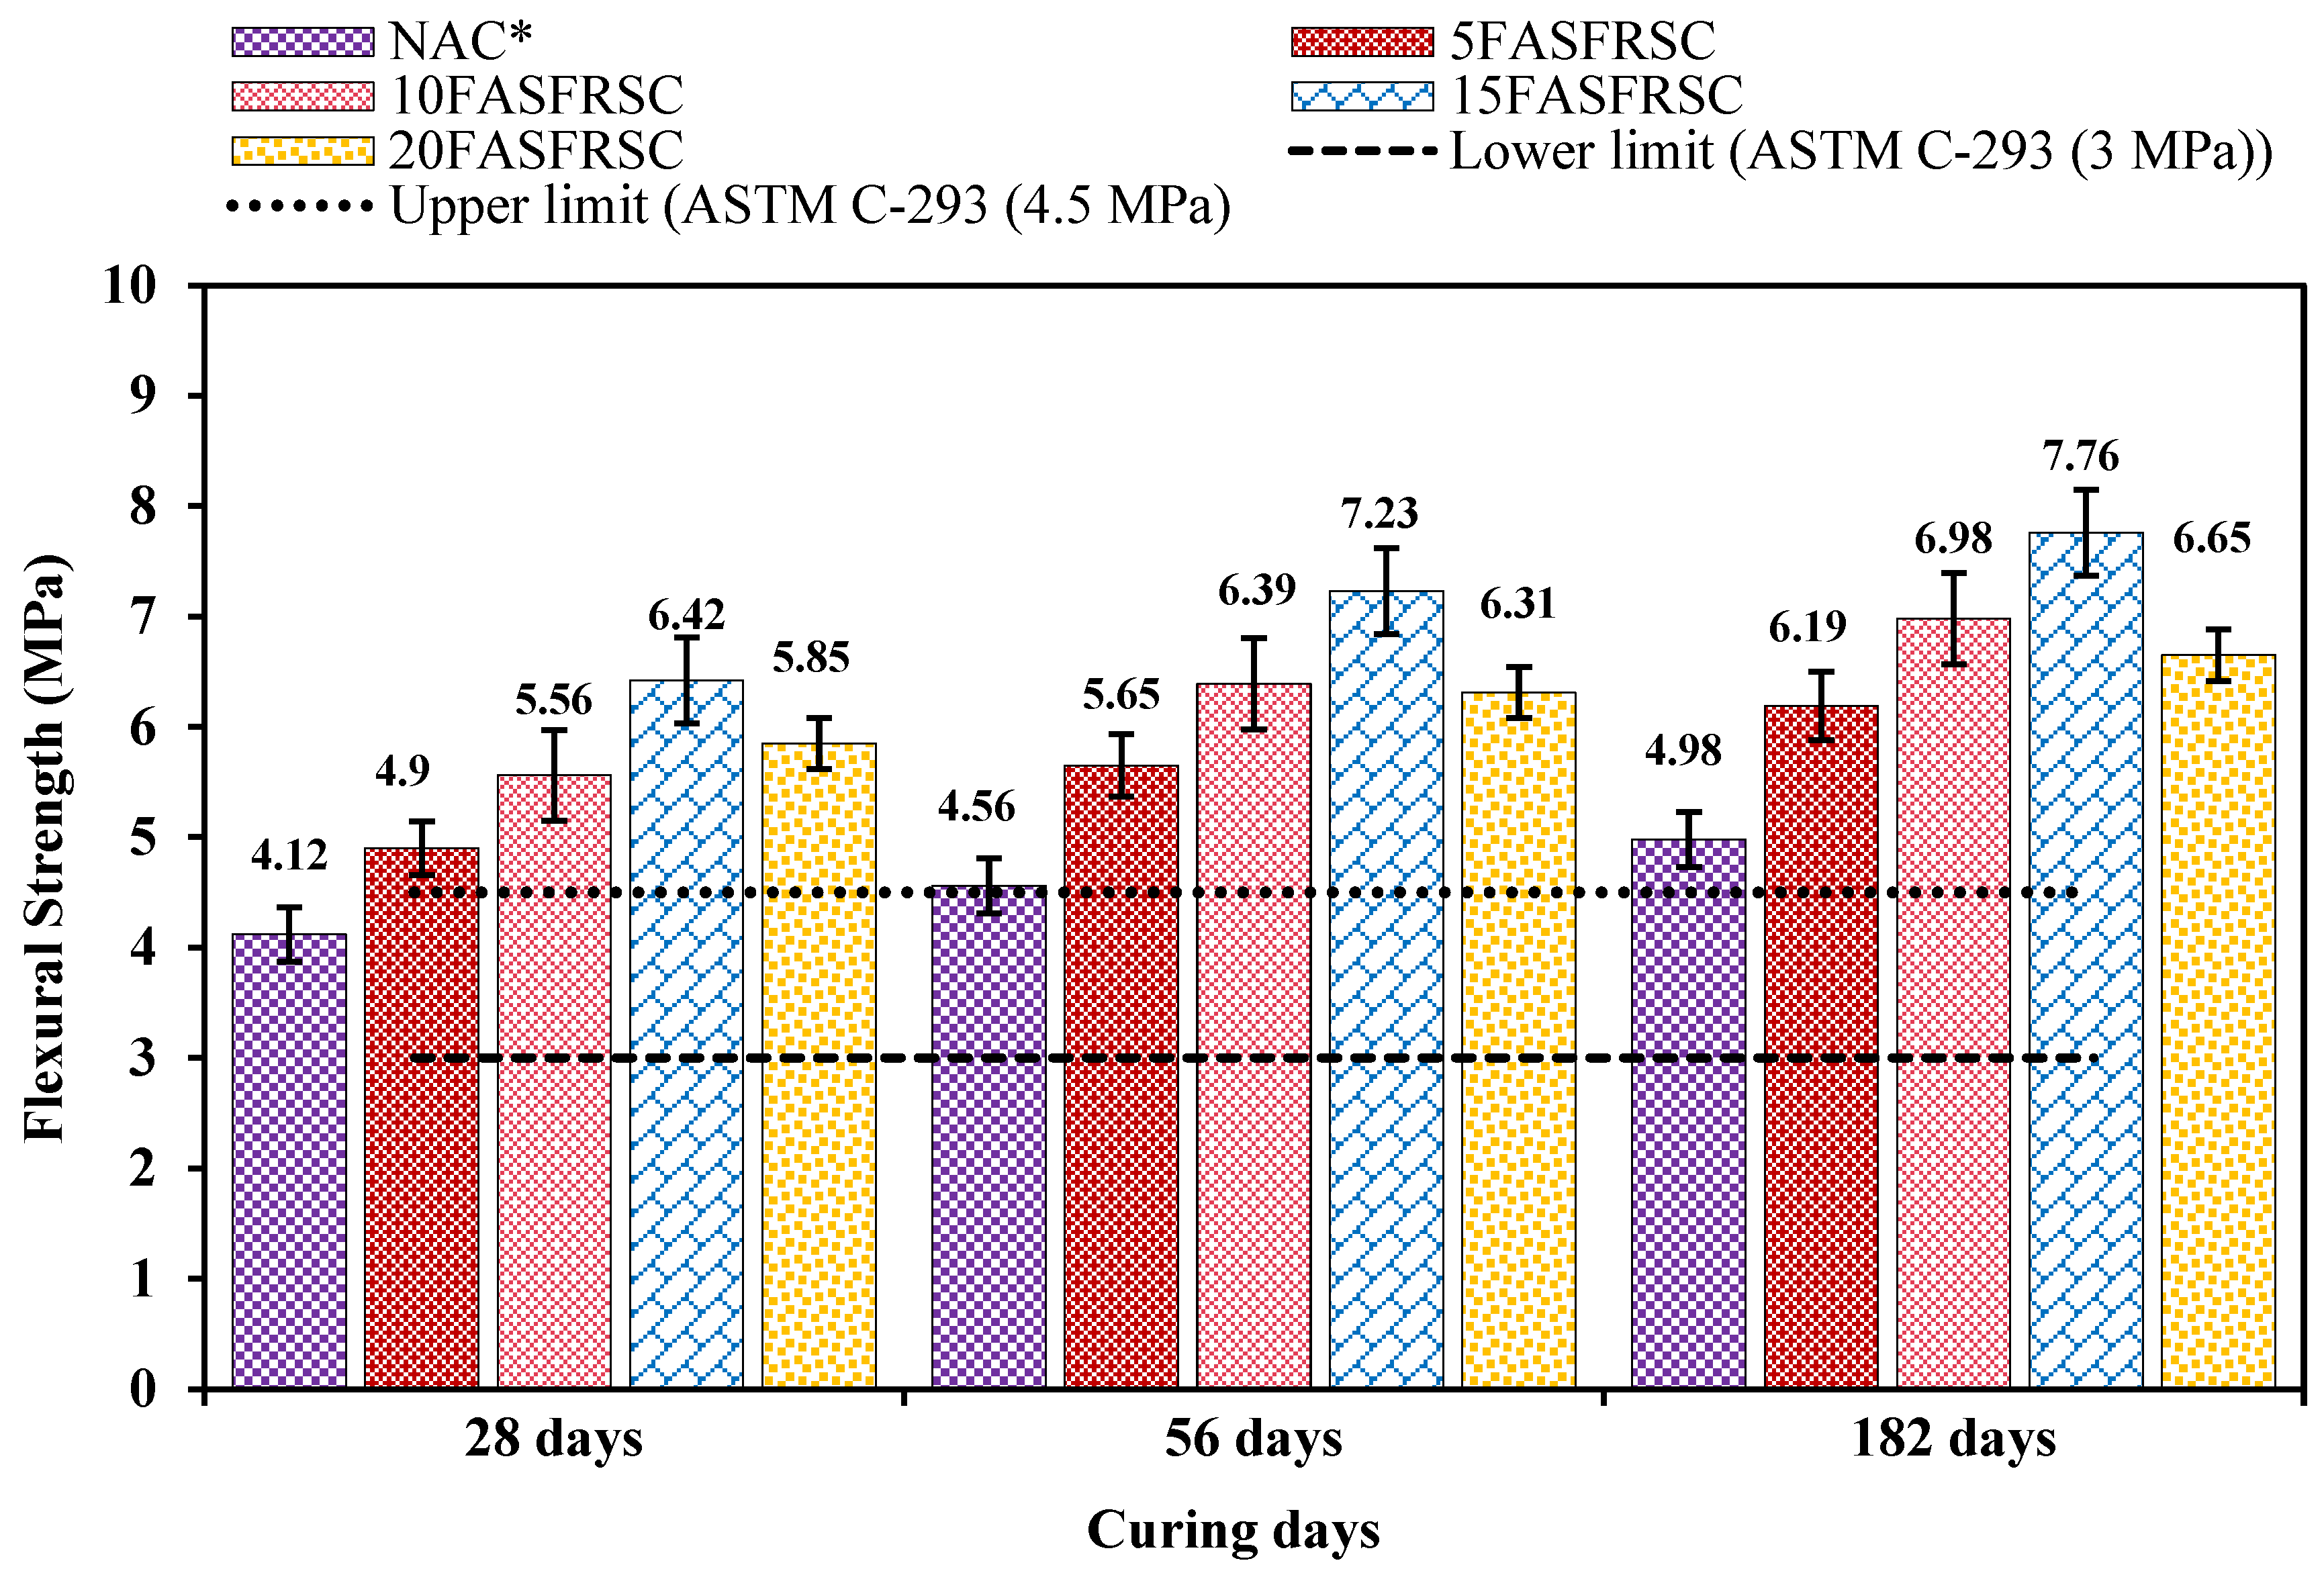
3.1.2. Flexural Strength Evaluation

The term “tensile strength” refers to the capacity of concrete to resist breaking or fracturing when subjected to tension. These forces exert a “pulling” effect that opens the transition zones in the concrete, including the binder that inhibits the dispersion of aggregates. Cracks form when the tensile forces surpass the material’s tensile strength. Regular concrete exhibits a much higher compressive strength compared to its tensile strength. Because directly testing concrete for tensile strength is complex, indirect methods such as flexural strength (FS) tests are used [31].
This research study examined the FS of the designated mixtures NAC*, 5FASFRSC, 10FASFRSC, 15FASFRSC, and 20FASFRSC over curing intervals of 28, 56, and 182 days. The requirement of FS was (10–15%) of (f’c = 30 MPa), as suggested by [31]. For this criterion, the sustainable concrete developed should have an average FS ranging from 3 to 4.5 MPa. To assess the average FS value for each specified mix NAC*, 5FASFRSC, 10FASFRSC, 15FASFRSC, and 20FASFRSC, the peak load (P) of each sample was measured. As depicted in Figure 7 samples are tested to determine the maximum load (P) for each. For each mixture, the FS value was determined by applying the maximum load (P) as specified in Equation (1). The FS outcomes are expressed in MPa, with the maximum load (P) measured in Newton’s and the length (L) in millimeters, and both failure width (b) and failure depth (d) in millimeters, as outlined in Equation (1).
R = 3 PL 2 bd 2
As illustrated in Figure 9, following a 28-day curing period, the FS values for the mixtures NAC*, 5FASFRSC, 10FASFRSC, 15FASFRSC, and 20FASFRSC were recorded as 4.12, 4.90, 5.56, 6.42, and 5.85 MPa, respectively. The developed mixes NAC*, 5FASFRSC, 10FASFRSC, 15FASFRSC, and 20FASFRSC FS values were recorded at 13.7%, 16.3%, 18.5%, 21.4%, and 19.5% of the concrete’s design capacity (f’c). The FS findings for the mixtures labeled 5FASFRSC, 10FASFRSC, and 15FASFRSC showed a steady increase, whereas a sudden decrease was observed in the mix 20FASFRSC. Hence, all samples at 28 days of the curing period successfully passed the criterion of (10–15%) design strength (f’c) of developed concrete.
Following a 56-day curing period, the FS results for the mixes NAC*, 5FASFRSC, 10FASFRSC, 15FASFRSC, and 20FASFRSC were 4.56, 5.65, 6.39, 7.23, and 6.31 MPa, respectively. These FS values corresponded to 15.2%, 18.8%, 21.3%, 24.1%, and 21% of the concrete’s (f’c). A consistent increase in FS values was observed for the 5FASFRSC, 10FASFRSC, and 15FASFRSC mixes, while a sudden decrease was noted in the 20FASFRSC mix. Nevertheless, all samples exceeded the design strength criterion of (10–15%) (f’c) for concrete after 56 days of curing.
Following a curing period of 182 days, the FS outcomes for the mixtures NAC*, 5FASFRSC, 10FASFRSC, 15FASFRSC, and 20FASFRSC were 4.98, 6.19, 6.98, 7.76, and 6.65 MPa. The mixes NAC*, 5FASFRSC, 10FASFRSC, 15FASFRSC, and 20FASFRSC STS values were recorded at 16.6%, 20.6%, 23.2%, 25.8%, and 22.1% of the concrete’s design mix (f’c). The FS outcomes for the mixtures 5FASFRSC, 10FASFRSC, and 15FASFRSC showed a steady increase, whereas a sudden decrease was observed in the mix 20FASFRSC. However, all samples surpassed the criterion of (10–15%) concrete design capacity (f’c) at an interval of 182 days curing period compared to 56 days.
The analysis of the results of the study has revealed several interesting observations. It has been reported that the FS results improve with time. Adding SCM materials (FA + SF) combined with R-Sand gains strength at later stages. The inert materials present in FA, SF, and R-Sand react later, forming extra calcium silicate hydrate gel in the paste and refining paste quality at later ages, such as 56 and 182 days, and ultimately, FS strength values increased. By integrating the FA and SF mixture with a 50% blend of R-Sand and M-Sand in the compositions 5FASFRSC, 10FASFRSC, 15FASFRSC, and 20FASFRSC, the mixes exhibit ductile characteristics, which subsequently improve the interfacial transition zone (ITZ) that FS relies on. Combining 50% R-Sand with 50% M-Sand and adding FA and SF also contributed to the development of elastic behavior in these mixes. Consequently, the beam samples exhibited increased strength in these mixtures. The study’s refined sand technique, combined with FA and SF, successfully enhances the cracking load and diminishes the brittleness of the 5FASFRSC, 10FASFRSC, 15FASFRSC, and 20FASFRSC mixes, respectively. Therefore, it was concluded that this effect was most pronounced in the mix 15FASFRSC, where the combination of SCMs (15% FA + 10% SF) with 100% natural sand replaced by (50% R-Sand + 50% M-Sand) achieved the highest performance at all curing stages compared to the other mixes.

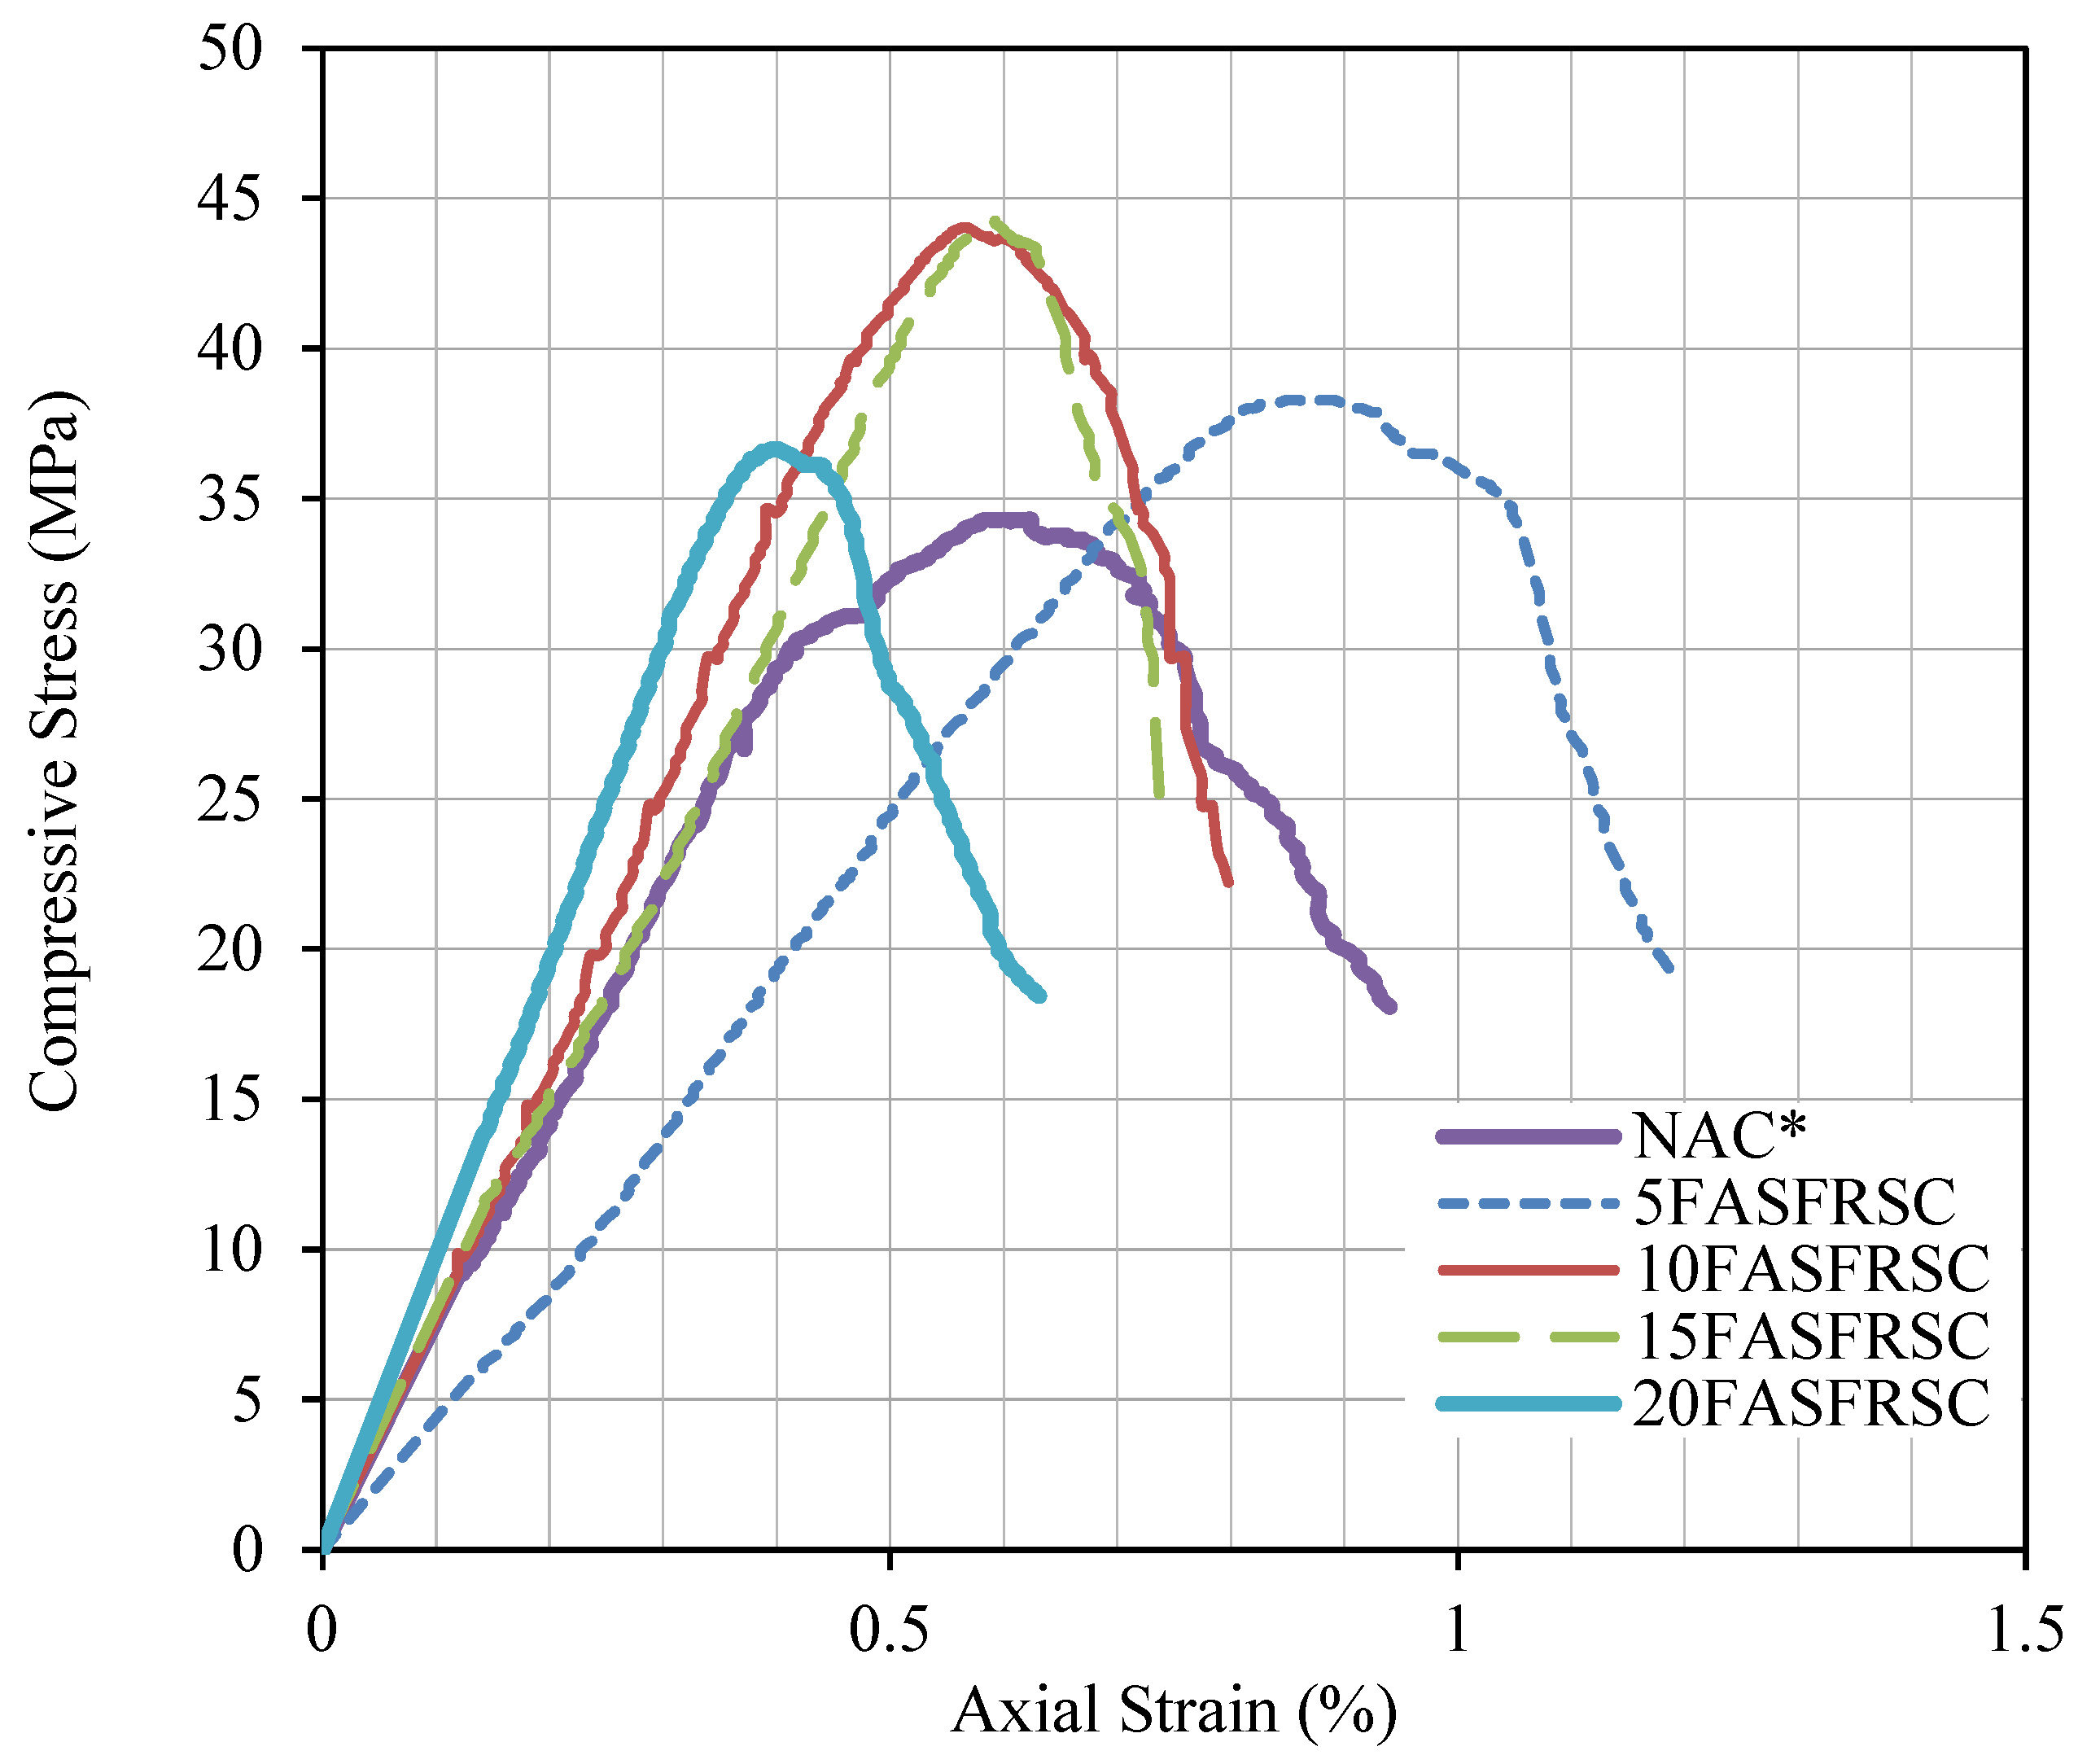
3.1.3. Stress-Strain Characteristics Under Compression

The stress-strain curves are presented in Figure 10. All specimens show almost the same initial slope, representing the elasticity modulus of concrete (Ec), except for 5FASFRSC. It is believed to be due to a testing glitch and not due to sample properties. The modulus of elasticity of the NAC* is about 27 GPa, which coincides with the value (4700 sqrt (fc’)) obtained by the American Concrete Institute (ACI) code of practice. The modulus of elasticity for 10FASFRSC 15FASFRSC is found from the graphs to be about 28.5 GPa, below the expected value of about 31.1 GPa according to the ACI formula. For 20FASFRSC, while the strength of the sample is lower than that of the 15FASFRSC sample, the modulus of elasticity is higher. It indicates a significant change in the mix’s properties and diverges from the ACI equation’s predictions regarding the modulus of elasticity. Considering the failure strain, excluding sample 5FASFRSC due to the testing issue, and sample 20FASFRSC, which shows a low failure strain, all three other specimens showed a typical failure strain of 0.16%. However, all samples have different failure strain values, which are reported to be close to acceptable limits.

3.2. Characteristics of Durability Properties

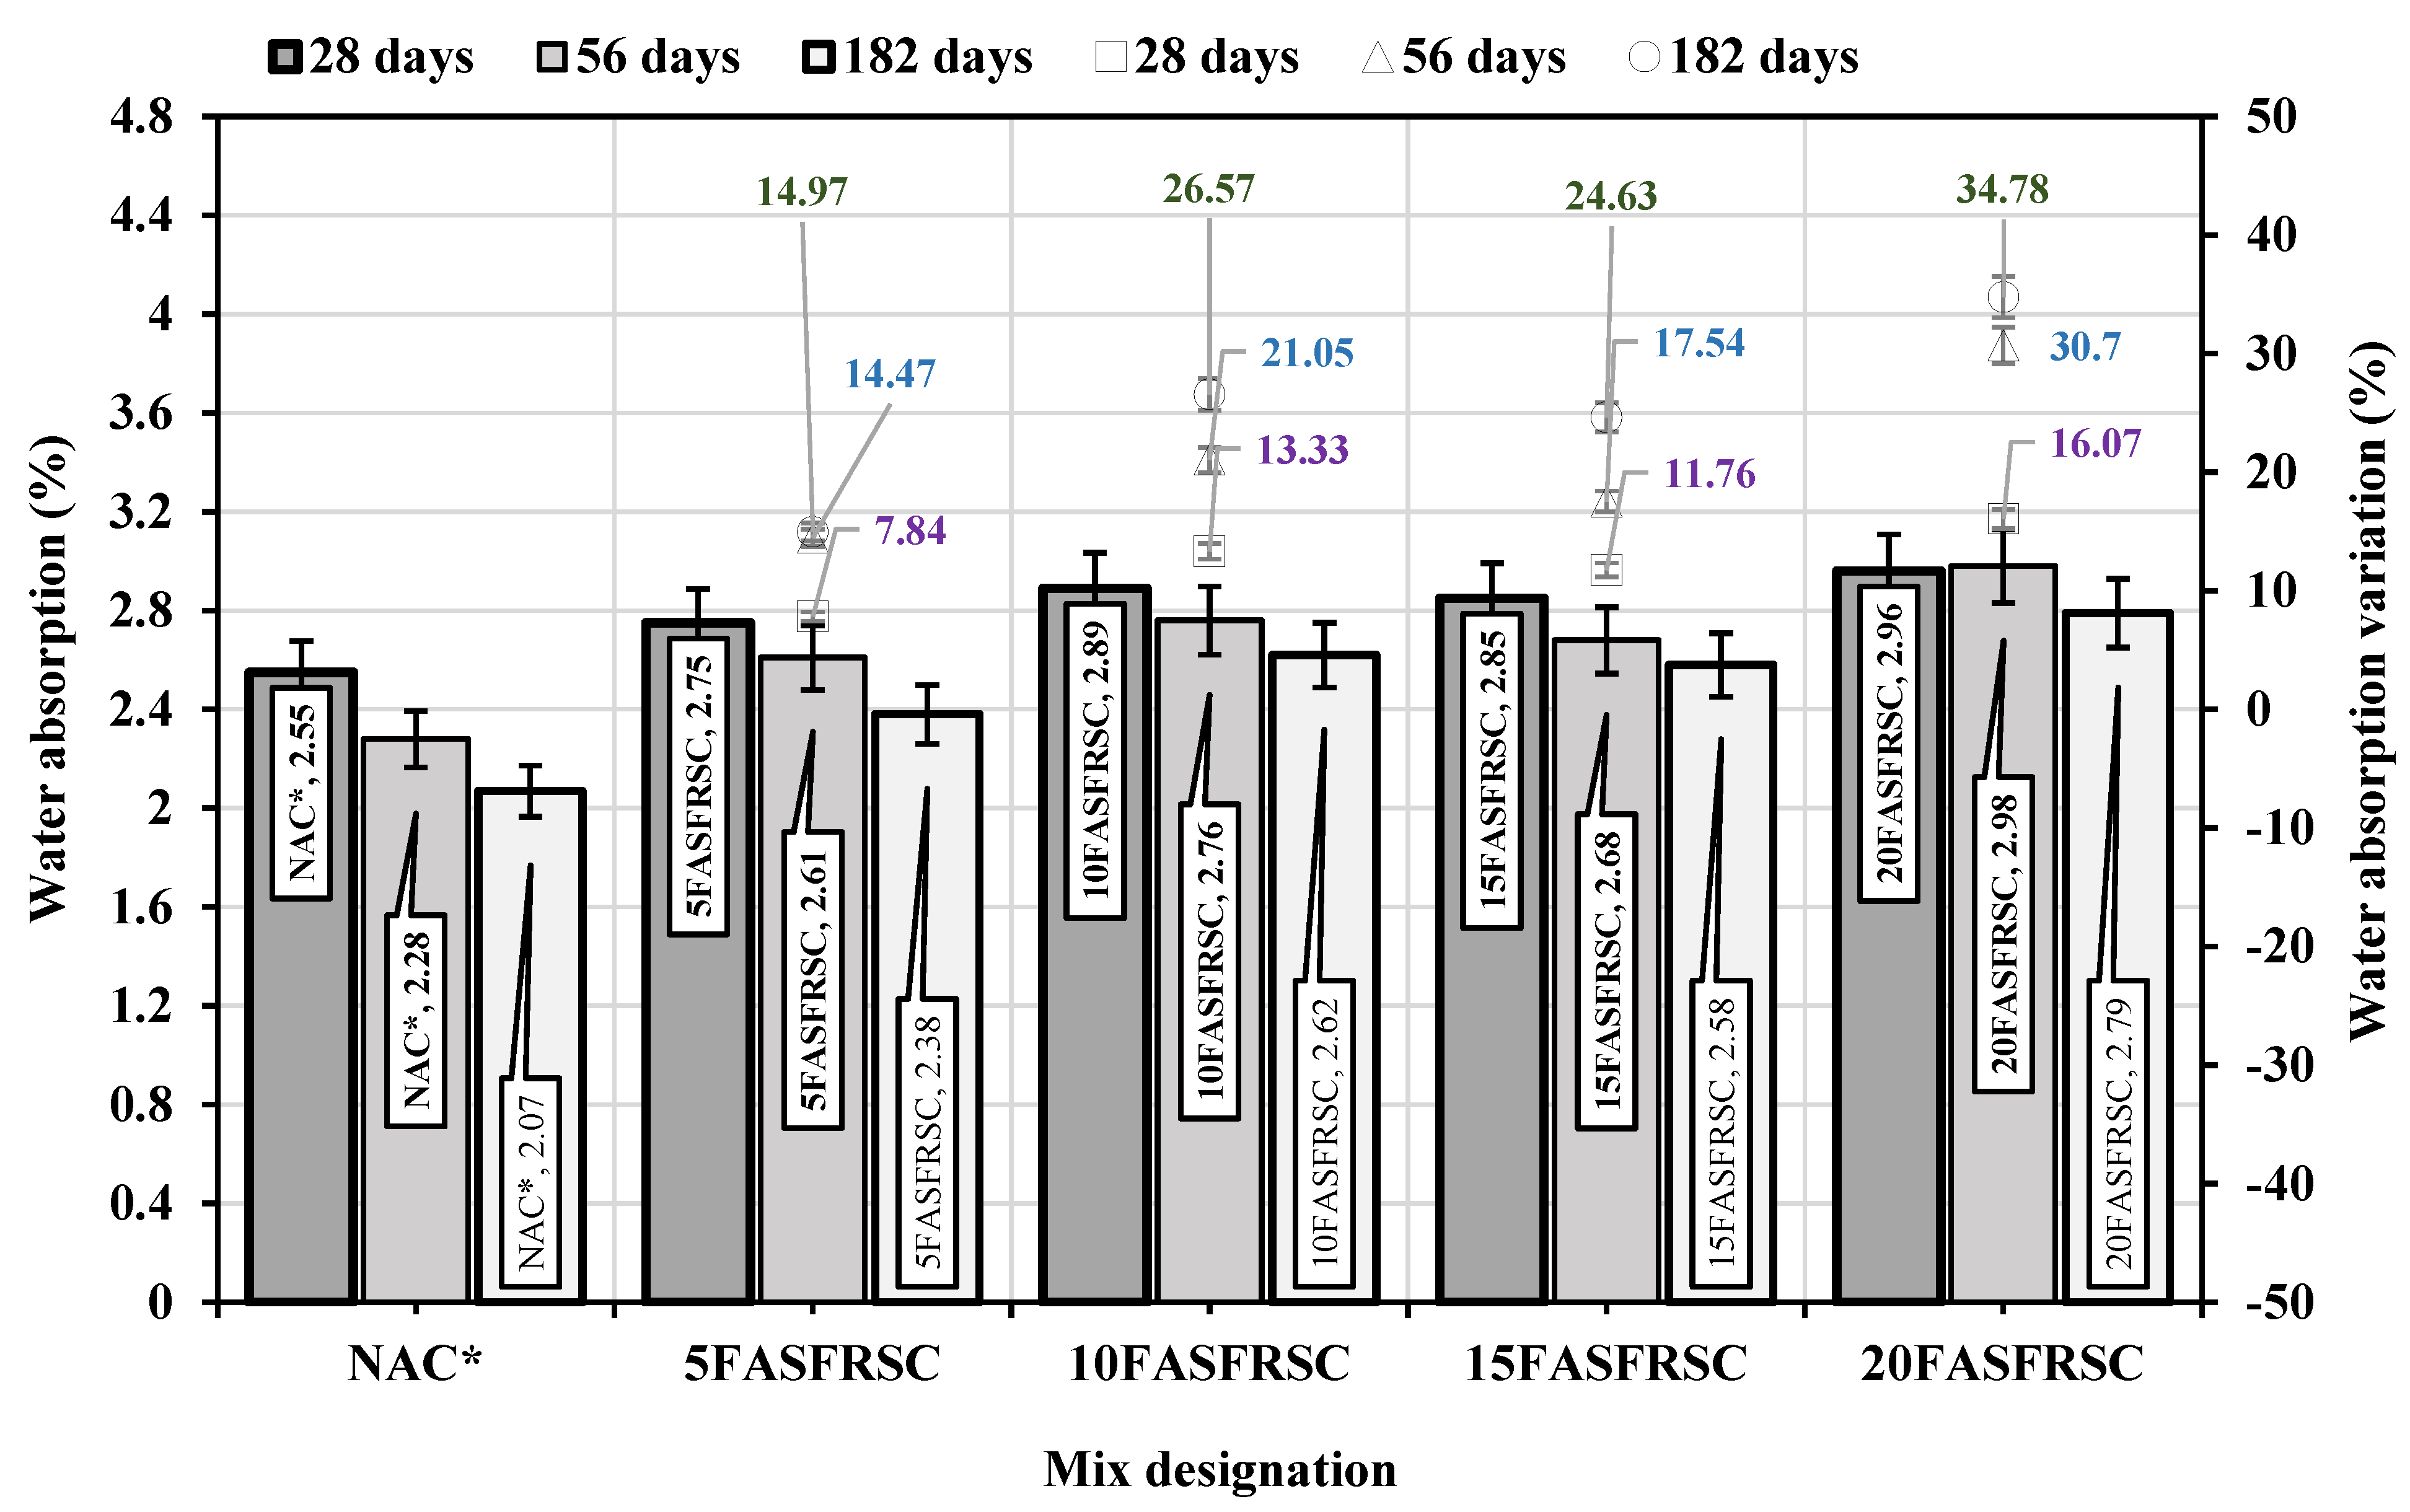
3.2.1. Absorption of Water in Hardened Concrete

Figure 11 illustrates the water absorption levels for the prepared mixes NAC*, 5FASFRSC, 10FASFRSC, 15FASFRSC, and 20FASFRSC. The increase in water absorption was more pronounced in the mixtures 5FASFRSC, 10FASFRSC, 15FASFRSC, and 20FASFRSC when the combination of (FA + SF) was used with (50% R-Sand + 50% M-Sand) compared to the reference mix NAC*.
In the mixes labeled NAC*, 5FASFRSC, 10FASFRSC, 15FASFRSC, and 20FASFRSC, water absorption rates were measured after 28 days of curing, showing values of 2.55%, 2.75%, 2.89%, 2.85%, and 2.96%, respectively. At the 56 days, these rates were recorded as 2.28%, 2.61%, 2.76%, 2.68%, and 2.98%, respectively. Additionally, at 182 days of curing, the water absorption percentages were 2.07%, 2.38%, 2.62%, 2.58%, and 2.79%. The trend observed indicates that as the curing period extended, there was a noticeable reduction in water absorption levels. The reactive silica found in FA and SF interacts with the byproducts of hydration produced by OPC, forming additional CSH gel at later curing stages, resulting in a denser concrete matrix, which inhibits further water absorption. The pozzolanic activity of microsilica contributes to blocking the pores in the concrete, and by filling these pores, it reduces their size, making it more difficult for water to penetrate, thereby decreasing water absorption and improving durability. The findings of this study align with those reported in recent publications [9,10,16,33].
A decreasing pattern of water absorption was observed in mixtures 5FASFRSC, 10FASFRSC, 15FASFRSC, and 20FASFRSC with the combination of SCM (FS + SF) with modified sand composition (50% R-sand + 50% M-sand) at intervals of 28, 56, and 182 days. As discussed earlier, the straightforward reason for this decline is the production of extra CSH gel. The threshold of this phenomenon was reached in the mix 15FASFRSC by adding 15% FA and 10% SF, combined with a sand mixture that was adjusted to consist of 50% R-Sand and 50% M-Sand. Once the sample testing was reached in the mix 20FASFRSC, a slight increase in the water absorption was recorded. It is because the fine particles in the mix reach the maximum value, and from this point on, the mix starts absorbing water in empty pores created by losing the fine particles from the mix. Hence, it can be concluded from the discussion that the maximum amount of fine particles in the concrete mix is also essential to deciding the durability of the concrete mix with SCMs.

3.2.2. Sulfuric Acid Attack

Concrete’s response to acid must be examined as part of any research on the material’s durability characteristics. It is essential to assess how resistant concrete is to acid attacks. Extensive chemical exposure can cause acid corrosion to concrete used in manufacturing. Because of air pollution, rain also contains acids. Rain causes chemical processes that increase the acidity of the air and raise the atmospheric concentrations of nitrogen dioxide and sulfur dioxide. Nitric, sulfuric, and carboxylic acids make up most of the rain. It must be tested in various acid solutions to determine how resistant and vulnerable hardened concrete is. Concrete deteriorates when the acids and bases in the mixture mix to create salts that dissolve in water. In the current study, the ability of modified sand (50% R-Sand + 50% M-Sand) with varying percentages (5–20%) of FA and 10% optimized SF in newly developed concrete was examined to withstand 5% sulfuric acid (H2SO4) solution.
The silica fume (SF) has a sulfate ion charge which showed resistance against the (H2SO4) attack. The published studies define the deterioration of concrete samples by the reaction shown in Equations (1)–(3) [34,35]. Equation (2) shows that the hydroxide compound of calcium found in the concrete reacts with sulfuric acid and turns into the hydrated salt of calcium sulfate, also known as gypsum. However, Equation (3) exhibits the hydrated calcium silicate reaction with sulfuric acid, which forms calcium sulfate and silicon tetrahydroxide with water. Also, calcium aluminate reacts with the hydrated salt of calcium; it changes into calcium-aluminum sulfate and water, as shown in Equation (4).
Ca ( OH ) 2 + H 2 S O 4     CaS O 4 . 2 H 2 O
CaSi O 3 . 2 H 2 O + H 2 S O 4     CaS O 4 . 2 H 2 O + Si ( OH ) 4
2 CaO . Al 2 O 3 . 12 H 2 O + 3 ( CaS O 4 . 2 H 2 O ) + 14 H 2 O   + 3 CaO . Al 2 O 3 . 3 CaS O 4 . 32 H 2
The pH of the sulfuric acid solution was determined using a pH meter. H2SO4, with a purity level of 97%, was obtained from Sigma-Aldrich and utilized to create a 5% sulfuric acid solution. A 5% H2SO4 solution was introduced each week to ensure the pH remained within the target range of 1.04 ± 0.1. The sulfuric acid concentrations in the solution container were stirred thrice weekly to avoid changes.
The sulfuric acid resistance was evaluated by measuring the mass loss after immersion in a H2SO4 solution for 28, 56, 91, and 182 days. The time interval for mass loss was extended as the mass loss values differed slightly. Four mass loss observation intervals were taken to determine the actual results. The residual compressive strength of the developed mixes was assessed in the same manner as the compressive strength for standard curing periods of 28, 56, and 182 days following immersion in a 5% H2SO4 solution. This approach ensured consistency in the results and allowed for comparison with compressive strength under normal conditions. Following 28 days of standard curing, the specimens were extracted. The original mass of each sample was calculated at a saturated surface dry (SSD) state after 28 days of normal curing. Each mix produced three concrete cylinders, measuring 75 mm in diameter and 150 mm in height, which were placed in a 5% H2SO4 solution for submersion. Figure 12a shows the sample in the container with 5% sulfuric acid solution in an incubator. The samples were taken out after completing the immersion time and exposure to room temperature until they reached the saturated surface dry (SSD) state shown in Figure 12b. Finally, Figure 12c shows the samples under compressive strength testing.

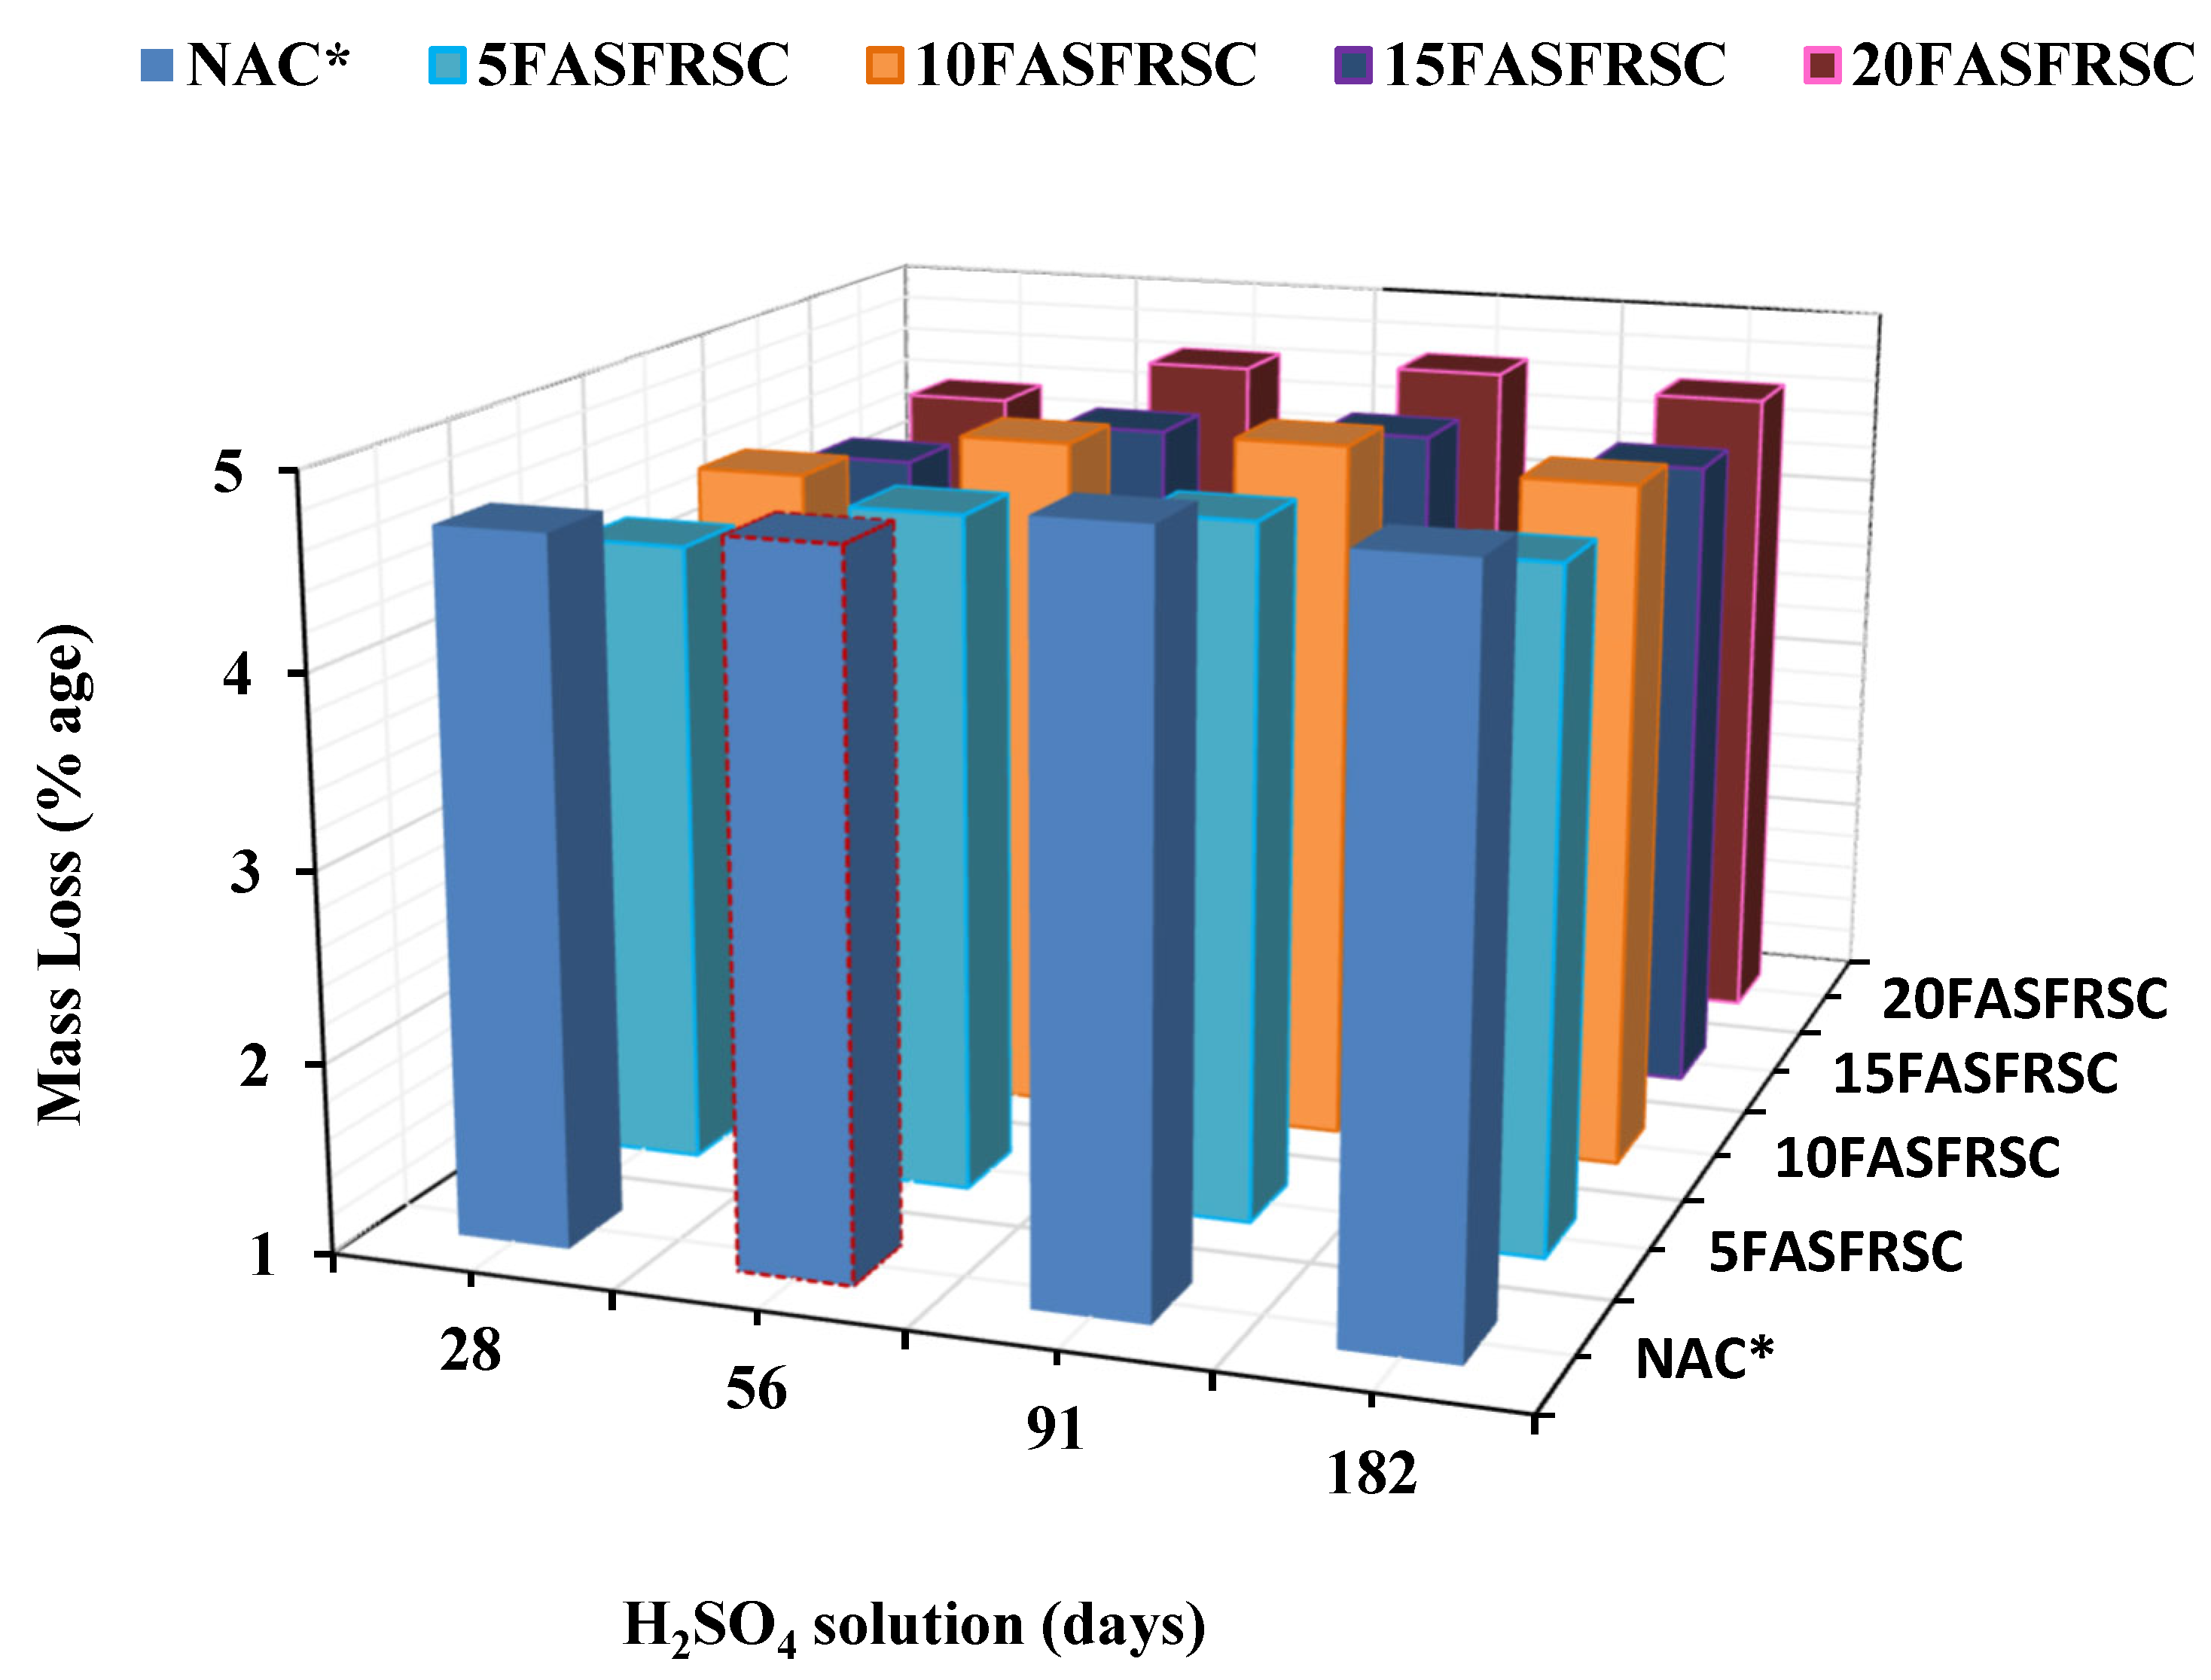
Change of Mass of Concrete Samples in Sulfuric Acid Solution

The mass measurements were retaken after 28, 56, 91, and 182 days of sulfuric acid immersion. The percentage of mass loss after 28, 56, 91, and 182 days of sulfuric acid immersion was calculated according to Equation (5).
Mass   loss :   % = β 1 β 2 β 1   × 100
Mass before immersion is denoted by β1, and mass after immersion is denoted by β2. Figure 13 reported the mass change of the developed concrete mixes after an immersion time of 28, 56, 91, and 182 days. The reference mix NAC* exhibited mass losses of 4.68%, 4.73%, 4.93%, and 4.88% at 28, 56, and 182 days, respectively. The mass loss in the mixes 5FASFRSC, 10FASFRSC, 15FASFRSC, and 20FASFRSC at 28, 56, 91, and 182 days was found (4.43, 4.47, 4.78, and 4.67%), (4.32, 4.59, 4.66, and 4.56%), (4.24, 4.51, 4.57, 4.49%) and (4.36, 4.64, 4.69, 4.62%), respectively.
The results showed that maximum deterioration occurred when specimens were submerged in a 5% H2SO4 solution for 28 days. The reaction between H2SO4 and calcium hydroxide in the samples results in the formation of hydrated calcium sulfate, known as gypsum, which precipitates in the solution. It could explain why the samples experienced the most significant mass loss after being immersed for up to 28 days. This trend was seen in all the mixes; when the immersion time increases beyond 28 days, the neutralization reaction slows down due to the slight variation in the pH of the solution. Consequently, only slight differences in mass loss were observed at the later intervals of 56, 91, and 182 days.
The mixes containing 10% SF show better resistance against sulfuric acid attacks than the reference mix NAC* without SF. The decrease in mass loss observed with the addition of SF is due to the reaction between SF and calcium hydroxide in the samples, which forms calcium silicate. When FA and SF are combined with water, they undergo a silicate reaction that produces extra C-S-H gel. The C-S-H gel obtained and combined with sulfuric acid formed hydrated calcium sulfate (gypsum) and silica gel, presented in Equation (5).
3 CaO . Si O 2 . 3 H 2 O + H 2 S O 4     CaS O 4 . 2 H 2 O + Si ( OH ) 4  
Furthermore, the fine particles of (FA + SF) filled the concrete’s micropores, consequently reducing permeability and porosity, thus helping to improve its ability to resist sulfuric acid attack. The deterioration of concrete decreases with the addition of (FA + SF). The microsilica fume lowers the amount of calcium hydroxide in the binder matrix. It changes chemical composition into C-S-H gel through a pozzolanic reaction, as shown in the above Equation (6). When exposed to an acidic environment, (FA + SF) concrete experiences a reduction in the formation of water-soluble salts compared to regular concrete, resulting in a lower degree of mass loss. It makes the acid resistance stronger.
The present study is based on newly developed concrete, so the direct comparison is invalid. However, the present study’s findings closely match the published study’s [34]. In the study [34], 10% SF was partially replaced by OPC in the concrete mix design and immersed in a 5% sulfuric acid solution. A mass loss of around 5% was discovered, as in our study of developed mixes 5FASFRSC, 10FASFRSC, 15FASFRSC, and 20FASFRSC, respectively.

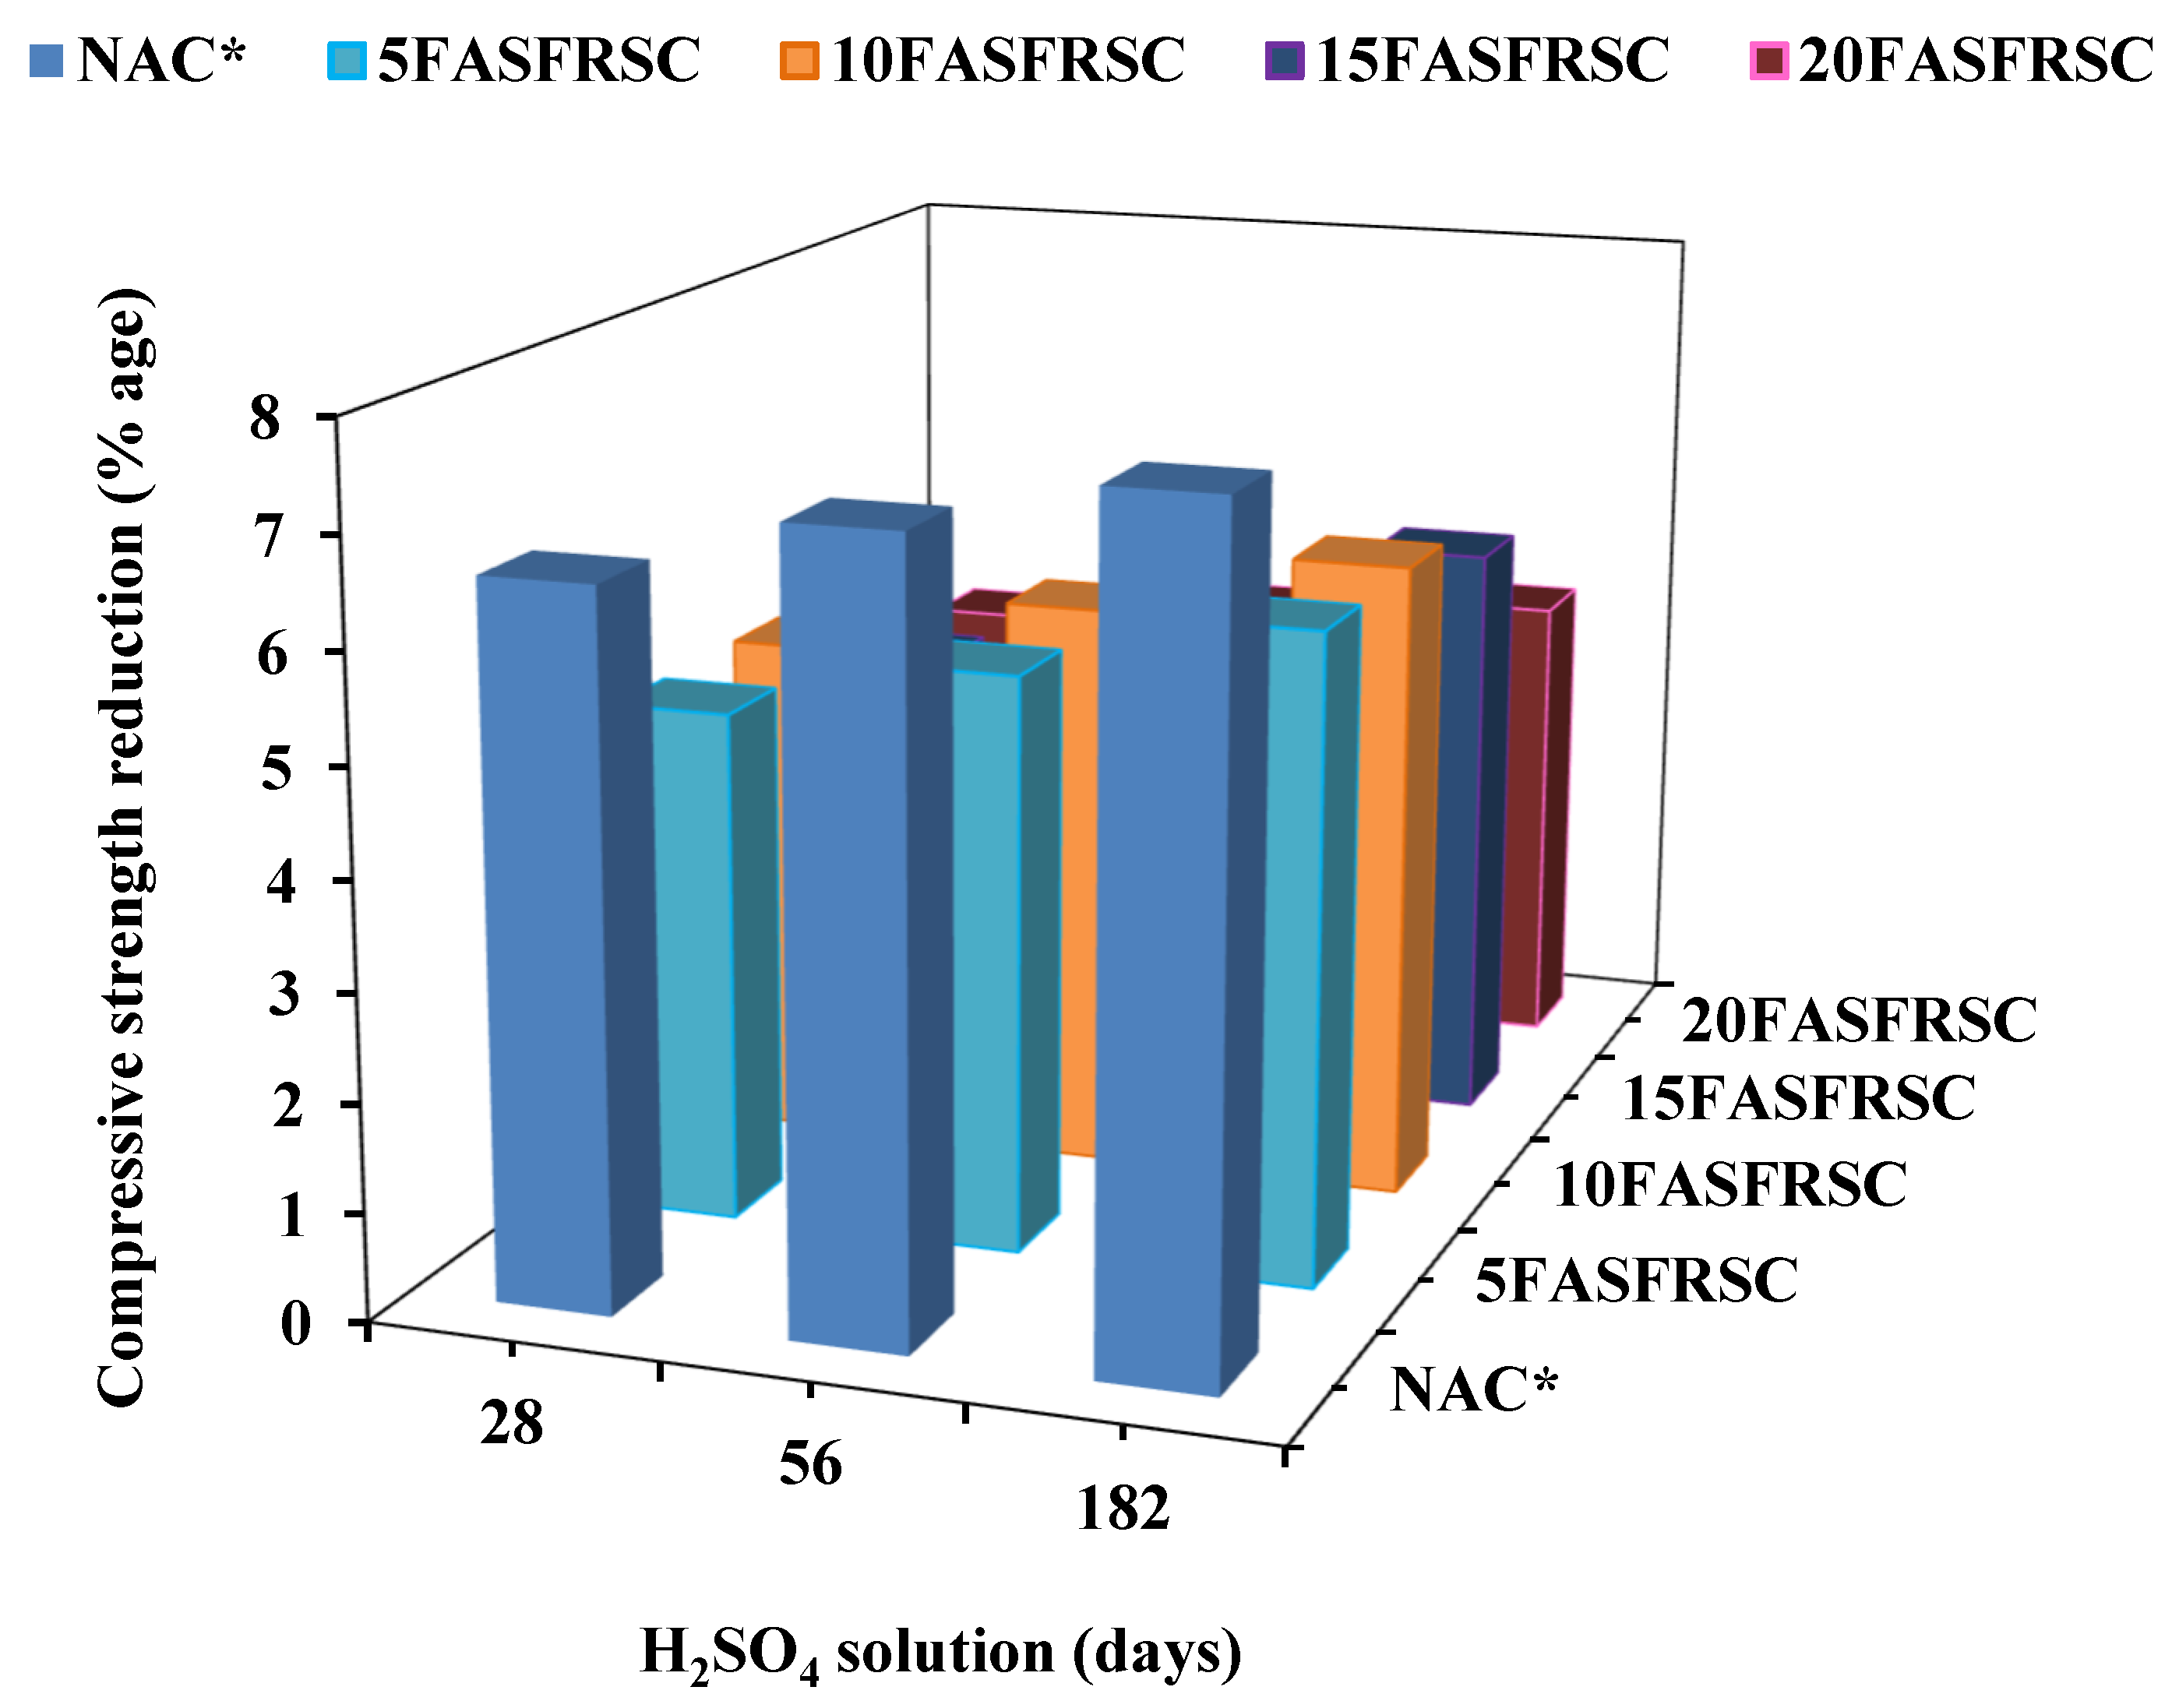
Variation in the Compressive Strength of Concrete Exposed to a Sulfuric Acid Solution

Samples were taken out to perform a compressive strength test after being incubated for 28, 56, and 182 days in a 5% sulfuric acid solution. The mean value derived from three identical specimens was used to assess the decrease in compressive strength for each formulated mix. Figure 14 illustrates the percentage decrease in compressive strength following 28, 56, and 182 days of exposure to 5% sulfuric acid. Figure 14 showcases the graphs for the NAC* mixes labeled as 5FASFRSC, 10FASFRSC, 15FASFRSC, and 20FASFRSC, respectively. Over 28, 56, and 182 days, the reference mix NAC* experienced a reduction in compressive strength by 6.55%, 7.2%, and 7.69%, respectively. The percentage reduction of compressive strength in the mixes 5FASFRSC, 10FASFRSC, 15FASFRSC, and 20FASFRSC at 28, 56, and 182 days was found (4.79, 5.37, and 5.99%), (4.09, 4.67, and 5.54%), (3.34, 3.88, and 4.4%) and (3.95, 4.23, and 4.44%), respectively. When 10% of OPC is substituted with SF and varying amounts of FA (ranging from 5% to 20%) in the mixes 5FASFRSC, 10FASFRSC, 15FASFRSC, and 20FASFRSC, the decrease in compressive strength is less pronounced compared to the reference mix NAC*.
As previously mentioned, the combination of (FA + SF) notably enhanced the compressive strength and reduced the newly developed concrete’s porosity when mixed with the modified sand blend (50% R-Sand + 50% M-Sand). It has been discovered that developed modified sand with (FA + SF) content enhances the resistance against sulfuric acid attack. However, the present study is based on newly developed modified sand concrete, so the direct comparison is invalid. The current study’s findings are consistent with existing research that employs 10% SF as a partial substitute in concrete to resist sulfuric acid damage [34,35,36].

4. Conclusions

This study developed four mixes containing varying amounts of fly ash ranging from 5% to 20%, 10% of optimal SF, and a modified sand blend of (50% R-sand and 50% M-sand), respectively. This investigation sought to integrate waste materials into concrete design mixtures to advance sustainability in the concrete industry. The study’s key conclusions are as follows:
  • Concrete from fly ash, silica fume, and recycled sand exhibited better mechanical properties and maintained adequate durability.
  • The four sustainable concrete formulations, including fly ash, silica fume, and recycled sand, successfully met the 30 MPa and 38 MPa compressive strength requirements, as ACI 318-19 outlined.
  • At the intervals of 28, 56, and 182 days, the compressive strength of the developed mixes 5FASFRSC, 10FASFRSC, 15FASFRSC, and 20FASFRSC consistently outperformed the reference mix NAC*.
  • At 28 days, the flexural strength of the 5FASFRSC, 10FASFRSC, 15FASFRSC, and 20FASFRSC formulations was found to be 16.3%, 18.5%, 21.4%, and 19.5% of the concrete’s design strength (f’c), respectively.
  • The absorption of water at 28, 56, and 182 days in the mixes 5FASFRSC, 10FASFRSC, 15FASFRSC, and 20FASFRSC with the combination of SCMs (FS + SF) along with modified sand combination (50% R-Sand + 50% M-Sand) found a decreasing pattern. The threshold was reached in the mix 15FASFRSC with the combination of (15% FA + 10% SF) and a modified sand combination (50% R-Sand + 50% M-Sand).
  • The developed mixes 5FASFRSC, 10FASFRSC, 15FASFRSC, and 20FASFRSC show better resistance against sulfuric acid attacks than the reference mix NAC*. The mixture labeled 15FASFRSC yielded consistent results when the fine aggregate was optimally balanced with a 50/50 combination of R-Sand and M-Sand and supplemented with cementitious materials comprising 15% FA and 10% SF.
  • It is concluded that up to 25% OPC with optimized SCMs (15% FA + 10% SF) and 100% river sand with (50% R-Sand + 50% M-Sand) could be replaced in the formulation of concrete mixtures for the building sector.

Author Contributions

Conceptualization, J.K.N. and M.N.A.; methodology, M.N.A.; validation, J.K.N.; and M.N.A.; formal analysis, M.N.A., A.H.A. and M.S.R.; investigation, M.N.A. and M.S.R.; resources, M.N.A.; data curation, M.N.A., A.H.A. and M.S.R.; writing—original draft preparation, J.K.N., M.N.A., A.H.A. and M.S.R.; writing—review and editing, A.H.A. and M.S.R.; visualization, J.K.N.; supervision, A.H.A.; funding acquisition, J.K.N. All authors have read and agreed to the published version of the manuscript.

Funding

This research received no external funding.

Data Availability Statement

The data are available in the manuscript.

Acknowledgments

We highly acknowledge the help extended to the FBSU Laboratory. We also extend our acknowledgment to Eng. Ammar for his valuable help in conducting experiments in the lab.

Conflicts of Interest

The authors declare no conflicts of interest.

Abbreviations

FlyashFA
Silica FumeSF
R-SandRecycled Sand
M-SandManufactured Sand
Supplementary Cementitious MaterialsSCMs
Natural Coarse AggregateNCA
Ordinary Portland CementOPC
Compressive strengthCS
Flexural Strength FS

References

  1. Song, H.; Gu, G.; Cheng, Y. Experimental Study on River Sand Replacement in Concrete. IOP Conf. Ser. Earth Environ. Sci. 2020, 567, 012013. [Google Scholar] [CrossRef]
  2. Chyon, M.S.A.; Best, J.; Haq, S.M.A. From Extraction to Recovery: Understanding the Environmental and Social Transformations of Gravel Mining. Available online: https://papers.ssrn.com/sol3/papers.cfm?abstract_id=5222439 (accessed on 17 April 2025).
  3. Akhtar, M.N.; Alotaibi, A.; Shbeeb, N.I. River Sand Replacement with Sustainable Sand in Design Mix Concrete for the Construction Industry. Civ. Eng. J. 2025, 11, 201–214. [Google Scholar] [CrossRef]
  4. Shbeeb, N.I.; Akhtar, M.N. Enhancing the Sustainability of Concrete by Adding Recycled Sand and Silica Fume Along with Human Hair Fibers. J. Compos. Sci. 2025, 9, 216. [Google Scholar] [CrossRef]
  5. Zhang, K.; Wang, L.; Li, Z.; Zhang, Q. Effects of different fine aggregates as sand replacements on the carbonation properties of recycled aggregate concrete. Constr. Build. Mater. 2025, 468, 140416. [Google Scholar] [CrossRef]
  6. Yunchao, T.; Zheng, C.; Wanhui, F.; Yumei, N.; Cong, L.; Jieming, C. Combined effects of nano-silica and silica fume on the mechanical behavior of recycled aggregate concrete. Nanotechnol. Rev. 2021, 10, 819–838. [Google Scholar] [CrossRef]
  7. Akhtar, M.; Hattamleh, O.; Akhtar, J. Feasibility of coal fly ash based bricks and roof tiles as construction materials: A review. MATEC Web Conf. 2017, 120, 03008. [Google Scholar] [CrossRef]
  8. Hashim, A.A.; Al-Mosawi, A.I.; Abdulsada, S.A. Investigating the mechanical properties, durability, microstructure, and embodied CO2 emissions of silica fume-infused sustainable concrete. Int. J. Appl. Ceram. Technol. 2025, e15136. [Google Scholar] [CrossRef]
  9. Akhtar, M.N.; Jameel, M.; Ibrahim, Z.; Bunnori, N.M. Incorporation of recycled aggregates and silica fume in concrete: An environmental savior—A systematic review. J. Mater. Res. Technol. 2022, 20, 4525–4544. [Google Scholar] [CrossRef]
  10. Akhtar, M.N.; Jameel, M.; Ibrahim, Z.; Bunnori, N.M.; Bani-Hani, K.A. Development of sustainable modified sand concrete: An experimental study. Ain Shams Eng. J. 2024, 15, 102331. [Google Scholar] [CrossRef]
  11. Sathvik, S.; Oyebisi, S.; Kumar, R.; Shakor, P.; Adejonwo, O.; Tantri, A.; Suma, V. Analyzing the influence of manufactured sand and fly ash on concrete strength through experimental and machine learning methods. Sci. Rep. 2025, 15, 4978. [Google Scholar] [CrossRef]
  12. Mishra, R.K.; Mishra, A.K. Machine learning based prediction model for the compressive strength of fly ash reinforced concrete: An exploration of varying cement replacements and water-cement ratios. Asian J. Civ. Eng. 2025, 26, 1543–1564. [Google Scholar] [CrossRef]
  13. Feng, W.; Tang, Y.; Zhang, Y.; Qi, C.; Ma, L.; Li, L. Partially fly ash and nano-silica incorporated recycled coarse aggregate based concrete: Constitutive model and enhancement mechanism. J. Mater. Res. Technol. 2022, 17, 192–210. [Google Scholar] [CrossRef]
  14. Wu, E.; Ma, X.; Fang, C.; Li, N.; Jia, L.; Jiang, P.; Wang, W. Strength performance and microscopic mechanism of cement mortar incorporating fine recycled concrete aggregate and natural sand. J. Build. Eng. 2025, 100, 111767. [Google Scholar] [CrossRef]
  15. Mistri, A.; Bhattacharyya, S.K.; Dhami, N.; Mukherjee, A.; Barai, S.V. A review on different treatment methods for enhancing the properties of recycled aggregates for sustainable construction materials. Constr. Build. Mater. 2020, 233, 117894. [Google Scholar] [CrossRef]
  16. Akhtar, J.; Akhtar, M. Enhancement in properties of concrete with demolished waste aggregate. GE-Int. J. Eng. Res. 2014, 2, 73–83. [Google Scholar]
  17. Akhtar, M.N.; Bani-Hani, K.A.; Malkawi, D.A.H.; Albatayneh, O. Suitability of sustainable sand for concrete manufacturing—A complete review of recycled and desert sand substitution. Results Eng. 2024, 23, 102478. [Google Scholar] [CrossRef]
  18. Mohammed, T.U.; Rony, M.A.; Zunaied Bin Harun, M.; Uddin, N.; Saha, D.; Rahman, M.N.; Mahmood, A.H. Alternative Fine Aggregates to Natural River Sand for Manufactured Concrete Ensuring Circular Economy. Constr. Mater. 2024, 4, 640–654. [Google Scholar] [CrossRef]
  19. Zhou, R.; Luo, Y.; Ba, M.; Zhang, Z.; Fang, J.; Poon, C.S.; Fang, X. Value-added recycling of waste concrete fines into alternative aggregates for river sand conservation. J. CO2 Util. 2024, 83, 102802. [Google Scholar] [CrossRef]
  20. Mostofinejad, D.; Nasrollahi, M.; Bahmani, H.; Zajshoor, Z.; Sadeghi, M. Enhancing concrete strength and durability of normal and high-strength concrete: Exploring combined effects of optimized silica fume and slag. Iran. J. Sci. Technol. Trans. Civ. Eng. 2025, 49, 2309–2328. [Google Scholar] [CrossRef]
  21. Xiao, S.; Cheng, H.; Que, Z.; Liu, T.; Zou, D. Enhancing marine anti-washout concrete: Optimal silica fume usage for improved compressive strength and abrasion resistance. Constr. Build. Mater. 2024, 428, 136262. [Google Scholar] [CrossRef]
  22. Azare, A.A.; Ibrahim, M.H.B.W.; Alshalif, A.F.; Jaya, R.P.; Nindyawati, N. Mechanical and Microstructural Characteristics of High-Strength Self-Compacting Concrete (HSSCC) with Optimal Silica Fume and Fly Ash Cement Replacement. Int. J. Sustain. Constr. Eng. Technol. 2024, 15, 81–99. [Google Scholar] [CrossRef]
  23. Wang, K.; Guo, S.; Yuan, H.; Ren, J.; Chen, P.; Zhang, Q. Influence of cement particle size, ultra-fine fly ash, and ultra-fine silica fume on the physical and microscopic properties of slurry. Case Stud. Constr. Mater. 2025, 22, e04337. [Google Scholar] [CrossRef]
  24. Ju, M.; Jeong, J.-G.; Palou, M.; Park, K. Mechanical Behavior of Fine Recycled Concrete Aggregate Concrete with the Mineral Admixtures. Materials 2020, 13, 2264. [Google Scholar] [CrossRef] [PubMed]
  25. Azizi, M.; Samimi, K. Effect of silica fume on Self-compacting Earth Concrete: Compressive strength, durability and microstructural studies. Constr. Build. Mater. 2025, 472, 140815. [Google Scholar] [CrossRef]
  26. Evangelista, L.; De Brito, J. Durability performance of concrete made with fine recycled concrete aggregates. Cem. Concr. Compos. 2010, 32, 9–14. [Google Scholar] [CrossRef]
  27. Jagadeesh, P. Assessment of usage of manufactured sand and recycled aggregate as sustainable concrete: A review. Mater. Today Proc. 2022, 64, 1029–1034. [Google Scholar]
  28. ACI-318; Building Code Requirements for Structural Concrete (ACI 318-08) and Commentary. American Concrete Institute: Farmington Hills, MI, USA, 2008.
  29. ASTM-C-494/C-494M; High-Range, G Water-Reducing and Retarding Admixture. ASTM International: West Conshohocken, PA, USA, 2005.
  30. ACI-211.1; Standard Practice for Selecting Proportions for Normal, Heavyweight, and Mass Concrete. American Concrete Institute: San Francisco, CA, USA, 1991.
  31. ASTM C293/C293M-16; Standard Test Method for Flexural Strength of Concrete (Using Simple Beam with Center-Point Loading). ASTM International: West Conshohocken, PA, USA, 2016.
  32. Akhtar, M.; Akhtar, J. Suitability of Class F Flyash for Construction Industry: An Indian Scenario. Int. J. Struct. Constr. Eng. 2018, 12, 892–897. [Google Scholar]
  33. Rais, M.S.; Khan, R.A. Strength and durability characteristics of binary blended recycled coarse aggregate concrete containing microsilica and metakaolin. Innov. Infrastruct. Solut. 2020, 5, 114. [Google Scholar] [CrossRef]
  34. Khodabakhshian, A.; Ghalehnovi, M.; De Brito, J.; Shamsabadi, E.A. Durability performance of structural concrete containing silica fume and marble industry waste powder. J. Clean. Prod. 2018, 170, 42–60. [Google Scholar] [CrossRef]
  35. Thomas, B.S.; Gupta, R.C.; Panicker, V.J. Recycling of waste tire rubber as aggregate in concrete: Durability-related performance. J. Clean. Prod. 2016, 112, 504–513. [Google Scholar] [CrossRef]
  36. Hewayde, E.; Nehdi, M.L.; Allouche, E.; Nakhla, G. Using concrete admixtures for sulphuric acid resistance. Constr. Mater. 2007, 160, 25–35. [Google Scholar] [CrossRef]
Figure 1. (a) Cement, (b) flyash, and (c) silica fume.
Jcs 09 00279 g001
Figure 2. (a) M-Sand and (b) R-Sand replaced river sand.
Jcs 09 00279 g002
Figure 3. Natural coarse aggregate (a) 19 mm, (b) 12.5 mm, (c) 9.5 mm.
Jcs 09 00279 g003
Figure 4. (a) Slump-retaining concrete admixture and (b) sample.
Jcs 09 00279 g004
Figure 5. Preparation methodology of recycled sand.
Jcs 09 00279 g005
Figure 6. (a) prepration of sulfur caping, (b) samples are ready for testing, (c) samples under testing.
Jcs 09 00279 g006
Figure 7. (a,b) Experimental setup for evaluating flexural strength.
Jcs 09 00279 g007
Figure 8. Evaluation of compressive strength.
Jcs 09 00279 g008
Figure 9. Evaluation of splitting tensile strength.
Jcs 09 00279 g009
Figure 10. Compressive stress-strain curves of the tested specimens.
Jcs 09 00279 g010
Figure 11. Water absorption of the tested specimens.
Jcs 09 00279 g011
Figure 12. (a) samples under H2SO4, (b) samples are ready for testing, (c) samples under testing.
Jcs 09 00279 g012
Figure 13. Change in concrete mass exposed to 5% sulfuric acid solution.
Jcs 09 00279 g013
Figure 14. Reduction in compressive strength of concrete exposed to 5% sulfuric acid solution.
Jcs 09 00279 g014
Table 1. Properties of concrete ingredients.
ParametersIngredient Results
CementFlyashSilica fumeR-SandM-SandCoarse AggregateWater for Mixing Concrete Ingredients
Bulk specific gravity3.152.102.302.562.662.80-
Absorption (%)---2.881.320.92-
Sand equivalent values---9498--
Fineness modulus (FM)---2.63.07.0-
pH---7.87.2 7.1
Sulfate (mg kg−1)---95026817028
TDS (mg kg−1)--- 680
Chloride (mg kg−1)---10101609440
Organic impurities-NilNilNilNilNil-
Salinity 478
Table 2. Details of ingredients in different concrete mixes.
Mix DesignationCementitious Materials %Fine Aggregate %NCA
%
Admixture by Weight of Cement (%)Mix Temperature (°C)Mix Air Temperature (°C)Mix Air Content
(%)
OPCFASFTotalR-SandM-Sand
NAC*1000010001001000.027202.5
5FASFRSC8551010050501000.826202.4
10FASFRSC80101010050501001.225202.5
15FASFRSC75151010050501001.625202.5
20FASFRSC70201010050501002.025202.6
NAC* = Natural aggregate concrete (reference mix*); 5FASFRSC = (5% FA + 10% SF + (50% R-Sand + 50% M-Sand)); 10FASFRSC = (10% FA + 10% SF + (50% R-Sand + 50% M-Sand)); 15FASFRSC = (15% FA + 10% SF + (50% R-Sand + 50% M-Sand)); 20FASFRSC = (20% FA + 10% SF + (50% R-Sand + 50% M-Sand)).
Disclaimer/Publisher’s Note: The statements, opinions and data contained in all publications are solely those of the individual author(s) and contributor(s) and not of MDPI and/or the editor(s). MDPI and/or the editor(s) disclaim responsibility for any injury to people or property resulting from any ideas, methods, instructions or products referred to in the content.

