Article

Prediction of Mechanical and Fracture Properties of Lightweight Polyurethane Composites Using Machine Learning Methods

by
Nikhilesh Nishikant Narkhede
1 and
Vijaya Chalivendra
2,*
1
Department of Data Science, University of Massachusetts, North Dartmouth, MA 02747, USA
2
Department of Mechanical Engineering, University of Massachusetts, North Dartmouth, MA 02747, USA
*
Author to whom correspondence should be addressed.
J. Compos. Sci. 2025, 9(6), 271; https://doi.org/10.3390/jcs9060271
Submission received: 13 May 2025 / Revised: 25 May 2025 / Accepted: 28 May 2025 / Published: 29 May 2025

Abstract

:
This study aims to investigate the effectiveness of two machine learning methods for the prediction of the mechanical and fracture properties of Cenosphere-reinforced lightweight thermoset polyurethane composites. To evaluate the effectiveness of the models, datasets from our experimental study of composites made of five different volume fractions (0% to 40%) of Cenospheres (hollow Aluminum Silicate particles) in increments of 10% are fabricated. Experiments are conducted to determine the effect of the volume fraction of Cenospheres on Young’s modulus (both in tension and compression), percentage elongation at break, tensile strength, specific tensile strength, and fracture toughness of the composites. Two machine learning models, shallow artificial neural network (ANN) and the non-linear deep neural network (DNN), are employed to predict the above properties. A parametric study was performed for each model and optimized parameters were identified and later used to predict the properties beyond 40% volume fraction of Cenospheres. The predictions of non-linear DNN demonstrated less slope than shallow ANN and, for mass density, the non-linear DNN had unexpected predictions of increasing mass density with the addition of lighter Cenospheres. Hence, a double-hidden-layer DNN is used to predict the mass density beyond 40%, which provides the expected behavior.

1. Introduction

Polyurethanes are among the most extensively studied and technologically advanced polymer materials used in composite applications [1,2,3]. They provide the non-linear elasticity of rubber and contribute not only to structural integrity but also to energy absorption and impact resistance for a wide range of engineering applications [4,5,6]. Two-part thermoset polyurethane is easy to mix for making flexible plastic materials, and with the addition of particles or fibers, particulate composites can be made using a simple fabrication process [7,8,9]. To enhance their applications as energy-absorbing materials, thermoset polyurethanes are reinforced with lightweight particulates such as Cenospheres [10], green coconut fibers [11], and flax-fiber mats [12]. The reinforcement of lightweight particulates not only decreases the composites’ mass density significantly but also enhances the targeted mechanical properties [10,11,12]. Latere Dwan’isa et al. [13] studied the addition of hemp fibers of 20%wt. in soy-oil-based thermoset polyurethane and conducted dynamic mechanical analysis to determine the storage modulus and specific storage modulus. They compared these properties with glass fiber reinforcement at the same 20%wt. It was found that hemp reinforcement was better with respect to mass density and the mechanical properties. Yu et al. [14] reinforced rigid polyurethane foam pellets of different densities in polyurethane resin to fabricate lightweight composites. They investigated the effect of pellet density on mechanical properties, electrical insulation, water absorption, and heat resistance. Among the three types of composites, those filled with pellets to a density of 0.15 g·cm−3 exhibit the best overall performance.
In recent years, machine learning techniques have emerged as powerful tools for the design and property prediction of composite materials [15,16,17]. Among these, deep learning approaches, particularly deep neural networks (DNNs), have gained considerable attention due to their ability to outperform traditional methods in various supervised learning tasks. DNNs have shown great potential in accurately predicting the mechanical properties of composite materials [18,19]. Specifically, for particulate composites, Zazoum et al. [20] employed a backpropagation deep neural network (DNN) with nanoclay and compatibilizer content, with processing parameters as input, to predict mechanical properties such as tensile modulus and tensile strength of clay-reinforced polyethylene nanocomposites. Baek et al. [21] employed two types of DNNs (simple graph convolution network and a complex artificial neural network) to elucidate the structure–property relationships of Polypropylene/Silicon Oxide (SiC) nanocomposites. They identified that the graph convolutional network was better suited and more intuitive for analyzing the impact of nanoparticle distribution and agglomeration. Niaki et al. [22] implemented DNN models to predict mechanical properties of epoxy composites made of five differential reinforcements (fly ash, silica sand, crushed basalt, basalt fiber, and nanoclay). They identified an optimum DNN model of three hidden layers and structure of 6-13-13-11-1 to accurately predict various mechanical properties (compressive, flexural, and splitting tensile strengths). Their DNN model for tensile strength shows higher accuracy than for compressive and flexural strength. Recently, by using machine learning and deep learning techniques, Varughese and Sreekanth [23] effectively forecasted the mechanical properties (flexural strength and tensile strength) of silane and polyethylene glycol functionalized boron nitride nanosheets/epoxy nanocomposites. Very recently, Chai et al. [24] incorporated an interpretable deep learning approach to fast-track the mechanical property prediction and configuration effect evaluation of silicon carbide p-type (SiCp)/aluminum metal matrix particulate composites. A spatial–temporal deep learning model was developed to correctly predict the stress–strain relations of SiCp/Al composites across several configurations as well as to quickly screen the configurations with improved strength–toughness matching.
Taking advantage of the merits of deep learning models in predicting the properties of composites, the current manuscript is focused on employing shallow artificial neural network (ANN) and deep neural network (DNN) models to train the experimental data of mechanical and fracture properties of lightweight polyurethane particulate composites reinforced with Cenospheres (hollow Aluminum Silicate spherical particles). Five different volume fractions (0% to 40%, increments of 10%) were fabricated, and both mechanical and fracture experiments were conducted to determine the tensile and compressive Young’s modulus, tensile strength, specific tensile strength, elongation at break, and fracture toughness of the composite. The experimental data was later used to train the above two different machine learning models for prediction of the above properties. The main research objectives of this manuscript are (a) to make predictions of mechanical and fracture properties of Cenosphere-reinforced polyurethane composites using two machine learning models for intermediate volume fractions of Cenosphere between 0% and 40%, (b) to make predictions of the above properties of these composites beyond 40% of volume fraction up to 60%, and (c) to identify the merits and demerits of these two models based on the predictions.

2. Experimental Details
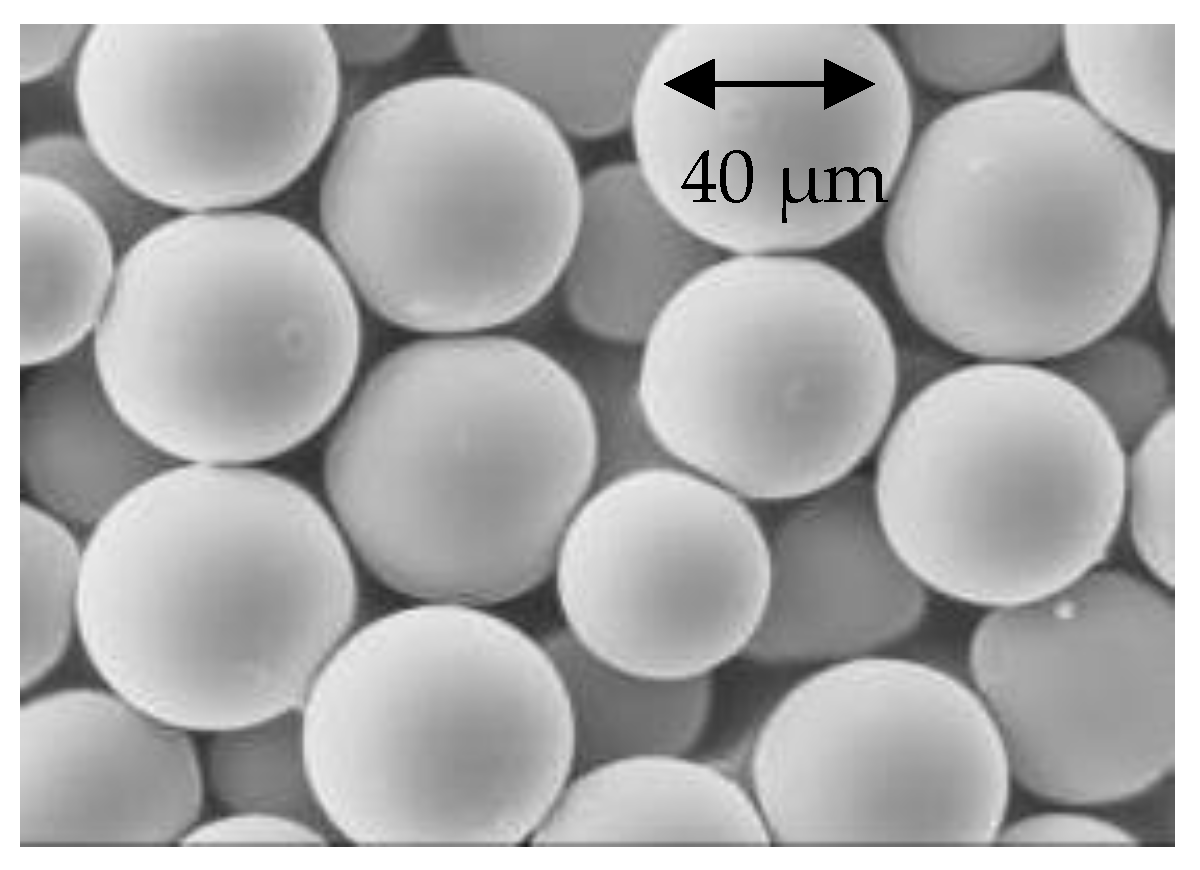
2.1. Materials

In this study, a thermoset and cross-linked elastomer polyurethane (supplied by Hapco Inc., Hanover, MA, USA) comprising two components, part A (resin) and part B (hardener), is used as a matrix material. Both components had a specific gravity of 1.16 and were mixed in a 1:1 ratio. This polyurethane is chosen for its flexibility and ease of handling. The polyurethane’s low viscosity makes it ideal for incorporating particles up to a 40% volume fraction without trapping air. Cenospheres (supplied by Sphere Services, Inc., Providence, RI, USA) were used as the reinforcing particles [25,26,27]. These are hollow, silica–alumina microspheres with diameters ranging from 10 to 300 μm. They are a by-product of fly ash generated by coal-fired power plants. Since fly ash is a waste material, its use contributes positively to environmental sustainability. A typical image of Cenospheres is shown in Figure 1.

2.2. Fabrication of Composites

Since polyurethane is a soft plastic, traditional machining of the test specimens from the cast sheet is difficult. Therefore, custom-made molds were fabricated using water jet machining to cast the required standard test specimens for mechanical and fracture characterization. Given that polyurethane’s polymerization process is highly sensitive to moisture, Cenospheres were first air-dried at 100 °C for an hour. Due to the higher viscosity of part A compared to part B, first, the Cenospheres were mixed with part B. Both part A and part B with Cenospheres were degassed separately to eliminate any trapped air. Afterward, the components were thoroughly mixed and degassed again to remove any air introduced during the mixing process. The resulting mix was carefully poured into the molds to form the desired test specimens, ensuring no air bubbles were introduced during pouring. Degassing prior to mixing both parts was performed to minimize degassing time after mixing, as polyurethane has a short gelation time of only 25 min. The specimens were left to cure in the molds at room temperature for 24 h. Afterward, they were removed from the molds and allowed to cure at room temperature for an additional 10 days to ensure complete polymerization of the polyurethane matrix.

2.3. Experimental Methods

The mass density of the composites of four different volume fractions is determined using cylindrical disks that are 25.4 mm in diameter and 12.5 mm thick. Tensile testing experiments are performed using the ASTM D412 test method, whereas compression testing experiments are conducted using the ASTM D575 test method. The fracture toughness of the composites is determined using single-edge-notch tension (SENT) specimen configuration. The fracture toughness KIC of the finite SENT geometry [29] can be determined by using Equation (1).
K I c = P c b w f a w
where b, w, and a are the thickness, width and crack length of the specimen, respectively, and f a w is a geometric correction factor for finite specimen geometry [29]. All three tension, compression, and fracture experiments are performed using an Instron 5585 materials (Instron, Norwood, MA, USA) testing system. A minimum of five experiments are performed for each composite type for the above measurements.

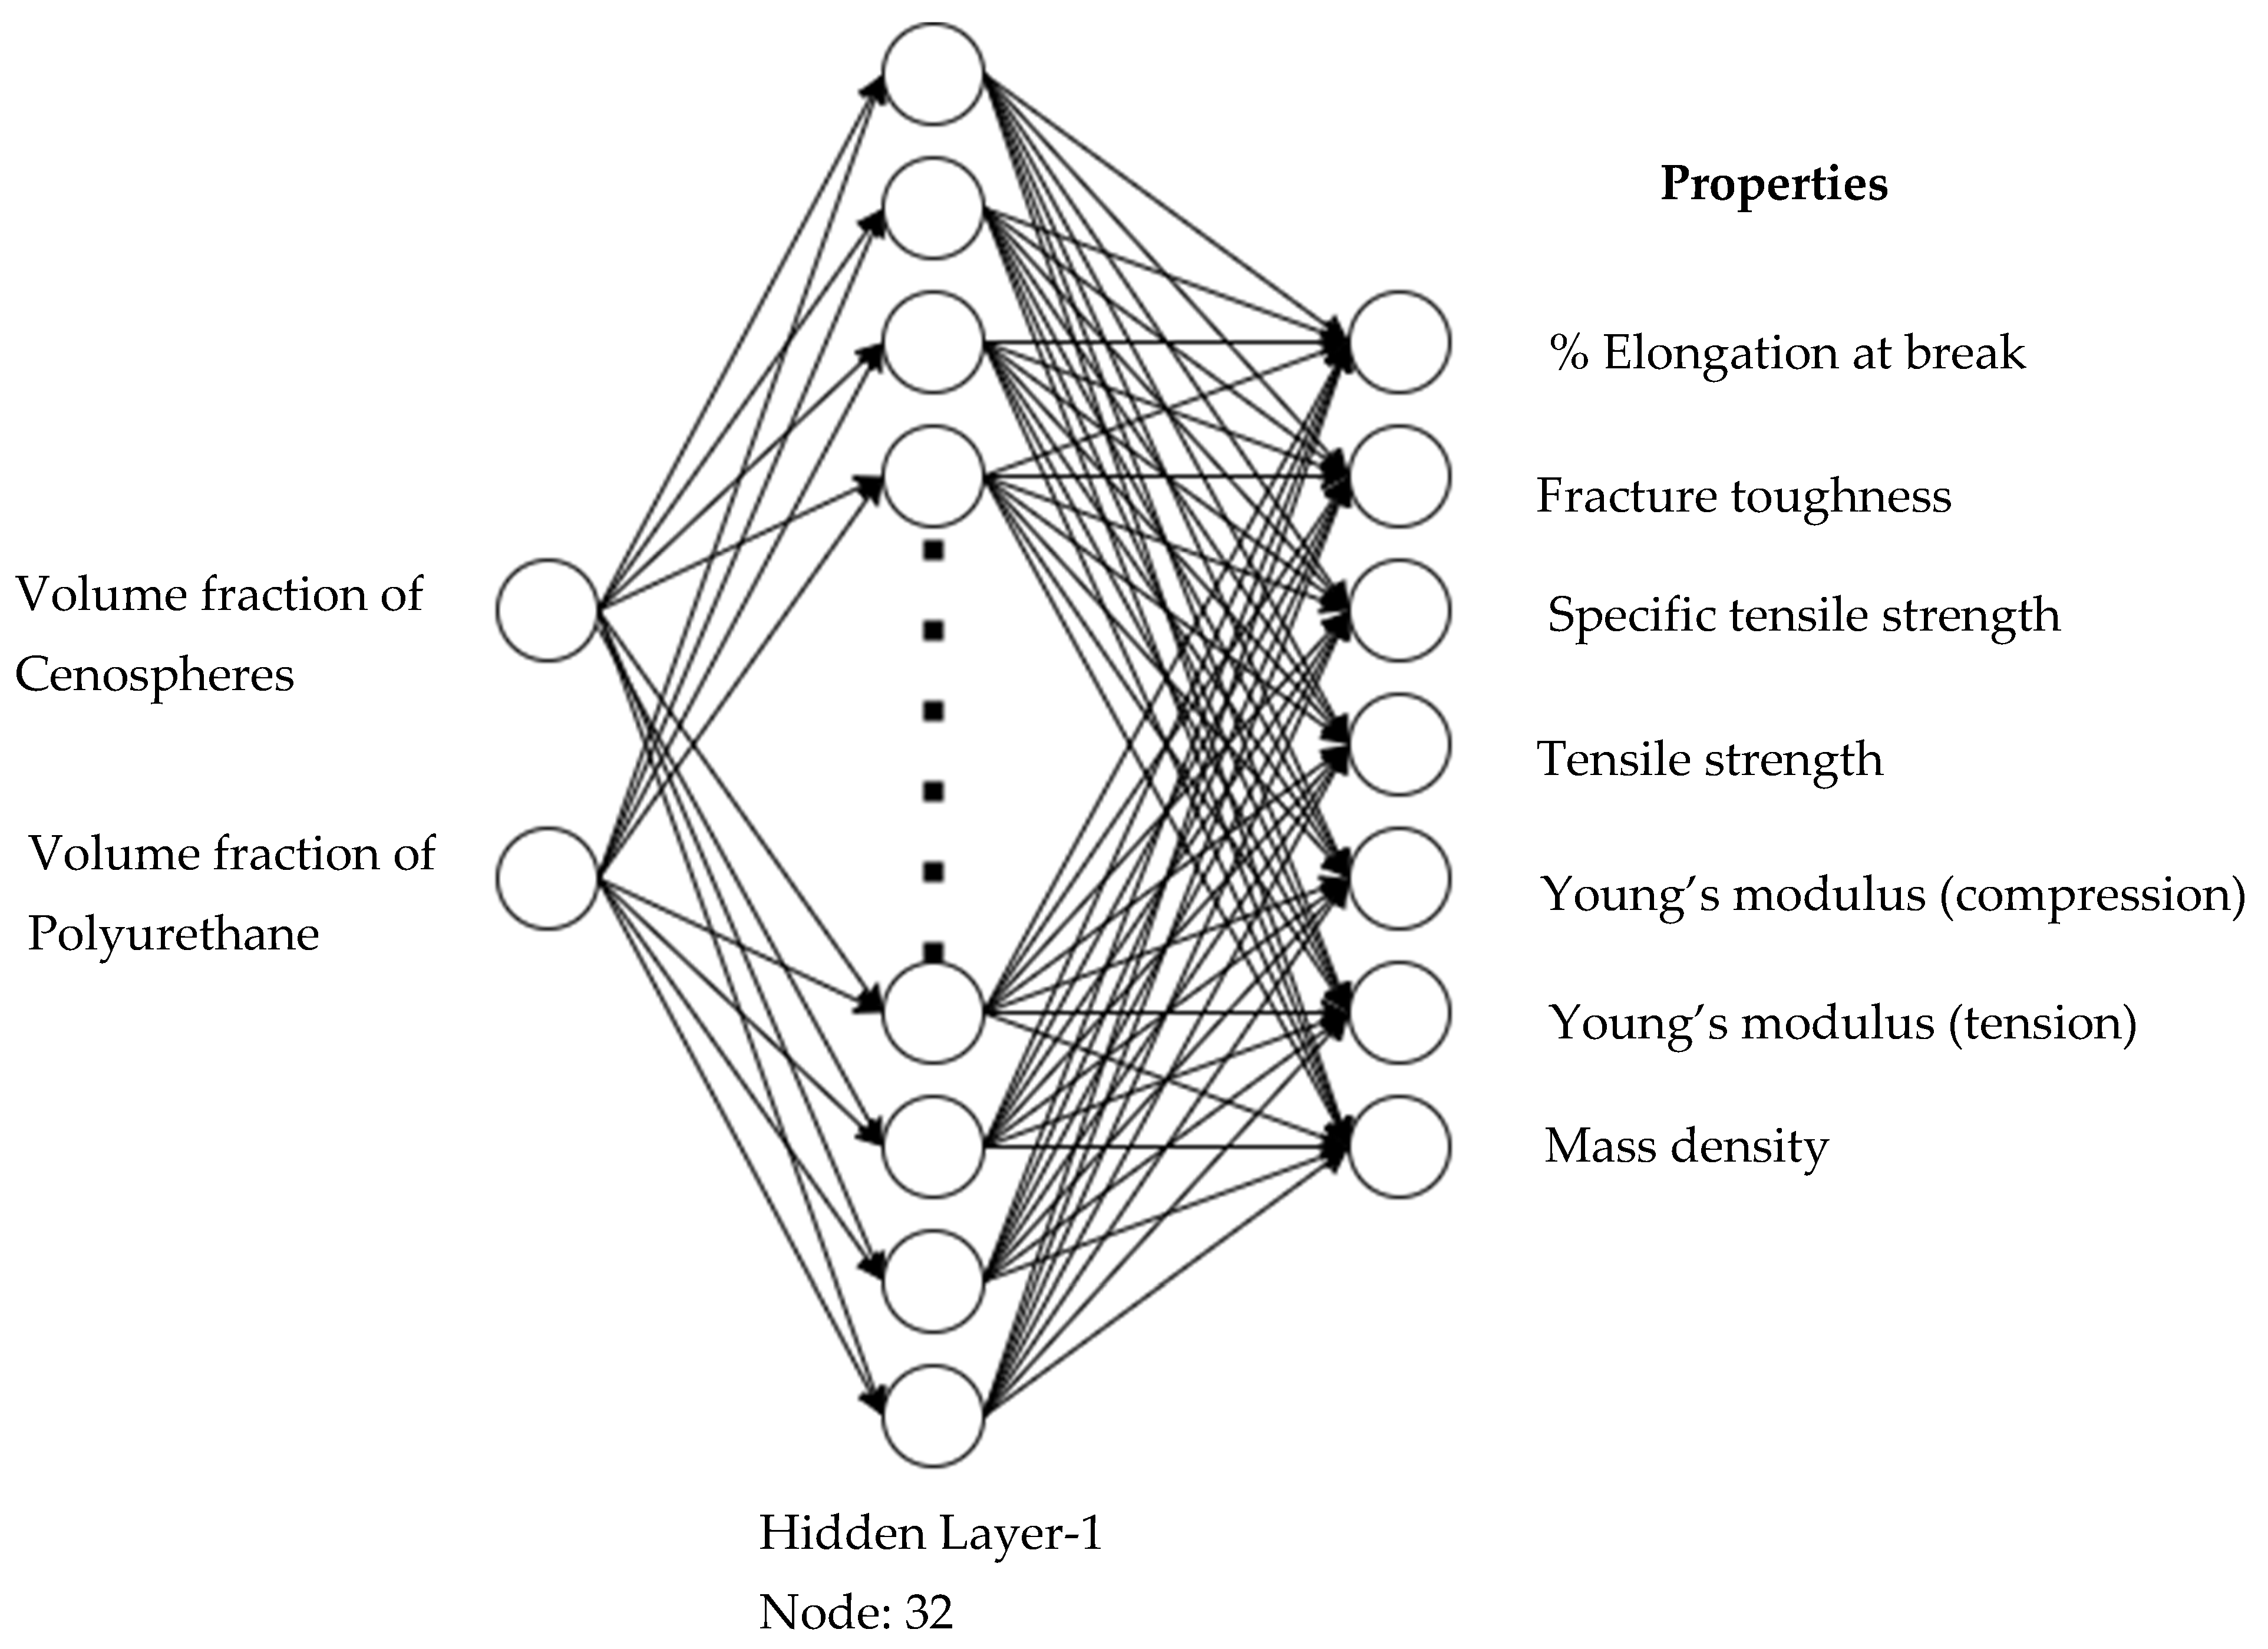
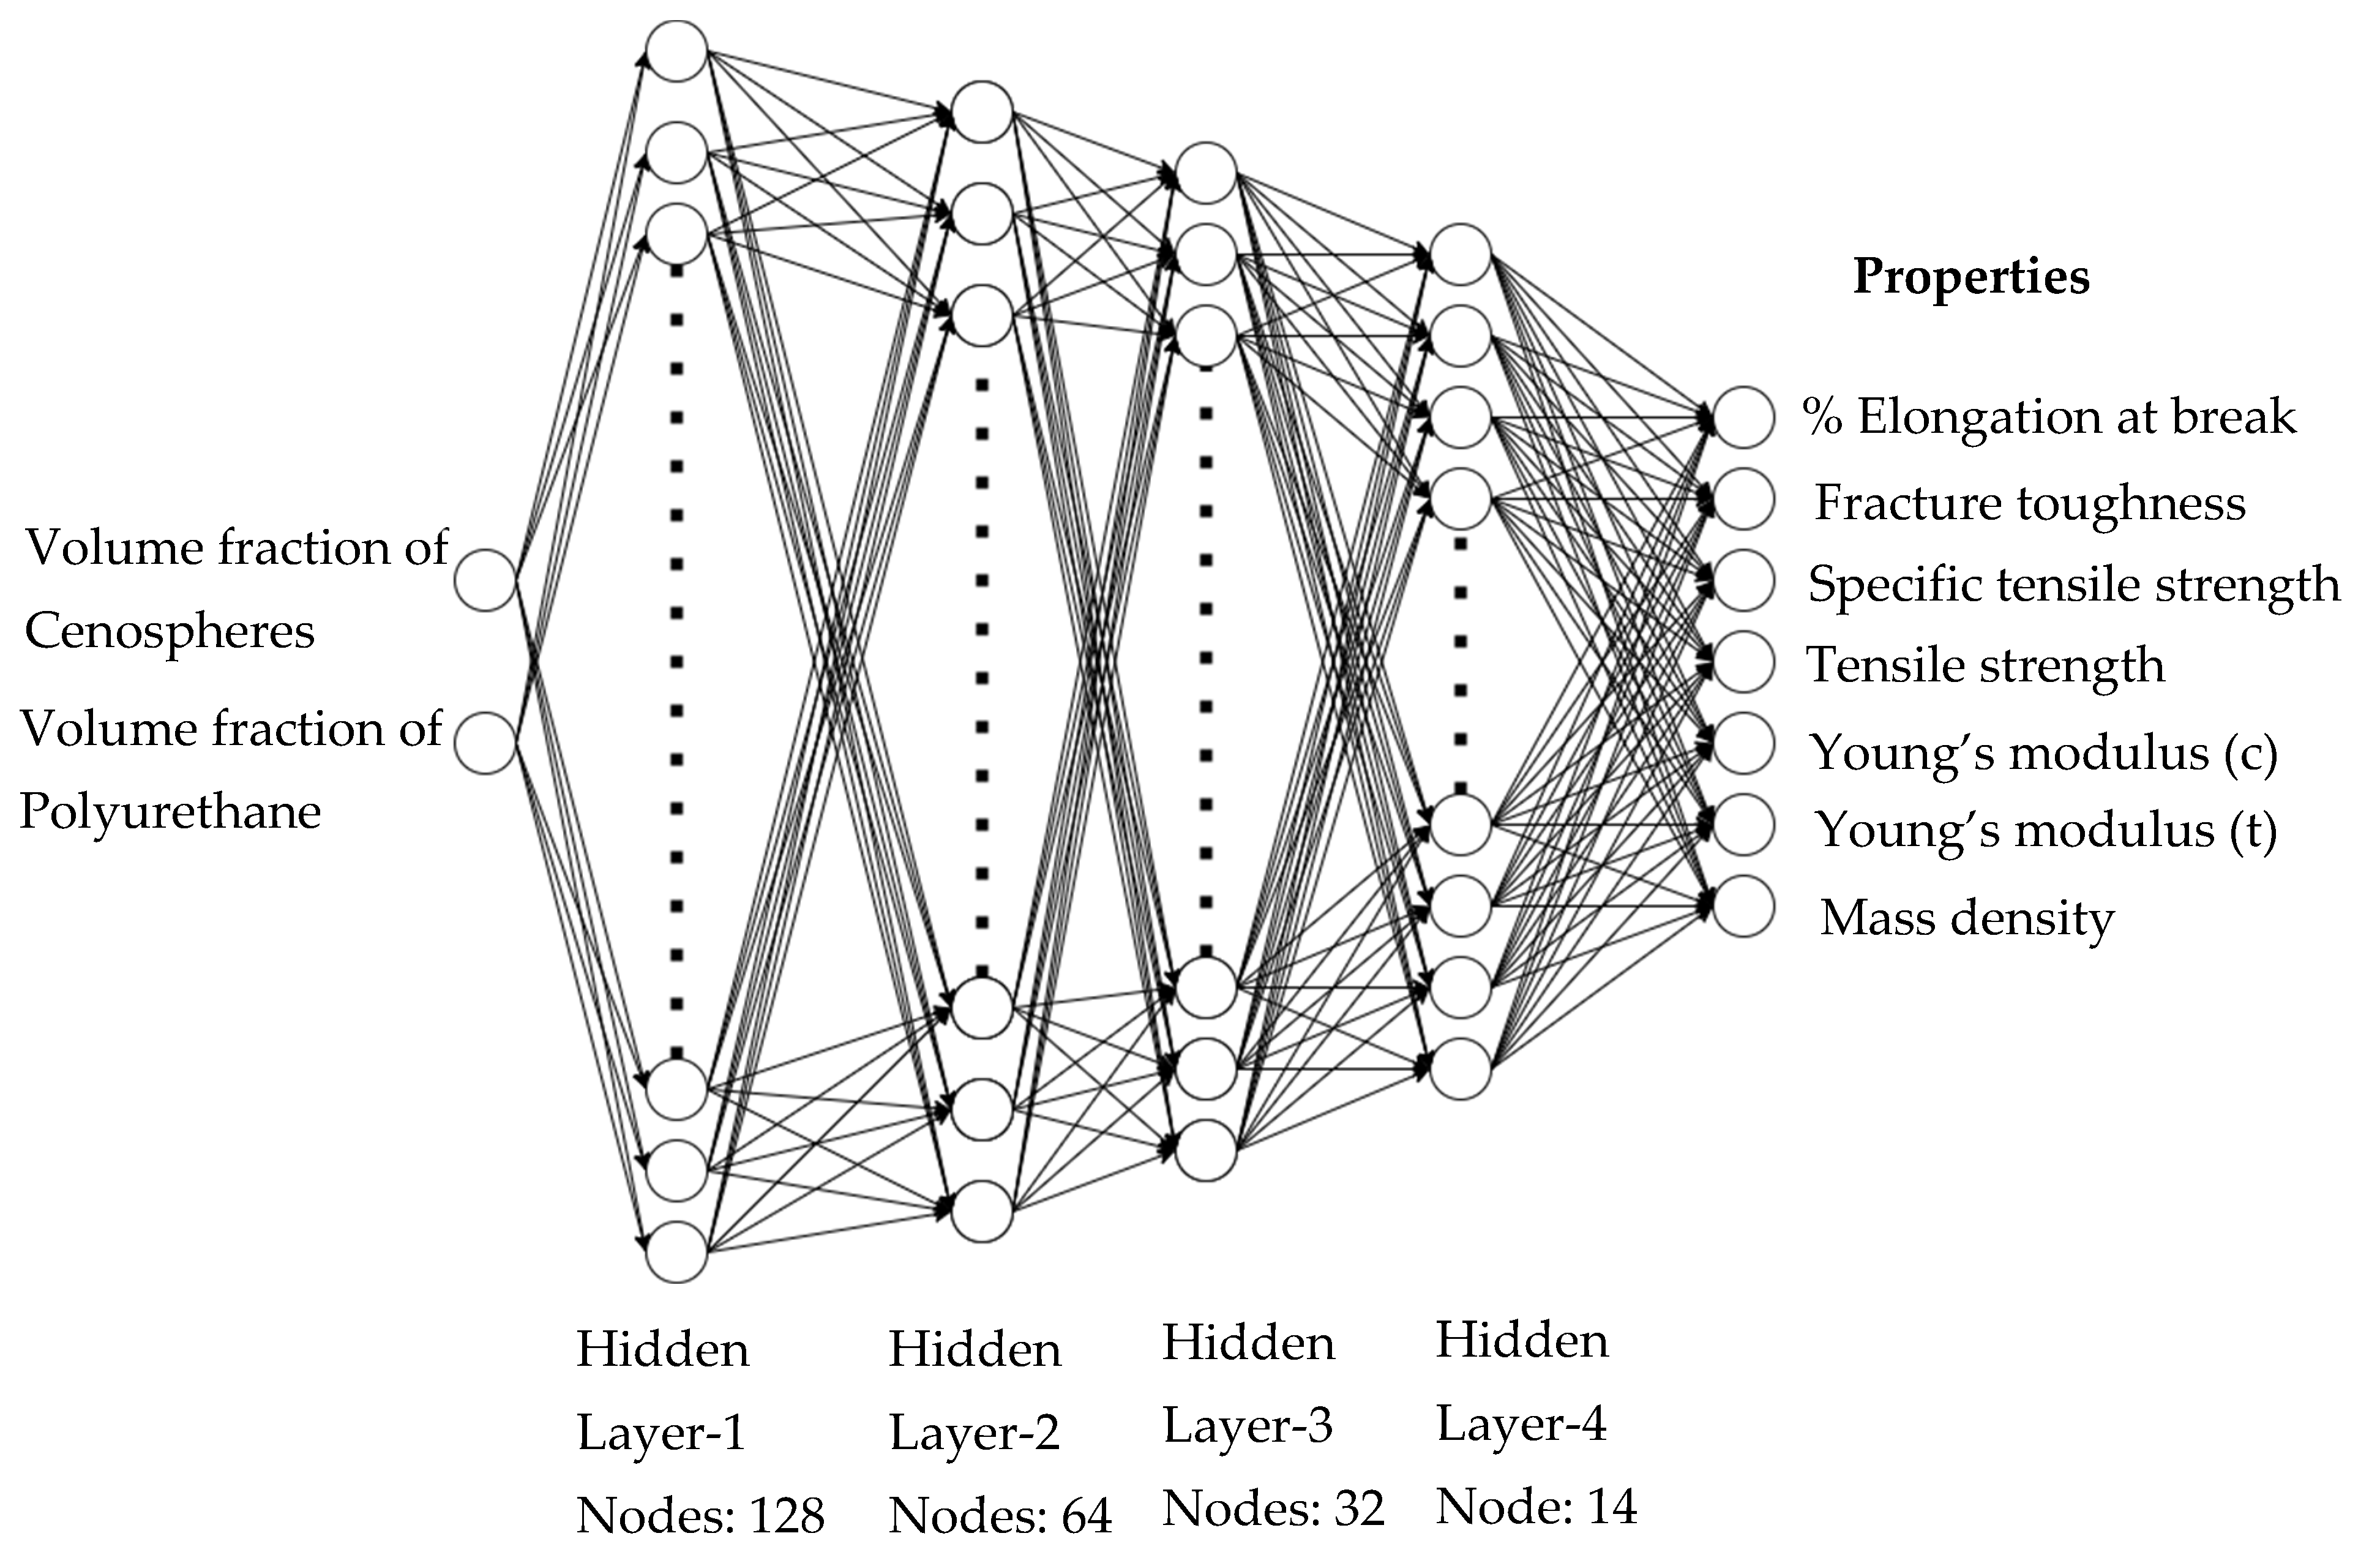
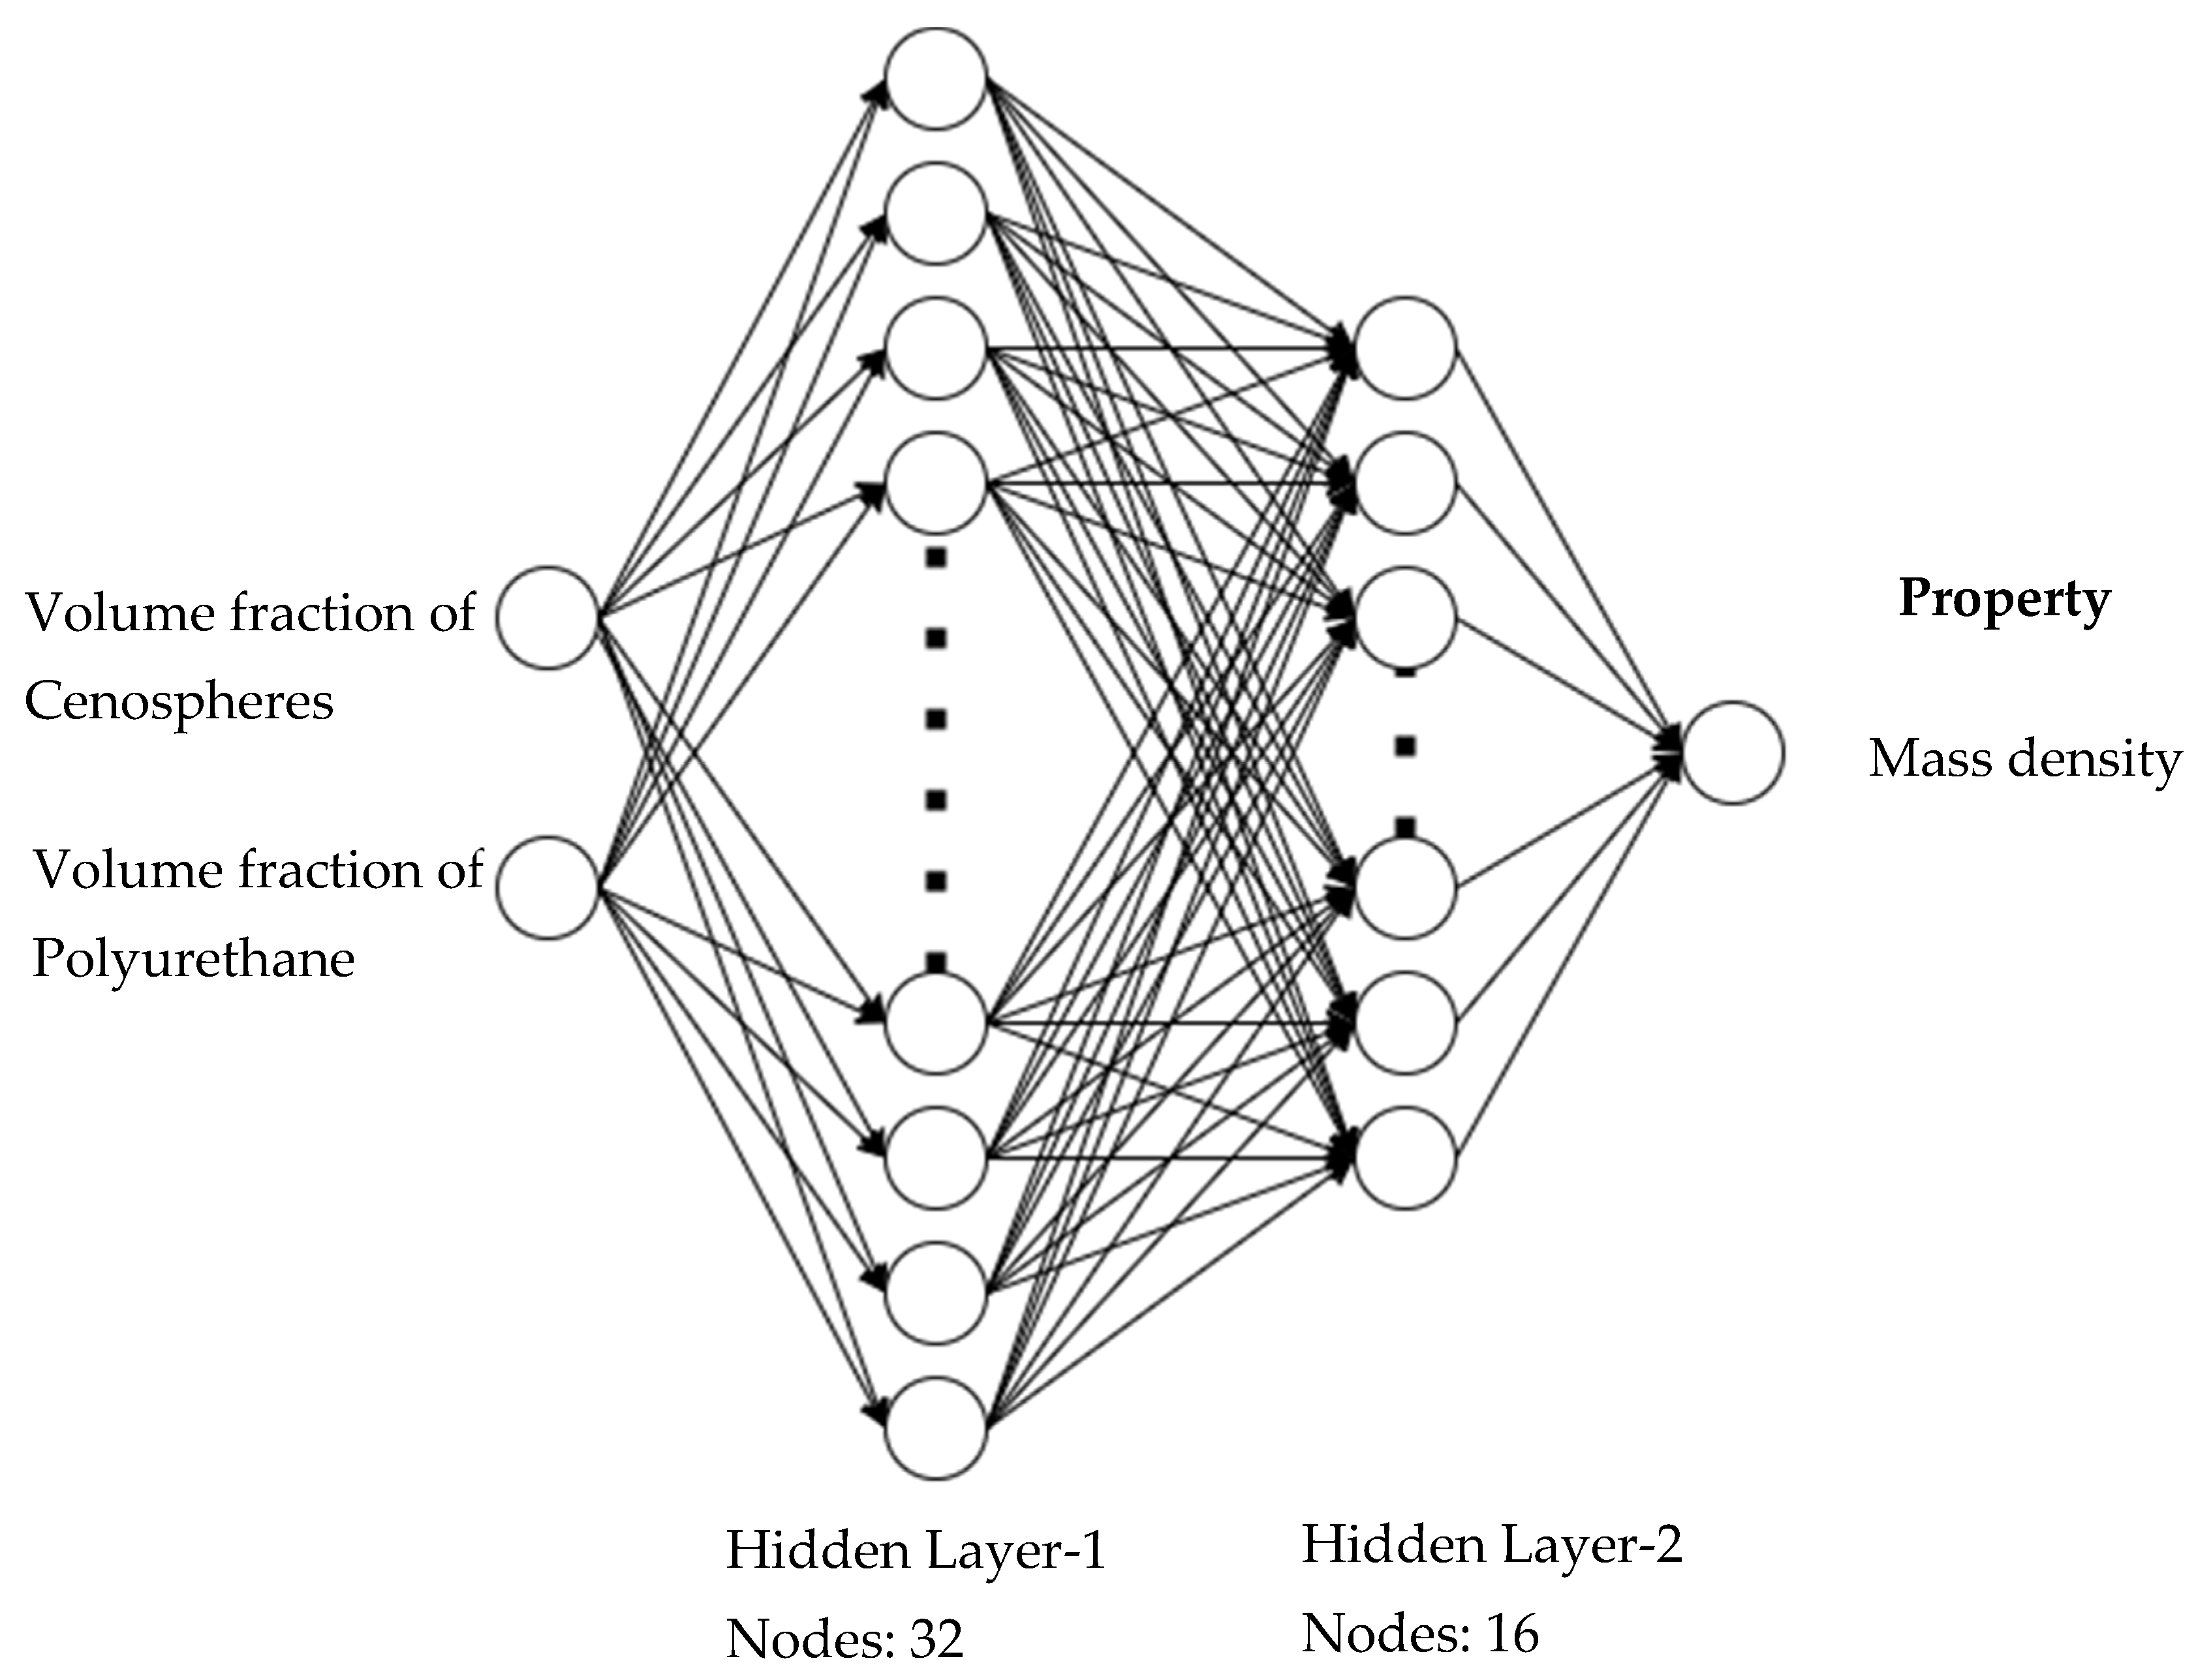
2.4. Artificial Neutral Network and Deep Learning Models

In this study, to train and predict the mechanical and fracture properties of particulate composites, three different neural network models are considered. They are (a) a shallow artificial neural network (ANN) model, a non-linear deep neural network (DNN), and a DNN model. The shallow ANN model has only 1 hidden layer with 32 nodes, as shown in Figure 2. This model is identified to predict the mechanical properties not only at intermediate volume fractions (between 0 and 40%), but also beyond 40% up to 60%. Since shallow ANN model predictions have linear trends, a non-linear deep neural network (DNN) model is implemented with four hidden layers, as shown in Figure 3. Although the predictions of the non-linear DNN model provided non-linear trends between intermediate volume fractions and beyond 40%, its predictions for mass density were not obvious beyond 40%; hence, the DNN model of two hidden layers with only one output of mass density (as shown in Figure 4) is considered. The non-linear DNN model has 128, 64, 32, and 14 nodes in hidden layers 1–4, respectively. The DNN model that predicts only mass density has 32–16 nodes in hidden layers 1–2, respectively. Normal distribution through NumPy from Python 3.13.3 library was used to generate random data for each output parameter that was determined from experiments. To generate random numbers, the mean, standard deviation (as given in Table 1), and size of the random data generated are provided as input; 10,000 random data points are generated for each property before using them for training (80%) and testing (20%). For validation of the predicted values of the machine learning model, actual experimental mean value data points are used. Since the standard deviation of mass density is zero, mean data values of experiments are repeated 10,000 times for training and testing. Table 2, Table 3 and Table 4 provide the set of parameters that are investigated for shallow ANN, non-linear DNN, and DNN models, and the optimum value/tool that is selected to predict the mechanical and fracture parameters is listed in the third column for each case.
The Adam optimizer is employed to train a deep neural network on all output properties. For all these properties, scaling plays a crucial role in ensuring effective training as they have widely different magnitudes. For instance, the fracture toughness typically ranges from 0.2 to 0.4, while the mass density ranges from 900 to 1100. Without upscaling/downscaling (tensile strength by 10 times, fracture toughness by 100 times; mass density and specific tensile strength are divided by 10), the above distinct range of values can cause imbalance in how the model learns. The Adam optimizer, as with most gradient-based methods, performs optimally when the input features are of similar magnitude; otherwise, large differences in magnitude can lead to biased or unstable gradient updates. By normalizing the values of the properties through scaling up or scaling down to put them into a common range, it enables the Adam optimizer to have adaptive learning rates more efficiently, which improves the convergence rate and reduces the chances of issues like vanishing or exploding gradients, especially in deeper networks. Scaling also prevents all features from having different magnitudes during training. Otherwise, such highly prized features like mass density would dominate learning even with other equally important features like fracture toughness that are smaller in magnitude. Scaling allows activation functions like ReLU to function more optimally as well, since they function best when the values are in a moderate range (say 0–100); enormous values have the potential to flatten or switch off neurons, so learning is restricted. Finally, once training is complete, predictions are unscaled to bring them back to their original physical units so that results can be compared and validated with the experimental data.

3. Results

3.1. Experimental Results
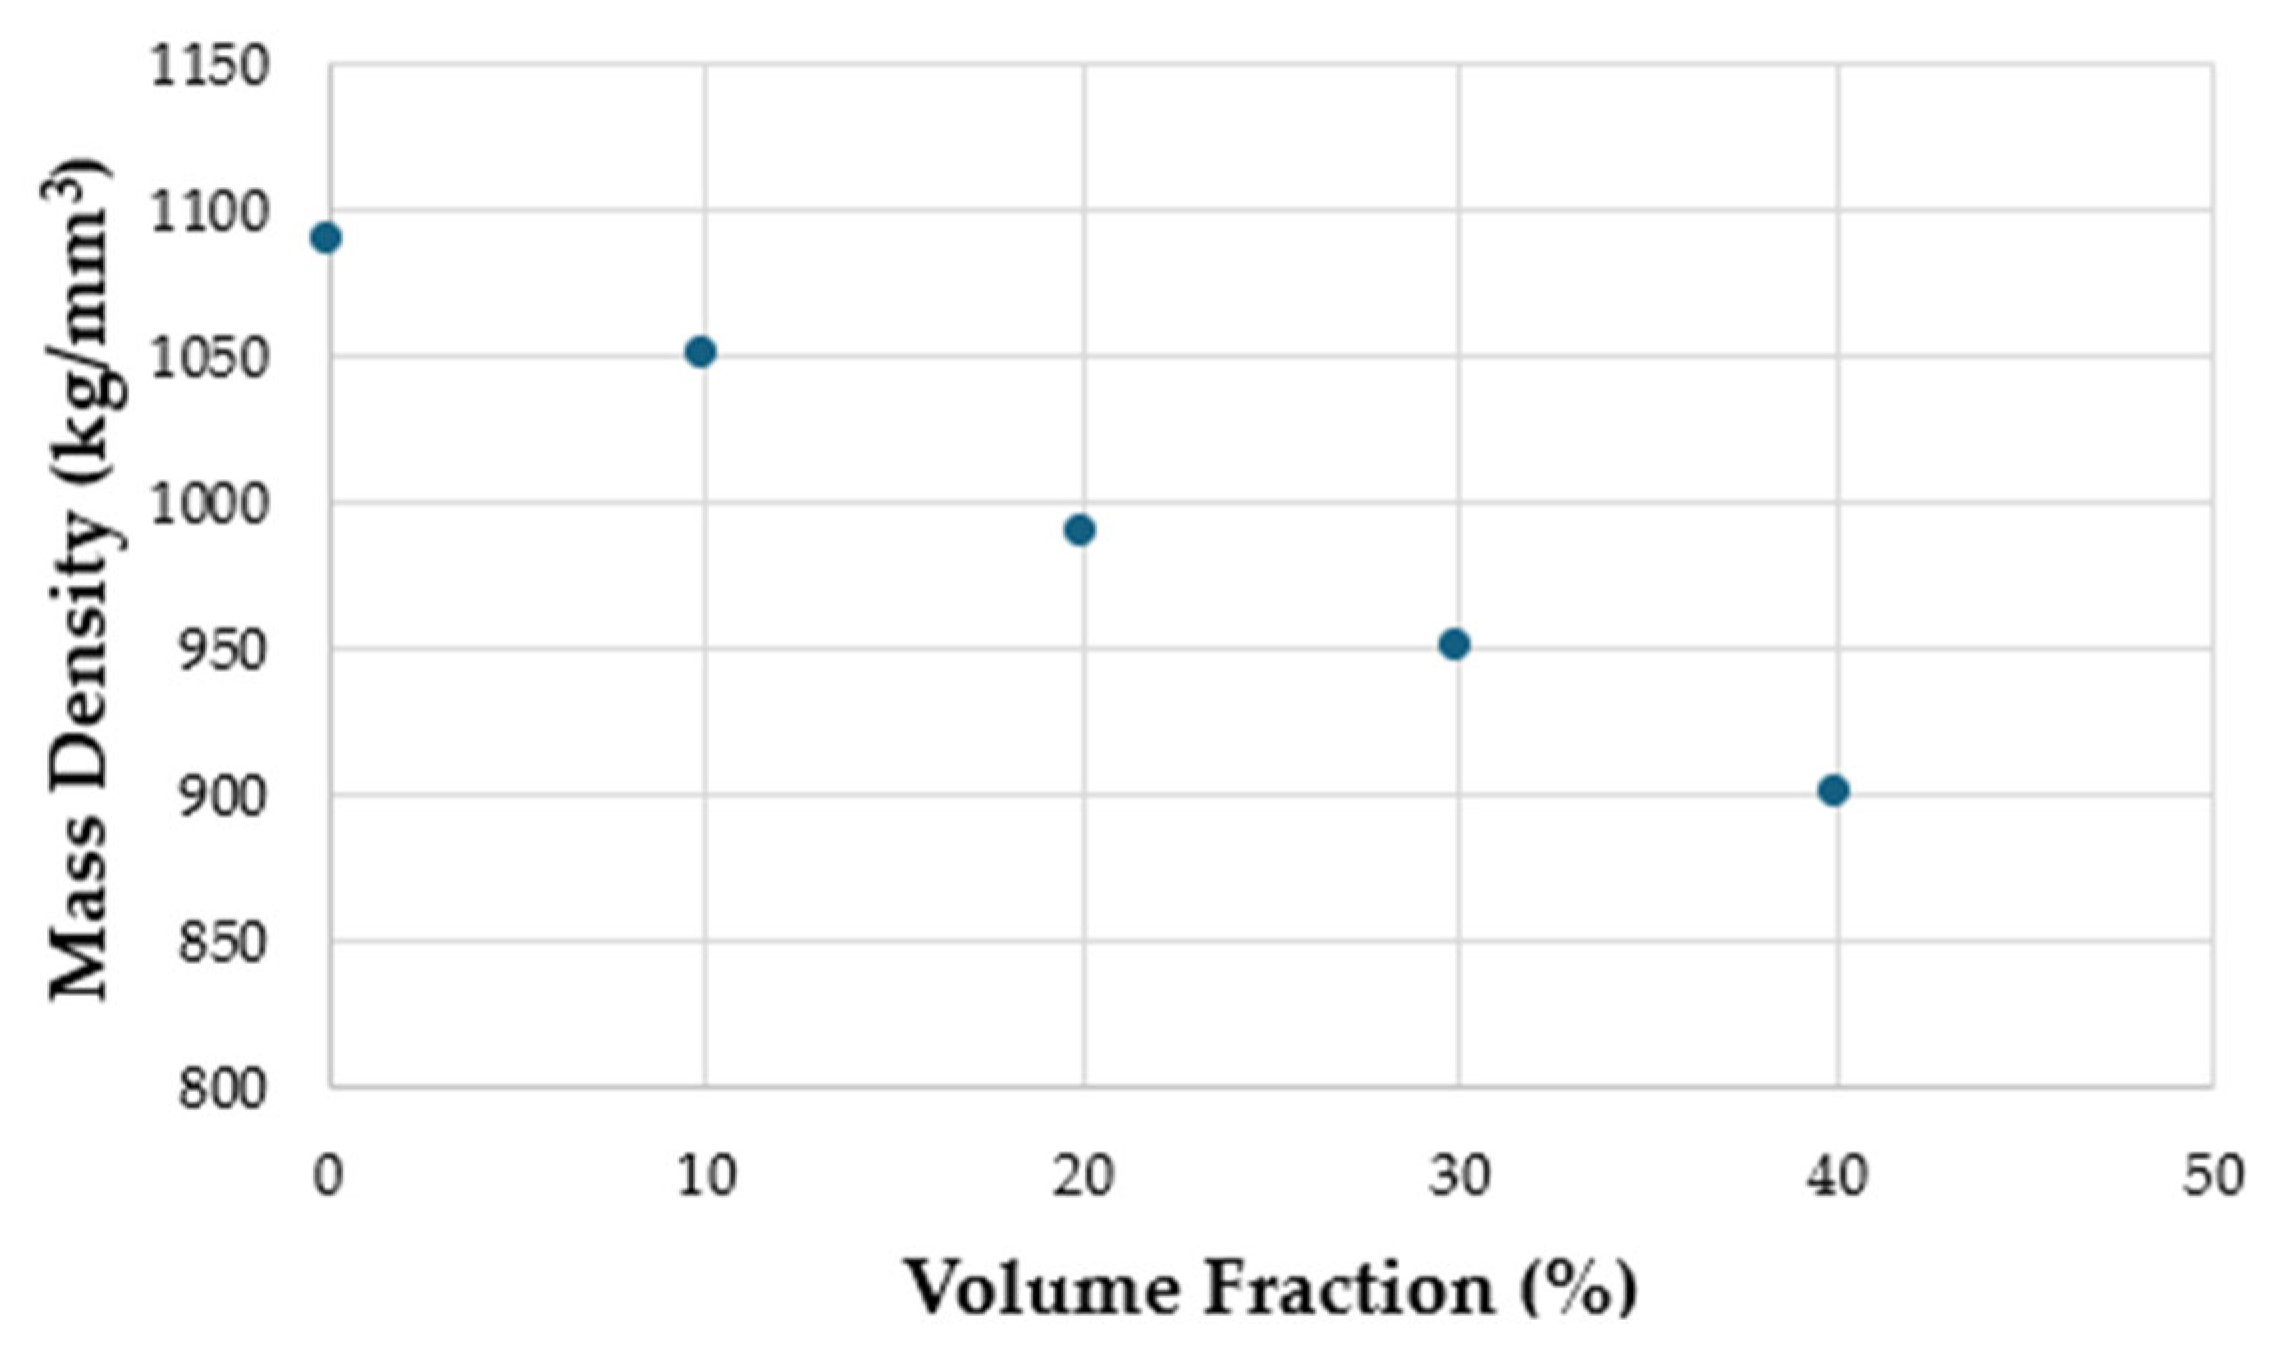
3.1.1. Mass Density

Figure 5 shows the mass density of composites as a function of the volume fraction of the Cenospheres. It is evident that mass density decreases almost linearly with the addition of Cenospheres. The mass density decreases by 20% as the particles’ volume fraction increases to 40%. Moreover, composites of 20% or higher concentrations can float in water, making them useful for marine applications.

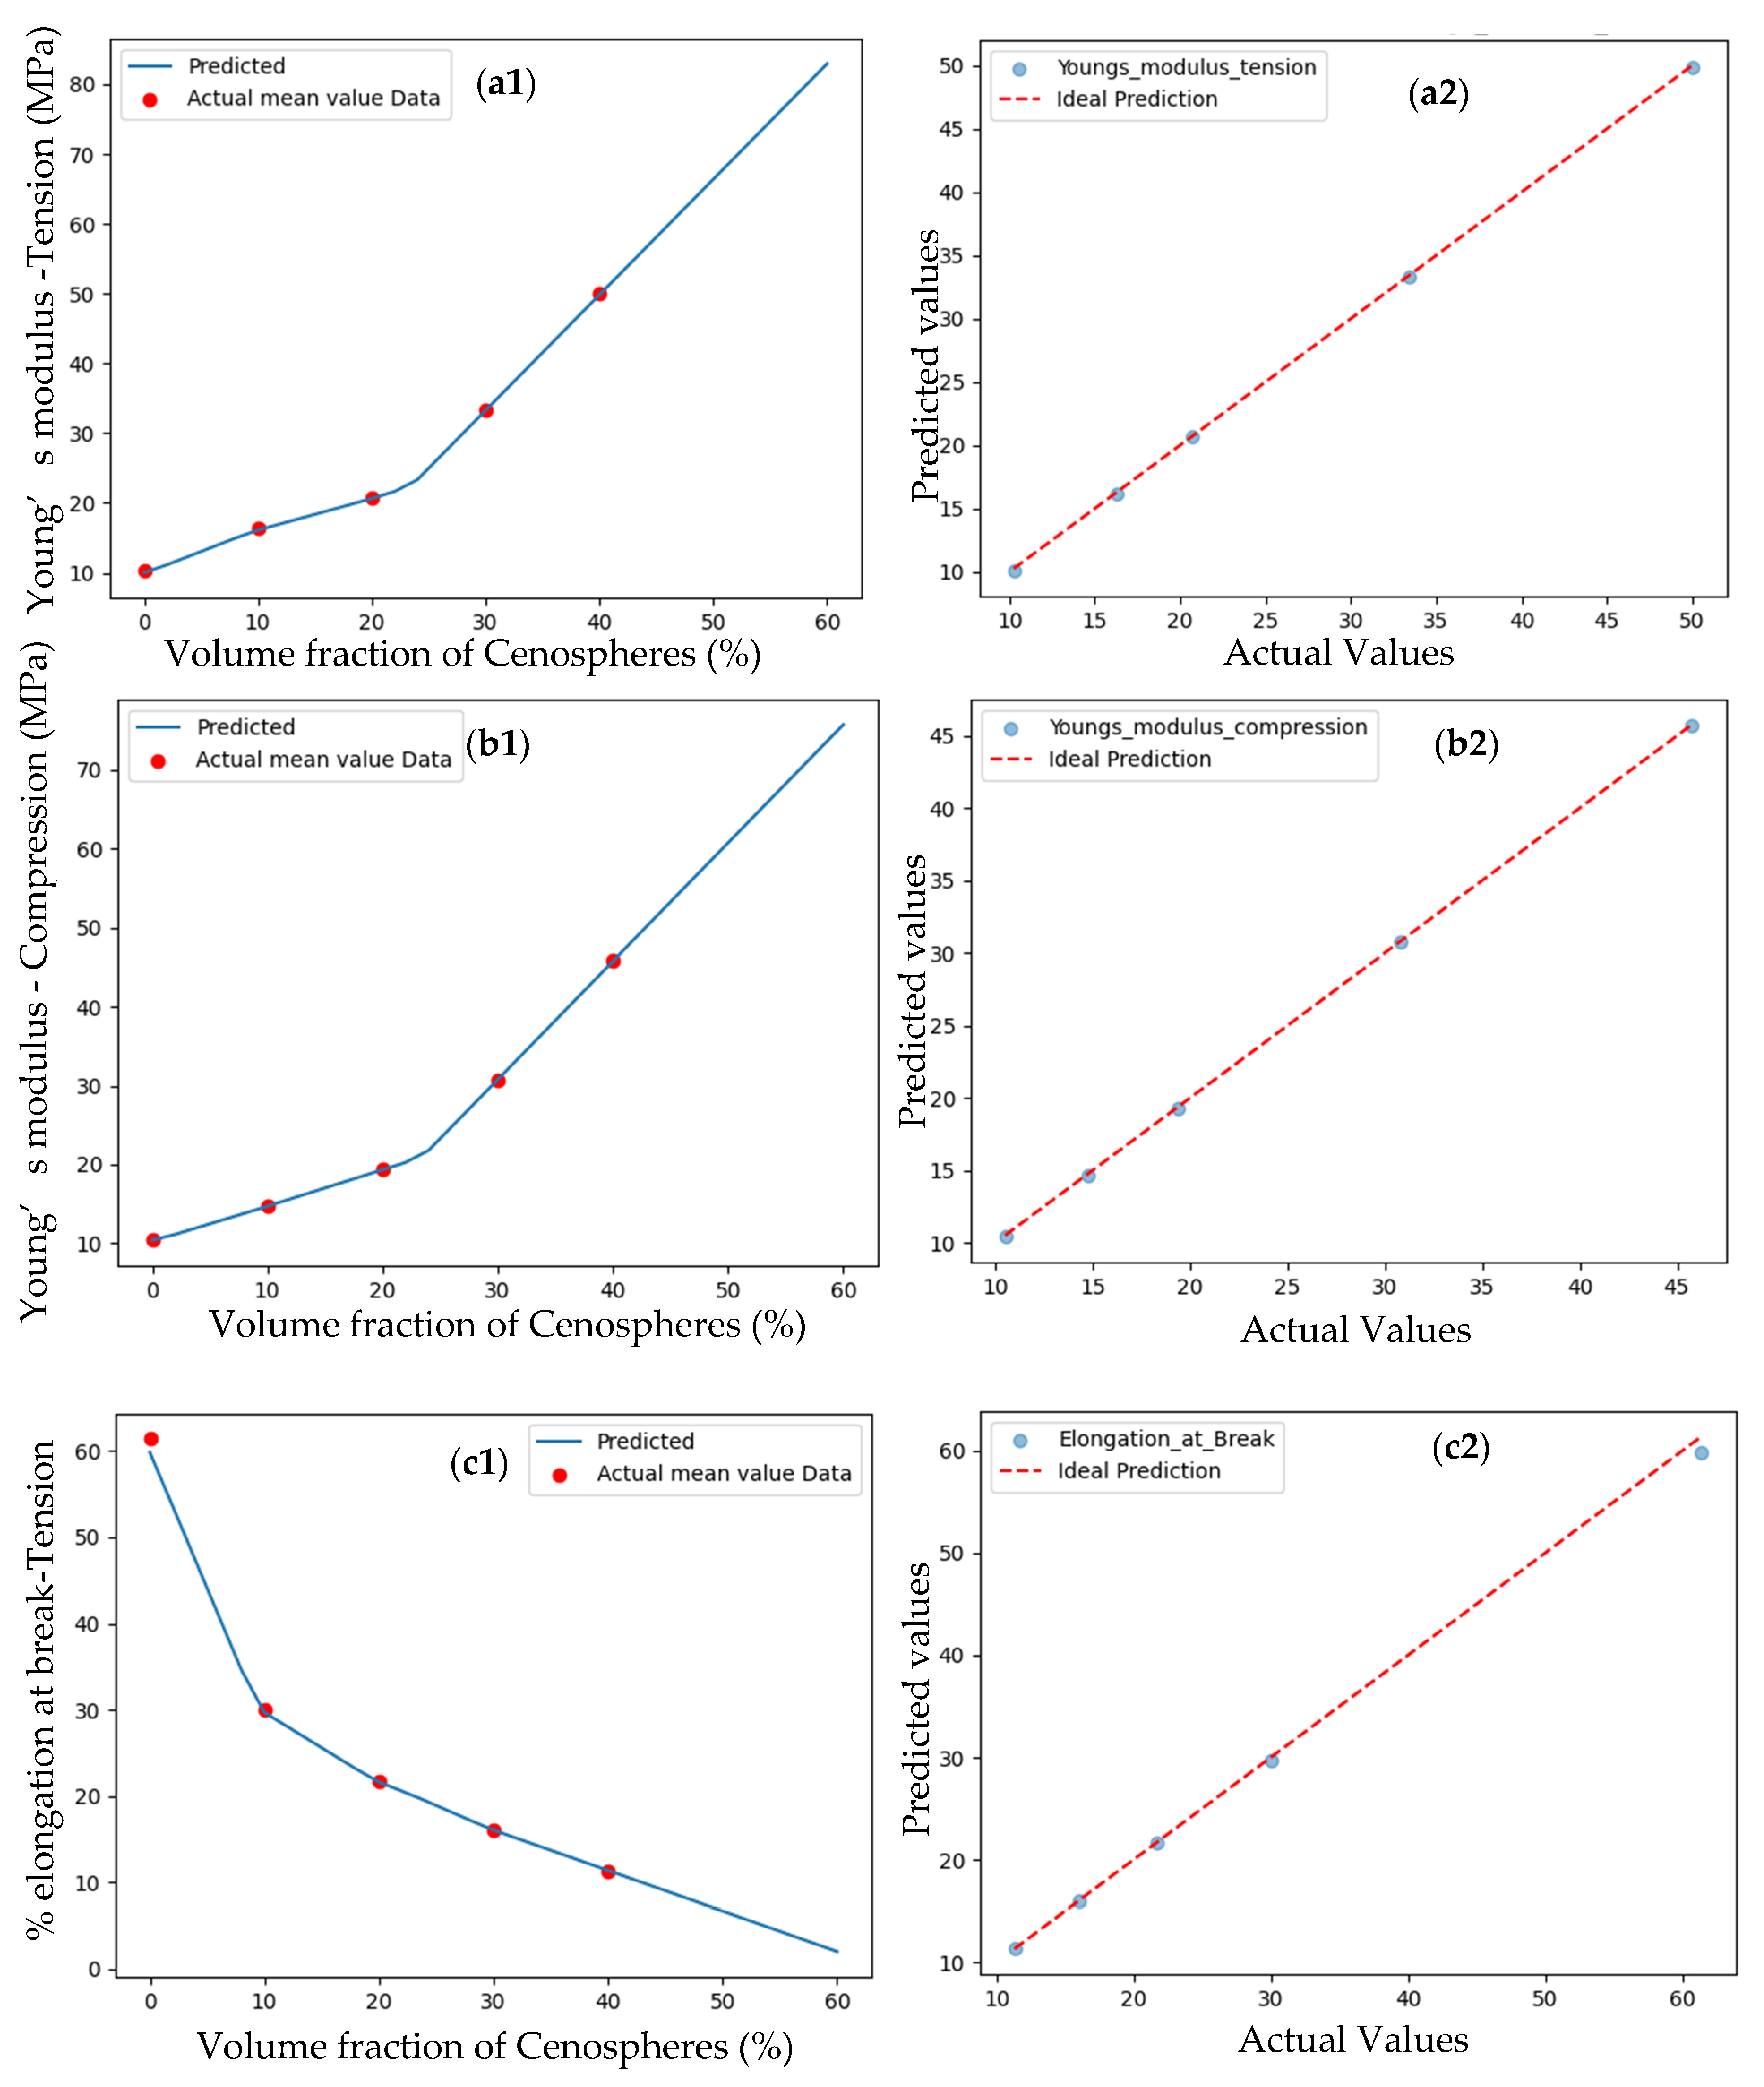
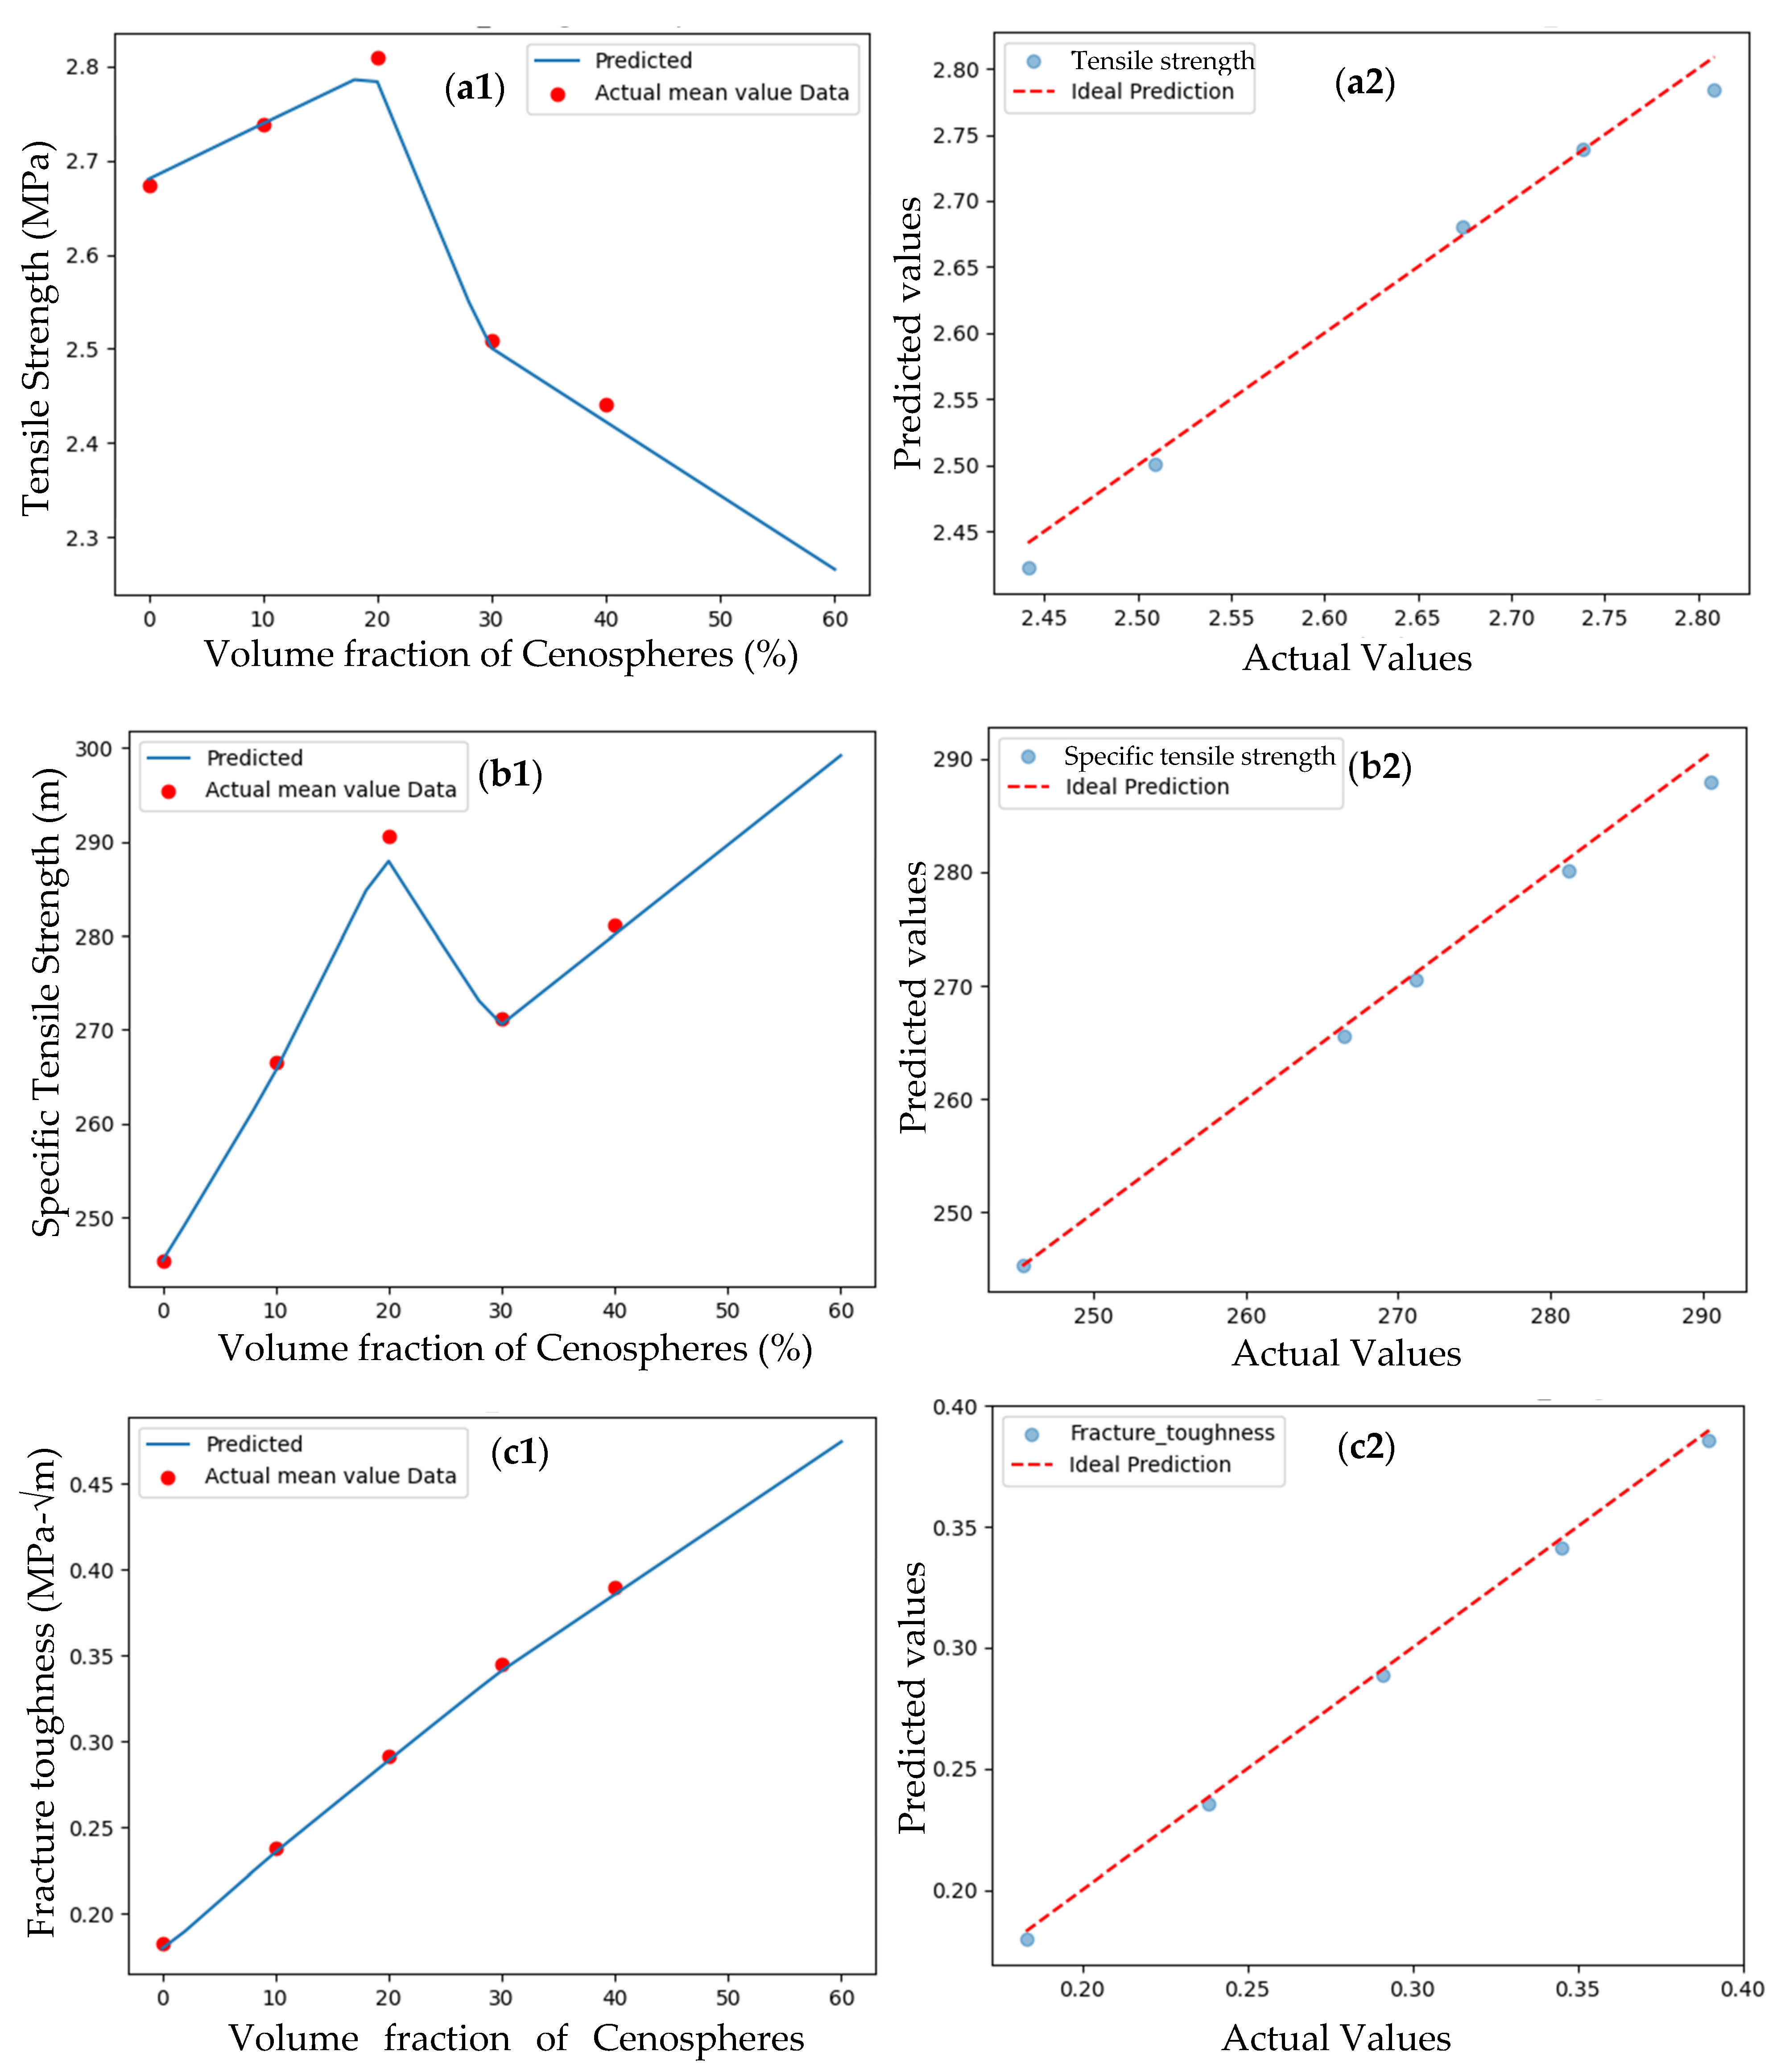
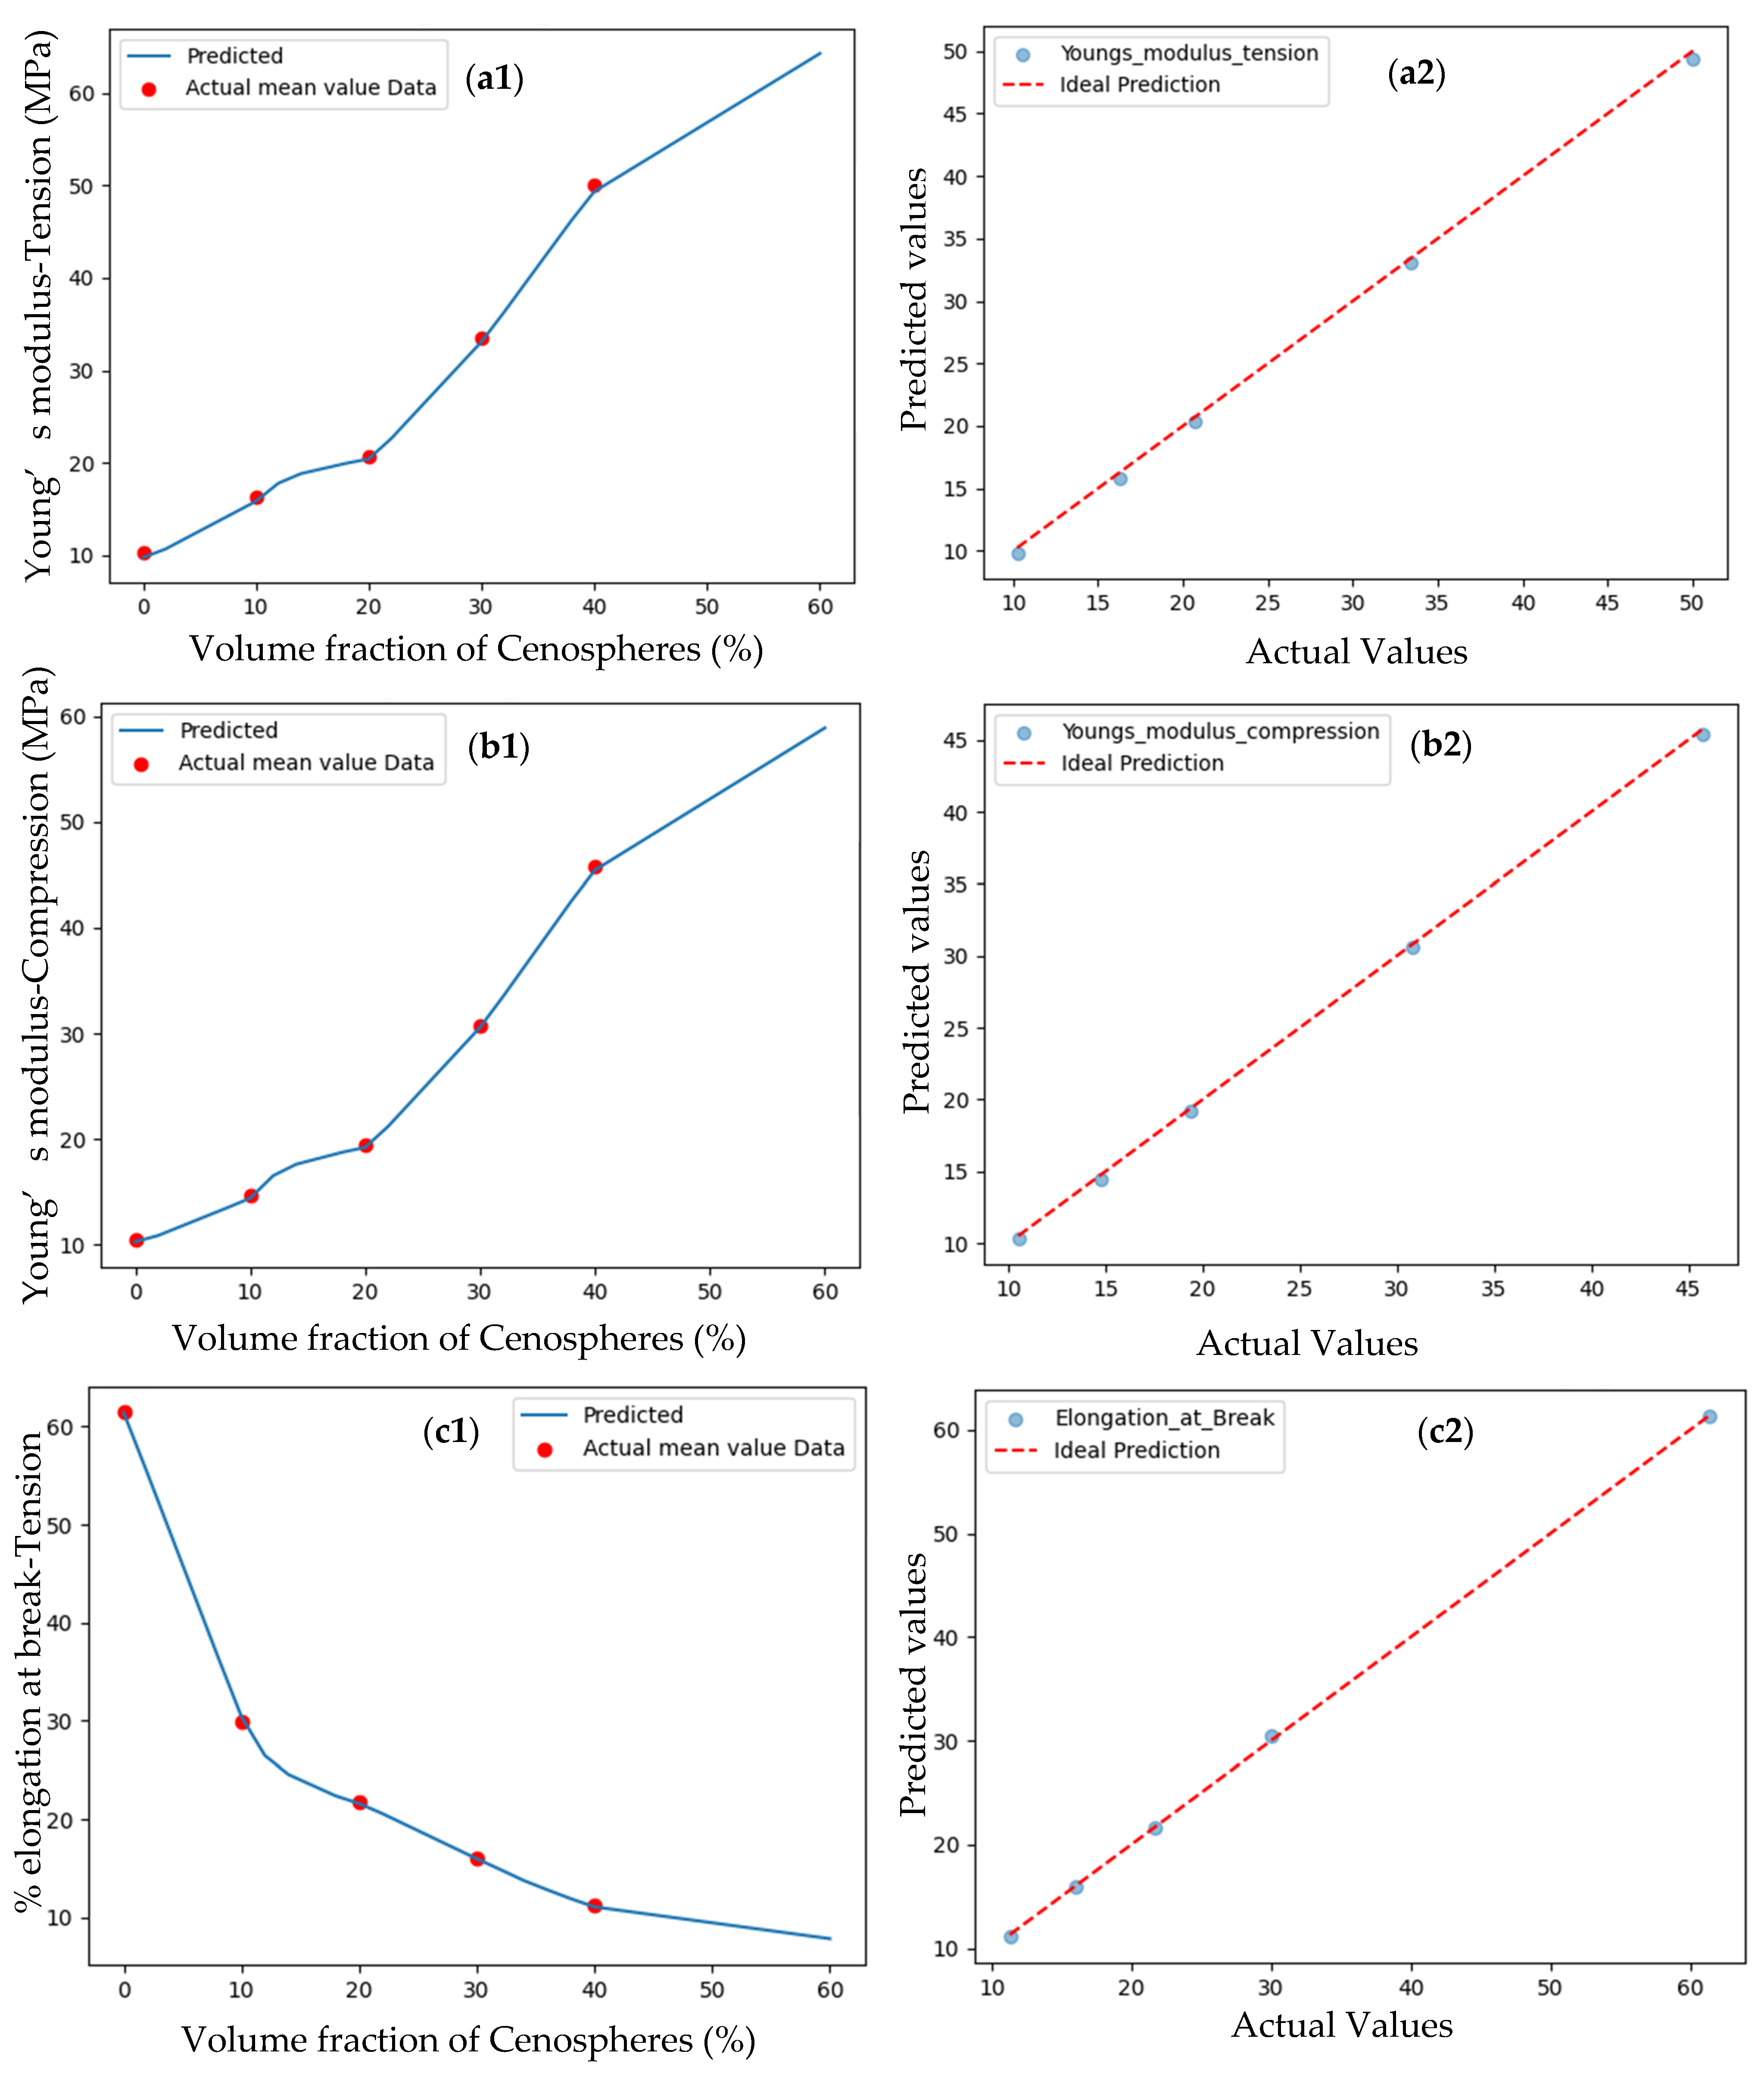
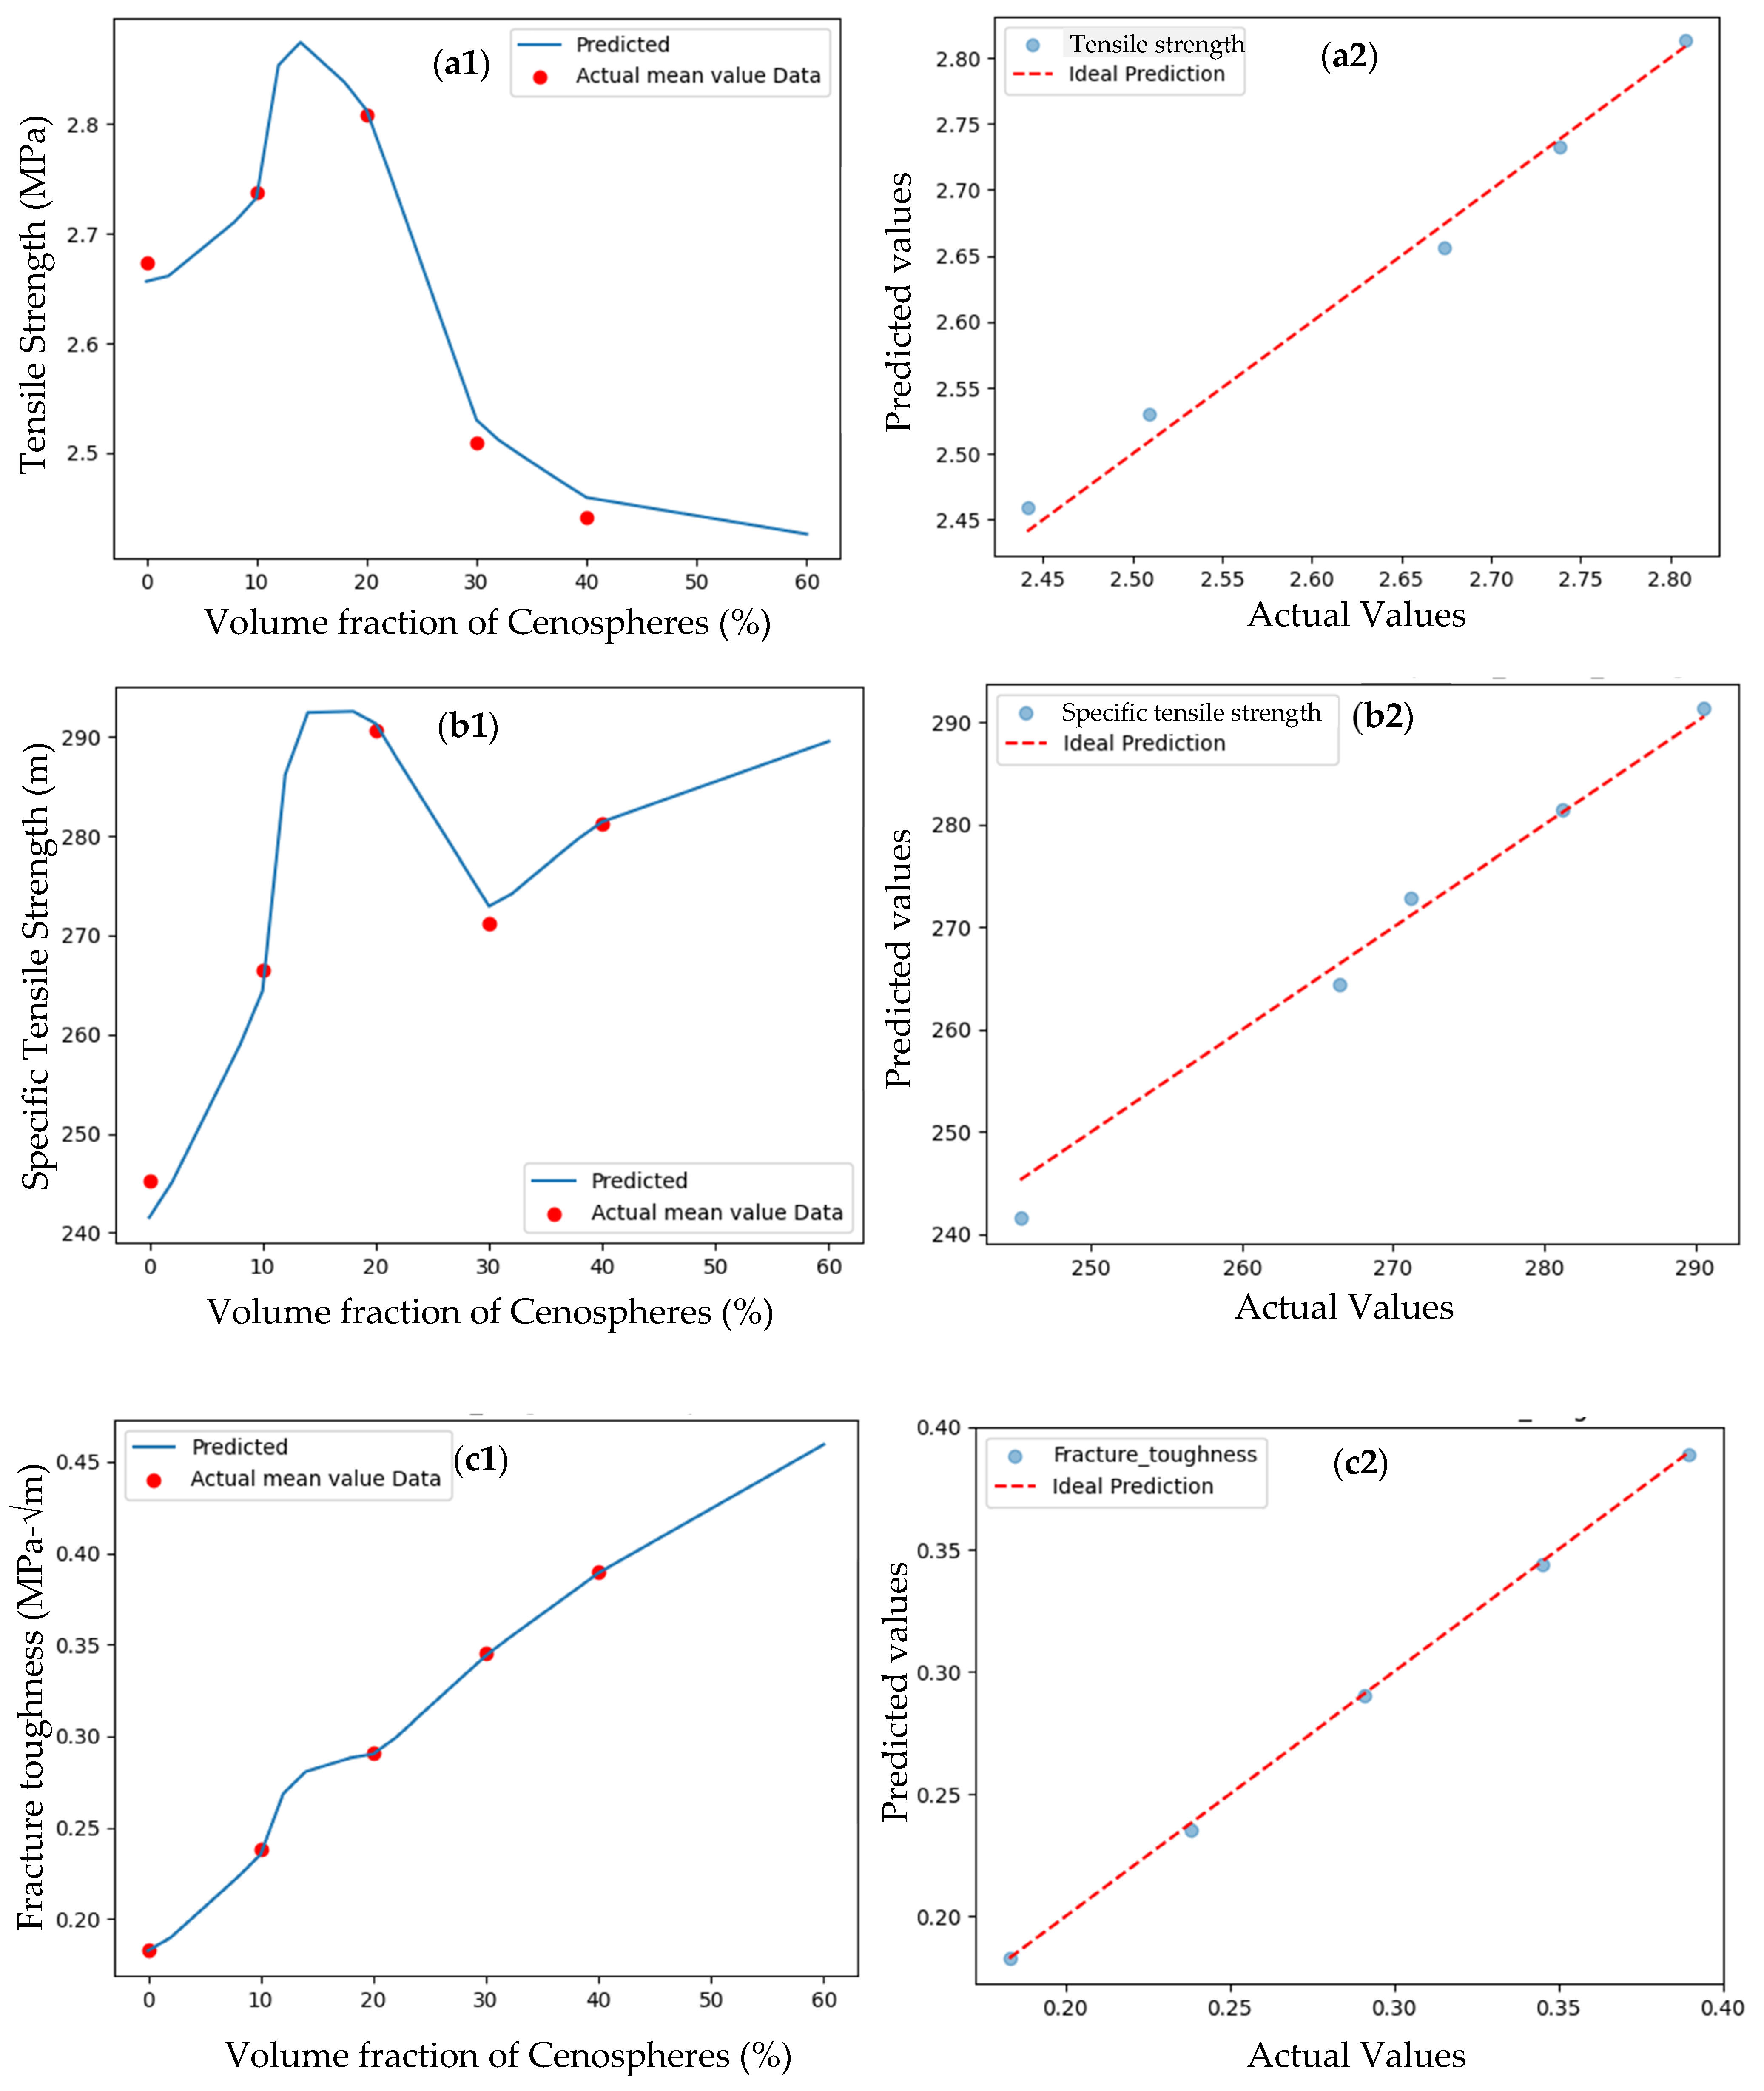
3.1.2. Mechanical and Fracture Properties

Table 4 shows the mechanical (for both tensile and compression loading conditions) and fracture properties of composites. The reinforcement of Cenospheres in the polyurethane matrix increases the Young modulus of the composites under both tension and compression. Under tension, the Young modulus of the composite with a 40% volume fraction of Cenospheres is five times that of the matrix, and an almost similar increase is also achieved under compression. The major reason for the increase in Young’s modulus with the addition of Cenospheres is attributed to the constraint imposed by the rigid particulates on the deformation of the matrix under both tensile and compression loads.
On the other hand, the tensile strength of the composites showed an increase up to a 20% volume fraction of Cenospheres and later showed a decreasing trend. Two opposing mechanisms influence the tensile strength of the composite. First, the inclusion of Cenospheres improves tensile strength through effective load sharing. Second, embedding these rigid particles into a soft matrix introduces localized stress concentrations around them. As the Cenosphere content increases, the locations and strength of these stress concentrations become more pronounced, leading to debonding or dewetting at the particle–matrix interface, as discussed in our previous work [10]. Once dewetting occurs, the ability of the Cenospheres to share load diminishes, and the debonded areas effectively act as voids, thereby reducing the overall tensile strength. This negative effect becomes significant only at higher volume fractions of Cenospheres at volume fractions beyond 20%. Similar trends were reported by Fu et al. [30], who observed a significant decrease in tensile strength when rigid particles were added to a relatively soft polymer matrix. The specific tensile strength, which is determined as the ratio of tensile strength to weight density of composites, demonstrates an increasing trend as the density of the composites decreases and the Cenosphere volume fraction increases despite the decreasing trend of tensile strength beyond 20%.
The composite with a 40% volume fraction of Cenospheres exhibits more than a 100% increase in fracture toughness compared to that of polyurethane with no particulates. This improvement can be due to three mechanisms: (1) the particulate reinforcement improves the matrix’s load-bearing capacity, thereby raising the fracture initiation load and then the fracture toughness; (2) elevated stresses near the crack tip induce dewetting, which helps to blunt the crack; and (3) the Cenospheres that remain bonded to the matrix promote crack bridging and crack deflection mechanisms, which also enhances the fracture toughness by increasing the fracture initiation load.

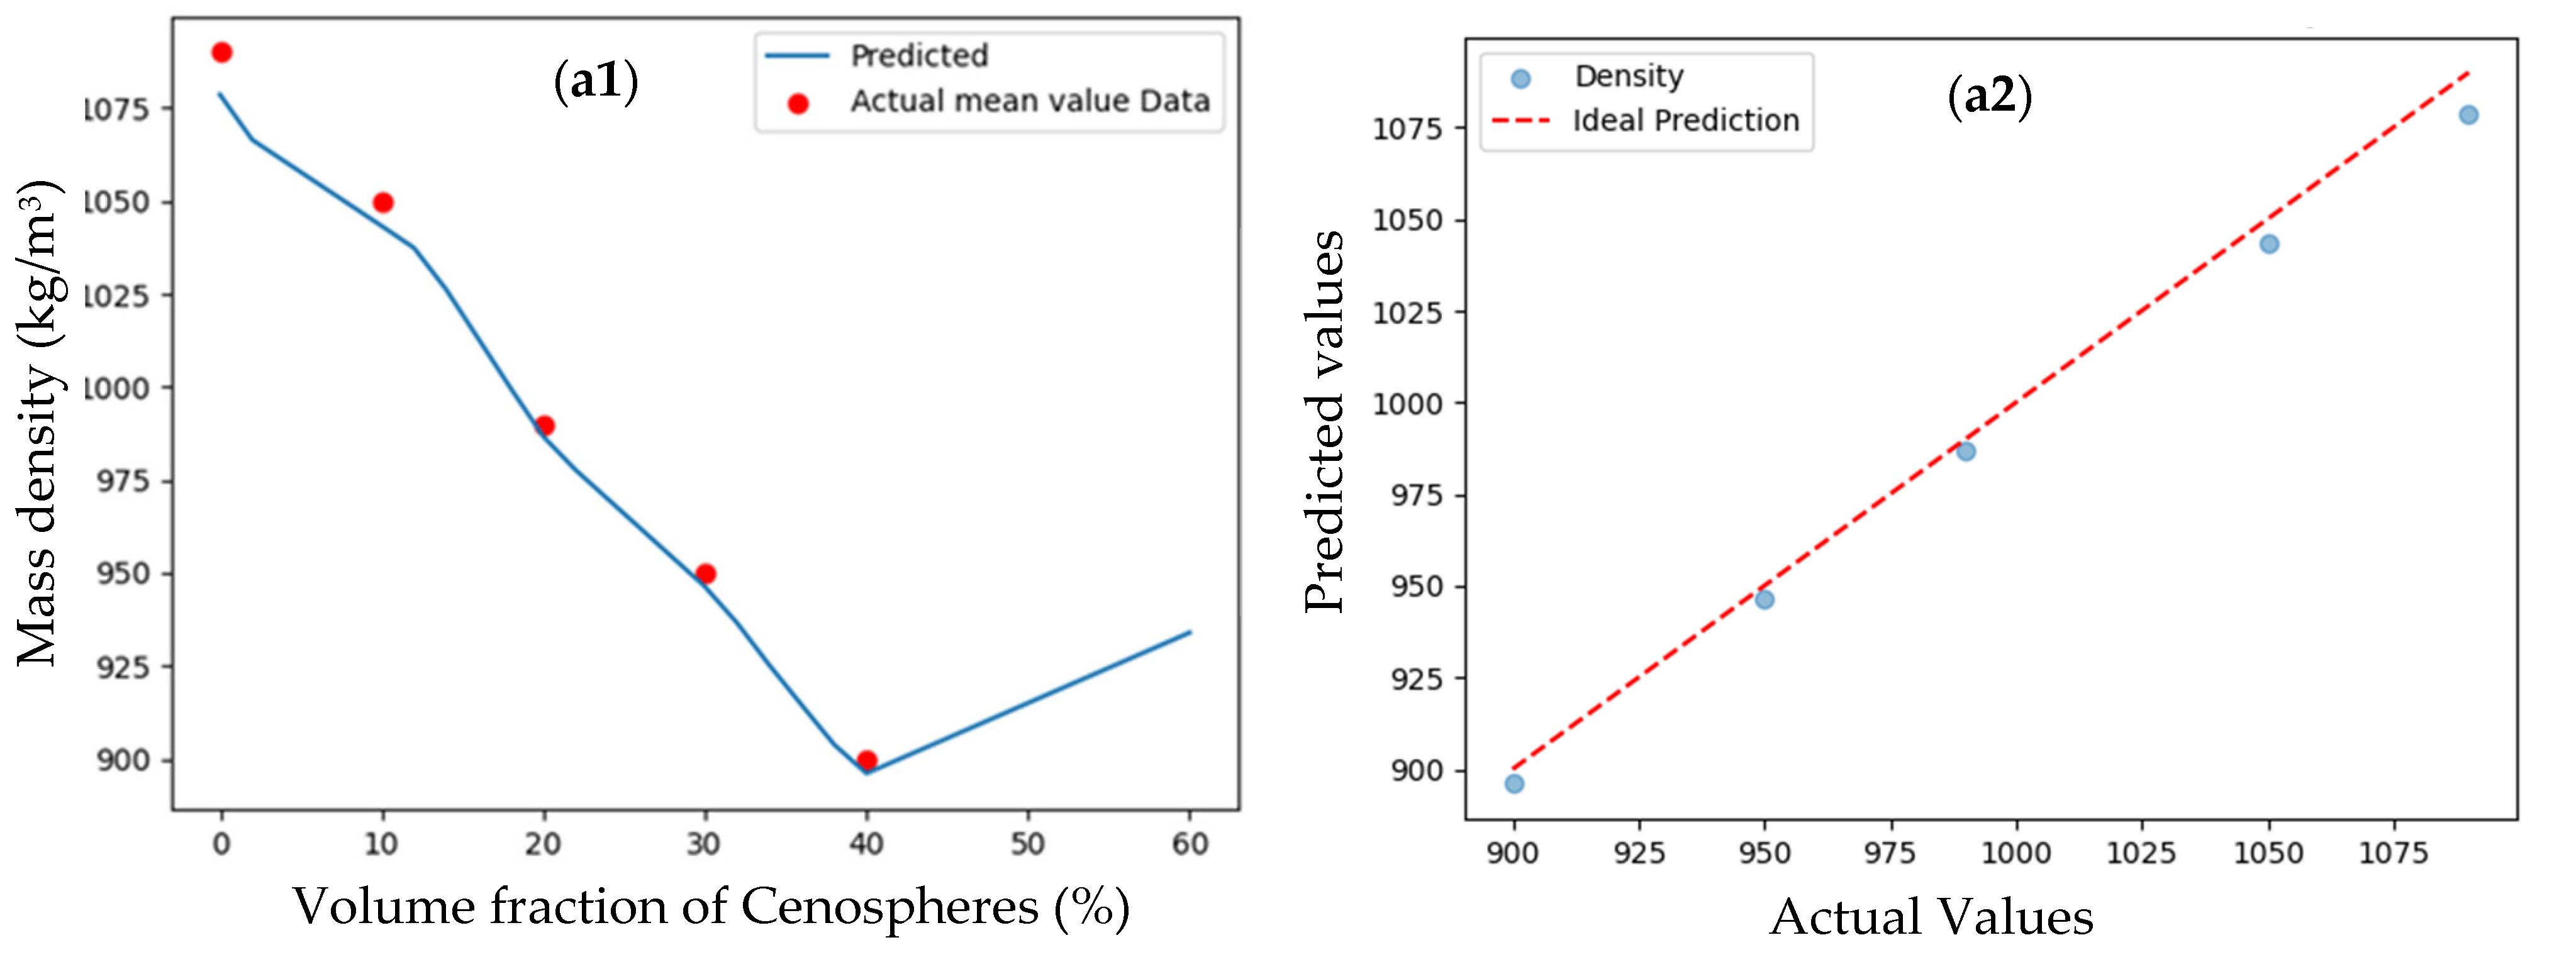
3.1.3. Results of Shallow ANN Model

The predictions of the shallow ANN model for all seven output properties of the polyurethane–Cenosphere composites are shown in Figure 6, Figure 7 and Figure 8. The overall statistical metrics of the predictions for this shallow ANN model are shown in Table 5. Overall, the shallow ANN model’s predictions are off by 1.274 units from the true values of measured properties. The overall RMSE is very low as the some of the output properties are upscaled for efficient adaptive learning of the models. Mass density predictions as a function of the volume fraction of Cenospheres are shown in Figure 6(a1). The shallow ANN model demonstrates linear predictions for intermediate points between the volume fractions of 0–40% and beyond 40%. The predictions have a Coefficient of Determination (R2) value of 0.999, as shown in the regression plot for mass density in Figure 6(a2). The mass density predictions beyond 40% demonstrate a decreasing trend, as expected, because the addition of lighter Cenospheres decreases the mass density of the composite by 11% to 801 kg/m3. This value is less than that predicted using the rule of mixtures, which is 838 kg/m3. Experimentally, it will be difficult to reinforce the polyurethane with Cenospheres up to 60% unless a solvent is used to decrease the viscosity of the mix to achieve a uniform composite.
The predictions of Young’s modulus under tension and compression using the shallow ANN model are shown in Figure 7(a1,b1), and the corresponding regression analysis graphs are shown in Figure 7(a2) and Figure 7(b2), respectively. Both of these measurements have an R2 value of 0.999. It is important to note that Young’s modulus values under both tension and compression demonstrated an increasing trend beyond 40% volume fraction, as expected; however, the relationship is linear due to the limitation of using one hidden layer for the shallow ANN model. The predicted Young’s modulus value for tension at the 60% volume fraction is 83 MPa, which is about 65% higher than that of the 40% volume fraction. The estimated value of Young’s modulus for tension at the 60% volume fraction based on the empirical prediction of Guth [31] is 76 MPa. Hence, the predicted value of the shallow ANN model is about 9% higher than the empirical estimation of Guth. In case of compression, the predicted value of Young’s modulus is 76 MPa, which is 65% higher than that of the 40% volume fraction. The empirical estimation by the Guth for the compression Young’s modulus is 79 MPa, which is very close to the prediction of the shallow ANN model. The predictions for % elongation at break under tension are shown in Figure 7(c1), and the regression analysis of this property is shown in Figure 7(c2) with an R2 value of 0.998. The % elongation showcased a decreasing trend beyond 40% volume fractions, as anticipated, as the with the presence of more particles, dewetting or debonding increases, leading to early failure of the specimen under tensile load. The predicted value of % elongation at break at the 60% volume fraction is 2%, which is about 82% lower than that of the 40% volume fraction. This means that the specimen breaks very quickly with no significant deformation for the 60% volume fraction of Cenospheres, which will not be useful for engineering load-bearing applications.
Figure 8 shows the predictions of tensile strength, specific tensile strength, and fracture toughness and corresponding regression analysis with R2 values of 0.988, 0.992, and 0.997, respectively. Like % elongation at break, the predictions of tensile strength beyond 40% showcased a decreasing trend. The tensile strength for the 60% volume fraction of Cenospheres is 2.27 MPa, which is 6% less than that of the 40% volume fraction. The reasons for such a decrease are again similar to % elongation at break, where the local stress concentrations associated with debonded Cenospheres cannot take much more load and fail with lower tensile strength. However, the specific tensile strength demonstrated an increasing trend beyond 40%, as determined by dividing the tensile strength by the weight density of the composite, which showed a significant decrease by about 11% with the addition of Cenospheres, as shown in Figure 6(a1). The specific tensile strength of a composite with a 60% volume fraction of Cenospheres is 299 m, which is 7% higher than that of the 40% volume fraction. The fracture toughness of composites beyond 40% also had an increase of about 23%, shown for the composite with a 60% volume fraction of Cenospheres, as expected, because the debonding of the particles at this volume fraction generates significant crack-tip blunting, and a blunt crack has a higher fracture toughness value.

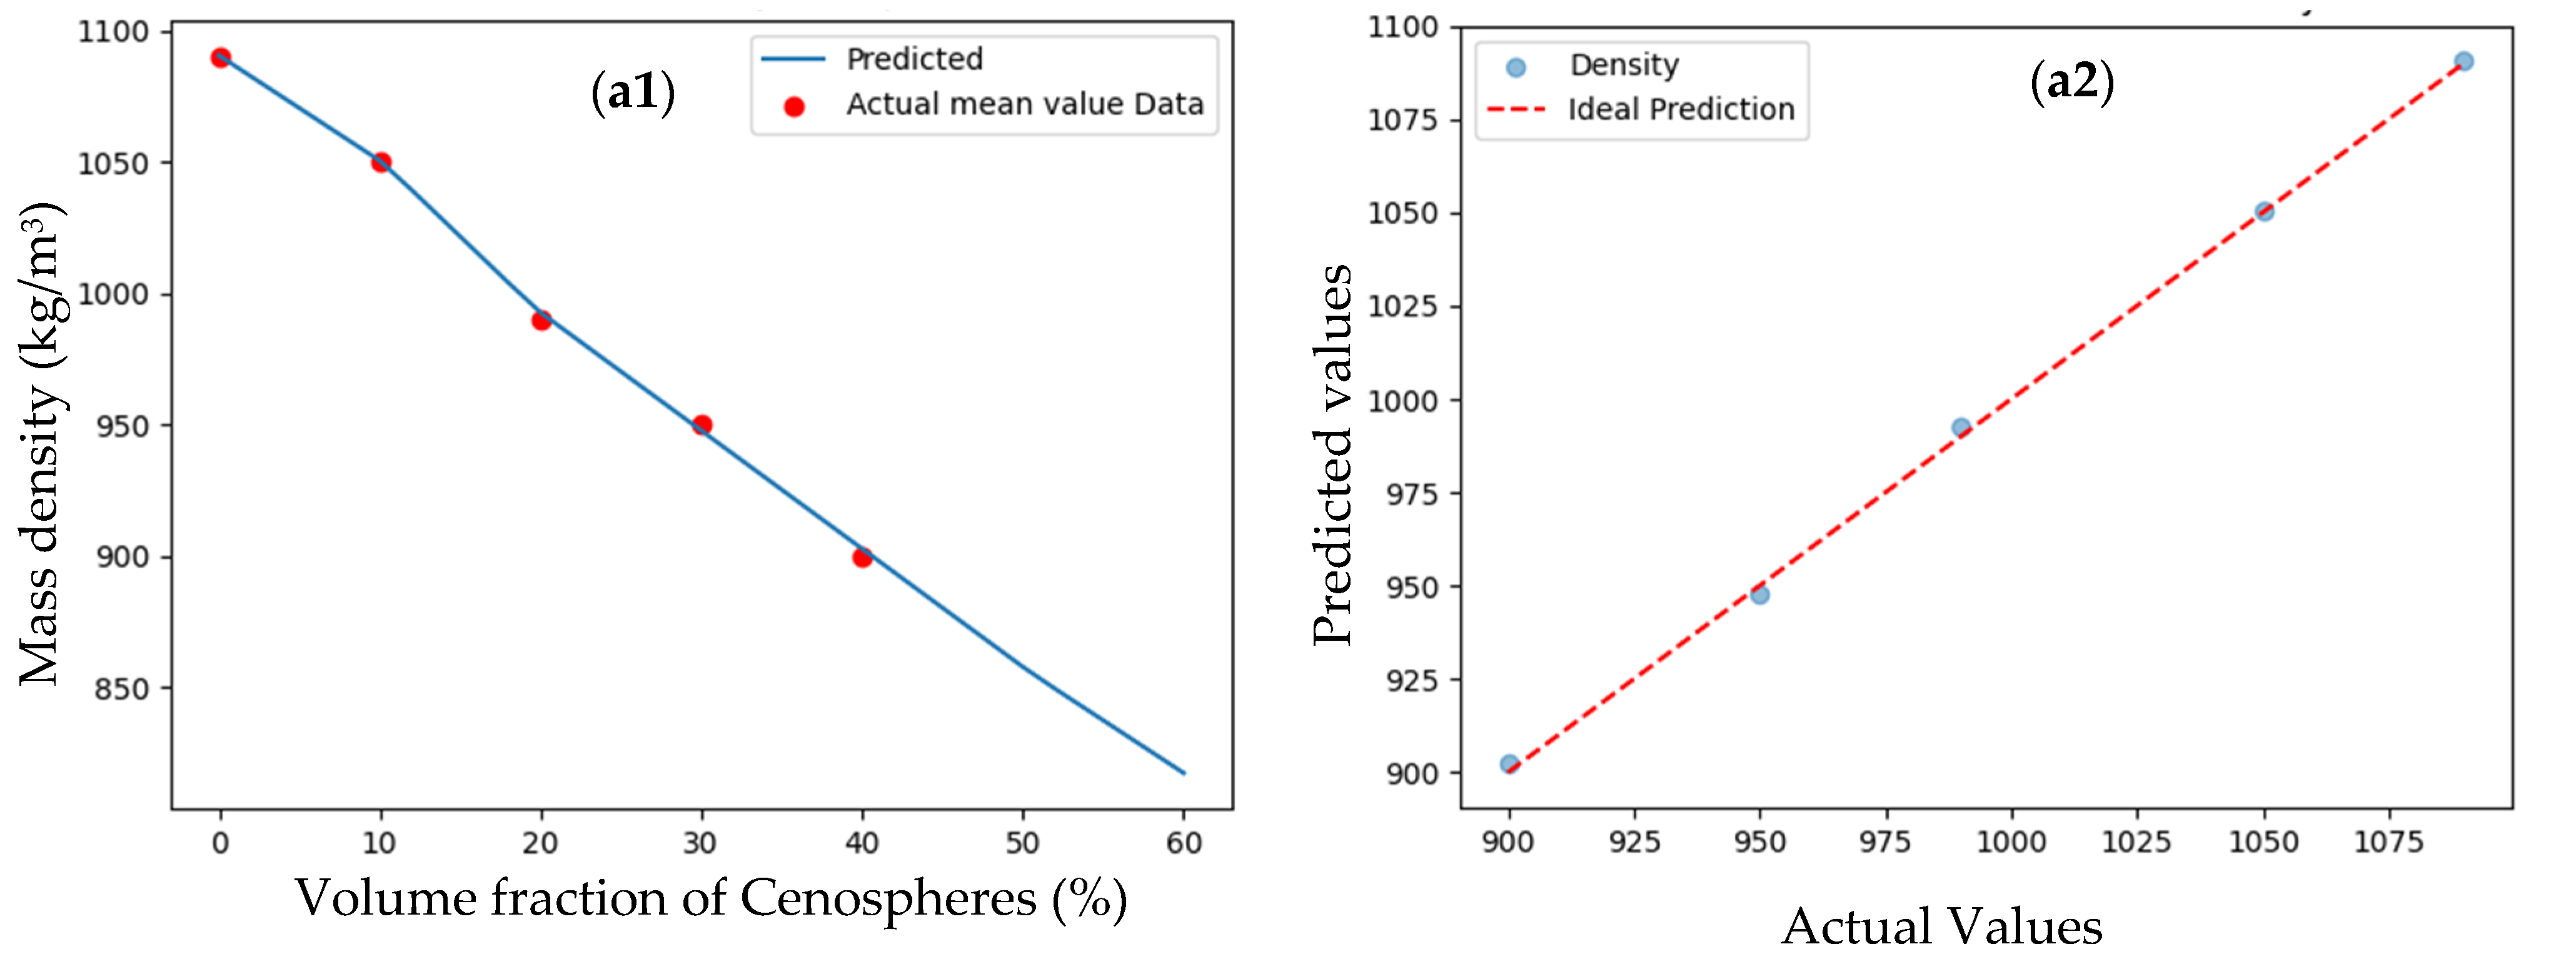
3.1.4. Results of Non-Linear DNN Model

Given the linear predictions of the shallow ANN model discussed in Section 3.1.4, an attempt is made to predict all seven properties of polyurethane composites as a function of Cenosphere volume fraction using a non-linear DNN model, shown in Figure 3. The statistical metrics of the non-linear DNN model are provided in Table 5. The metrics are not as different from the shallow ANN model, and the lower values represent good predictions. Figure 9(a1) shows the predictions of mass density and comparisons with the experimental average values of mass density shown in Figure 2. The regression analysis of the mass density is shown in Figure 9(a2) with an R2 value of 0.99. It can be noticed that the predictions demonstrated a non-linear trend between the intermediate points of the volume fractions; however, the mass density showed an increasing trend beyond 40%, which was not expected. The increase in reinforcement of Cenospheres with a volume fraction increase should make the composite lighter, as predicted by the shallow ANN model in Section 3.1.4 and the rule of mixtures.
The predictions of the non-linear DNN model for Young’s modulus for tension, compression and % elongation at break are shown in Figure 10(a1), Figure 10(b1) and Figure 10(c1), respectively. The regression analysis plots of the above three properties are shown in Figure 10(a2–c2) with the corresponding R2 values of 0.998, 0.999, and 0.999. The non-linear DNN was supposed to provide non-linear trends of these property variations as a function of volume fraction. This non-linearity is more pronounced between the volume fractions of 10 and 20%; otherwise, the relationships between other volume fractions are fairly linear, and the same is noticed beyond the 40% volume fraction. The main difference between the shallow ANN model and non-linear DNN model is that predictions beyond 40% for Young’s modulus in tension and compression have less slopes compared to the previous case. Based on the non-linear DNN model, the predicted Young’s modulus tension value at the 60% volume fraction is 64 MPa, which is about 30% higher than that of the 40% volume fraction. This value is lower than the empirical prediction of Guth (76 MPa) and the prediction of the shallow ANN model (83 MPa). In compression, the non-linear DNN model’s prediction of Young’s modulus is 59 MPa at a 60% volume fraction of Cenospheres, which is much smaller than both Guth’s prediction of 79 MPa and also the shallow ANN prediction of 76 MPa. Like the above two properties, the slope of the decrease in the % elongation at break beyond the 40% volume fraction for the non-linear DNN model is also diminished compared to that of the shallow ANN model. The non-linear DNN model’s prediction of % elongation of the composite at a 60% volume fraction of Cenospheres is 8%, which is four times higher than that of the shallow ANN model.
Figure 11(a1–c1) show the predictions of non-linear DNN models for the tensile strength, specific tensile strength, and fracture toughness of polyurethane composites as a function of the volume fraction of Cenospheres. The corresponding regression analysis of the above properties are shown in Figure 11(a2–c2) with the associated R2 values of 0.988, 0.980, and 0.999. Unlike the shallow ANN model, the prediction of maximum of tensile strength happened at volume fraction less than 20%, where the same happened experimentally at 20%. Similar to Young’s modulus and % elongation at break, the slope of the decrease in tensile strength, the slope of the increase in specific tensile strength, and the slope of the increase in fracture toughness beyond 40% volume fraction for the non-linear DNN model are less than those of the shallow ANN model. The non-linear DNN model’s predicted value of tensile strength at 60% volume fraction is 2.42 MPa, which is 7% higher than that of the shallow ANN model. The predicted specific tensile strength of the non-linear DNN model at 60% volume fraction is also smaller than that of the shallow ANN model. The predicted fracture toughness of the non-linear DNN at a 60% volume fraction of Cenospheres is increased by only 18% from the 40% volume fraction, which is less compared to the shallow ANN model.
Overall, the non-linear DNN model predictions of all output properties are lower with less slope between 40 and 60% volume fractions compared to the shallow ANN model. The reasons for such a trend of the non-linear DNN model are its deeper architecture, greater capacity to smooth over noise, and emphasis on global trend learning. Moreover, regularization is applied across multiple layers, encouraging sparsity and reducing aggressive slope changes. However, in the case of the shallow ANN, it has less abstraction ability and follows the local variance more closely, leading to sharper slopes.

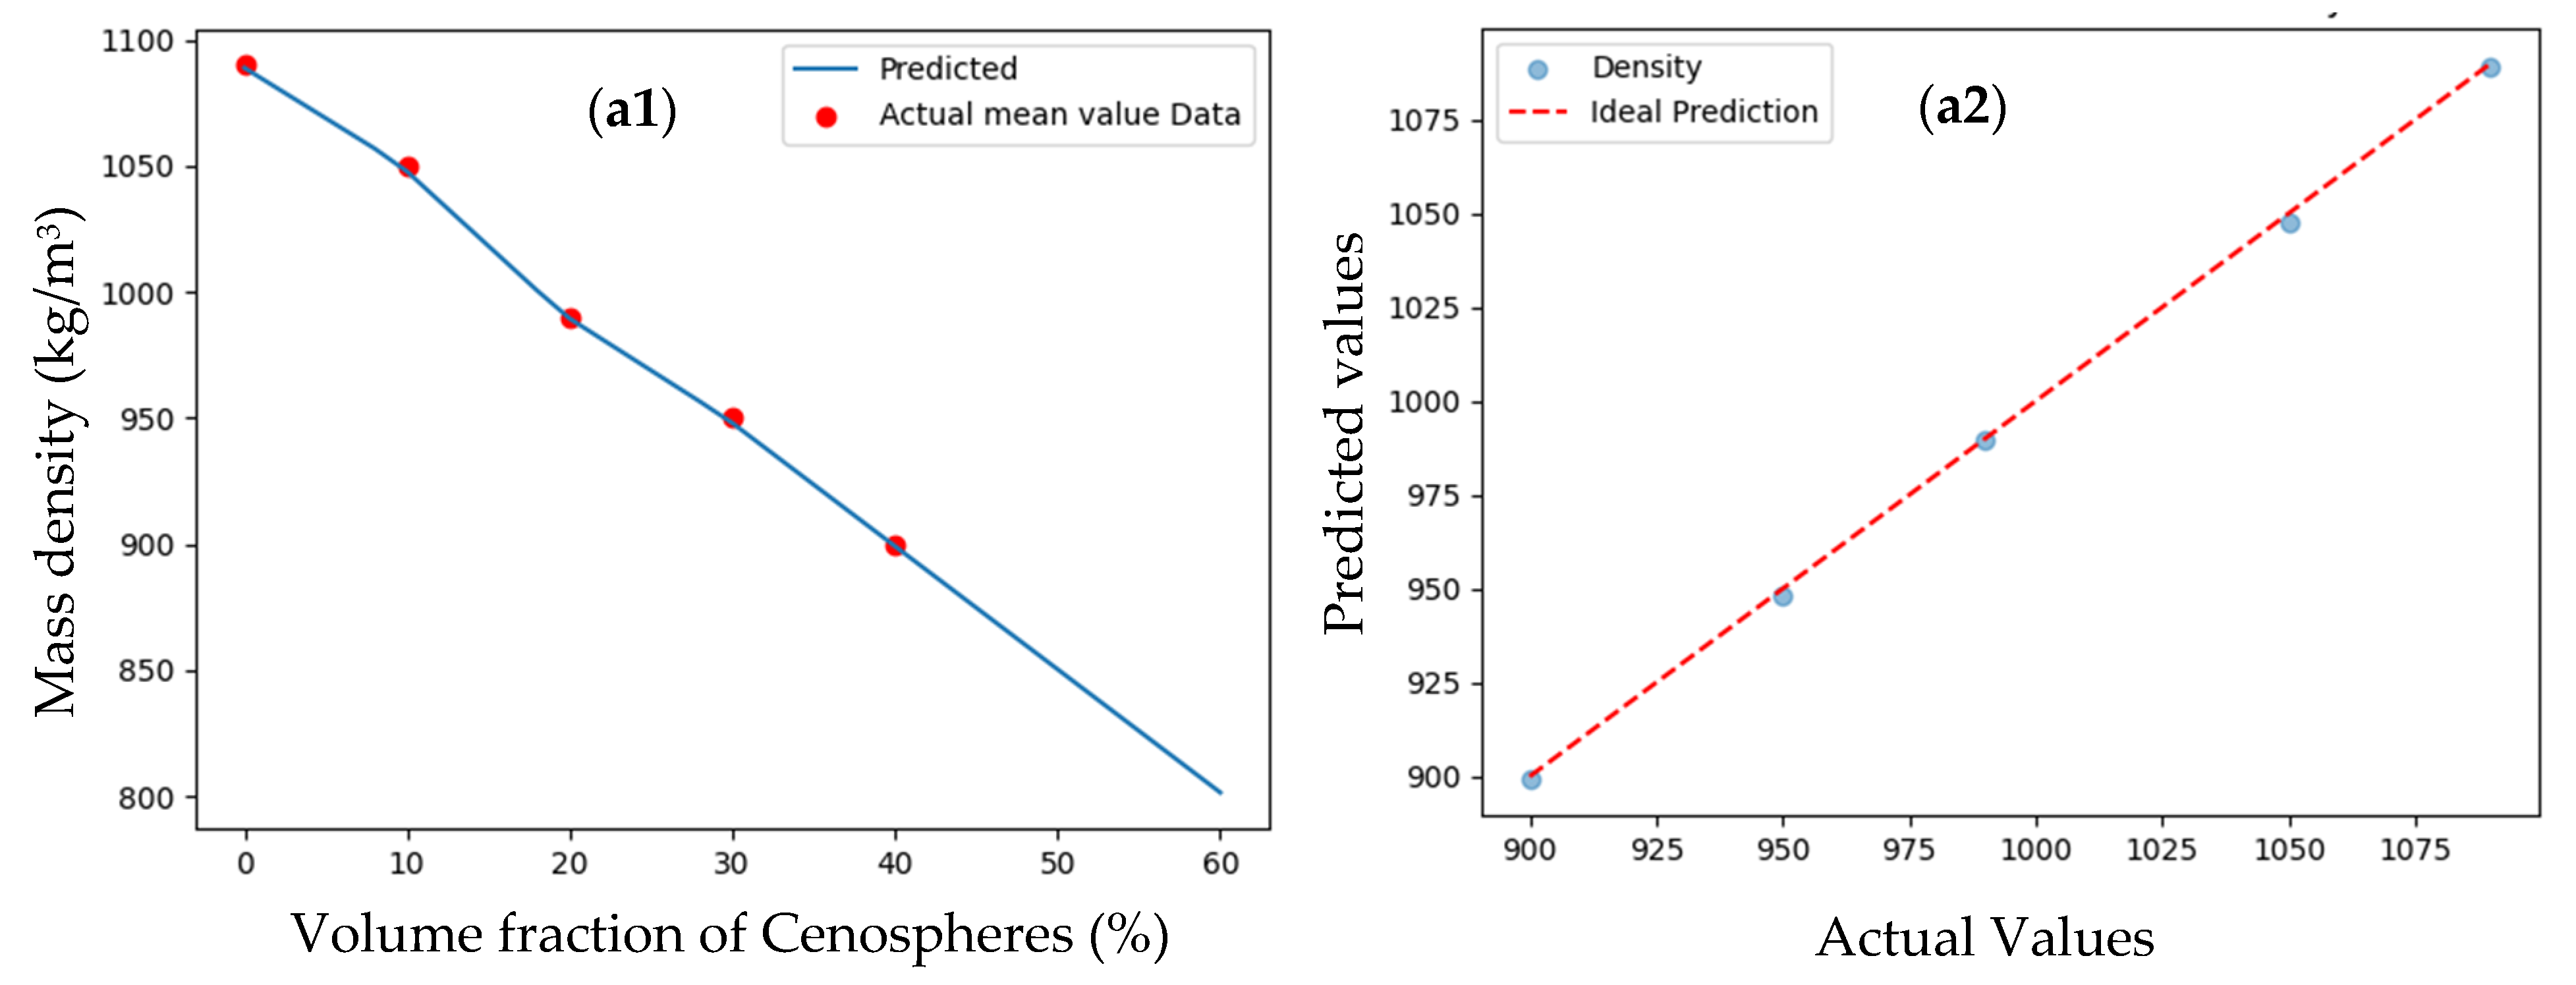
3.1.5. Mass Density Prediction of DNN Model

As the predictions of mass density beyond the 40% volume fraction from the non-linear DNN model (with four hidden layers) are not as expected, the DNN model with only two hidden layers, as shown in Figure 4, is used to predict only the mass density of the composite. The predictions are shown in Figure 12(a1), and the corresponding regression analysis figure for this property is shown in Figure 12(a2) with an R2 value of 0.999. The statistical metrics of MAE and RMSE are a little higher than those of the other two models, but given the measurement of only mass density, they are very small. This DNN model provided a slightly linear trend but showed a decrease in density with an increase in the volume fraction of Cenospheres, as anticipated. The predicted decrease in density is 817.4 kg/m3 for the increase in the Cenosphere volume fraction from 40% to 60%. This decrease is slightly higher than that of the shallow ANN model with a value of 801 kg/m3. The reasons for this difference in predictions of both the DNN and shallow ANN are similar to those discussed at the end of the previous section. An additional hidden layer in DNN model used for predicting density (shown in Figure 4), offers deeper architecture, a greater capacity to smooth over noise, and emphasis on global trend learning, causing a conservative prediction of a smaller decrease in mass density compared to that of the shallow ANN model.

4. Conclusions

A machine learning-based investigation is performed to predict the mass density and mechanical and fracture properties of Cenosphere-reinforced particulate polyurethane composites. The experimental data of measured properties (between 0% and 40% volume fractions in increments of 10%) is used to train and test two different kinds of machine learning models: (a) a shallow ANN and (b) a non-linear DNN. Both of these models accurately predicted all intermediate volume fractions between 0% and 40% with higher R2 values (close 0.99) for all seven output properties. The statistical metrics used in this study are also significantly low for all three models, indicating that the model predictions closely match those of experimental measurements. The shallow ANN model’s predictions demonstrated a linear trend for both intermediate volume fractions of 0% and 40% and those beyond 40% up to 60%. On the other hand, the non-linear DNN predictions showed a significant non-linear trend between 10 and 20%, as well as slight non-linearity between other volume fractions. For the predictions beyond the 40% volume fraction, the non-linear DNN model predictions for all seven output properties are less than those of the shallow ANN models due to the former’s deeper architecture, greater capacity to smooth over noise, and emphasis on global trend learning. The shallow ANN-predicted Young’s modulus tension values at 60% volume fraction are about 10% higher than that of the empirical model; however, the predictions of Young’s modulus for compression are almost similar to those of the empirical model. The non-linear DNN model’s predictions of Young’s modulus values under both tension and compression conditions are lower than those of the empirical model. Mass density predictions between 40% and 60% of the non-linear DNN model showed an unexpected trend of an increase in density, as the addition of lighter Cenospheres was supposed to reduce the mass density. Hence, a double-hidden-layer DNN model was used for predicting only the mass density, which demonstrated an expected decreasing trend, although the values were higher than those of the shallow ANN. The reasons for the higher values are similar to those of the non-linear DNN.
Although the predictions of the mechanical and fracture properties are reasonably accurate, they can be further improved by incorporating debonding of particles from the matrix and coalescence of voids at higher volume fractions through physics-informed machine learning models.

Author Contributions

Conceptualization, V.C.; methodology, N.N.N.; software, N.N.N.; validation, N.N.N. and V.C.; formal analysis, N.N.N.; investigation, N.N.N.; resources, N.N.N. and V.C.; data curation, N.N.N.; writing—original draft preparation, V.C.; writing—review and editing, N.N.N. and V.C.; visualization, V.C.; supervision, V.C.; project administration, V.C. All authors have read and agreed to the published version of the manuscript.

Funding

This research received no external funding.

Data Availability Statement

Data is contained within the article.

Conflicts of Interest

The authors declare no conflicts of interest.

References

  1. Atiqah, A.; Mastura, M.T.; Ahmed Ali, B.A.; Jawaid, M.; Sapuan, M. A Review on Polyurethane and its Polymer Composites. Curr. Org. Synth. 2017, 14, 233–248. [Google Scholar] [CrossRef]
  2. Kausar, A. Polyurethane Composite Foams in High-Performance Applications: A Review. Polym. Plast. Technol. Eng. 2018, 57, 346–369. [Google Scholar] [CrossRef]
  3. Ahiwar, D.; Telang, A.; Purohit, R.; Namdev, A. A short review on polyurethane polymer composite. Mater. Today 2022, 62, 3804–3810. [Google Scholar]
  4. Sounik, D.; McCullough, D.; Clemons, J.; Liddle, J. Dynamic Impact Testing of Polyurethane Energy Absorbing (EA) Foams. In SAE Technical Paper 940879; SAE International: Warrendale, PA, USA, 1994. [Google Scholar]
  5. Patel, J.; Stojko, S. Characterising polyurethane foam as impact absorber in transport packages. Packag. Transp. Storage Secur. Radioact. Mater. 2013, 21, 25–30. [Google Scholar] [CrossRef]
  6. Bates, S.R.G.; Farrow, I.R.; Trask, R.S. 3D printed polyurethane honeycombs for repeated tailored energy absorption. Mater. Design 2016, 112, 172–183. [Google Scholar] [CrossRef]
  7. McClory, C.; McNally, T.; Brennan, G.P.; Erskine, J. Thermosetting polyurethane multiwalled carbon nanotube composites. J. Appl. Polym. Sci. 2007, 105, 1003–1011. [Google Scholar] [CrossRef]
  8. Wu, G.-M.; Liu, G.-F.; Chen, J.; Kong, Z.-W. Preparation and properties of thermoset composite films from two-component waterborne polyurethane with low loading level nanofibrillated cellulose. Prog. Org. Coat. 2017, 106, 170–176. [Google Scholar] [CrossRef]
  9. Yang, G.; Song, J.; Hou, X. Fabrication of highly hydrophobic two-component thermosetting polyurethane surfaces with silica nanoparticles. Appl. Surf. Sci. 2018, 439, 772–779. [Google Scholar] [CrossRef]
  10. Chalivendra, V.; Shukla, A.; Bose, A.; Parameswaran, V. Processing and mechanical characterization of lightweight polyurethane composites. J. Mater. Sci. 2003, 38, 1631–1643. [Google Scholar] [CrossRef]
  11. Faria, D.L.; Junior, L.M.; Resende, A.A.; Lopes, D.E.; Mended, L.M.; Martins, M.A.; Marconcini, J.M.; Junior, J.B.G. Physical and mechanical properties of polyurethane thermoset matrices reinforced with green coconut fibres. J. Compos. Mater. 2020, 54, 4841–4852. [Google Scholar] [CrossRef]
  12. Gao, L.; Tang, Q.; Chen, Y.; Wnag, Z.; Guo, W. Investigation of novel lightweight phenolic foam-based composites reinforced with flax fiber mats. Polym. Compos. 2016, 39, 1809–1817. [Google Scholar] [CrossRef]
  13. Latere Dwan’isa, J.-P.; Mohanty, A.K.; Misra, M.; Drzal, L.T.; Kazemizadeh, M. Novel soy oil based polyurethane composites: Fabrication and dynamic mechanical properties evaluation. J. Mater. Sci. 2004, 39, 1887–1890. [Google Scholar] [CrossRef]
  14. Yu, S.; Li, X.; Zhao, Y.; Zou, M. A Novel Lightweight Polyurethane Composite for Application on Ultra-High-Voltage Insulator Core Filler. Polymers 2020, 12, 2737. [Google Scholar] [CrossRef]
  15. Chen, C.; Gu, G.X. Machine learning for composite materials. MRS Commun. 2021, 9, 556–566. [Google Scholar] [CrossRef]
  16. Liu, X.; Tian, S.; Tao, F.; Yu, W. A review of artificial neural networks in the constitutive modeling of composite materials. Compos. B Eng. 2021, 224, 109152. [Google Scholar] [CrossRef]
  17. Sharma, A.; Mukhopadhyay, T.; Rangappa, S.M.; Siengchin, S.; Kushvaha, V. Advances in computational intelligence of polymer composite materials: Machine learning assisted modeling, analysis and design. Arch. Comput. Methods Eng. 2022, 29, 3341–3385. [Google Scholar] [CrossRef]
  18. Wang, Y.; Soutis, C.; Ando, D.; Sutou, Y.; Narita, F. Application of deep neural network learning in composites design. Eur. J. Mater. 2022, 2, 117–170. [Google Scholar] [CrossRef]
  19. Shyam, S.; Kaul, S.; Kalsara, N.; Babu, T.N. Mechanical behaviour and microscopic analysis of epoxy and E-glass reinforced banyan fibre composites with the application of artificial neural network and deep neural network for the automatic prediction of orientation. J. Compos. Mater. 2021, 55, 213–234. [Google Scholar] [CrossRef]
  20. Zazoum, B.; Triki, E.; Bachri, A. Modeling of Mechanical Properties of Clay-Reinforced Polymer Nanocomposites Using Deep Neural Network. Materials 2020, 13, 4266. [Google Scholar] [CrossRef]
  21. Baek, K.; Hwang, T.; Lee, W.; Chung, H.; Cho, M. Deep learning aided evaluation for electromechanical properties of complexly structured polymer nanocomposites. Compos. Sci. Tech. 2022, 228, 109661. [Google Scholar] [CrossRef]
  22. Niaki, M.H.; Pashaian, M.; Ahangari, M.G. Experimental assessment of the efficiency of deep learning method in predicting the mechanical properties of polymer concretes and composites. J. Build. Eng. 2023, 76, 107107. [Google Scholar] [CrossRef]
  23. Varughese, J.Y.; Sreekanth, M.S. Influence of silane and polyethylene glycol functionalization of boron nitride nanosheets on mechanical and thermal properties of epoxy nanocomposites: Machine and deep learning forecasting. Polym. Compos. 2024, 46, 2190–2208. [Google Scholar] [CrossRef]
  24. Chai, X.; Sue, Y.; Lin, Z.; Qiu, C.; Liu, X.; Zhang, X.; Yang, J.; Ouyang, Q.; Zhang, D. Mechanical property prediction and configuration effect exploration of particulate reinforced metal matrix composites via an interpretable deep learning approach. Mater. Sci. Eng. A 2025, 925, 147880. [Google Scholar] [CrossRef]
  25. Ngu, L.-N.; Wu, H.; Zhang, D.-K. Characterization of Ash Cenospheres in Fly Ash from Australian Power Stations. Energy Fuels 2007, 21, 3437–3445. [Google Scholar] [CrossRef]
  26. Ranjbar, N.; Kuenzel, C. Cenospheres: A review. Fuel 2017, 207, 1–12. [Google Scholar] [CrossRef]
  27. Danish, A.; Mosaberpanah, M.A. Formation mechanism and applications of cenospheres: A review. J. Mater. Sci. 2020, 55, 4539–4557. [Google Scholar] [CrossRef]
  28. Available online: https://bariteworld.com/industrial-minerals-products/cenospheres/ (accessed on 10 May 2025).
  29. Anderson, T.L. Fracture Mechanics: Fundamentals and Applications, 4th ed.; CRC Press: Boca Raton, FL, USA, 2017. [Google Scholar]
  30. Fu, S.-Y.; Feng, X.-Q.; Lauke, B.; Mai, Y.-W. Effects of particle size, particle/matrix interface adhesion and particle loading on mechanical properties of particulate–polymer composites. Compos. B Eng. 2008, 19, 933–961. [Google Scholar] [CrossRef]
  31. Guth, E. Theory of Filler Reinforcement. J. Appl. Phys. 1945, 16, 20–25. [Google Scholar] [CrossRef]
Figure 1. Typical image of Cenospheres [28].
Jcs 09 00271 g001
Figure 2. Shallow artificial neural network (ANN) model for predicting all output parameters.
Jcs 09 00271 g002
Figure 3. Non-linear deep neural network (DNN) model for predicting all output parameters.
Jcs 09 00271 g003
Figure 4. Deep neural network (DNN) model for predicting mass density.
Jcs 09 00271 g004
Figure 5. Mass density of composites as a function of volume fraction of Cenospheres.
Jcs 09 00271 g005
Figure 6. Predictions of shallow ANN model: (a1) mass density as a function of volume fraction of Cenospheres and (a2) regression analysis of mass density.
Jcs 09 00271 g006
Figure 7. Predictions of shallow ANN model: (a1) Young’s modulus for tension as a function of volume fraction of Cenospheres, (a2) regression analysis of Young’s modulus for tension, (b1) Young’s modulus for compression as a function of volume fraction of Cenospheres, (b2) regression analysis of Young’s modulus for compression, (c1) % elongation at break as a function of volume fraction of Cenospheres and (c2) regression analysis of % elongation at break.
Jcs 09 00271 g007
Figure 8. Predictions of shallow ANN model: (a1) tensile strength as a function of volume fraction of Cenospheres, (a2) regression analysis of tensile strength, (b1) specific tensile strength as a function of volume fraction of Cenospheres, (b2) regression analysis of specific tensile strength, (c1) fracture toughness as a function of volume fraction of Cenospheres, and (c2) regression analysis of fracture toughness.
Jcs 09 00271 g008
Figure 9. Predictions of non-linear DNN model: (a1) mass density as a function of volume fraction of Cenospheres and (a2) regression analysis of mass density.
Jcs 09 00271 g009
Figure 10. Predictions of non-linear DNN model: (a1) Young’s modulus for tension as a function of volume fraction of Cenospheres, (a2) regression analysis of Young’s modulus for tension, (b1) Young’s modulus for compression as a function of volume fraction of Cenospheres, (b2) regression analysis of Young’s modulus for compression, (c1) % elongation at break as a function of volume fraction of Cenospheres and (c2) regression analysis of % elongation at break.
Jcs 09 00271 g010
Figure 11. Predictions of non-linear DNN model: (a1) tensile strength as a function of volume fraction of Cenospheres, (a2) regression analysis of tensile strength, (b1) specific tensile strength as a function of volume fraction of Cenospheres, (b2) regression analysis of specific tensile strength, (c1) fracture toughness as a function of volume fraction of Cenospheres, and (c2) regression analysis of fracture toughness.
Jcs 09 00271 g011
Figure 12. Predictions of DNN model: (a1) mass density as a function of volume fraction of Cenospheres and (a2) regression analysis of mass density.
Jcs 09 00271 g012
Table 1. Parameter set of shallow ANN model for predicting all output parameters.
ParameterValues/Tools InvestigatedSelected Value/Tool
Learning Rates0.0001, 0.001, 0.010.001
Neurons8, 16, 32, 64, 128, 256, 51232
Activationssigmoid, ReLUReLU
Batch Sizes8, 16, 32, 6416
Dropout Rates0, 0.2, 0.40
Initializersglorot_uniform, he_normalglorot_uniform
RegularizersNone, l1(0.01), l2(0.01)l1(0.01)
OptimizerSGD, RMSprop, ADAMADAM
Lossmae, root_mean_squared_error, mse, R2_scoremse
Epochs50, 100, 200100
Table 2. Parameter set of non-linear DNN model for predicting all output parameters.
ParameterValues/Tools InvestigatedSelected Value/Tool
Learning Rates0.0001, 0.001, 0.010.001
Neuron Layer no 18, 14, 16, 32, 64, 128, 256, 512128
Neuron Layer no 28, 14, 16, 32, 64, 128, 256, 51264
Neuron Layer no 38, 14, 16, 32, 64, 128, 256, 51232
Neuron Layer no 48, 14, 16, 32, 64, 128, 256, 51214
Activationssigmoid, ReLUReLU
Batch Sizes8, 16, 32, 6416
Dropout Rates0, 0.2, 0.40
Initializersglorot_uniform, he_normalglorot_uniform
RegularizersNone, l1(0.01), l2(0.01)l1(0.01)
OptimizerSGD, RMSprop, ADAMADAM
Lossmae, root_mean_squared_error, mse, R2_scoremse
Epochs50, 100, 200100
Table 3. Parameter set of DNN model for predicting mass density.
ParameterValues/Tools InvestigatedSelected Value/Tool
Learning Rates0.0001, 0.001, 0.010.001
Neuron Layer no 18, 14, 16, 32, 64, 128, 256, 51232
Neuron Layer no 28, 14, 16, 32, 64, 128, 256, 51216
Activationssigmoid, ReLUReLU
Batch Sizes8, 16, 32, 6416
Dropout Rates0, 0.2, 0.40
Initializersglorot_uniform, he_normalglorot_uniform
RegularizersNone, l1(0.01), l2(0.01)l1(0.01)
OptimizerSGD, RMSprop, ADAMADAM
Lossmae, root_mean_squared_error, mse, r2_scoremse
Epochs50, 100, 200100
Table 4. Mechanical properties of composites under tension and compression and fracture toughness (±values are standard deviation).
Volume
Fraction of
Particles (%)
Tensile Young’s
Modulus (MPa)
Compression Young’s
Modulus (MPa)
Tensile Strength
(MPa)
Specific Tensile
Strength (m)
% Elongation at
Break Under
Tension
Fracture
Toughness
(MPa·√m)
010.24 ± 0.9410.5 ± 0.642.67 ± 0.18245.29 ± 16.4461.42 ± 5.050.18 ± 0.008
1016.32 ± 0.8814.72 ± 1.182.74 ± 0.11266. 47 ± 11.4229.97 ± 3.360.23 ± 0.013
2020.67 ± 1.2719.42 ± 0.752.81 ± 0.24290.58 ± 25.1721.70 ± 3.230.29 ± 0.021
3033.43 ± 2.4230.77 ± 0.962.51 ± 0.15271. 18 ± 16.4516.02 ± 2.550.34 ± 0.027
4050.05 ± 2.5345.77 ± 1.122.44 ± 0.07281. 17 ± 8.7211.31 ± 1.680.38 ± 0.033
Table 5. Statistical metrics of predictions for all three machine learning models.
Shallow ANNNon-Linear DNNDNN
ParameterValue
Mean Absolute Error (MAE)1.271.341.75
Root Mean Square Error (RMSE)1.951.962.03
Mean Square Error3.813.844.11
Disclaimer/Publisher’s Note: The statements, opinions and data contained in all publications are solely those of the individual author(s) and contributor(s) and not of MDPI and/or the editor(s). MDPI and/or the editor(s) disclaim responsibility for any injury to people or property resulting from any ideas, methods, instructions or products referred to in the content.

