Systematic Review

The Impact of Sports Drink Exposure on the Surface Roughness of Restorative Materials: A Systematic Review

by
Filip Podgórski
1,2,
Wiktoria Musyt
3 and
Kacper Nijakowski
1,*
1
Department of Conservative Dentistry and Endodontics, Poznan University of Medical Sciences, 60-812 Poznan, Poland
2
Doctoral School, Poznan University of Medical Sciences, 60-812 Poznan, Poland
3
Student’s Scientific Group in Department of Conservative Dentistry and Endodontics, Poznan University of Medical Sciences, 60-812 Poznan, Poland
*
Author to whom correspondence should be addressed.
J. Compos. Sci. 2025, 9(5), 234; https://doi.org/10.3390/jcs9050234
Submission received: 8 April 2025 / Revised: 1 May 2025 / Accepted: 3 May 2025 / Published: 5 May 2025
(This article belongs to the Special Issue Feature Papers in Journal of Composites Science in 2025)

Abstract

:
The impact of acidic beverages on dental restorative materials, such as composites and glass ionomers, is critical in conservative dentistry. Exposure to an acidic environment can lead to the degradation of these materials, affecting their durability and clinical effectiveness. We aimed to examine the effect of sports drink exposure on the surface roughness of composite and glass ionomer materials. This systematic review was conducted based on the records published from 1 January 2005 to 31 December 2024, according to PRISMA statement guidelines, using the databases PubMed, Scopus, Web of Science, and Embase. Following the inclusion and exclusion criteria, 10 studies were included in this review and 6 in the meta-analysis. Meta-analysis demonstrated a statistically significant increase in surface roughness (Ra parameter) for glass ionomer materials after immersion in sports drinks for one week and one month. No such significant differences were observed for composite materials. Despite the systematic review, the degree of material degradation presented by in vitro studies cannot be directly extrapolated to oral conditions due to factors such as the buffering capacity of saliva or irregular exposure times to sports drinks.

1. Introduction

Dental erosion (DE) is a progressive and irreversible loss of enamel (the outermost layer of the tooth composed of calcium mineral salts), which acts as a protective barrier for the underlying dentin (a softer and more sensitive tissue). Dissolving dentin is more challenging than enamel due to a demineralized organic matrix, which obstructs ionic diffusion [1].
Tooth erosion results from exposure to acids that do not originate from bacteria [2]. Acids can be of intrinsic and extrinsic origin [3]. The most common causes of dental erosion include food products and beverages with low pH, such as fruits, fresh juices, and carbonated sweet drinks [2,4,5]. However, internal factors, particularly disorders characterized by frequent vomiting, can also contribute to erosion [6]. They include conditions and diseases such as pregnancy, bulimia, anorexia, alcoholism, and gastroesophageal reflux disease (GERD) [1,7,8]. Moreover, regular physical activity while consuming sports drinks significantly raises the risk of dental erosion [6,9]. In addition, when all these factors are combined with the abrasion process, which is often linked to incorrect oral hygiene habits, they can exacerbate the clinical manifestation of dental erosion [10].
Some researchers have noted that the increasing introduction of a Westernized diet and lifestyle may influence the prevalence of dental erosion across all age groups [11]. Recent changes in dietary habits, including the increased consumption of newly introduced acidic foods and drinks, have significantly contributed to that phenomenon. Since dental erosion is irreversible and progresses during a lifetime, prevalence is expected to rise if acidic dietary choices persist [2,5,10].
The effect of acidic beverages on dental restorative materials, including composite resins and glass ionomers, is critical in restorative dentistry. Exposure to an acidic environment can lead to the degradation of these materials, affecting their longevity and clinical performance [12,13]. They are believed to cause severe alterations of occlusion and damage to restorative materials [7].
Composite resins, commonly used due to their esthetic and mechanical properties, are susceptible to surface degradation when exposed to acidic substances [14,15]. The acidic environment can weaken the resin matrix and lead to material loss, resulting in increased surface roughness and contributing to the restorations’ microleakage [14,16]. The acidic environment not only compromises the mechanical properties of the composite materials but can also affect their appearance, resulting in color change [17,18].
Glass ionomer cements, valued for their fluoride release and adhesion to tooth structures, demonstrate sensitivity to acidic conditions [13,19]. Prolonged exposure can cause erosion and increase surface roughness, which may weaken the material and reduce its protective effects [13]. The material’s structural integrity is important for maintaining its durability and effectiveness in clinical applications [20].
Maintaining the smoothness of restorative materials is essential for their longevity and proper function, because a rough surface can promote bacterial adhesion and plaque accumulation, increasing the risk of secondary caries and periodontal complications [18,21]. Surface roughness plays a pivotal role in determining the color stability of restorative materials. Increased roughness can lead to greater pigment adsorption and plaque accumulation, which negatively impacts esthetic longevity. Even minor variations in surface texture can significantly influence discoloration over time, underscoring the clinical importance of achieving smooth well-polished surfaces in restorative dentistry [22]. Furthermore, a smooth surface enhances the esthetic quality of restorations and contributes to patient satisfaction [18]. To ensure the durability of restorations, it is advisable to minimize exposure to acidic beverages [7,12,13,14]. Therefore, we aimed to examine the effect of sports drink exposure on the surface roughness of composite and glass ionomer materials.

2. Materials and Methods

2.1. Search Strategy and Data Extraction

Our systematic review was conducted based on the records published from 1 January 2005 to 31 December 2024, according to the Preferred Reporting Items for Systematic Reviews and Meta-Analyses (PRISMA) statement guidelines [23], using the databases PubMed, Scopus, Web of Science, and Embase. The search queries included the following:
-
For PubMed: (“soft drink” OR “sport drink” OR “sports drink” OR “sport beverage” OR “sports beverage” OR “fruit juice” OR “isotonic beverage” OR “energy beverage” OR “isotonic drink” OR “energy drink”) AND (“dental material” OR “restorative material” OR “composite” OR “glass-ionomer” OR “compomer”);
-
For Scopus: TITLE-ABS-KEY ((“soft drink” OR “sport drink” OR “sports drink” OR “sport beverage” OR “sports beverage” OR “fruit juice” OR “isotonic beverage” OR “energy beverage” OR “isotonic drink” OR “energy drink”) AND (“dental material” OR “restorative material” OR “composite” OR “glass-ionomer” OR “compomer”));
-
For Web of Science: TS = ((“soft drink” OR “sport drink” OR “sports drink” OR “sport beverage” OR “sports beverage” OR “fruit juice” OR “isotonic beverage” OR “energy beverage” OR “isotonic drink” OR “energy drink”) AND (“dental material” OR “restorative material” OR “composite” OR “glass-ionomer” OR “compomer”));
-
For Embase: (“soft drink”: ti,ab,kw OR “sport drink”: ti,ab,kw OR “sports drink”: ti,ab,kw OR “sport beverage”: ti,ab,kw OR “sports beverage”: ti,ab,kw OR “fruit juice”: ti,ab,kw OR “isotonic beverage”: ti,ab,kw OR “energy beverage”: ti,ab,kw OR “isotonic drink”: ti,ab,kw OR “energy drink”: ti,ab,kw) AND (“dental material”: ti,ab,kw OR “restorative material”: ti,ab,kw OR “composite”: ti,ab,kw OR “glass-ionomer”: ti,ab,kw OR “compomer”: ti,ab,kw).
The records were screened by the title, abstract, and full text by two independent investigators. The studies included in this review matched all the predefined criteria according to PICOS (Population, Intervention, Comparison, Outcomes, and Study design), as presented in Table 1. A detailed search flowchart is shown in Figure 1. The study protocol was registered in the international prospective register of systematic reviews, PROSPERO (CRD420251002440).
The results of the meta-analysis were presented in forest plots using Statistica 13.3 (Statsoft, Cracow, Poland). The standardized mean differences of Ra parameters were calculated by subgrouping material type and exposure duration. Egger’s test was used to assess potential publication bias in a meta-analysis.

2.2. Quality Assessment and Critical Appraisal for the Systematic Review of Included Studies
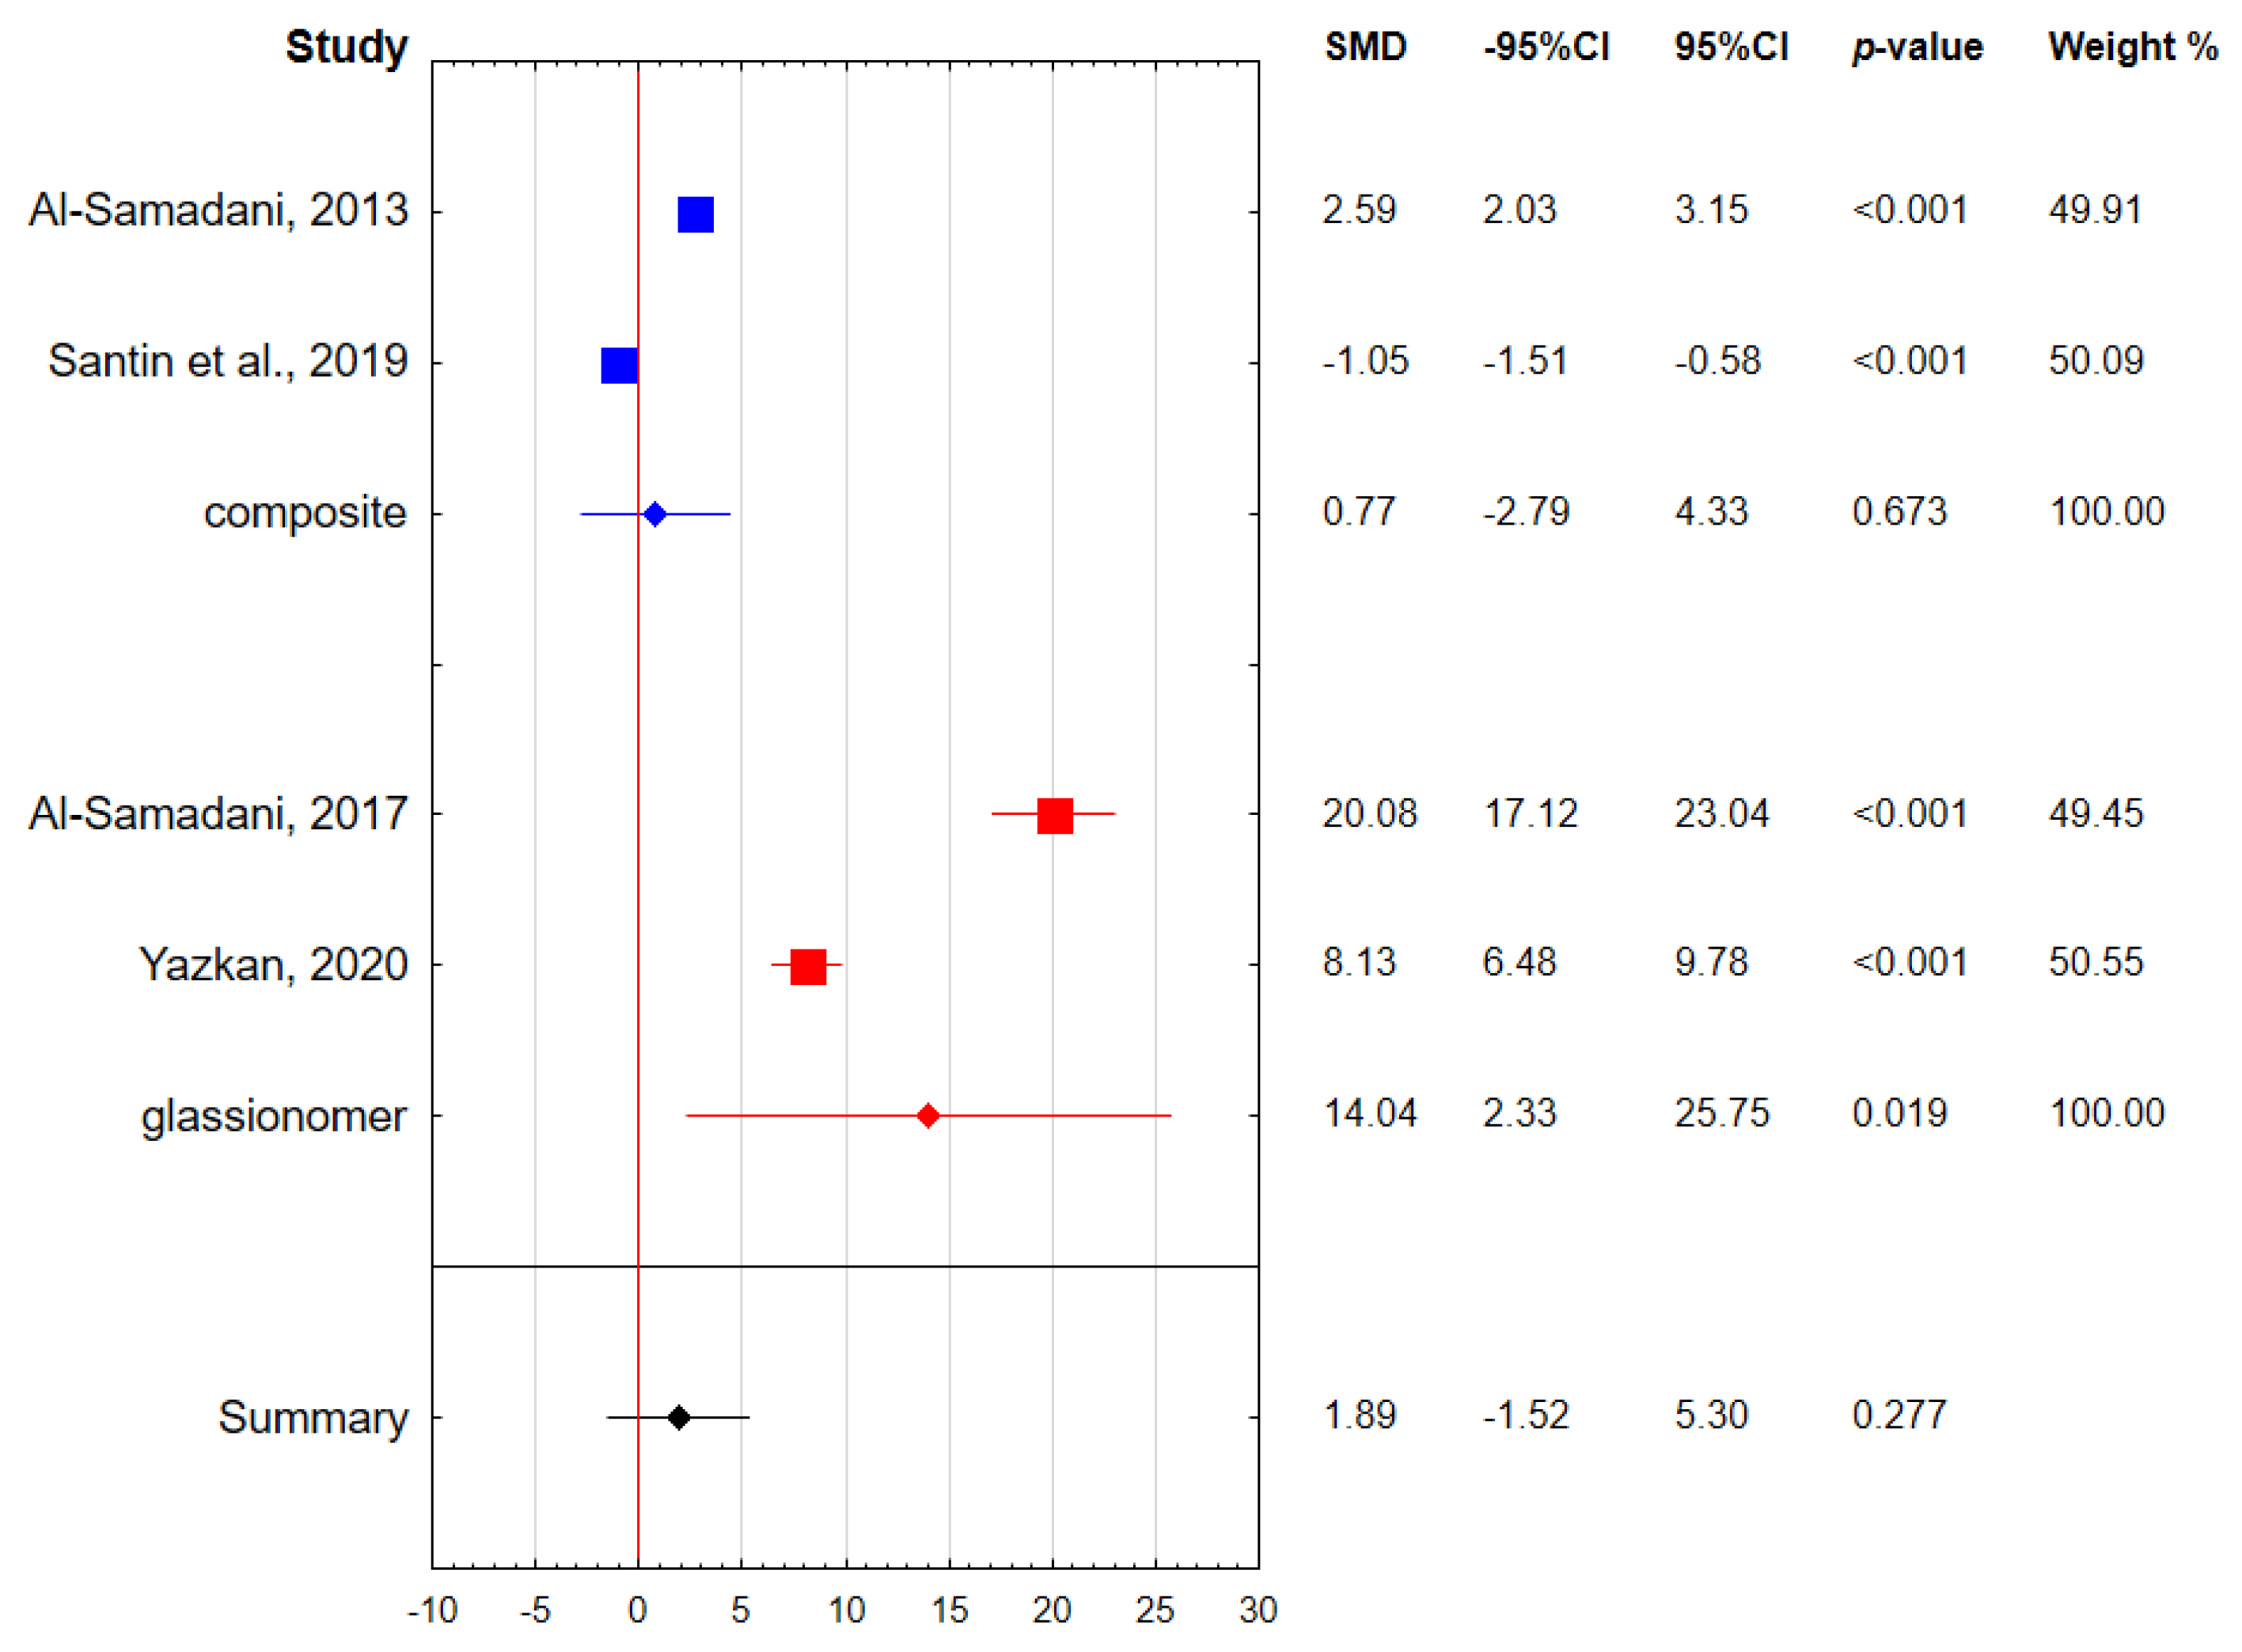
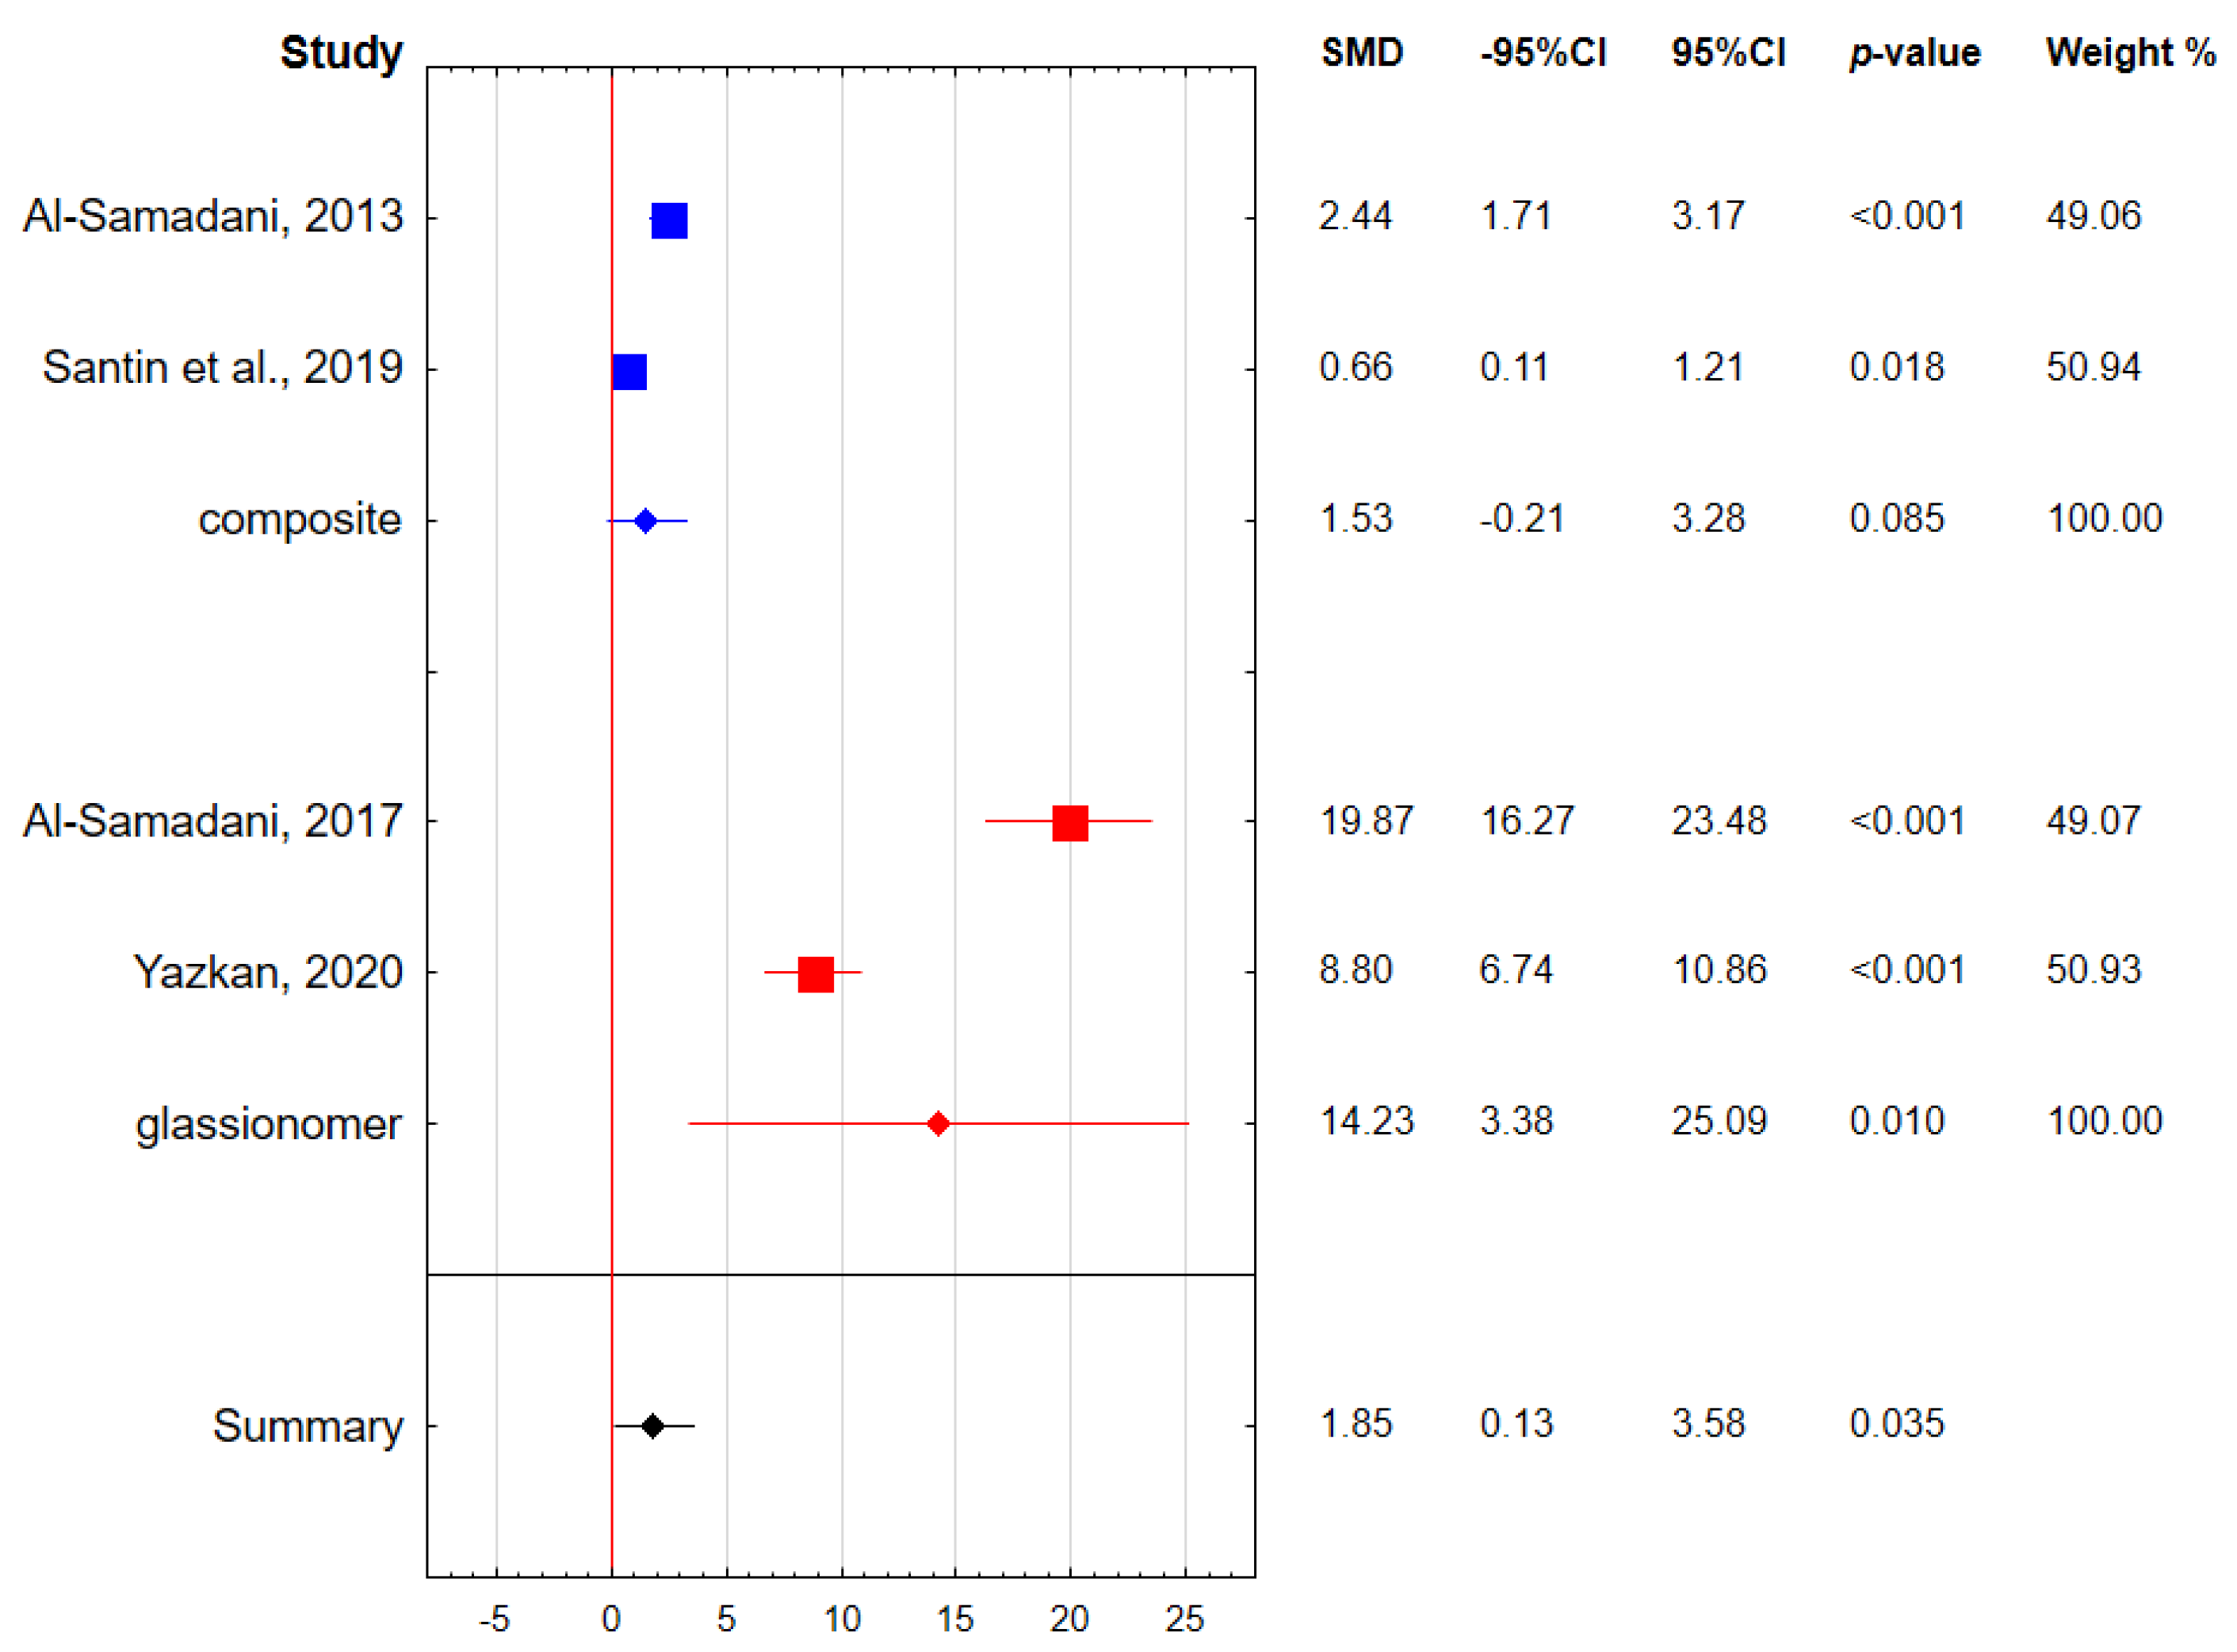
The risk of bias in each individual study was assessed according to the Study Quality Assessment Tool issued by the National Heart, Lung, and Blood Institute within the National Institute of Health [24]. These questionnaires were answered by two independent investigators, and any disagreements were resolved by discussion between them.
Figure 2 reports the summarized quality assessment. The most frequently encountered risk of bias was the absence of data regarding the blinding of samples. Critical appraisal was summarized by adding up the points for each criterion of potential risk (points: 1—low, 0.5—unspecified, and 0—high). All studies were classified as having “good” quality (≥85% total score).

3. Results

Following the search criteria, our systematic review included ten studies. More detailed information on the methodology of these studies and main findings is provided in Table 2.
Based on the meta-analysis of six included studies (Figure 3, Figure 4, Figure 5 and Figure 6), the significant increase in surface roughness was determined only amongst the glass ionomer group, respectively, after 1-week exposure to sports drinks SMD was approximately 12.77 [95%CI: 5.95–19.58] and after 1 month 14.04 [95%CI: 2.33–25.75]. Additionally, in the same material group, the SMD increase in surface roughness against the control group was 11.61 [95%CI: 6.17–17.05] and 14.23 [95%CI: 3.38–25.09] for 1-week and 1-month exposure.

4. Discussion

Restorative materials used in dentistry are constantly exposed to various factors in the oral cavity, such as changes in pH and temperature, brushing, chewing, type of consumed food, and composition of the material itself [29,32]. Glass-ionomer and composite resin materials are well known and most used clinically. Glass-ionomer materials present anti-cariogenic properties due to the release of fluoride. Despite their good biocompatibility, these materials present a significant disadvantage of surface degradation tendency [13]. Composite materials show great esthetics and have become the material of choice for anterior teeth restorations [12]. Resin-modified materials present better adhesion to enamel and dentine. The ability of restorative materials to resist functional forces exposure to different food and drinks plays a significant role in maintaining oral health. Even though material properties are improved every year, and new products are available on the market, the surface roughness of dental materials is still a challenge for their longevity [13]. The surface roughness of restorations allows bacterial accumulation, creating microleakage, and, finally, secondary caries are developed. The progression of caries reflects on the strength of the tooth’s structures and materials’ mechanical and esthetic properties [33,34].
Studies included in the meta-analysis examined various composite materials. In the research conducted by Al-Samadani [12], three different composites were tested (Filtek Z350 XT, Filtek Z250 XT, Tetric EvoCeram). Samples were immersed in three test solutions (Red Bull, Bison, Power Horse) and distilled water as a control. Baseline Ra (nm) values for tested materials were Filtek Z350 XT—73.6; Filtek Z250 XT—145.07; Tetric EvoCream—149.4. Among the tested materials, it was observed that Filtek Z350 XT and Tetric EvoCream immersed in Red Bull for 1, 3, and 6 months revealed the highest ΔRa values reaching 100.9; 125.7; 144 for Filtek Z350 XT and 61.61; 81.5; 127.8 for Tetric EvoCream. Filtek Z350 XT also showed sensitivity to Power Horse with 54.4; 58.44; 66.4 ΔRa values. On the other hand, Tetric EvoCeram samples immersed in Power Horse showed decreasing surface roughness with ΔRa values of −1.3; −5.34; −9.9. Between the tested materials, Filtek Z250 XT revealed the smallest decrease in surface roughness with the lowest ΔRa values after 1 month. All discussed results were statistically significant.
Properties of Filtek Z350 were also tested in research conducted by Elmarakby et al. [25]. Prepared material samples were immersed in Bison sports drink for 5 min and then stored in distilled water for the rest of the day. These procedures were repeated for 14 days. Surface roughness measurements before immersion were 0.189 µm and 0.487 µm after immersion, being statistically significant. In both of these studies, the sensitivity of the Filtek Z350 material to Bison sports drink was significant and increased surface roughness [12,25].
On the other hand, Santin et al. [29] revealed that the surface roughness of Filtek Z350 XT composite decreased throughout the immersion protocol. Material samples were immersed in two solutions: Maltodextrin mixed with deionized water for 22.5 days; whey protein mixed with deionized water for 7.5 days and then stored for 15 days in deionized water. The control group consisted of samples immersed in deionized water. Measured Ra (μm) values for each drink before and after immersion were: 0.37 ± 0.08 and 0.28 ± 0.04 for deionized water, 0.39 ± 0.08 and 0,28 ± 0.08 for the Maltodextrin solution, and 0.44 ± 0.09 and 0.22 ± 0.05 for the whey protein solution. The same study also tested the properties of another composite material, Empress Direct. The surface roughness of this material also decreased under the deionized water and Maltodextrin solution exposure; however, after immersion in the whey protein solution, Ra values changed from 0.32 ± 0.02 to 0.45 ± 0.07, indicating an increase in surface roughness. The Empress Direct resin showed a higher ΔRa in the control solution than in both sports drinks.
Another research regarding the properties of composite materials was conducted by Kolarovszki et al. [26]. Two resin composites were tested: Filtek Z250 and Estelite Sigma Quick. The samples were immersed in two test drinks (Burn and Hell) for 30 min. Samples treated only with the cleaning protocol determined the control group. Atomic force microscopy (AFM) measurements were carried out in 5 × 5 μm area and 20 × 20 μm area. AFM measurements at a 5 × 5 μm sample size for the Filtek Z250 group showed the following Ra (nm) values: 47 ± 6 in the control group, 78 ± 6 for Hell, and 93 ± 6 for Burn. In the 20 × 20 μm area sample size, results were, respectively, 70 ± 8, 126 ± 11, and 228 ± 13. In the Estelite Sigma Quick group, AFM Ra value measurements in the 5 × 5 μm and 20 × 20 μm samples were 41 ± 4, 112 ± 11 (control group); 54 ± 4, 127 ± 11 (Hell); 48 ± 3, 95 ± 7 (Burn). Filtek Z250 showed statistical significance in all tested groups towards the control; however, Estelite Sigma Quick presented no significant difference from the control group after immersion in sports drinks.
Kose et al. [27] determined the influence of three different sports drinks (Powerade, Burn, and Monster) on the surface roughness of Charisma Diamond One resin composite. Samples were immersed in sports drinks for 7 days, and distilled water served as a control group. The baseline value of Ra (µm) was 0.42 ± 0.16. Ra values after 7 days of immersion in distilled water, Powerade, Burn, and Monster were, respectively, 0.52 ± 0.17; 0.55 ± 0.16; 0.52 ± 0.13; 0.67 ± 0.1. All test solutions significantly increased surface roughness against the control group. There was no statistical significance between distilled water, Powerade, and Burn immersion; however, these drinks showed significance against immersion in the Monster drink. Both studies conducted by Kolarovszki et al. [26] and Kose et al. [27] proved the high erosive potential of Burn sports drinks on two different composite materials, resulting in a significant increase in surface roughness.
In the research by Tanthanuch et al. [30], the properties of Premise resin composite were tested. Samples of the material were stored in two beverages: Sponsor sports drink and M-150 energy drink; distilled water served as a control group. Samples were immersed for 7 and 14 days. The baseline value of Ra (µm) before immersion was 0.01 ± 0.01 in each group. In the Sponsor group, the Ra value after 7 days was 0.19 ± 0.02 and 0.22 ± 0.02 after 14 days. Ra values in the M-150 group were 0.30 ± 0.02 after 7 days and 0.33 ± 0.02 after 14 days. The surface roughness in both groups after the immersion protocol increased significantly.
The same study also established the effect of sports drinks immersion on Ketac Universal glass ionomer. Within the same study design mentioned before, baseline Ra (µm) values were 0.01 ± 0.01 in deionized water and 0.02 ± 0.02 in the Sponsor and M-150 groups. Ra values after immersion for 7 and 14 days were, respectively, 0.33 ± 0.02 and 0.36 ± 0.02 in the Sponsor group and 0.29 ± 0.08 and 0.82 ± 0.02 in the M-150 group. There was no statistical significance in the control group [30].
Another research regarding the properties of glass ionomer materials was conducted by Al-Samadani [13]. In the study, three different glass ionomer materials were tested. Samples of Ionofil Plus AC, GC Equia, and Ketac Molar were immersed in Code Red, Red Bull, Power Horse, and distilled water (control). Exposure time was divided into three groups: 1 day, 1 week, and 1 month. Baseline Ra (nm) values for each material were 7.72 for Ionofil Plus AC, 23.3 for GC Equia, and 13.27 for Ketac Molar. All tested materials showed a significant increase in surface roughness after immersion in sports drinks and distilled water for each exposure time. Immersion in Red Bull led to the highest Ra differences. ΔRa values for Ionofil Plus AC were 185.1 after 1 day, 208.1 after 1 week, and 272.1 after 1 month and, respectively, for GC Equia, 199.5, 222.8, and 282.8, and Ketac Molar, 133.9, 147.1, and 205. Results indicate high levels of degradation in the surface roughness of glass ionomer materials after exposure to sports drinks.
Kose et al. [27] tested the properties of the Equia Forte HT glass ionomer. In the study, samples were stored in distilled water, Powerade, Burn, and Monster for 7 days. Before immersion, the Ra (µm) value was 0.86 ± 0.09. After the immersion protocol, obtained Ra values were 1.07 ± 0.15 for distilled water, 10.47 ± 0.17 for Powerade, 10.62 ± 0.71 for Burn, and 10.51 ± 0.62 for Monster. A significant increase in surface roughness was observed in each group.
The properties of this material were also tested in the study conducted by Yazkan et al. [32]. Prepared samples were immersed in Red Bull, Burn, and distilled water (control) 3 times daily for 5 min for 1 day, 1 week, and 1 month periods. Baseline Ra (µm) values for samples were, respectively, 0.149 ± 0.006 for Red Bull, 0.112 ± 0.006 for Burn, and 0.116 ± 0.005 for distilled water. A significant increase in Ra (µm) values was observed after 1 week and 1 month of exposure. Ra values in the Red Bull group were 0.165 ± 0.007 after 1 week and 0.215 ± 0.007 after 1 month, and, in the Burn group, 0.130 ± 0.006 after 1 week and 0.152 ± 0.007 after 1 month. Within the control group, a significant increase in surface roughness was observed after a 1-month aging period with the Ra value of 0.127 ± 0.005. In both of these studies, there was a significant increase in surface roughness after immersion of the Equia Forte HT glass ionomer in the Burn sports drink [27,32].
In the research conducted by Al-Samadani [13], glass ionomer restorations showed statistically significant differences in surface roughness, with a p-value of 0.019 in the control group, including distilled water. Kose et al. [27] also showed a significant increase in surface roughness amongst glass ionomers. On the other hand, Yazkan et al. [32] concluded that a significant change in surface roughness occurred after a 1-month aging regimen consisting of three daily immersions in distilled water for 5 min. There was no statistically significant difference after 1 day or 1 week of exposure. Moreover, research by Tanthanuch et al. [30] showed no statistical significance in the control group.
The ability of water sorption is a major challenge for resin-modified restorative materials and glass ionomers. Roughness is affected by this process and depends on material capacities [29]. Sports drinks present high acidity, which enables deep penetration into the organic matrix. This process allows water absorption and leads to the loss of particles and reduction of superficial homogeneity and microhardness [25]. Vaidya et al. [31] and Kose et al. [27] found that distilled water, used as a test solution in the control group, caused significant differences in the surface roughness of composite materials. Studies show that water sorption causes hydrolytic degradation, leading to the extraction of unbound monomers or additives and erosion of resin-based materials in the process of filler matrix debonding. The degradation of composites is related to the swelling of the matrix, leading to the release of organic substances through the formation of pores [31]. Glass ionomers present the ability to absorb acidic fluids and pigments found in sports drinks. Acid and pigment penetration is possible due to water acting as a medium. This process leads to material degradation and increases in surface roughness. The matrix component of glass ionomers degrade under exposure to acidic environments [13]. It can be concluded that glass ionomer restorations are vulnerable to water sorption and its consequences; however, the degree of degradation depends on the summative time of exposure.
The erosive potential of sports drinks is mostly related to the titratable acidity level [32]. Most sports drinks’ pH values oscillate from 3.16 to 3.70 [9]. Studies show that acidic beverages dissolve organic matrix, weakening the mechanical properties of the material [29]. The authors also pay attention to the composition of the beverage. Many sports drinks contain citric acid, a strong inorganic acid with highly corrosive properties. The presence of such ingredients in the product’s composition may lead to more substantial erosive potential despite presenting a slightly higher pH than commonly consumed beverages like orange juice or cola [30,31].
Kose et al. [27] pointed out that glass ionomer restorations were prepared without a resin coating, which could protect the material from the erosive potential of sports drinks. On the other hand, Yazkan et al. [32] observed that applying resin coating only increased the material’s resistance for a short period. After one week of exposure to sports drinks, all materials tested in the study showed a significant change in surface roughness.

4.1. Strengths and Limitations

This review offers a comprehensive synthesis of available evidence on the effects of sports drinks on the surface roughness of restorative materials; however, several limitations must be acknowledged to critically appraise the strength of its conclusions. A prominent limitation was the substantial heterogeneity in the experimental designs of the included studies. There was a wide variation in terms of immersion protocols, sample sizes, and beverage compositions, which limited the comparability of outcomes and the generalizability of the results. The authors agreeably present that the major methodological challenge was a precise simulation of the oral cavity environment [27,31,32]. Factors observed in clinical situations, such as the buffering capacity of saliva, dietary habits, oral hygiene, and patient-related factors, could not be implemented in in vitro studies. Vaidya et al. [31] suggested that, despite the usage of artificial saliva and proper care during sample preparation, the results of the study should be implemented in the clinical trial.
We also observed that researchers significantly differed in exposure duration, creating a lack of standardized immersion conditions. Some of the studies used continuous 24 h exposure to material in sports drinks [12,13,27,30], while, in other studies, exposure consisted of one to three daily immersions lasting 5 to 10 min [25,28,31,32]. The most extended exposure times were implemented in the research carried out by Al-Samadani. [12]. Immersion periods were estimated at 1 month, 3 months, and 6 months of continuous exposure. Another study of the same author’s design included 1-day, 1-week, and 1-month aging periods [13]. Other researchers also executed the model of continuous immersion, with 7 days of exposure [27], 7-day and 14-day periods [30], and 22.5 days of exposure [29]. The study conducted by Kolarovszki et al. [26] relied on only one 30 min immersion. Some studies executed a model of short immersion in test beverages mixed with immersion in control beverages. Elmarakby et al. [25] implemented a 5 min immersion in a test beverage, and samples were stored in distilled water. The process was repeated for 14 days. In other research, the executed methodology was similar; however, test immersions lasted 10 min, and the aging period was prolonged to 28 days [28]. Vaidya et al. [31] used a model of 5 min test immersion repeated for 30 days, and the samples were stored in artificial saliva instead of distilled water. In the study by Yazkan et al. [25], the exposure model consisted of three daily test immersions for 5 min. The materials were aged for 1 day, 1 week, and 1 month. These differences in exposure conditions could affect the credibility of the obtained results regarding the degree of degradation of materials.
Moreover, considerable variability was observed in the measurement techniques for surface roughness. The use of different profilometry devices (e.g., contact vs. non-contact profilometers, atomic force microscopy) and reporting units (such as Ra values expressed in nanometers versus micrometers) may introduce significant measurement bias. These discrepancies can obscure true differences or similarities between materials and reduce the reliability of inter-study comparisons. Also, observed publication bias could affect the reliability of pooled outcomes.

4.2. Clinical Implications and Future Research Directions

To enhance the clinical applicability of future research, it is essential to adopt standardized experimental protocols that closely replicate the dynamic intraoral environment. This includes simulating factors such as intermittent exposure to staining agents, thermal fluctuations, mechanical wear, and the presence of saliva substitutes. Moreover, longitudinal in vivo investigations and controlled randomized clinical trials are strongly encouraged to validate the clinical significance of material degradation observed under laboratory conditions.
While the meta-analysis reports statistically significant changes in surface roughness, the clinical implications of these findings warrant further contextualization. In the oral environment, even minor increases in surface roughness can significantly impact plaque accumulation and esthetic outcomes. Furthermore, surface roughness influences the color stability of restorative materials. For instance, materials with higher roughness values are more susceptible to staining agents, leading to perceptible color changes that may compromise esthetic longevity.
Therefore, interpreting roughness data in light of clinically relevant thresholds is crucial for translating laboratory outcomes into meaningful clinical recommendations. It is important to explore potential protective strategies that may mitigate the erosive impact of acidic beverages on restorative materials. Surface coatings have demonstrated potential in forming a barrier against acid penetration and reducing surface degradation. Similarly, implementing effective post-restorative polishing protocols can help achieve and maintain low surface roughness, thereby enhancing resistance to staining and bacterial colonization.
Additionally, while this study focuses on sports drinks, comparing their effects with those of other commonly consumed acidic substances, such as citrus juices and carbonated soft drinks, would provide a more comprehensive understanding of dietary risks. Incorporating such comparisons would not only broaden the relevance of the present findings but also align them more closely with real-world dietary behaviors and preventive dental care.

5. Conclusions

Regular sports drink consumption is associated with increased surface roughness of dental materials. Glass ionomer materials are less resistant to acidic sports drinks than resin composites. Despite the systematic review, the degree of material degradation presented by in vitro studies cannot be directly extrapolated to oral conditions due to factors such as the buffering capacity of saliva or irregular exposure times to sports drinks.

Author Contributions

Conceptualisation, F.P. and K.N.; methodology, F.P. and K.N.; formal analysis, F.P. and K.N.; investigation and data curation, F.P., W.M. and K.N.; writing—original draft preparation, F.P. and W.M.; writing—review and editing, K.N.; visualization, K.N.; supervision, K.N. All authors have read and agreed to the published version of the manuscript.

Funding

This research received no external funding.

Data Availability Statement

No new data were created or analyzed in this study.

Conflicts of Interest

The authors declare no conflicts of interest.

References

  1. Dipalma, G.; Inchingolo, F.; Patano, A.; Guglielmo, M.; Palumbo, I.; Campanelli, M.; Inchingolo, A.D.; Malcangi, G.; Palermo, A.; Tartaglia, F.C.; et al. Dental Erosion and the Role of Saliva: A Systematic Review. Eur. Rev. Med. Pharmacol. Sci. 2023, 27, 10651–10660. [Google Scholar] [CrossRef] [PubMed]
  2. Donovan, T.; Nguyen-Ngoc, C.; Abd Alraheam, I.; Irusa, K. Contemporary Diagnosis and Management of Dental Erosion. J. Esthet. Restor. Dent. 2021, 33, 78–87. [Google Scholar] [CrossRef] [PubMed]
  3. Inchingolo, A.M.; Malcangi, G.; Ferrante, L.; Del Vecchio, G.; Viapiano, F.; Mancini, A.; Inchingolo, F.; Inchingolo, A.D.; Di Venere, D.; Dipalma, G.; et al. Damage from Carbonated Soft Drinks on Enamel: A Systematic Review. Nutrients 2023, 15, 1785. [Google Scholar] [CrossRef] [PubMed]
  4. Mehta, L.K.; Hegde, A.; Thomas, A.; Virdi, M.S. Acidogenic Potential of Packaged Fruit Juices and Its Effect on Plaque and Salivary pH. Int. J. Clin. Pediatr. Dent. 2019, 12, 312–317. [Google Scholar] [CrossRef]
  5. Reddy, A.; Norris, D.F.; Momeni, S.S.; Waldo, B.; Ruby, J.D. The pH of Beverages in the United States. J. Am. Dent. Assoc. 2016, 147, 255–263. [Google Scholar] [CrossRef]
  6. Nijakowski, K.; Walerczyk-Sas, A.; Surdacka, A. Regular Physical Activity as a Potential Risk Factor for Erosive Lesions in Adolescents. Int. J. Environ. Res. Public Health 2020, 17, 3002. [Google Scholar] [CrossRef]
  7. Hengtrakool, C.; Kukiattrakoon, B.; Kedjarune-Leggat, U. Effect of Naturally Acidic Agents on Microhardness and Surface Micromorphology of Restorative Materials. Eur. J. Dent. 2011, 5, 89–100. [Google Scholar]
  8. Kanzow, P.; Wegehaupt, F.J.; Attin, T.; Wiegand, A. Etiology and Pathogenesis of Dental Erosion. Quintessence Int. 2016, 47, 275–278. [Google Scholar] [CrossRef]
  9. Nijakowski, K.; Zdrojewski, J.; Nowak, M.; Podgórski, F.; Surdacka, A. Regular Physical Activity and Dental Erosion: A Systematic Review. Appl. Sci. 2022, 12, 1099. [Google Scholar] [CrossRef]
  10. Lussi, A.; Jaeggi, T.; Zero, D. The Role of Diet in the Aetiology of Dental Erosion. Caries Res. 2004, 38, 34–44. [Google Scholar] [CrossRef]
  11. Kitasako, Y.; Sasaki, Y.; Takagaki, T.; Sadr, A.; Tagami, J. Age-Specific Prevalence of Erosive Tooth Wear by Acidic Diet and Gastroesophageal Reflux in Japan. J. Dent. 2015, 43, 418–423. [Google Scholar] [CrossRef] [PubMed]
  12. Al-Samadani, K.H. Effect of Energy Drinks on the Surface Texture of Nanofilled Composite Resin. J. Contemp. Dent. Pract. 2013, 14, 830–835. [Google Scholar] [CrossRef] [PubMed]
  13. Al-Samadani, K.H. Influence of Energy Beverages on the Surface Texture of Glass Lonomer Restorative Materials. J. Contemp. Dent. Pract. 2017, 18, 937–942. [Google Scholar] [CrossRef]
  14. Da Silva, M.A.B.; Vitti, R.P.; Sinhoreti, M.A.C.; Consani, R.L.X.; da Silva, J.G., Jr.; Tonholo, J. Evaluation of the Surface Roughness and Microleakage of Dental Composites Exposed to Different Beverages. J. Contemp. Dent. Pract. 2015, 16, 800–804. [Google Scholar] [CrossRef]
  15. Ilday, N.; Bayindir, Y.Z.; Erdem, V. Effect of Three Different Acidic Beverages on Surface Characteristics of Composite Resin Restorative Materials. Mater. Res. Innov. 2010, 14, 385–391. [Google Scholar] [CrossRef]
  16. Maganur, P.D.C.; Prabhakar, A.R.; Sugandhan, S.; Namineni, S. Evaluation of Microleakage of RMGIC and Flowable Composite Immersed in Soft Drink and Fresh Fruit Juice: An In Vitro Study. Int. J. Clin. Pediatr. Dent. 2010, 3, 153–161. [Google Scholar] [CrossRef]
  17. Erdemir, U.; Yildiz, E.; Eren, M.M. Effects of Sports Drinks on Color Stability of Nanofilled and Microhybrid Composites After Long-Term Immersion. J. Dent. 2012, 40, e55–e63. [Google Scholar] [CrossRef]
  18. Alkhadim, Y.K.; Hulbah, M.J.; Nassar, H.M. Color Shift, Color Stability, and Post-Polishing Surface Roughness of Esthetic Resin Composites. Materials 2020, 13, 1376. [Google Scholar] [CrossRef]
  19. Ge, K.X.; Quock, R.; Chu, C.-H.; Yu, O.Y. The Preventive Effect of Glass Ionomer Restorations on New Caries Formation: A Systematic Review and Meta-Analysis. J. Dent. 2022, 125, 104272. [Google Scholar] [CrossRef]
  20. Durrant, L.; Mutahar, M.; Daghrery, A.A.; Albar, N.H.; Alwadai, G.S.; Alqahtani, S.A.; Al Dehailan, L.A.; Abogazalah, N.N.; Alamoudi, N.A.; Al Moaleem, M.M. Clinical Performance of Glass Ionomer Cement in Load-Bearing Restorations: A Systematic Review. Med. Sci. Monit. 2024, 30, e943489. [Google Scholar] [CrossRef]
  21. Dutra, D.; Pereira, G.; Kantorski, K.; Valandro, L.; Zanatta, F. Does Finishing and Polishing of Restorative Materials Affect Bacterial Adhesion and Biofilm Formation? A Systematic Review. Oper. Dent. 2018, 43, E37–E52. [Google Scholar] [CrossRef] [PubMed]
  22. Paolone, G.; Mandurino, M.; Scotti, N.; Cantatore, G.; Blatz, M.B. Color Stability of Bulk-Fill Compared to Conventional Resin-Based Composites: A Scoping Review. J. Esthet. Restor. Dent. 2023, 35, 657–676. [Google Scholar] [CrossRef]
  23. Page, M.J.; McKenzie, J.; Bossuyt, P.; Boutron, I.; Hoffmann, T.; Mulrow, C.D.; Shamseer, L.; Tetzlaff, J.; Akl, E.; Brennan, S.E.; et al. The PRISMA 2020 Statement: An Updated Guideline for Reporting Systematic Reviews. BMJ 2021, 372, n71. [Google Scholar]
  24. Study Quality Assessment Tools | NHLBI, NIH. Available online: https://www.nhlbi.nih.gov/health-topics/study-quality-assessment-tools (accessed on 22 August 2020).
  25. Elmarakby, A.M.; Alanazi, A.M.; Alotaibi, N.; Bahrain, I.A.; Alshamali, R.; Ameer, S.M.; Lsloom, S.; Khaled, H. Evaluation of Surface Roughness of Different Esthetic Restorative Materials after Immersion in Different Acidic Media. Open Access Maced. J. Med. Sci. 2022, 10, 471–476. [Google Scholar] [CrossRef]
  26. Kolarovszki, B.; Sándor, A.; Szabó, P.; Kopniczky, J.; Frank, D.; Nagy, Á.; Turzó, K. Energy Drinks Alter the Surface Morphology and Roughness of Composites, Fissure Sealants and Titanium: An In Vitro Study. Heliyon 2022, 8, e10764. [Google Scholar] [CrossRef]
  27. Kose, H.D.; Giray, I.; Boyacioglu, H.; Turkun, L.S. Can Energy Drinks Affect the Surface Quality of Bioactive Restorative Materials? BMC Ora. Health 2024, 24, 1011. [Google Scholar] [CrossRef]
  28. Kumavat, V.; Raghvendra, S.S.; Vyavahare, N.; Khare, U.; Kotadia, P. Effect of Alcoholic and Non-Alcoholic Beverages on Color Stability, Surface Roughness and Fracture Toughness of Resin Composites: An in Vitro Study. IIOAB J. 2016, 7, 48–54. [Google Scholar]
  29. Santin, D.C.; Naufel, F.S.; Mondelli, R.F.L.; Piccolotto, A.; Schmitt, V.L. Effect of Sports Drinks on the Surface Properties of Composite Resins After Prolonged Exposure-In Vitro Study. Braz. J. Oral Sci. 2019, 18, e191651. [Google Scholar] [CrossRef]
  30. Tanthanuch, S.; Kukiattrakoon, B.; Thongsroi, T.; Saesaw, P.; Pongpaiboon, N.; Saewong, S. In Vitro Surface and Color Changes of Tooth-Colored Restorative Materials after Sport and Energy Drink Cyclic Immersions. BMC Oral Health 2022, 22, 578. [Google Scholar] [CrossRef]
  31. Vaidya, N.; Kumar, P.; Pathak, K.; Punia, S.; Choudhary, A.; Patnana, A. Comparative Evaluation of the Influence of Different Sports/Energy Drinks and Alcoholic Beverages on the Surface Roughness of Three Different Flowable Esthetic Restorative Materials: An in Vitro Analysis. J. Int. Soc. Prev. Community Dent. 2020, 10, 585–590. [Google Scholar] [CrossRef]
  32. Yazkan, B. Surface Degradation Evaluation of Different Self-Adhesive Restorative Materials after Prolonged Energy Drinks Exposure. J. Esthet. Restor. Dent. 2020, 32, 707–714. [Google Scholar] [CrossRef] [PubMed]
  33. Lehmann, A.; Nijakowski, K.; Nowakowska, M.; Woś, P.; Misiaszek, M.; Surdacka, A. Influence of Selected Restorative Materials on the Environmental pH: In Vitro Comparative Study. Appl. Sci. 2021, 11, 11975. [Google Scholar] [CrossRef]
  34. Lehmann, A.; Nijakowski, K.; Jankowski, J.; Donnermeyer, D.; Palma, P.J.; Drobac, M.; Martins, J.F.B.; Pertek Hatipoğlu, F.; Tulegenova, I.; Javed, M.Q.; et al. Awareness of Possible Complications Associated with Direct Composite Restorations: A Multinational Survey Among Dentists from 13 Countries with Meta-Analysis. J. Dent. 2024, 145, 105009. [Google Scholar] [CrossRef] [PubMed]
Figure 1. PRISMA flow diagram presenting search strategy.
Jcs 09 00234 g001
Figure 2. Quality assessment, including the main potential risk of bias (risk level: green—low, yellow—unspecified, red—high; quality score: green—good, yellow—intermediate, red—poor) [12,13,25,26,27,28,29,30,31,32].
Jcs 09 00234 g002
Figure 3. The forest plot presenting the standardized mean differences in roughness increase due to 1-week exposure to energy drinks (subgrouping comparison p-value 0.530; Egger’s test p-value < 0.001) [13,27,30,32].
Jcs 09 00234 g003
Figure 4. The forest plot presenting the standardized mean differences in roughness increase due to 1-week exposure to energy drinks versus control samples (subgrouping comparison p-value 0.376; Egger’s test p-value < 0.001) [13,27,30,32].
Jcs 09 00234 g004
Figure 5. The forest plot presenting the standardized mean differences in roughness increase due to 1-month exposure to energy drinks (subgrouping comparison p-value 0.034; Egger’s test p-value 0.099) [12,13,29,32].
Jcs 09 00234 g005
Figure 6. The forest plot presenting the standardized mean differences in roughness increase due to 1-month exposure to energy drinks versus control samples (subgrouping comparison p-value 0.024; Egger’s test p-value 0.011) [12,13,29,32].
Jcs 09 00234 g006
Table 1. Inclusion and exclusion criteria according to PICOS.
ParameterInclusion CriteriaExclusion Criteria
PopulationDental composite or glass ionomer samplesSamples from other dental materials
InterventionExposure on sport drinks
ComparisonNot applicable
OutcomesDetermined roughness parametersDetermined other technical or esthetical parameters
Study designIn vitro studiesOther original articles, literature reviews, case reports, letters to the editor, conference reports
Published after 1 January 2005Not published in English
Table 2. Detailed characteristics of included studies.
StudyTest GroupControl GroupTest MaterialsTest BeveragesControl BeverageExposure DurationOutcome MeasureEvaluation MethodsMain Findings
Al-Samadani, 2013 [12]4515Composites (n = 60):
Filtek Z350 XT (n = 20),
Tetric EvoCeram (n = 20),
Filtek Z250 XT (n = 20)
Red Bull (n = 15),
Bison (n = 15),
Power Horse (n = 15)
Distilled water1 month (n = 15),
3 months (n = 15),
6 months (n = 15)
Ra in nmSurface scanning interferometry (Contour GT-K0 BRUKER—USA)The three resin tested composite materials in the study revealed significant surface roughness changes after 6 months of immersion in the three types of solutions.
Al-Samadani, 2017 [13]4515Glass ionomers (n = 60):
Ionofil Plus AC (n = 20),
GC EQUIA (n = 20), Ketac Molar (n = 20)
Code Red (n = 15),
Red Bull (n = 15),
Power Horse (n = 15)
Distilled water1 day (n = 15),
1 week (n = 15),
1 month (n = 15)
Ra in nmSurface scanning interferometry (Contour GT-K0 BRUKER—USA)The three tested materials in this study revealed significant surface roughness changes post periods of immersion time—1 day, 1 week, and 1 month—in all groups of solutions.
Elmarakby et al., 2022 [25]45n/aComposites (n = 45):
Ceram.x sphereTEC one (n = 15),
Filtek Z350 XT (n = 15),
Tetric N-Ceram Refill (n = 15)
Coke Cola (n = 9),
orange juice (n = 9),
Pepsi (n = 9),
Bison (n = 9),
lemon juice (n = 9)
n/a5 min immersion in beverage, then immersion in distilled water, repeated for 14 daysRa in µmProfilometer (Talysurf CLI 1000, Leicester, England)Lemon juice had an aggressive effect on the surface roughness of the three types of composites.
Kolarovszki et al., 2022 [26]3030Composites (n = 30):
Grandio Seal (n = 10),
Filtek Z250 (n = 10),
Estelite Sigma Quick (n = 10)
Burn (n = 15),
Hell (n = 15)
Cleaning protocol: soaked for 15 min in 70% ethanol and placed in distilled water for 10 min30 minRa in nmAFM (PSIA XE-100 instrument, PSIA Inc., South Korea)Energy drinks caused a significant change in the surface roughness and morphology of the various dental materials.
Kose et al., 2024 [27]12040Glass ionomers (n = 40):
Equia Forte HT (n = 40);
Composites (n = 40):
Charisma Diamond One (n = 40);
Bioactive materials (n = 80):
Activa BioActive Restorative (n = 40),
Activa Presto (n = 40)
Powerade (n = 40),
Burn (n = 40),
Monster (n = 40)
Distilled water7 daysRa in µmSurface profilometer (SurfTest SJ-301, Mitutoyo, Tokyo, Japan)All the materials were affected by the acidic environment. GI exhibited the highest surface roughness of all the immersed energy drinks.
Kumavat et al., 2016 [28]8012Composites (n = 92):
Tetric N-Ceram (n = 46),
G–aenial (n = 46)
Sparkling wine (n = 20),
Jamun juice (n = 20),
Red Bull (n = 20),
Cola drink (n = 20)
Distilled water10 min immersion in beverage, then immersion in distilled water, repeated for 28 daysRa in µmProfilometer, Hommel Tester T500 (Hommelwerke GmbH)Both materials became stained and rougher after they were subjected to the immersion regimen. This can be ascribed to the capability of acidic media to soften resin-based restorative materials.
Santin et al., 2019 [29]4020Composites (n = 60):
Filtek Z350 (n = 30),
Empress Direct (n = 30)
Maltodextrin (n = 20),
whey protein (n = 20)
Distilled waterDistilled water—1 week;
Maltodextrin—renewed 2× daily for 22.5 days;
whey protein—renewed 2× daily for 7.5 days + 15 days in distilled water
Ra in µmSurfcorder SE1700 surface roughness measuring instrument (Kosaka Corp, Tokyo, Japan)The results showed that the composite resins exposed to whey protein were mostly affected, potentially for being protein-based.
Tanthanuch et al., 2022 [30]9648; + 3 samples for surface micromorphology examinationComposites (n = 98):
Filtek One Bulk Fill Posterior Restorative (n = 49),
Premise (n = 49);
Glass ionomers (n = 49):
Ketac Universal (n = 49)
Sponsor Sport drink (n = 48),
M-150 energy drink (n = 48)
Distilled water7 days, 14 daysRa in µmProfilometer (model SE2300, Surfcorder, Kosaka Laboratory, Tokyo, Japan)The glass ionomer restorative material had a greater increase in surface roughness than that of nanohybrid and bulk-fill resin composite, respectively.
Vaidya et al., 2020 [31]18030Giomer (n = 70),
compomer (n = 70),
composite (n = 70)
Gatorade (n = 30),
Red Bull (n = 30),
Sting (n = 30),
beer (n = 30),
vodka (n = 30),
whiskey (n = 30)
Distilled water5 min immersion in beverage, then immersion in artificial saliva, repeated for 30 daysRa in µmProfilometry (Surftest SJ-210, MITUTOYO)Composites showed minimum surface roughness followed by Giomer, whereas compomers showed the maximum surface roughness.
Yazkan, 2020 [32]11739Alkasite (n = 52):
Cention N (n = 52);
Glass ionomer (n = 52):
Equia Forte (n = 52);
Glass carbomer (n = 52):
GCP Fill (n = 52)
Red Bull (n = 39),
Burn (n = 39),
Coca-cola (n = 39)
Distilled waterImmersed three times daily for 5 min, aged for
1 day, 1 week, and 1 month
Ra in µm3D non-contact optical profilometer (PS50 Nanovea, 6 Morgan Ste 156, Irvine, California)All three self-adhesive materials were similarly affected by the same beverage.
Disclaimer/Publisher’s Note: The statements, opinions and data contained in all publications are solely those of the individual author(s) and contributor(s) and not of MDPI and/or the editor(s). MDPI and/or the editor(s) disclaim responsibility for any injury to people or property resulting from any ideas, methods, instructions or products referred to in the content.

