Article

Enhancing the Sustainability of Concrete by Adding Recycled Sand and Silica Fume Along with Human Hair Fibers

by
Nadim I. Shbeeb
1,2,† and
Mohammad Nadeem Akhtar
1,*
1
Department of Civil Engineering, Faculty of Engineering, Fahad Bin Sultan University, P.O. Box 15700, Tabuk 71454, Saudi Arabia
2
Civil Engineering Department, Faculty of Engineering, Jordan University of Science and Technology, P.O. Box 3030, Irbid 22110, Jordan
*
Author to whom correspondence should be addressed.
On leave from Jordan University of Science and Technology.
J. Compos. Sci. 2025, 9(5), 216; https://doi.org/10.3390/jcs9050216
Submission received: 6 March 2025 / Revised: 9 April 2025 / Accepted: 18 April 2025 / Published: 29 April 2025

Abstract

:
This experimental study produced recycled sand–silica fume–hair fiber concrete to enhance concrete sustainability. Recycled sand and silica fume can be used to address the environmental issues caused by excessive river sand mining and the carbon footprint of the concrete industry. In addition, waste hair fibers (0.5–2%) were introduced to enhance the properties of newly developed concrete mixes. The absolute volume method was employed for four newly developed sustainable concrete mixes. A 100 mm slump was set as a structural concrete requirement, which was maintained by adding 0.5%, 1%, 1.4%, 1.9%, and 2.6% of the admixture by weight of the cement to the proposed mixes. The compressive strength, splitting tensile strength, and density of the hardened concrete mixtures were estimated. The study results show that combining optimized 10% silica fume with 0.5–2% hair fibers enhanced the properties of the newly developed sustainable mixes. The slump threshold was met when 1.5% of hair fibers were mixed with 10% silica fume, 50% manufactured sand, and 50% recycled sand. However, the splitting tensile strengths of the mixes with 1.5% and 2.0% hair fibers were found to be almost the same at 5.62 MPa and 5.65 MPa, respectively. The bulk density of the mixes increased with increasing percentages of hair fibers. Furthermore, in the mixes with 1.5% and 2.0% hair fibers, the bulk density was very similar at 2.708 g/cm3 and 2.792 g/cm3, respectively. Thus, it can be concluded from the study results that concrete containing recycled sand, silica fume, and hair fibers in optimal percentages is acceptable as structural concrete.

1. Introduction

The rapid growth in the world population has been observed from the twentieth to the twenty-first century. For this reason, the efficient usage of natural resources is crucial. There is a need for sustainability in the construction sector based on its current fragile state [1,2,3]. As a part of urbanization, it is usual to notice redevelopment in societies. It is quite apparent that the need to tear down old structures and build new structures is an integral part of maintaining infrastructure. This situation is concerning, considering the scarcity of natural resources and the consequent development of sustainability issues [4,5]. The literature shows that key elements hampering the efficient use of sustainable construction materials include the active members of construction firms. Little awareness of sustainable construction materials, their high cost, and the limited availability of information are a few factors affecting the use of these materials, as highlighted by [6,7,8].
Recycling waste products offer numerous advantages, including significantly reducing water and air pollution. It aids in conserving energy and decreasing the volume of solid waste and greenhouse gas emissions. Therefore, it is crucial to examine factors that can positively impact the construction industry through the use of waste and recycled materials. This study area has become increasingly important, with researchers focusing on practices emphasizing the efficient use of appropriate, recycled, and repurposed waste materials. Due to the high demand and short supply of raw materials, they are very expensive [9]. The most prominent and widely used recycled products are recycled concrete, fly ash, silica fume, mineral wool, and gypsum, as discussed in [10]. One approach to improving the properties of recycled aggregates and their environmental efficacy is biocement. However, the appropriate usage of nanomaterials and pozzolana, as well as numerous mixing techniques, is also highly valued [11]. Previous studies have compared each approach’s benefits and drawbacks, ways to recycle coarse and fine aggregates, silica fume and hair fiber utilization worldwide, and future research directions [12,13,14].
The amount of solid waste generated worldwide grows exponentially each year [15,16]. The CDM set a target of recycling and reusing approximately 60–70% of waste in the EU to overcome this issue [15,17]. The massive amount of demolished concrete produced worldwide and the replacement of recycled aggregate concrete (RAC) with natural aggregate concrete (NAC) to reduce the adverse environmental effects have been discussed [11,18,19]. When concrete is produced with 30% RAC replacement, the strength of the resulting concrete is almost the same as that of NAC, whereas at 50% RAC replacement, a reduction in this strength is noted, and at 100% RAC replacement, a significant reduction in this strength is reported [12,20,21,22]. Additionally, adding RAC to fresh concrete requires a long curing time to obtain the required design strength. As a result, most research does not support the 100% use of RAC in place of NAC for every circumstance. The compressive strength and tensile strength of newly developed concrete made with RAC are decreased. However, the addition of up to 50% of RAC does not compromise the engineering properties of concrete [12,13,17,22,23,24].
The rising need for cement in manufacturing concrete causes excessive CO2 emissions, leading to an imbalance in the environment. The production of silica fume (SF) and its use as a replacement for cement were demonstrated by [25]. The properties of concrete are enhanced when SF is used in place of cement. Recycling SF is crucial due to the significant health hazards connected with its dumping in public places [26,27]. It has been observed [28,29] that the optimal percentage of cement replacement with SF is 10%; at this percentage, the mechanical strength of newly developed concrete was increased. The durability is improved when SF, a supplemental cementitious material (SCM), is combined with fine marble powder [30]. Human hair fibers are another interesting waste material that affects the strength characteristics of concrete. Published studies [31,32,33,34] have evaluated the strength characteristics of concrete using different percentages of human hair fibers by weight of cement, i.e., 0.5%, 1%, 1.5%, and 2%. These studies aimed to investigate the impacts of human hair fiber reinforcement on concrete. However, it was discovered that an addition of human hair between 1.5% and 2% produced the highest compressive and tensile strength.
An extensive review of the published studies showed that higher amounts of RAC in new concrete reduced its strength characteristics. However, the addition of optimized SF led to an enhancement in strength. Moreover, adding hair fibers (HFs) also improved strength up to the required values. As per the analysis, the combined effect of RAC, SF, and HF has not yet been studied. This study aimed to close the unstudied research gap through its experimental work. In this study, we added a combination of solid waste at optimized values. The design mix concrete was prepared using the absolute volume method by incorporating recycled and manufactured sand to replace 100% river sand, and 10% OPC was replaced by SF. In addition, HF (0.5–2%) was added based on the weight of cement. The final objective of this study was to produce cost-effective sustainable concrete made of combined waste without compromising its engineering properties.

2. Materials and Methods
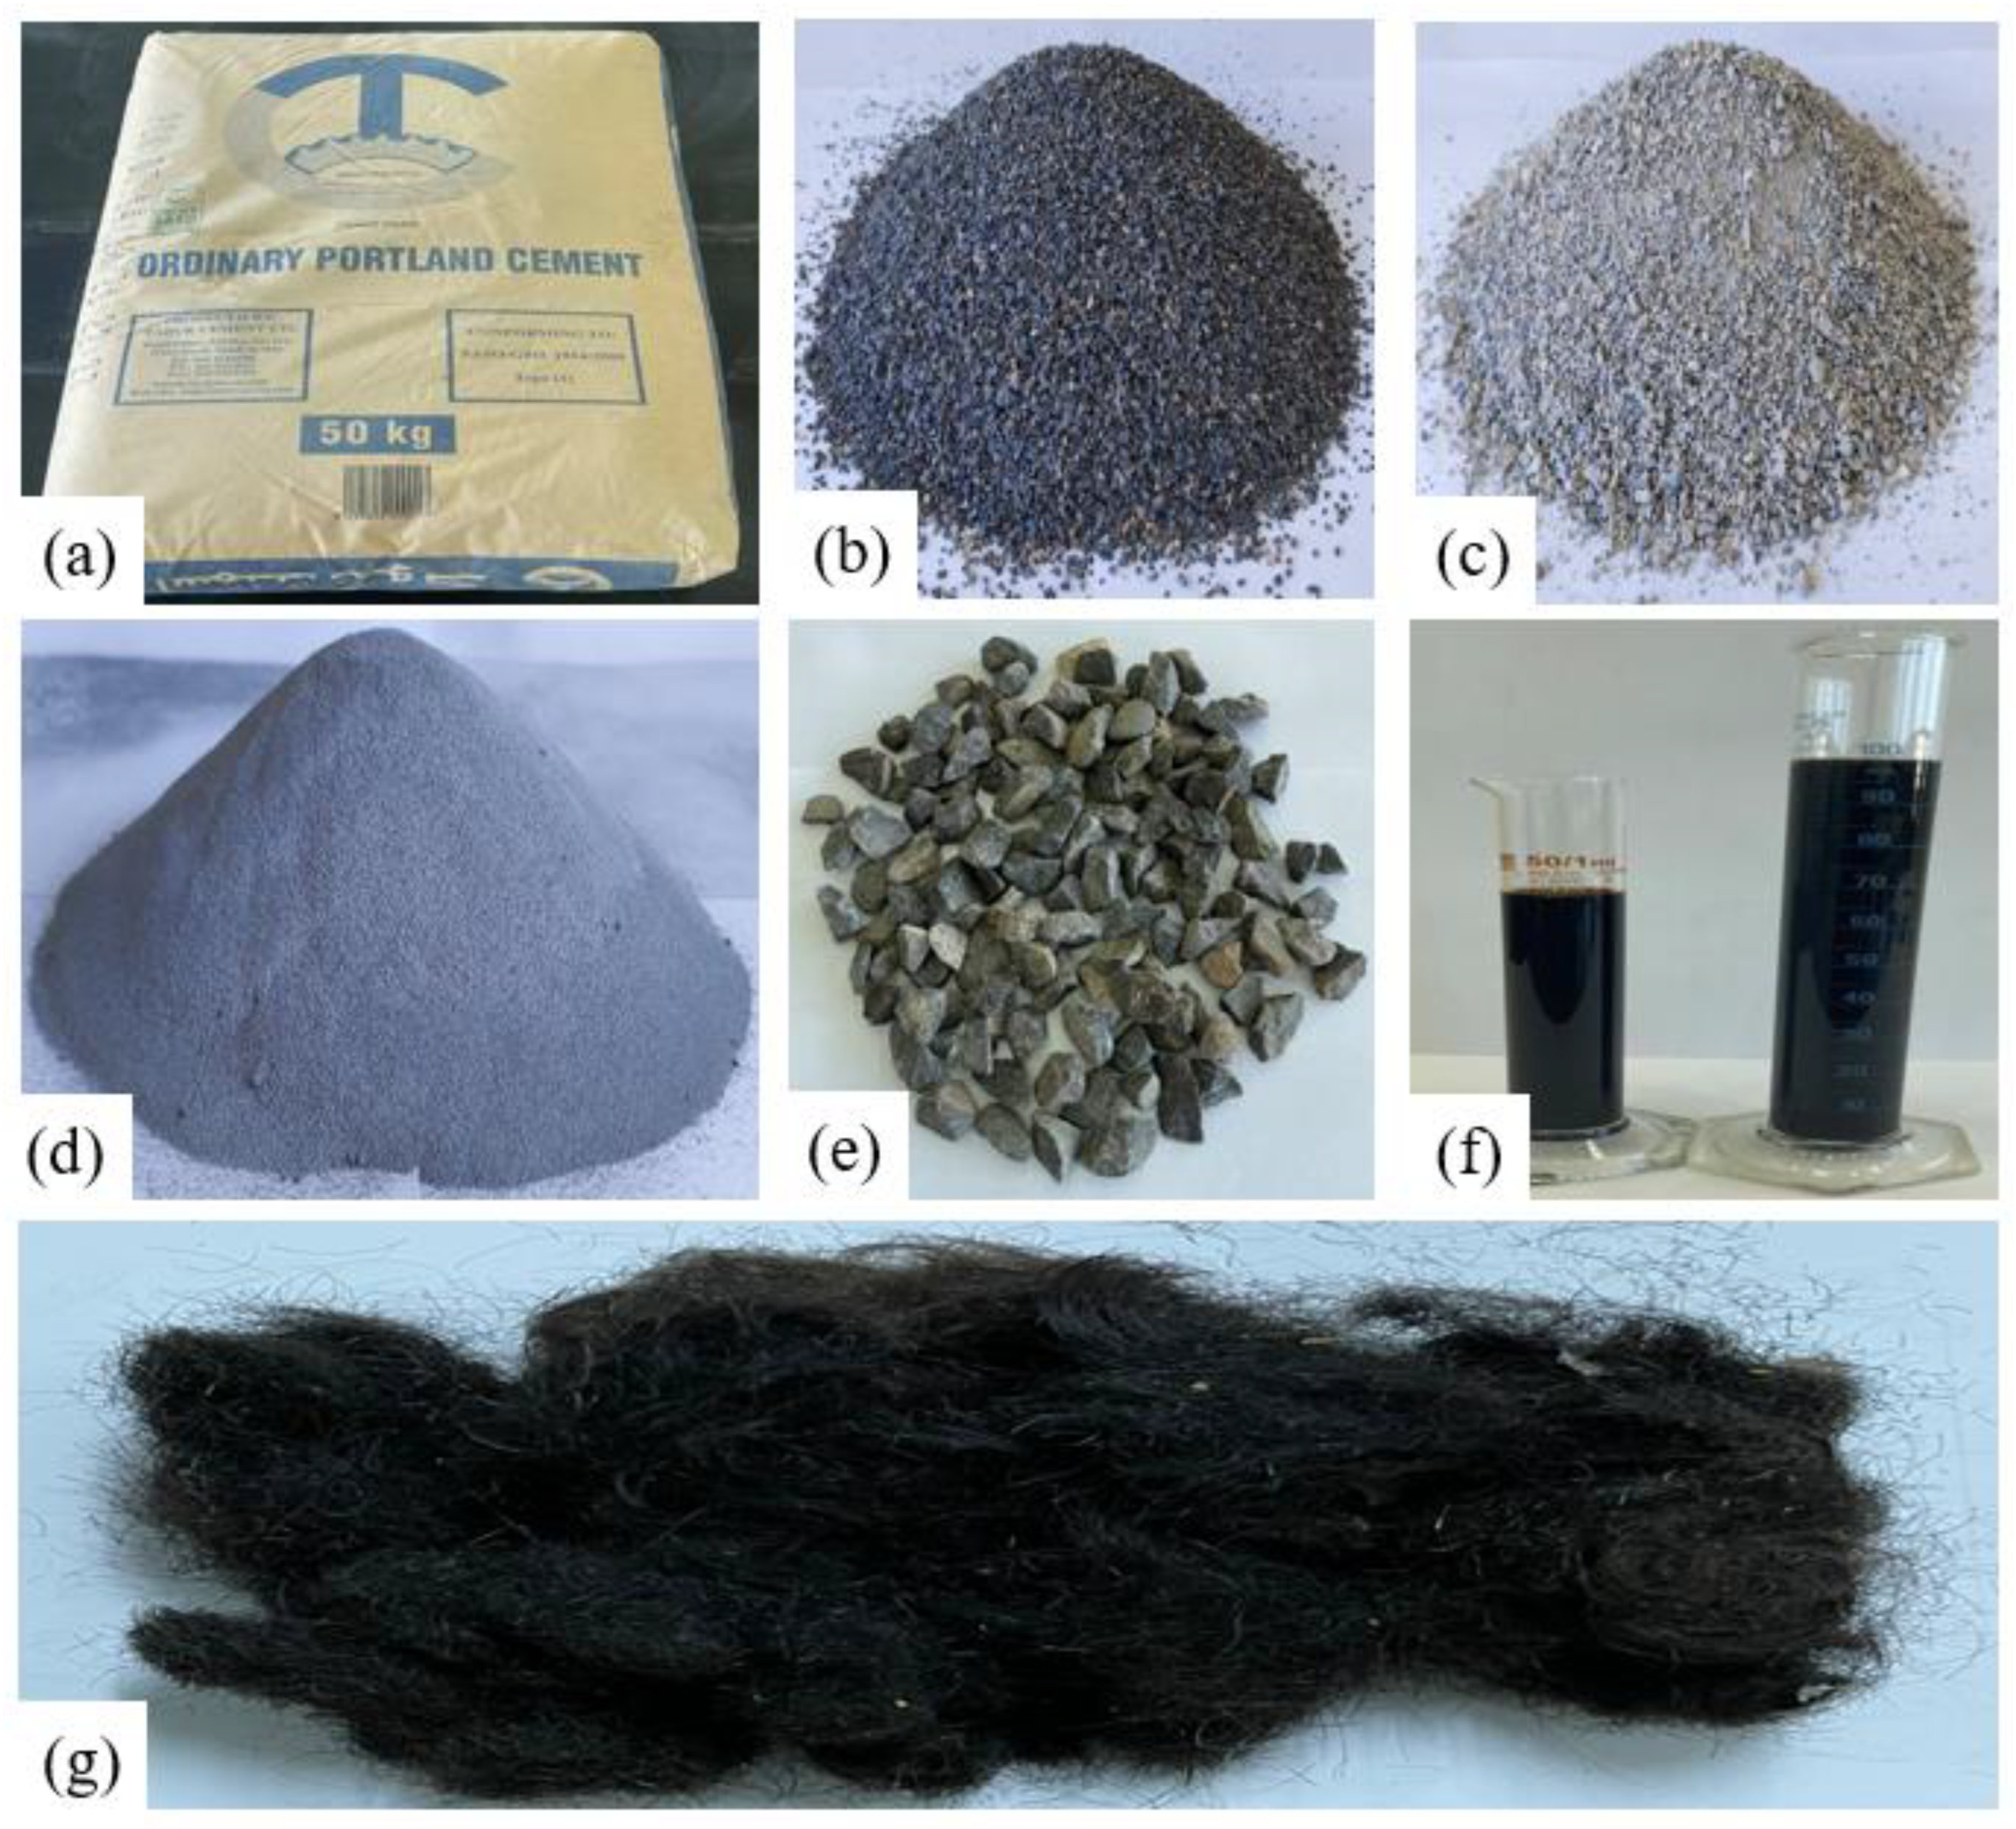
2.1. Materials

Materials for Producing Concrete

As a binder, concrete is made using ordinary Portland cement (OPC), a necessary building material. For the experimental work of this study, a single batch of type 1 brand OPC that was readily available locally was used. Figure 1a shows the cement sample utilized in this study. Silica fume (SF) is a kind of industrial waste. Microsilica is the most creative addition to concrete that has been discovered recently. Elkem Microsilica provided the product for the building material research. The material does not meet the requirements to be categorized as hazardous. Figure 1b shows the silica fume sample.
In this study, four series of sustainable concrete were created using two types of fine aggregates. Abdullah Abdin Construction Co., Ltd., Tabuk, Saudi Arabia, provides locally available manufactured sand (M-Sand). The Abdullah Abdin Construction Co., Ltd. aggregate crushing plant in Tabuk, Saudi Arabia, crushed demolished concrete to produce recycled sand (R-Sand) smaller than 5 mm. Distinct kinds of weathered concrete with differing strengths make up the distinct (EOL) concrete sources. Concrete samples that have been demolished are gathered and crushed at the Abdullah Abdin Construction Co., Ltd. aggregate crushing plant in Tabuk, Saudi Arabia. The Engineering Materials Laboratory at Fahad Bin Sultan University in Tabuk, Saudi Arabia, cleaned, washed, and sifted the sand. Figure 1c,d show the M-Sand and R-Sand, respectively.
Crushed stones and gravel in natural coarse aggregate (NCA) containing particles larger than 4.75 mm, i.e., between 9.5 and 19 mm, were obtained for this study. The NCA was graded and cleaned according to its various sizes. Crushed stones made up the remaining coarse aggregates, with gravel accounting for more than half of the total quantity. Figure 1e shows the NCA samples. As per reference [35], Figure 1f shows the type F water-reducing, high-range admixtures. The main component of the study samples was waste human hair fibers, as shown in Figure 1g. The waste human fibers were collected from barber shops and mixed before being utilized in different percentages by weight of cement. The length of the hair fibers varied from 20 to 60 mm.

2.2. Methods

The natural aggregate concrete (NAC*) contains 100% M-Sand and was used as the reference mix of this study. The 50% M-Sand + 50% R-Sand was used to prepare the four types of newly developed design mix concrete with 10% SF and 0.5–2% hair fibers in each designated mix, namely, 0.5%HFSFC, 1.0%HFSFC, 1.5%HFSFC, and 2.0%HFSFC, respectively.
The freshly prepared concrete was mixed using the absolute volume method (AVM), and workability was tested using the slump test. As per the AVM [35], the slump value of structural concrete was selected as 100 mm for each design mix. To avoid extra water, a slump-retaining concrete additive was used to preserve each mix’s 100 mm slump value. Figure 2 shows the amount of admixture that was found in different percentages by weight of cement to maintain the 100 mm slump. The different percentages of hair fibers in the mixes were used based on the optimal values of sustainable sand with 10% SF values. In the mixes NAC*, 0.5%HFSFC, 1.0%HFSFC, 1.5%HFSFC, and 2.0%HFSFC, the percentage of admixture was optimized as 0.5%, 1%, 1.4%, 1.9%, and 2.6%, respectively. The temperature of fresh mixes was noted and was also found within the AVM guidelines. The composition of the newly developed design mix concrete following the AVM is listed in Table 1. While mixing the newly developed design mix concrete, proper care was taken during the dry mixing of concrete ingredients calculated using the AVM for the mixing, placing, compacting, and filling of the samples.

3. Results and Discussion

3.1. Chemical Characterization of Developed Sand

3.1.1. SEM-EDS Instrumentation

Observing and investigating the presence of minerals in concrete can be challenging because of its often characteristic and complex microstructure. Concrete’s microstructure and mechanical qualities are altered when concrete materials are substituted. The unidentified constituents of the sustainable modified sand combinations of M-Sand and R-Sand found via chemical characterization were analyzed with an SEM-EDS analyzer. The identified constituents of the sustainable modified sand can be utilized in the hydration process for dispersal throughout the hydrated cement paste. An experimental SEM examination was performed on the developed M-Sand and R-Sand samples. This technique produced images displaying particle morphology, size, elemental composition, and specific source types. For this study, each prepared sustainable modified sand mixture has an approximate size of 5 mm. The microstructure of each blend was examined and contrasted with that of the approximation up to 10,000 times. To evaluate possible CaCO3 precipitation, reaction product analysis, C-S-H gel creation, and calcite identification were performed. The sustainable modified sand samples were subjected to EDS analysis to identify the chemical composition and concentrations of elements, focusing on C/Ti/Mn/Cd/Zn, and these elements were found to be present in the samples. The energy used for the excitation of Al and Cu is a reference point for calibration. Semi-quantitative calculations were performed using the software TEAM to determine element weight percent concentrations. The presence of an element was determined by observing its peak counts in the region of interest. The elemental ratios and morphological markers were compared to determine contributions [36,37,38].

3.1.2. Characterization of Developed Modified Sand Using SEM-EDS

The SEM analysis results captured at low-to-high magnifications of ×50, ×1500, ×5000, and ×10,000 are depicted in Figure 3 and Figure 4. Higher SEM magnification, up to 10,000×, made the surface differences more noticeable (50×, 1500×, 5000×, and 10,000×). The best images of M-Sand and R-Sand samples are shown in Figure 3 and Figure 4, respectively.
Figure 3 shows the SEM image of the modified M-Sand. The images reveal that M-Sand frequently contains traces of other minerals in addition to lime, silica, and alumina. Well-defined dense gray and brighter calcite crystal grains and scattered flat and elongated gypsum crystals and grains of inequitable particle sizes are separated, resulting in several voids. Uniform distributions of platy and layered frameworks with partially dense CaSO4 and amorphous silica are visible on the other side, and the porosity is interlinked. In comparison, particles adhere to the surfaces with many voids, even though the white/gray particle accumulations indicate the presence of alumina, quartz, and bentonite, as well as calcite or dolomite or both, at a magnification of 10,000×, as depicted in Figure 3.
Figure 4 shows the SEM image of R-Sand. Scattered angular particles and loose cotton-like structures with numerous holes are visible in the image. The spreading of porous silicate, crystalline C-H, and loose C-S-H gel formation can also be seen. At a magnification of 10,000× for rough calcium silicate, the spreading of C-S-H gels, varying-sized pores, foil-like C-S-H formations, and platy C-S-H formations are observed.
As shown in Figure 3 and Figure 4, EDS investigations were also conducted on the modified M-Sand and R-Sand to classify their chemical compositions and to identify the chemical species and their proportions in their compositions. EDS identified elements such as O, C, Al, Mg, Si, Ca, Cd, Cl, Fe, and Mn in the prepared sand combinations of M-Sand and R-Sand.

3.2. Strength Characteristics

3.2.1. Compressive Strength Evaluation

The compressive strength of the control mix NAC*, containing 100% M-Sand and 100% OPC, was assessed to compare the newly developed mixes. After several trial mixes, thresholds of sand were obtained when up to 50% R-Sand and 50% M-Sand were used to replace 100% river sand. The newly developed mixes of 0.5%HFSFC, 1.0%HFSFC, 1.5%HFSFC, and 2.0%HFSFC with a maximum of 50% R-Sand and 50% M-Sand with 10% SF, along with 0.5–2% HB, were prepared as shown in Table 1. A compressive strength testing machine with 2000 kN capacity was utilized to evaluate the compressive strength of the prepared mixes.
The 28-day concrete strength is a standard reference for evaluating compressive strength by any standard code of practice. This study measured compressive strength at 28 days of curing, as shown in Figure 5. The compressive strength of the control mix NAC* and the newly prepared concrete mixes of 0.5%HFSFC, 1.0%HFSFC, 1.5%HFSFC, and 2.0%HFSFC was found to be 36.104, 38.602, 44.041, 44.297, and 42.942 MPa, respectively. The results of the mixes 0.5%HFSFC, 1.0%HFSFC, 1.5%HFSFC, and 2.0%HFSFC meet the requirement of (f’cr) (38 MPa), as per references [39,40]. The control mix designated as NAC* had a compressive strength of 36.104 MPa, which was close to the selected target strength (f’cr) of 38 MPa. The result shows that the hair fiber–silica fume concrete combinations perform well and achieve the (f’cr) at 28 days of curing. All mixes of 0.5%HFSFC, 1.0%HFSFC, 1.5%HFSFC, and 2.0%HFSFC fulfilled all standard criteria for this study at 28 days of curing [39,40]. At 28 days of curing, the control mix NAC* fulfilled the field and design strength criteria but failed to reach the (f’cr) of 38 MPa.
Figure 5 illustrates variations in the control mix NAC* and the newly prepared concrete mixes of 0.5%HFSFC, 1.0%HFSFC, 1.5%HFSFC, and 2.0%HFSFC. In the mixes of 0.5%HFSFC, 1.0%HFSFC, 1.5%HFSFC, and 2.0%HFSFC, an increase of approximately 6.9%, 21.3%, 22%, and 18.9% in strength was recorded compared to the control mix NAC*, respectively. It is evident from Figure 5 that replacing OPC with SF along with the HF combination enhanced the compressive strength of the mixes. The optimized 10% OPC was replaced by SF. The study results suggested that the mixes 0.5%HFSFC, 1.0%HFSFC, and 1.5%HFSFC showed a continuous increment in their compressive strength. The optimal compressive strength was recorded in the mix 1.5%HFSFC (10%SF + 1.5%HF). For the combination with 10%SF + 2.0%HF, a decrease in the compressive strength value was recorded.
Combining SF + HF with OPC exhibited no reactivity until water was added. After adding water, the reaction was completed, and additional C-S-H gel was produced by increasing the SF content, which was recognized for facilitating the most vigorous crystallization. The interaction of 10% SF with cement resulted in additional C-S-H gel within the pore spaces, which enhanced the concrete’s strength and increased the matrix’s density. Incorporating an optimal ratio of the SF + HF blend led to a significant enhancement in the compressive strength due to the denser microstructure created by the increased formation of the C-S-H gel containing 10% SF and 0.5–2% HF.
Moreover, including an ideal proportion of R-Sand resulted in a significant improvement in the surface area attributable to the fine characteristics of R-Sand particles. The findings indicate an increase in the compressive strength of the mixtures. Furthermore, the observed rate of strength enhancement in the mixture could be linked to the secondary hydration process occurring with the residual cement found in the R-Sand. The R-Sand in the mixtures around the aggregates shows vulnerability during the early phases. The outcome is affected by the residual layers of the cement matrix found in the old concrete situated within the R-Sand. Over time, the gel interacts with the unhydrated cement from the preceding layer. The secondary hydration of R-Sand could occur due to the interaction between SF and R-Sand. In summary, the blend of 10%SF + 1.5%HF with 50% R-Sand exhibited the greatest compressive strength, reflecting an enhancement of around 22% compared to the reference mix NCA*.

3.2.2. Splitting Tensile Strength

Since it is challenging to test concrete directly for tensile strength, indirect tests are employed. Splitting tensile strength (STS) and flexural strength (FS) are commonly used indirect methods. This study used the STS method to assess the indirect tensile strength of concrete. This study evaluated the STS of mixes designated as 0.5%HFSFC, 1.0%HFSFC, 1.5%HFSFC, and 2.0%HFSFC, including the reference mix NAC* (100% OPC). Reference [41] recommends that the average STS value must be between 10% and 15% of (f’c). This study selects the design strength (f’c) of 30 MPa at 28 days of curing. According to the criterion proposed by reference [41], 10–15% of (f’c) retains the value of 3–4.5 MPa. The standard criteria set by reference [41] were used to validate the STS results of this study.
The load–displacement results from each mix, i.e., NAC*, 0.5%HFSFC, 1.0%HFSFC, 1.5%HFSFC, and 2.0%HFSFC, are shown in Figure 6. The maximum peak load (P) was used to compute the STS of mixes NAC*, 0.5%HFSFC, 1.0%HFSFC, 1.5%HFSFC, and 2.0%HFSFC. At the peak load, hair fiber–silica fume concrete combinations performed well and were not broken into two pieces. As and when the sample reached the peak load, sudden failure in the sample was observed. Plain concrete is sensitive and does not exhibit the elastic behavior required to hold the samples, which is the main reason for the splitting of the cylindrical samples into two halves when the load peaked. In this study, hair fiber–silica fume concrete combinations at the maximum peak load exhibited some ductile behavior, as shown in Figure 6. It is observed in Figure 6 that the lowest peak load was found in the mix NAC* without silica fume and hair fibers.
The STS of this study was calculated from the peak load (P), as shown in Figure 7, using Equation (1):
S T S = 2 P π ld
Equation (1) shows the splitting tensile strength (STS), load (P), length (l), and diameter (d).
The STS values of the prepared mixes NAC*, 0.5%HFSFC, 1.0%HFSFC, 1.5%HFSFC, and 2.0%HFSFC were assessed according to Equation (1). The numerical STS values of the mixes NAC*, 0.5%HFSFC, 1.0%HFSFC, 1.5%HFSFC, and 2.0%HFSFC are 4.62, 4.75, 4.8, 5.62, and 5.65 MPa, respectively, as shown in Figure 7. The STS of the mixes NAC*, 0.5%HFSFC, 1.0%HFSFC, 1.5%HFSFC, and 2.0%HFSFC was recorded as 15.4%, 15.8%, 16%, 18.7%, and 18.8% of the (f’c) proposed by reference [41]. The STS of the mixes 1.5%HFSFC and 2.0%HFSFC was found to be higher and almost the same at 18.7% and 18.8% of the (f’c) proposed by reference [41]. This indicates that mixing 1.5%HFSFC and 2.0%HFSFC with silica fumes and hair fibers improved the STS. The mixes 1.5%HFSFC and 2.0%HFSFC showed greater improvement in STS values compared to the other mixes.

3.3. Durability Characteristics in Terms of Density and Porosity of Prepared Samples at Hardened Stage

3.3.1. Experimental Method

To examine the durability performance of the developed modified concrete mixes, the characteristics of the prepared concrete mixes such as density and volume of permeable voids (porosity) were studied. The standard test method ASTM-C642-13 [42] was selected to evaluate the density and porosity in the hardened stage of the newly developed design mix concrete of this study. The mass of each mix prepared with or without silica fume and hair fibers was determined using the procedure mentioned in the method ASTM-C642-13 [42]. The density and porosity values were calculated using Equations (2) and (3).
The stepwise procedure for evaluating the masses of A, B, C, and D is based on the standard method ASTM-C642-13 [42]. The masses determined for A, B, C, and D are required to calculate the density and permeable voids (porosity) using Equations (2) and (3), respectively. A concrete cutter machine cut the samples into pieces with a height of 100 mm and a diameter of 75 mm. The purpose of these specific dimensions is to maintain the sample volume suggested by ASTM-C642-13 [42]. The approximate volume of samples used in this study was 500 cm3, i.e., higher than 350 cm3. As per ASTM-C642-13 [42], the volume of the samples should not be less than 350 cm3. The data obtained for the procedure described in ASTM-C642-13 [42] are reported in Table 2.

3.3.2. Density and Porosity Results of Hardened Concrete Samples
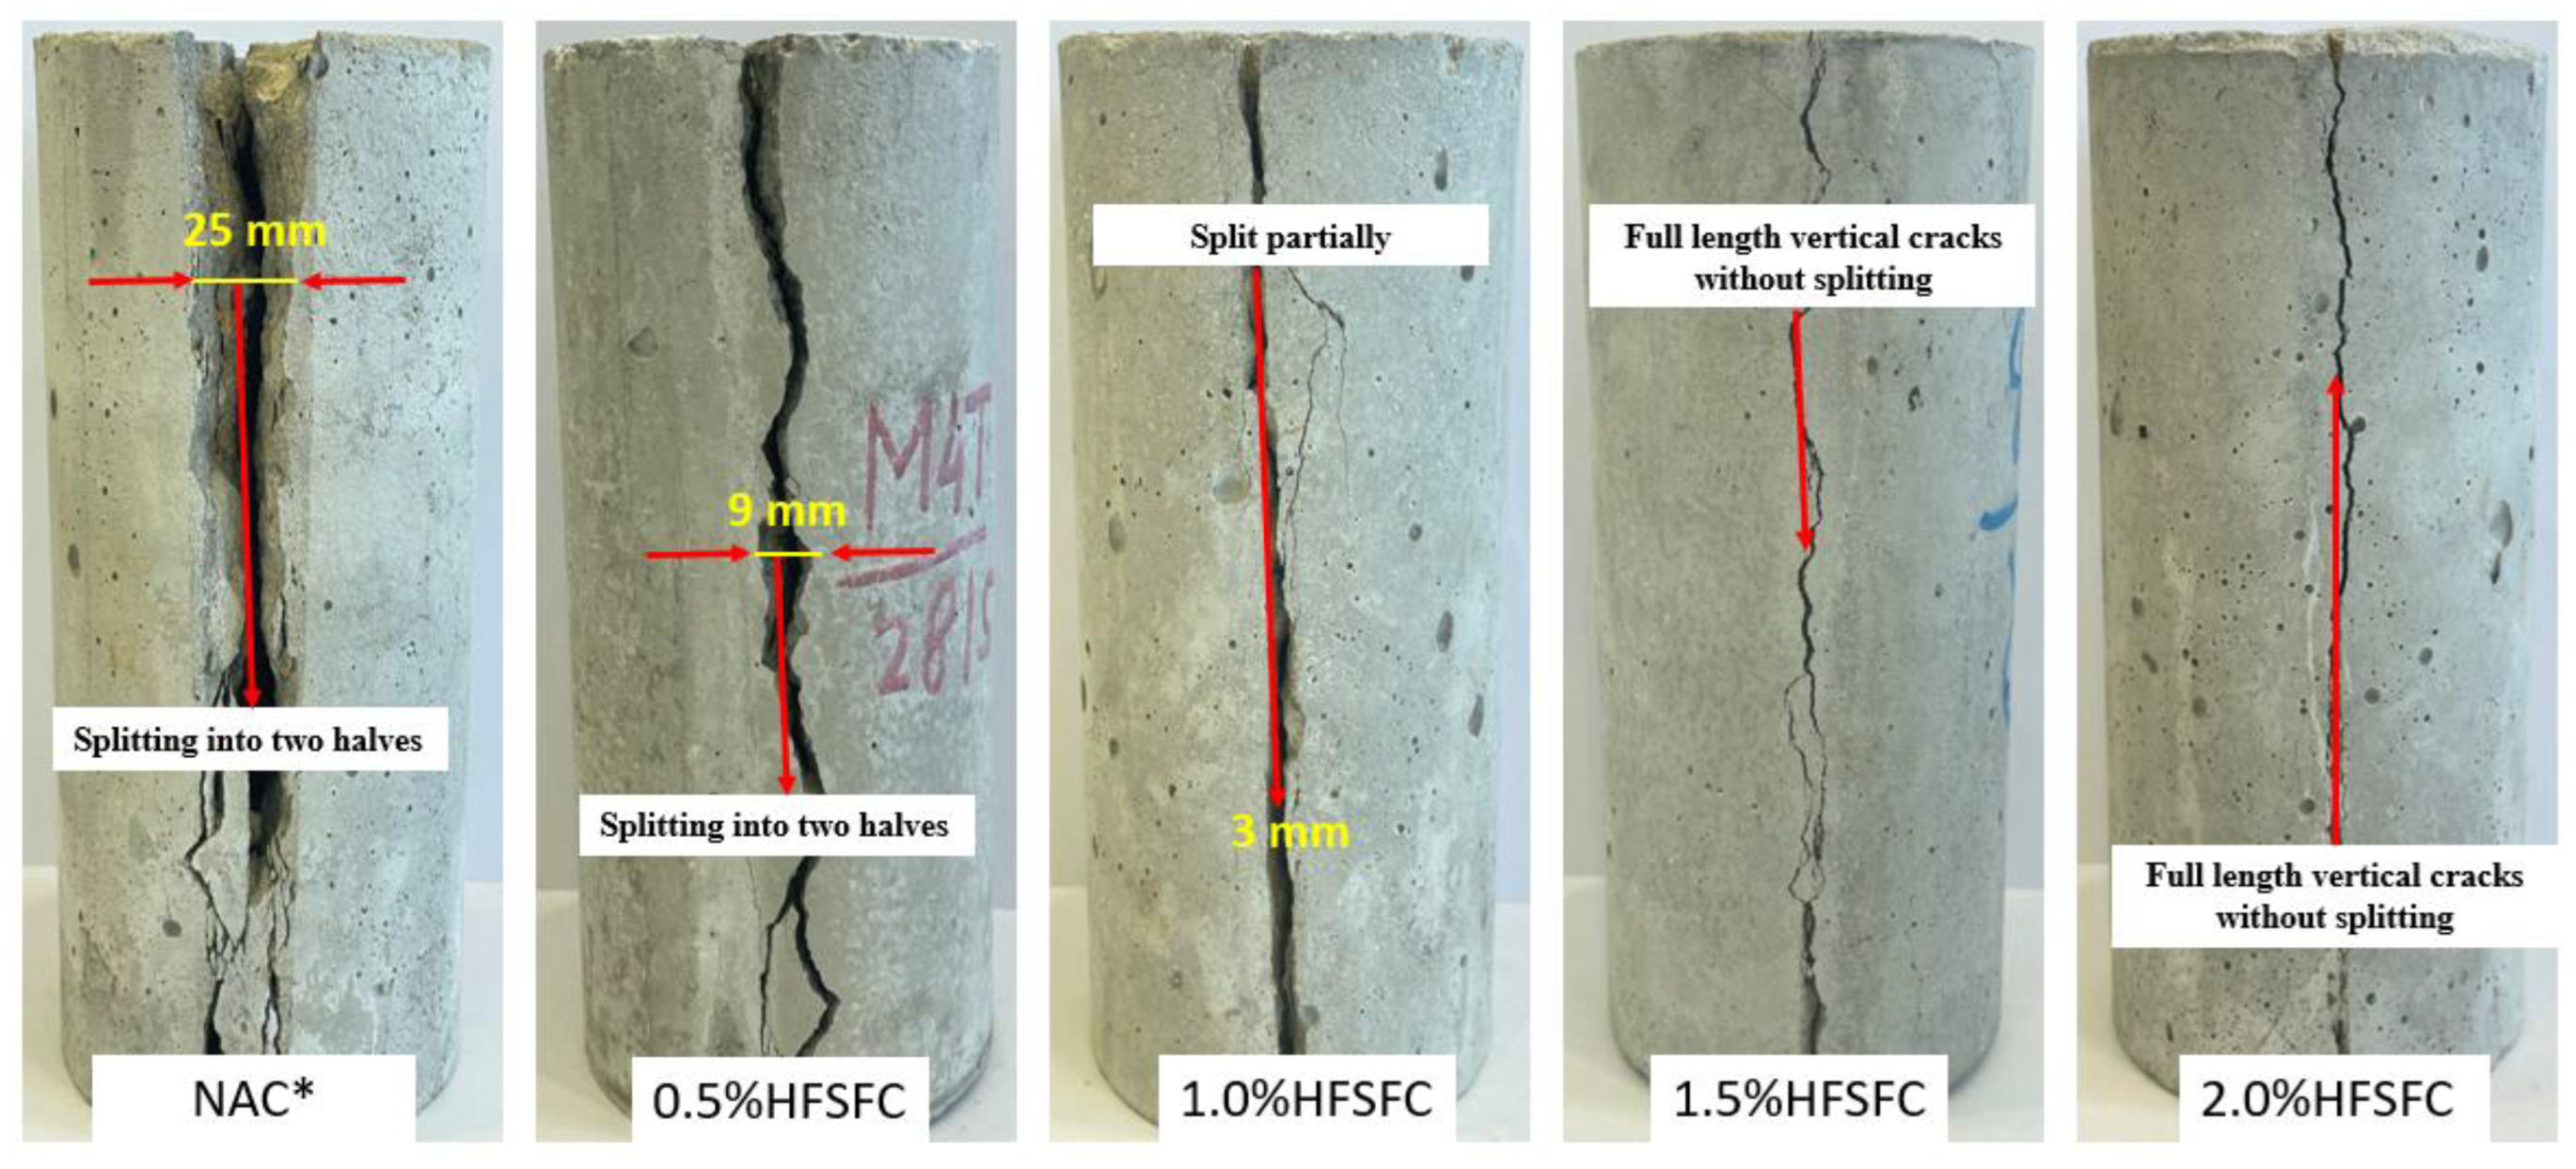
The density of the prepared concrete mixes with hair fibers and silica fume at the hardened phase was evaluated by reference [42]. The graphical representations of the bulk and apparent densities of the prepared mixes NAC*, 0.5%HFSFC, 1.0%HFSFC, 1.5%HFSFC, and 2.0%HFSFC are shown in Figure 8. The dry bulk density and apparent density values of the reference mix NAC* with 100% OPC without hair fibers and silica fume are 2.208 and 2.702 g/cm3, respectively. The experimental values of the dry bulk density (2.345, 2.390, 2.527, and 2.471 g/cm3) and apparent density (2.741, 2.769, 2.788, and 2.727 g/cm3) of the mixes 0.5%HFSFC, 1.0%HFSFC, 1.5%HFSFC, and 2.0%HFSFC with the addition of hair fibers and silica fume were obtained. The results indicate that when HF + SF was added to the mixes, the dry bulk density of 0.5%HFSFC, 1.0%HFSFC, 1.5%HFSFC, and 2.0%HFSFC increased by 6.20, 8.24, 14.45, and 11.91% when compared to the dry bulk density of the reference mix NAC*. This indicates that the unoccupied pores present in samples were filled by adding different percentages of HF + SF. It was also observed that when developing a sand combination (50% M-Sand + 50% R-Sand), the fine percentage of 50% R-Sand in the mixes is another factor that reduced the pores and enhanced the density of the combination. The addition of hair fibers in the mix that contained OPC + SF made the cement paste denser.
However, the dry bulk density increased with an increase in HF content up to 1.5% with optimized 10% SF. The dry bulk density increased when HF was added (0.5–1.5%) and 10% SF was replaced by OPC. When the HF percentage was increased to 2%, the bulk density slightly declined compared to 1.5% HF. Another factor that results in the formation of a more compact and less porous structure is the particle size of SF, which is smaller than that of OPC, thus increasing the density. It is evident from the results that the percentage increase in dry bulk density is smaller in the reference mix NAC* without HF + SF compared to the mixes with HF + SF. This indicates that SF in the samples filled the pores, and thus, the samples absorbed less water than those without SF. Thus, the newly developed concrete mixes of 0.5%HFSFC, 1.0%HFSFC, 1.5%HFSFC, and 2.0%HFSFC with HF + SF showed better density, and the required density threshold was achieved for the 1.5% HF with the optimized 10% SF combination.
Water absorption is the most helpful parameter for describing hardened concrete’s moisture dynamics that affects durability. Water absorption mainly depends on the total volume of permeable pore spaces (voids), also known as porosity. The calculated values of the total volume of permeable pore spaces (voids) in % are listed in Table 2. Figure 8 shows the porosity of the prepared mixes designated as NAC*, 0.5%HFSFC, 1.0%HFSFC, 1.5%HFSFC, and 2.0%HFSFC, in which 10% OPC was replaced by SF. The porosity of the mixes NAC*, 0.5%HFSFC, 1.0%HFSFC, 1.5%HFSFC, and 2.0%HFSFC was found to be 18.28%, 14.45%, 13.68%, 9.36%, and 9.39%, respectively. The porosity was greatly affected by the addition of HF + SF along with modified sand in the mixes of 0.5%HFSFC, 1.0%HFSFC, 1.5%HFSFC, and 2.0%HFSFC. When the HF percentage increased relative to optimized 10% SF and modified sand in the mixes, the capillary porosity of the concrete mix decreased. However, optimum HF addition produced a denser and impervious matrix, leading to a lower capillary porosity for decreased water absorption. Figure 8 compares the volume of permeable pore spaces (voids) with the dry bulk density dry. In the beginning, when 0.5% HF was added to the mix, the porosity increased. This is because the smaller amount of HF did not mix with the SF and modified sand, and ultimately, the pore spaces increased compared to the control mix. When the amount of HF increased, the porosity of the mixes reduced. It is concluded that up to 2–2.5% of HF with modified sand and an optimum 10% SF is the best substitution for the concrete developed in this study.

3.4. Crack Pattern

The failure mode under compression did not show any new observations. The typical failure modes of the mixes NAC*, 0.5%HFSFC, 1.0%HFSFC, 1.5%HFSFC, and 2.0%HFSFC during the STS tests are shown in Figure 9. The crack behavior of the mixes NAC*, 0.5%HFSFC, 1.0%HFSFC, 1.5%HFSFC, and 2.0%HFSFC at the peak load is displayed in Figure 9. The reference sample of the mix NAC* split into two parts with an average distance of 25 mm when the peak load was applied. Cylindrical samples of the mix 0.5%HFSFC showed similar trends, with an average distance of 9 mm at the peak load. The samples of the 0.5%HFSFC mix were more stable than the samples of the reference mix NAC* when 10% OPC was replaced by optimized SF and 0.5% HF by weight of OPC (10%SF + 0.5%HF) was added. It was observed that adding SF + HF improved the sample’s stability.
Further increasing the HF percentages in the 1.0%HFSFC mix with optimized 10% SF and 1.0% HF by weight of OPC (10%SF + 1.0%HF) enhanced the stability of the samples. The samples were split partially with narrow cracks of about 3 mm. When HF was increased to 1.5% by weight of OPC in the mix, the 1.5%HFSFC (10%SF + 1.5%HF) samples did not split into two halves. However, fine cracks were formed on the entire vertical depth of the samples. A similar trend was observed in the 2.0%HFSFC mix with 2% HF inclusion (10%SF + 1.5%HF). The peak load at which the cracks were formed was utilized to calculate the STS of the cylindrical samples. The load–displacement curves shown in Figure 6 validate the crack pattern of the mixes 0.5%HFSFC, 1.0%HFSFC, 1.5%HFSFC, and 2.0%HFSFC.
The reference mix NAC* with 100% OPC was found to be sensitive and did not show any elastic behavior for holding the samples. This is the main reason for the splitting of the cylindrical samples into two halves, as shown in Figure 9. The cracking patterns of the cylindrical samples with SF + HF incorporation in the mixes 0.5%HFSFC, 1.0%HFSFC, 1.5%HFSFC, and 2.0%HFSFC are shown in Figure 9. In the mixes 1.0%HFSFC, 1.5%HFSFC, and 2.0%HFSFC, samples were not broken into two halves. The quality of cement paste was improved by adding optimized 10% SF to the mixes 1.0%HFSFC, 1.5%HFSFC, and 2.0%HFSFC.
Furthermore, 50% R-Sand combined with OPC formed secondary C-S-H gel in the residual cement layers of the demolished concrete. This observation was validated using previously published studies [12,13,22,43]. Starting from the inclusion of 1% HF, the cracking load of the mixes 1.0%HFSFC, 1.5%HFSFC, and 2.0%HFSFC effectively increased and their brittleness decreased. Based on the failure mode results, it was concluded that concrete with optimized 10% SF and 0.5–2% HF content significantly improved the paste quality of the developed concrete samples.

4. Conclusions

This study aimed to develop a sustainable concrete design mix by incorporating various waste materials, specifically recycled sand, manufactured sand, silica fume, and hair fibers. The proposed formulation, referred to as recycled sand–silica fume–hair fiber concrete (HFSFC), was evaluated through rigorous testing, including the workability slump test and the assessment of mechanical properties of hardened concrete, namely, the compressive strength, splitting tensile strength, and bulk density.
The sustainable concrete mix has the potential to completely replace natural river sand while achieving a 10% reduction in cement usage through the incorporation of silica fume in the concrete manufacturing process. This approach supports ecological balance and promotes environmental preservation. The detailed conclusions of this study are as follows:
  • A slump of 100 mm was successfully attained in the mixes NAC*, 0.5% HFSFC, 1.0% HFSFC, 1.5% HFSFC, and 2.0% HFSFC, achieved by adding 0.5%, 1%, 1.4%, 1.9%, and 2.6% admixture by weight of cement, respectively.
  • The compressive strength of the developed mixes containing hair fibers, i.e., 0.5% HFSFC, 1.0% HFSFC, 1.5% HFSFC, and 2.0% HFSFC, met the target compressive strength requirement (f’cr) of 38 MPa. The control mix NAC*, which utilized 100% ordinary Portland cement (OPC), exhibited a compressive strength of 36.104 MPa, falling short of the target strength but demonstrating proximity to it. This indicates that including hair fibers positively enhances the compressive strength of the concrete mixes.
  • The splitting tensile strength (STS) values for the mixes NAC*, 0.5% HFSFC, 1.0% HFSFC, 1.5% HFSFC, and 2.0% HFSFC were recorded to be 15.4%, 15.8%, 16%, 18.7%, and 18.8% (f’c), respectively. All tested mixes surpassed the established criterion of 10–15% (f’c), indicating satisfactory performance.
  • The bulk density measurements of the dry mixes 0.5% HFSFC, 1.0% HFSFC, 1.5% HFSFC, and 2.0% HFSFC, which included hair fibers and silica fume, were determined to be 2.518, 2.644, 2.708, and 2.792 g/cm3, respectively. In contrast, the reference mix NAC*, which contained 100% OPC and did not contain any hair fibers or silica fume, exhibited a bulk density of 2.360 g/cm3. These results signify that adding hair fibers and silica fume increased the bulk density of the concrete mixes, with the mixes 0.5% HFSFC, 1.0% HFSFC, 1.5% HFSFC, and 2.0% HFSFC showing increments in bulk density of 6.69%, 12.03%, 14.75%, and 18.30% compared to the reference mix. Moreover, the utilization of a 50% blend of recycled sand and manufactured sand as a fine aggregate was identified as a significant factor for pore reduction and density enhancement.
  • The combination of 50% recycled sand and 50% manufactured sand is an effective alternative to 100% natural river sand. Furthermore, the optimal incorporation of 10% silica fume alongside 0.5% to 2% hair fibers emerged as the most favorable combination in terms of the strength and durability of the newly developed concrete mixes. Notably, all specified parameters of the 1.5% HFSFC mix complied with the required parameter values, making it the best concrete mix developed in this study.

Author Contributions

Conceptualization, M.N.A. and N.I.S.; methodology, M.N.A.; validation, N.I.S. and M.N.A.; formal analysis, N.I.S.; investigation, M.N.A.; resources, M.N.A.; data curation, M.N.A.; writing—original draft preparation, N.I.S.; writing—review and editing, N.I.S.; visualization, N.I.S.; supervision, M.N.A.; funding acquisition, N.I.S. All authors have read and agreed to the published version of the manuscript.

Funding

This research received no external funding.

Data Availability Statement

The data are available in the manuscript.

Conflicts of Interest

The authors declare no conflicts of interest.

References

  1. UN. Translation Division. Documentation, Reference and Terminology Section. Environment and Development; United Nations: New York, NY, USA, 1992; Volume 2. [Google Scholar]
  2. Gallagher, L.; Peduzzi, P. Sand and Sustainability: Finding New Solutions for Environmental Governance of Global Sand Resources; University of Geneva: Geneva, Switzerland, 2019. [Google Scholar]
  3. Bhatawdekar, R.M.; Singh, T.N.; Tonnizam Mohamad, E.; Armaghani, D.J.; Binti Abang Hasbollah, D.Z. River sand mining vis a vis manufactured sand for sustainability. In Proceedings of the International Conference on Innovations for Sustainable and Responsible Mining: ISRM 2020; Springer: Berlin/Heidelberg, Germany; Volume 1, pp. 143–169.
  4. Kisku, N.; Joshi, H.; Ansari, M.; Panda, S.; Nayak, S.; Dutta, S.C. A critical review and assessment for usage of recycled aggregate as sustainable construction material. Constr. Build. Mater. 2017, 131, 721–740. [Google Scholar] [CrossRef]
  5. Torres, A.; Simoni, M.U.; Keiding, J.K.; Müller, D.B.; zu Ermgassen, S.O.; Liu, J.; Jaeger, J.A.; Winter, M.; Lambin, E.F. Sustainability of the global sand system in the Anthropocene. One Earth 2021, 4, 639–650. [Google Scholar] [CrossRef]
  6. Safinia, S.; Al-Hinai, Z.; Yahia, H.A.; Abushammala, M.F. Sustainable construction in sultanate of Oman: Factors effecting materials utilization. Procedia Eng. 2017, 196, 980–987. [Google Scholar] [CrossRef]
  7. Zhong, X.; Deetman, S.; Tukker, A.; Behrens, P. Increasing material efficiencies of buildings to address the global sand crisis. Nat. Sustain. 2022, 5, 389–392. [Google Scholar] [CrossRef]
  8. Fanijo, E.O.; Kolawole, J.T.; Babafemi, A.J.; Liu, J. A comprehensive review on the use of recycled concrete aggregate for pavement construction: Properties, performance, and sustainability. Clean. Mater. 2023, 9, 100199. [Google Scholar] [CrossRef]
  9. Bolden, J.; Abu-Lebdeh, T.; Fini, E. Utilization of recycled and waste materials in various construction applications. Am. J. Environ. Sci. 2013, 9, 14–24. [Google Scholar] [CrossRef]
  10. Sormunen, P.; Kärki, T. Recycled construction and demolition waste as a possible source of materials for composite manufacturing. J. Build. Eng. 2019, 24, 100742. [Google Scholar] [CrossRef]
  11. Mistri, A.; Bhattacharyya, S.K.; Dhami, N.; Mukherjee, A.; Barai, S.V. A review on different treatment methods for enhancing the properties of recycled aggregates for sustainable construction materials. Constr. Build. Mater. 2020, 233, 117894. [Google Scholar] [CrossRef]
  12. Akhtar, M.N.; Bani-Hani, K.A.; Malkawi, D.A.H.; Albatayneh, O. Suitability of sustainable sand for concrete manufacturing-A complete review of recycled and desert sand substitution. Results Eng. 2024, 23, 102478. [Google Scholar] [CrossRef]
  13. Akhtar, M.N.; Albatayneh, O.; Bani-Hani, K.A.; Malkawi, A.I.H. Performance of modified desert sand concrete: An experimental case study. Case Stud. Constr. Mater. 2024, 21, e03465. [Google Scholar] [CrossRef]
  14. Bajpai, R.; Choudhary, K.; Srivastava, A.; Sangwan, K.S.; Singh, M. Environmental impact assessment of fly ash and silica fume based geopolymer concrete. J. Clean. Prod. 2020, 254, 120147. [Google Scholar] [CrossRef]
  15. Sáez, P.V.; Merino, M.; Porras-Amores, C. Managing construction and demolition (C&D) waste—A European perspective. In International Conference on Petroleum and Sustainable Development; IACSIT Press: Singapore, 2011; pp. 27–31. [Google Scholar]
  16. Fischer, C.; Werge, M.; Reichel, A. EU as a Recycling Society. European Topic Centre on Resource Waste Management, Working Paper 2/2009; European Environment Agency: Copenhagen, Denmark, 2009. [Google Scholar]
  17. Monier, V.; Mudgal, S.; Hestin, M.; Trarieux, M.; Mimid, S. Service contract on management of construction and Demolition Waste–SR1. Final Rep. Task 2011, 2, 240. [Google Scholar]
  18. Akhtar, J.; Akhtar, M. Enhancement in properties of concrete with demolished waste aggregate. GE-Int. J. Eng. Res. 2014, 2, 73–83. [Google Scholar]
  19. Halahla, A.M.; Akhtar, M.; Almasri, A.H. Utilization of demolished waste as coarse aggregate in concrete. Civ. Eng. J. 2019, 5, 540–551. [Google Scholar] [CrossRef]
  20. Monish, M.; Srivastava, V.; Agarwal, V.; Mehta, P.; Kumar, R. Demolished waste as coarse aggregate in concrete. J. Acad. Indus. Res 2013, 1, 540–542. [Google Scholar]
  21. Akhtar, M.N.; Ibrahim, Z.; Bunnori, N.M.; Jameel, M.; Tarannum, N.; Akhtar, J. Performance of Sustainable sand Concrete at Ambient and Elevated Temperature; Elsevier: Amsterdam, The Netherlands, 2021. [Google Scholar]
  22. Akhtar, M.N.; Jameel, M.; Ibrahim, Z.; Bunnori, N.M. Incorporation of recycled aggregates and silica fume in concrete: An environmental savior-a systematic review. J. Mater. Res. Technol. 2022, 20, 4525–4544. [Google Scholar] [CrossRef]
  23. Tang, Y.; Chen, Z.; Feng, W.; Nong, Y.; Li, C.; Chen, J. Combined effects of nano-silica and silica fume on the mechanical behavior of recycled aggregate concrete. Nanotechnol. Rev. 2021, 10, 819–838. [Google Scholar] [CrossRef]
  24. Feng, W.; Tang, Y.; Zhang, Y.; Qi, C.; Ma, L.; Li, L. Partially fly ash and nano-silica incorporated recycled coarse aggregate based concrete: Constitutive model and enhancement mechanism. J. Mater. Res. Technol. 2022, 17, 192–210. [Google Scholar] [CrossRef]
  25. Williams, K.C.; Partheeban, P. An experimental and numerical approach in strength prediction of reclaimed rubber concrete. Adv. Concr. Constr. 2018, 6, 87. [Google Scholar]
  26. Ashish, D.K.; Verma, S.K. Effect on permeability of concrete made with successive recycled aggregate and silica fume. In Urbanization Challenges in Emerging Economies: Resilience and Sustainability of Infrastructure; American Society of Civil Engineers: Reston, VA, USA, 2018; pp. 196–205. [Google Scholar]
  27. Alhajiri, A.M.; Akhtar, M.N. Enhancing Sustainability and Economics of Concrete Production through Silica Fume: A Systematic Review. Civ. Eng. J. 2023, 9, 2612–2629. [Google Scholar] [CrossRef]
  28. Mehta, A.; Ashish, D.K. Silica fume and waste glass in cement concrete production: A review. J. Build. Eng. 2020, 29, 100888. [Google Scholar] [CrossRef]
  29. Ashish, D.K.; Verma, S.K. An overview on mixture design of self-compacting concrete. Struct. Concr. 2019, 20, 371–395. [Google Scholar] [CrossRef]
  30. Ashish, D.K. Concrete made with waste marble powder and supplementary cementitious material for sustainable development. J. Clean. Prod. 2019, 211, 716–729. [Google Scholar] [CrossRef]
  31. Srivastava, K.S.; Verma, N.; Singh, K. A Comparative Study of Mechanical Characteristics of Normal Concrete with Human Hair Fiber Fabricated Concrete. IOP Conf. Ser. Earth Environ. Sci. 2013, 1110, 012057. [Google Scholar] [CrossRef]
  32. Akbar, M.; Umar, T.; Hussain, Z.; Pan, H.; Ou, G. Effect of human hair fibers on the performance of concrete incorporating high dosage of silica fume. Appl. Sci. 2022, 13, 124. [Google Scholar] [CrossRef]
  33. Kumar, S.; Kumar, A. Effect of human hair fiber On mechanical properties of concrete. J. Sci. Res. Teach. 2024, 3, 199–207. [Google Scholar]
  34. Bheel, N.; Awoyera, P.; Aluko, O.; Mahro, S.; Viloria, A.; Sierra, C.A.S. Sustainable composite development: Novel use of human hair as fiber in concrete. Case Stud. Constr. Mater. 2020, 13, e00412. [Google Scholar] [CrossRef]
  35. ASTM-C-494/C-494M; High-Range, G Water-Reducing and Retarding Admixture. ASTM: West Conshohocken, PA, USA, 2005.
  36. Kleiner, F.; Decker, M.; Rößler, C.; Hilbig, H.; Ludwig, H.-M. Combined LA-ICP-MS and SEM-EDX analyses for spatially resolved major, minor and trace element detection in cement clinker phases. Cem. Concr. Res. 2022, 159, 106875. [Google Scholar] [CrossRef]
  37. McCrone, W.C.; Skirius, C. Light microscopical study of theTurin Shroud. I. Microsc. 1980, 28, 105–113. [Google Scholar]
  38. Moser, R.D.; Allison, P.G.; Chandler, M.Q. Characterization of impact damage in ultra-high performance concrete using spatially correlated nanoindentation/SEM/EDX. J. Mater. Eng. Perform. 2013, 22, 3902–3908. [Google Scholar] [CrossRef]
  39. ACI-318; Building Code Requirements for Structural Concrete (ACI 318-08) and Commentary. American Concrete Institute: Farmington Hills, MI, USA, 2008.
  40. ACI-214R-11; Guide to Evaluation of Strength Test Results of Concrete. American Concrete Institute: Farmington Hills, MI, USA, 2011.
  41. ASTM-C496/C496M-11; Standard Test Method for Splitting Tensile Strength of Cylindrical Concrete Specimens. American Concrete Institute: Farmington Hills, MI, USA, 2011.
  42. ASTM-C642-13; C642-13, Standard Test Method for Density, Absorption, and Voids in Hardened Concrete. ASTM International: West Conshohocken, PA, USA, 2013.
  43. Akhtar, M.N.; Jameel, M.; Ibrahim, Z.; Bunnori, N.M.; Bani-Hani, K.A. Development of sustainable modified sand concrete: An experimental study. Ain Shams Eng. J. 2023, 15, 102331. [Google Scholar] [CrossRef]
Figure 1. (ag) Materials of newly prepared concrete mixes.
Jcs 09 00216 g001
Figure 2. Admixture percentages to maintain a slump of 100 mm. NAC*: natural aggregate concrete.
Jcs 09 00216 g002
Figure 3. SEM-EDS characterization of M-Sand.
Jcs 09 00216 g003
Figure 4. SEM-EDS characterization of R-Sand.
Jcs 09 00216 g004
Figure 5. Compressive strength comparison between the mixes. NAC*: natural aggregate concrete.
Jcs 09 00216 g005
Figure 6. Load vs. displacement curves.
Jcs 09 00216 g006
Figure 7. STS results of newly developed concrete mixes. NAC*: natural aggregate concrete.
Jcs 09 00216 g007
Figure 8. Dry bulk density and porosity of hardened developed concrete mixes.
Jcs 09 00216 g008
Figure 9. The failure mode of the developed concrete mixes in the splitting tensile strength test.
Jcs 09 00216 g009
Table 1. Composition of design mix concrete.
Mixes DesignationsBinding MaterialsHF
by Weight of Cement (%)
Concrete SandNCA
(%)
Slump
(mm)
Admixture by Weight of Cement (%)Mix Temperature (°C)Mix Air Temperature (°C)
OPC
(%)
SF
(%)
M-SandR-Sand
NAC* 100 0 0 100 0 1001000.52620
0.5%HFSFC 90 10 0.5 50 50 1001001.02620
1.0%HFSFC 90 10 1.0 50 50 1001001.42520
1.5%HFSFC 90 10 1.5 50 50 1001001.92420
2.0%HFSFC 90 10 2.0 50 50 1001002.62520
NAC* = natural aggregate concrete; SF = silica fume; HF = hair fiber; NCA = natural coarse aggregate; M-Sand = manufactured sand; R-Sand = recycled sand.
Table 2. Experimental test results.
Mix DesignationMeasurement of Masses as per ASTM C642-13 ProcedureDry Bulk Density Apparent DensityVoid Percentage
ABCDEquation (2)Equation (3)Equation (4)
[ A ( C D ) ] · ρ = g1 [ A ( A D ) ] · ρ = g2 [ ( g 2 g 1 ) g 2 ] × 100
ggggg/cm3 %
NAC*102511081110645.72.2082.70218.28
0.5%HFSFC100510651067638.42.3452.74114.45
1.0%HFSFC104811091108669.62.3902.76913.68
1.5%HFSFC113011701172724.82.5272.7889.36
2.0%HFSFC110911481151702.32.4712.7279.39
Disclaimer/Publisher’s Note: The statements, opinions and data contained in all publications are solely those of the individual author(s) and contributor(s) and not of MDPI and/or the editor(s). MDPI and/or the editor(s) disclaim responsibility for any injury to people or property resulting from any ideas, methods, instructions or products referred to in the content.

