
Comparison of Bending Properties of Sandwich Structures Using Conventional and 3D-Printed Core with Flax Fiber Reinforcement


 , ,
, ,  ,
,  and
and 
Abstract
1. Introduction
2. Literature Review
2.1. Glass Fibers
2.2. Resins
2.3. Natural Fibers
2.4. Core Materials
2.5. Balsa Core
2.6. Additive Manufacturing—3D Printing
3. Materials and Methods
3.1. Materials
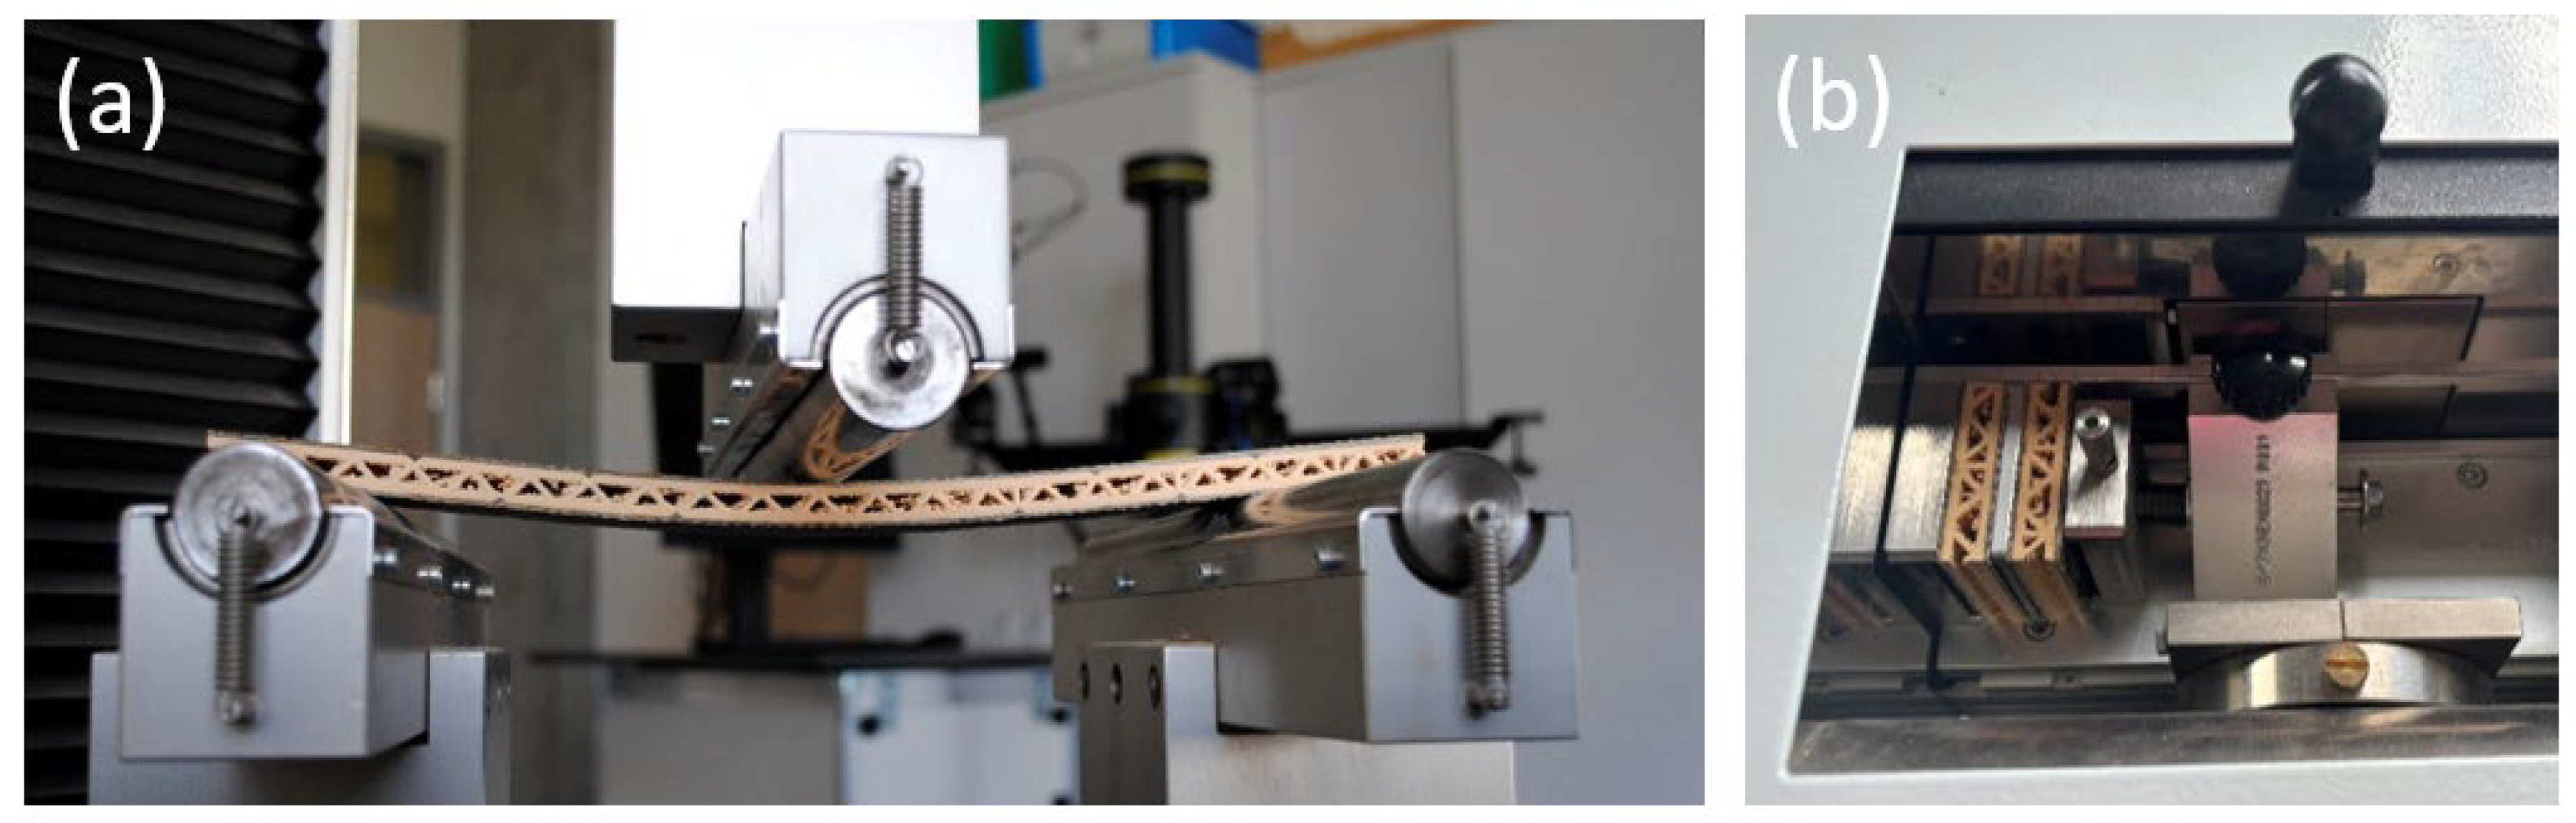
3.2. Methods
4. Results
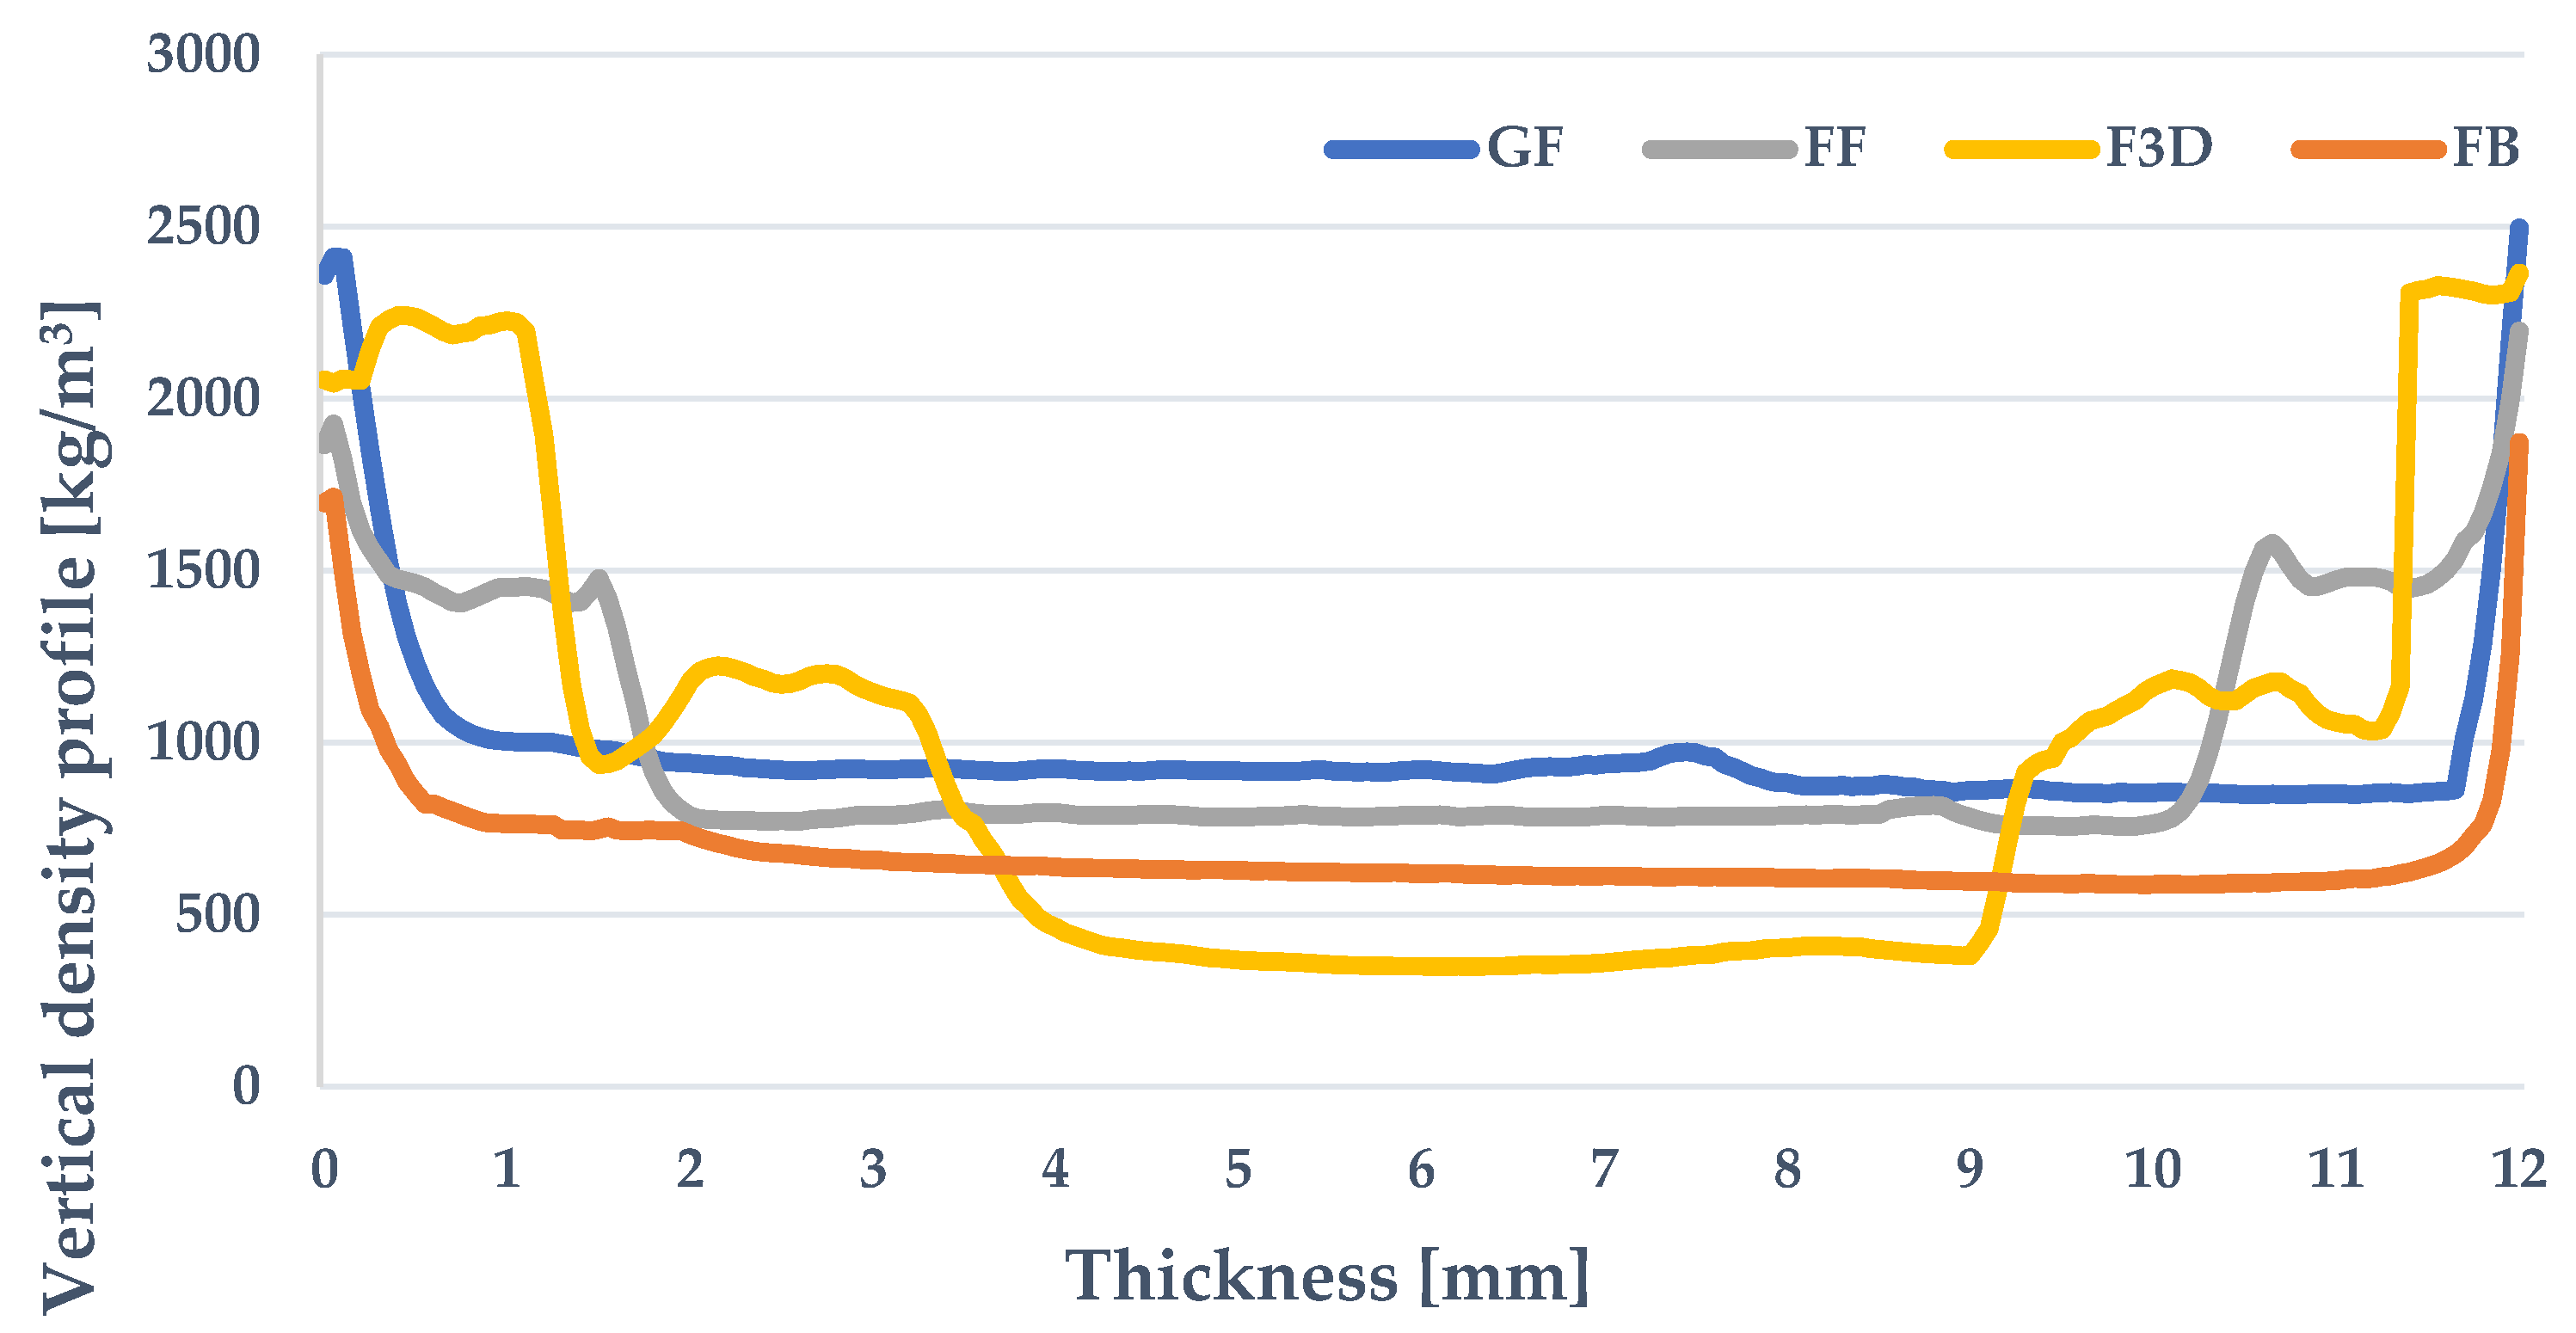
4.1. Density Profile
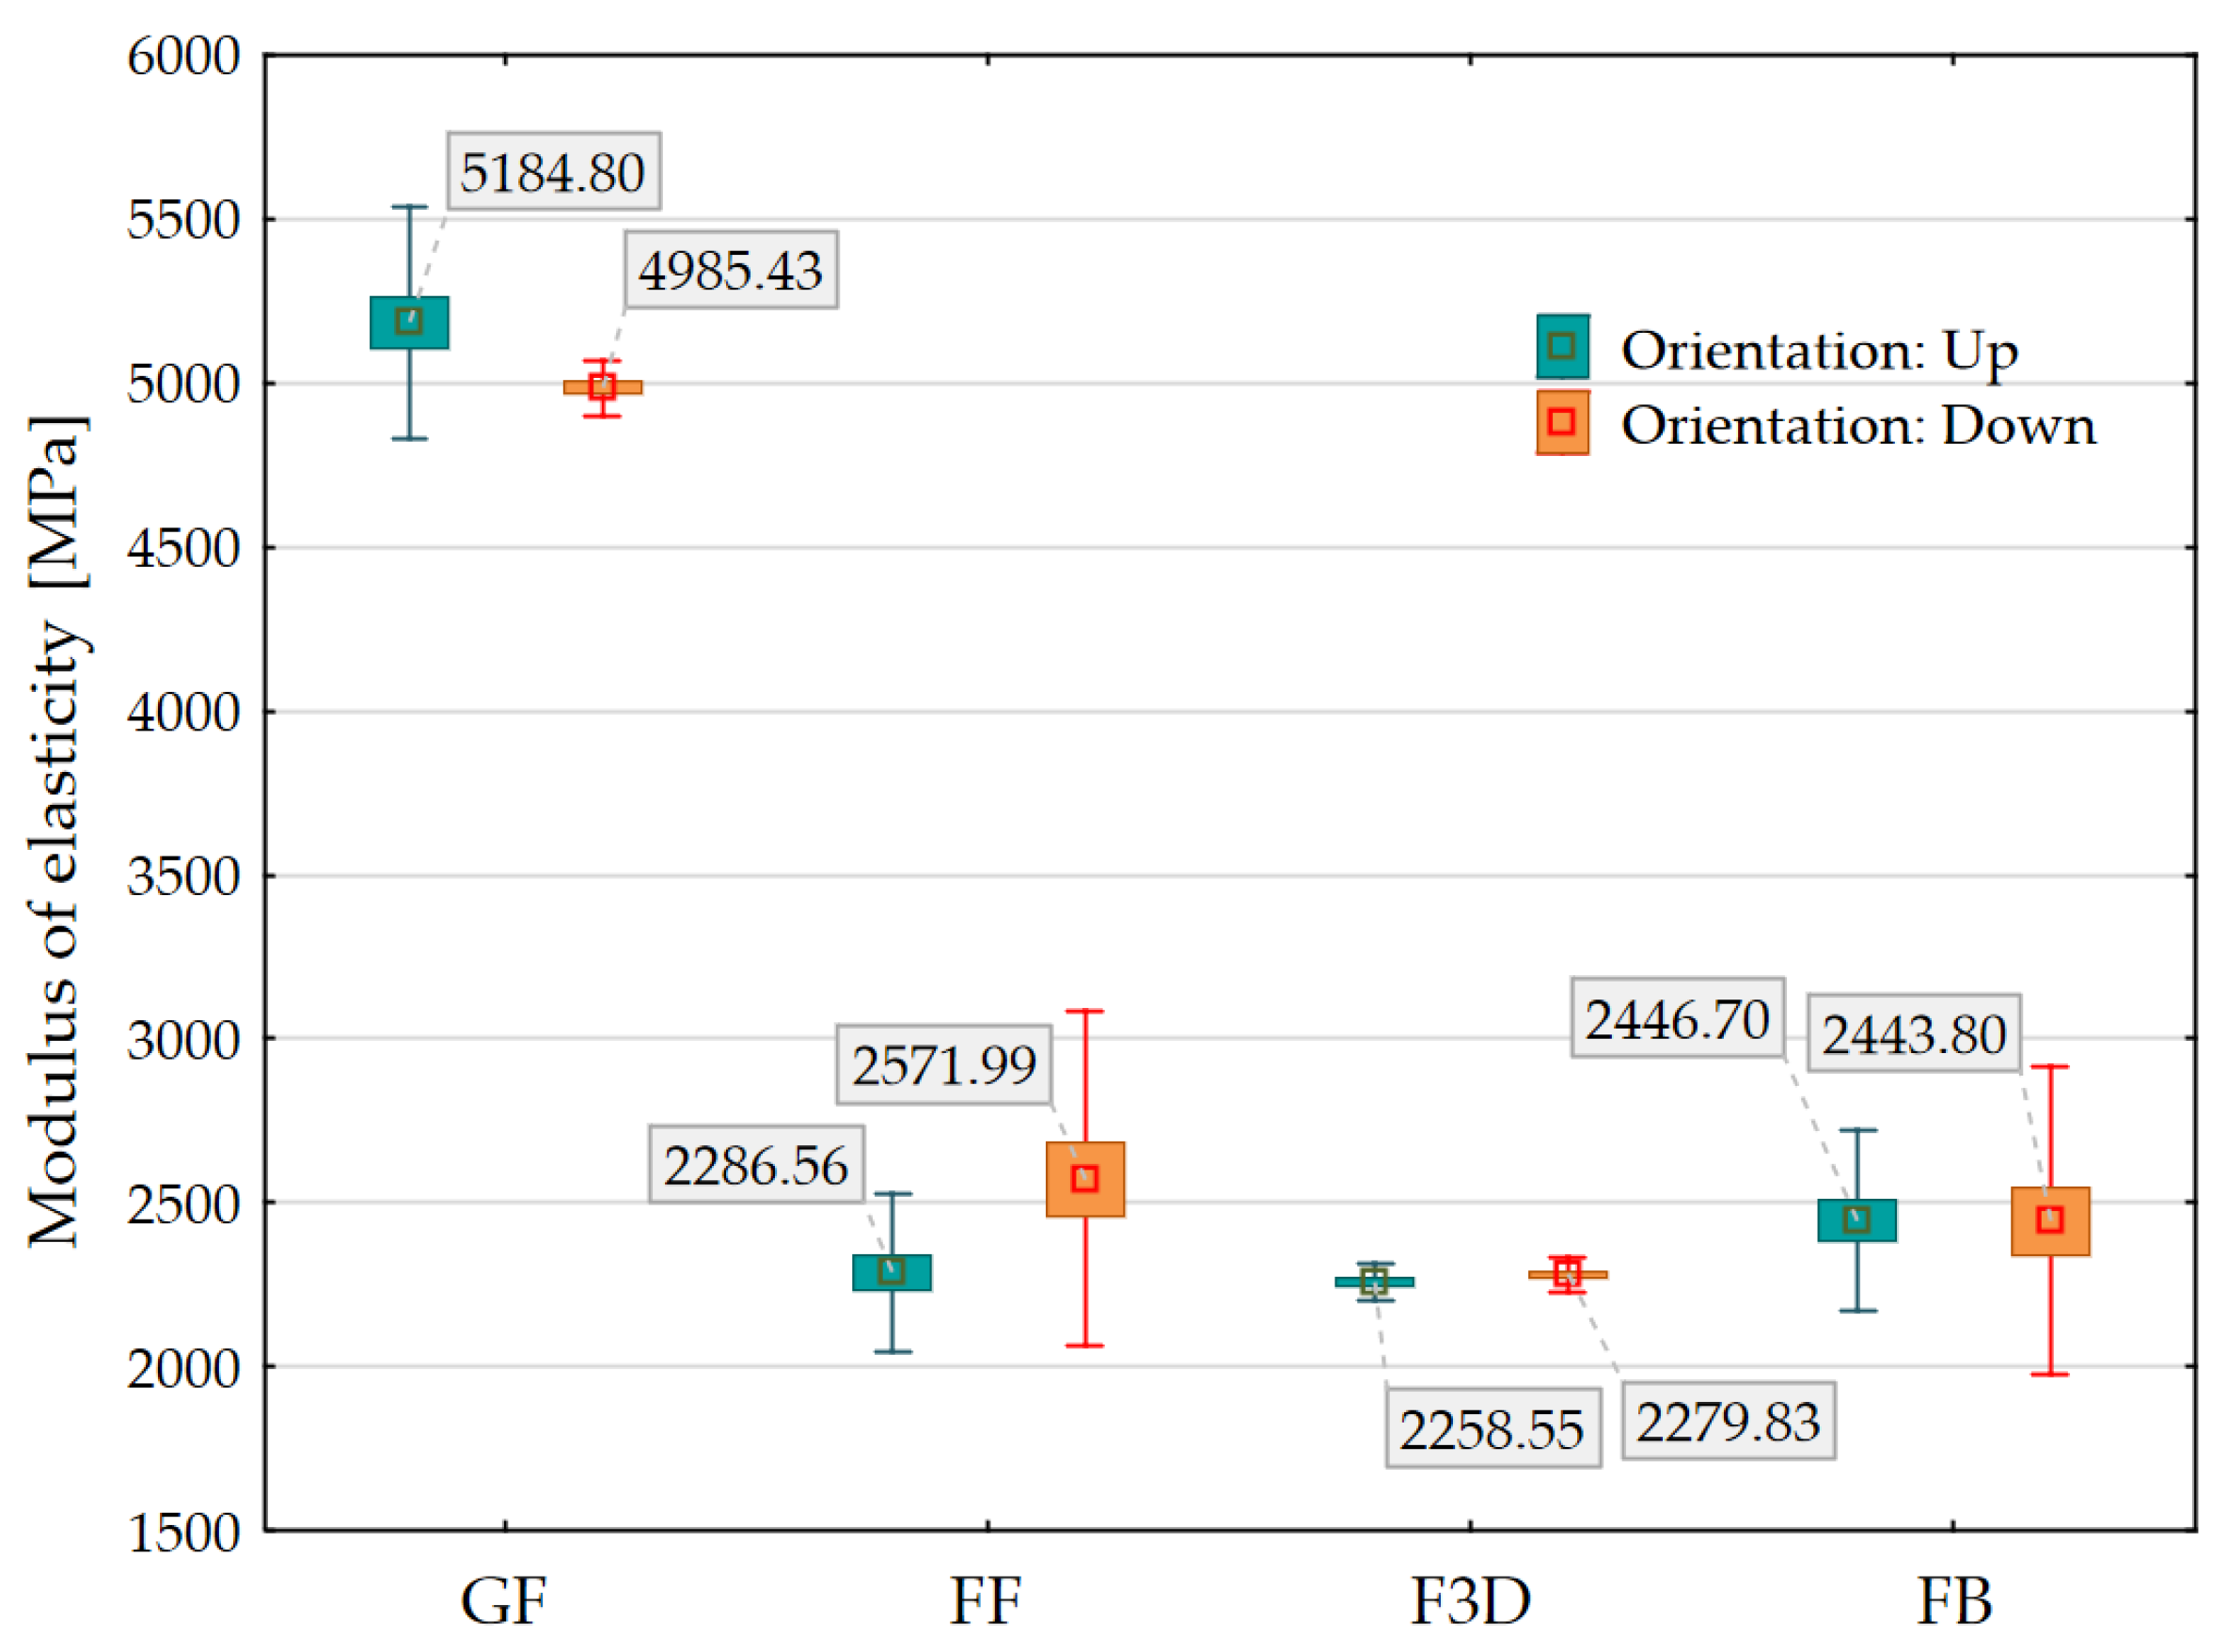
4.2. Modulus of Elasticity
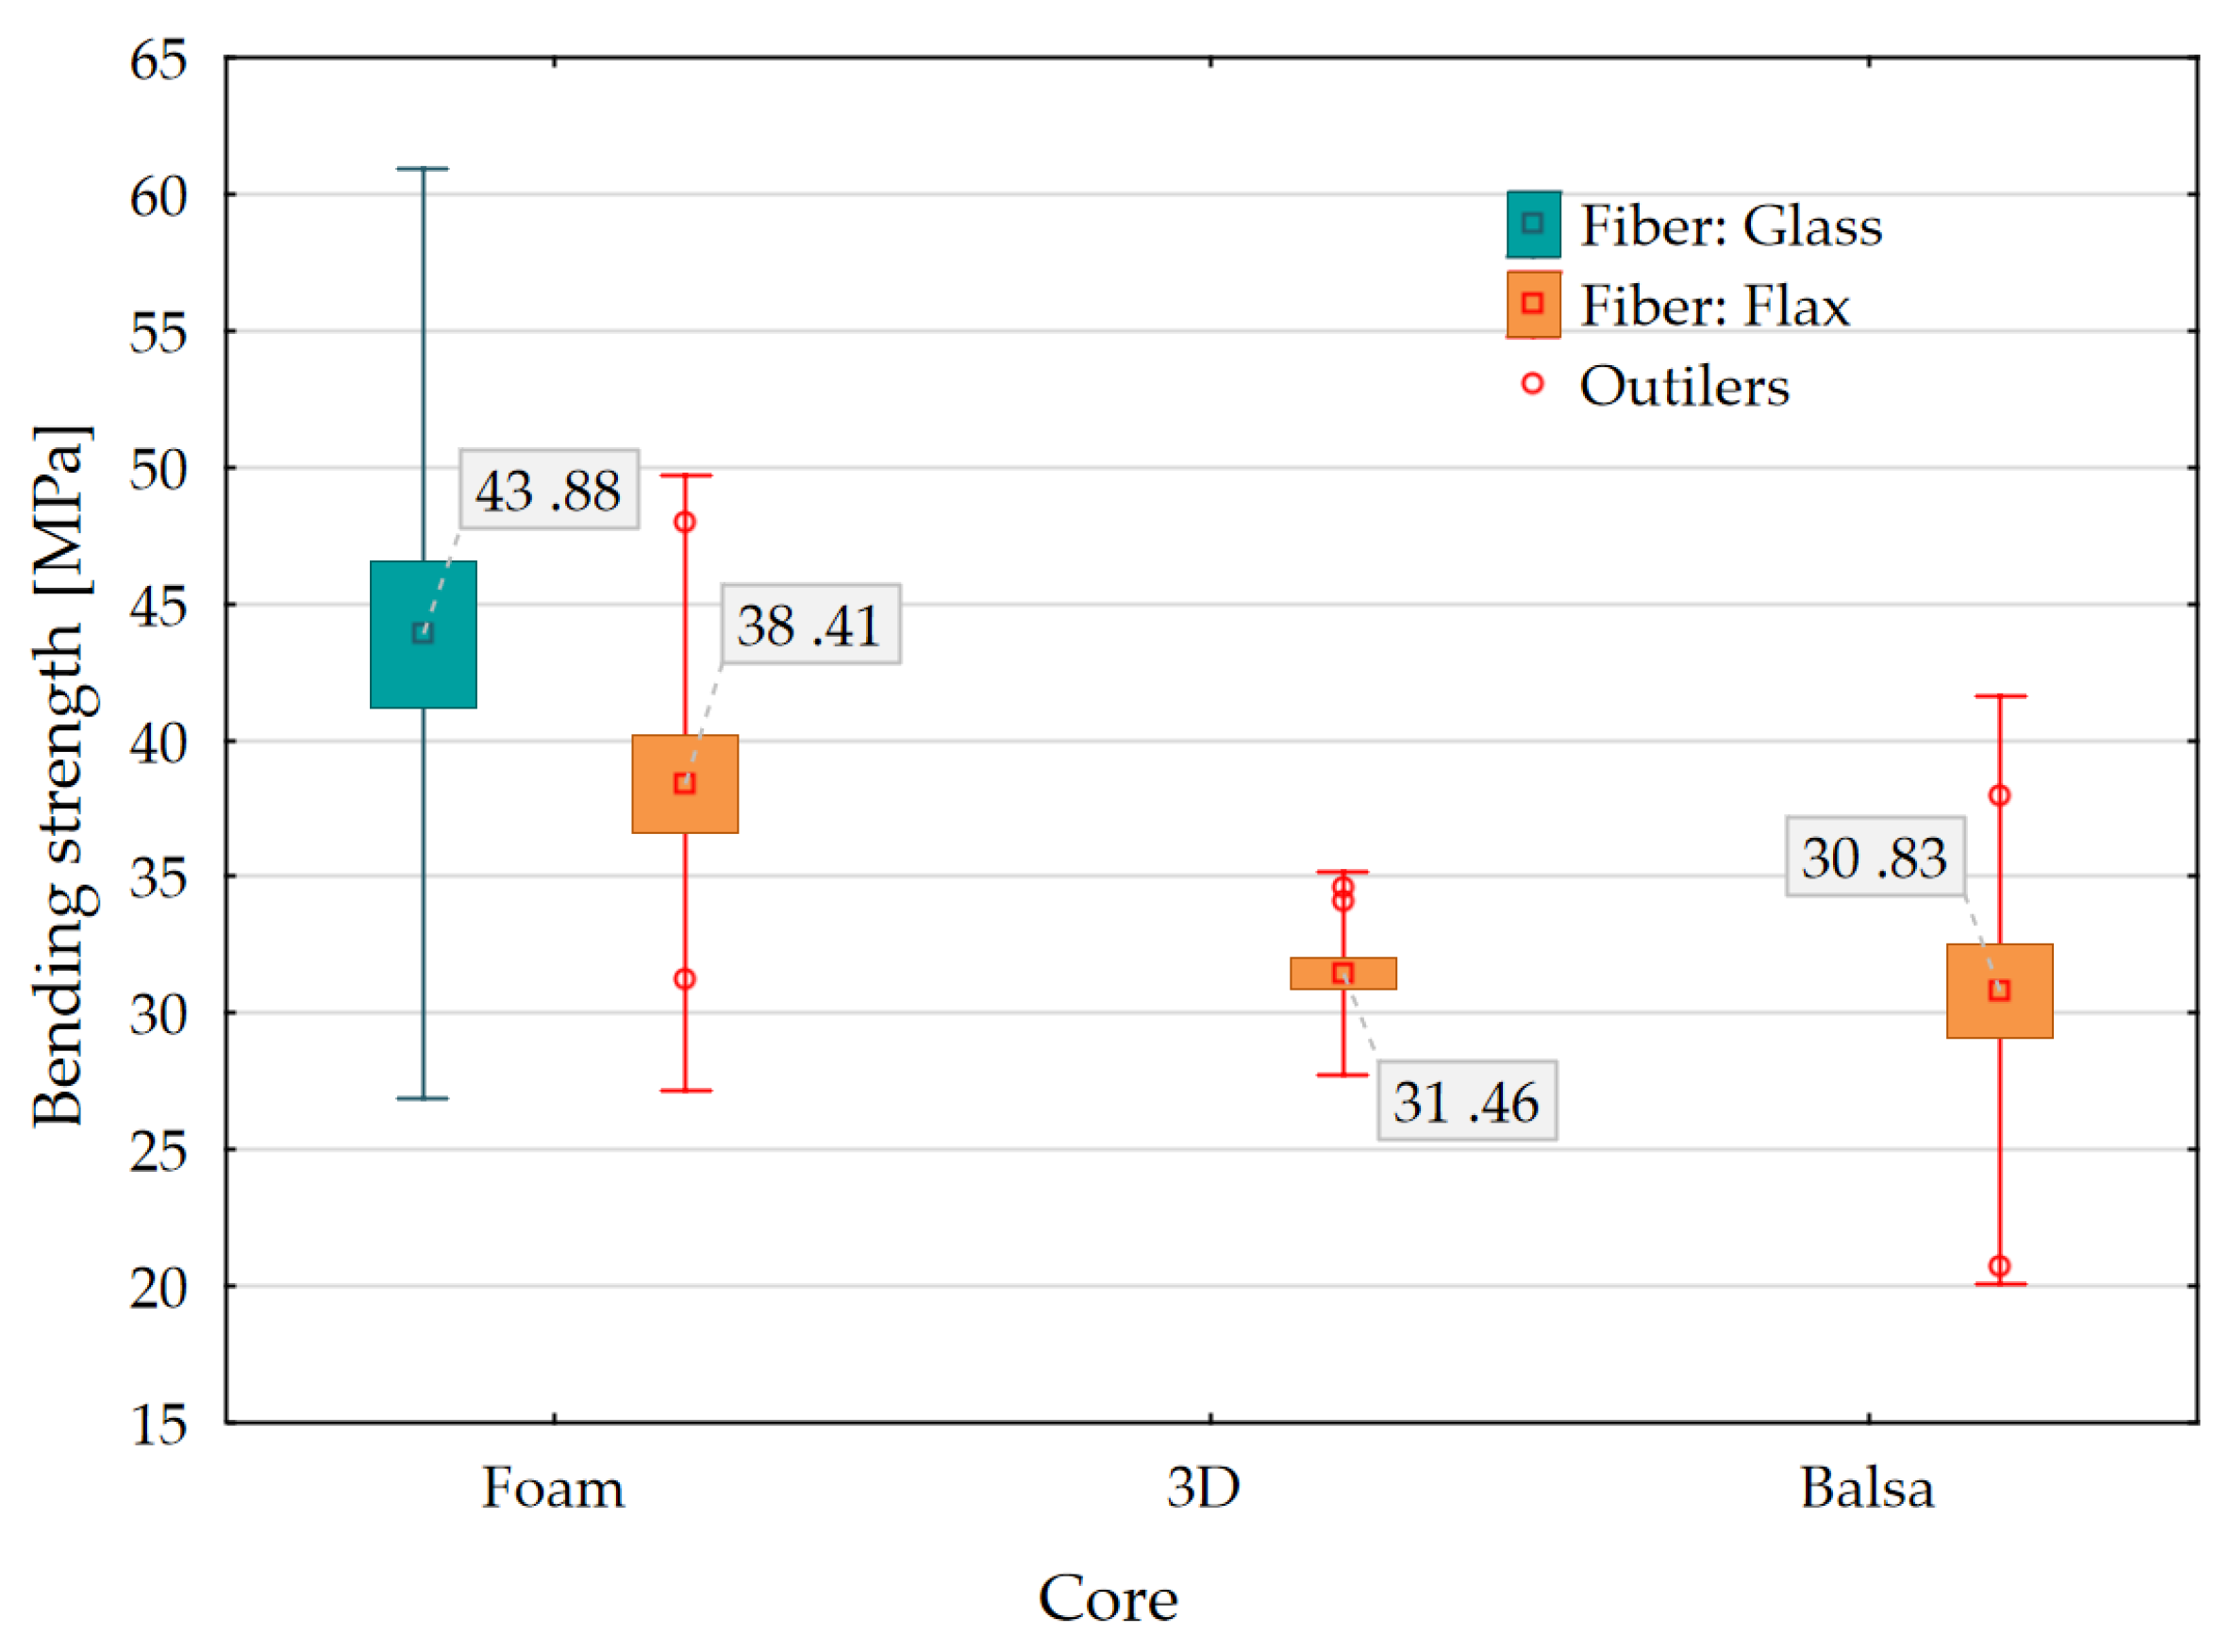
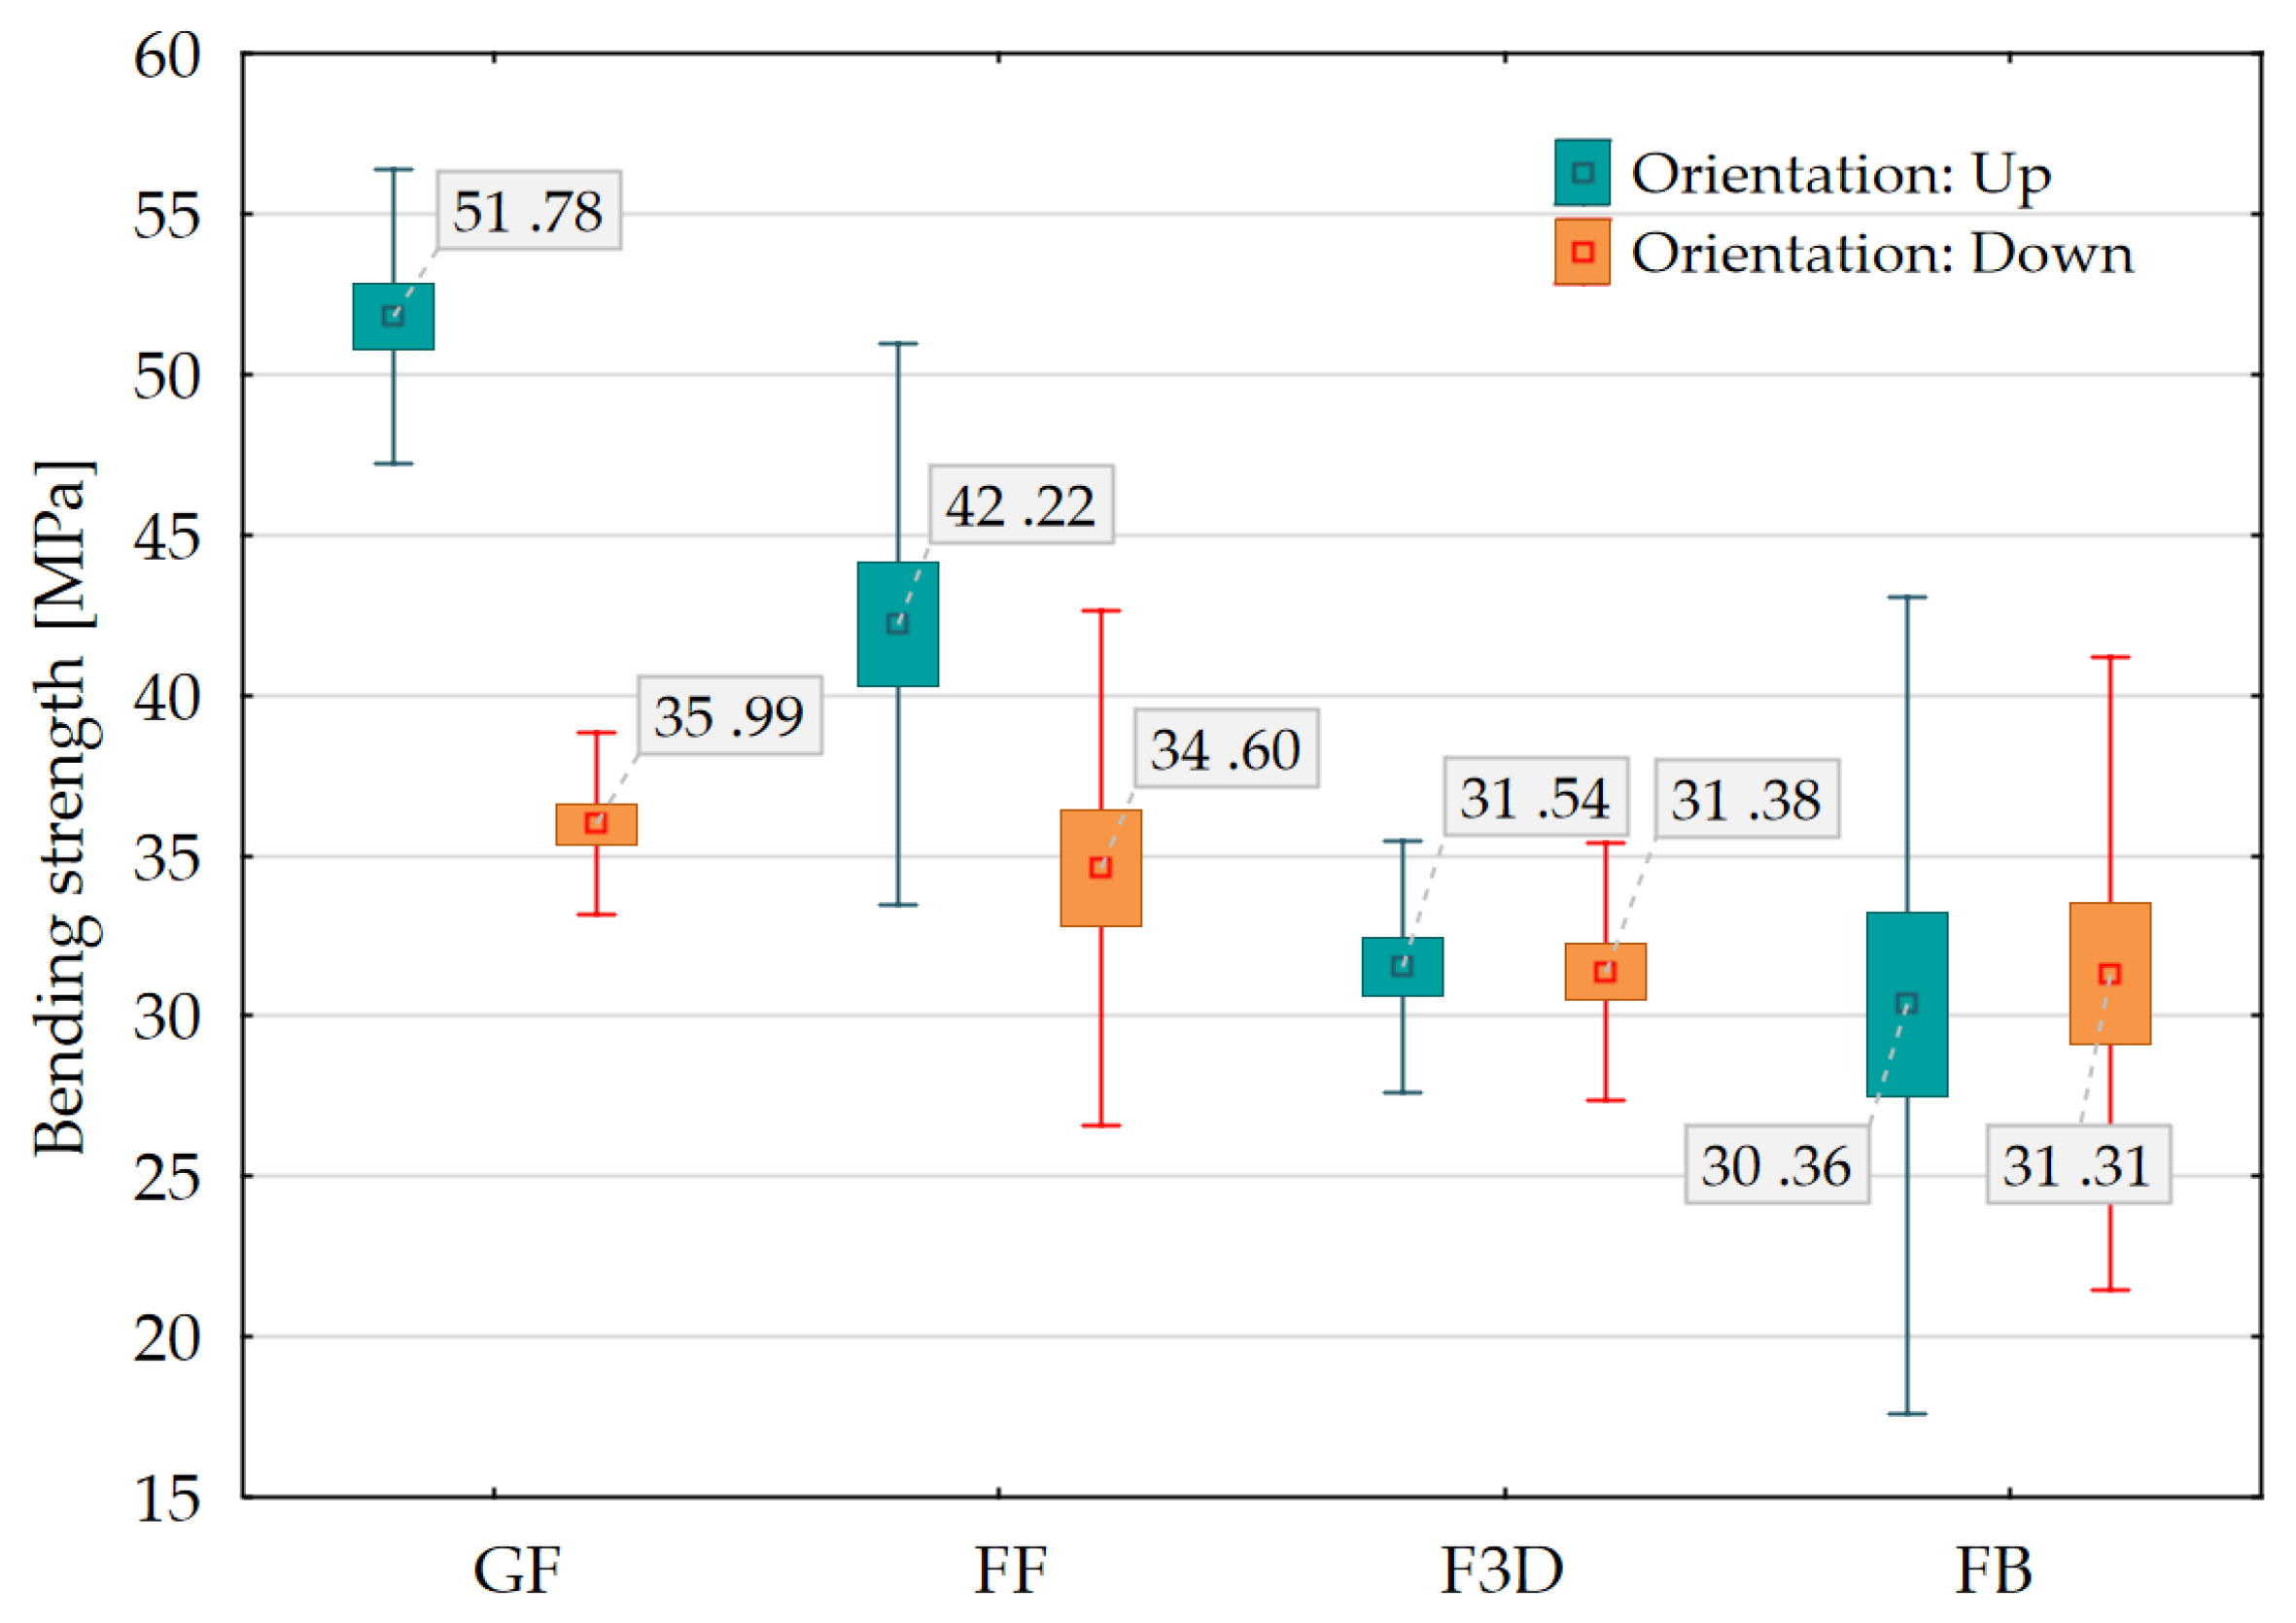
4.3. Bending Strength
4.4. Failure Modes
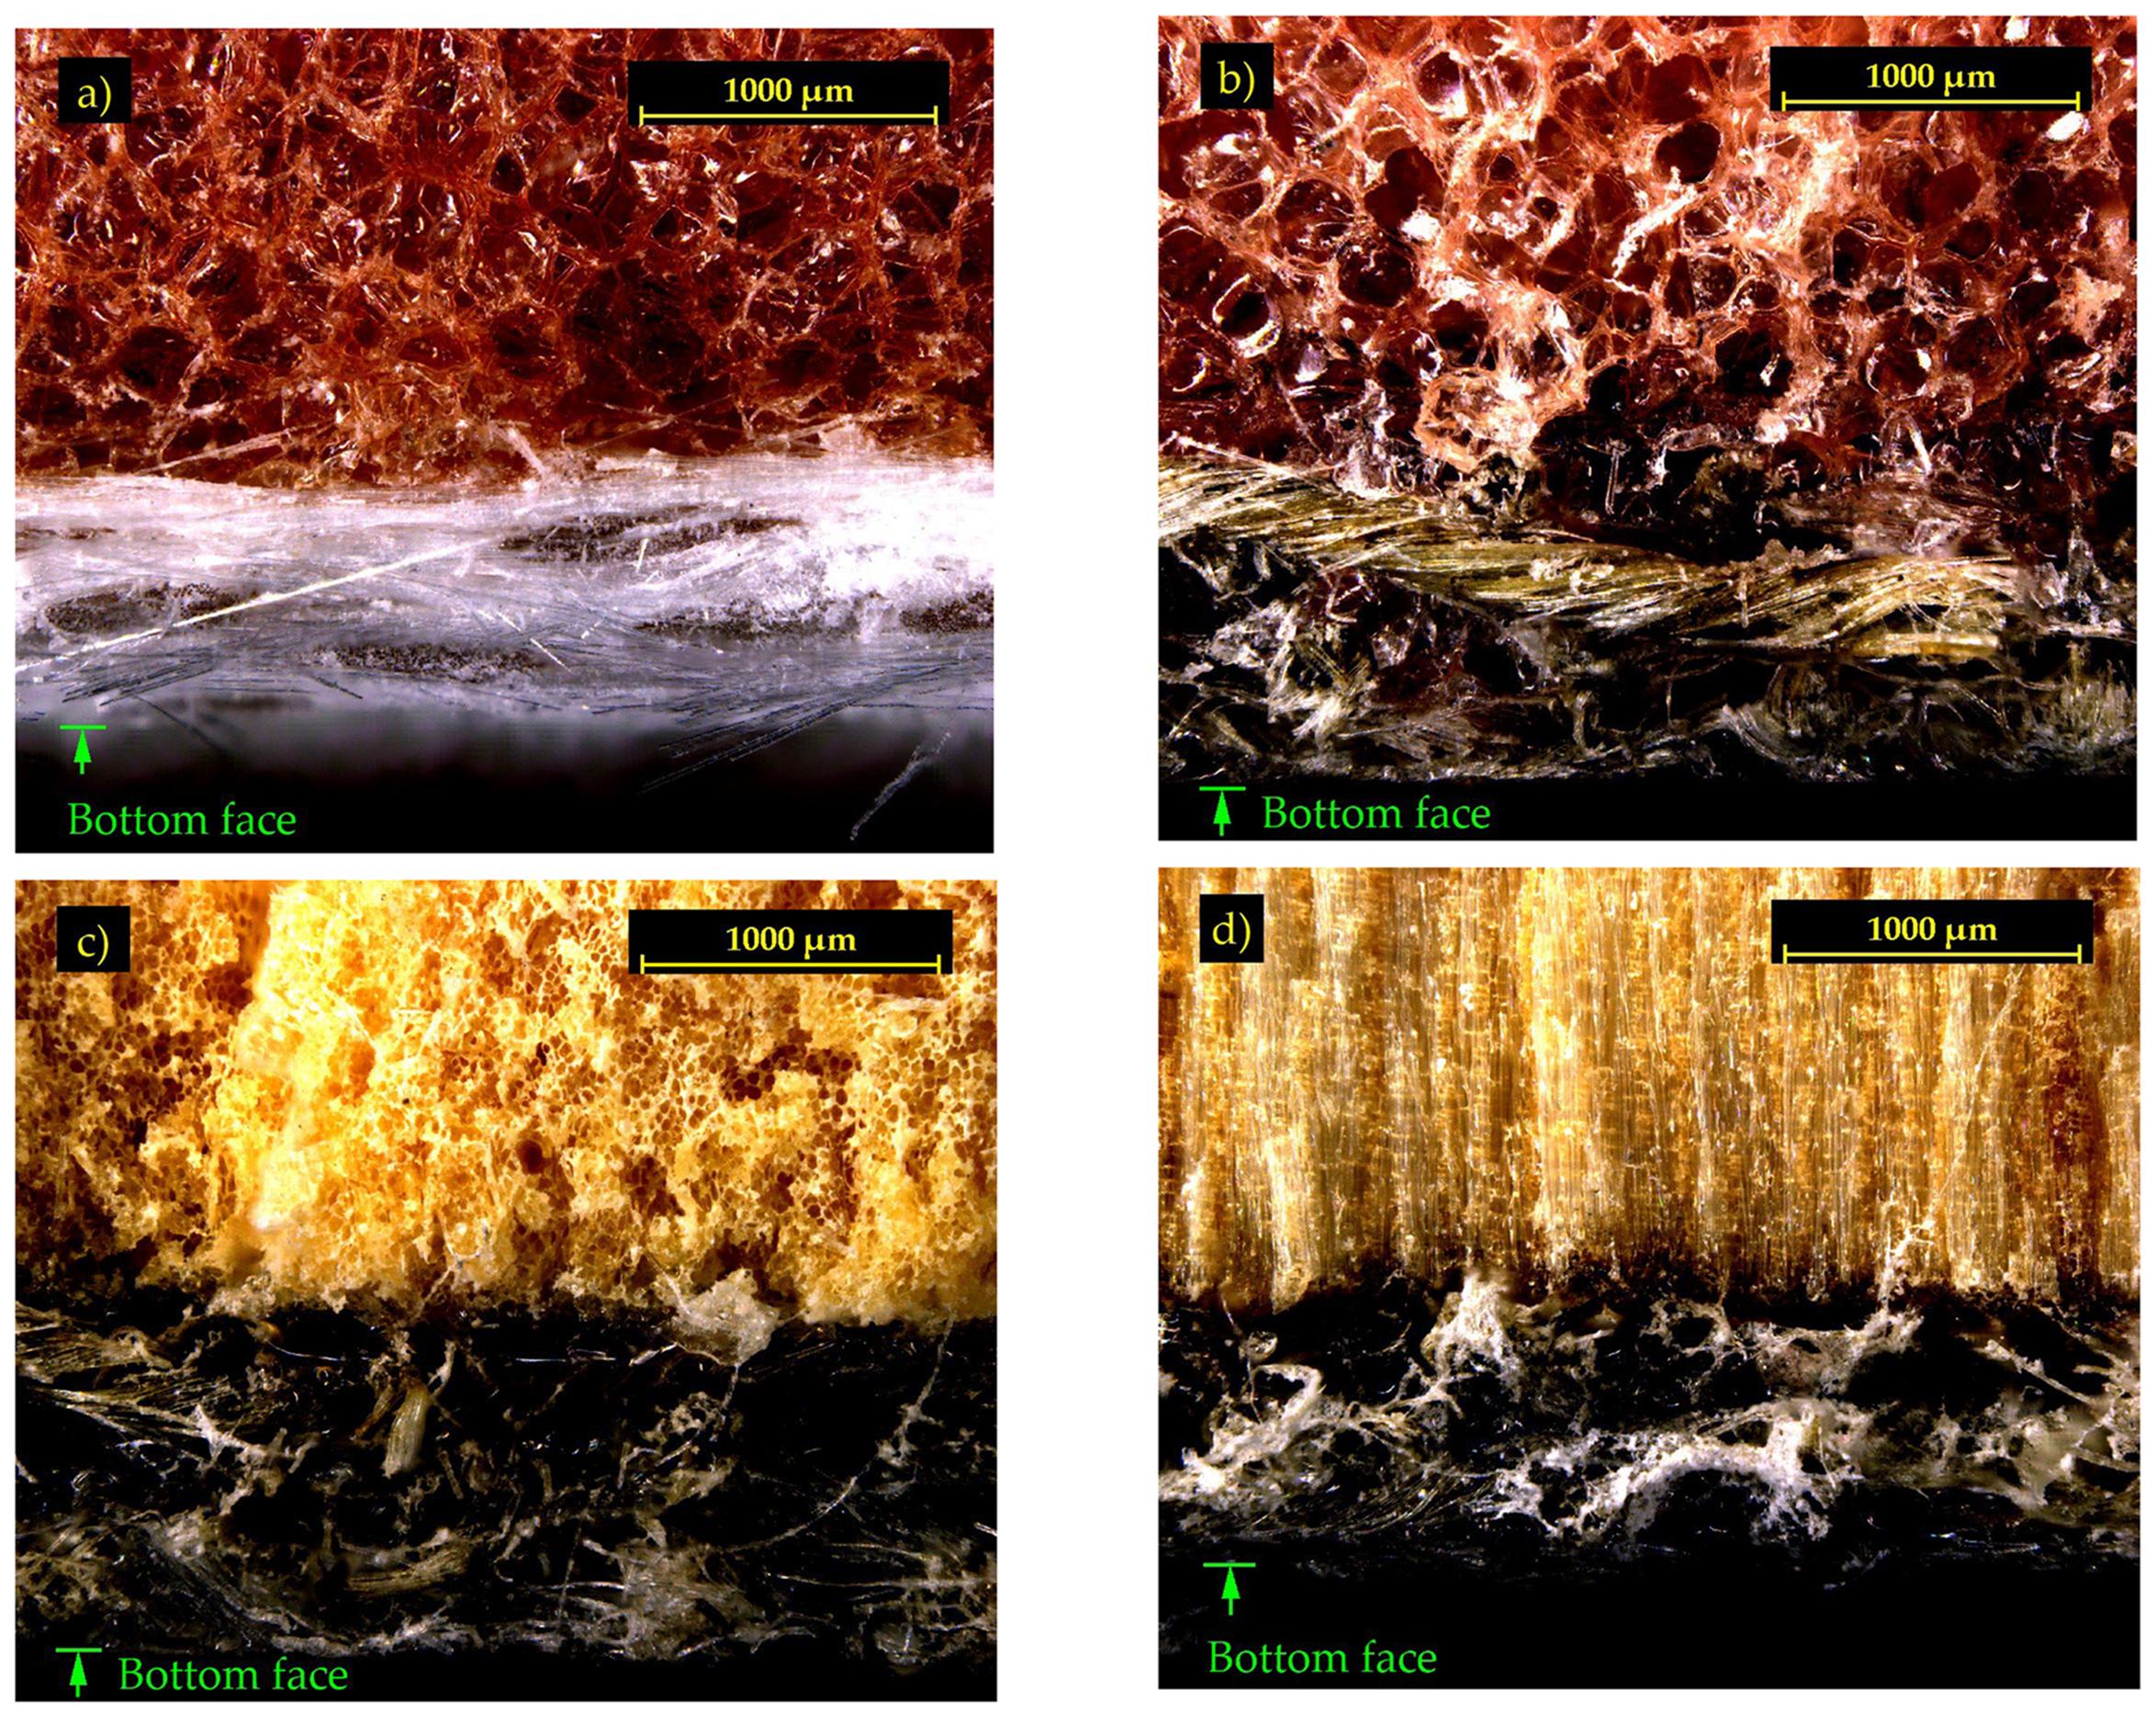
4.5. Microscopic Analysis
5. Conclusions
- Glass fiber reinforcements achieved superior mechanical properties compared to flax fibers, including higher tensile strength and greater stiffness;
- Flax fiber reinforcement reduced impregnation efficiency in foam cores, negatively affecting certain mechanical characteristics;
- Although flax fibers absorbed more resin, they maintained a significantly lower density than glass fibers;
- Despite their lower mechanical performance, flax fibers provide an environmentally friendly alternative, making them suitable for sustainable composite production;
- Density profile measurements showed that the 3D-printed core had the lowest raw material density yet delivered comparable performance in selected tests. In the F3D group, the resulting composite density was intermediate among flax-reinforced samples;
- Mechanical testing confirmed that lightweight 3D-printed thermoplastic cores can match the performance of conventional foam and balsa cores. Moreover, 3D-printed materials exhibited greater consistency and homogeneity in their properties;
- The modulus of elasticity for samples with 3D-printed cores averaged 2269.19 MPa, with statistical analysis revealing overlapping values with groups utilizing conventional core materials.
Author Contributions
Funding
Data Availability Statement
Conflicts of Interest
References
- Al-Oqla, F.M.; Hayajneh, M.T.; Nawafleh, N. Advanced Synthetic and Biobased Composite Materials in Sustainable Applications: A Comprehensive Review. Emerg. Mater. 2023, 6, 809–826. [Google Scholar] [CrossRef]
- JEC Observer. JEC Observer: Overview of the Global Composites Market 2022–2027. 2023. Available online: https://www.jeccomposites.com/wp-content/uploads/2023/06/v2_14985_DP-UK_JEC-Observer-ECO.pdf (accessed on 1 January 2025).
- Composites Market: Global Industry Analysis and Forecast (2025–2032). 2025. Available online: https://www.maximizemarketresearch.com/market-report/global-composites-market/34243/ (accessed on 2 February 2025).
- Grand View Research, Inc. Composites Market Analysis and Segment Forecasts to 2030. 2023. Available online: https://www.grandviewresearch.com/industry-analysis/composites-market (accessed on 12 December 2024).
- Bullen, G.N.; Grant, C.; Hiken, A.; Day, D.; Champa, D. Economics of Composites; SAE International: Warrendale, PA, USA, 2015. [Google Scholar]
- Estin, Co. Overview of the Global Composites Market 2019–2024; JEC Group: Paris, France, 2020. [Google Scholar]
- Lucintel Bio-Composites Market Report: Trends, Forecast and Competitive Analysis. Report and Market. 2020. Available online: https://www.lucintel.com/biocomposite-market.aspx (accessed on 2 January 2025).
- Brejcha, V.; Kobetičová, K.; Pommer, V.; Koňáková, D.; Böhm, M. Analysis of Porosity and Abrasion Resistance of Composite Material Based on Flax Fiber and Bio-Epoxy Resin with Corundum Additive. In Proceedings of the International Conference of Computational Methods in Sciences and Engineering ICCMSE 2022, Virtual, 26–29 October 2022; AIP Publishing: New York, NY, USA, 2024; Volume 3030, p. 070004. [Google Scholar]
- Shirinbayan, M.; Abbasnezhad, N.; Nikooharf, M.H.; Benfriha, K.; Kallel, A.; Jendli, Z.; Fitoussi, J. Manufacturing Process Effect on the Mechanical Properties of Glass Fiber/Polypropylene Composite Under High Strain Rate Loading: Woven (W-GF-PP) and Compressed GF50-PP. Appl. Compos. Mater. 2023, 30, 1717–1736. [Google Scholar] [CrossRef]
- Sathishkumar, T.P.; Satheeshkumar, S.; Naveen, J. Glass Fiber-Reinforced Polymer Composites—A Review. J. Reinf. Plast. Compos. 2014, 33, 1258–1275. [Google Scholar] [CrossRef]
- Zu, Q.; Solvang, M.; Li, H. Commercial Glass Fibers. In Fiberglass Science and Technology: Chemistry, Characterization, Processing, Modeling, Application, and Sustainability; Li, H., Ed.; Springer International Publishing: Cham, Switzerland, 2021; pp. 1–87. ISBN 978-3-030-72200-5. [Google Scholar]
- Rajak, D.K.; Wagh, P.H.; Linul, E. Manufacturing Technologies of Carbon/Glass Fiber-Reinforced Polymer Composites and Their Properties: A Review. Polymers 2021, 13, 3721. [Google Scholar] [CrossRef]
- Goudenhooft, C.; Siniscalco, D.; Arnould, O.; Bourmaud, A.; Sire, O.; Gorshkova, T.; Baley, C. Investigation of the Mechanical Properties of Flax Cell Walls during Plant Development: The Relation between Performance and Cell Wall Structure. Fibers 2018, 6, 6. [Google Scholar] [CrossRef]
- Rahman, M.M.; Maniruzzaman, M.; Yeasmin, M.S. A State-of-the-Art Review Focusing on the Significant Techniques for Naturally Available Fibers as Reinforcement in Sustainable Bio-Composites: Extraction, Processing, Purification, Modification, as Well as Characterization Study. Results Eng. 2023, 20, 101511. [Google Scholar] [CrossRef]
- Böhm, M.; Brejcha, V.; Jerman, M.; Cerný, R. Bending Characteristics of Fiber-Reinforced Composite with Plywood Balsa Core. In Proceedings of the AIP Conference Proceedings, Rhodes, Greece, 1–5 May 2019; American Institute of Physics Inc.: Melville, NY, USA, 2019; Volume 2186. [Google Scholar]
- Scelsi, L.; Hodzic, A.; Soutis, C.; Hayes, S.A.; Rajendran, S.; AlMa’adeed, M.A.; Kahraman, R. A Review on Composite Materials Based on Recycled Thermoplastics and Glass Fibres. Plast. Rubber Compos. 2011, 40, 1–10. [Google Scholar] [CrossRef]
- Tiimob, B.J.; Rangari, V.K.; Jeelani, S. Effect of Reinforcement of Sustainable β-CaSiO3 Nanoparticles in Bio-Based Epoxy Resin System. J. Appl. Polym. Sci. 2014, 131, 40867. [Google Scholar] [CrossRef]
- Nodehi, M. Epoxy, Polyester and Vinyl Ester Based Polymer Concrete: A Review. Innov. Infrastruct. Solut. 2021, 7, 64. [Google Scholar] [CrossRef]
- Krzywiński, K.; Sadowski, Ł.; Stefaniuk, D.; Obrosov, A.; Weiß, S. Engineering and Manufacturing Technology of Green Epoxy Resin Coatings Modified with Recycled Fine Aggregates. Int. J. Precis. Eng. Manuf. Green Technol. 2022, 9, 253–271. [Google Scholar] [CrossRef]
- Kandelbauer, A.; Tondi, G.; Goodman, S.H. Handbook of Thermoset Plastics: 6 Unsaturated Polyesters and Vinyl Esters Unsaturated Polyesters; Elsevier: Amsterdam, The Netherlands, 2013. [Google Scholar]
- Ramon, E.; Sguazzo, C.; Moreira, P.M.G.P. A Review of Recent Research on Bio-Based Epoxy Systems for Engineering Applications and Potentialities in the Aviation Sector. Aerospace 2018, 5, 110. [Google Scholar] [CrossRef]
- Partanen, A.; Carus, M. Biocomposites, Find the Real Alternative to Plastic—An Examination of Biocomposites in the Market. Reinf. Plast. 2019, 63, 317–321. [Google Scholar] [CrossRef]
- Capretti, M.; Giammaria, V.; Santulli, C.; Boria, S.; Del Bianco, G. Use of Bio-Epoxies and Their Effect on the Performance of Polymer Composites: A Critical Review. Polymers 2023, 15, 4733. [Google Scholar] [CrossRef]
- Stanzione, J.; La Scala, J. Sustainable Polymers and Polymer Science: Dedicated to the Life and Work of Richard P. Wool. J. Appl. Polym. Sci. 2016, 133, 44212. [Google Scholar] [CrossRef]
- Zhang, Y.; Liu, X.; Wan, M.; Zhu, Y.; Zhang, K. Recent Development of Functional Bio-Based Epoxy Resins. Molecules 2024, 29, 4428. [Google Scholar] [CrossRef]
- Sangregorio, A.; Guigo, N.; van der Waal, J.C.; Sbirrazzuoli, N. All ‘Green’ Composites Comprising Flax Fibres and Humins’ Resins. Compos. Sci. Technol. 2019, 171, 70–77. [Google Scholar] [CrossRef]
- Brouwer, W.D. Natural Fibre Composites: Where Can Flax Compete with Glass? Sampe J. 2000, 36, 18–23. [Google Scholar]
- Huda, M.S.; Drzal, L.T.; Ray, D.; Mohanty, A.K.; Mishra, M. Natural-Fiber Composites in the Automotive Sector. In Properties and Performance of Natural-Fibre Composites; Elsevier: Amsterdam, The Netherlands, 2008; pp. 221–268. [Google Scholar]
- Yan, L.; Chouw, N.; Jayaraman, K. Flax Fibre and Its Composites—A Review. Compos. B Eng. 2014, 56, 296–317. [Google Scholar] [CrossRef]
- Satyanarayana, K.G.; Guimarães, J.L.; Wypych, F. Studies on Lignocellulosic Fibers of Brazil. Part I: Source, Production, Morphology, Properties and Applications. Compos. Part. A Appl. Sci. Manuf. 2007, 38, 1694–1709. [Google Scholar] [CrossRef]
- Shehab, E.; Meiirbekov, A.; Amantayeva, A.; Tokbolat, S. Cost Modelling for Recycling Fiber-Reinforced Composites: State-of-the-Art and Future Research. Polymers 2023, 15, 150. [Google Scholar] [CrossRef]
- Parodo, G.; Sorrentino, L.; Turchetta, S.; Moffa, G. Manufacturing of Sustainable Composite Materials: The Challenge of Flax Fiber and Polypropylene. Materials 2024, 17, 4768. [Google Scholar] [CrossRef]
- Khanal, A.; Shah, A. Techno-Economic Analysis of Hemp Production, Logistics and Processing in the U.S. Biomass 2024, 4, 164–179. [Google Scholar] [CrossRef]
- Dittenber, D.B.; GangaRao, H.V.S. Critical Review of Recent Publications on Use of Natural Composites in Infrastructure. Compos. Part. A Appl. Sci. Manuf. 2012, 43, 1419–1429. [Google Scholar] [CrossRef]
- Genc, G.; El Hafidi, A.; Birame Gning, P. 783. Comparison of the Mechanical Properties of Flax and Glass Fiber Composite Materials. J. Vibroeng. 2012, 14, 572–581. [Google Scholar]
- Ladaci, N.; Saadia, A.; Belaadi, A.; Boumaaza, M.; Chai, B.X.; Abdullah, M.M.S.; Al-Khawlani, A.; Ghernaout, D. ANN and RSM Prediction of Water Uptake of Recycled HDPE Biocomposite Reinforced with Treated Palm Waste W. Filifera. J. Nat. Fibers 2024, 21, 2356697. [Google Scholar] [CrossRef]
- Ramful, R. Mechanical Performance and Durability Attributes of Biodegradable Natural Fibre-Reinforced Composites—A Review. J. Mater. Sci. Mater. Eng. 2024, 19, 50. [Google Scholar] [CrossRef]
- Alzate Acevedo, S.; Díaz Carrillo, Á.J.; Flórez-López, E.; Grande-Tovar, C.D. Recovery of Banana Waste-Loss from Production and Processing: A Contribution to a Circular Economy. Molecules 2021, 26, 5282. [Google Scholar] [CrossRef]
- Kozlowski, R.M. Handbook of Natural Fibres: Volume 1: Types, Properties and Factors Affecting Breeding and Cultivation; Elsevier Science & Technology: Chantilly, UK, 2012; ISBN 9780857095503. [Google Scholar]
- Nasri, K.; Loranger, É.; Toubal, L. Effect of Cellulose and Lignin Content on the Mechanical Properties and Drop-Weight Impact Damage of Injection-Molded Polypropylene-Flax and -Pine Fiber Composites. J. Compos. Mater. 2023, 57, 3347–3364. [Google Scholar] [CrossRef]
- Yang, J.; Ching, Y.C.; Chuah, C.H. Applications of Lignocellulosic Fibers and Lignin in Bioplastics: A Review. Polymers 2019, 11, 751. [Google Scholar] [CrossRef]
- Komuraiah, A.; Kumar, N.; Prasad, B. Chemical Composition of Natural Fibers and Its Influence on Their Mechanical Properties. Mech. Compos. Mater. 2014, 50, 359–376. [Google Scholar] [CrossRef]
- Kobetičová, K.; Nábělková, J.; Brejcha, V.; Böhm, M.; Jerman, M.; Brich, J.; Černý, R. Ecotoxicity of Caffeine as a Bio-Protective Component of Flax-Fiber-Reinforced Epoxy-Composite Building Material. Polymers 2023, 15, 3901. [Google Scholar] [CrossRef] [PubMed]
- Wang, X.; Petrů, M. Effect of Hygrothermal Aging and Surface Treatment on the Dynamic Mechanical Behavior of Flax Fiber Reinforced Composites. Materials 2019, 12, 2376. [Google Scholar] [CrossRef] [PubMed]
- Guduri, B.R.; Khoathane, C.; Anandjiwala, R.D.; De Vries, A.; Sadiku, E.R.; Van Wyk, L. Effect of Water Absorption on Mechanical Properties of Flax Fibre Reinforced Composites. Adv. Sci. Technol. Res. J. 2015, 9, 1–6. [Google Scholar]
- Kim, Y.K.; Chalivendra, V. Natural Fibre Composites (NFCs) for Construction and Automotive Industries. In Handbook of Natural Fibres; Elsevier: Amsterdam, The Netherlands, 2020; pp. 469–498. [Google Scholar]
- Li, X.; Tabil, L.G.; Panigrahi, S. Chemical Treatments of Natural Fiber for Use in Natural Fiber-Reinforced Composites: A Review. J. Polym. Environ. 2007, 15, 25–33. [Google Scholar] [CrossRef]
- Ventura, H.; Claramunt, J.; Navarro, A.; Rodriguez-Perez, M.A.; Ardanuy, M. Effects of Wet/Dry-Cycling and Plasma Treatments on the Properties of Flax Nonwovens Intended for Composite Reinforcing. Materials 2016, 9, 93. [Google Scholar] [CrossRef]
- Rachtanapun, P.; Sawangrat, C.; Kanthiya, T.; Kaewpai, K.; Thipchai, P.; Tanadchangsaeng, N.; Worajittiphon, P.; Suhr, J.; Wattanachai, P.; Jantanasakulwong, K. Comparison of Effects of Plasma Surface Modifications of Bamboo and Hemp Fibers on Mechanical Properties of Fiber-Reinforced Epoxy Composites. Polymers 2024, 16, 3394. [Google Scholar] [CrossRef]
- Sassi, F.Z.; Zouari, R.; Baffoun, A.; Sonnier, R.; Longuet, C.; Khemir, H.; Msahli, S. Plasma Jet Technology to Improve the Hydrophobicity of Flax Fabrics. In Proceedings of 10th International Conference of Applied Research on Textile and Materials, Monastir, Tunisia, 9–11 November 2023; Babay, A., Cheriaa, R., Zouari, R., Eds.; Springer: Cham, Switzerland, 2024; pp. 113–117. [Google Scholar]
- Bayart, M.; Gauvin, F.; Foruzanmehr, M.R.; Elkoun, S.; Robert, M. Mechanical and Moisture Absorption Characterization of PLA Composites Reinforced with Nano-Coated Flax Fibers. Fibers Polym. 2017, 18, 1288–1295. [Google Scholar] [CrossRef]
- Gieparda, W.; Rojewski, S.; Rózanska, W. Effectiveness of Silanization and Plasma Treatment in the Improvement of Selected Flax Fibers’ Properties. Materials 2021, 14, 3564. [Google Scholar] [CrossRef]
- Koohestani, B.; Darban, A.K.; Mokhtari, P.; Yilmaz, E.; Darezereshki, E. Comparison of Different Natural Fiber Treatments: A Literature Review. Int. J. Environ. Sci. Technol. 2019, 16, 629–642. [Google Scholar] [CrossRef]
- Thyavihalli Girijappa, Y.G.; Mavinkere Rangappa, S.; Parameswaranpillai, J.; Siengchin, S. Natural Fibers as Sustainable and Renewable Resource for Development of Eco-Friendly Composites: A Comprehensive Review. Front. Mater. 2019, 6, 226. [Google Scholar] [CrossRef]
- Shahria, S. Fabrication and Property Evaluation of Hemp-Flax Fiber Reinforced Hybrid Composite. Chem. Mater. Eng. 2019, 7, 17–23. [Google Scholar] [CrossRef]
- Stelea, L.; Filip, I.; Lisa, G.; Ichim, M.; Drobotă, M.; Sava, C.; Mureșan, A. Characterisation of Hemp Fibres Reinforced Composites Using Thermoplastic Polymers as Matrices. Polymers 2022, 14, 481. [Google Scholar] [CrossRef] [PubMed]
- Stochioiu, C.; Ciolcă, M.; Deca, A.L. Mechanical Characterization of Flax and Hemp Fibers Cultivated in Romania. Materials 2024, 17, 4871. [Google Scholar] [CrossRef]
- Liu, H.; Yu, Y.; Liu, Y.; Zhang, M.; Li, L.; Ma, L.; Sun, Y.; Wang, W. A Review on Basalt Fiber Composites and Their Applications in Clean Energy Sector and Power Grids. Polymers 2022, 14, 2376. [Google Scholar] [CrossRef]
- Deng, X.; Hoo, M.S.; Cheah, Y.W.; Tran, L.Q.N. Processing and Mechanical Properties of Basalt Fibre-Reinforced Thermoplastic Composites. Polymers 2022, 14, 1220. [Google Scholar] [CrossRef]
- Holmes, M. Biocomposites Take Natural Step Forward: Applications for Biocomposites and the Use of Natural Fiber Reinforcements Are Increasing. Reinforced Plastics Looks at a Number of Examples. Reinf. Plast. 2019, 63, 194–201. [Google Scholar] [CrossRef]
- Pawlik, M.; Gunputh, U.; Odiyi, D.; Odofin, S.; Le, H.; Wood, P.; Maligno, A.; Lu, Y. Mechanical Properties of Eco-Friendly, Lightweight Flax and Hybrid Basalt/Flax Foam Core Sandwich Panels. Materials 2024, 17, 3842. [Google Scholar] [CrossRef]
- Alphonse, M.; Bupesh Raja, V.K.; Gopala Krishna, V.; Kiran, R.S.U.; Subbaiah, B.V.; Chandra, L.V.R. Mechanical Behavior of Sandwich Structures with Varying Core Material—A Review. Mater. Today Proc. 2021, 44, 3751–3759. [Google Scholar] [CrossRef]
- Yan, J.; Wang, G.; Li, Q.; Zhang, L.; Yan, J.D.; Chen, C.; Fang, Z. A Comparative Study on Damage Mechanism of Sandwich Structures with Different Core Materials under Lightning Strikes. Energies 2017, 10, 1594. [Google Scholar] [CrossRef]
- Imielińska, K.; Guillaumat, L.; Wojtyra, R.; Castaings, M. Effects of Manufacturing and Face/Core Bonding on Impact Damage in Glass/Polyester-PVC Foam Core Sandwich Panels. Compos. B Eng. 2008, 39, 1034–1041. [Google Scholar] [CrossRef]
- Kausar, A.; Ahmad, I.; Rakha, S.A.; Eisa, M.H.; Diallo, A. State-of-the-Art of Sandwich Composite Structures: Manufacturing-to-High Performance Applications. J. Compos. Sci. 2023, 7, 102. [Google Scholar] [CrossRef]
- Jang, J.-W.; Jeong, S.; Oh, D.; Cho, J.-H.; Noh, J. Test and Evaluation Procedure of Foam Core Materials for Composite Ships. J. Korean Soc. Mar. Environ. Saf. 2020, 26, 286–296. [Google Scholar] [CrossRef]
- Pertiwi, Y.A.B.; Ishiguri, F.; Aiso, H.; Ohshima, J.; Yokota, S. Wood Properties of 7-Year-Old Balsa (Ochroma pyramidale) Planted in East Java. Int. Wood Prod. J. 2017, 8, 227–232. [Google Scholar] [CrossRef]
- Easterling, K.E.; Harrysson, R.; Gibson, L.J.; Ashby, M.F. On the Mechanics of Balsa and Other Woods. Proc. R. Soc. Lond. Ser. A Math. Phys. Sci. 1982, 383, 31–41. [Google Scholar]
- Kotlarewski, N.J.; Belleville, B.; Gusamo, B.K.; Ozarska, B. Mechanical Properties of Papua New Guinea Balsa Wood. Eur. J. Wood Wood Prod. 2016, 74, 83–89. [Google Scholar] [CrossRef]
- Jagadeesh, P.; Puttegowda, M.; Rangappa, S.M.; Alexey, K.; Gorbatyuk, S.; Khan, A.; Doddamani, M.; Siengchin, S. A Comprehensive Review on 3D Printing Advancements in Polymer Composites: Technologies, Materials, and Applications. Int. J. Adv. Manuf. Technol. 2022, 121, 127–169. [Google Scholar] [CrossRef]
- Delgado Camacho, D.; Clayton, P.; O’Brien, W.J.; Seepersad, C.; Juenger, M.; Ferron, R.; Salamone, S. Applications of Additive Manufacturing in the Construction Industry—A Forward-Looking Review. Autom. Constr. 2018, 89, 110–119. [Google Scholar] [CrossRef]
- Wimpenny, D.I.; Pandey, P.M.; Jyothish Kumar, L. Advances in 3D Printing & Additive Manufacturing Technologies; Springer: Singapore, 2016; ISBN 9789811008122. [Google Scholar]
- Ansari, A.I.; Sheikh, N.A. A Review on Different Approaches for Foam Fabrication. J. Inst. Eng. Ser. C 2023, 104, 1219–1245. [Google Scholar] [CrossRef]
- Zheng, X.; Williams, C.; Spadaccini, C.M.; Shea, K. Perspectives on Multi-Material Additive Manufacturing. J. Mater. Res. 2021, 36, 3549–3557. [Google Scholar] [CrossRef]
- Bryll, K.; Piesowicz, E.; Szymański, P.; Slaczka, W.; Pijanowski, M. Polymer Composite Manufacturing by FDM 3D Printing Technology. MATEC Web Conf. 2018, 237, 02006. [Google Scholar] [CrossRef]
- Lumpe, T.S.; Shea, K. Computational Design of 3D-Printed Active Lattice Structures for Reversible Shape Morphing. J. Mater. Res. 2021, 36, 3642–3655. [Google Scholar] [CrossRef]
- Marabello, G.; Borsellino, C.; Di Bella, G. Carbon Fiber 3D Printing: Technologies and Performance—A Brief Review. Materials 2023, 16, 7311. [Google Scholar] [CrossRef] [PubMed]
- Ghosh, B.; Karmakar, S. 3D Printing Technology and Future of Construction: A Review. In Proceedings of the IOP Conference Series: Earth and Environmental Science, Jaipur, India, 11–12 August 2023; Institute of Physics: Melville, NY, USA, 2024; Volume 1326. [Google Scholar]
- Ning, X.; Liu, T.; Wu, C.; Wang, C. 3D Printing in Construction: Current Status, Implementation Hindrances, and Development Agenda. Adv. Civ. Eng. 2021, 2021, 6665333. [Google Scholar] [CrossRef]
- Jayakrishna, M.; Vijay, M.; Khan, B. An Overview of Extensive Analysis of 3D Printing Applications in the Manufacturing Sector. J. Eng. 2023, 2023, 7465737. [Google Scholar] [CrossRef]
- Nodehi, M.; Ozbakkaloglu, T.; Gholampour, A. Effect of Supplementary Cementitious Materials on Properties of 3D Printed Conventional and Alkali-Activated Concrete: A Review. Autom. Constr. 2022, 138, 104215. [Google Scholar] [CrossRef]
- Rehman, A.U.; Kim, J.H. 3d Concrete Printing: A Systematic Review of Rheology, Mix Designs, Mechanical, Microstructural, and Durability Characteristics. Materials 2021, 14, 3800. [Google Scholar] [CrossRef]
- Momeni, K.; Vatin, N.I.; Hematibahar, M.; Gebre, T.H. Differences between 3D Printed Concrete and 3D Printing Reinforced Concrete Technologies: A Review. Front. Built Environ. 2024, 10, 1450628. [Google Scholar] [CrossRef]
- Sun, H.Q.; Zeng, J.J.; Hong, G.Y.; Zhuge, Y.; Liu, Y.; Zhang, Y. 3D-Printed Functionally Graded Concrete Plates: Concept and Bending Behavior. Eng. Struct. 2025, 327, 119551. [Google Scholar] [CrossRef]
- Qi, C.; Jiang, F.; Yang, S. Advanced Honeycomb Designs for Improving Mechanical Properties: A Review. Compos. B Eng. 2021, 227, 109393. [Google Scholar] [CrossRef]
- Blok, L.G.; Longana, M.L.; Yu, H.; Woods, B.K.S. An Investigation into 3D Printing of Fibre Reinforced Thermoplastic Composites. Addit. Manuf. 2018, 22, 176–186. [Google Scholar] [CrossRef]
- Sugiyama, K.; Matsuzaki, R.; Ueda, M.; Todoroki, A.; Hirano, Y. 3D Printing of Composite Sandwich Structures Using Continuous Carbon Fiber and Fiber Tension. Compos. Part. A Appl. Sci. Manuf. 2018, 113, 114–121. [Google Scholar] [CrossRef]
- Deng, K.; Khan, M.H.U.; Park, S.; Sung, D.H.; Fu, K. Additive Manufacturing of Continuous Carbon Fiber/Epoxy Composites with Structured Core-Shell Towpreg: Methods, Characterization, and Mechanics. Compos. B Eng. 2025, 291, 112001. [Google Scholar] [CrossRef]
- Andrzejewski, J.; Gronikowski, M.; Aniśko, J. A Novel Manufacturing Concept of LCP Fiber-Reinforced GPET-Based Sandwich Structures with an FDM 3D-Printed Core. Materials 2022, 15, 5405. [Google Scholar] [CrossRef]
- Lu, C.; Qi, M.; Islam, S.; Chen, P.; Gao, S.; Xu, Y.; Yang, X. Mechanical Performance of 3D-Printing Plastic Honeycomb Sandwich Structure. Int. J. Precis. Eng. Manuf. Green Technol. 2018, 5, 47–54. [Google Scholar] [CrossRef]
- 3D LabPrint Technical Data Sheet and Specification of PolyLight 1.0. Available online: https://3dlabprint.com/faq/prusaslicer/ (accessed on 18 October 2024).
- Nofar, M.; Utz, J.; Geis, N.; Altstädt, V.; Ruckdäschel, H. Foam 3D Printing of Thermoplastics: A Symbiosis of Additive Manufacturing and Foaming Technology. Adv. Sci. 2022, 9, 2105701. [Google Scholar] [CrossRef]
- Loh, G.H.; Pei, E.; Gonzalez-Gutierrez, J.; Monzón, M. An Overview of Material Extrusion Troubleshooting. Appl. Sci. 2020, 10, 4776. [Google Scholar] [CrossRef]
- Sun, B.; Wu, L. Research Progress of 3D Printing Combined with Thermoplastic Foaming. Front. Mater. 2022, 9, 1083931. [Google Scholar] [CrossRef]
- Ashraf, W.; Ishak, M.R.; Zuhri, M.Y.M.; Yidris, N.; Ya’acob, A.M. Effect on Mechanical Properties by Partial Replacement of the Glass with Alkali-Treated Flax Fiber in Composite Facesheet of Sandwich Structure. J. Mater. Res. Technol. 2021, 13, 89–98. [Google Scholar] [CrossRef]
- Sadeghian, P.; Hristozov, D.; Wroblewski, L. Experimental and Analytical Behavior of Sandwich Composite Beams: Comparison of Natural and Synthetic Materials. J. Sandw. Struct. Mater. 2018, 20, 287–307. [Google Scholar] [CrossRef]
- Shaker, K.; Nawab, Y.; Jabbar, M. Bio-Composites: Eco-Friendly Substitute of Glass Fiber Composites. In Handbook of Nanomaterials and Nanocomposites for Energy and Environmental Applications; Kharissova, O.V., Martínez, L.M.T., Kharisov, B.I., Eds.; Springer International Publishing: Cham, Switzerland, 2020; pp. 1–25. ISBN 978-3-030-11155-7. [Google Scholar]
- Patel, R.V.; Yadav, A.; Winczek, J. Physical, Mechanical, and Thermal Properties of Natural Fiber-Reinforced Epoxy Composites for Construction and Automotive Applications. Appl. Sci. 2023, 13, 5126. [Google Scholar] [CrossRef]
- Khan, F.M.; Shah, A.H.; Wang, S.; Mehmood, S.; Wang, J.; Liu, W.; Xu, X. A Comprehensive Review on Epoxy Biocomposites Based on Natural Fibers and Bio-Fillers: Challenges, Recent Developments and Applications. Adv. Fiber Mater. 2022, 4, 683–704. [Google Scholar] [CrossRef]
- Böhm, M.; Brejcha, V.; Kobetičová, K.; Procházka, J.; Krejsová, J.; Koňáková, D.; Černý, R.; Polášek, M.; Heneberg, P.; Němcová, D. Composite Shell Element, Czech Utility Model 37723; Industrial Property Office of the Czech Republic: Prague, Czech Republic, 2024.
- Cao, D.; Bouzolin, D.; Lu, H.; Griffith, D.T. Bending and Shear Improvements in 3D-Printed Core Sandwich Composites through Modification of Resin Uptake in the Skin/Core Interphase Region. Compos. B Eng. 2023, 264, 110912. [Google Scholar] [CrossRef]
- Zeng, J.J.; Yan, Z.T.; Jiang, Y.Y.; Li, P.L. 3D Printing of FRP Grid and Bar Reinforcement for Reinforced Concrete Plates: Development and Effectiveness. Compos. Struct. 2024, 335, 117946. [Google Scholar] [CrossRef]
- Konsta-Gdoutos, M.S.; Gdoutos, E.E. The Effect of Load and Geometry on the Failure Modes of Sandwich Beams. Appl. Compos. Mater. 2005, 12, 165–176. [Google Scholar] [CrossRef]
- Da Silva, A.; Kyriakides, S. Compressive Response and Failure of Balsa Wood. Int. J. Solids Struct. 2007, 44, 8685–8717. [Google Scholar] [CrossRef]
- Al-Hamdan, A.; Ajlouni, M.; Alhusein, M.; Rudd, C.; Long, A. Behaviour of Core Materials during Resin Transfer Moulding of Sandwich Structures. Mater. Sci. Technol. 2000, 16, 929–934. [Google Scholar] [CrossRef]
- Schlimper, R.; Müller, M.; Willner, F.; Schäuble, R. Resin Absorption and Deformation Behaviour of Foam Core Materials for High Performance Sandwich Panels. In Proceedings of the 14th European Conference on Composite Materials, Budapest, Hungary, 7–10 June 2010. [Google Scholar]
- Cullen, R.K.; Grove, S.M.; Summerscales, J. Resin infusion of sandwich structures—Core/skin interactions and void formation. In Proceedings of the ICCM International Conferences on Composite Materials, Edinburgh, Scotland, 27–31 September 2009. [Google Scholar]


| Group | Fiber | Core |
|---|---|---|
| GF | Aeroglass 200 g/m2 twill | PVC core foam |
| FF | FLAXDRY-BL200 200 g/m2 | PVC core foam |
| F3D | FLAXDRY-BL200 200 g/m2 | PolyLight 1.0 LW-PLA |
| FB | FLAXDRY-BL200 200 g/m2 | End-grain balsa core |
| Group/Sample | x [kg/m3] | Min [kg/m3] | Max [kg/m3] | SD [kg/m3] |
|---|---|---|---|---|
| GF | 416.56 | 399.96 | 437.22 | 15.77 |
| FF | 432.21 | 416.88 | 447.56 | 12.83 |
| F3D | 424.46 | 396.73 | 440.76 | 17.63 |
| FB | 405.41 | 384.93 | 431.86 | 18.29 |
| Group | x [MPa] | Min [MPa] | Max [MPa] | SD [MPa] |
|---|---|---|---|---|
| GF | 5085.12 | 4914.52 | 5409.55 | 175.31 |
| FF | 2429.28 | 2120.85 | 2971.30 | 254.24 |
| F3D | 2269.19 | 2216.60 | 2310.52 | 29.93 |
| FB | 2445.25 | 2196.85 | 2782.82 | 193.40 |
| Group | x [MPa] | Min [MPa] | Max [MPa] | SD [MPa] |
|---|---|---|---|---|
| GF | 43.88 | 34.52 | 54.40 | 8.67 |
| FF | 38.41 | 31.24 | 48.01 | 5.63 |
| F3D | 31.46 | 29.17 | 34.62 | 2.01 |
| FB | 30.83 | 20.72 | 37.04 | 5.68 |
Disclaimer/Publisher’s Note: The statements, opinions and data contained in all publications are solely those of the individual author(s) and contributor(s) and not of MDPI and/or the editor(s). MDPI and/or the editor(s) disclaim responsibility for any injury to people or property resulting from any ideas, methods, instructions or products referred to in the content. |
© 2025 by the authors. Licensee MDPI, Basel, Switzerland. This article is an open access article distributed under the terms and conditions of the Creative Commons Attribution (CC BY) license (https://creativecommons.org/licenses/by/4.0/).
Share and Cite
Brejcha, V.; Böhm, M.; Holeček, T.; Jerman, M.; Kobetičová, K.; Burianová, I.; Černý, R.; Pavlík, Z. Comparison of Bending Properties of Sandwich Structures Using Conventional and 3D-Printed Core with Flax Fiber Reinforcement. J. Compos. Sci. 2025, 9, 182. https://doi.org/10.3390/jcs9040182
Brejcha V, Böhm M, Holeček T, Jerman M, Kobetičová K, Burianová I, Černý R, Pavlík Z. Comparison of Bending Properties of Sandwich Structures Using Conventional and 3D-Printed Core with Flax Fiber Reinforcement. Journal of Composites Science. 2025; 9(4):182. https://doi.org/10.3390/jcs9040182
Chicago/Turabian StyleBrejcha, Viktor, Martin Böhm, Tomáš Holeček, Miloš Jerman, Klára Kobetičová, Ivana Burianová, Robert Černý, and Zbyšek Pavlík. 2025. "Comparison of Bending Properties of Sandwich Structures Using Conventional and 3D-Printed Core with Flax Fiber Reinforcement" Journal of Composites Science 9, no. 4: 182. https://doi.org/10.3390/jcs9040182
APA StyleBrejcha, V., Böhm, M., Holeček, T., Jerman, M., Kobetičová, K., Burianová, I., Černý, R., & Pavlík, Z. (2025). Comparison of Bending Properties of Sandwich Structures Using Conventional and 3D-Printed Core with Flax Fiber Reinforcement. Journal of Composites Science, 9(4), 182. https://doi.org/10.3390/jcs9040182