
Effect of Phosphogypsum Origin and Calcination Temperature on Characteristics of Supersulfated Cements

 , ,
, , 
 and
and
Abstract
1. Introduction
2. Materials and Methods
2.1. Materials
- FG from OOO “Phosphorit” (Kingisepp, Russia)—FGK. Apatite concentrate of the Kovdorskoye deposit (Kovdor, Russia) of ultrabasic alkaline rocks with magmatic and metasomatic carbonatites of the Lower Paleozoic age, and organogenic phosphorites of the Karatau phosphorite-bearing basin (Zhanatas, Republic of Kazakhstan) are used as a raw material for the production of acid by this enterprise.
- G from CJSC “FosAgro AG” (Balakovo, Russia)—FGB. Here, the source of raw materials for acid production is the Khibina deposit of alkaline rocks of the Kola Peninsula (Apatity, Russia), with layer- and lens-shaped deposits of complex apatite ores associated with nepheline syenites.
2.2. Sample Preparation and Experimental Design
- –
- pH value of the fresh SSC (pH);
- –
- the mini-cone flow diameter for fresh SSC with a water content of 35% (D);
- –
- the average density of samples dried in an oven to a constant mass at a temperature of 60 °C at the age of 2 days (), 7 days (), 28 days (), and 90 days ();
- –
- compressive strength of samples dried to a constant mass in a drying oven at a temperature of 60 °C at the age of 2 days (R(2)), 7 days (R(7)), 28 days (R(28)), 90 days (R(90));
- –
- pH value of the pore space of SSC aged 28 days (pH28).
2.3. Methods
3. Results and Discussions
3.1. Characteristics of FAB
3.2. Effect of Composition and Technological Parameters on the Characteristics of SSCs
3.2.1. Effect of Composition and Technological Parameters on Mini-Cone Flow Diameter of Fresh SSCs
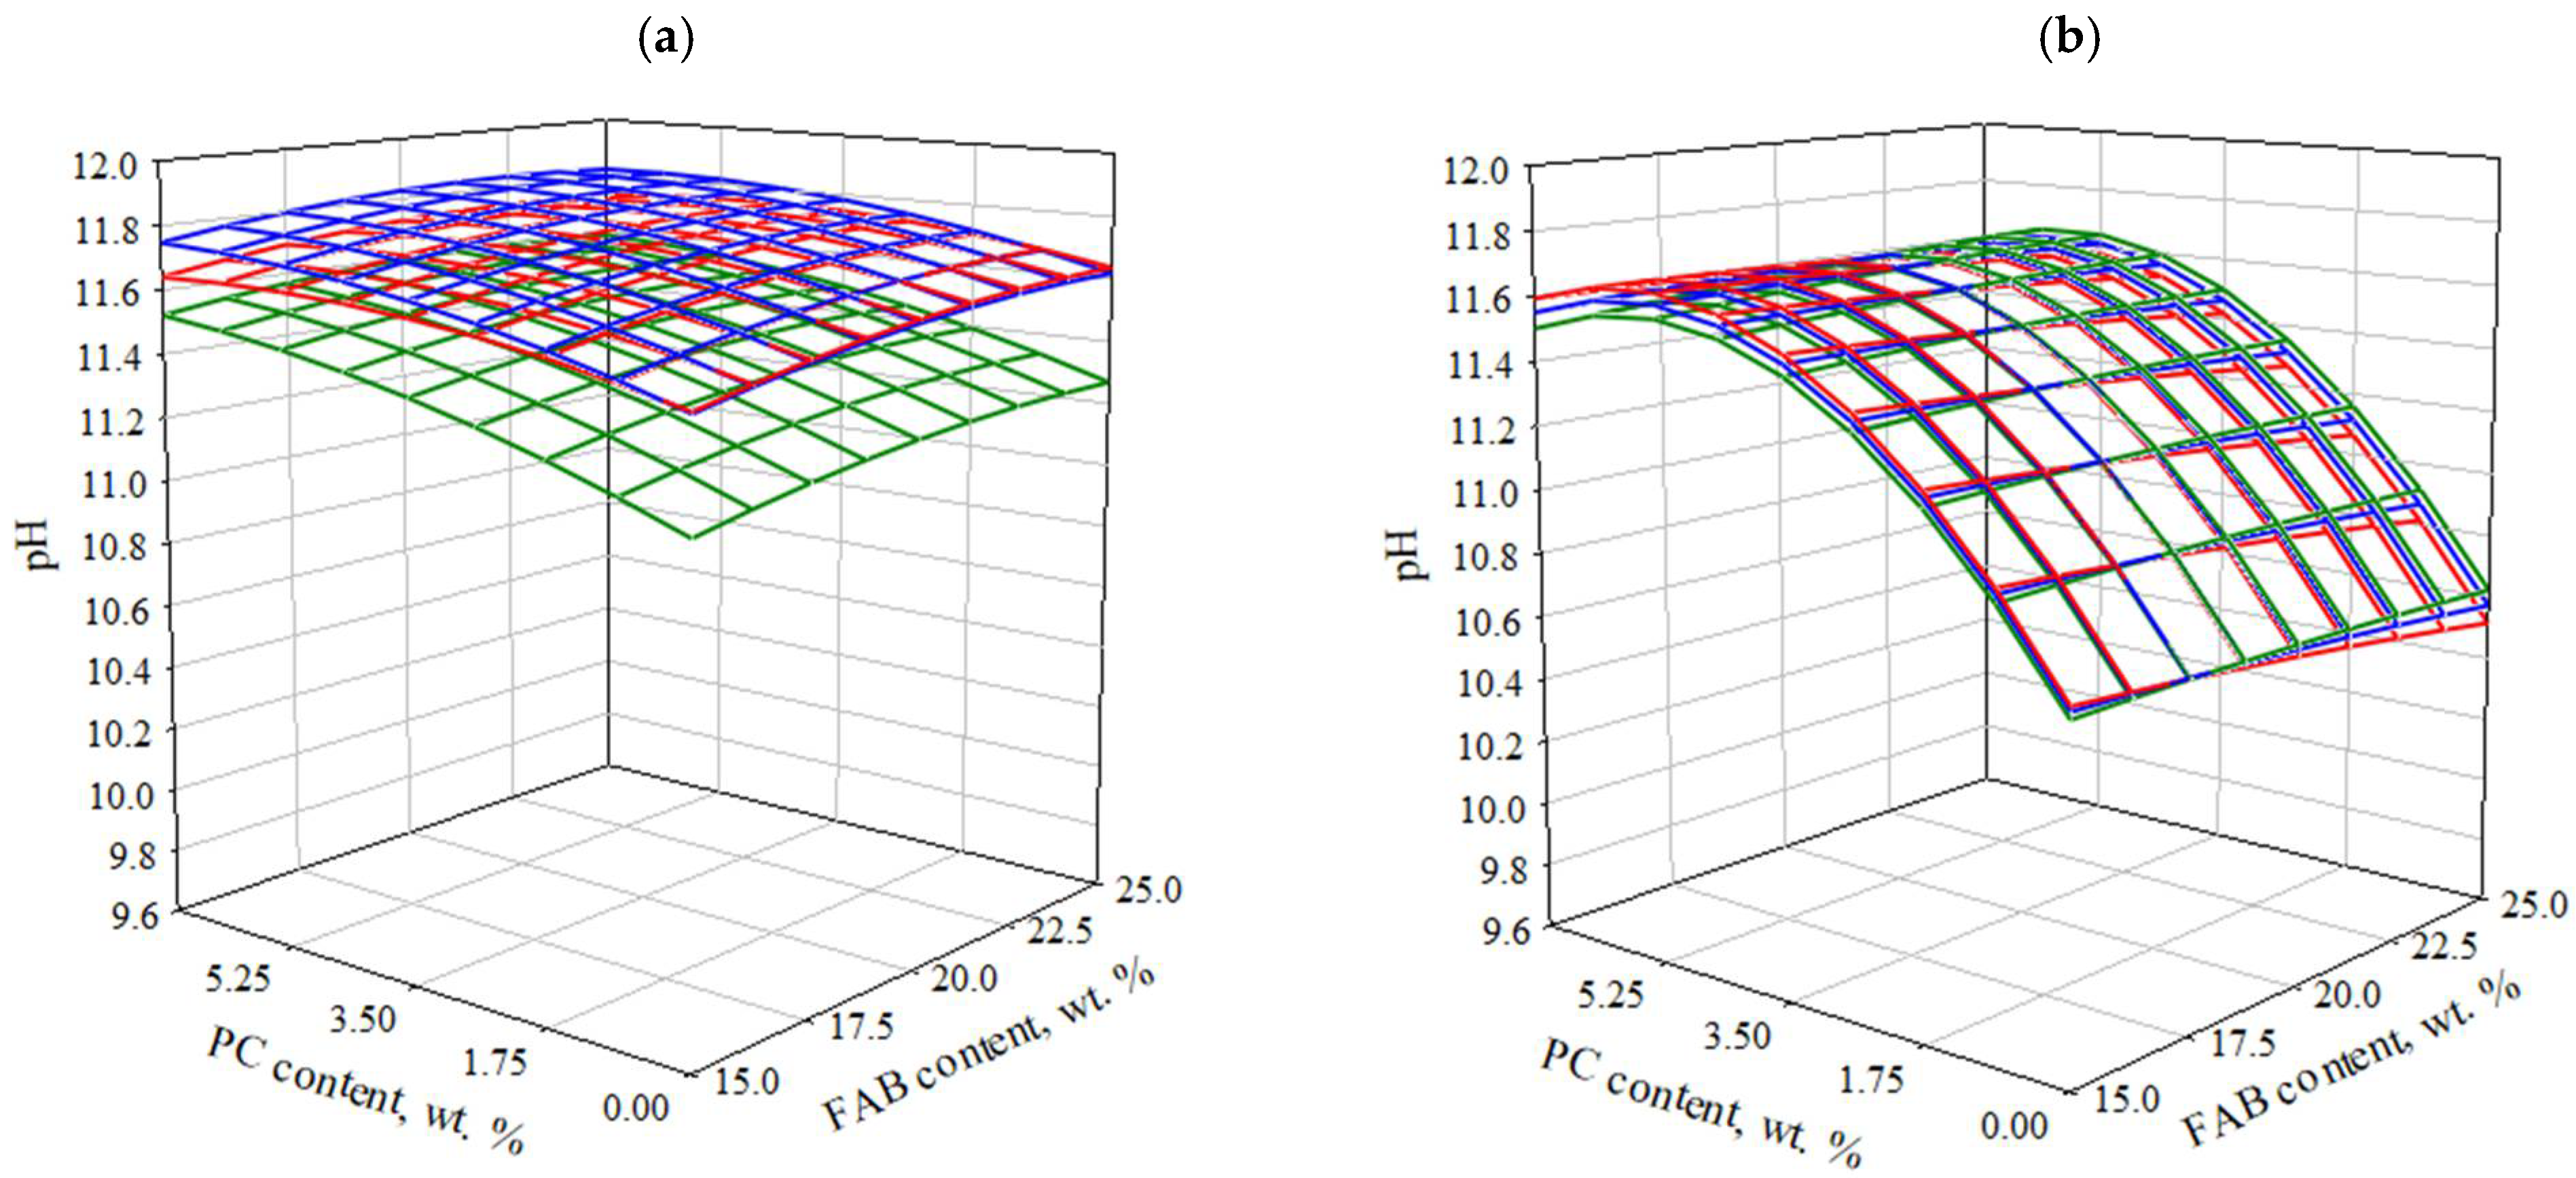
3.2.2. Effect of Composition and Technological Parameters on the pH Value of Water Extract Based on SSC
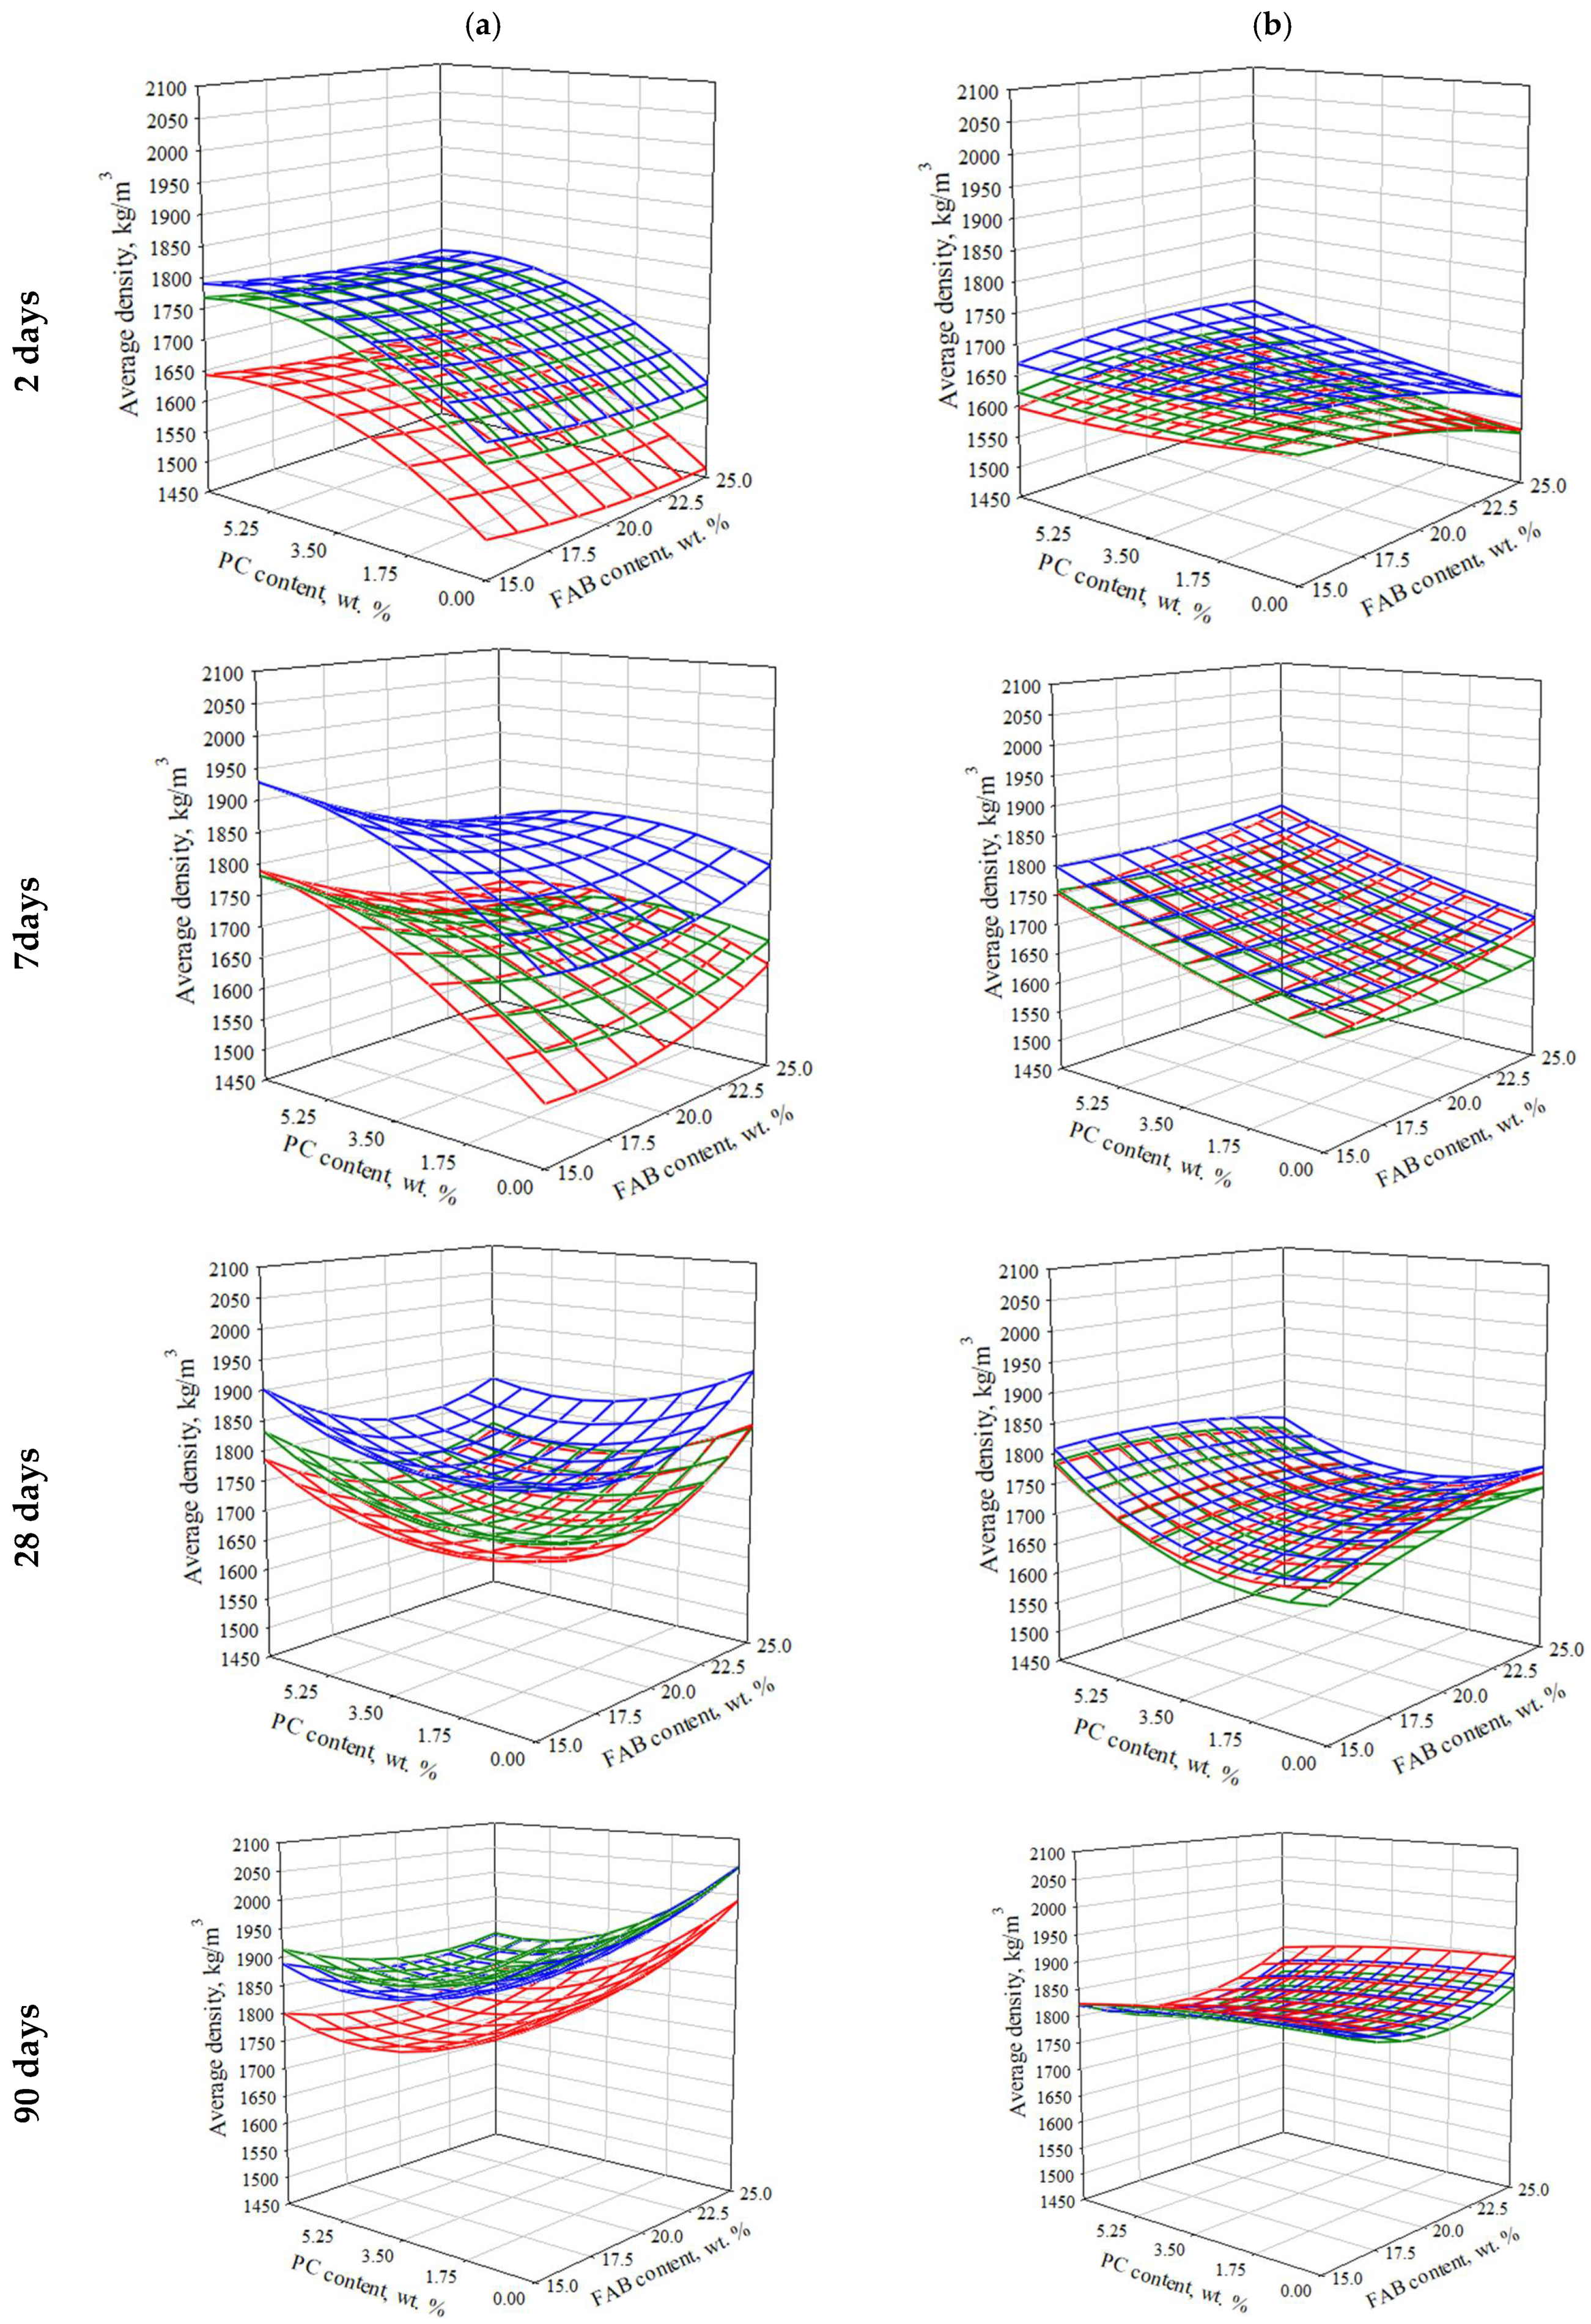
3.2.3. The Effect of Composition and Technological Parameters on the Average Density of Consolidated SSC
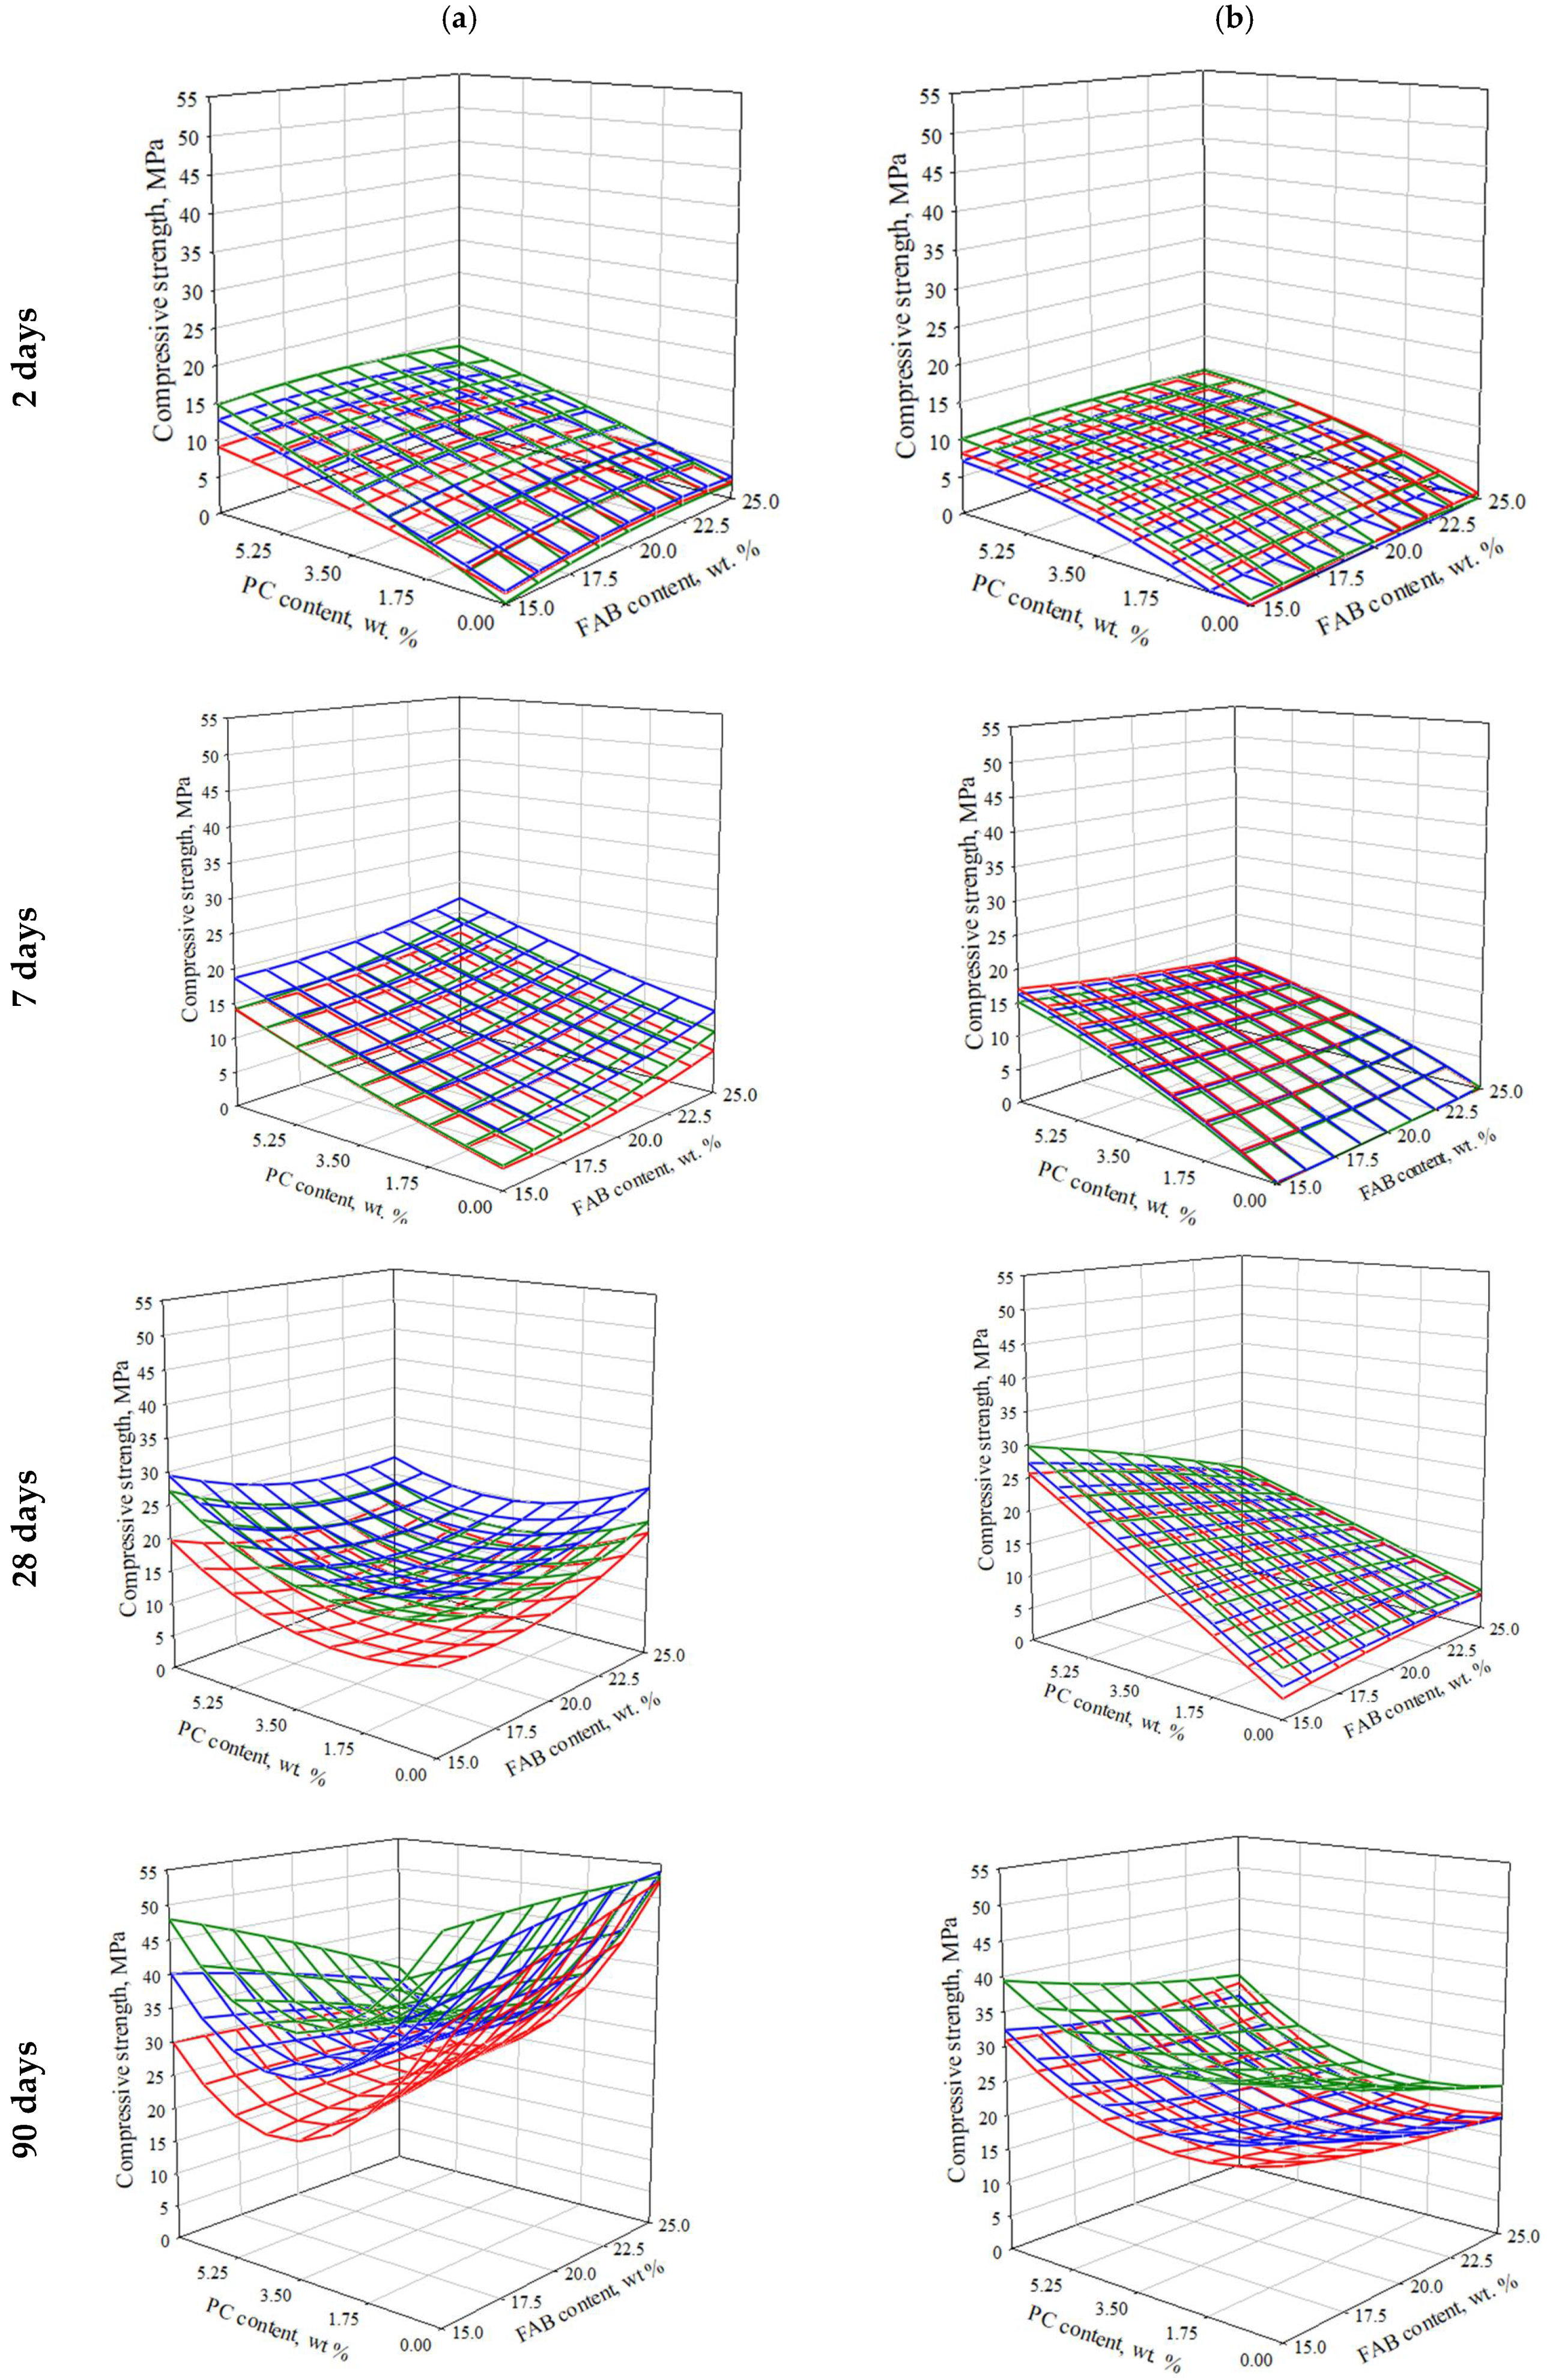
3.2.4. Effect of Composition and Technological Parameters on Compressive Strength of SSCs
- When production of SSCK with the maximum content of PC (7% of GBFS) and FAB (25% of GBFS), which is characterized by high pH values (11.9–12.5), the most favorable conditions for alkaline activation of slag are provided, with the release of a large number of Si4+ and Al3+ ions, which actively interact with the extra amount of . This leads to the formation of ettringite and gel CS(A)H, which up to 7 days, contributes to the most intense increase in strength. In the future, most likely due to the formation of an excessively compact layer of new formations on the surface of the slag and blocking ion exchange with the porous medium, the reaction begins to slow down. The intensity of hardening of the SSC due to the content of PC after 7 days of hardening is also significantly reduced due to the consumption of the main part of the clinker substance and the blocking of its residues. The ability of FAB to self-harden is relatively low in the entire studied time interval, so it cannot provide a noticeable strengthening of the SSC.
- A lower content of FABK in the SSC promotes smoother hydration processes. Probably, this is due to a decrease in the degree of alkaline activation of slag. This is weakly reflected in the early strength, which is mainly provided by PC. However, in the later period of hardening, the strength of SSCK containing 15% of FAB exceeds the strength of SSCK with 25% of FAB. Also, this phenomenon is facilitated by the increase in the content of GBFS in the SSC, as the main source of Si4+ and Al3+ ions, which are responsible for SSC hardening.
- The above-mentioned makes it possible to assume that the key factor affecting the rate and efficiency of SSC hardening is the provision of a rational degree of activation of GBFS, when the ion exchange between the surface of the solid phase and the liquid phase in the pore space of the binder is sufficiently intense and long-lasting. This is greatly facilitated by the increase in the area of the active surface of GBFS due to the increase in dispersion (this factor is not considered in the framework of this study) or its content in the SSC, which increases with a decrease in the content of FAB and PC.
- An increase in the pH value and (or) content of FAB contributes to an increase in the initial rate of hardening, but also increases the coefficient of inhibition of this process. Accordingly, for different types of FAB, depending on their genetic characteristics, the rational degree of activation of GBFS will be reached at different contents of FG depending on its pH value.In the case of SSCB with the maximum content of PC, the tendency to decrease strength with increasing content of FABB is observed at earlier periods of hardening, which is probably associated with lower pH values of FABB, as one of the significant factors of intensification of GBFS hardening. This, together with a decrease in the emission of ions associated with a decrease in the reactive surface of GBFS in SSC, negatively affects the volume of new formations and the hydration process.
- A decrease in PC content in the SSCB from 7% to ≈3.5%, which provides its own contribution to the hardening of the SSC and is an alkaline activator, initiates a decrease in strength, regardless of the content of FAB in the binder. Most likely, in this case, the PC content is still insufficient for the effective alkaline activation of the slag. At the same time, new formations of PC paste settle on the surface of the slag, which is the most represented crystallization substrate, and block access to it. The increase in FAB content is not significant, but it also negatively affects the compressive strength. This can be explained by the prevalence of reduction in the active surface of slag over the activating effect of FAB. At the same time, the tendency to decrease is most pronounced when using FABB, which is explained by its lower pH value and smaller contribution to the GBFS activation process.
- Further reduction in PC content from 3.5% to 0%, FAB turns out to be the main agent that activates the hydration of GBFS. At the same time, when the presence of FABB (with a lower pH value), the structure formation and hardening of the SSCB proceeds mainly through the mechanism of sulfate activation. The dissolution of slag under the action of ions proceeds much more slowly than in a medium with a high pH value. This causes a slower and smoother set of strength with a low braking coefficient of this process, but also lower ultimate strength in the considered time interval.In the case of using FABK (with a high pH value), probably, the alkaline mechanism of activation remains predominant. The absence of PC has a negative effect on the early strength, but at the same time, one of the factors blocking the slag surface is excluded, and its relative amount in the system increases, which reduces the degree of inhibition of the hardening system and provides the highest strength in the late hardening period (90 days).
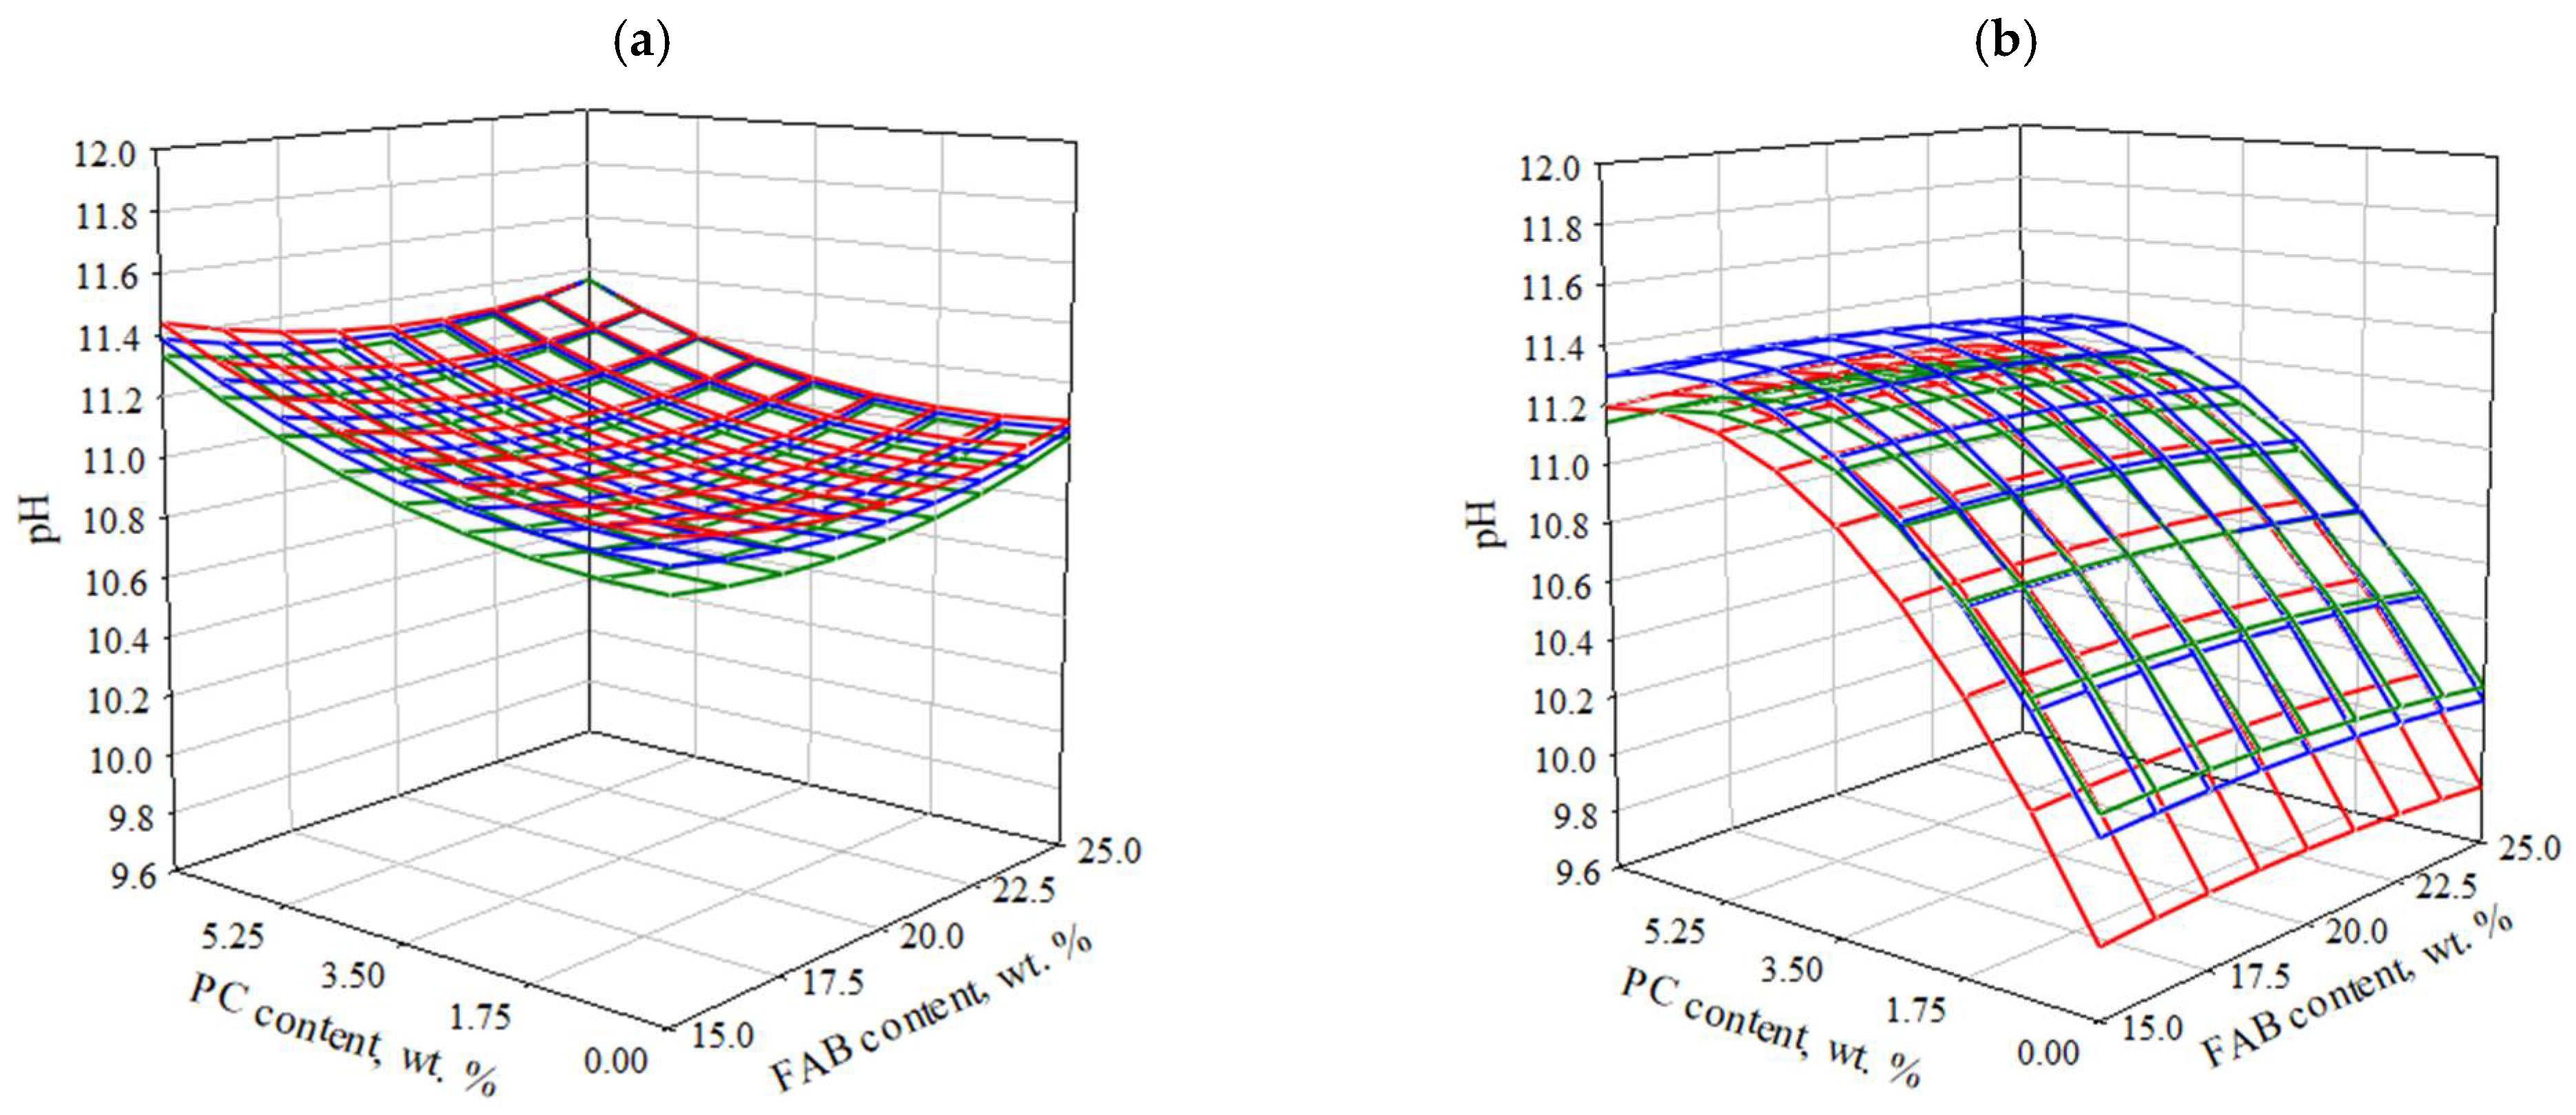
3.2.5. Effect of Composition and Technological Parameters on pH Value in the Pore Space of SSC Samples at the Age of 28 Days
3.3. Morphology and Type of New Formations
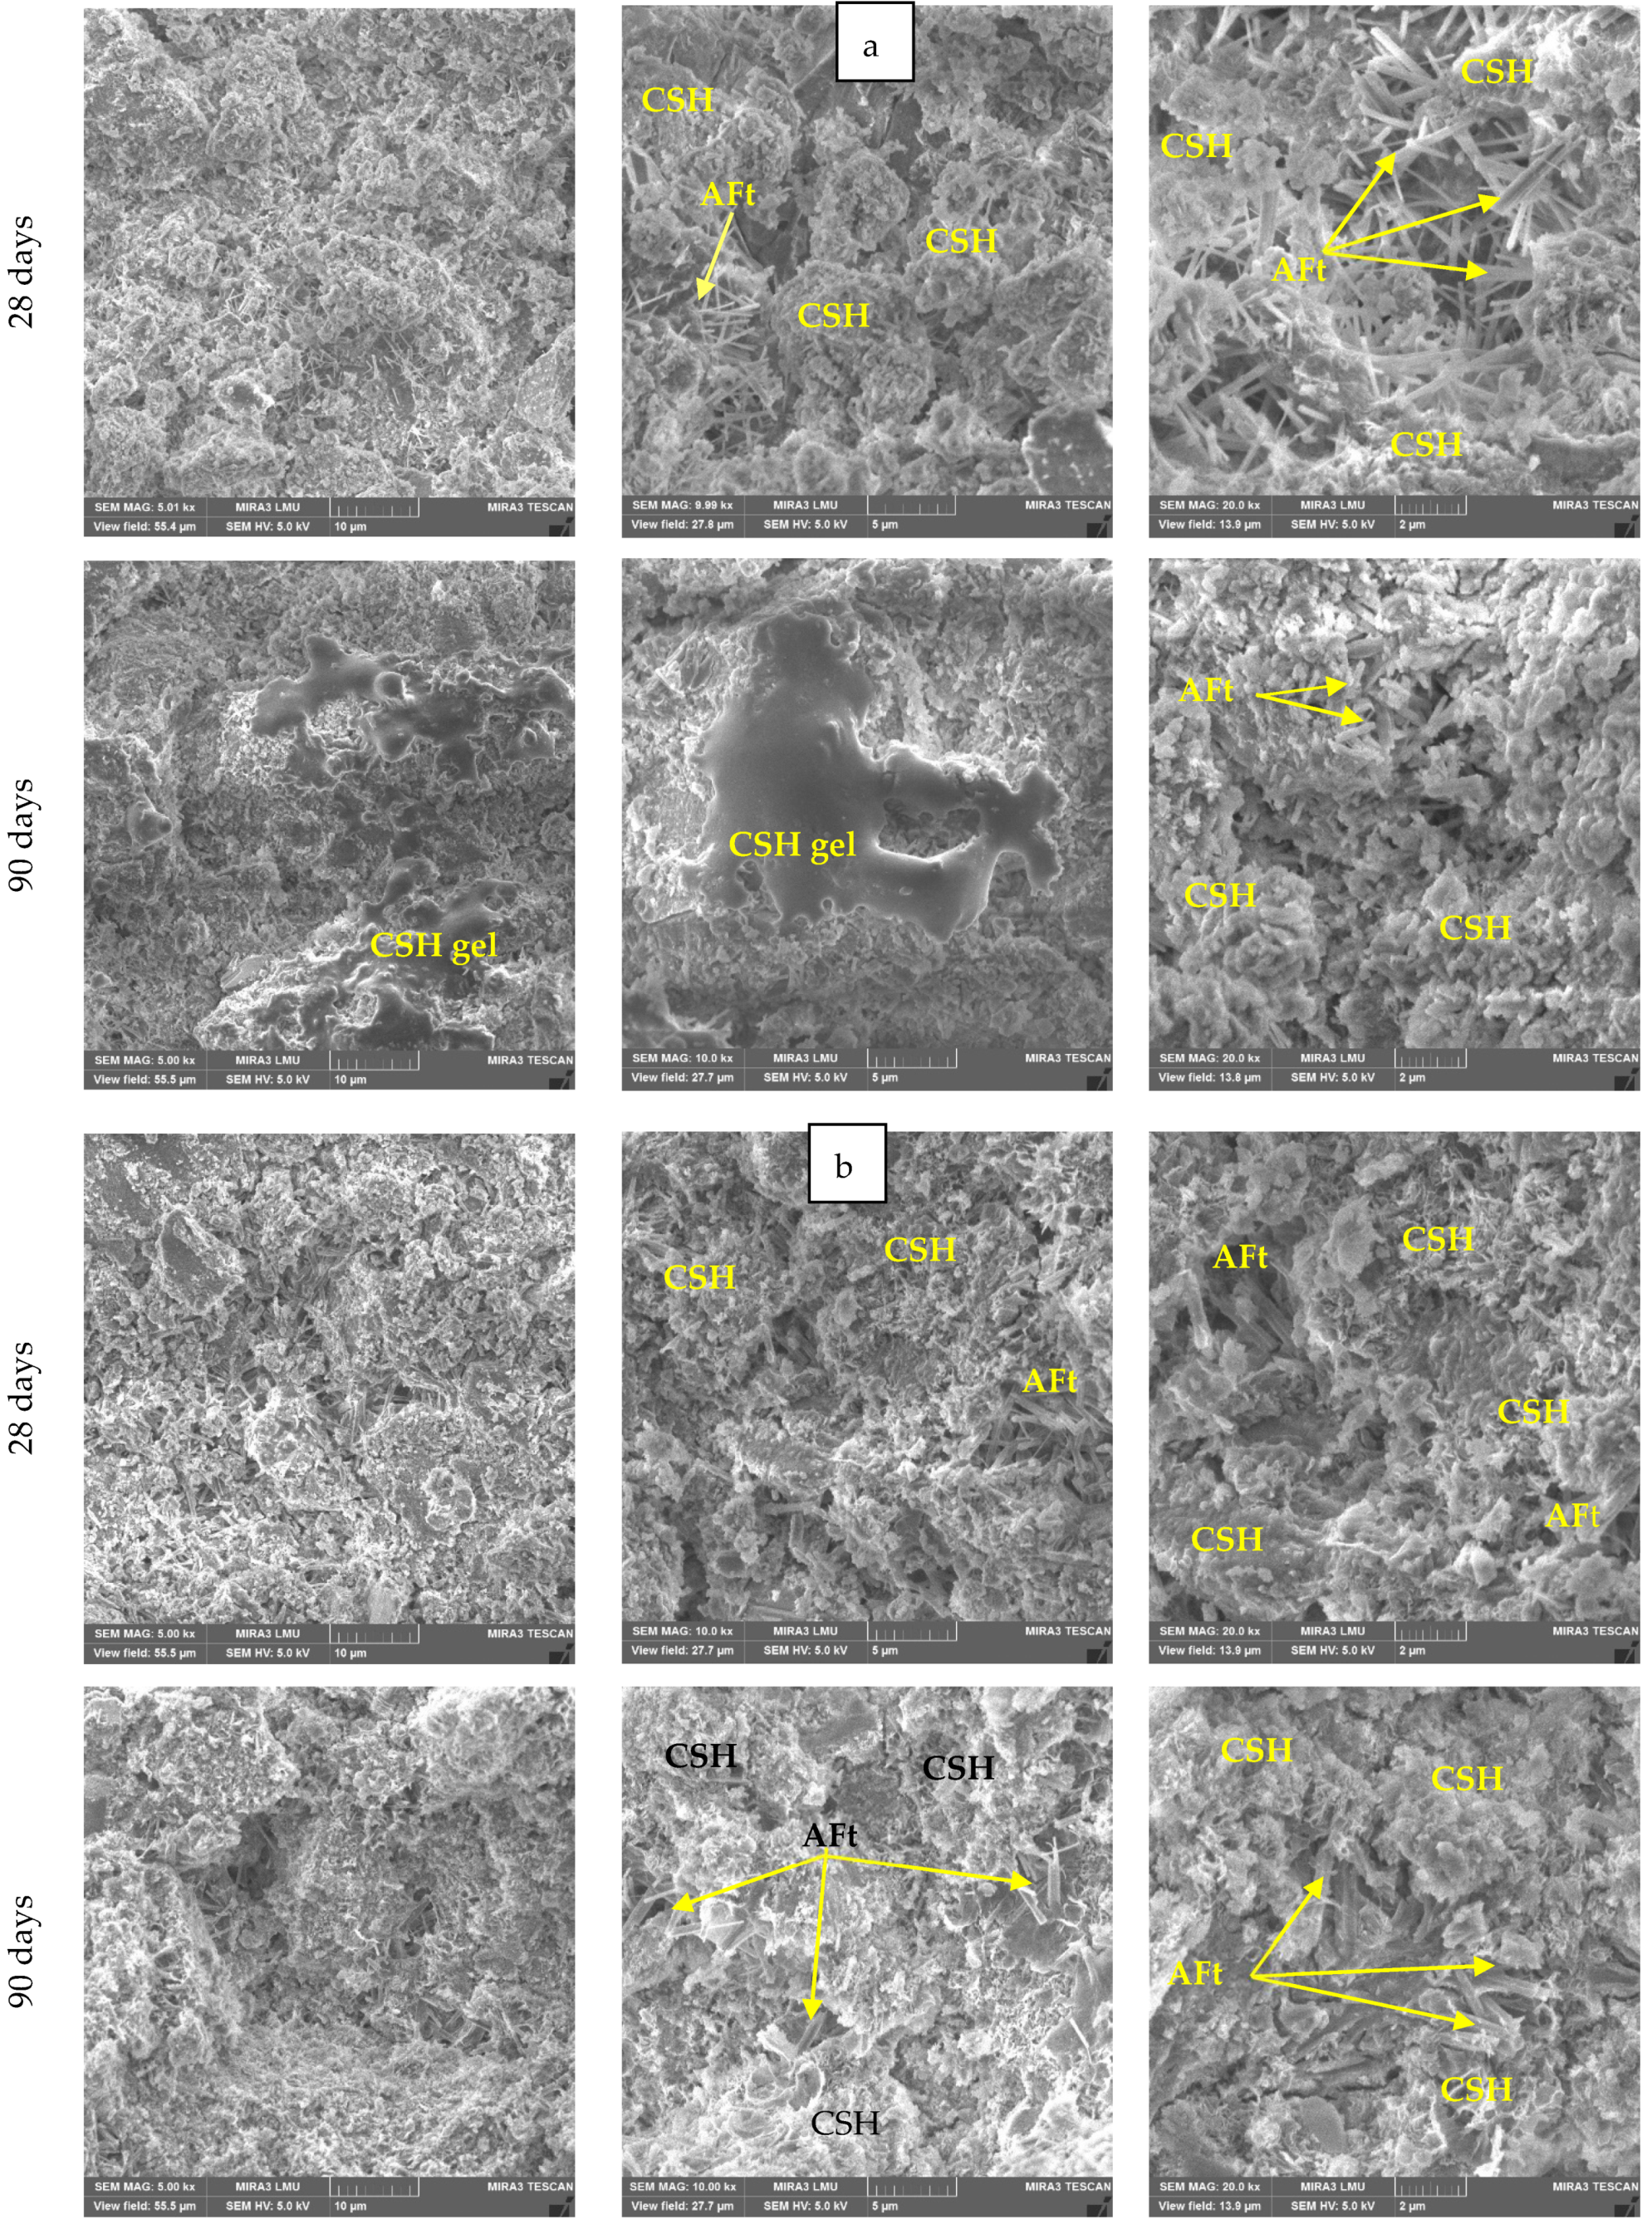
3.3.1. Morphology of New Formations
3.3.2. XRD Analysis of New Formations
4. Conclusions
Author Contributions
Funding
Data Availability Statement
Acknowledgments
Conflicts of Interest
References
- Luo, W.; Li, B.; Xu, M.; Pang, C.; Lester, E.; Xu, L.; Kow, K.-W. In-situ release and sequestration of CO2 in cement composites using LTA zeolites. Sci. Total Environ. 2023, 872, 162133. [Google Scholar] [CrossRef] [PubMed]
- Supriya; Chaudhury, R.; Sharma, U.; Thapliyal, P.C.; Singh, L.P. Low-CO2 emission strategies to achieve net zero target in cement sector. J. Clean. Prod. 2023, 417, 137466. [Google Scholar] [CrossRef]
- Kaliyavaradhan, S.K.; Ling, T.-C. Potential of CO2 sequestration through construction and demolition (C&D) waste—An overview. J. CO2 Util. 2017, 20, 234–242. [Google Scholar] [CrossRef]
- Juenger, M.C.G.; Winnefeld, F.; Provis, J.L.; Ideker, J.H. Advances in alternative cementitious binders. Cem. Concr. Res. 2011, 41, 1232–1243. [Google Scholar] [CrossRef]
- Ouyang, G.; Li, Z.; Sun, T.; Ye, Z.; Deng, Y.; Li, W. Greener phosphogypsum-based all-solid-waste cementitious binder with steel slag activation: Hydration, mechanical properties and durability. J. Clean. Prod. 2024, 443, 140996. [Google Scholar] [CrossRef]
- Wu, Q.; Xue, Q.; Yu, Z. Research status of super sulfate cement. J. Clean. Prod. 2021, 294, 126228. [Google Scholar] [CrossRef]
- Gruskovnjak, A.; Lothenbach, B.; Winnefeld, F.; Figi, R.; Ko, S.-C.; Adler, M.; Mäder, U. Hydration mechanisms of super sulphated slag cement. Cem. Concr. Res. 2008, 38, 983–992. [Google Scholar] [CrossRef]
- Zokaei, S.; Siad, H.; Lachemi, M.; Mahmoodi, O.; Ozcelikci, E.; Şahmaran, M. Engineered Cementitious Composites with Super-Sulfated Cement: Mechanical, Physical, and Durability Performance. Materials 2024, 17, 2240. [Google Scholar] [CrossRef]
- Kühl, H. Verfahren zur Herstellung von Zement aus Hochofenschlacke. German Patent No. 237,777, 23 December 1908. [Google Scholar]
- EN 15743:2010+A1:2015; «Supersulfated Cement—Composition, Specifications, and Conformity Criteria». European Committee for Standardization (CEN): Brussels, Belgium, 2010.
- Alfimova, N.I.; Levickaya, K.M.; Elistratkin, M.Y.; Bukhtiyarov, I.Y. Supersulfated cements: A review analysis of the features of properties, raw materials, production and application prospects. Bull. BSTU Named After V.G. Shukhov 2024, 7, 8–24. [Google Scholar] [CrossRef]
- Shi, X.; Zeng, A.; Duan, H.; Zhang, H.; Yang, J. Status and development trends of phosphogypsum utilization in China. Circ. Econ. 2024, 3, 100116. [Google Scholar] [CrossRef]
- Wu, F. The treatment of phosphogypsum leachate is more urgent than phosphogypsum. Environ. Res. 2024, 262, 119849. [Google Scholar] [CrossRef] [PubMed]
- Wei, Z.; Deng, Z. Research hotspots and trends of comprehensive utilization of phosphogypsum: Bibliometric analysis. J. Environ. Radioact. 2022, 242, 106778. [Google Scholar] [CrossRef] [PubMed]
- Liu, S.; Ouyang, J.; Ren, J. Mechanism of calcination modification of phosphogypsum and its effect on the hydration properties of phosphogypsum-based supersulfated cement. Constr. Build. Mater. 2020, 243, 118226. [Google Scholar] [CrossRef]
- Xie, Y.; Sun, T.; Shui, Z.; Ding, C.; Li, W. The impact of carbonation at different CO2 concentrations on the microstructure of phosphogypsum-based supersulfated cement paste. Constr. Build. Mater. 2022, 340, 127823. [Google Scholar] [CrossRef]
- Wang, L.; Gao, Z.; Gao, F.; Li, X.; Chang, S.; Liu, S. Comparing study on the evolution characteristics of performance and microstructure between Portland slag cement and supersulfated cement under chemical attacks. Constr. Build. Mater. 2024, 425, 135969. [Google Scholar] [CrossRef]
- Pinto, S.R.; da Luz, C.A.; Munhoz, G.S.; Medeiros-Junior, R.A. Durability of phosphogypsum-based supersulfated cement mortar against external attack by sodium and magnesium sulfate. Cement. Concr. Res. 2020, 136, 106172. [Google Scholar] [CrossRef]
- Liu, S.; Wang, L.; Yu, B. Effect of modified phosphogypsum on the hydration properties of the phosphogypsum-based supersulfated cement. Constr. Build. Mater. 2019, 214, 9–16. [Google Scholar] [CrossRef]
- Bilal, E.; Bellefqih, H.; Bourgier, V.; Mazouz, H.; Dumitraş, D.-G.; Bard, F.; Laborde, M.; Caspar, J.P.; Guilhot, B.; Iatan, E.-L.; et al. Phosphogypsum circular economy considerations: A critical review from more than 65 storage sites worldwide. J. Clean. Prod. 2023, 414, 137561. [Google Scholar] [CrossRef]
- Levickaya, K.; Alfimova, N.; Nikulin, I.; Kozhukhova, N.; Buryanov, A. The Use of Phosphogypsum as a Source of Raw Materials for Gypsum-Based Materials. Resources 2024, 13, 69. [Google Scholar] [CrossRef]
- Gordashevsky, P.F.; Dolgorev, A.V. Production of Gypsum Binders from Gypsum-Containing Waste; Stroyizdat: Moscow, Russia, 1987; 105p. [Google Scholar]
- Akhmedov, M.A.; Atakuziev, T.A. Phosphogypsum. In Research and Application; Fan: Tashkent, Uzbekistan, 1980; 156p. [Google Scholar]
- Schmid, T.; Jungnickel, R.; Dariz, P. Insights into the CaSO4–H2O System: A Raman-Spectroscopic Study. Minerals 2020, 10, 115. [Google Scholar] [CrossRef]
- Klimenko, V.G.; Pavlenko, V.I.; Gasanov, S.K. The Role of pH Medium in Forming Binding Substauces on Base of Calcium Sulphate. Middle East J. Sci. Res. 2013, 17, 1169–1175. [Google Scholar]
- Sioulas, B.; Sanjayan, J.G. The coloration phenomenon associated with slag blended cements. Cem. Concr. Res. 2001, 31, 313–320. [Google Scholar] [CrossRef]
- Couvidat, J.; Diliberto, C.; Meux, E.; Izoret, L.; Lecomte, A. Greening effect of concrete containing granulated blast-furnace slag composite cement: Is there an environmental impact? Cem. Concr. Compos. 2020, 113, 103711. [Google Scholar] [CrossRef]
- Le Cornec, D.; Wang, Q.; Galoisy, L.; Renaudin, G.; Izoret, L.; Calas, G. Greening effect in slag cement materials. Cem. Concr. Compos. 2017, 84, 93–98. [Google Scholar] [CrossRef]


| PGB | PGK | ||||
|---|---|---|---|---|---|
| Oxide | % | StdErr% | Oxide | % | StdErr % |
| SO3 | 48.84 | 0.250 | CaO | 47.03 | 0.250 |
| CaO | 46.44 | 0.250 | SO3 | 46.85 | 0.250 |
| SrO | 2.520 | 0.080 | P2O5 | 1.580 | 0.060 |
| P2O5 | 0.684 | 0.034 | SiO2 | 1.270 | 0.060 |
| CeO2 | 0.362 | 0.018 | SrO | 1.050 | 0.050 |
| PuO2 | 0.167 | 0.010 | F | 0.980 | 0.170 |
| MgO | 0.145 | 0.008 | Al2O3 | 0.319 | 0.016 |
| SiO2 | 0.127 | 0.009 | CeO2 | 0.216 | 0.011 |
| Fe2O3 | 0.124 | 0.006 | MgO | 0.205 | 0.010 |
| Na2O | 0.121 | 0.018 | Na2O | 0.104 | 0.019 |
| La2O3 | 0.119 | 0.009 | Other | 0.395 | |
| Nd2O3 | 0.113 | 0.006 | |||
| Other | 0.233 | ||||
| SiO2 | CaO | Al2O3 | MgO | TiO2 | Na2O | SO3 | K2O | Fe2O3 |
|---|---|---|---|---|---|---|---|---|
| 36.46 | 32.07 | 13.65 | 12.50 | 1.93 | 1.07 | 0.93 | 0.52 | 0.37 |
| SiO2 | CaO | Al2O3 | MgO | Fe2O3 | Others |
|---|---|---|---|---|---|
| 21.9 | 66.1 | 5.2 | 0.8 | 4.4 | 1.6 |
| Parameter | Type FG and Calcination Temperature | |||||
|---|---|---|---|---|---|---|
| FGK | FGB | |||||
| 600 °C | 800 °C | 1000 °C | 600 °C | 800 °C | 1000 °C | |
| SSA after calcination, m2/kg | 214.6 | 37.3 | 29.1 | 242.3 | 143.0 | 14.7 |
| Grinding duration, min | 1 | 23 | 49 | 0,5 | 15 | 47 |
| SSA after grinding, m2/kg | 319.8 | 330.2 | 341.8 | 345.6 | 324.8 | 347.8 |
| Parameters | Variation Levels of Studied Parameters | Variability Interval | |||
|---|---|---|---|---|---|
| Original Form | Coded Form | −1 | 0 | +1 | |
| FAB content, % of GBFS | X1 | 15 | 20 | 25 | 5 |
| PC content, % of GBFS | X2 | 0 | 3.5 | 7 | 3.5 |
| Calcination temperature of FG, °C | X3 | 600 | 800 | 1000 | 200 |
| No. | Input Parameters | |||||
|---|---|---|---|---|---|---|
| Coded Form | Original Form | |||||
| X1 | X2 | X3 | FAB * Content, % of GBFS | PC Content, % of GBFS | Calcination Temperature of FG, °C | |
| 1 | +1 | +1 | +1 | 25 | 7 | 1000 |
| 2 | +1 | +1 | −1 | 25 | 7 | 600 |
| 3 | +1 | −1 | +1 | 25 | 0 | 1000 |
| 4 | +1 | −1 | −1 | 25 | 0 | 600 |
| 5 | −1 | +1 | +1 | 15 | 7 | 1000 |
| 6 | −1 | +1 | −1 | 15 | 7 | 600 |
| 7 | −1 | −1 | +1 | 15 | 0 | 1000 |
| 8 | −1 | −1 | −1 | 15 | 0 | 600 |
| 9 | +1 | 0 | 0 | 25 | 3.5 | 800 |
| 10 | −1 | 0 | 0 | 15 | 3.5 | 800 |
| 11 | 0 | +1 | 0 | 20 | 7 | 800 |
| 12 | 0 | −1 | 0 | 20 | 0 | 800 |
| 13 | 0 | 0 | +1 | 20 | 3.5 | 1000 |
| 14 | 0 | 0 | −1 | 20 | 3.5 | 600 |
| 15 | 0 | 0 | 0 | 20 | 3.5 | 800 |
| Mix ID According to (Table 6) | Average Values of Controlled Parameters and Average Statistical Deviations (%) | ||||||||||
|---|---|---|---|---|---|---|---|---|---|---|---|
| Fresh Mix | SSC-FGK Samples | ||||||||||
| pH Value | Mini-Cone Flow Diameter, mm | Average Density, kg/m3 | Compressive Strength, MPa | pH28 | |||||||
| Curing Time, Days | |||||||||||
| 2 | 7 | 28 | 90 | 2 | 7 | 28 | 90 | ||||
| 1 | 11.76 | 98.0 | 1590 ± 0.1 | 1737 ± 1.5 | 1722 ± 0.9 | 1783 ± 1.6 | 6.13 ± 2.1 | 17.25 ± 3.9 | 15.50 ± 2.2 | 27.17 ± 4.8 | 11.40 |
| 2 | 11.58 | 61.9 | 1733 ± 0.3 | 1605 ± 1.4 | 1776 ± 1.2 | 1898 ± 0.6 | 13.21 ± 0.9 | 18.98 ± 3.8 | 16.68 ± 4.0 | 32.56 ± 4.2 | 11.36 |
| 3 | 11.62 | 94.7 | 1475 ± 1.0 | 1624 ± 0.3 | 1847 ± 0.6 | 2029 ± 0.1 | 2.13 ± 4.3 | 6.21 ± 3.4 | 16.23 ± 2.1 | 52.50 ± 4.6 | 11.05 |
| 4 | 11.24 | 74.4 | 1584 ± 0.9 | 1657 ± 0.8 | 1800 ± 0.3 | 2013 ± 1.5 | 2.00 ± 2.6 | 14.62 ± 4.8 | 21.12 ± 0.5 | 54.58 ± 3.7 | 11.05 |
| 5 | 11.67 | 96.1 | 1638 ± 0.5 | 1787 ± 1.5 | 1813 ± 2.3 | 1826 ± 2.5 | 8.85 ± 4.8 | 13.00 ± 3.7 | 18.88 ± 4.0 | 28.00 ± 1.8 | 11.42 |
| 6 | 11.54 | 69.0 | 1755 ± 0.1 | 1773 ± 1.1 | 1816 ± 1.9 | 1865 ± 1.9 | 14.75 ± 4.4 | 14.00 ± 3.9 | 29.54 ± 0.3 | 47.50 ± 0.1 | 11.37 |
| 7 | 11.46 | 90.0 | 1513 ± 1.2 | 1567 ± 1.8 | 1706 ± 1.6 | 1835 ± 1.1 | 1.50 ± 0.1 | 2.66 ± 3.1 | 13.85 ± 4.5 | 40.00 ± 0.1 | 11.06 |
| 8 | 11.08 | 70.9 | 1632 ± 0.2 | 1614 ± 1.8 | 1776 ± 4.8 | 1987 ± 0.6 | 0.53 ± 0.1 | 2.31 ± 3.8 | 18.00 ± 4.8 | 51.13 ± 3.9 | 10.85 |
| 9 | 11.80 | 80.0 | 1753 ± 1.5 | 1852 ± 1.9 | 1858 ± 3.5 | 1900 ± 4.7 | 9.25 ± 4.2 | 17.00 ± 3.3 | 23.58 ± 4.1 | 26.74 ± 2.2 | 11.03 |
| 10 | 11.64 | 73.9 | 1773 ± 0.1 | 1855 ± 0.7 | 1786 ± 3.2 | 1902 ± 0.6 | 7.13 ± 1.7 | 14.25 ± 3.5 | 18.18 ± 0.2 | 31.71 ± 4.1 | 11.05 |
| 11 | 11.75 | 79.7 | 1806 ± 2.7 | 1869 ± 3.2 | 1812 ± 0.9 | 1871 ± 0.4 | 14.29 ± 0.1 | 13.00 ± 4.4 | 23.17 ± 1.9 | 38.88 ± 4.7 | 11.22 |
| 12 | 11.65 | 86.4 | 1589 ± 1.0 | 1701 ± 1.6 | 1797 ± 0.8 | 1983 ± 0.2 | 2.56 ± 4.5 | 9.79 ± 3.8 | 22.48 ± 0.9 | 50.00 ± 0.1 | 10.90 |
| 13 | 11.67 | 95.8 | 1609 ± 2.4 | 1640 ± 0.7 | 1651 ± 1.1 | 1763 ± 1.2 | 7.50 ± 4.6 | 8.00 ± 3.4 | 10.83 ± 3.9 | 24.13 ± 2.7 | 11.00 |
| 14 | 11.52 | 70.0 | 1726 ± 1.4 | 1720 ± 3.3 | 1676 ± 0.5 | 1908 ± 1.1 | 9.02 ± 2.4 | 14.36 ± 4.5 | 13.00 ± 1.3 | 33.02 ± 4.0 | 10.89 |
| 15 | 11.77 | 86.4 | 1721 ± 1.1 | 1791 ± 1.9 | 1778 ± 0.7 | 1766 ± 0.7 | 7.05 ± 3.2 | 11.66 ± 3.3 | 14.42 ± 4.1 | 25.00 ± 0.1 | 11.11 |
| Mix ID According to (Table 6) | Average Values of Controlled Parameters and Average Statistical Deviations (%) | ||||||||||
|---|---|---|---|---|---|---|---|---|---|---|---|
| Fresh Mix | SSC-FGB Samples | ||||||||||
| pH Value | Mini-Cone Flow Diameter, mm | Average Density, kg/m3 | Compressive Strength, MPa * | pH28 | |||||||
| Curing Time, Days | |||||||||||
| 2 | 7 | 28 | 90 | 2 | 7 | 28 | 90 | ||||
| 1 | 11.57 | 94.5 | 1634 ± 0.3 | 1800 ± 0.8 | 1737 ± 3.4 | 1847 ± 0.6 | 9.90 ± 4.7 | 12.13 ± 3.1 | 17.15 ± 3.3 | 29.50 ± 4.8 | 11.16 |
| 2 | 11.57 | 59.8 | 1608 ± 0.5 | 1746 ± 1.7 | 1755 ± 0.1 | 1803 ± 0.2 | 9.50 ± 4.5 | 11.25 ± 2.9 | 16.88 ± 0.7 | 31.75 ± 2.7 | 11.15 |
| 3 | 10.47 | 100.9 | 1519 ± 0.4 | 1712 ± 0.3 | 1770 ± 0.8 | 1910 ± 2.9 | – | – | 3.66 ± 3.9 | 19.11 ± 4.7 | 9.71 |
| 4 | 10.63 | 56.1 | 1545 ± 0.3 | 1632 ± 3.2 | 1713 ± 1.0 | 1839 ± 4.9 | – | – | 4.58 ± 4.1 | 21.01 ± 3.5 | 10.12 |
| 5 | 11.58 | 95.8 | 1588 ± 1.7 | 1738 ± 1.0 | 1793 ± 1.2 | 1823 ± 1.9 | 8.00 ± 4.8 | 17.13 ± 2.8 | 27.00 ± 3.8 | 32.96 ± 3.3 | 11.22 |
| 6 | 11.54 | 72.20 | 1645 ± 1.8 | 1726 ± 2.9 | 1767 ± 1.7 | 1811 ± 0.2 | 10.76 ± 0.1 | 14.73 ± 4.5 | 31.25 ± 3.7 | 39.25 ± 2.8 | 11.22 |
| 7 | 10.70 | 105.20 | 1654 ± 3.2 | 1629 ± 0.2 | 1684 ± 1.1 | 1864 ± 1.1 | – | – | 4.25 ± 2.8 | 24.25 ± 2.2 | 9.73 |
| 8 | 10.61 | 93.90 | 1611 ± 0.4 | 1634 ± 2.7 | 1669 ± 1.2 | 1863 ± 2.1 | – | – | 7.54 ± 4.3 | 36.58 ± 3.1 | 10.22 |
| 9 | 11.50 | 92.80 | 1620 ± 0.4 | 1734 ± 1.0 | 1729 ± 2.2 | 1855 ± 1.8 | 5.00 ± 4.1 | 8.01 ± 4.1 | 16.28 ± 2.3 | 20.91 ± 3.6 | 11,15 |
| 10 | 11.49 | 92.00 | 1668 ± 0.9 | 1756 ± 1.9 | 1693 ± 2.6 | 1840 ± 0.3 | 4.39 ± 2.4 | 10.11 ± 3.9 | 11.31 ± 3.5 | 18.41 ± 4.1 | 11.16 |
| 11 | 11.55 | 96.80 | 1658 ± 0.1 | 1870 ± 0.3 | 1836 ± 0.7 | 1796 ± 0.3 | 6.6 ± 0.1 | 14.50 ± 3.2 | 21.91 ± 4.1 | 30.00 ± 2.5 | 11.11 |
| 12 | 10.69 | 100.30 | 1681 ± 2.1 | 1617 ± 1.8 | 1732 ± 3.0 | 1780 ± 1.3 | – | – | 6.16 ± 3.8 | 18.41 ± 1.0 | 10.42 |
| 13 | 11.50 | 96.80 | 1584 ± 1.8 | 1695 ± 2.3 | 1689 ± 0.4 | 1811 ± 0.9 | 6.75 ± 0.1 | 8.81 ± 0.1 | 12.67 ± 4.2 | 16.96 ± 4.2 | 11.12 |
| 14 | 11.51 | 66.10 | 1618 ± 0.5 | 1689 ± 1.2 | 1720 ± 1.4 | 1788 ± 0.7 | 7.37 ± 0.1 | 8.13 ± 3.2 | 16.67 ± 3.7 | 26.05 ± 3.4 | 11.00 |
| 15 | 11.43 | 95.30 | 1684 ± 0.7 | 1691 ± 0.6 | 1694 ± 1.1 | 1810 ± 3.3 | 4.29 ± 3.7 | 6.38 ± 3.9 | 14,04 ± 3.4 | 24.43 ± 3.2 | 11.06 |
| Binder ID | W/S Ratio | Average Density, kg/m3 | Compressive Strength, MPa |
|---|---|---|---|
| 0.37 | 1795 | 26.67 | |
| 0.35 | 1844 | 35.72 | |
| 0.34 | 1833 | 30.04 |
Disclaimer/Publisher’s Note: The statements, opinions and data contained in all publications are solely those of the individual author(s) and contributor(s) and not of MDPI and/or the editor(s). MDPI and/or the editor(s) disclaim responsibility for any injury to people or property resulting from any ideas, methods, instructions or products referred to in the content. |
© 2025 by the authors. Licensee MDPI, Basel, Switzerland. This article is an open access article distributed under the terms and conditions of the Creative Commons Attribution (CC BY) license (https://creativecommons.org/licenses/by/4.0/).
Share and Cite
Alfimova, N.; Levickaya, K.; Nikulin, I.; Elistratkin, M.; Kozhukhova, N.; Anosov, N. Effect of Phosphogypsum Origin and Calcination Temperature on Characteristics of Supersulfated Cements. J. Compos. Sci. 2025, 9, 146. https://doi.org/10.3390/jcs9040146
Alfimova N, Levickaya K, Nikulin I, Elistratkin M, Kozhukhova N, Anosov N. Effect of Phosphogypsum Origin and Calcination Temperature on Characteristics of Supersulfated Cements. Journal of Composites Science. 2025; 9(4):146. https://doi.org/10.3390/jcs9040146
Chicago/Turabian StyleAlfimova, Nataliya, Ksenia Levickaya, Ivan Nikulin, Mikhail Elistratkin, Natalia Kozhukhova, and Nikita Anosov. 2025. "Effect of Phosphogypsum Origin and Calcination Temperature on Characteristics of Supersulfated Cements" Journal of Composites Science 9, no. 4: 146. https://doi.org/10.3390/jcs9040146
APA StyleAlfimova, N., Levickaya, K., Nikulin, I., Elistratkin, M., Kozhukhova, N., & Anosov, N. (2025). Effect of Phosphogypsum Origin and Calcination Temperature on Characteristics of Supersulfated Cements. Journal of Composites Science, 9(4), 146. https://doi.org/10.3390/jcs9040146