1. Introduction
Pollution and excessive use of natural resources have gained significant attention, particularly following the establishment of the Paris Agreement in 2016 [
1]. One of the most pressing issues is the exponential increase in plastic production. Over the past 70 years, plastic production has risen from 2 million tons to 459.75 million tons [
2]. The widespread use of polymer products generates significant plastic waste. Much of it is not reprocessed; is improperly reprocessed, or is disposed of incorrectly because its mechanical properties are poorly understood and there are no standardized guidelines for waste disposal and recycling. Within this context, the scientific question is not only how to reduce plastic stockpiles, but how to engineer reliable, application-specific materials from heterogeneous, post-consumer streams with quantifiable performance limits.
Recycling routes for plastic waste into construction products are viable only when the feedstock is described, standardized testing is applied, and the intended service loads are defined [
3,
4]. These new materials often possess attractive properties for the construction industry, promoting recycling and adaptation to new materials and construction processes [
3,
5]. However, beyond generic claims of “recyclability,” engineering acceptance in construction requires: (i) clear feedstock description, (ii) reproducible processing, (iii) standardized testing, and (iv) explicit identification of use-cases with realistic stress envelopes.
The construction industry, known for its significant environmental impact, is increasingly adopting sustainable practices. Conventional Portland-cement concrete and steel reinforcement are among the main contributors to the embodied greenhouse gas footprint of buildings and infrastructure, due to energy-intensive clinker production, high cement content, and large raw material demand. Recent developments in polymer concretes and polymer modified cementitious systems partially address this challenge by replacing part or all of the cement matrix with polymer resins and, in many cases, achieving higher compressive strength and chemical resistance than conventional concretes, while still targeting structural load bearing elements in buildings and pavements [
6]. In this structural context, there remains a complementary need for non-structural, temporary components, such as formwork panels and stay-in-place liners, where performance is dominated by out-of-plane stiffness, allowable deflection, and reusability rather than ultimate compressive strength.
Wood-plastic composites (WPCs), which combine plastic and wood waste, represent an innovative solution that reduces the consumption of natural resources and minimizes plastic waste [
7]. WPCs can be used as both structural and non-structural composites for various applications, including roofs, door frames, windows, wood-frame shear walls, decorative fixtures, furniture, sound insulation elements, and other structures [
8,
9]. They have a high strength-to-weight ratio, low density, and require less maintenance than wood, making them more resistant and durable [
10]. For example, bamboo fibers are widely used in moisture-resistant panels. In contrast, polyester matrices with jute or sisal fibers are used for false ceilings; linen, shell, and bagasse are used for floors, insulating panels, and doors [
11,
12,
13]. Prior studies also show that particle size distribution, forming rate/temperature, and UV/moisture aging substantially modulate WPC properties, emphasizing the need to couple materials selection with standardized mechanical benchmarks. Complementary literature on rHDPE-based WPCs documents mechanical variability, thermal/DSC behavior, moisture uptake, UV weathering, friction/wear, and flame-response. These domains frame durability but are beyond the scope of the present mechanical benchmarking.
Research on WPCs has focused on various aspects, including the effects of wood flour particle size distribution on physical and chemical properties [
14]. The effects of strain rate and temperature on the press forming of extruded WPCs [
15] and the degradability of WPCs, including biodegradation, moisture sorption, and UV decomposition [
16,
17,
18]. These studies frame durability issues for WPCs; in the present work, however, we restrict our scope to mechanical benchmarking of recycled WPC boards and do not perform direct biodegradation or long-term weathering tests. WPC materials are often more environmentally friendly than those they replace, as they use renewable raw materials that are sometimes recyclable or biodegradable [
19]. Additionally, depending on their application, WPCs can help reduce energy consumption and waste disposal areas [
3]. Yet, performance dispersion due to feedstock variability is a persistent barrier to deployment, particularly when composites are fabricated from mixed polyolefins and untreated lignocellulosic fillers.
High-density polyethylene (HDPE), a material widely used in WPCs, is also the plastic used for the caps of PET (polyethylene terephthalate) beverage bottles [
20]. Considering that approximately 500 billion plastic bottles are used and discarded annually, the scale of the recycling problem becomes evident. Only about 9% of these bottles are recycled worldwide, with 29% of domestic production recycled in the United States [
21,
22]. Water and soft drink bottles are evolving to increase recyclability. New designs keep caps attached to bottles, facilitating their inclusion in recycling streams and promoting both post-consumer (PCR) and post-industrial recycling (PIR). Using recycled thermoplastics to manufacture WPCs can yield composites made entirely from recycled feedstocks, such as post-consumer or recycled polyethylene (rPE) and HDPE [
23]. This approach can also be extended to industrial injection molding purges [
24]. Technically, bottle-cap HDPE is an attractive feedstock because it is abundant and mechanically robust. It is also frequently pigmented with carbon black, an additive that screens UV radiation and slows polymer photodegradation, providing a practical avenue to enhance outdoor durability when caps are repurposed within WPC matrices.
HDPE is widely used in WPCs [
14,
25] and its properties can be enhanced using coupling agents [
26]. Additionally, they have been bonded using various techniques, including UC/ozone treatment [
27], surface activation [
28], and epoxy coatings [
28]. The coating types used for WPCs are diverse [
29], which can help protect and reduce deterioration during use. Nevertheless, when recycled HDPE is combined with raw sawdust without compatibilizers, interfacial adhesion and porosity remain key determinants of stiffness and strength. Therefore, rigorous mechanical characterization under ASTM protocols is necessary to define allowable stresses and safety factors for specific use cases.
The vast amount of plastics produced and used annually eventually reach the end of their useful life and become waste. Then, part of those partially degraded plastics become micro- and nanoplastics (MNPs) that enter the food chain of humans and animals. A collateral problem of transcendental proportions that requires a solution is mentioned by Hu et al. [
30], who raised concerns about the presence of microplastics in 100% of the tested human and dog testes samples. Twelve polymers were identified as dominant in polyethylene (PE), with concentrations of 122.63 mg/g in dogs and 328.44 mg/g in humans. This highlights the presence of microplastics in the reproductive systems of humans and dogs, with the potential to impact their fertility. Amato-Lourenço et al. [
31] reported the presence of microplastics in the olfactory bulb of the human brain, raising health concerns. From a circular economy standpoint, diverting HDPE caps and sawmill residues into durable, serviceable composites reduces the dispersal pathways of MNPs. It increases material residency time in productive use, provided that mechanical thresholds for the target application are met.
Carbon black (CB) is a well-established UV stabilizer in polyolefins due to its strong UV absorption and radical-quenching effects, which often extend outdoor durability at practical loadings [
32,
33]. Accordingly, when recycled HDPE caps are pigmented black, the resulting WPC color and potential UV screening can be advantageous for outdoor service. In this work, CB-related durability is not measured; instead, it is framed as a practical, literature-supported hypothesis to be tested in future accelerated aging studies (e.g., ASTM G154/G155) on the same recycled-feedstock route [
34,
35].
This study focuses on the mechanical characterization of WPC boards made from sawdust and HDPE caps recycled from carbonated soft drink bottles. Using these HDPE caps not only promotes post-consumer recycling but also contributes to a more robust circular economy. The flexural and tensile mechanical properties of WPC boards with partial substitution of pine sawdust, a semi-hard, coarse-to-medium-grained material abundantly available but rarely reused, were evaluated. The use of cellulose reinforcement (in the form of sheets, flakes, fibers, or powder) as a filler in WPC boards can modify both the external and internal behavior of the boards. Such behavior can be obtained by testing WPC specimens under tensile, flexural, or torsional loading conditions and can be analyzed using stress–strain curves [
36]. This study evaluates the mechanical properties of WPCs made from recycled HDPE bottle caps and pine sawdust to determine their suitability and performance limits as temporary concrete formwork. The findings contribute to understanding how recycled materials can be used effectively in construction applications, promoting environmental sustainability and resource conservation.
We mapped the flexural and tensile properties (strength, modulus, strain) from ASTM tests for non-structural temporary formwork [
37,
38,
39], where panels (10–15 mm) operate at moderate spans under controlled deflection and safety factors. Our primary objective is to establish a reproducible panel-level route from polyolefins and post-consumer PP/HDPE bottle cap sawdust, and to generate statistics that an engineer can use for acceptability checks. The commonly cited link between carbon black pigmentation and UV durability is not measured in this work. It is treated only as a literature-supported hypothesis to be tested in future accelerated aging studies using the same recycled-feedstock route (ASTM G154/G155). The WPC boards developed were designed as reusable, lightweight formwork panels that complement, rather than replace, conventional concrete or polymer concrete. They divert mixed PP/HDPE bottle caps and pine sawdust from landfills and reduce the demand for virgin plywood formwork in repeated casting operations. In addition, they operate at a lower density than timber or steel formwork, which facilitates manual handling and reuse on site.
2. Materials and Methods
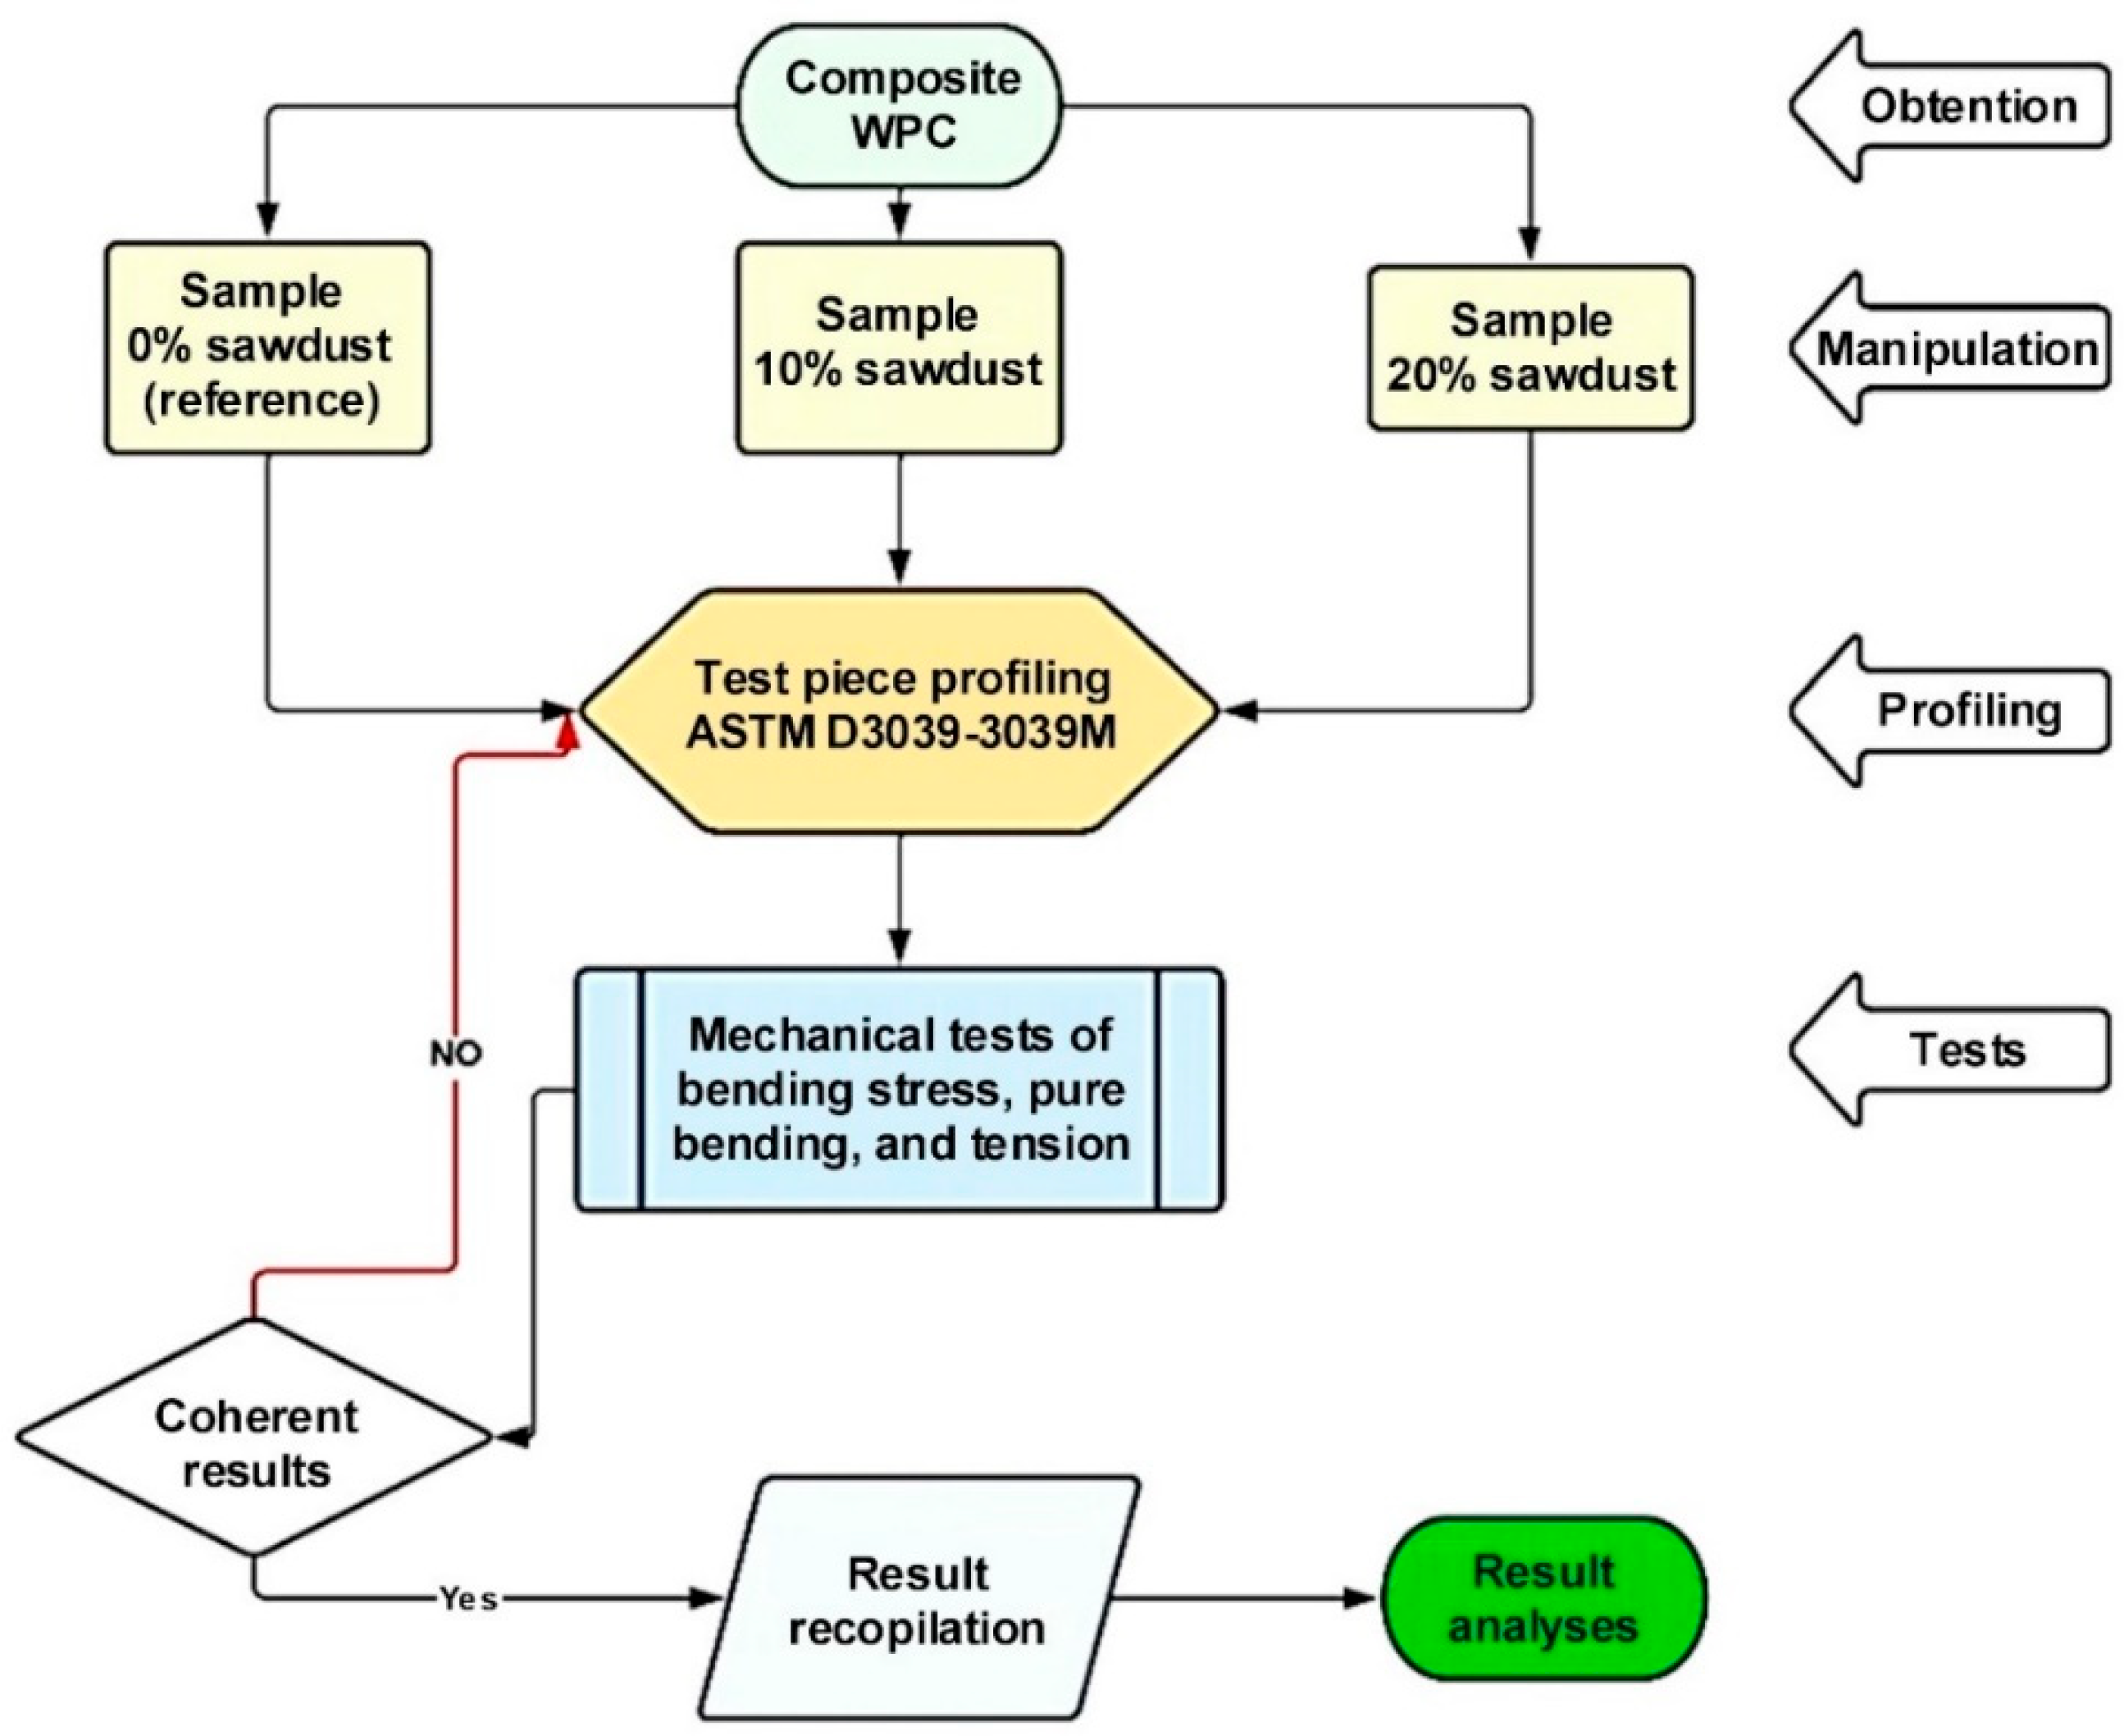
The composites were prepared with varying concentrations of sawdust and HDPE. Flexural and tensile tests were then conducted to explore their potential use in construction materials. The methodology involves four main steps: obtaining materials, manipulating specimens, profiling, and testing, as illustrated in
Figure 1. All materials and test specimens were conditioned at 23 ± 2 °C and 50 ± 5% RH for ≥40 h in accordance with ASTM D618 [
40] before machining and testing. Testing was performed in a laboratory maintained at 23 ± 2 °C and 50 ± 5% RH. Ambient conditions were monitored and recorded for each test batch.
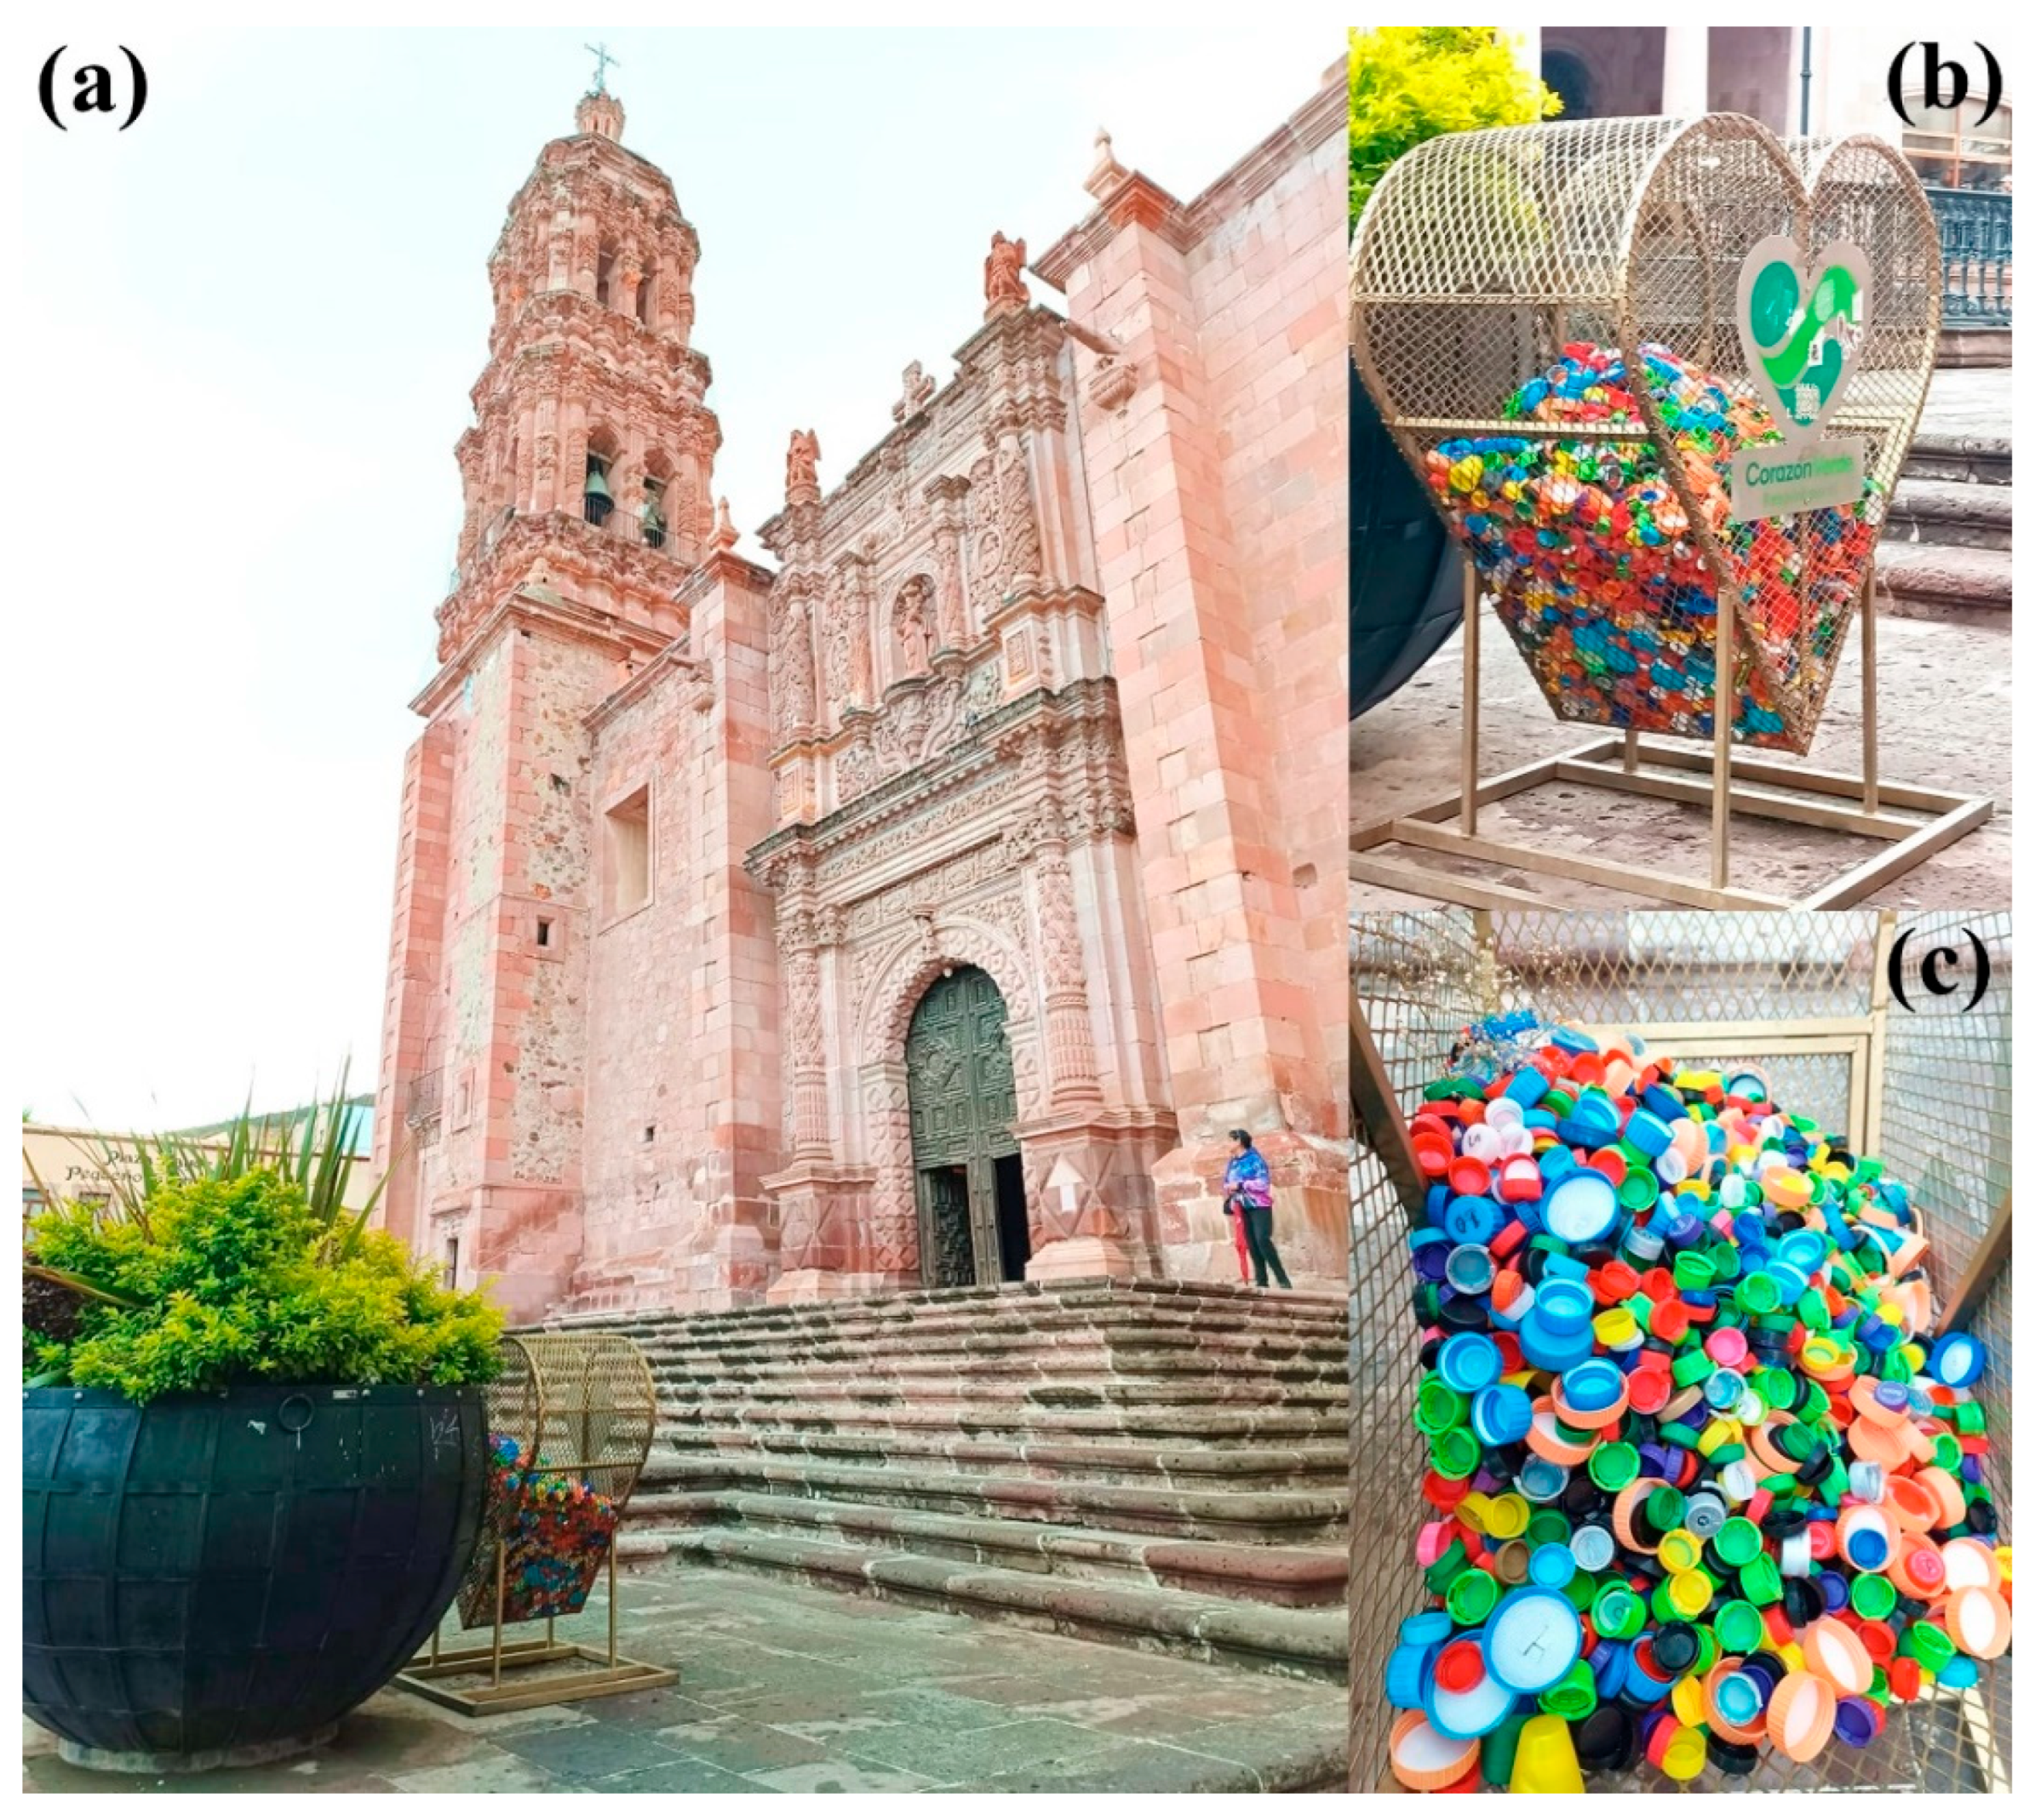
The raw materials used to fabricate the WPCs include recycled sawdust and recycled high-density polyethylene (HDPE) caps. The sawdust, obtained from a local carpentry workshop and made from semi-hard pine wood, was a coarse- to medium-grained material with an average particle size of about 0.5–2 mm. The recycled HDPE caps, sourced from water and carbonated soft drink bottles, were provided by a local recycling center. The collection system and typical volume of recovered caps used as feedstock are illustrated in
Figure 2, which documents the public collection of post-consumer bottle caps for this study. The images contextualize ‘feedstock availability’ only and no inference is drawn from them. The HDPE used has a density of about 0.95 g/cm
3 and a melting point of 130 °C, making it suitable for extrusion and molding processes. The use of recycled materials implies pieces with varied characteristics. This study aimed to be inclusive of all plastic caps, generally made of HDPE, excluding metal caps.
HDPE caps were washed, dried, and shredded into flakes of 3–8 mm. Pine sawdust was sieved to report a particle-size distribution (0.5–2 mm modal) and oven-dried to ≤2 wt% moisture (mass change < 0.1% h−1 as endpoint). No compatibilizers/surface treatments were added to preserve an all-recycled formulation; their effect on dispersion and adhesion is proposed for future optimization.
WPC boards were manufactured by compression molding. The sawdust was dried, and the HDPE caps were shredded into small flakes. The mixture of sawdust and HDPE was prepared at varying ratios (0%, 10%, and 20% sawdust by weight), with 0% serving as the control.
2.1. Fabrication of WPC Boards
The polymeric matrix (PP/HDPE, 70/30 wt%, mean particle size ≈ 9.5 mm, 3/8″) was obtained entirely from crushed, post-consumer recycled plastics; no virgin polymers or compatibilizers were added at this stage. Dry pre-mixing of polymers and dried sawdust (0, 10, 20 wt%) was performed for 2–3 min before melt processing. Melt-mixing was conducted at 160 ± 5 °C until full wet-out (~5–8 min, no visible dry pockets), followed by compression molding in a pre-heated mold at 160 ± 5 °C, contact pressure 4–6 MPa, dwell 5–10 min, and cooling under load to <50 °C before demolding. Board thickness targets were 10 mm and 15 mm. The following values were used and recorded: melt temperature [°C], dwell time [min], pressure [MPa], cooling rate [°C min−1], and demold temperature [°C], as these parameters significantly affect porosity and fiber–matrix adhesion.
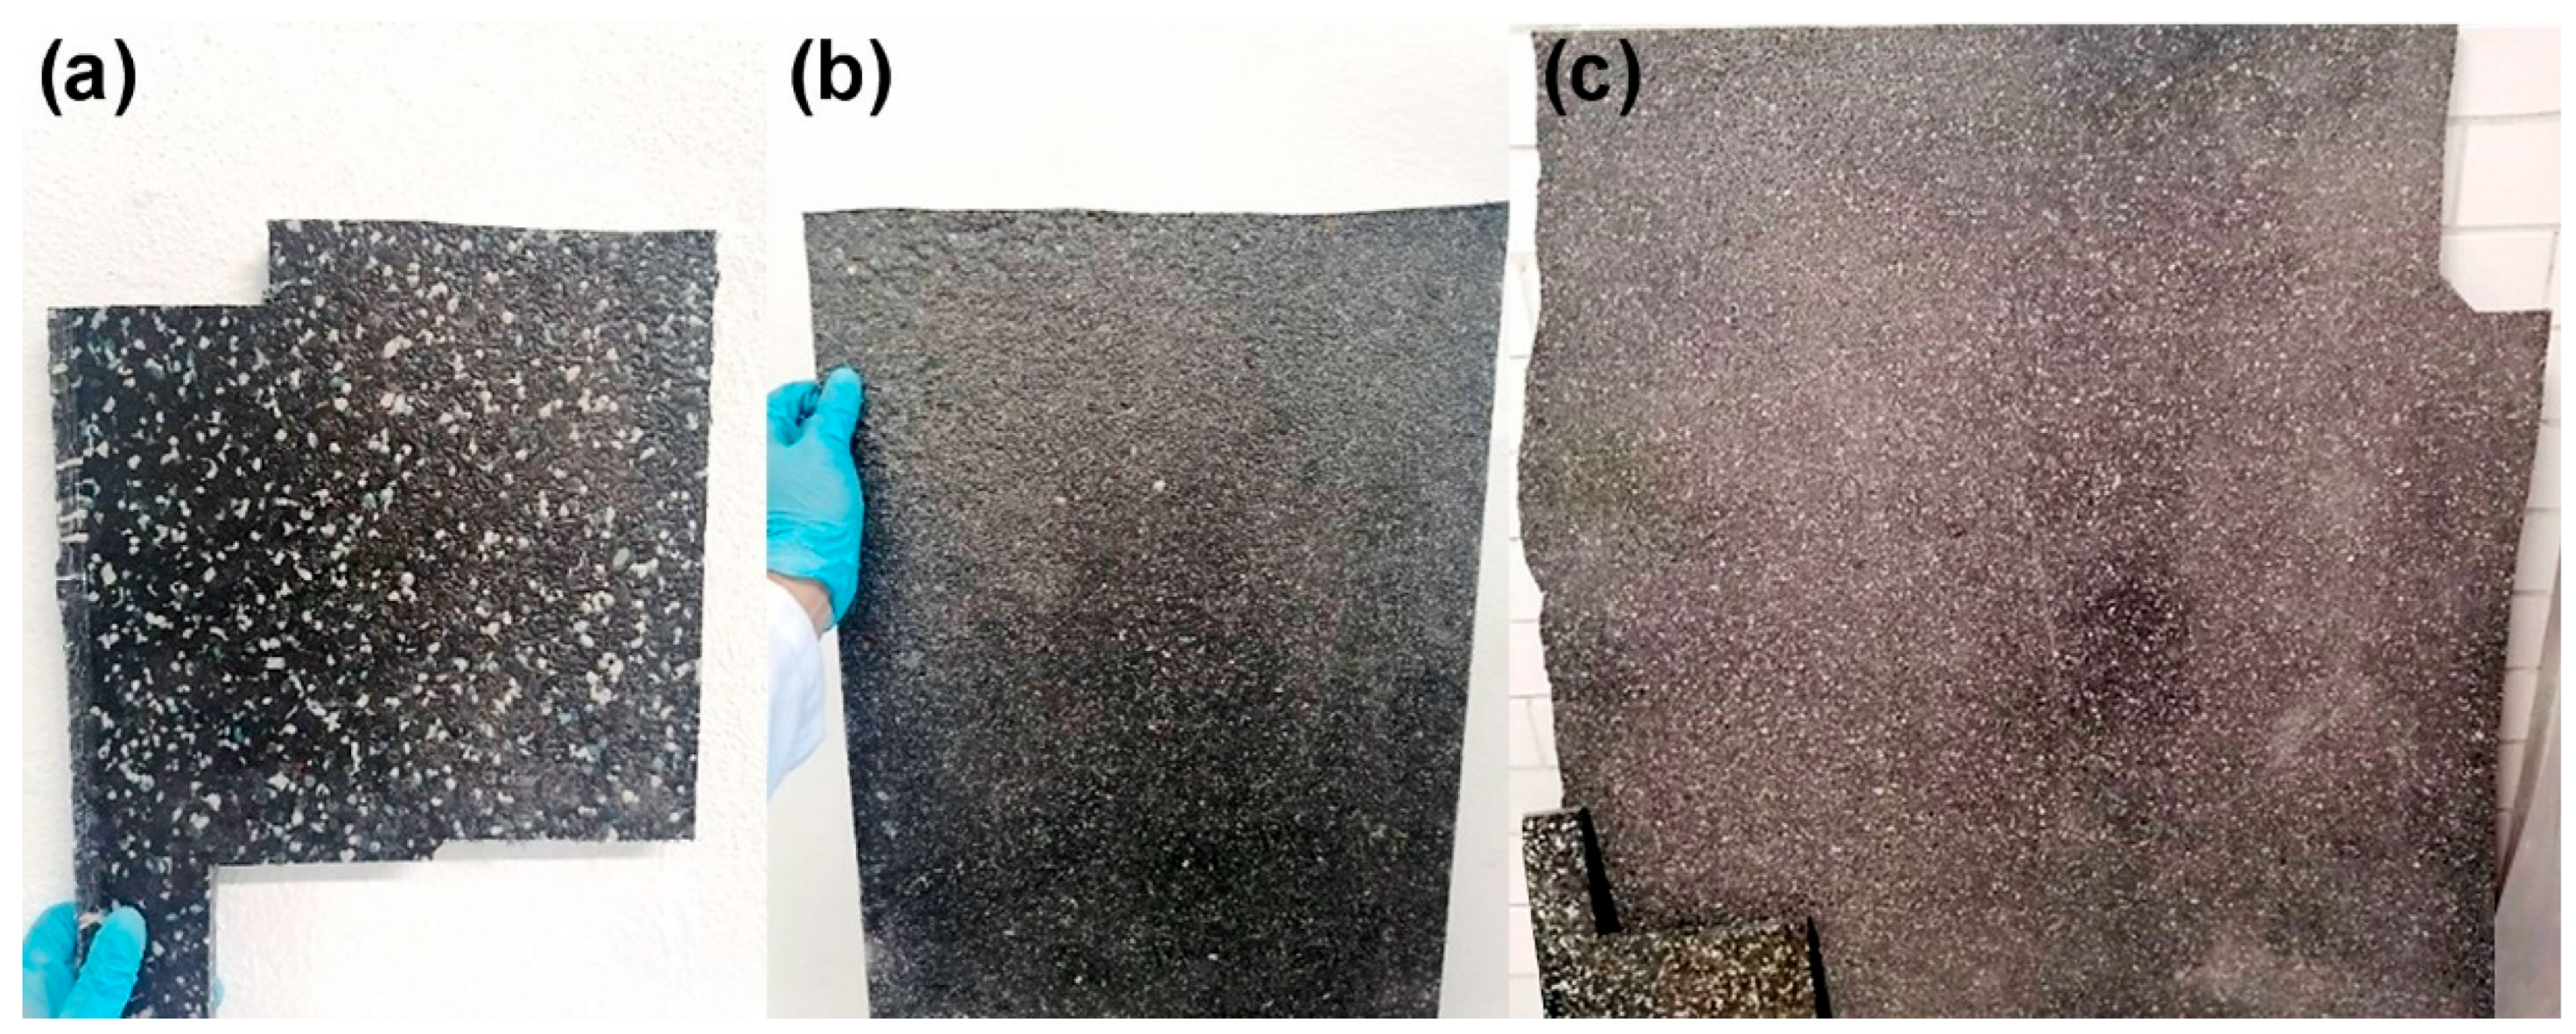
The composite material boards were obtained via compression molding, with thicknesses of 10 mm and 15 mm. They were categorized based on the percentage of wood fiber (sawdust) substitution in the polymer matrix: 0% (reference), 10%, and 20%, as shown in
Figure 3a,
Figure 3b, and
Figure 3c, respectively.
The 0/10/20 wt% sawdust levels bracket a processing-practical range: 0% (matrix baseline), ~10% (expected stiffness gain with limited porosity), and 20% (upper bound where voids/debonding begin to penalize strength), serving the applied mapping rather than a complete design of experiments (DOE).
2.2. Specimen Geometry, Measurement, and Spans
Rectangular prismatic coupons were machined from 10 and 15 mm thick boards, with a tolerance of ±2 mm, using a SM400 band saw (Delta Machinery, Jackson, TN, USA). Their edges were lightly deburred. Dimensions were measured with a precision vernier caliper (resolution 0.01 mm). Three readings per dimension were averaged. Flexural spans were set according to standards: under 3-point bending (ASTM D790) [
37], under 4-point bending (ASTM D6272) [
38], and under tensile load (ASTM D3039/D3039M) [
39].
Table 1 summarizes the nominal (design) and measured dimensions (L × W × t) of the rectangular coupons for all test types (three- and four-point bending and tension).
2.3. Procedure for Flexural Tests
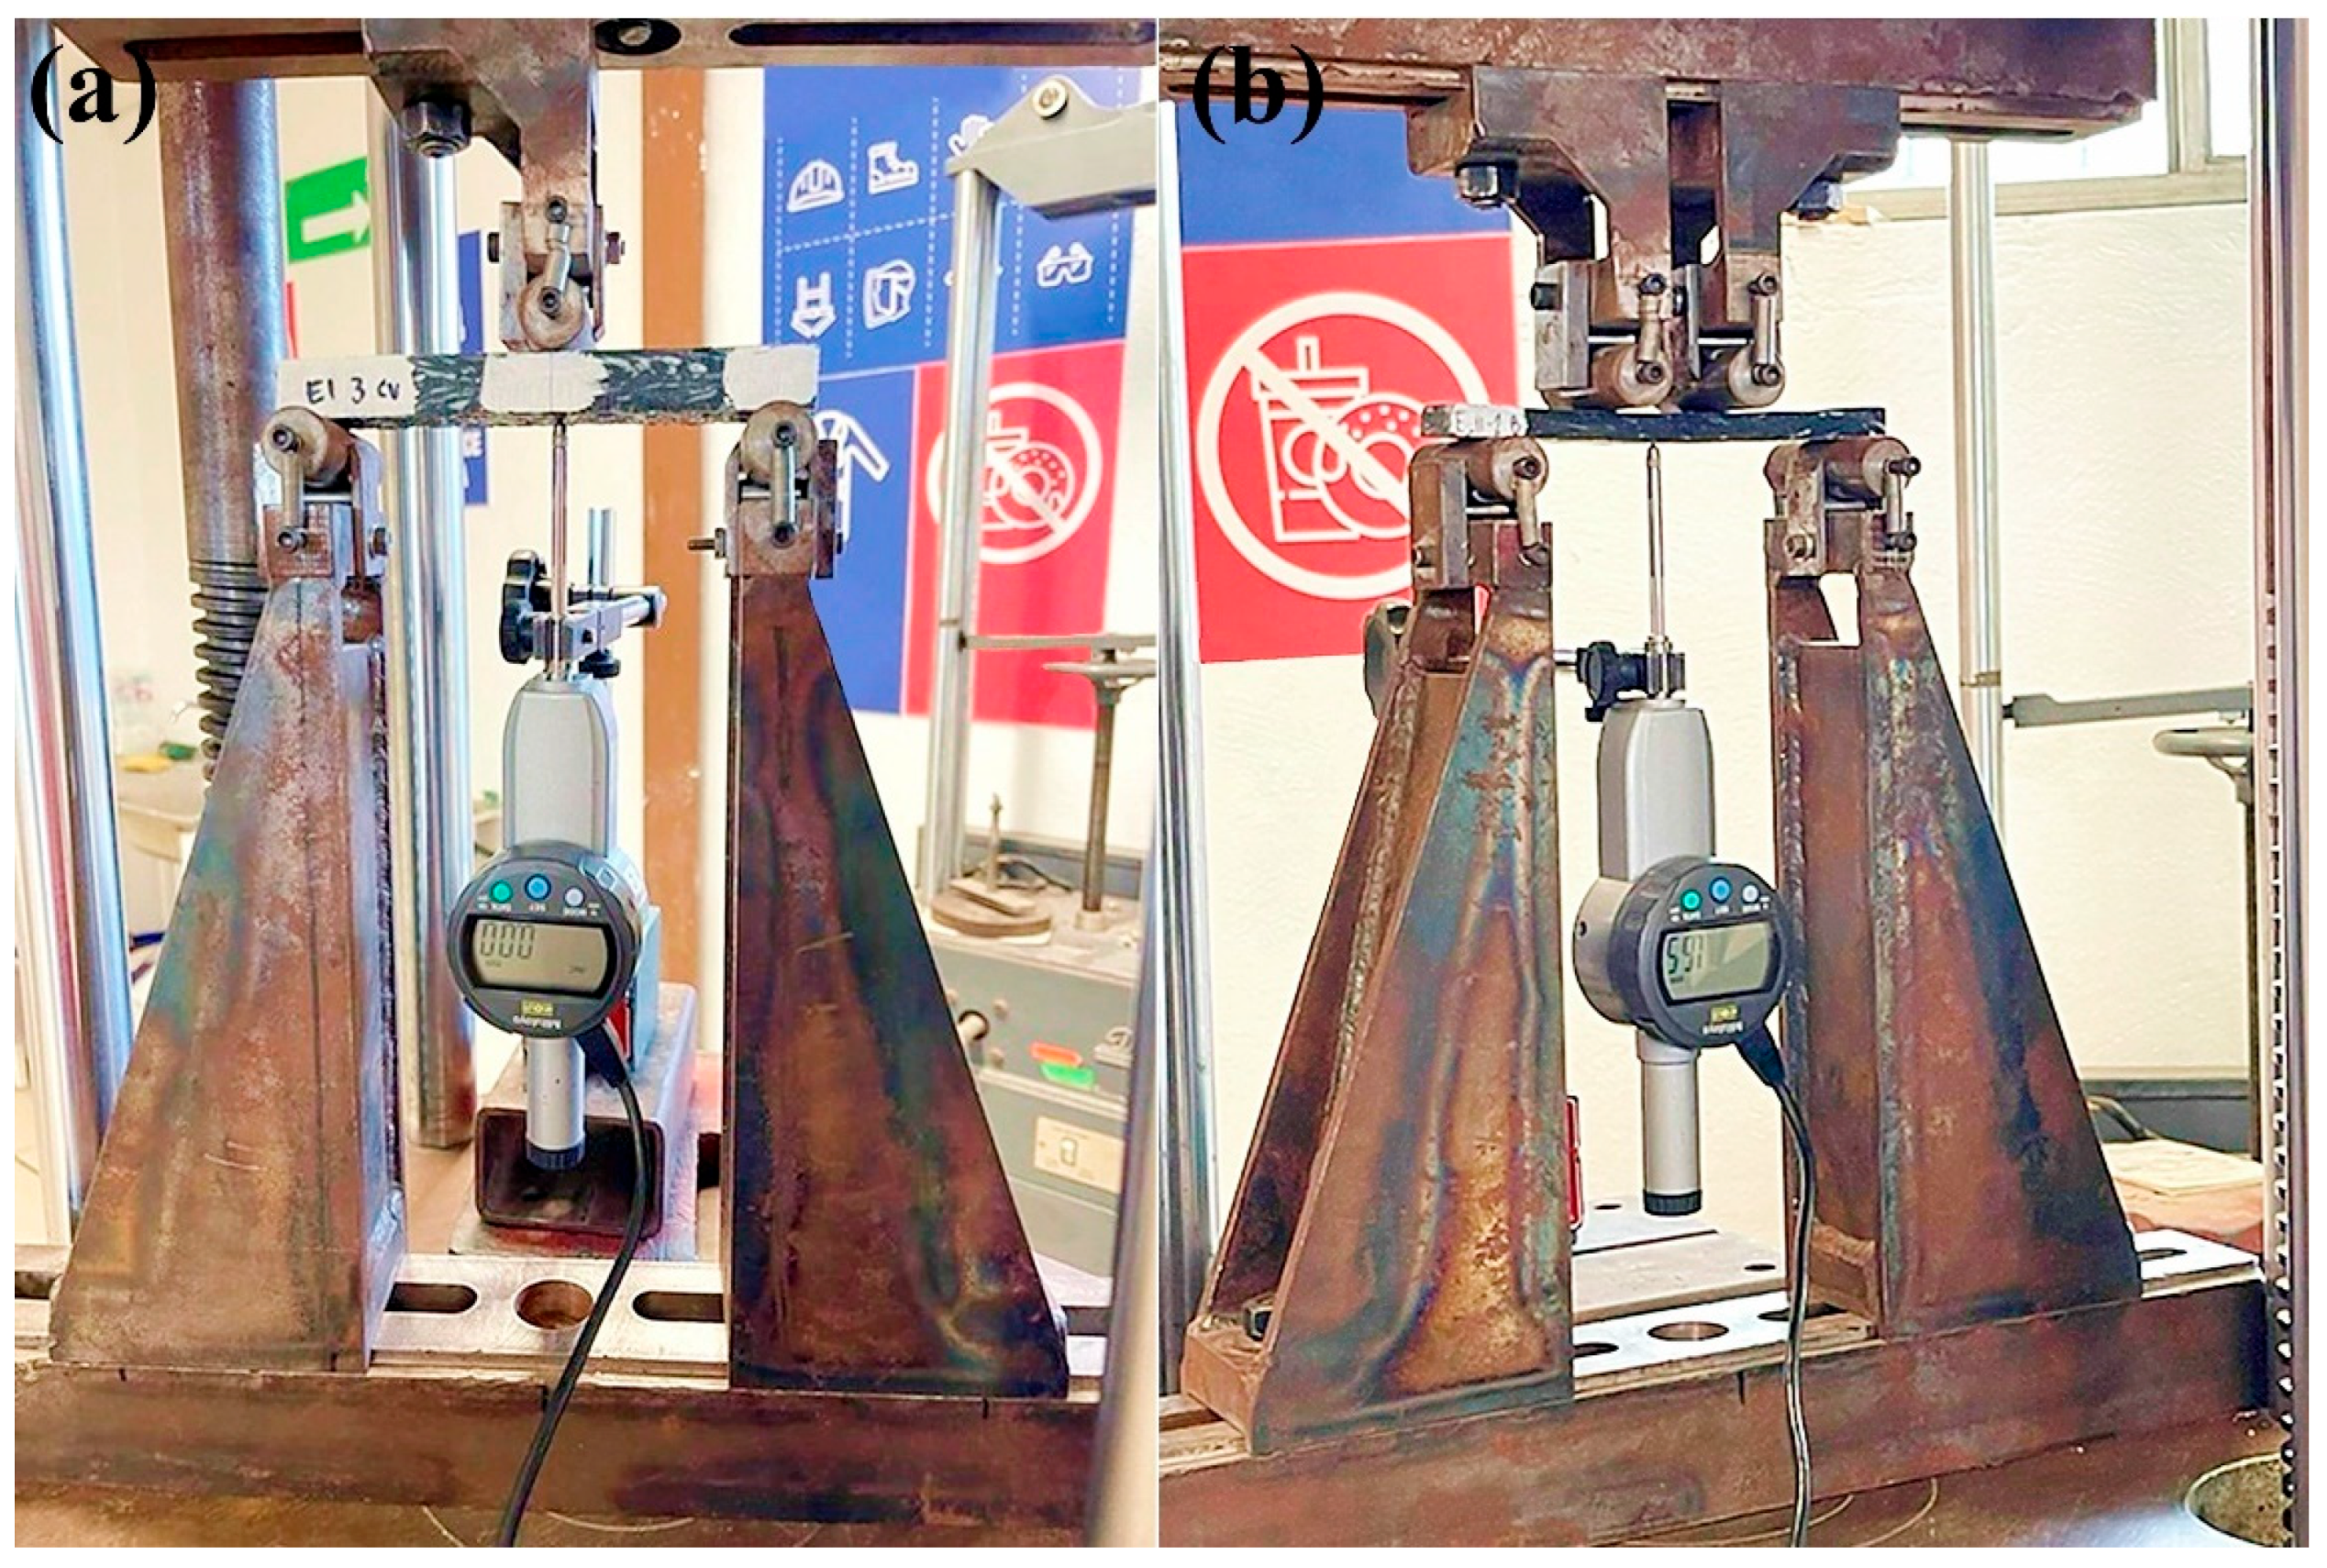
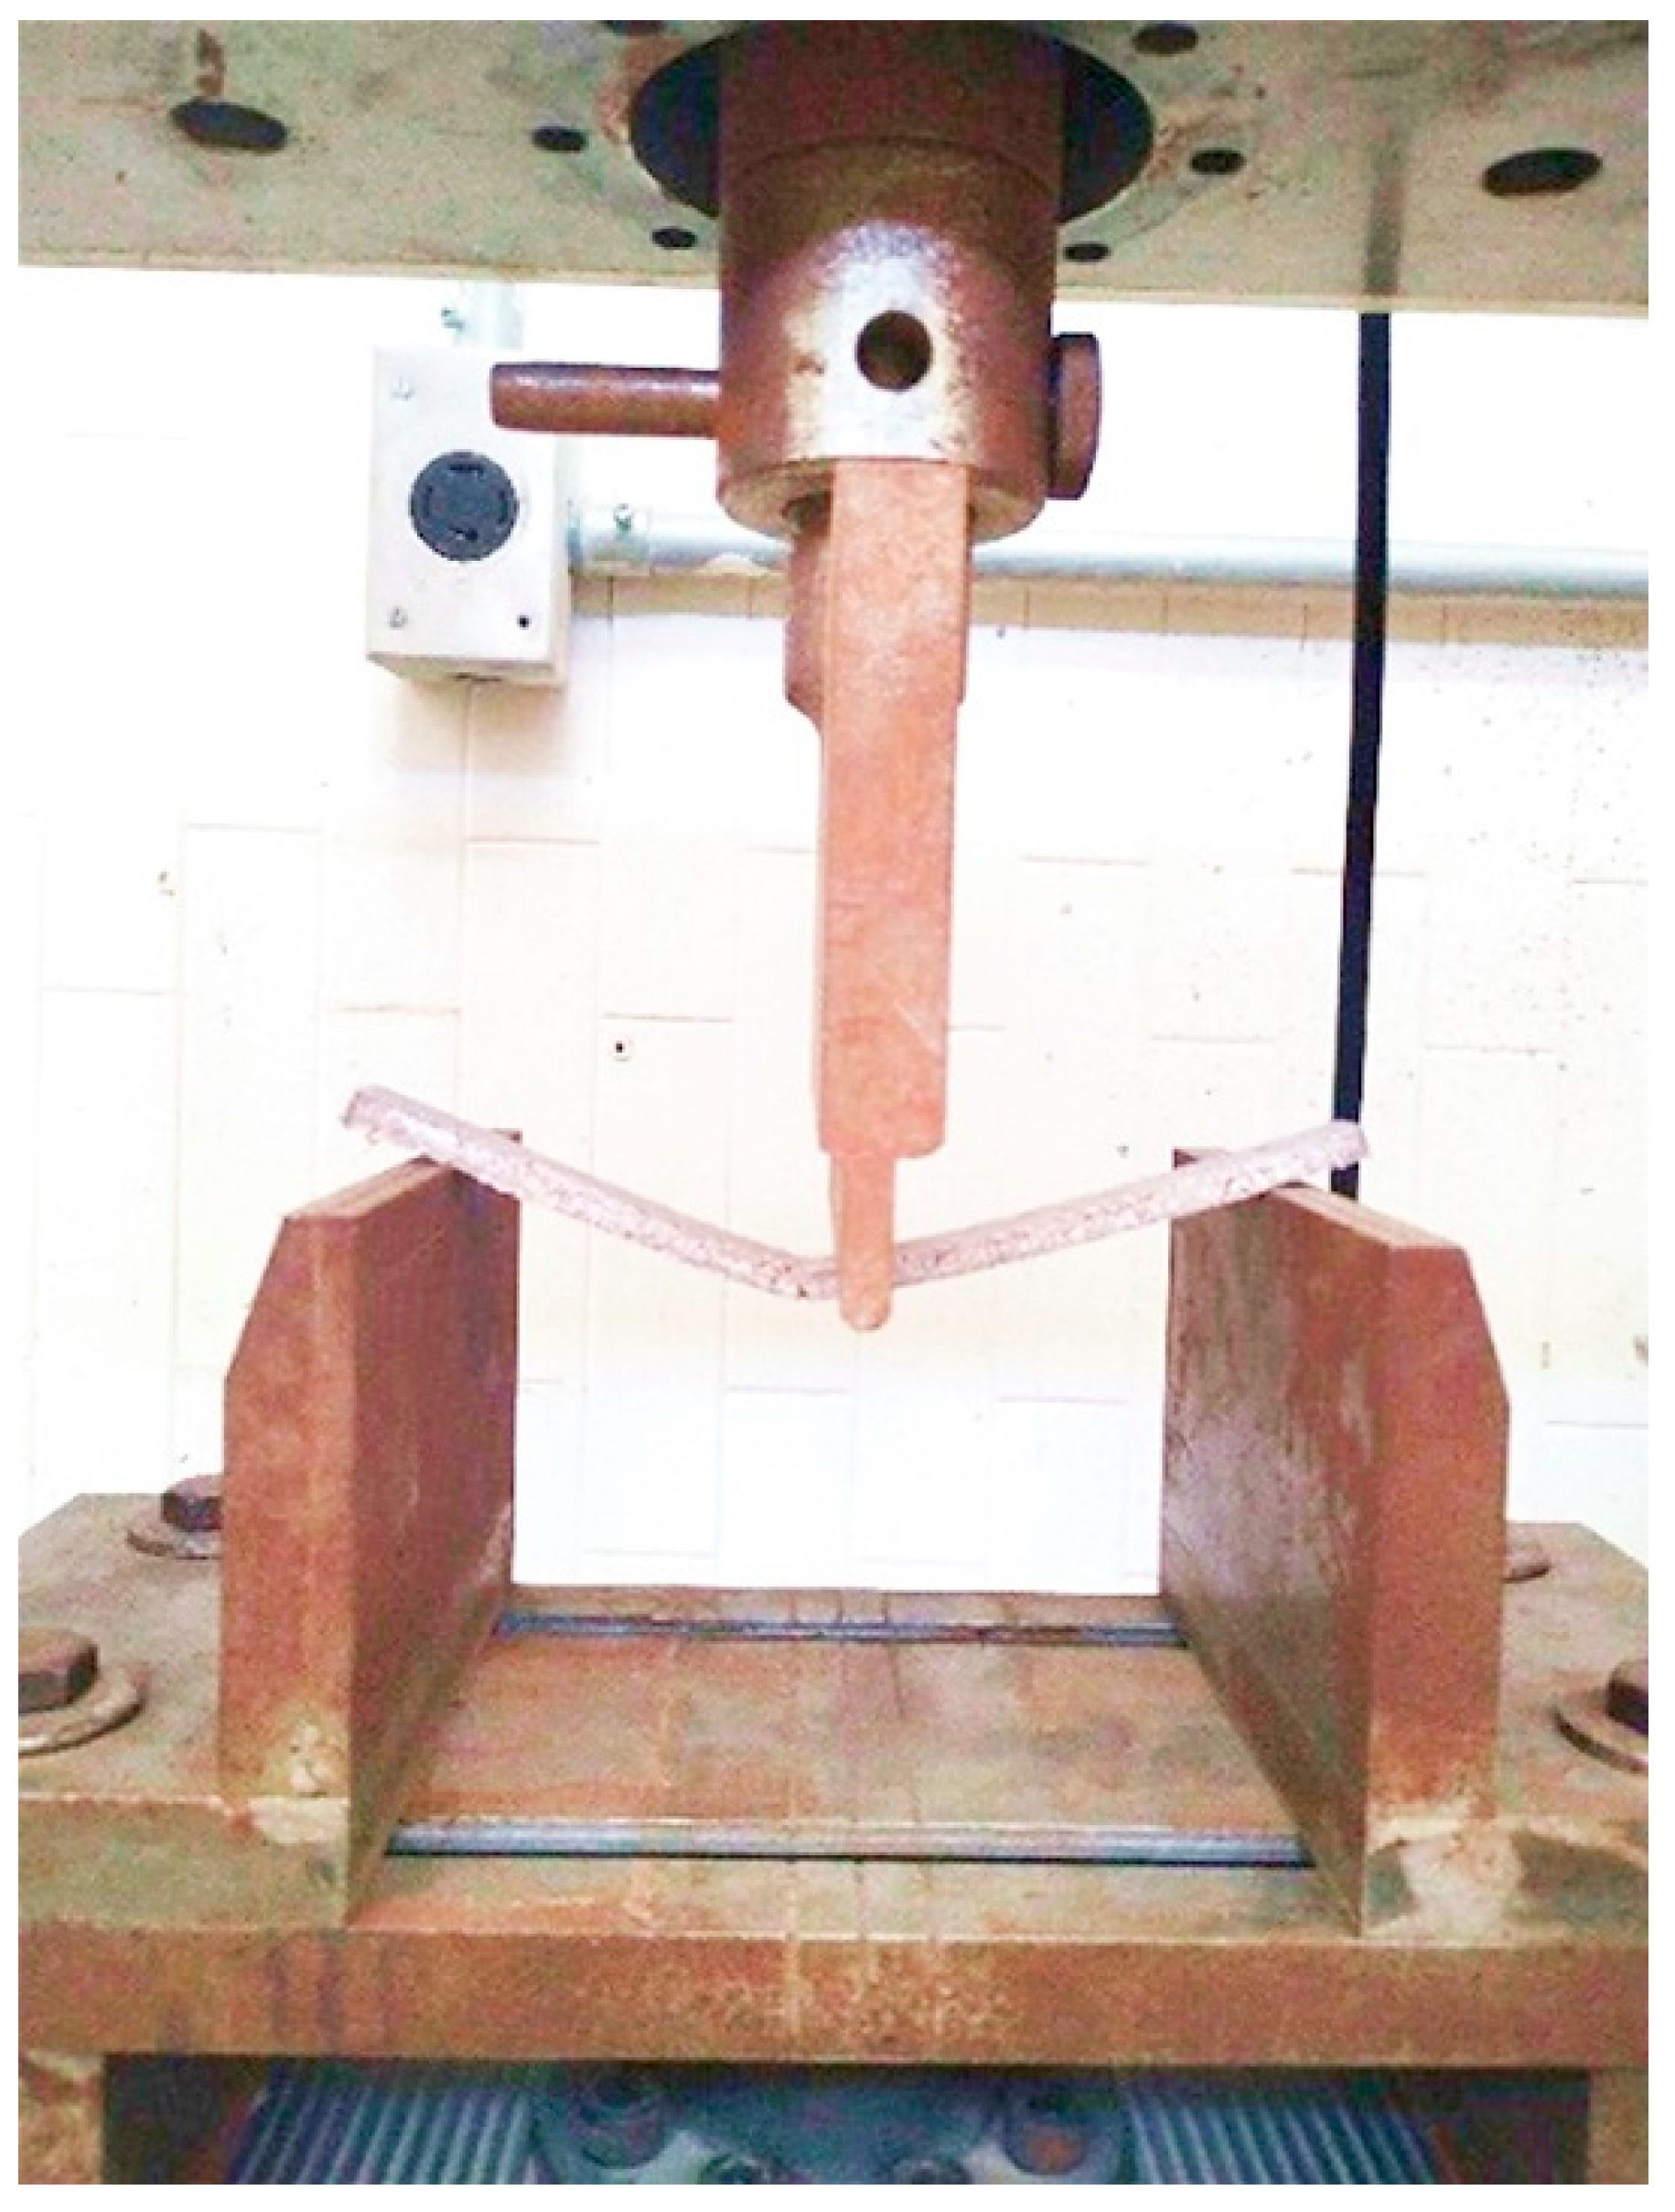
Two loading system methods were used to perform the flexural tests on simple-supported beam specimens: the three-point and four-point loading systems (
Figure 4). Tests were performed on a Tinius Olsen (Horsham, PA, USA) universal testing machine with a calibrated load cell (traceable within 12 months). Crosshead rate was computed per ASTM to target failure within 1–10 min:
D790 3-point: , where L is span, d thickness, and Z the strain rate.
D6272 4-point: rate per standard Clause 10 (outer span So, inner span Si).
Mid-span deflection was measured with a contact LVDT (resolution ≤ 0.01 mm) mounted on the specimen; when crosshead travel was used, frame compliance was corrected. Failure modes (tension face cracking and shear) and valid/invalid test criteria were followed in accordance with the standard requirements.
In this work, both three-point (ASTM D790) and four-point (ASTM D6272) bending were employed to probe failure sensitivity under different stress fields. Three-point bending concentrates maximum moment and shear under a single load nose, enhancing sensitivity to local defects. Four-point bending introduces a constant-moment region and reduces shear effects between inner spans. Comparing both improves the interpretability of stiffness/strength dispersion in porous, brittle WPCs and supports application-specific design envelopes.
For each condition, n = 10 specimens were tested. Tables report the mean ± standard deviation (SD) and 95% confidence intervals (CI). No hypothesis-testing is claimed (e.g., ANOVA/Kruskal-Wallis). Given the applied scope and heterogeneous recycled feedstock, descriptive statistics and application-oriented acceptability ranges were conducted.
2.4. Tensile Testing
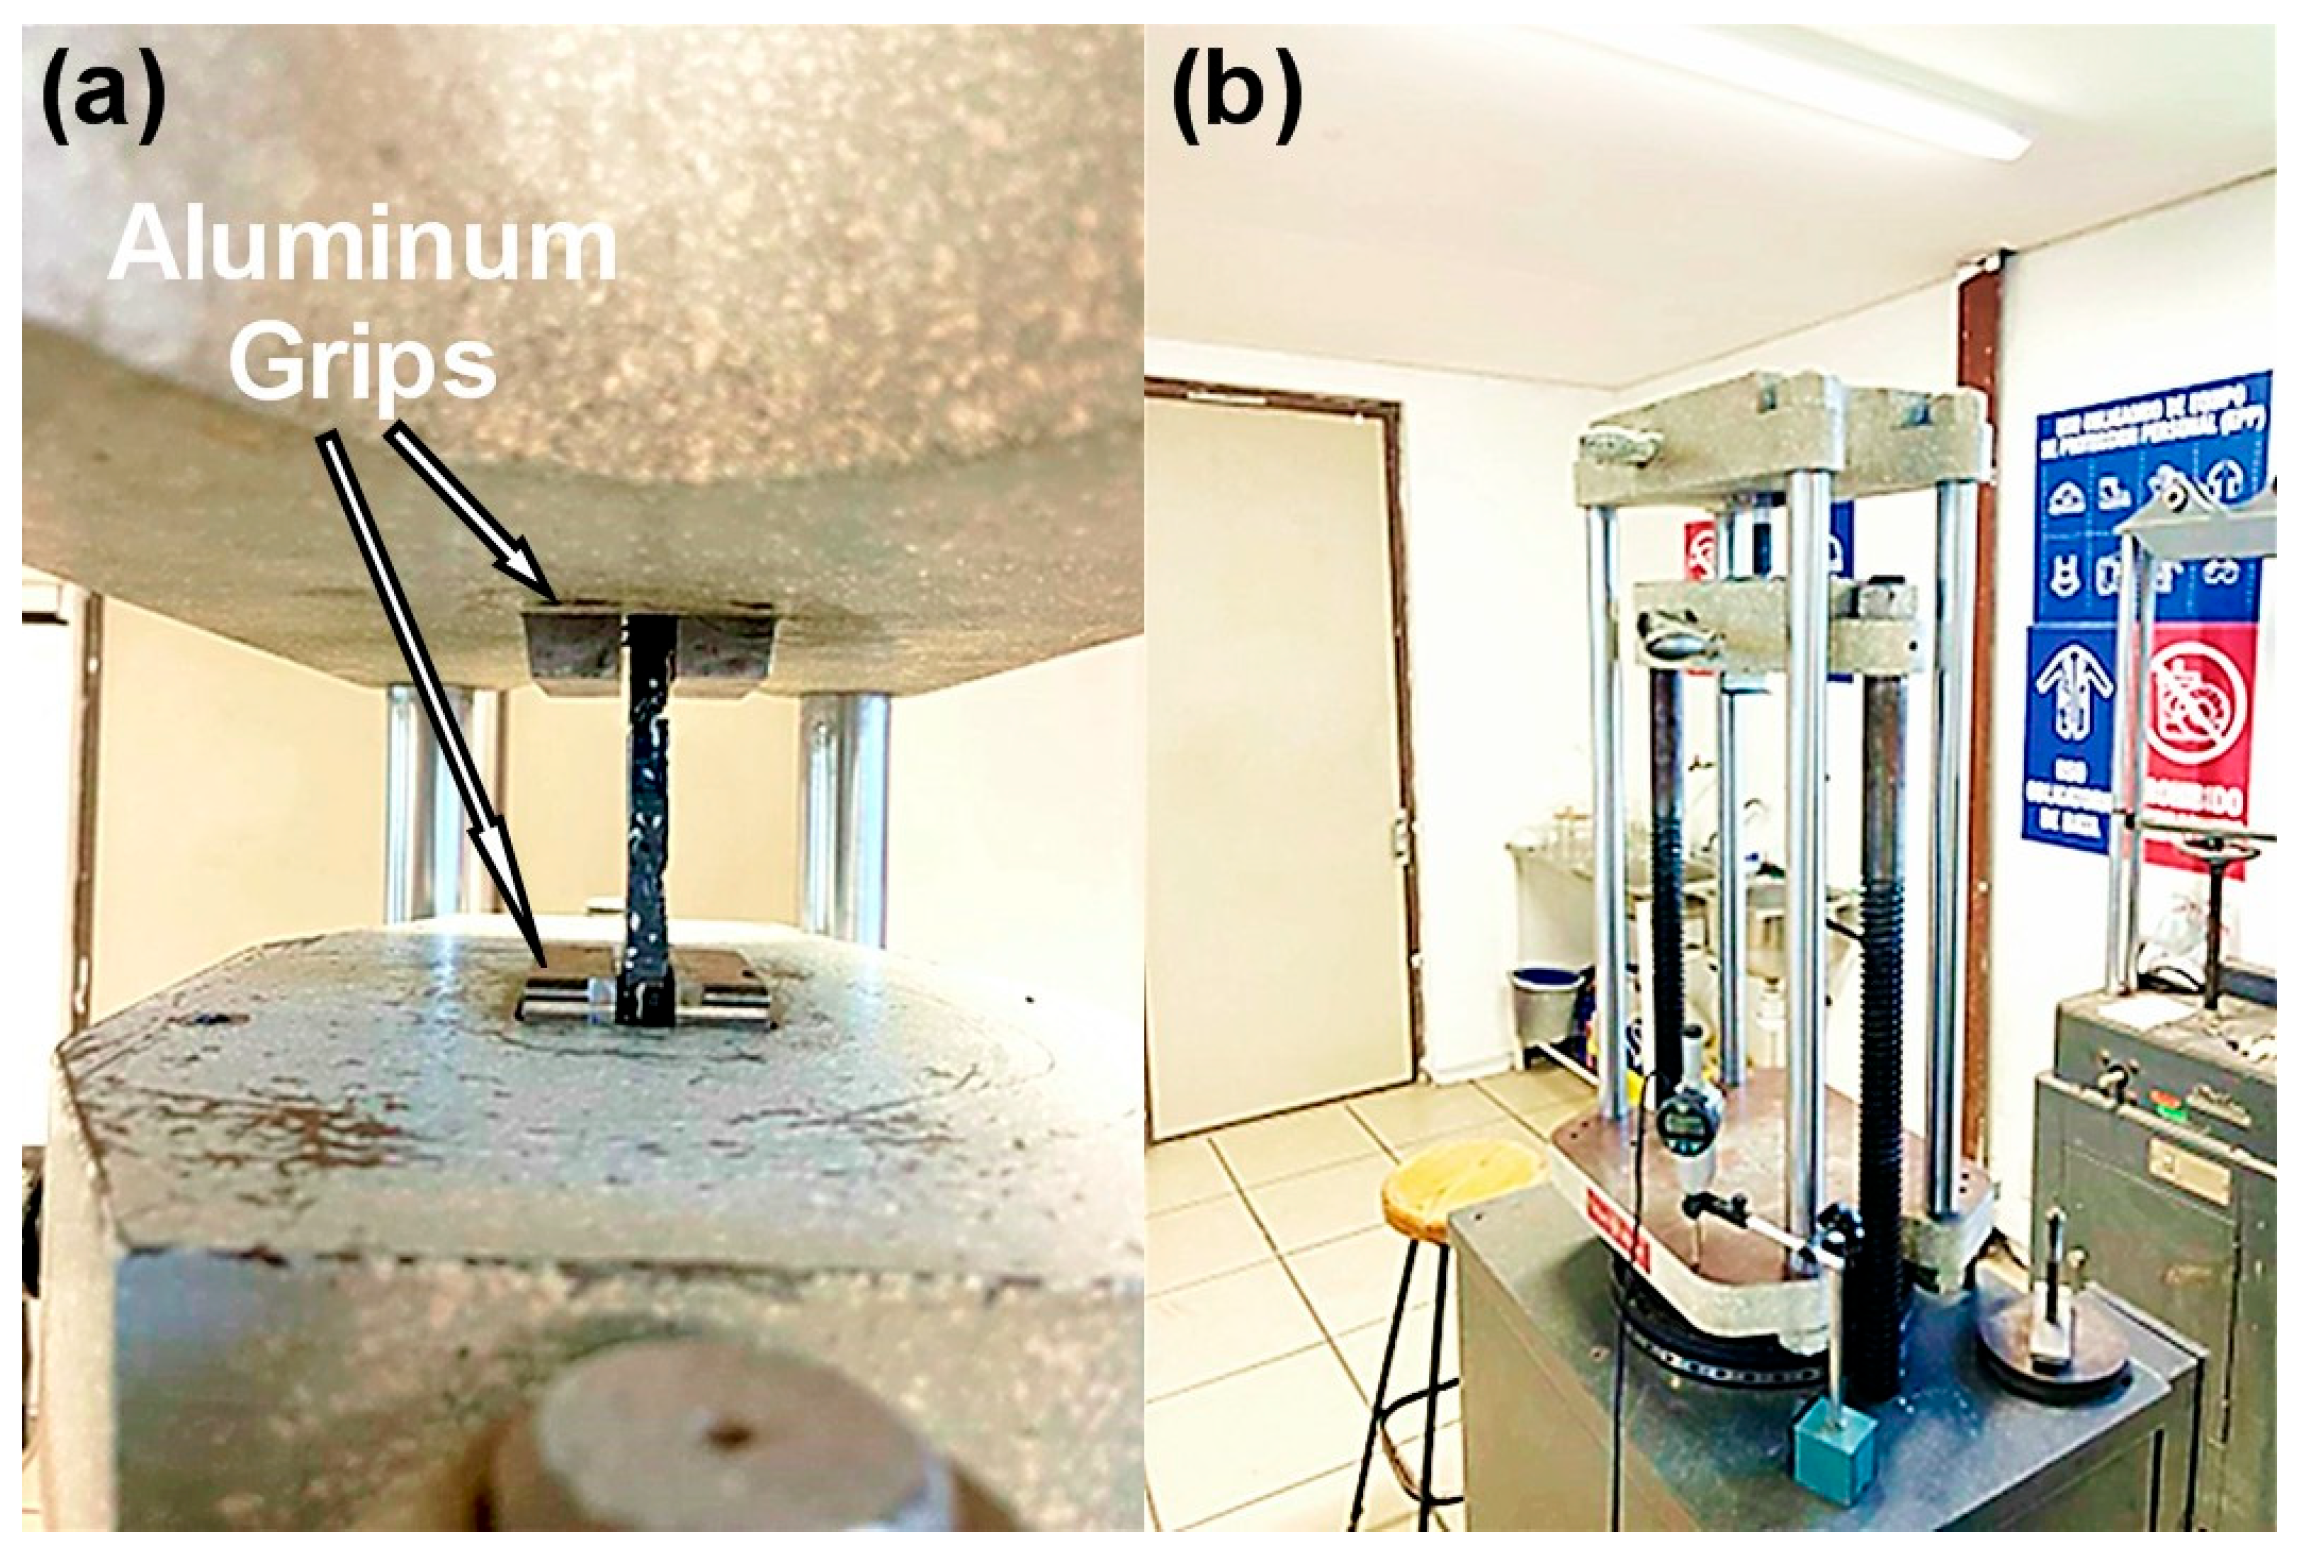
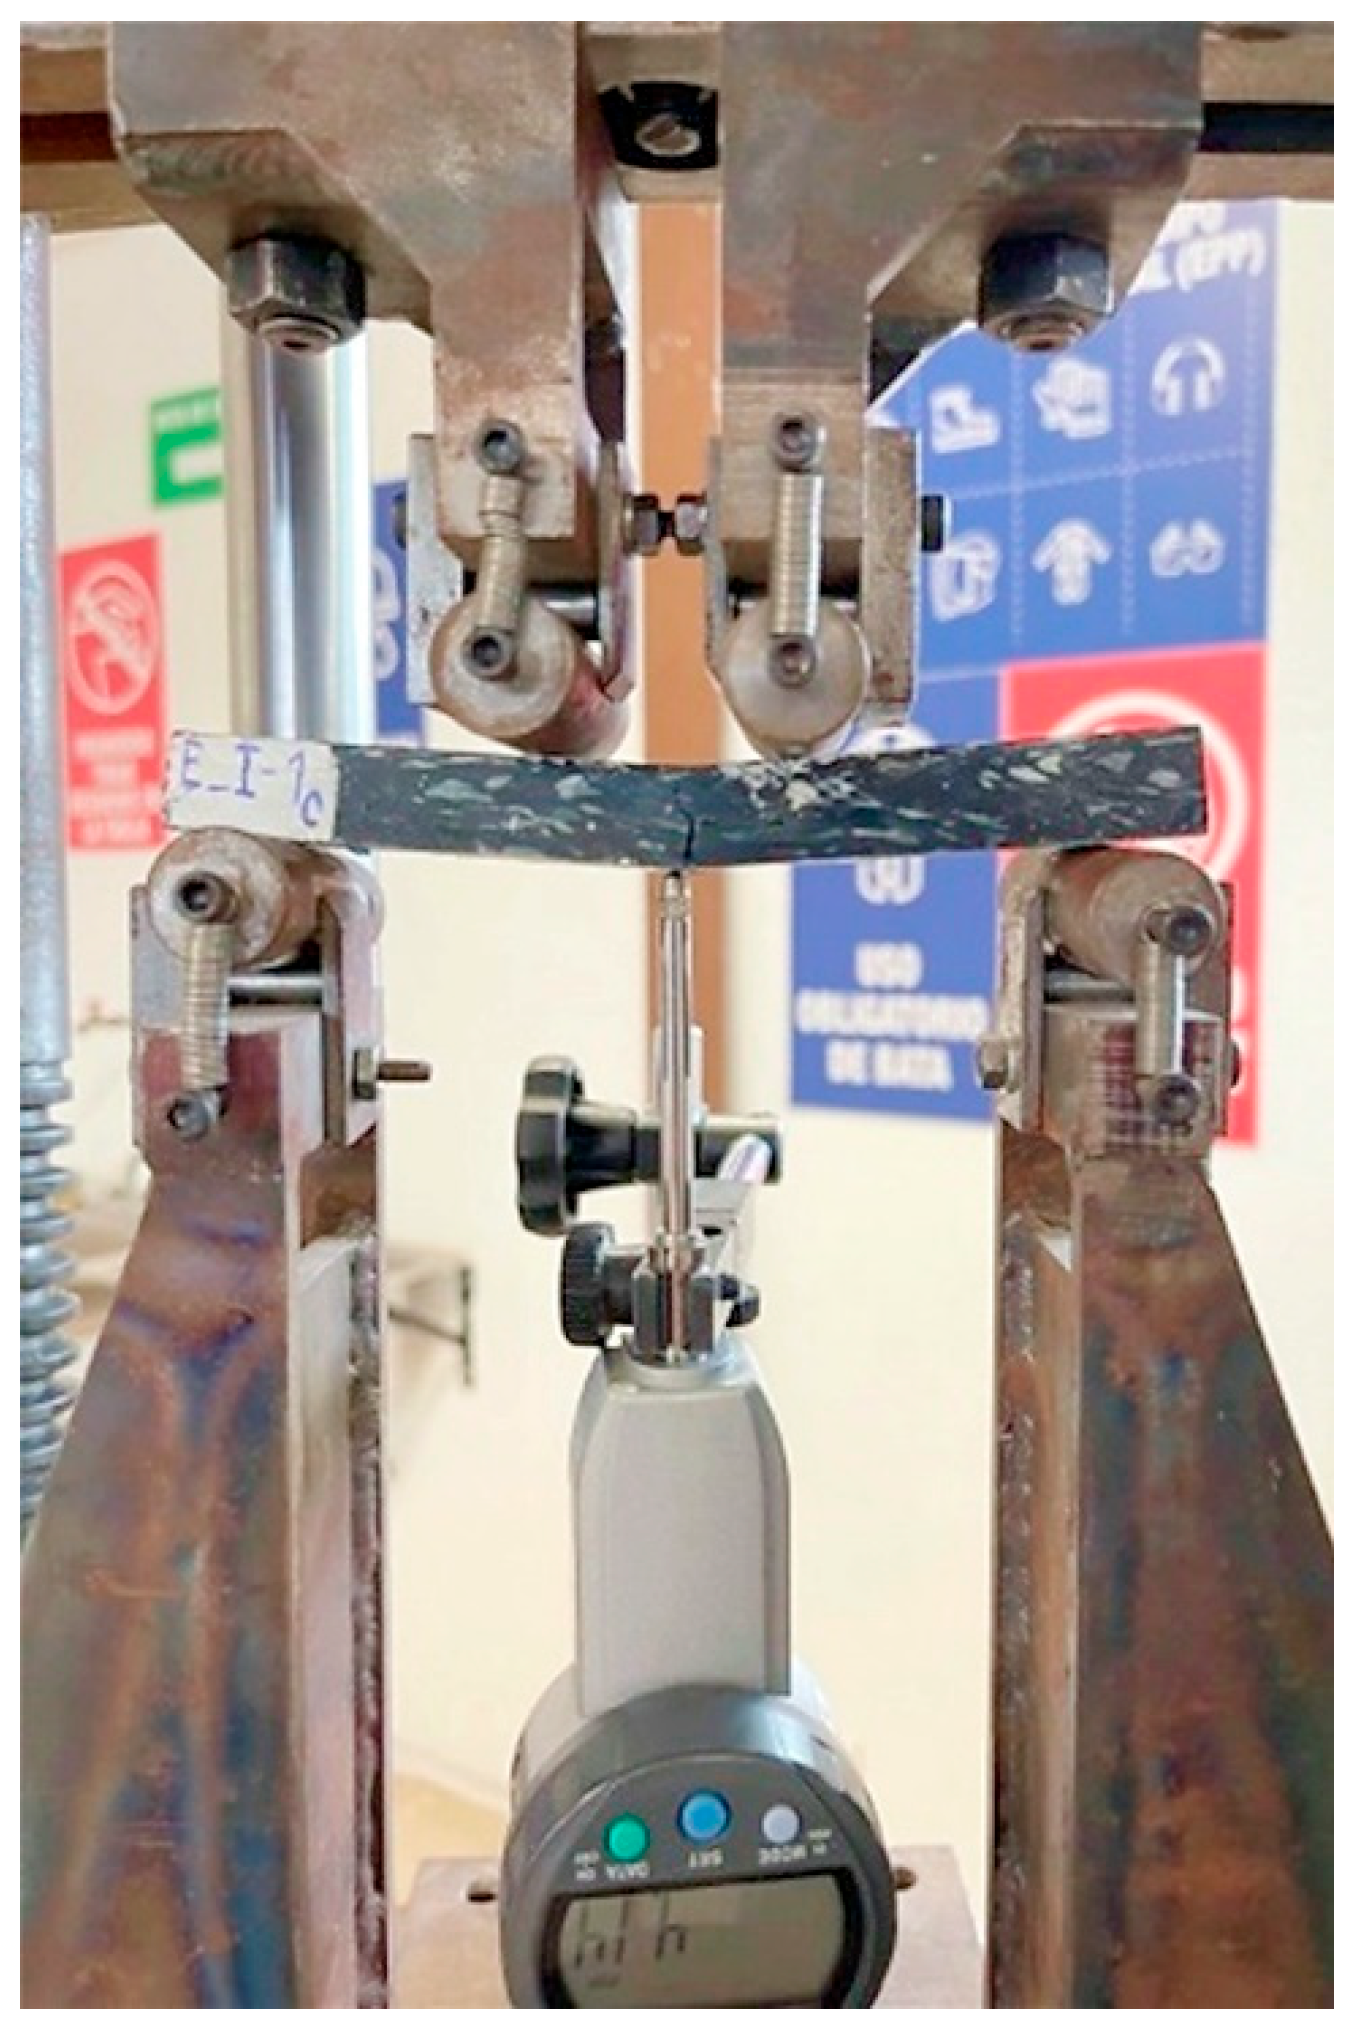
Specimens followed Procedure A of ASTM D3039/D3039M using grips with conical serrations (≈25 TPI).
Figure 5 presents the tensile test setup, with the grip pressure set to prevent slippage without inducing jaw breaks. Axial strain was measured using a clip-on extensometer (gage length: 25–50 mm) up to its full range; beyond that, crosshead displacement was employed, with compliance correction applied. The crosshead rate was targeted at 1–10 min to failure.
Special care was taken to correlate load application with deformation to avoid excessive deformation caused by specimen slippage. The elastic modulus was calculated according to elastic deformation (first section of the stress–strain graph). The failure mode, cracking pattern, and location of specimens were recorded according to the recommendations of the ASTM D3039/D3039M standard [
39].
Flexural strength (3-point) was computed as
, the flexural modulus from the slope of the load–deflection curve in the linear region.
, where
m is the slope (load/deflection),
b is the width,
d is the thickness. Four-point formulas were followed according to ASTM D6272, Clause 12 [
38]. Tensile strength was
and modulus from the initial engineering stress–strain slope.
For each condition, n = 10 specimens were tested. Tables report the mean ± SD and 95% CI. No hypothesis-testing is claimed. Given the applied scope and heterogeneous recycled feedstock, descriptive statistics and application-oriented acceptability ranges were conducted.
2.5. Thermal Analysis
Differential scanning calorimetry (DSC) and thermogravimetric analysis (TGA) were performed on a simultaneous thermal analyzer (TA Instruments SDT Q650, New Castle, DE, USA) using open platinum crucibles. Separate runs were carried out on cap flakes from white closures (HDPE/PP) and from black closures (HDPE/PP with carbon black), as received. Tests were conducted under a nitrogen purge (100 mL·min−1) from 30 to 600 °C at a heating rate of 10 °C·min−1 using specimens of 10–15 mg. The thermograms reported correspond to the first heating scan (no cooling/reheating cycles). DSC heat flow is reported in W·g−1 (endotherm down) and TGA mass is expressed as a percent of the initial mass.
3. Results and Discussion
3.1. Weathering and Thermal Characterization of Bottle-Cap Feedstock
Bottle-cap polymers are commonly mixed polyolefins (PP/HDPE). Exposure to solar UV radiation induces chain scission and embrittlement [
41]. Natural weathering, particularly UV exposure, drives caps to break down into progressively smaller fragments [
42]. As brittle pieces are transported by wind and runoff, MNPs enter soils, surface waters, aquifers, and ultimately the food chain [
30], which is especially concerning given the large annual volume of caps.
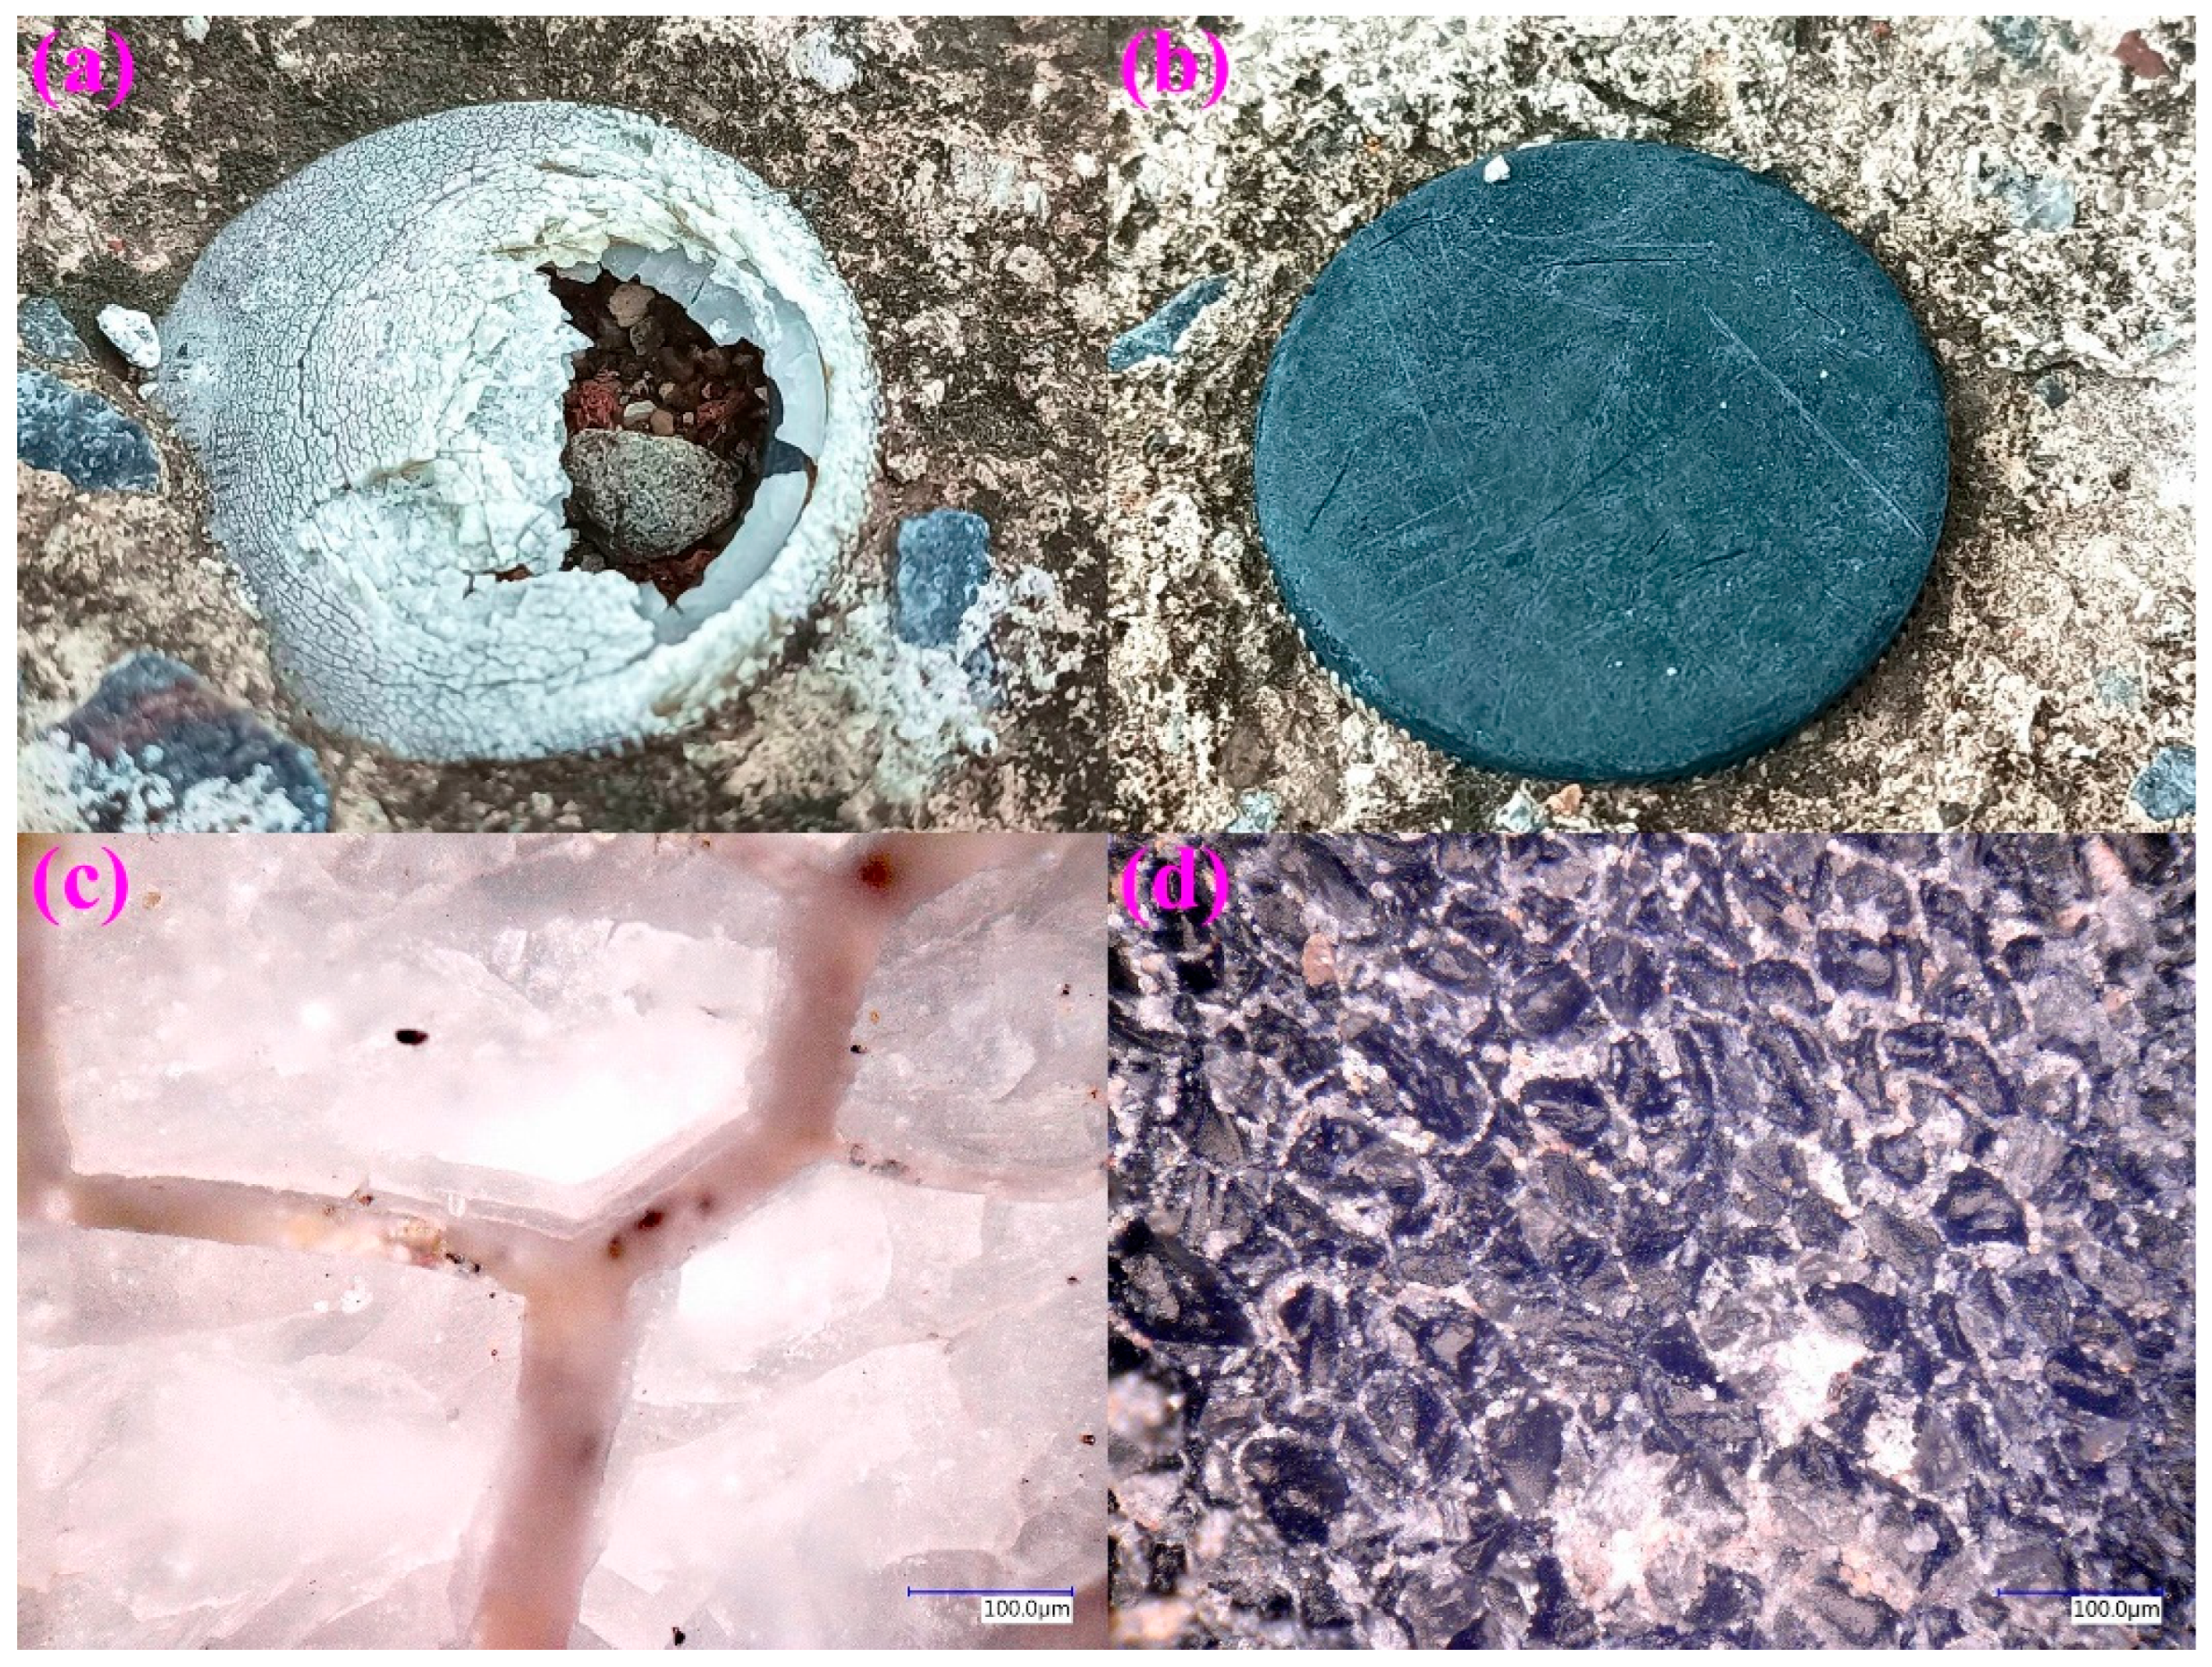
Figure 6 compiles qualitative field observations of long-term weathering (qualitative comparison only). A conventional colored HDPE cap located outdoors on a concrete step in front of a PET prototype room [
5,
43,
44,
45], exhibited severe cracking and fragmentation after years of sunlight (
Figure 6a), whereas, under similar exposure, a black HDPE cap remained largely intact (
Figure 6b). Optical microscopy (
Figure 6c) reveals a network of cracks and secondary fractures that can detach as fine powder, while
Figure 6d shows surface grains decorated with ~5 µm quartz particles that contribute to abrasion resistance. Although UV durability is not quantified here, these images support the hypothesis that carbon-black pigmentation enhances outdoor stability and motivates future accelerated-aging studies on WPC panels.
In this study, the researchers applied this principle to WPCs by incorporating carbon black caps. The resulting composite materials exhibited a predominantly black coloration, interspersed with white spots and sawdust particles, reflecting the heterogeneous composition. This approach opens new possibilities for extending the lifespan and performance of WPCs in outdoor environments, where UV resistance is critical for maintaining mechanical strength over time.
To complement these qualitative observations, differential scanning calorimetry (DSC) and thermogravimetric analysis (TGA) under N
2 were used to verify the polymer matrix and the presence of carbon black in the black caps.
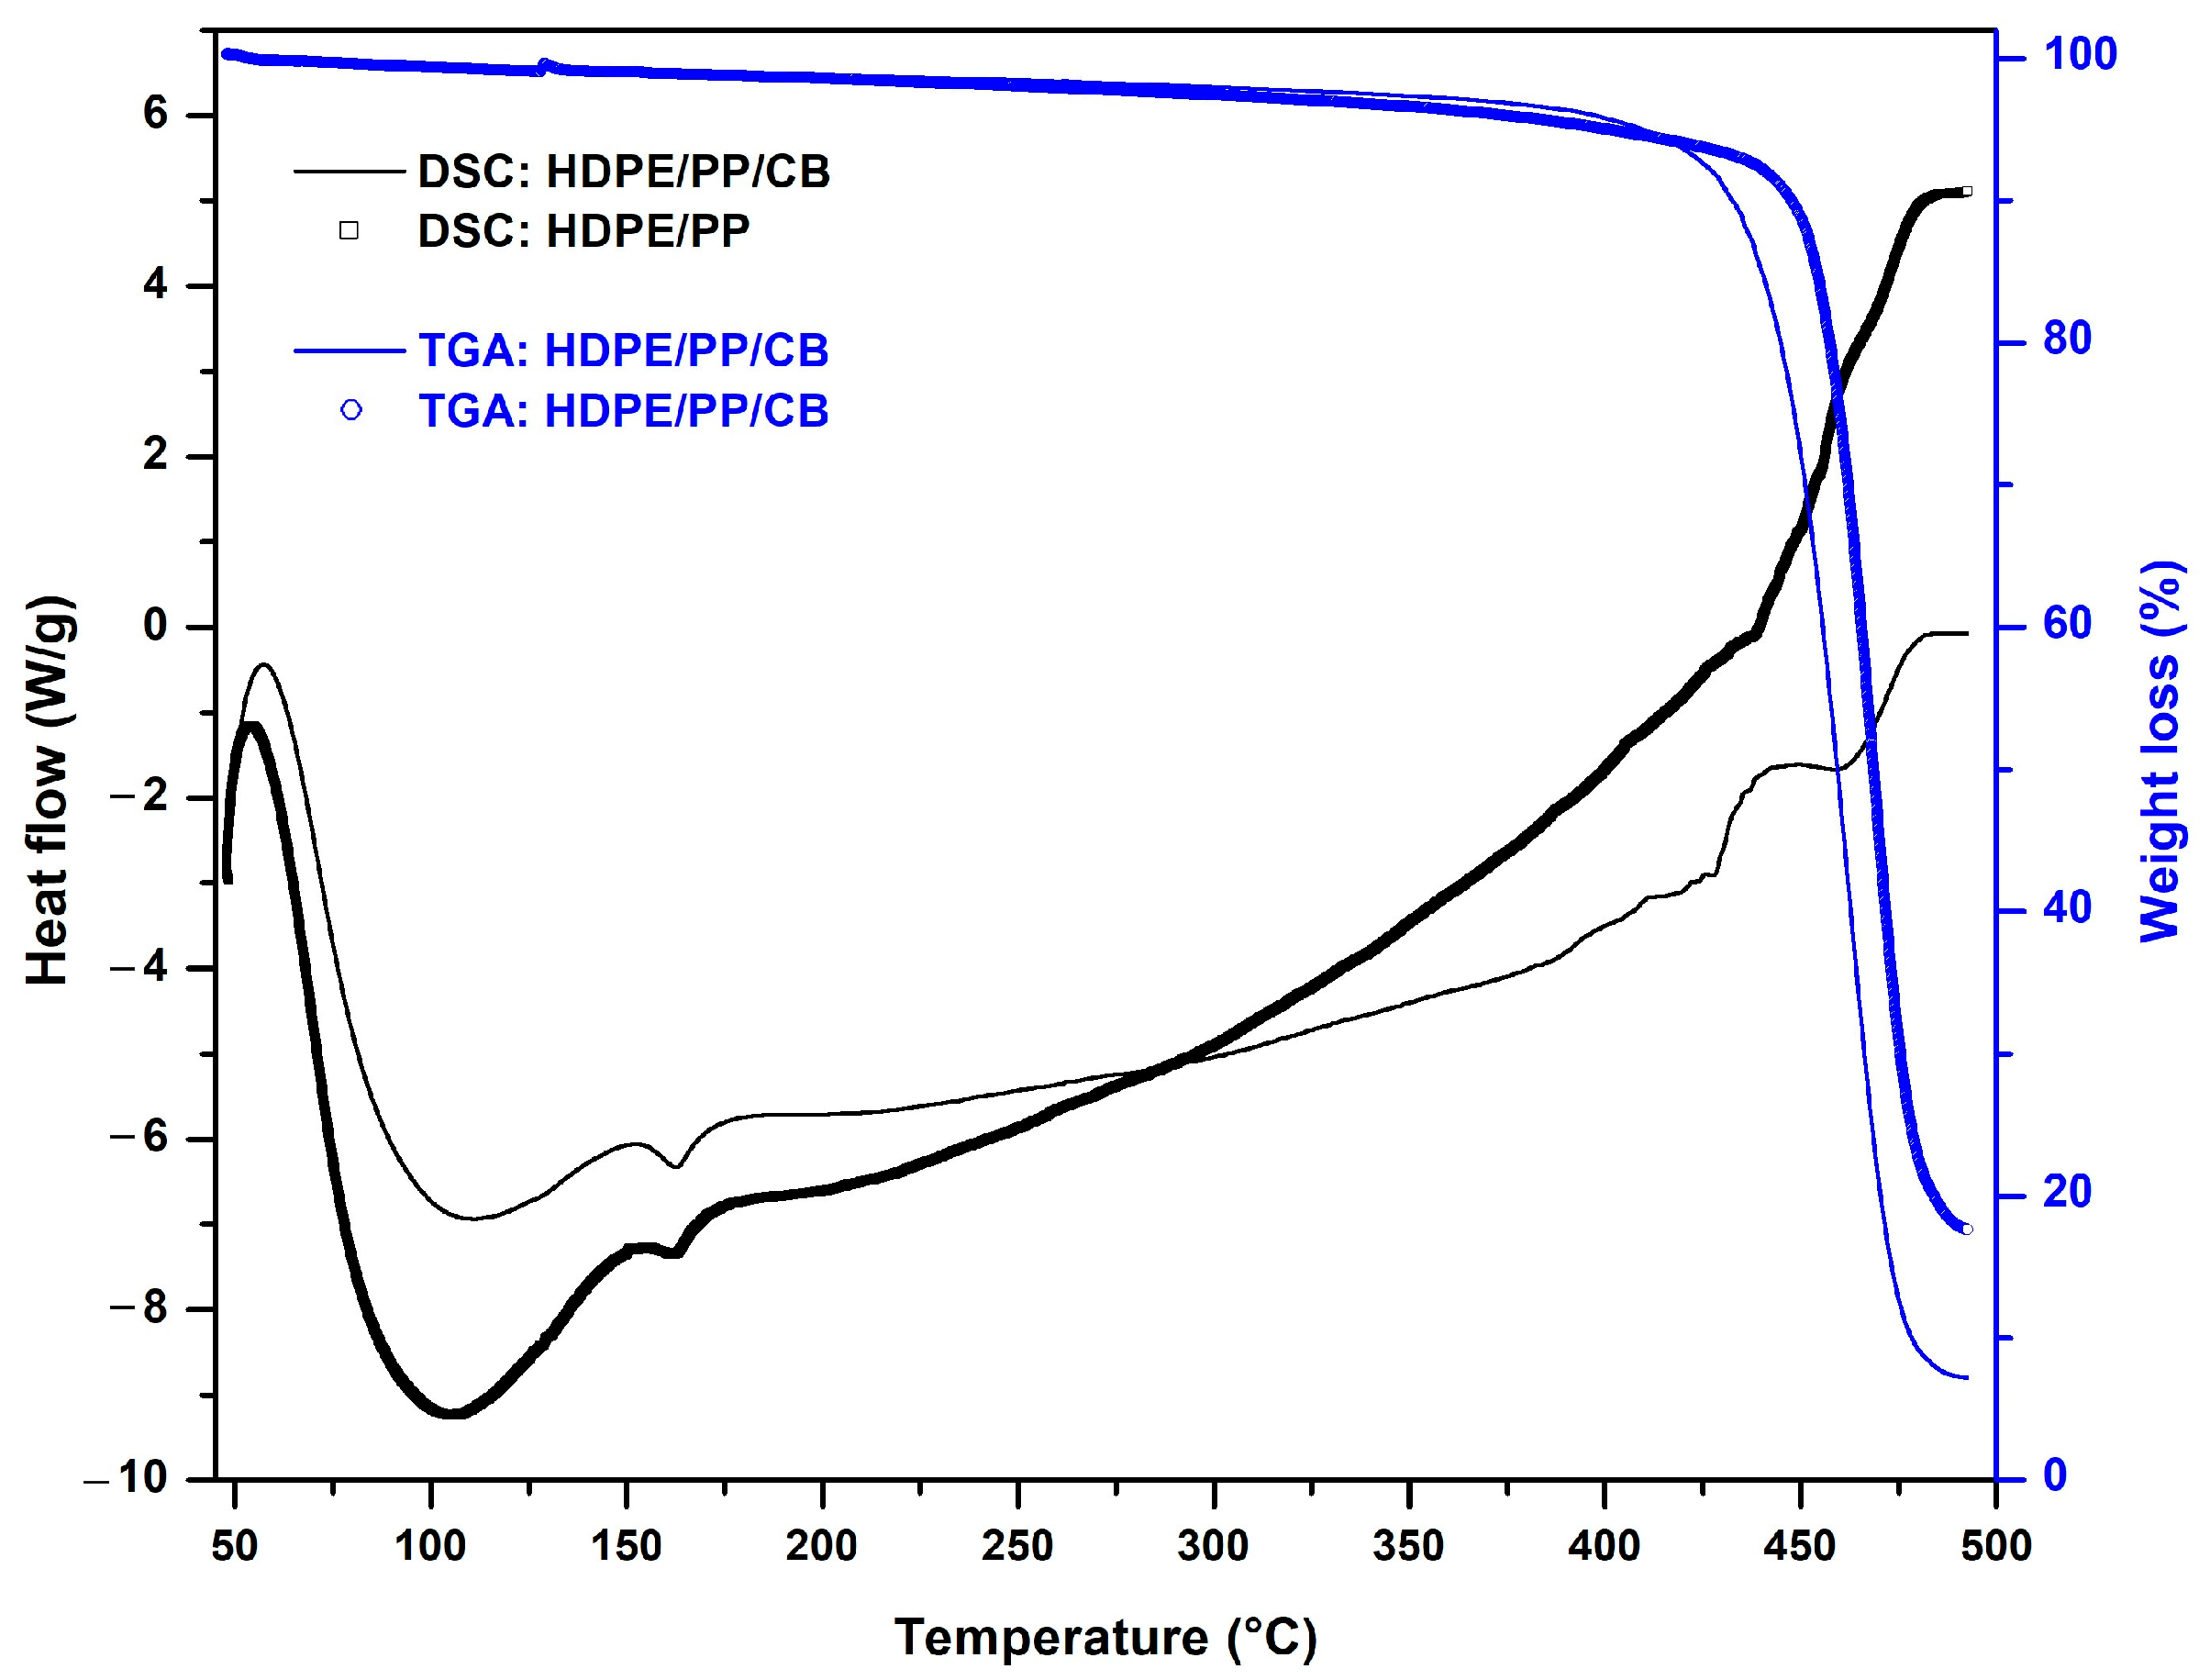
Figure 7 overlays DSC heat flow (left
Y-axis, W·g
−1) and TGA mass loss (right
Y-axis, % of initial mass) for white HDPE/PP caps and black HDPE/PP/CB caps.
Table 2 summarizes the main thermal parameters: melting peak temperatures of HDPE- and PP-rich phases, decomposition onset and peak temperatures, and the residual mass at 500 °C, along with their assignments.
In DSC (
Figure 7, black curves;
Table 2), both feedstocks exhibit the characteristic double melting endotherm of PP/HDPE blends. The white HDPE/PP caps show a lower-temperature peak at ≈118 °C, attributed to HDPE-rich crystallites, and a higher-temperature peak at ≈155 °C, attributed to PP-rich crystalline domains. The black HDPE/PP/CB caps present similar melting temperatures (≈115 and ≈150 °C), indicating that carbon black does not significantly perturb the crystalline identity of the blend at the resolution of DSC. In both cases, a weak shoulder near 60–70 °C can be associated with less perfect crystals or minor additives. The measured melting peaks fall within the ranges reported for recycled PP/HDPE mixtures [
46,
47,
48].
In TGA (
Figure 7, blue curves;
Table 2), both materials show a single dominant degradation step under nitrogen. The HDPE/PP caps start to decompose at ≈400–410 °C and reach a maximum mass-loss rate at ≈465–470 °C, leaving ≈0–1 wt% residue at 500 °C. The black HDPE/PP/CB caps show a slightly delayed onset (≈405–415 °C), a peak at ≈455–460 °C, and retain ≈8–10 wt% residue associated with non-volatile carbon black and minor inorganic pigments [
48,
49]. These temperatures are consistent with TGA data for PP/HDPE blends [
50,
51,
52]. After oxidative ashing, the residue disappears, supporting its carbonaceous origin and aligning with standard ash/carbon-black determinations for polyolefins [
53,
54,
55]. Overall, the thermal analysis confirms that both feedstocks are PP/HDPE blends, verifying the presence of carbon black in the black caps, and establishes a safe processing window below 200 °C for compression molding, well separated from the onset of thermal degradation.
3.2. Mechanical Behavior Under Three-Point Bending
Figure 8 shows the typical crack pattern for specimens with 0% sawdust (0SF3), 10% sawdust (10SF3), and 20% sawdust (20SF3).
Table 3 presents detailed results for the mechanical properties under three-point flexural loading (strength, strain, and modulus of elasticity). Flexural elastic modulus values are reported in
Table 3 and discussed below alongside strength and strain metrics. These data serve as a benchmark for comparing the performance of the WPC samples. The PP/HDPE blend reflects the reality of post-consumer bottle-cap streams (closures/liners). No compatibilizers were added, so the interface is intentionally unoptimized, consistent with the applied waste-to-panel scope. Note that figures plot ε (mm/mm), whereas tables list elongation in % (=ε × 100).
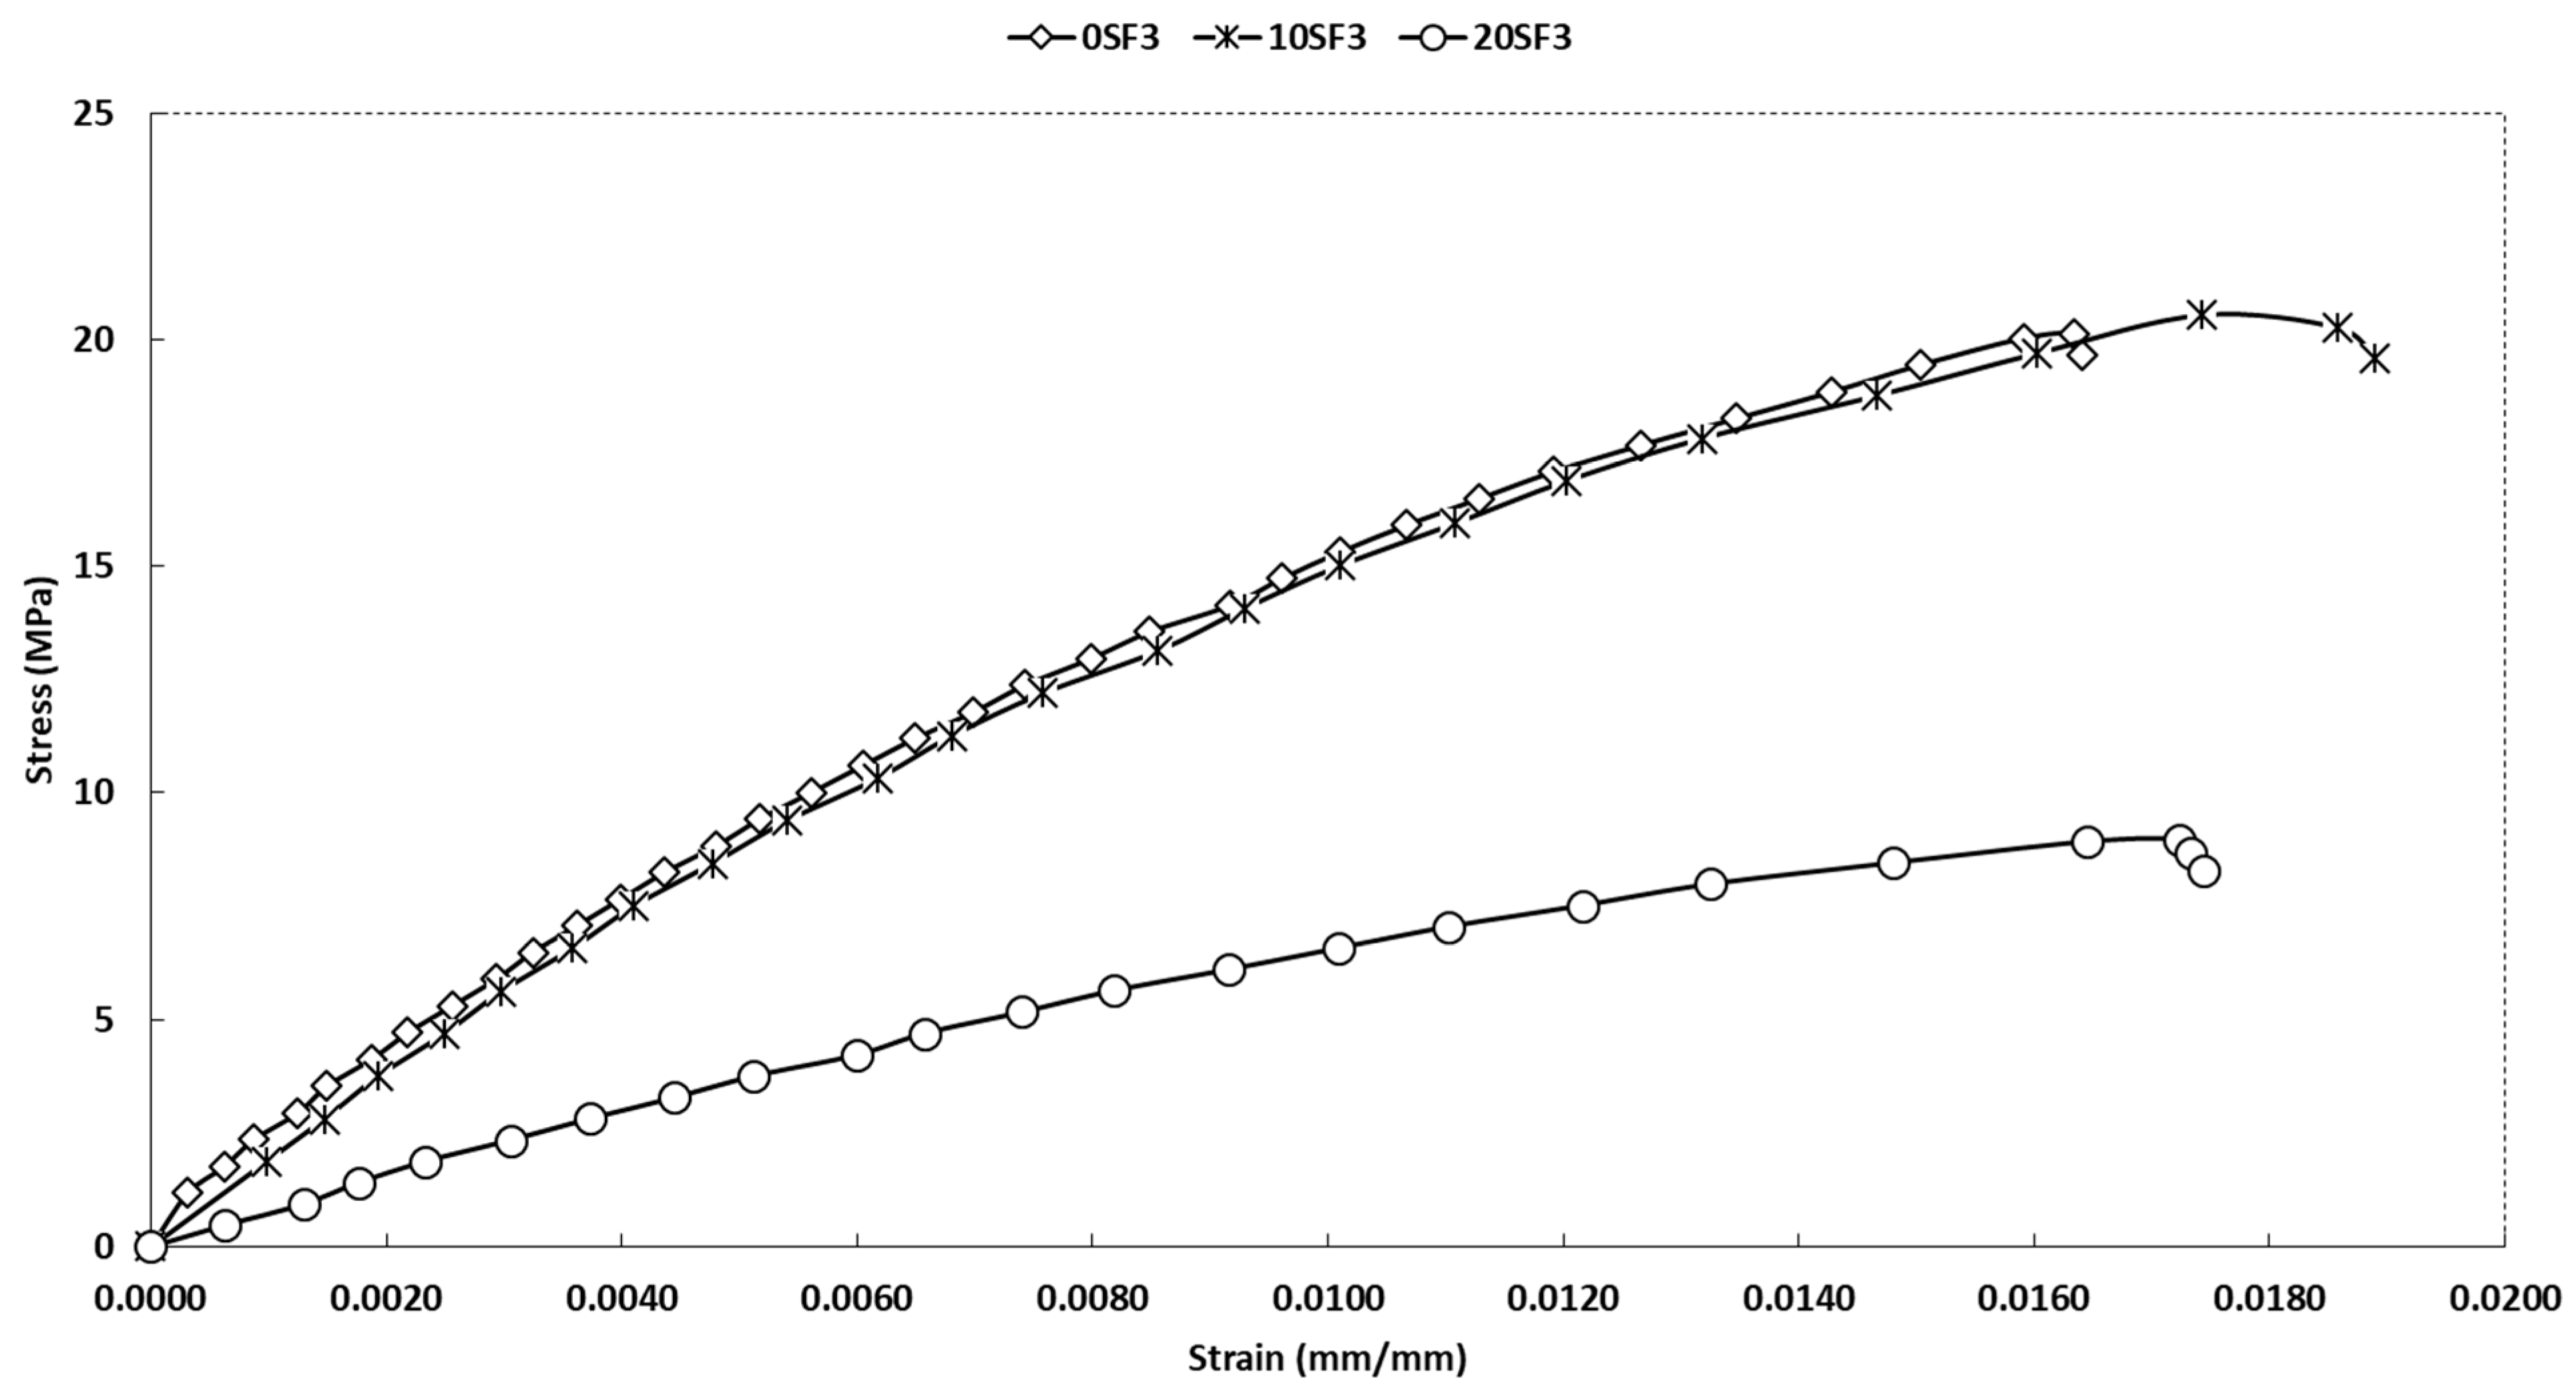
A visual analysis of the stress–strain curves for all specimens under three-point bending shows a nonlinear response. There is no clearly defined region where stress is linearly proportional to strain. Furthermore, it failed to identify the yield point, the point at which plastic deformation begins or where a change in slope occurs. At the end of the curve, the highest point is identified, followed by a decline until the collapse of the test specimen. This point concerns the formation of cracks in the tension zone of the specimens. These cracks occur when the maximum flexural normal stress exceeds the tensile strength of the polymeric matrix. Therefore, the behavior exhibited under the three-point loading condition is similar to that of elastic-brittle damage materials. These failure types are brittle under minor strains, and the best design method for fiber-reinforced composites is to ensure ductile failure. Such behavior is typical of fiber- and particle-reinforced composite materials, including concrete. In these materials, the mechanical interlocking of particles (e.g., gravel with sharp edges) plays a key role in the overall mechanical response.
Flexural strength. Based on the stress–strain graphs of the tested specimens, the maximum stress occurs at the yield point, indicating the flexural strength at yield. Consequently, the specimens break under stress less than the yield strength (flexural stress at break). Group averages and 95% CIs are reported in
Table 3. The 0SF3 specimens exhibited the highest flexural strength, followed closely by the 10SF3 specimens, while the 20SF3 specimens had the lowest value. The 10SF3 specimens exhibited higher variability (standard deviation of 3.96 MPa), followed by the 0SF3 samples. Specimen 20SF3 showed low dispersion, which increased with sawdust content.
Strain. Regarding the strain, two results were considered. The first measure is “percent elastic elongation”. It is determined by locating the first point on the stress–strain curve where deformation increases without a significant increase in stress, that is, the point where the slope changes. For the second, the percentage elongation at fracture of the tested specimen was considered, referred to as “elongation at break”. Concerning the elastic elongation, the 20SF3 specimens showed a higher value. However, the values for the other specimens do not differ much. Furthermore, the dispersion for all specimen types was very similar. All specimens tested cracked or yielded in the maximum tensile stress zone before reaching a strain of 5.0% (0.05 mm/mm), as shown in
Figure 9.
Flexural Elastic Modulus. The elastic modulus was determined from the slope drawn between two specific points on the stress–strain curve below the elastic limit. According to the data shown in
Figure 8 and
Table 3, which report group averages and 95% CIs. The 0SF3 specimens exhibit higher variability, while the 10SF3 specimens have the highest average value. The dispersion increases with sawdust content.
The results show that an increase in the percentage of sawdust fibers significantly affects the deformation of the WPC. However, the increase in sawdust fibers reduces flexural strength. The observed reduction in flexural strength with increasing sawdust content highlights the need to optimize fiber distribution and polymer compatibility when designing WPCs for structural or semi-structural applications.
3.3. Mechanical Behavior Under Four-Point Bending
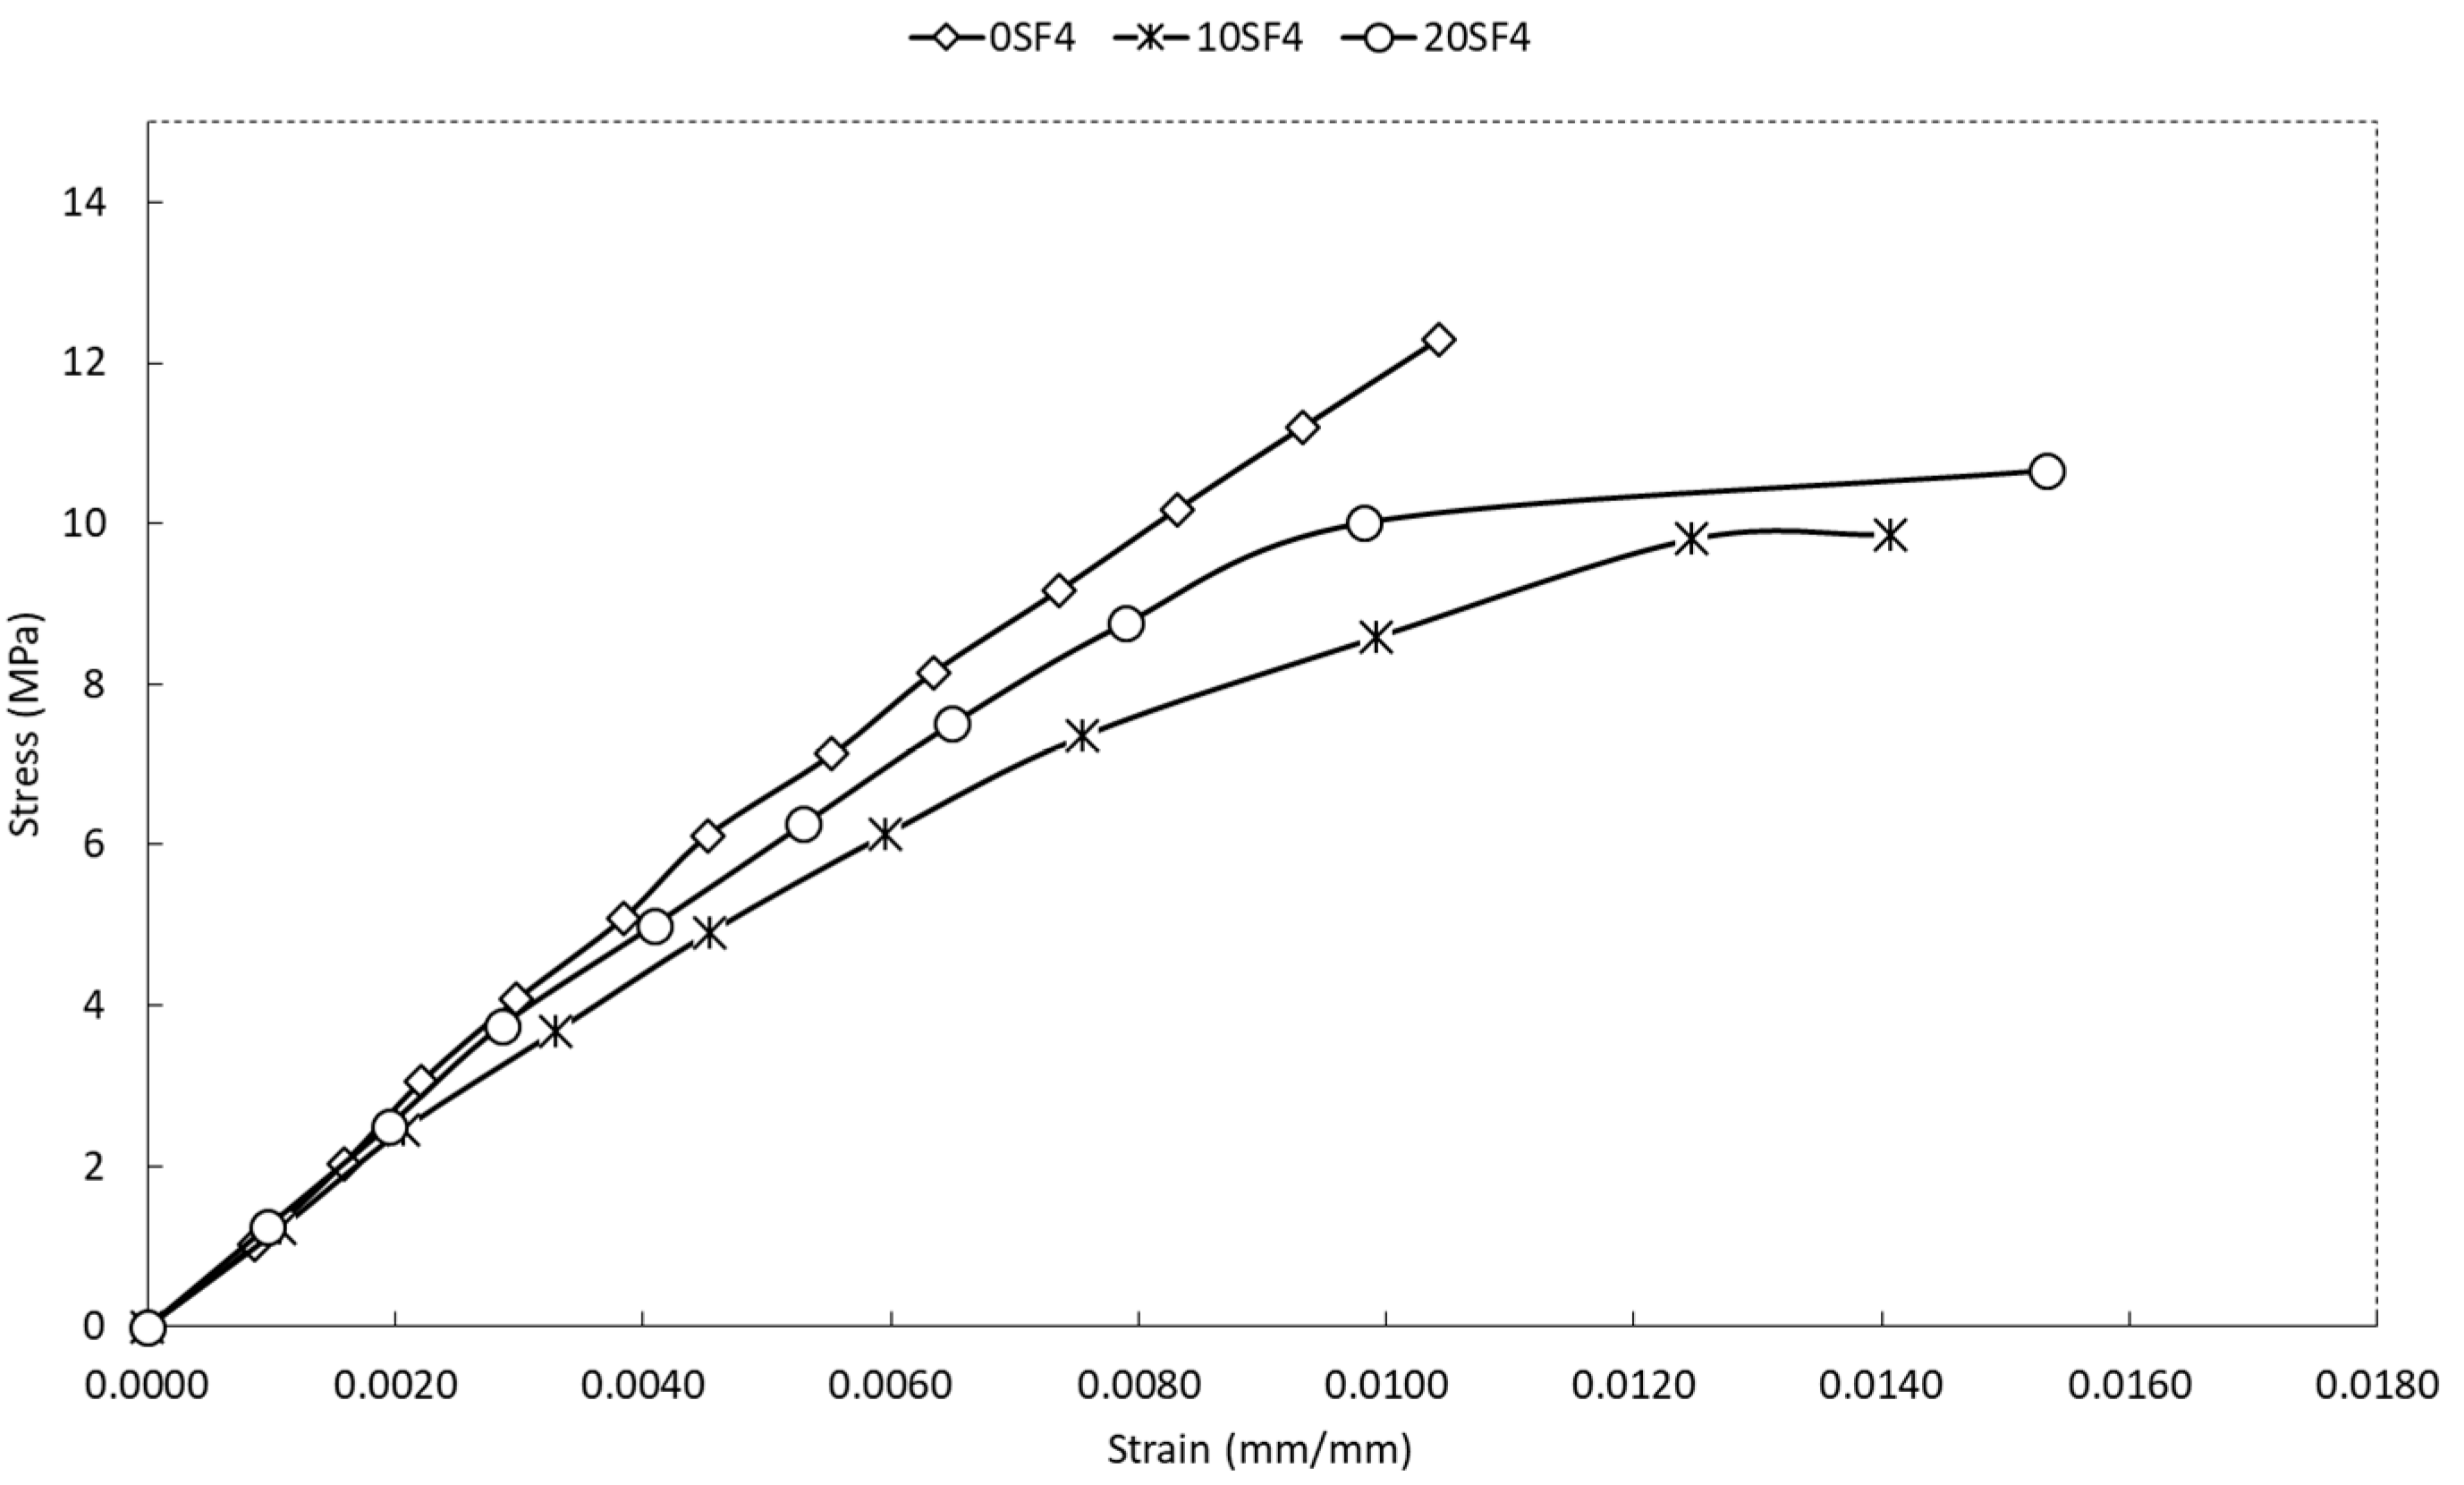
Figure 10 shows the stress–strain curves for the mechanical behavior under four-point bending of specimens with 0% sawdust (0SF4), 10% sawdust (10SF4), and 20% sawdust (20SF4).
Table 4 presents an overview of the mechanical properties of all WPC specimen types tested, evaluated as simply supported beams under a four-point loading system. Note that figures plot ε (mm/mm), whereas tables list elongation in % (=ε × 100).
Comparing the mechanical behaviors shown in the curves in
Figure 8 and
Figure 10, they are remarkably similar. The stress–strain curves exhibit nonlinear mechanical behavior until collapse. There are no distinct zones in which stress is linearly proportional to strain. Furthermore, it did not identify the yield point and at the end of the curve, the highest point is determined (collapse of the test specimen). Therefore, the behavior shown under the four-point loading condition is similar to that of elastic-brittle damaged materials. For some curves, a second zone of plastic deformation was identified; for example, the specimens with 20% sawdust exhibit this characteristic.
Flexural strength. From the stress–strain graphs, it was observed that the 0SF4 specimens exhibited a maximum stress at fracture (flexural strength at break). However, in specimens with 10SF4 and 20SF4, the maximum stress occurred at the yield point (flexural strength at yield). Subsequently, the specimens broke under a stress slightly below or above the strength (flexural stress at break), as shown in
Figure 11. Group averages and 95% CIs are reported in
Table 4. The dispersion increases with sawdust content.
Strain. Strain under this loading condition was characterized using two measures: “percent elastic elongation” and “elongation at break”. Percent elastic elongation is the first point on the stress–strain curve where deformation increases without an increase in stress and elongation at break is the percentage strain at fracture. Regarding elastic elongation, the 0SF4 specimens showed a higher value, while the other specimens did not differ significantly. Furthermore, the dispersion for all specimen types was very similar.
Strain values obtained under four-point loading were consistently lower than those under three-point bending, likely due to reduced shear effects and a more uniform bending moment distribution. Regarding the maximum strain, it was also less than 5% (0.05 mm/mm). This may be because, during pure bending loading, the effect of shear loading is minimized. Consequently, the deflection in the tested specimens (simply supported beams) decreases. The dispersion increases with sawdust content. Group averages and 95% CIs are reported in
Table 4.
Flexural elastic modulus. The 0SF4 specimens had the highest average value, followed by the 10SF4 samples. However, the values of these specimens differ very little. For the 10SF4 specimens, higher variability or dispersion in the values is noted. Group averages and 95% CIs are reported in
Table 4. The dispersion increases with sawdust content.
At a sawdust concentration of ~10 wt%, stiffness gains resulting from particle-to-matrix load transfer offset defect-induced weakening, preserving matrix continuity and producing equal or higher flexural modulus and, in some cases, strength. At a concentration of ~20 wt%, increased porosity, crack initiation sites, and debonding from the fiber-matrix interface promote early crack growth and unstable crack propagation, reducing strength, especially in flexure, despite the higher filler content. Trends in three- and four-point bending, as well as between flexure and tension, are consistent with defect sensitivity under varying stress distributions.
3.4. Mechanical Behavior Under Tension Stress
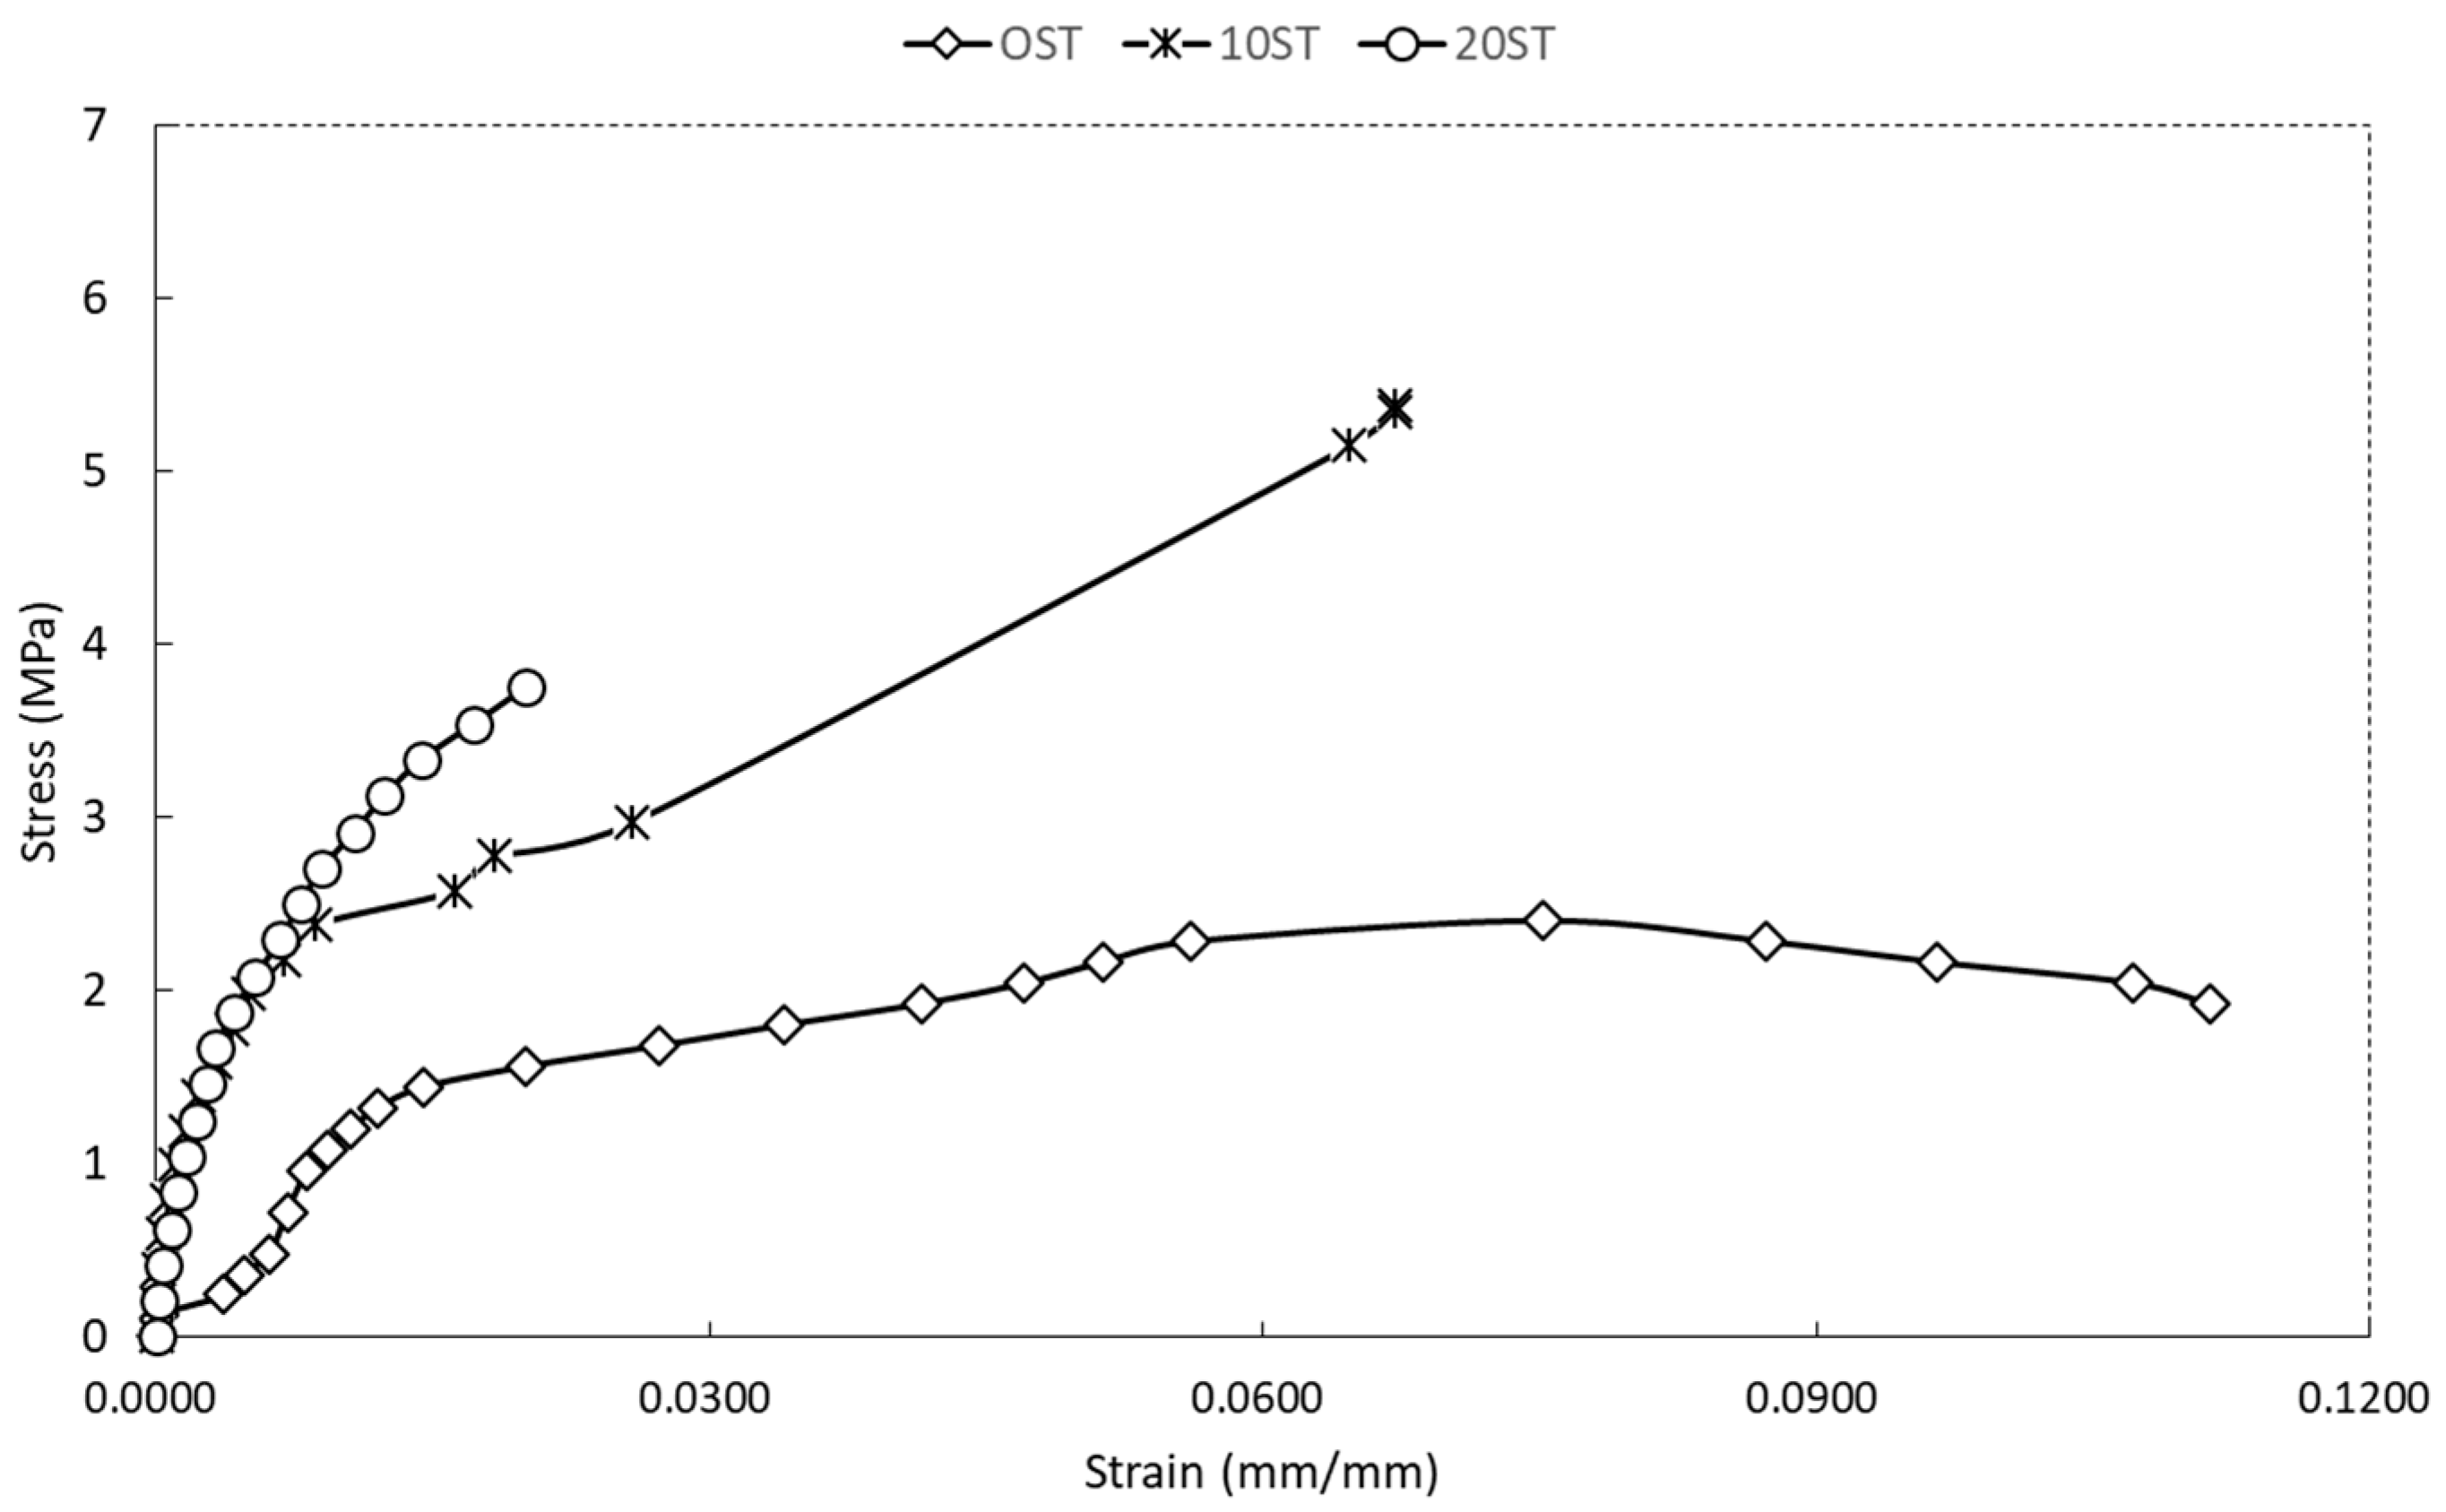
Figure 12 shows the stress–strain graphs corresponding to the mechanical behavior under tensile stress for specimens with 0% sawdust (0ST), 10% sawdust (10ST), and 20% sawdust (20ST). On the other hand,
Table 5 includes data on elastic modulus, strain, and tensile strength, along with their averages. Note that figures plot ε (mm/mm), whereas tables list elongation in % (=ε × 100).
The tensile stress–strain curves of all specimens exhibited a nonlinear progression without a distinct yield point, indicating a brittle or quasi-brittle response typical of fiber-reinforced thermoplastics. There are no distinguished zones where stress is linearly proportional to strain, and the yield point is also not identified. However, for some curves, a second zone of plastic deformation (characterized by large strain values) was observed, followed by cracking and collapse. Similarly, the mechanical behavior identified is elastic-brittle damage. As observed, the direct tension load generates tensile stresses that more easily exceed the strength of the polymeric matrix, in contrast to the flexural tests. Additionally, it is noticeable that the sawdust reinforcing fibers did not substantially modify the mechanical behavior under direct tensile loading.
The observed scattering is consistent with a recycled stream resulting from particle size heterogeneity, residual moisture, and interfacial adhesion/debonding between the wood and the matrix. These factors determine sensitivity to defects and explain the variability in stiffness/strength in flexural and tensile modes.
According to the recommendations of the ASTM D3039/D3039M standard [
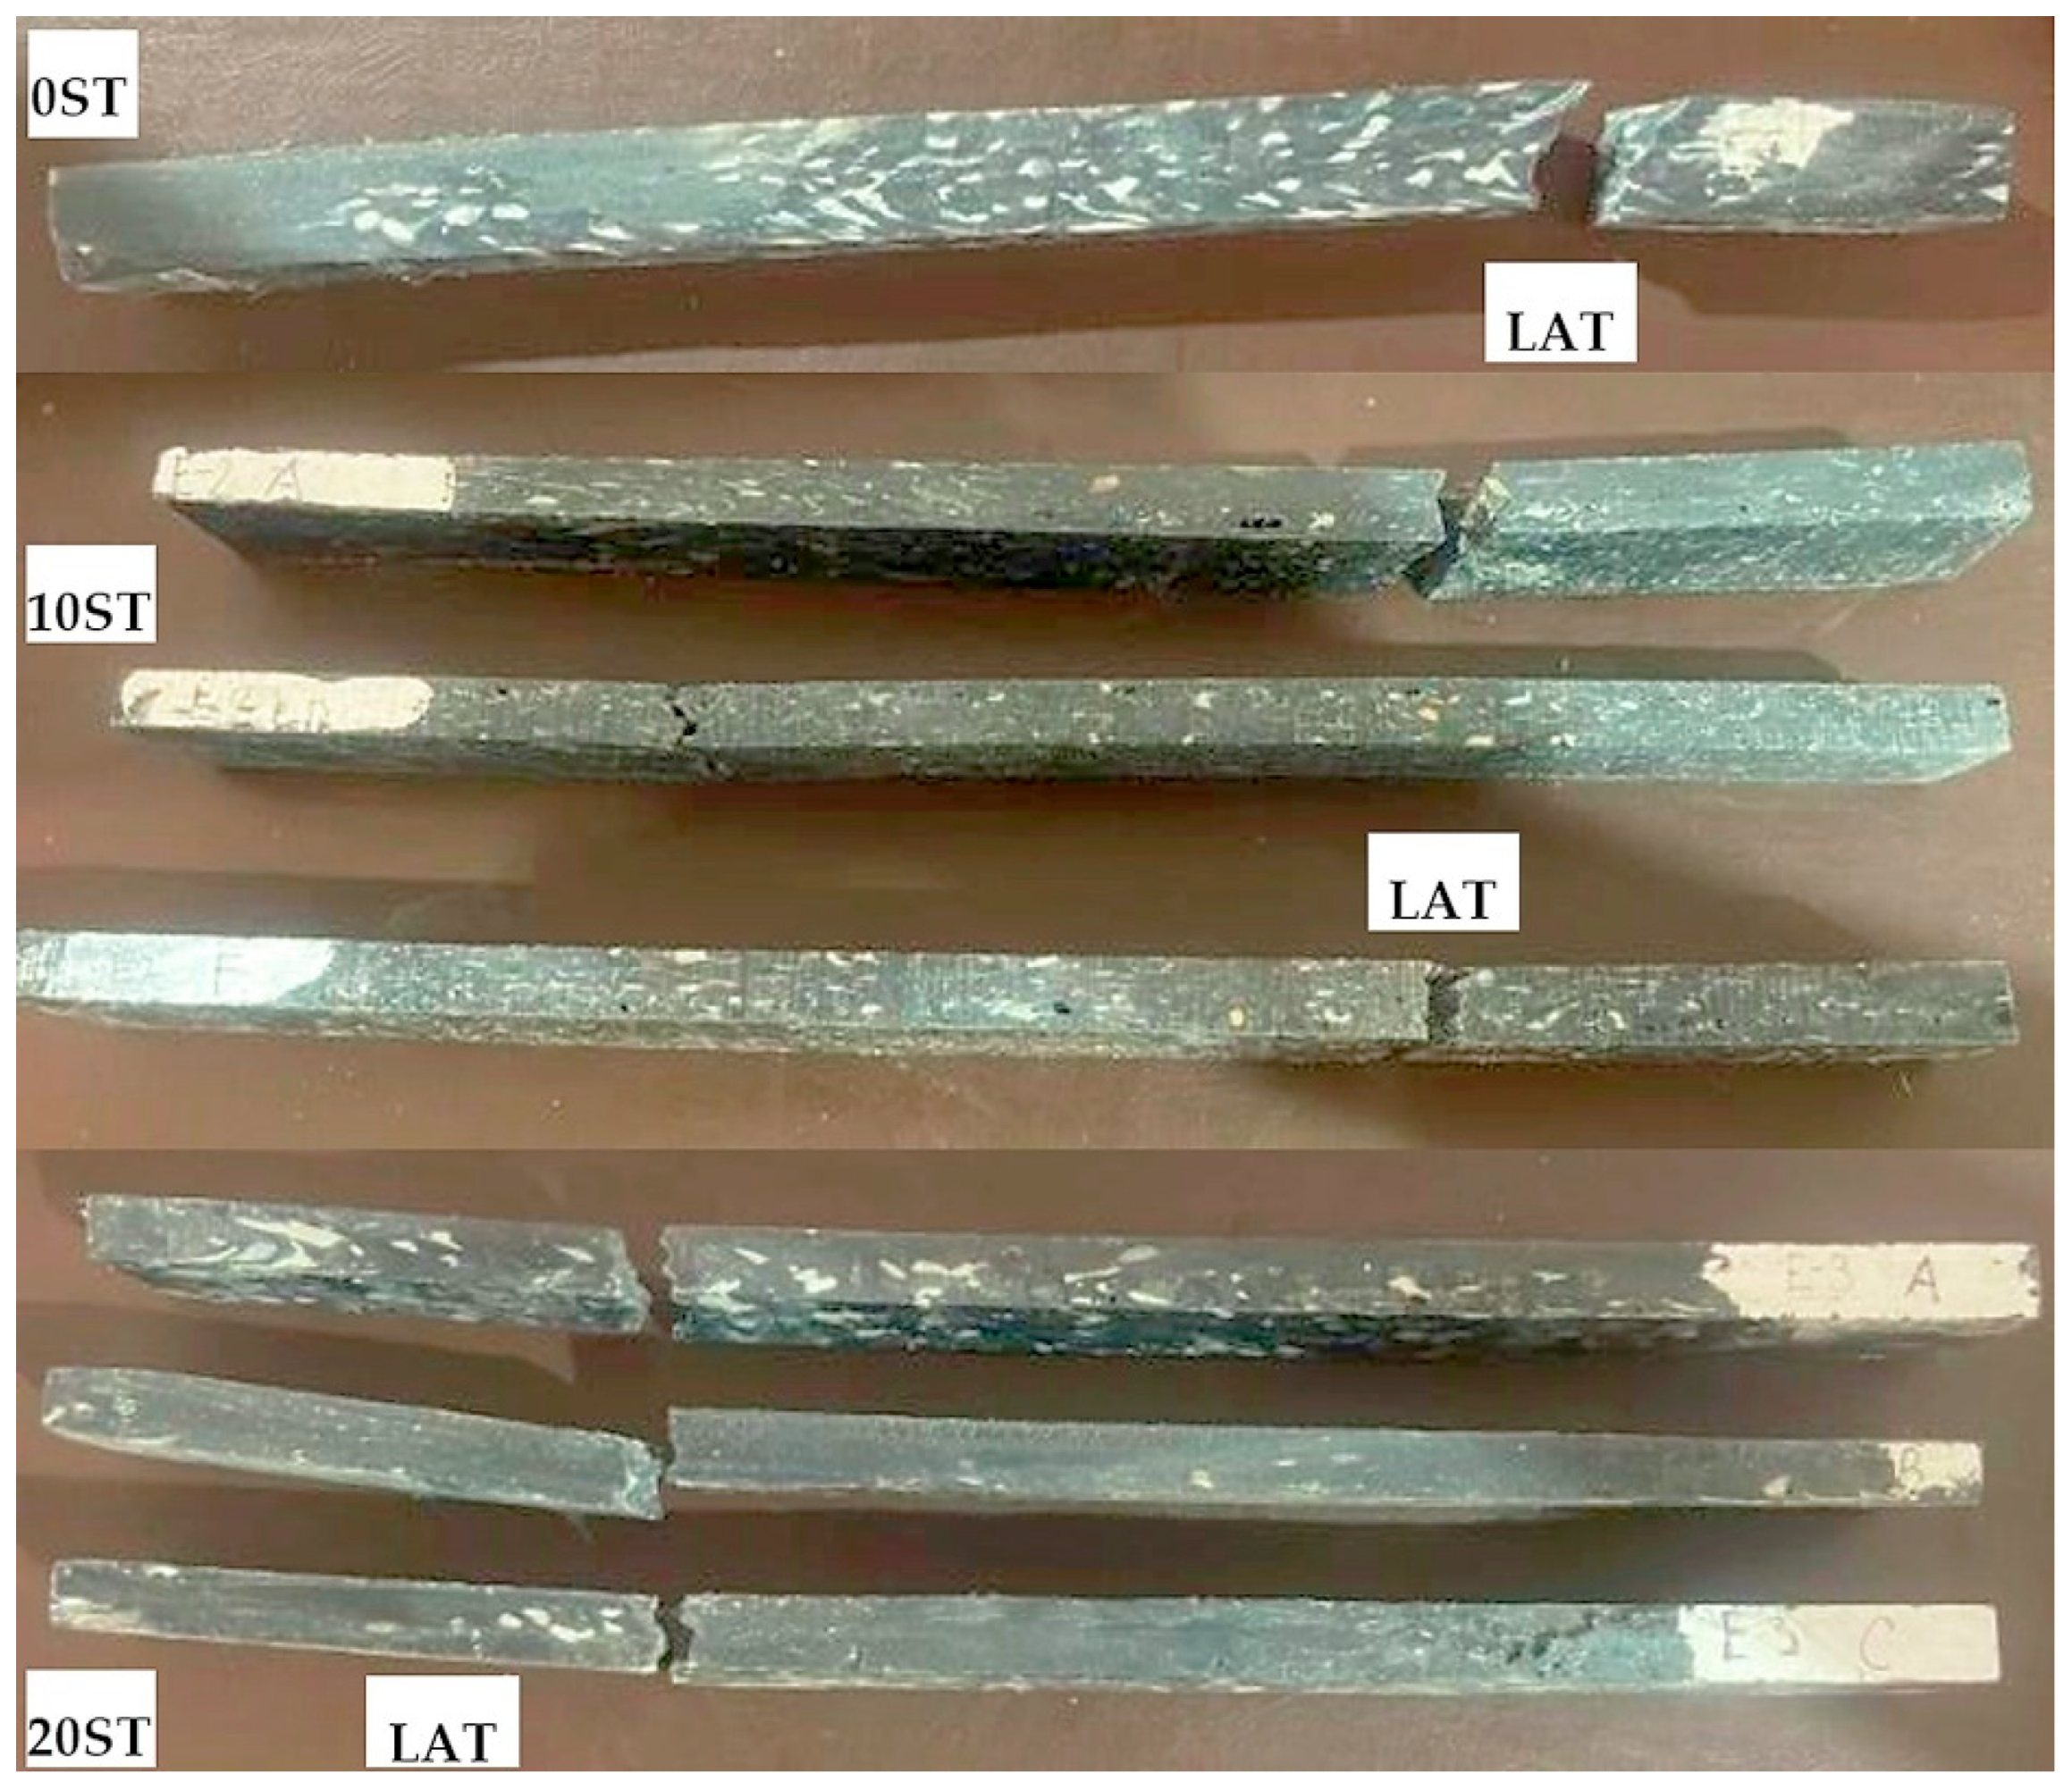
39], the cracking pattern and its location (failure mode or collapse) of the tested specimens were recorded. For this purpose, the standard recommends using a three-part failure mode code to describe the failure. Some of the codes it suggests are AGM (A-angled, G-gage, M-middle), LAT (L-lateral, A-at grid/tab, T-top), AIB (A-angled, I-inside grip/tab, B-Bottom), LGM (L-lateral, G-gage, M-middle), etc. In this regard,
Figure 13 shows some test specimens and the most common cracking pattern was the LAT or LGM, with the cracking zone near the grip zone and the crack extending from one end to the other. However, in some specimens, the crack had a slight inclination.
According to the stress–strain graphs for the 10ST and 20ST specimens, the maximum stress occurred at fracture (flexural strength at break). However, in the case of 10ST specimens, tensile stress was observed at yielding. The first point on the stress–strain curve at which an increase in strain occurs without a significant increase in stress indicates a change in the slope of the curve. For specimens tested 0ST, the maximum stress occurred at the yield point (tensile strength at yield), and the specimens subsequently broke at a stress below the yield strength (tensile stress at break). For the 0ST specimens, the individual values ranged from 2.4 to 4.80 MPa, with an average of 3.60 MPa. Whereas for the 10ST specimens, the individual values ranged from 2.29 to 5.34 MPa, with an average of 3.79 MPa. Additionally, for the 20ST specimens, the individual values ranged from 3.1 to 3.75 MPa, with an average of 3.44 MPa. The 10ST specimens exhibited the highest tensile strength, followed closely by the 0ST specimens, while the 20ST specimens had the lowest.
Strain. Strain under tensile loading was again described using “percent elastic elongation” and “elongation at break”. Regarding elastic elongation, the 0ST specimens showed higher values and higher dispersion.
Regarding the elongation at break for the 0ST specimens, the individual values ranged from 11.13 to 20.05%, with an average of 15.60%. In contrast, for 10ST samples, the individual values ranged from 1.95 to 6.72%, with an average of 3.7%. Similarly, for 20ST samples, individual values ranged from 2.0% to 3.3%, with an average of 2.55%. The 0ST specimens exhibited the highest average unit strain and also showed higher variability in values. Moreover, the 10ST specimens also have higher variability.
The curves show that the tensile strain values are higher than the flexural strain, and the maximum strain value for the 0ST and 10ST specimens exceeded 5% (0.05 mm/mm). It is evident that under direct tension load, this composite material exhibits lower stiffness, which can be attributed to the low stiffness of both the polymeric matrix and the reinforcement (sawdust). Furthermore, this effect can be caused by discontinuities in the material, such as cracks, pores, material transitions, or a lack of adhesion.
Concerning the Tensile Elastic Modulus, the individual values ranged significantly as follows: 0.06 to 0.14 GPa with an average of 0.1 GPa for 0ST samples; 0.15 to 0.5 GPa, with an average of 0.33 GPa, for 10ST samples; 0.22 to 0.48 GPa, with an average of 0.36 GPa, for 20ST samples. The 10ST samples had the highest average value and higher variability or dispersion (standard deviation of 0.17 GPa), followed by the 20ST samples. However, the values of these specimens differ very little. The modulus of elasticity under tensile loading was lower than that obtained under flexural loading.
Use as temporary formwork requires application-specific design (span, support spacing, safety factor, deflection limits). The data in this work provide screening values, not structural design values.
4. Conclusions
This work evaluated the mechanical behavior of wood-plastic composites (WPCs) fabricated from recycled high-density polyethylene (HDPE) caps and sawdust at varying fiber concentrations.
Four-point flexural modulus up to 1.6 GPa. Non-structural panels can be designed using a thickness-based approach.
Performance peak at ~10 wt% sawdust (stiffness gain vs. defect-induced weakening); 20 wt% lowers strength via porosity/debonding.
Dispersion increases with sawdust content. The n = 10, mean ± SD, and 95% CI were reported (
Table 2 and
Table 3).
The experimental results confirm that increasing the sawdust content reduces both flexural strength and elastic modulus, due to limited fiber orientation, poor interfacial adhesion, and increased matrix porosity.
The composites exhibited nonlinear mechanical responses with no evident yield point, characteristic of elastic-brittle failure. Cracking typically originated in the tension zone and propagated rapidly once the tensile capacity of the polymer matrix was exceeded. These behaviors were consistent across both flexural and tensile loading conditions.
Despite their lower modulus than conventional polymers or metals, recycled WPCs achieved mechanical properties suitable for non-structural applications, such as temporary formwork in concrete casting. The highest flexural elastic modulus recorded was 1.6 GPa, which is sufficient for low-load bending applications when proper thickness adjustments are made in the design.
A key insight from this study is the influence of experimental dispersion on mechanical reliability. Variability in tensile results, particularly at higher sawdust content, suggests the need for improved fiber distribution and enhanced interaction between the matrix and filler. These variations should be considered when defining safety factors and allowable stresses for engineering applications.
Limitations in this study: (i) composition verification by DSC is provided only in representative form and not as a full compositional survey, (ii) CB content and dispersion in black caps were not quantified, (iii) no surface compatibilizers or fiber treatments were used, (iv) durability (UV/water uptake) and impact/hardness were not measured, and (v) re-processing (multiple recycling) effects on PP/HDPE properties were not evaluated. No statistical inference was performed at this stage. Fractographic (SEM) analysis is reserved for process/compatibilizer optimization in subsequent work. The heterogeneity of the recycled raw material and the applied objective led to an emphasis on descriptive statistics and acceptability ranges for non-structural use.
Future work can quantify UV stability (ASTM G154/G155) and moisture effects, and assess compatibilizers to narrow dispersion while maintaining a recycled-only bill of materials. Based on reported UV-stabilization mechanisms in polyethylene and PP/HDPE blends, practical CB loadings of the order of a few wt% (≈2–3 wt% relative to the polymer phase) generally balance UV screening with retention of ductility and processability. This CB range, combined with the mechanically favorable sawdust content of ~10 wt% identified here, is proposed as a starting point for systematic durability optimization of recycled WPC formwork in subsequent studies. Also, the studies can focus on optimizing the manufacturing process, including the use of longer, aligned natural fibers or coupling agents to improve matrix adhesion. Additionally, the incorporation of carbon black, as seen in black HDPE caps, holds great promise for extending UV resistance in outdoor applications, meriting further investigation through accelerated-aging tests.
This research supports the development of eco-friendly building materials by validating the potential of post-consumer and industrial waste in composite formulations. The findings contribute to circular economy strategies and highlight pathways to enhance the mechanical performance and environmental durability of WPCs.
