Abstract
In this study, an experimental adiabatic temperature rise (ATR) measurement and a multi-scale analytical approach were investigated for concrete containing Class F fly ash (FA). A half-meter (0.5 m) insulated cube was developed to measure the ATR. ATR calorimetry was used to verify the applicability of the 0.5 m insulated cube. The ATRs were obtained by calculating the heat loss from the cube. Besides the insulated cube and adiabatic calorimetry, a multi-scale hydration model was programmed to predict the ATR from the chemical composition of the cementitious materials and mix designs. The model consists of two parts; the first part is for the Portland cement (PC) hydration reaction, and the second part is for the FA reaction. The analytical model was verified using ordinary PC and FA concrete mixes, and the ATR predictions compared well with the experimental measurements. The proposed methods proved to be a reliable alternative approach to obtain the ATR of a concrete mix containing FA. The developed 0.5 m insulated cube offers a more practical and economical approach for estimating the ATR while maintaining accuracy comparable to large-scale cubes, making it suitable for both field and laboratory applications. The study integrates on-site measurements with multi-scale analytical modeling to provide a better understanding of the hydration behavior and temperature development in FA-blended concrete.
1. Introduction
Concrete curing is an exothermic chemical process involving reactions between cementitious materials and water. During early hydration, the released heat can cause a considerable temperature to rise inside concrete structures. The thermal expansion generates tensile stresses on the surface, as the cooler outer layers provide restraint, potentially causing surface cracking. Such thermal cracks compromise structural durability and reduce the lifespan of concrete structures. Thus, estimating the ATR is essential for designing robust and durable concrete.
Adiabatic and semi-adiabatic calorimetry methods have been extensively employed to evaluate the heat generated by concrete mixtures, also referred to as the heat of hydration. RILEM TC 119-TCE [1] developed a technical recommendation for adiabatic calorimetry with a specimen heat loss of less than 0.02 K/h, while the semi-adiabatic calorimeter had a maximum heat loss of less than 100 J/(h.K). Adiabatic calorimetry has been widely used to estimate the ATR of concrete at early ages. Lin and Chen [2] developed an adiabatic calorimetry method, modifying the design by Gibbon et al. [3] to match the surrounding water in the calorimetry and concrete temperatures to limit the heat dissipation to the ambient environment. The test required a controlled environment to prevent heat transfer between the specimen and its surroundings. Because adiabatic testing is complex and costly, engineers often prefer semi-adiabatic calorimetry as a simpler and more practical alternative.
Several studies of on-site temperature measurements to evaluate heat of hydration of concrete have been performed [2,4,5,6]. Woo et al. [6] fabricated three concrete specimens (1.5 m × 1.5 m × 2.5 m) on-site, insulated with 0.1 m thick expanded polystyrene foam boards and steel formwork. They measured the temperature developments at five different positions, using thermocouples to evaluate the heat development from hydration in mass concrete containing a very high volume of slag. Lin and Chen [2] utilized two 1.2 m concrete cubes with steel formwork and embedded temperature sensors to validate their finite element hydration model. Yikici and Chen [5] constructed four 2 m concrete cubes across different regions in West Virginia (WV), employing concrete that included slag and Class F FA. Meanwhile, Chen et al. [4] developed an on-site heat of hydration measurement method using the measured temperature at the center of an insulated 1 m cube for different ambient conditions. However, using large specimens is complex and impractical for laboratory settings. In this paper, a smaller specimen size (0.5 m cube) is proposed as a more economical and practical alternative.
Predicting and controlling temperature rise from PC hydration is critical for mass concrete structures. Numerous empirical and analytical models have been developed to estimate heat evolution and the degree of hydration, which governs many concrete properties [7,8,9,10,11]. Parrot and Killoh [7] developed an empirical approach that was based on a single particle and accounted for the influence of the surface area, relative humidity, and water/cement (w/c) ratio on hydration. Kishi and Maekawa [8] proposed a model that can describe the hydration reactions taking place in PC in terms of the reactions of individual mineral components of PC. Swaddiwudhipong [9] established a multi-constituent model used to describe the hydration process of PC in the concrete mixture by combining Parrot and Killoh’s model and Kishi and Maekawa’s multi-component model with various improvements. Tomosawa [10,11] proposed a shrinking-core theory-based hydration model to estimate the heat evolution rate, considering factors like powder fineness and the w/c ratio in hydration kinetics.
Tomosawa’s model was subsequently refined by researchers such as Park et al. [12,13], Maruyama [14], and Narmluk et al. [15]. Park et al. developed a more comprehensive model considering the chemical composition of PC, w/c ratio, particle diameter, curing temperature, and an improved central particle hydration model. Wang and Lee [16] developed another model for describing PC + FA systems, which included a PC model [12,13] and a simplified model to describe the pozzolanic reaction of FA. The model that was developed in [16] to describe the pozzolanic reaction of FA is not chemically dependent, so it does not fully consider the chemical composition, amorphous contents, and/or reactivity of FA in the process of pozzolanic reaction. The pozzolanic reaction model in [16] was integrated with the hydration model of PC and adopted to predict the heat evolution, compressive strength, and carbonation depth during the hydration of PC in the presence of FA [17].
In this study, the integrated reaction models including the PC hydration model from Park et al. [12,13] and the pozzolanic reaction model for FA from Wang [16] are adopted. The integrated reaction model was reported to describe the hydration process of different PC-based materials in a series of studies [15,16,17,18,19]. The degree of hydration of PC and mineral admixtures were computed based on the production and consumption of the concrete’s calcium hydroxide (Ca(OH)2). A 0.5 m insulated cube developed in this study is described to measure the ATR of concrete. An integrated kinetic model with PC [12] and FA [17] was programmed during this study to describe the hydration behavior of PC + FA blended concrete. The ATR predicted by the kinetic model was found to be comparable to the ATR obtained from the 0.5 m cube’s semi-adiabatic measurement, and the results are verified by two additional calorimetry measurements.
This study extends previous ATR investigations [4,6] by introducing a smaller 0.5 m insulated cube that simplifies field measurements without compromising accuracy. Our team cross-checked the results against larger cubes and adiabatic calorimetry, while the smaller size facilitates handling and quicker thermal stabilization. The key design improvement that facilitates successful ATR measurements with the 0.5 m cube, which the previous study [4] did not achieve, will be explained in Section 3.1.
2. Design of 0.5 m Insulated Box
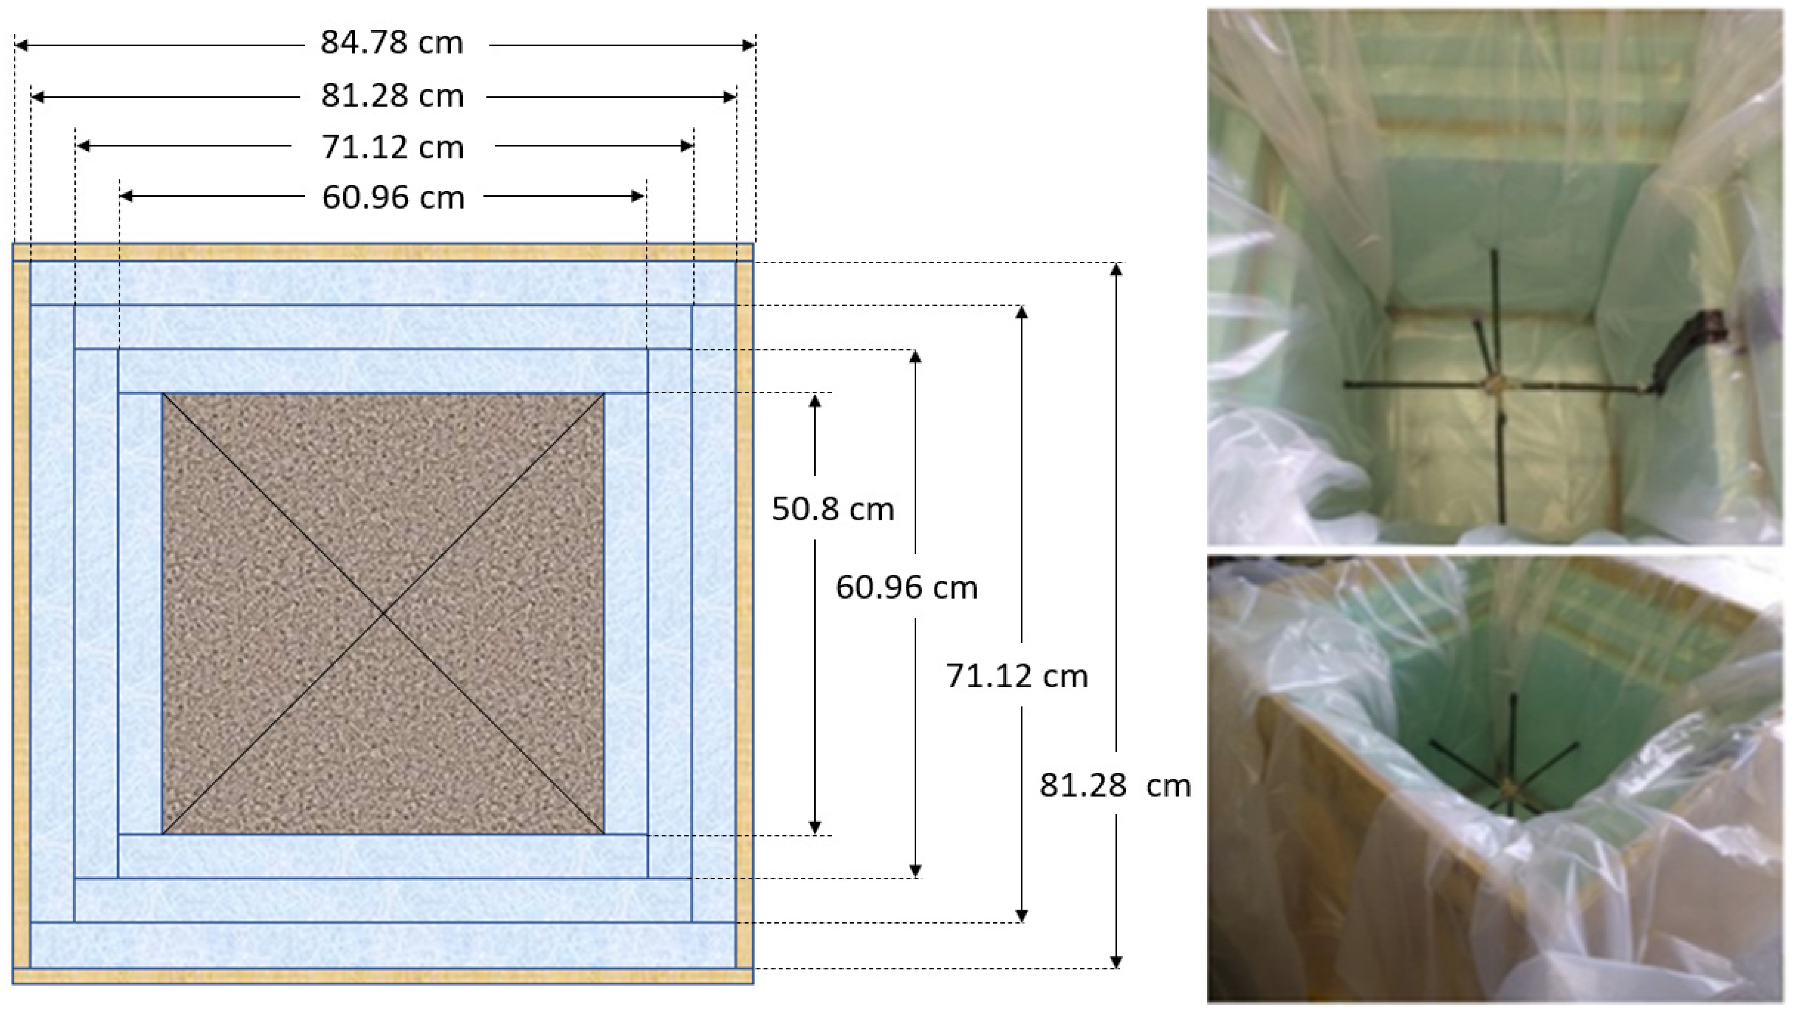
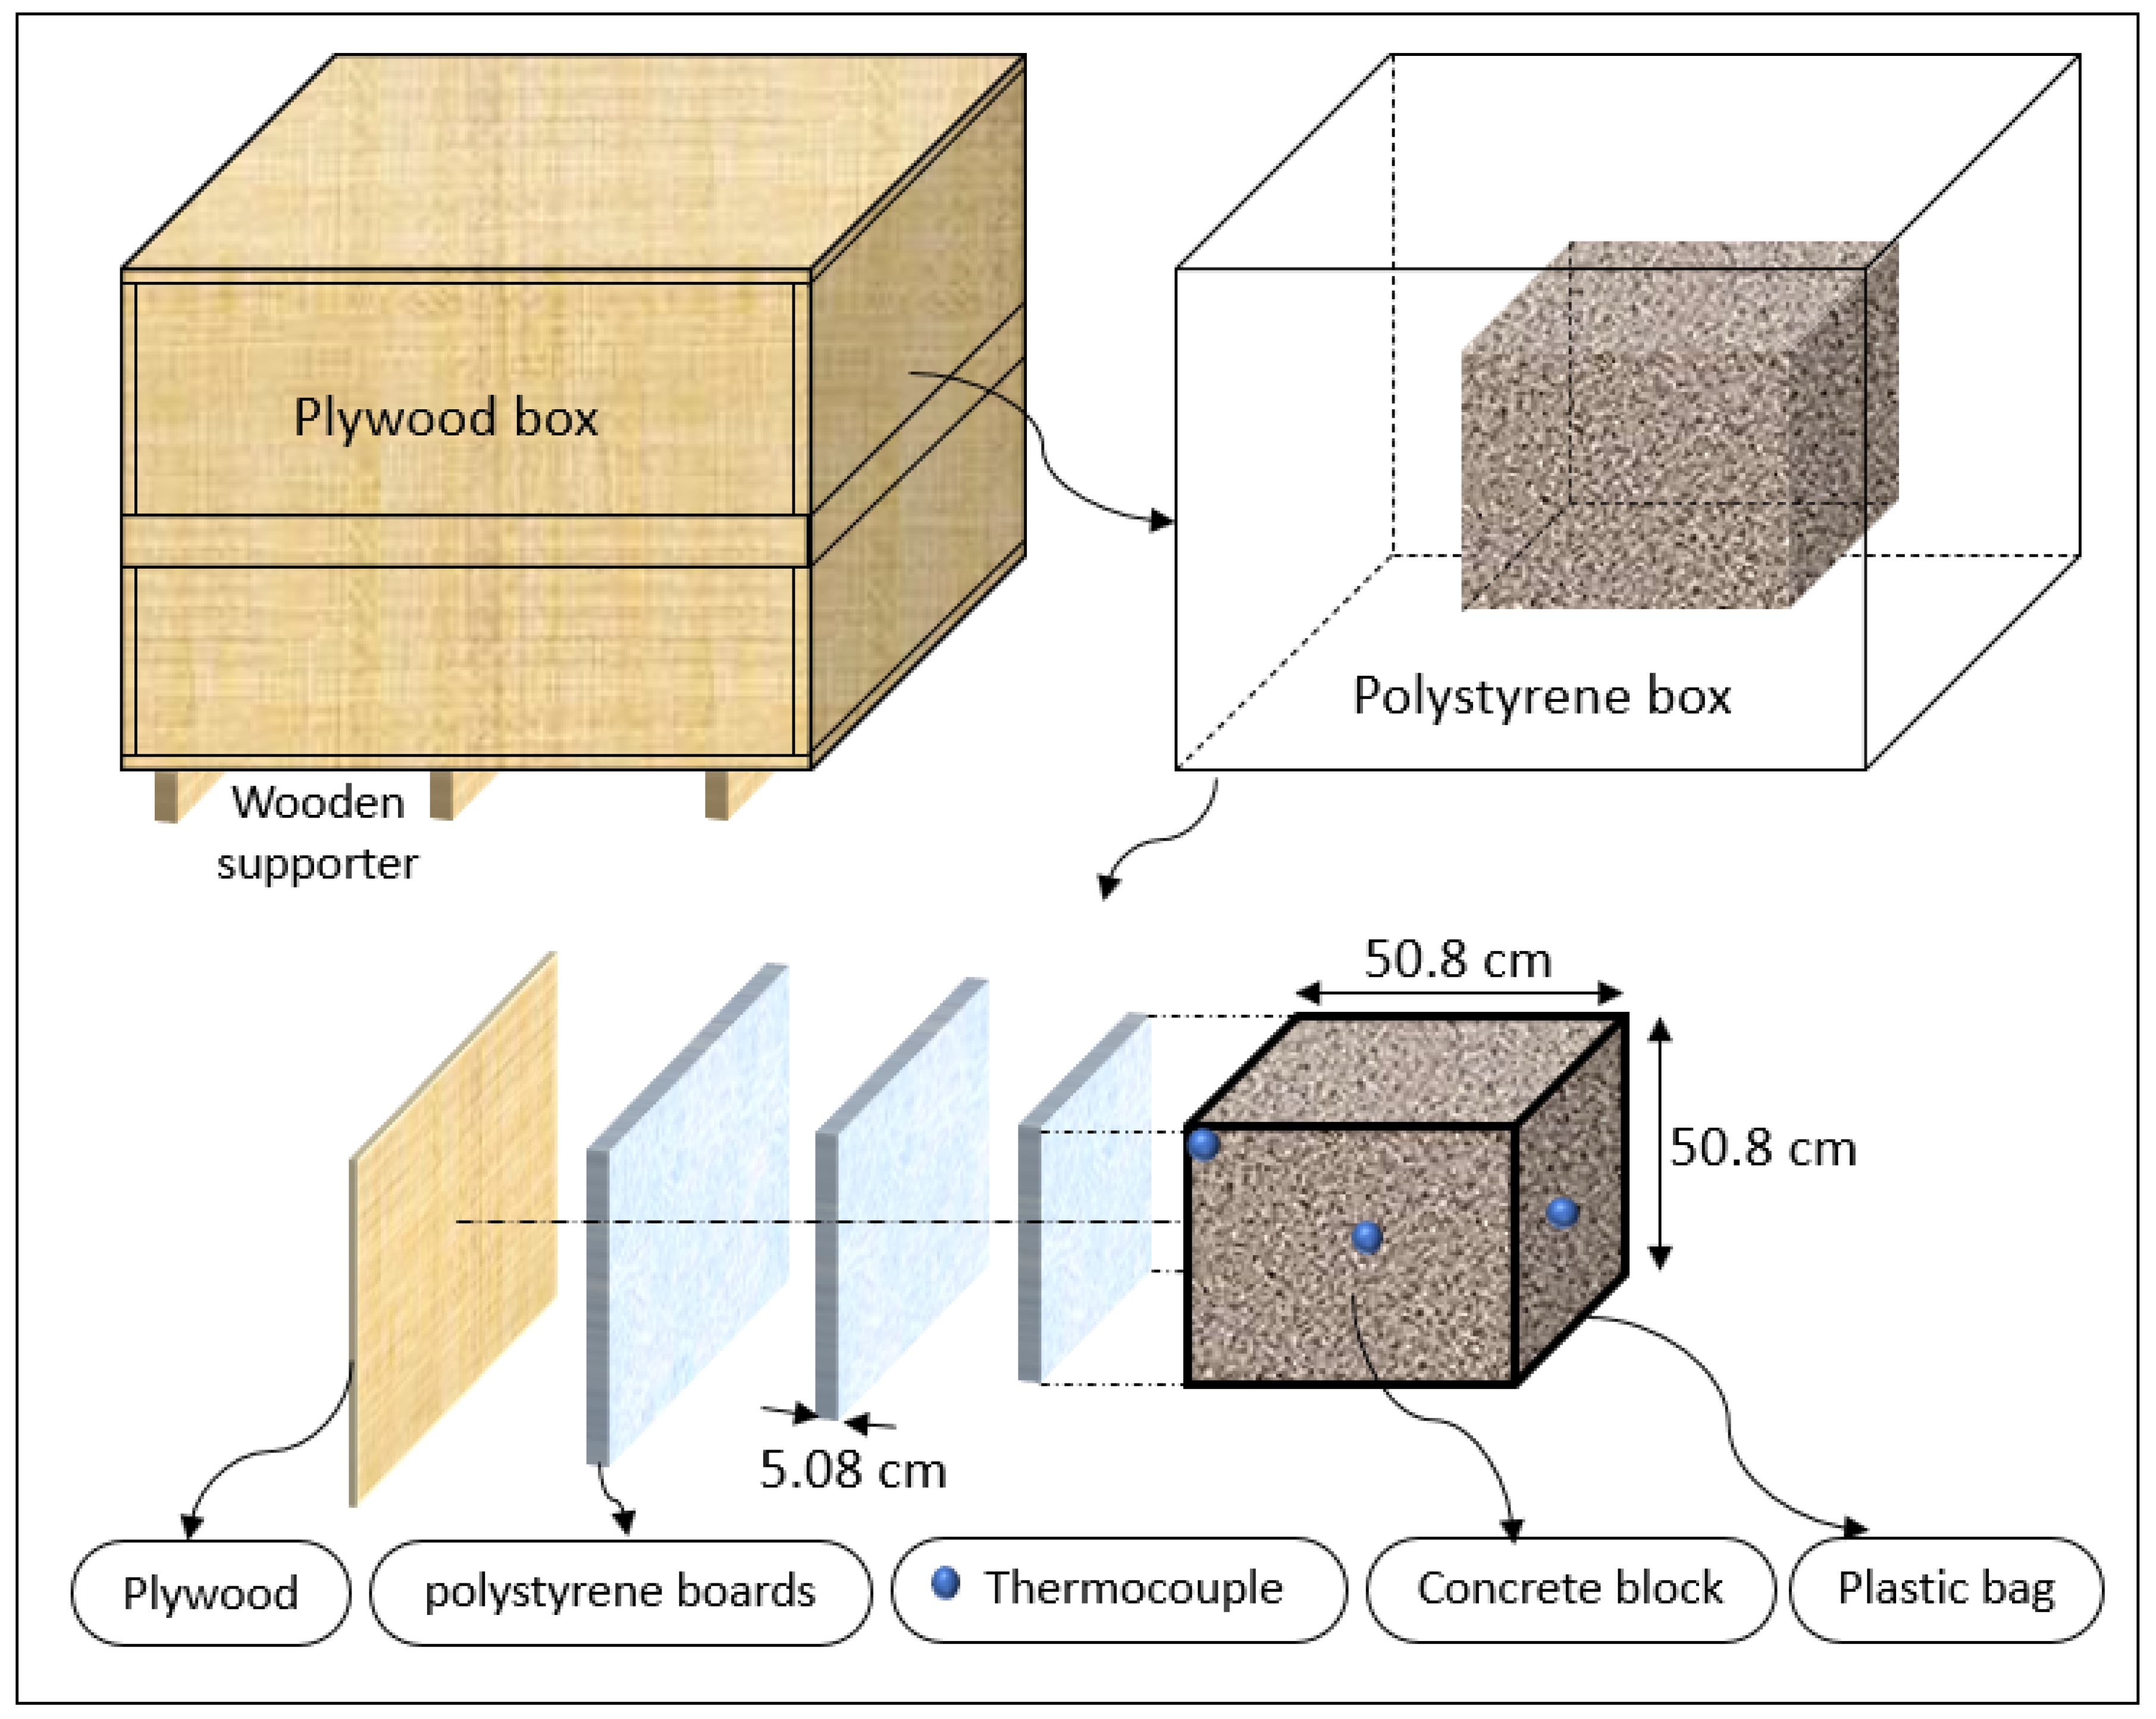
An insulated box was designed and fabricated to minimize the heat loss to the ambient environment. As shown in Figure 1, six plywood boards with a thickness of 1.75 cm (0.668 in) were used to create the formwork. The plywood boards were sealed with hot glue. Screws were added at each corner to prevent splitting. Three polystyrene foam boards with a thickness of 5.08 cm (2 in) at the top, bottom, and sides of the concrete were used to prevent heat loss. The inner layers were sealed with hot glue to prevent air gaps. The plywood construction was reinforced outside with 5.08 cm by 10.16 cm (2 inch by 4 inch) bracing. Three 5.08 cm by 10.16 cm (2 inch by 4 inch) wooden supporters were placed under the box to separate it from the ground. A double plastic wrap was applied to cover the concrete specimen after the casting. T-type thermocouples were placed at three locations (center, side face, and top corner) to measure the concrete’s temperature–time history. Another thermocouple was used to measure the ambient temperature. After the box was filled with concrete, the top surface of the concrete cube was leveled and covered with three layers of polystyrene foam boards. Then, the box was closed with a plywood cover. A schematic of the insulated box is shown in Figure 2.
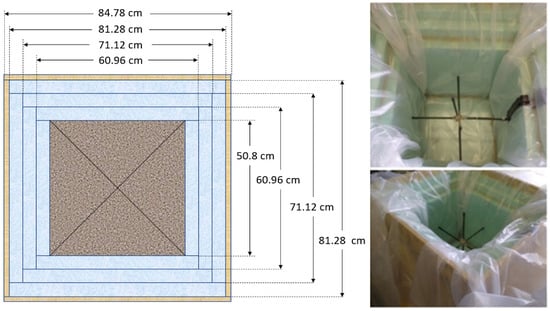
Figure 1.
Top view of the 0.5 m insulated box.
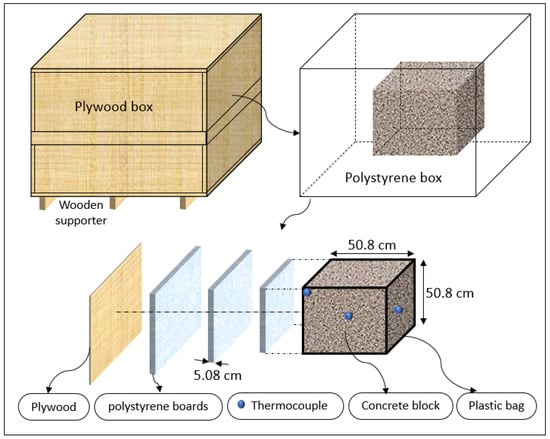
Figure 2.
The 0.5 m insulated box drawing details.
3. Analysis
3.1. Heat Loss Compensation
The method developed by Ng et al. [20] was applied to compensate the heat loss dissipated from the 1 m and 0.5 m insulated cubes. The cube size reduction from 1 m to 0.5 m slightly increases the potential for heat loss; however, this effect was minimized by the use of multilayer insulation and by applying a correction coefficient (λ) calibrated against the 1 m cube results. The relationship between the apparent ATR and the heat loss was expressed using the following Equation (1):
where TVol, Tini, Tad, HLoss, , and Cp represent the measured volumetric mean temperature, initial temperature, ATR, heat loss, density, and specific heat of the concrete, respectively.
Applying the heat conduction law (Fourier’s Law), the rate of the heat loss over time—determined using Equation (2)—between the cube and the surrounding temperature is proportional to the average thermal conductivity (k) multiplied by the temperature difference of (Tsurf—TAmb). Considering the heat conduction law through the insulating materials [4], the overall heat loss can be determined using the following relationship in Equation (3) [20]:
where Tsurf and TAmb denote the mean surface temperature of the concrete and the ambient temperature, respectively, while λ represents the heat loss characteristic coefficient of the system.
When sufficient insulation is provided, the spatial temperature profile, T(x, y, z), within the concrete volume becomes uniform, eliminating location dependence. This allows for significant simplification in the calculations, where TVol and Tsurf can be approximated as equal to the measured center temperature, Tc [4]. Hence,
It was observed that when concrete was cured at elevated temperatures due to its own heat of hydration, it matures more rapidly, and the heat production from hydration stabilizes, reaching a plateau. As a result, ∂Tad becomes approximately zero. Ng et al. [21] suggested that 120 h post-casting is sufficient to reach a constant adiabatic temperature based on several experiments. Chen et al. [4] assumed that the concrete’s heat generation can be negligible after 140 h for the mixes with the supplementary cementitious materials (SCMs) containing slag and fly ash. Therefore, in this study, the average heat loss characteristic coefficient can be obtained as follows [4]:
The λ coefficient was evaluated using temperature data after 140 h, when hydration reached a quasi-steady stage. At early ages, the temperature gradients within the cube remained small due to effective insulation, so the influence of λ on ATR estimation was assumed to be minimal. The heat loss characteristic coefficients (average value of λ) calculated within 140 to 200 h using Equation (6) prove to be a good compensation factor for gradual heat dissipation.
3.2. Reaction Kinetic Models
3.2.1. Kinetic Model of PC Hydration
Park et al. [12,13] presented a kinetics model for the hydration reaction of PC to simulate the temperature distribution inside the concrete structures. The reaction coefficient of the initial dormant period, kd, the effective diffusion coefficient of the water in the hydration product, De, and the coefficient of the reaction rate of the cement, kr, were considered in this model. These coefficients determine the rate of the mass transport through the initial shell layer, the rate of the chemical reaction process, and the rate of the diffusion-controlled process in the hydration of PC. In the model, PC particles are assumed to be spherical, and the surface is surrounded by the hydration product. External water diffuses through the surface of the hydration products and reacts with the unhydrated PC particles to form a new hydration product (C-S-H gel). The main hydration model for PC is shown in Equation (7).
where αc represent the reaction degree of PC; v represents the stoichiometric ratio by mass of water to PC; wg represents the amount of physically bound water in hydrated cement, which typically ranges from 0.15 to 0.19; and ρc is the density of the PC. The values of v and wg depend on the compound compositions of PC. In this study, fixed values of v = 0.25 and wg = 0.15 were assumed, as referenced in [17]. In Equation (8), Cwfree denotes the amount of capillary water at the exterior of hydration products, which is expressed as a function of hydration degree as follows:
where Wcap and W0 are the content of the capillary water in hydrating concrete and the content of water in the concrete mixture; the terms (v + wg) αc Pc and 0.25 αF PF are the mass of capillary water consumed by PC hydration and FA reaction, respectively; the value of (v + wg) = 0.4 represents the total chemically and physically bound water from PC hydration; the value of 0.25 represents the chemically bound water (=0.1 g/g FA) and gel water (=0.15 g/g FA), noting that it is assumed in Ref. [16] that 0.25 g free water is needed for total reaction of 1 g of FA; Pc and PF are the mass fractions of PC content and FA content in the mix proportion; and αc and αF are the degree of hydration of PC and the reaction degree of FA, respectively.
If an FA reaction (αF) is not included in the analysis, the term 0.25 αF PF in Equation (8) will be equal to zero. However, this term will be used when analyzing the interactions between PC and FA reactions. In Equation (7), the PC particles were assumed to be spherical with uniform sizes and an average radius of rc0 that can be obtained using the following equation [10]:
where BFc is the Blaine fineness (cm2/g) and ρc is the density of PC.
The term Sw/S0 in Equation (7) was first proposed by Navi and Pignat [22,23,24,25] to describes the decrease in the contact area between PC particles and ambient capillary. Sw is the effective contact surface area between the cement particles and capillary water. S0 is the total surface area when the hydration products develop unconstrained, S0 = 4πRc2. The surface of the PC particles has enough water at the start of the hydration process for hydration to continue. The PC particles gradually develop as the hydration progresses and the contact areas between free water and hydration products depend on the volumes of hydration products. As the contact area between PC particles and the surrounding water decreases, the hydration rate drops because of the growing interconnections among particles. This effect was incorporated by Park et al. [13] through the Sw/S0 term.
The effective surface area between the free water and PC particle is shown in Equations (10a)–(10c). Equation (10a) accounts for the hydration products surrounding individual PC particles that are not in contact with each other, while Equation (10b) considers the hydration products around the particles that are in contact with each other. As the particles grow further, (10c) would apply.
where Rc represents the radius of the PC particle, including the outer hydration products, and is expressed as a function of the degree of hydration, αc, and the rate of volume growth (the volume ratio between hydration products and the reacted PC), RVG. In Equation (11), the RVG was assumed to have a constant value of 2.0 [13].
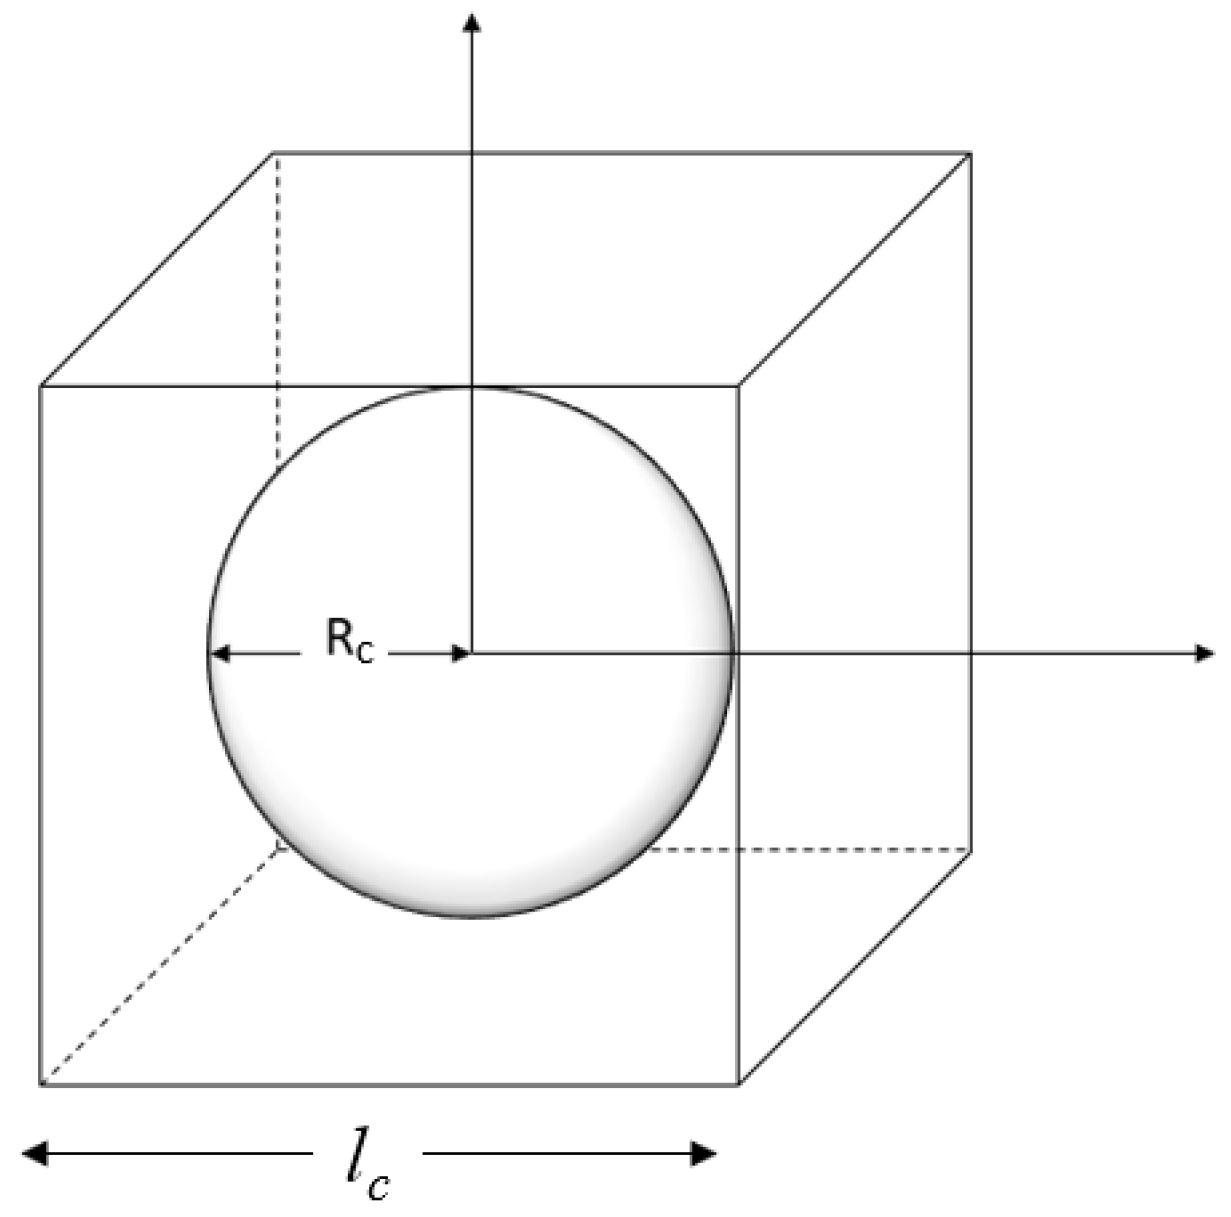
In this model, the PC paste is represented as spherical cement particles surrounded by water. Park et al. [12] modeled the PC paste as a unit cell consisting of the unhydrated PC grains, gel, and capillary pores. The particles are dispersed in the water without making contact with one another. As illustrated in Figure 3, the geometry of each particle and the surrounding water is formulated within a cubic unit cell, where the entire hydration process occurs. The length of the cube unit cell (lc), the average radius of a PC particle (rc0), the PC density, and the w/c ratio are related in Equation (12) as follows:
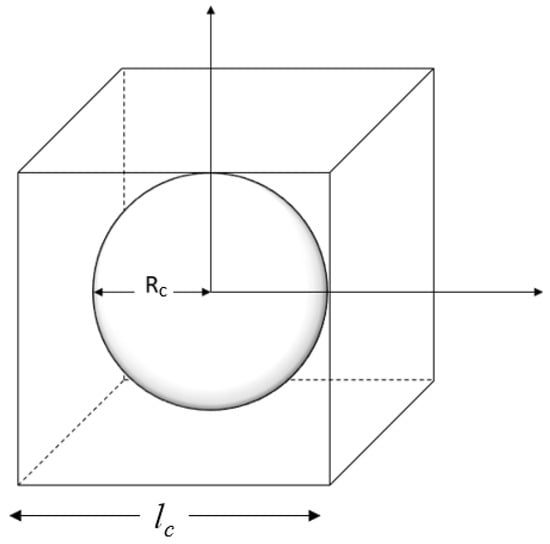
Figure 3.
The unit cell of a single cement particle.
As mentioned previously, the model is represented by a single equation with three coefficients (kd, De, and kr). The reaction coefficient, kd, describes the initial dormant period, during which an impermeable layer forms and subsequently breaks down. The hydration rate slows due to the formation of this layer but accelerates once the layer is disrupted. In this model, kd is assumed to be a function of the degree of hydration.
where B and C are the rates of formation and breakdown of the initial impermeable layer, respectively. The term De in Equation (7) denotes the rate of PC hydration during the diffusion-controlled phase and is expressed in terms of the degree of hydration, Equation (14), where De0 is the initial diffusion coefficient.
The effect of curing temperature on the reaction coefficients is modeled according to Arrhenius’s law, as outlined in Equation (15) [10].
where βB, βC, βDe and Er/R denote temperature sensitivity coefficients, while B20, C20, De20, and kr20 represent the respective values of B, C, De0, and kr at Tr = 20 °C (293 K). The four parameters (B20, C20, De20, and kr20) are related to the mineral components of PC [17]. Wang showed that the B20, C20, De20, and kr20 have a relationship with (C3S + C3A), C3S, C2S, and C3S, respectively [17]. These relationships are used in this study.
According to Park et al. [13] and Maruyama [14], the temperature sensitivity coefficients can be roughly regarded as constants for different PCs. Based on experimental data from various ATRs, Wang [17] proposed the following values: βB = βC = 1000, βDe = 7500, and Er/R = 5400. These values have been used in the analysis of this study.
3.2.2. FA Reaction Model
FA are silicate-based materials that react with Ca(OH)2 produced by the hydration of PC to form cementitious hydration products such as C-S-H and C-S-A-H [26]. Ca(OH)2 plays a major role in the reaction of low-calcium materials such as FA in PC + FA blended binder systems, as it will consume Ca(OH)2 to form additional C-S-H. The available amount of Ca(OH)2 directly affects the dissolution rate of FA; this phenomenon has been reported in the literature. Wang and Lee [16] revised the original shrinking-core model to determine the reaction of FA. Similarly to the PC hydration model, the FA reaction is expressed through a single equation involving three key coefficients (kdF, DeF, krF). In this analysis, both the PC hydration and FA reaction models are integrated to examine the interaction and overall reaction mechanism in PC + FA systems. The main FA reaction model is shown in Equation (17):
where represents the reaction degree of FA; PF is the mass of the FA in the mix proportion; is the density of FA; mCCH is the stoichiometric ratio of the mass of Ca(OH)2 to FA, and it can be calculated using Equation (19b); and rF0 is the radius of the FA particle. is the mass of the Ca(OH)2 in a unit volume of hydrating PC + FA blends and can be established as follows:
where the first term is for the hydration of PC and the second term is for the FA reaction; the terms (mPCH·Pc·αc) and (mCCH·PF·αF) in Equation (18) are the mass of Ca(OH)2 produced from PC hydration and the mass of Ca(OH)2 consumed by the FA reaction, respectively; and the two factors in Equation (18), mPCH and mCCH, are the produced mass of Ca(OH)2 from 1 g of hydrated PC and the consumed mass of Ca(OH)2 by 1 g of reacted FA, respectively, and they can be calculated as Equations (19a) and (19b).
Here, PC3S, PC2S, and PC4AF denote the weight fractions of the mineral phases C3S, C2S, and C4AF in PC, respectively; PFA is the mass fraction of fly ash in total cementitious materials. It is evident that the evolution of Ca(OH)2 mass in the system depends on these two factors (mPCH and mCCH). The values in Equation (19a) were calculated based on the known stoichiometry of PC chemical reactions, as proposed in the literature. Wang [27] derived Equation (19b) empirically by fitting Ca(OH)2 consumption data reported by Lam et al. [28], who studied cement–fly ash pastes across various water/binder ratios (0.19, 0.24, 0.30, and 0.50) and replacement levels (25%, 45%, and 55%). Lam et al.’s study is one of the few that provides both the degree of hydration and detailed Ca(OH)2 consumption at various ages. Based on these data, Wang estimated the mass of Ca(OH)2 consumed per one gram of reacted fly ash (mCCH), values equal to 0.67, 0.53, and 0.46 for 25%, 45%, and 55% replacement, respectively. These values were then regressed against the corresponding replacement ratios PFA = 0.25, 0.45, and 0.55, resulting in the linear form of Equation (19b).
As is well acknowledged, FA in blended PC reacts with Ca(OH)2, produced by the PC hydration reaction. Therefore, this study used the capillary water content calculated using Equation (8) and the Ca(OH)2 content calculated using Equation (18) in the hydrating system to consider the interactions between the reaction of PC and the reaction of FA.
To provide a chemically grounded alternative to Wang’s empirical model, this study developed a modified version of Equation (19b). The revised equation incorporates an expression based on the stoichiometric Ca(OH)2 consumption of reactive silica and alumina in FA:
The terms (SiO2)active and (Al2O3)active represent the active (reactive) fractions of silica and alumina in FA. Although these reactive components can be determined experimentally, this study estimated the reactive part of SiO2 and Al2O3 based on the literature [29]. The reactive fractions of SiO2 and Al2O3 were estimated assuming 50% amorphous content based on the literature values for Class F fly ash [29]. The constants 1.357 and 2.18 correspond to the molar ratios of Ca(OH)2 consumed per mole of reactive SiO2 and Al2O3, respectively, derived based on the pozzolanic reaction stoichiometry. For all the Class F fly ash used during this study, the amorphous value was assumed as 50% to calculate the weight fractions of (SiO2)active and (Al2O3)active. The intercept value (0.845) was retained from Wang’s original model, representing the Ca(OH)2 yield from full hydration of pure PC when there is no fly ash used. When Equation (19c) was applied, plotting mCCH versus PFA yielded a linear correlation similar to Wang’s [27] model, highlighting the improved predictive capability of the stoichiometric model, which now depends on the chemical composition of the fly ash.
Similarly to the PC hydration model, the reaction rate coefficient in the dormant period, kdF, the initial diffusion coefficient, DeF, the reaction rate coefficient, krF, and the influence of the temperature on the FA reaction are described using Arrhenius’s law, as shown in Equations (20), (21) and (22a)–(22d).
where the βBF = 6000 (K), βCF = 6000 (K), βDeF = 10,000 (K), and ErF/R = 10,000 (K) are temperature sensitivity coefficients and BF20, CF20, DeF20, and krF20 are the values of BF, CF, De0F, and krF at Tr = 20 °C (293 K).
3.2.3. Heat of Hydration
The heat from PC hydration and FA reaction can be obtained using the following Equation (23):
where Hc is ultimate heat of hydration of PC and can be calculated using Equation (24); H1, H2, H3, H4, H5, H6, and H7 are the maximum heats of hydration of the individual mineral compounds in PC (J/g); PC3S, PC2S, PC3A, PC4AF, PSO3, PfreeCaO, and PMgO are the mass proportions for each chemical compound (%) of PC (the maximum heats of hydration of major mineral compounds in PC used in this analysis are shown in Table 1); and HF is the ultimate heat of reaction of FA.

Table 1.
Maximum heat of hydration of mineral compound in PC (J/g).
Limited data is available for the ultimate heat of reaction of FA. Kichi and Maekawa [30] reported a value of 209.0 J/g for a specific FA with 8.8 wt.% of CaO. Han et al. [31] suggest a value of 285.0 J/g for their FA, obtained by analyzing the results for the heat of hydration of PC blended with FA. Waller [32] proposed values for heat of reactions for the FA from experimental measurements where five different FAs were tested with Ca(OH)2, and values of 522.0, 556.0, 569.0, 533.0, and 626.0 J/g were found (average = 560.0 J/g). Based on the thorough experiments carried out by [32], it appears that these results are the most reliable to be used for FA; hence, HF is assumed as 560.0 J/g.
The incremental temperature rise in one time step under adiabatic conditions can be determined between the ratio of the heat released and the specific heat (J/g °C) of SCMs as follows:
where the is the mass density, while Cp(t) is the specific heat capacity of the hydrating concrete, which typically varies based on the degree of hydration of the cementitious materials and the temperature of the concrete. Water has an exceptionally high specific heat. The binding of water in hydration products reduces the specific heat of composite concrete [2,4,33,34]. In this study, the specific heat capacity of hydrating concrete can be calculated as the sum of the individual component of concrete as follows:
where Wc, WF, WS, WA, and WW are the mass of PC, FA, sand, coarse aggregate, and water per unit volume of concrete (kg/m3). The specific heat of PC, FA, sand, coarse aggregate, chemically bound water, and water (Cc, CF, CS, CA, Ccbm, and CW) were assumed to be 740, 720, 710, 840, 2200, and 4184 (J/kg K), respectively.
The Wcbm in Equation (26) is the chemically bound water and can be determined using Equation (27). In the reaction of FA, the chemically bound water, gel water, and consumed Ca(OH)2 per 1 g reacted FA were assumed to be 0.10 g, 0.15 g, 1.00 g, respectively [35]. Therefore, the mass of chemically bound water in the reaction of FA is 0.1 g/g FA, and 0.25 g/g can be used to obtain the mass of chemically bound water in the cement reaction. As shown in Equation (27), both PC hydration and FA reaction contribute to chemically bound water.
The adiabatic temperature can be calculated with Equation (28):
The hydration model calculations were verified with experimental results conducted by Chen et al. [4]. An ordinary PC (D-4) mix and a 30% fly ash (D-10) mix were chosen from [4] to compare with the kinetic model described above. The concrete’s placement temperatures were 24 °C and 27 °C, respectively. The chemical compositions of the D-4 and D-10 concrete mixes are provided in Table 2. The calculated Bogue compositions (mass fractions) for PC (D-10) are C3S, C2S, C3A, and C4AF are 57.63%, 14.41%, 7.68%, and 10.59%, respectively. Control coefficients for the hydration model are calculated based on the mass fractions of the major clinker phases of PC and given in Table 3. The calibrated control coefficients of the FA reaction model used in this study were adopted from [17] as a reference. The model was then calibrated using the experimental data of the available FAs, where similar coefficients (except DeF20) were obtained (Table 4). The mix designs and the measured properties of the D-4 and D-10 concrete mixes are given in Table 5 and Table 6, respectively. The FA reaction model was calibrated using isothermal heat data from a 70% PC + 30% FA mix (w/b = 0.5, cured at 23 °C), prepared using the same PC and FA materials for both the D-10 case and the case of this study. The ATR tests were conducted using different mix proportions: 70% PC + 30% FA for D-10 and 67% PC + 33% FA for this study. However, the isothermal calibration mix was identical in both cases. As a result, the same DeF20 value was obtained for both cases. This consistency confirms that when the same materials and curing conditions are used in the isothermal test, the calibrated DeF20 remains valid across different mix proportions used in subsequent ATR analyses.

Table 2.
Chemical composition of D-4 and D-10 adopted from [4].

Table 3.
Control coefficients for the hydration model calculated using Equations (16a)–(16d).

Table 4.
Model coefficient of FAs reaction.

Table 5.
Concrete mix design.

Table 6.
Measured properties of concrete mixes.
It should be noted that the kinetic coefficients (kdF, DeF, krF) adopted from the literature may vary depending on the reactivity of individual fly ashes. Variations in amorphous content and fineness can influence diffusion and reaction rates. Based on comparisons with multiple published datasets, the uncertainty associated with parameter transferability is estimated to be within ±5–10%, which is acceptable for practical ATR prediction accuracy.
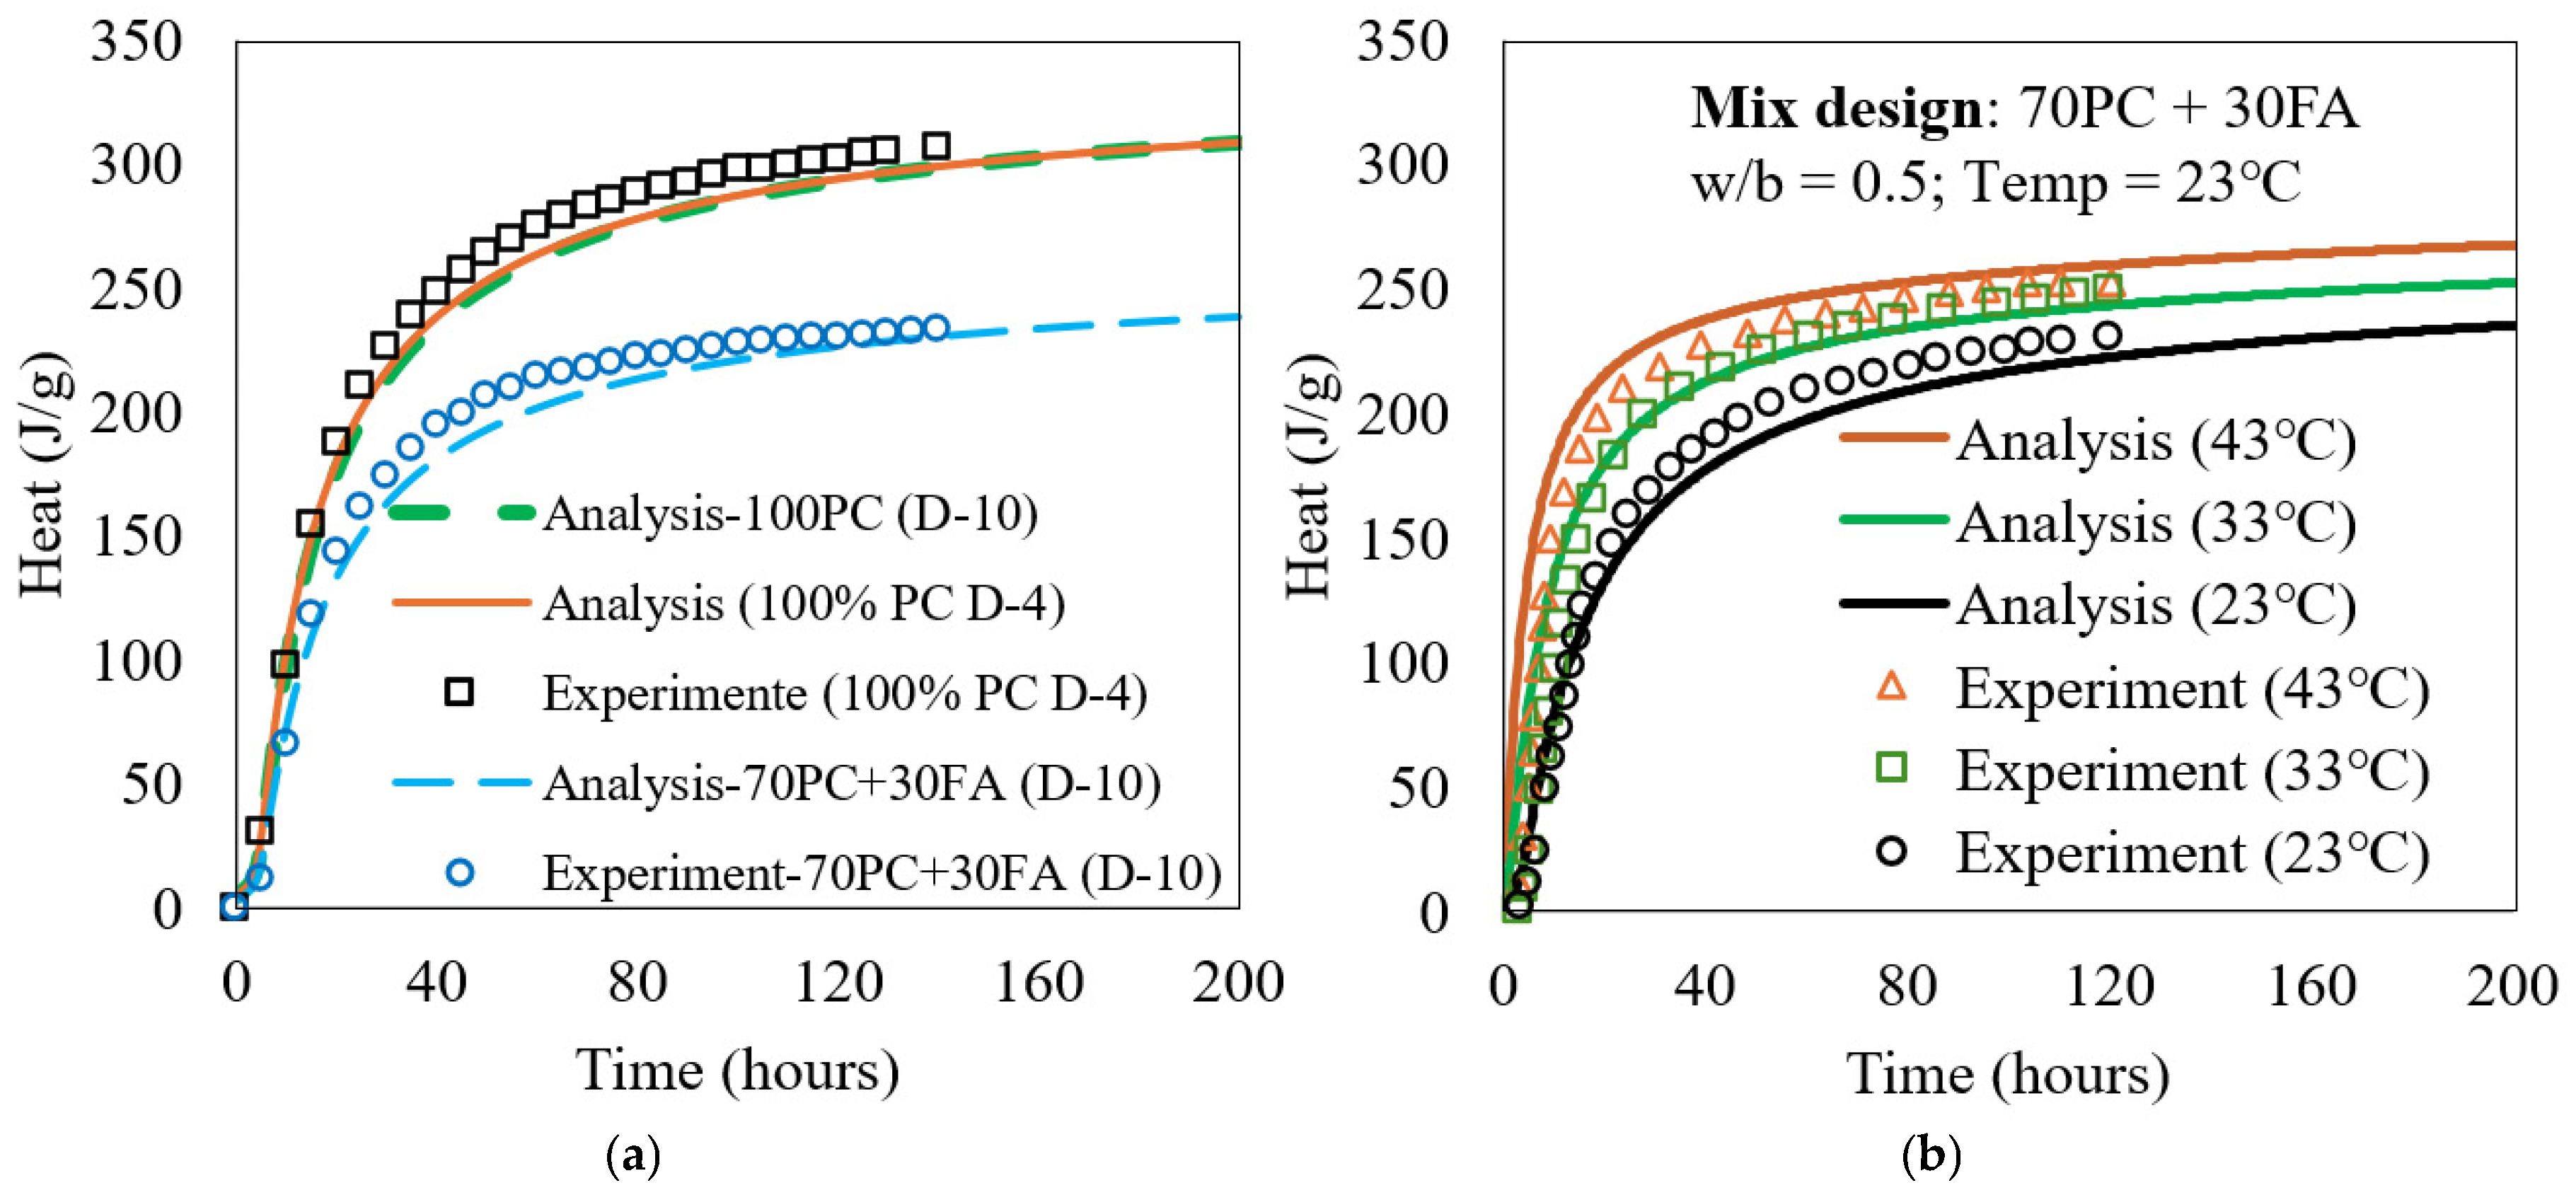
The kinetic model was programmed using MATLAB R2018a (MathWorks, Natick, MA, USA), with a time step of 0.2 h. Prior to simulating the ATR behavior of both the PC (D-4) and PC + FA (D-10) mixes, the isothermal heat of hydration was calculated using the model. The reaction of FA was determined using Equation (23). Constant FA parameters were established by calibrating the model against experimental isothermal hydration heat results. For each FA, one mixture was used for calibration, as shown in Figure 4. These parameters remained constant regardless of FA/PC replacement level, w/b ratio, or temperature. In Equation (24), a fixed value of 1.0% was assumed for for all the PC, and the heat contribution from PMgO was considered negligible heat contribution during the first seven days.
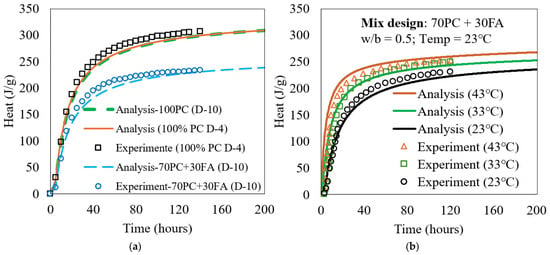
Figure 4.
Calculated and measured heat in isothermal condition for (a) D-4 and D-10 mixes and (b) PC + FA mix used in this study.
A reasonably good agreement between the model predictions and experimental results was obtained, as shown in Figure 4a, enabling ATR simulations of these mixes. This experimental testing was conducted using the TAM Air isothermal calorimeter (TA Instruments), following ASTM C1679 standard procedures. This instrument, equipped with eight parallel twin measurement channels, was used to investigate the hydration kinetics. For comparison, the heat of hydration of 100% PC in the D-10 mix was also calculated and included in Figure 4a, alongside that of the D-4 mix. Although D-10 and D-4 differ in chemical and physical properties and were both cured at 23 °C, they exhibited nearly identical heat evolution behavior under their respective conditions.
Additionally, experimental heat of hydration was measured for the 70% PC + 30% FA mix of this study at different curing temperatures (23 °C, 33 °C, and 43 °C) under isothermal conditions. The corresponding model-predicted heats of hydration were also calculated and presented in Figure 4b.
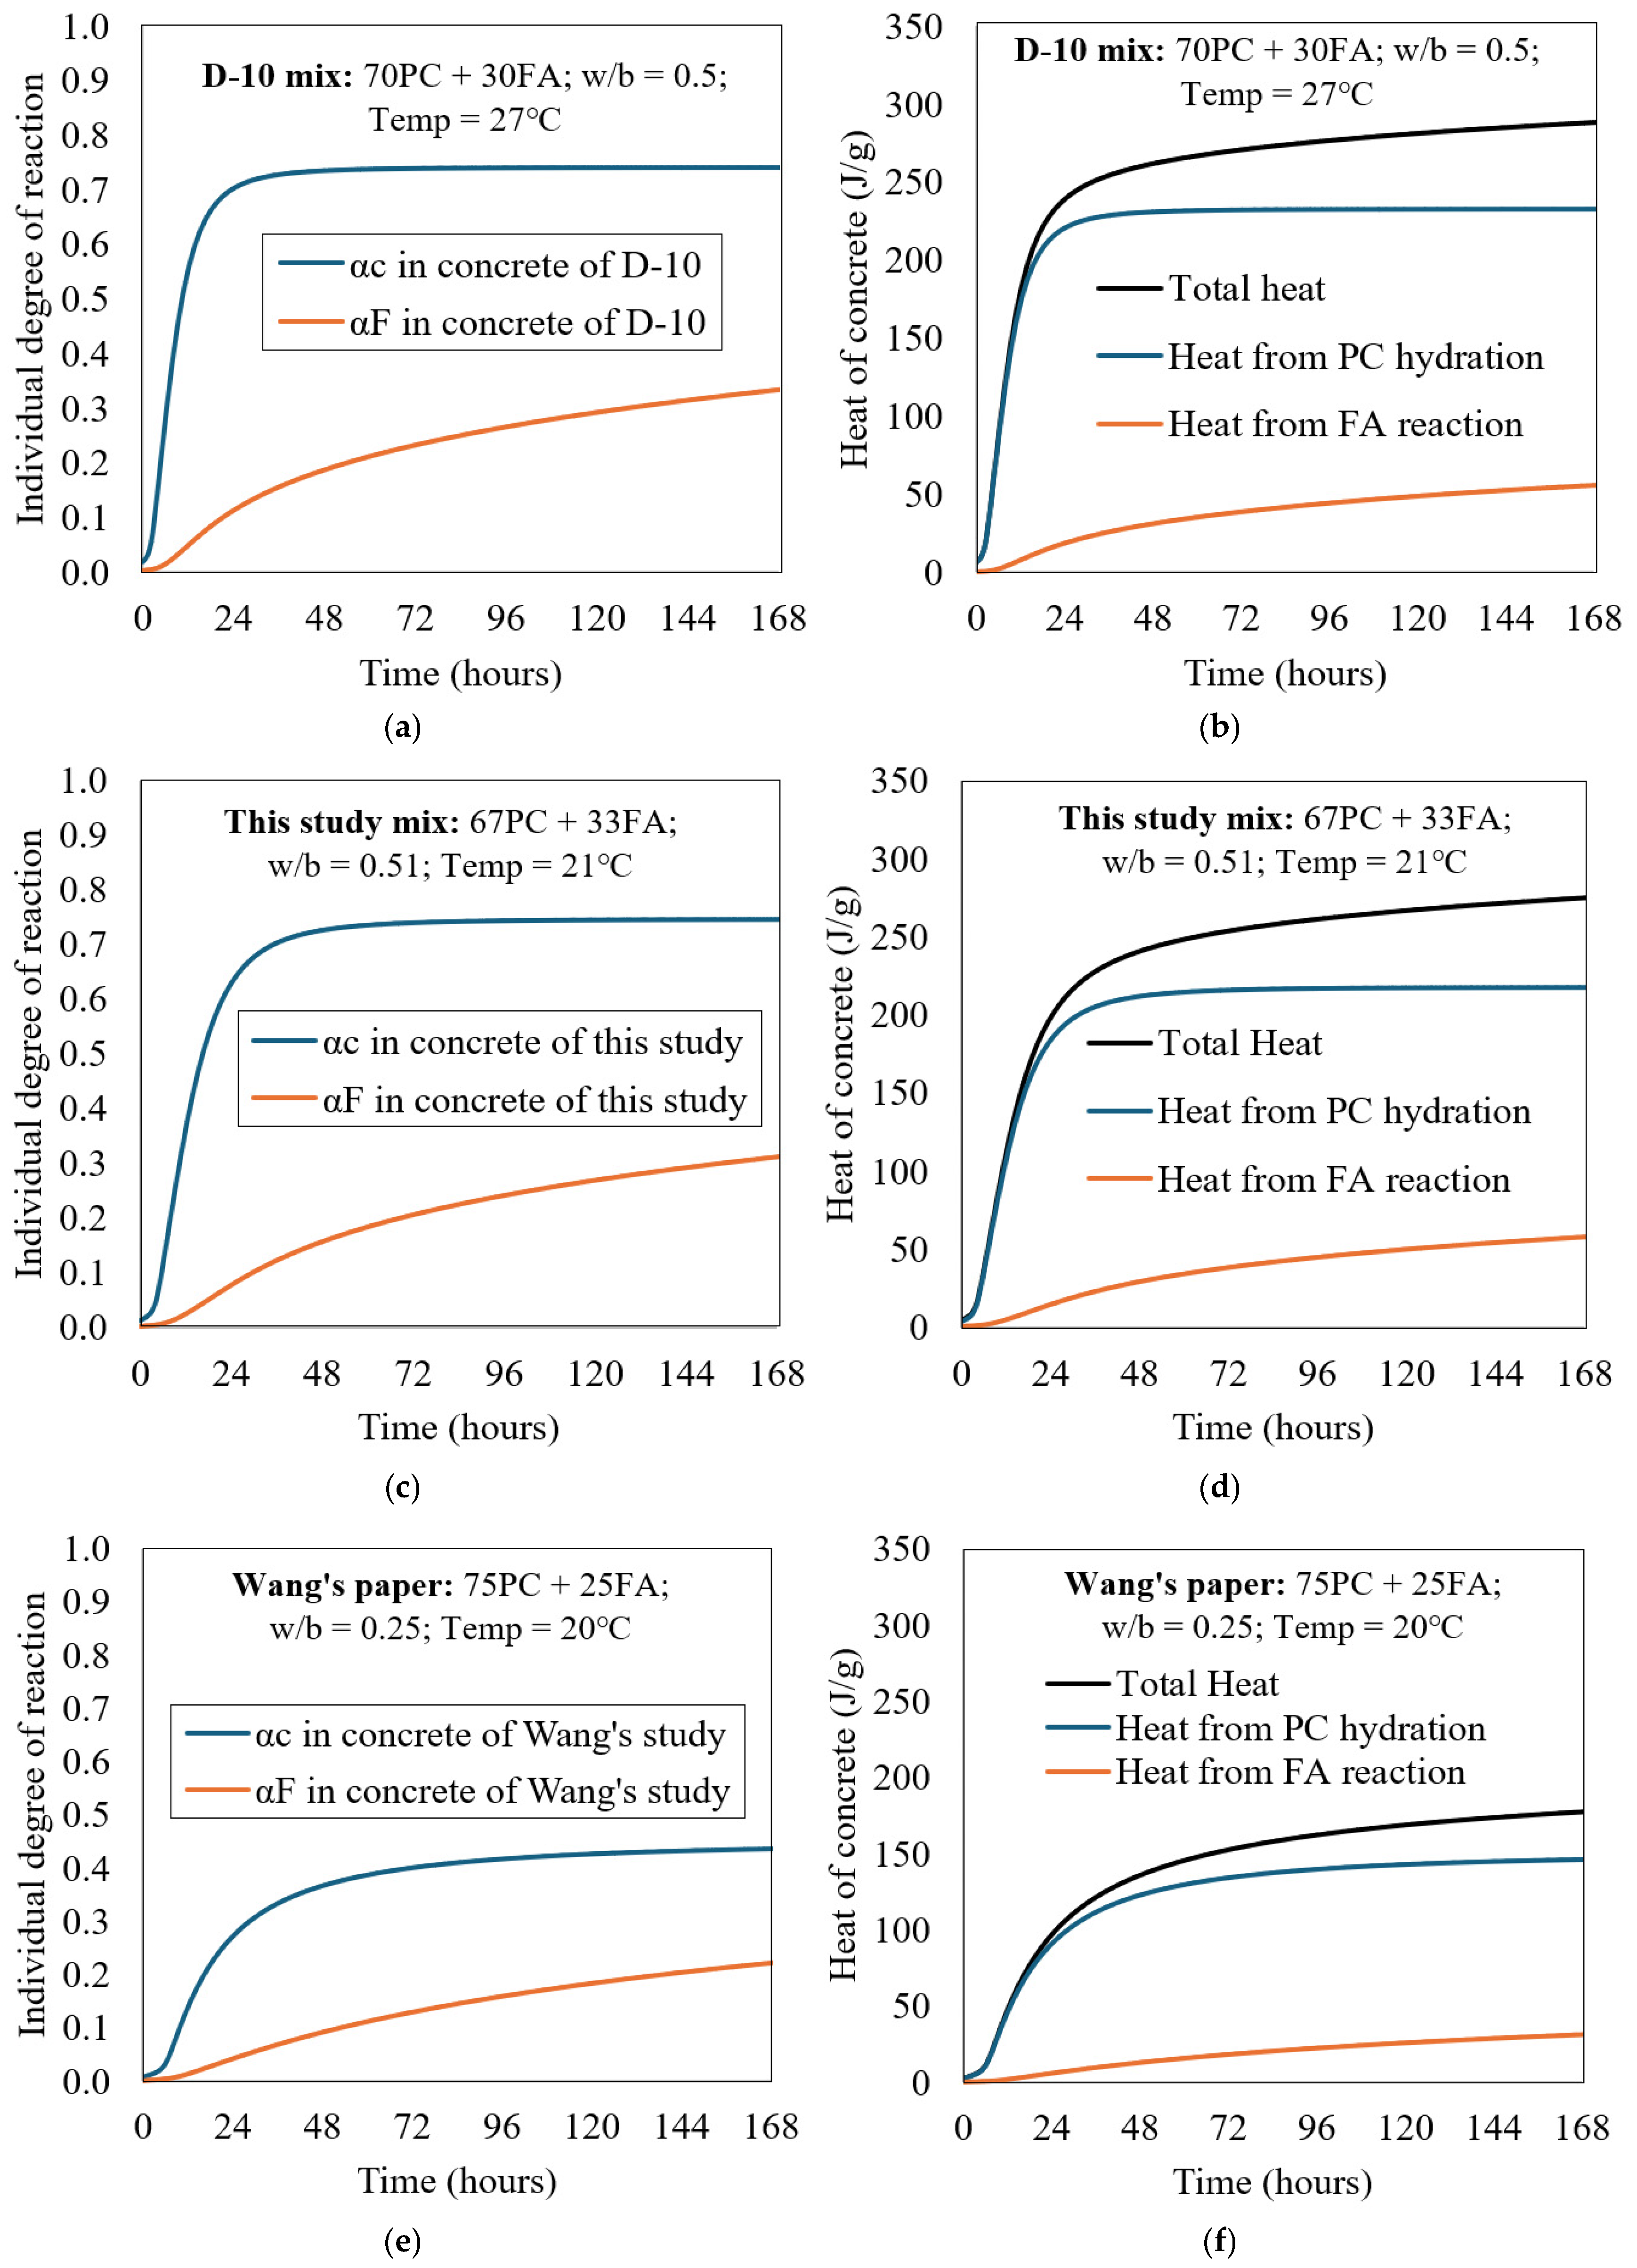
Figure 5a shows a parameter study of PC + FA concrete for the D-10 mix (30 wt.% FA) in adiabatic conditions. The individual reaction degrees of PC and FA concretes are shown in Figure 5a. Based on these individual reaction degrees, the heat contributions from PC hydration and FA reaction were calculated. Figure 5b shows the respective heat contributions, where their sum represents the total heat of hydration. As expected, the heat released from PC hydration is significantly higher than that of the FA reaction. The heat contributions from the FA reaction reached about 50.0 J/g after 7 days (about 21% of the total heat), which reflects the slow short-term pozzolanic reaction of FA, constituting 30% of the total cementitious materials.
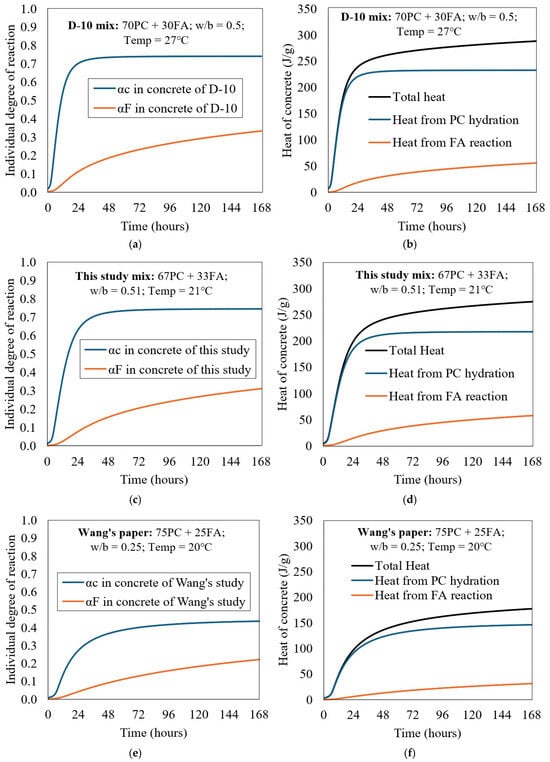
Figure 5.
Parametric analysis of PC + FA concrete of D-10 mix in adiabatic condition: (a,c,e) individual degree of reaction, and (b,d,f) heat contribution of each component.
It is observed that the degree of reaction of FA in D-10 is slightly higher than that reported for FA in this study mix shown in Figure 5c,d. Similarly, the degree of hydration of cement in D-10 proceeds slightly faster, particularly within the first 24 h, which can be attributed to the higher curing temperature (27 °C for D-10 versus 21 °C in this study mix). When applying Equation (24), it becomes evident that the chemical composition of the cement also influences the total heat of hydration: D-10 generates 288.4 J/g at 168 h, compared to 275.2 J/g for the cement used in the present study mix. Furthermore, the calculated maximum heat of hydration of cement (HC) using Equation (24) yielded values of 448.0 J/g for the PC in D-10 and 435.0 J/g for the PC in the present study mix.
For comparison, Figure 5e includes the individual reaction degrees of PC and FA based on a mix reported in Wang’s study [17], in which the mix design comprised 75% PC and 25% FA, cured at a temperature of 20 °C. Notably, the water/binder (w/b) ratio used in Wang’s mix was very low (0.25), which significantly influenced the reaction kinetics. As a result, the reaction degrees of both PC and FA, as well as the total heat evolution, were much lower than those observed in the D-10 mix and in the current study mix. The heat generated at 168 h in Wang’s mix was 177.4 J/g, while the calculated maximum heat of hydration of cement (HC), based on Equation (24), was 447.6 J/g. The analysis of all three mixes is presented together in Figure 5 to highlight the influence of curing conditions and mix design parameters.
The lower ATR observed in [17] is attributed to the reduced internal moisture availability in low w/b mixes (0.25). Insufficient capillary water limits the diffusion of ions and restricts the hydration of both PC and FA, resulting in slower reaction rates and lower total heat evolution compared to mixes with moderate w/b ratios.
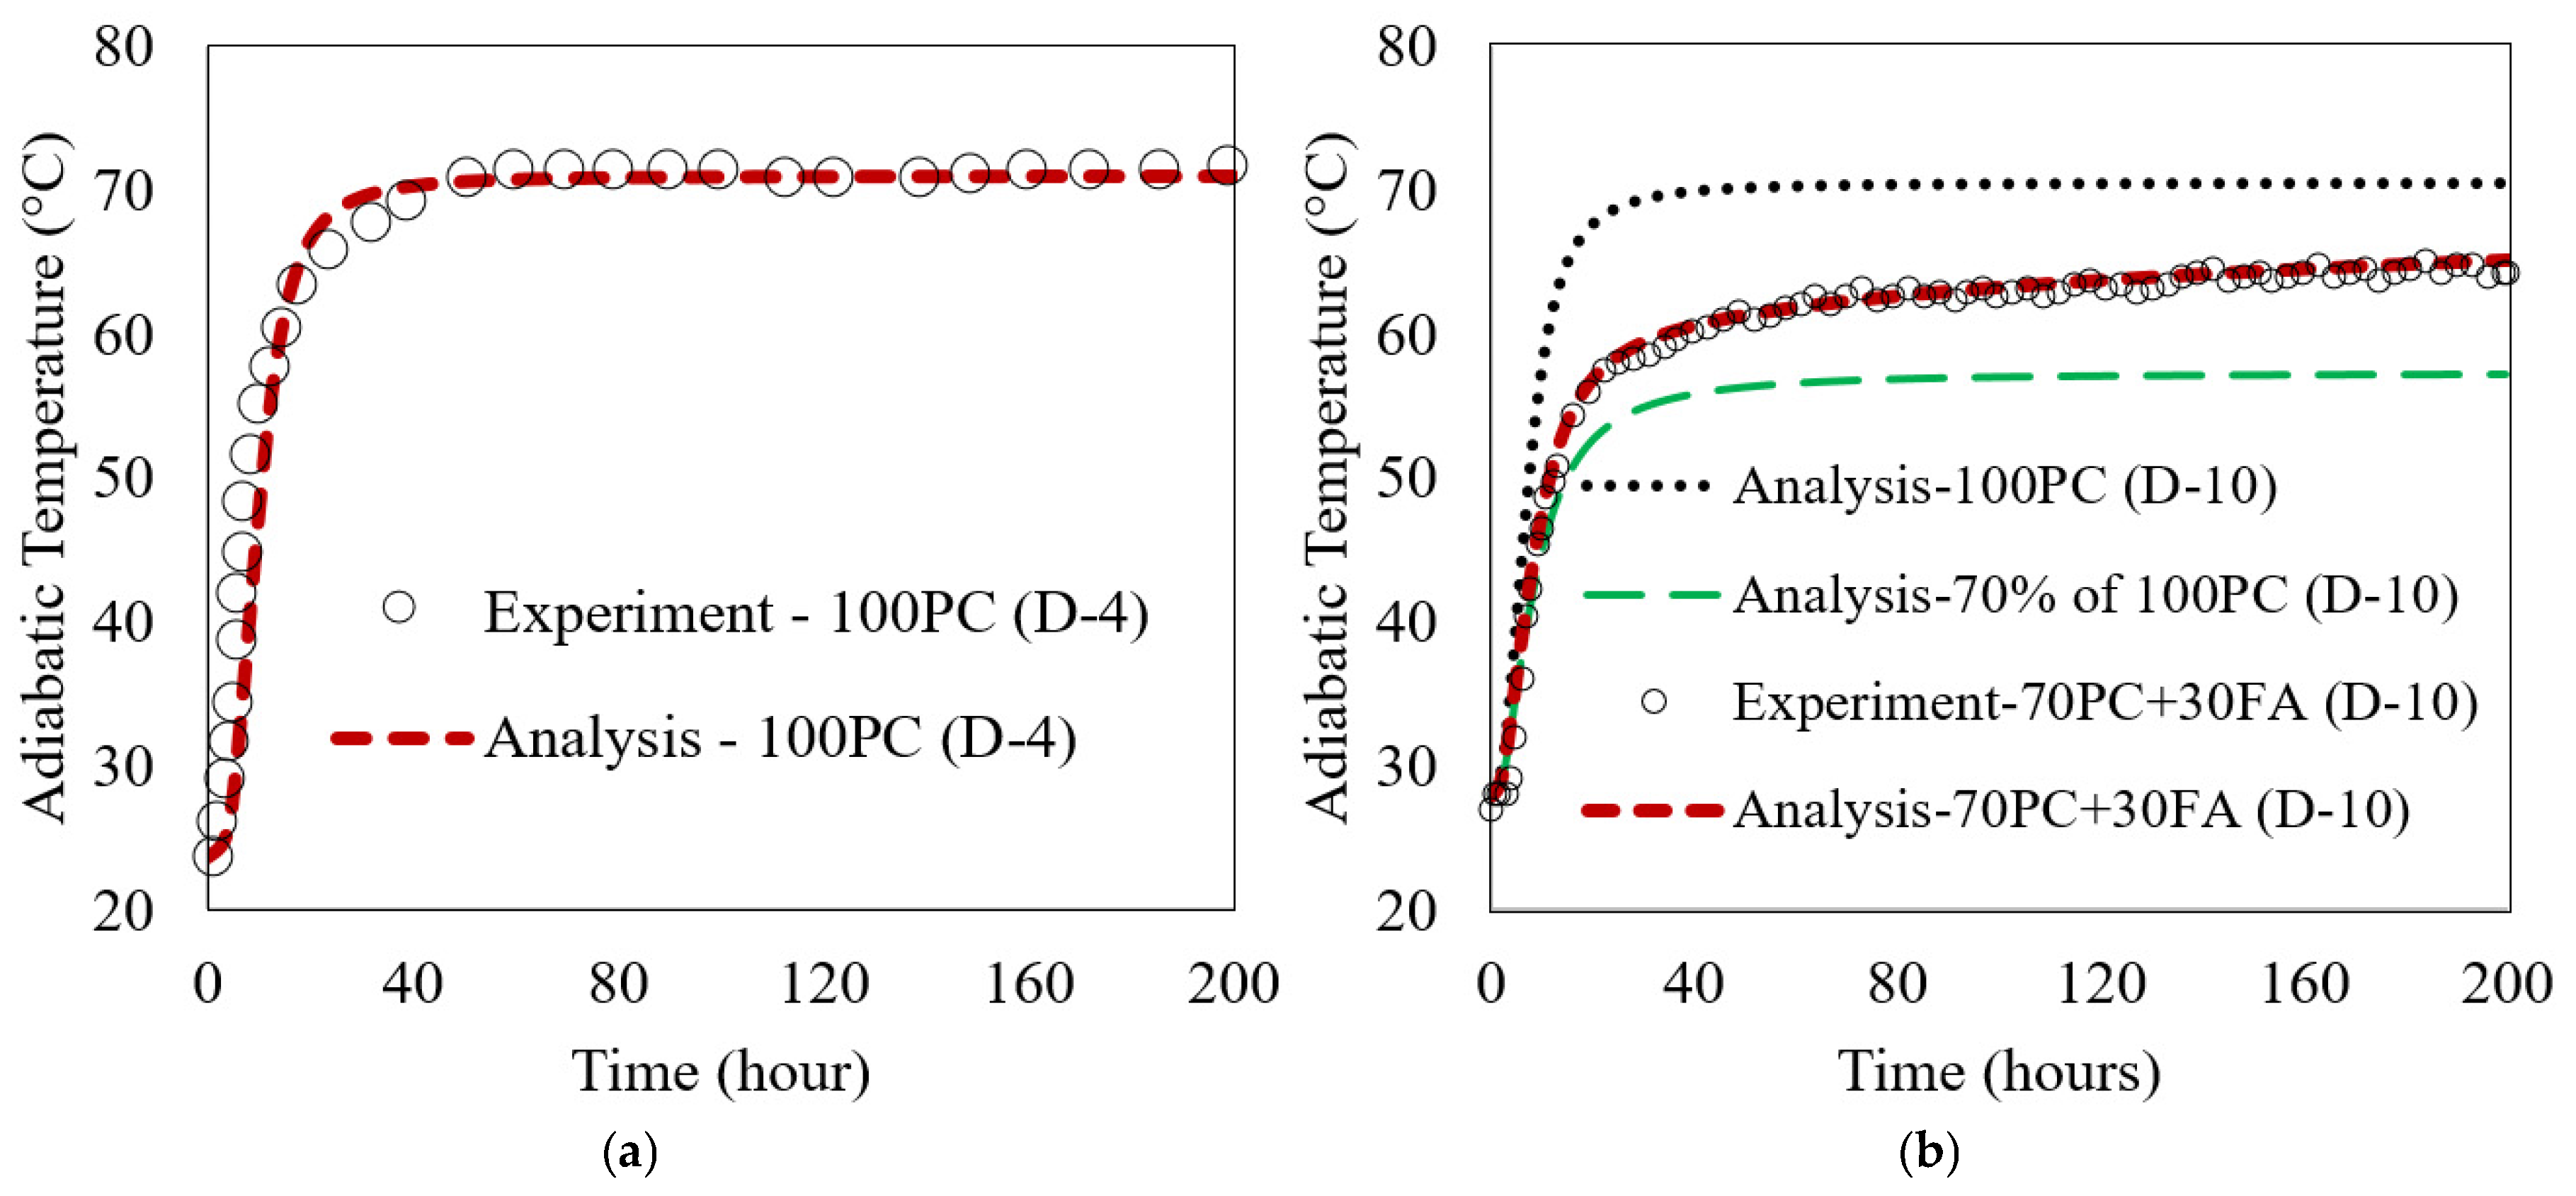
The analytical and experimental results are compared in Figure 6. The results demonstrate a close alignment between the model’s predictions and experimental observations. Figure 6a shows the comparison between analytical and experimental results for the 100% PC (D-4) case, and Figure 6b shows the results for the 70% PC + 30% FA (D-10) case. Besides the analytical and test data for the 70PC + 30FA case in Figure 6b, the analytical results for 100PC (100% PC—no FA) for D-10 PC, along with 70% of that 100PC, are plotted to explain FA contribution in the ATR. The analysis results in Figure 6b show that without FA (100PC case), the ATR reached 70.5 °C. With 30 wt.% FA replacement, the ATR of 70PC + 30FA case decreased to 65.1 °C. The ATR of the 70% of 100PC is 57.5 °C at 200 h. The contribution of FA can be explained by the 7.6 °C difference between the curves of 30% FA and 70% of 100PC. In general, replacing 30 wt.% of the PC with FA decreased the ATR to approximately 8% of the D-10 100PC mix (without FA), which is a positive result. The close match between the model predictions and experimental data supports the reliability of the multi-scale model. This suggests that the model is capable of simulating the ATR for both ordinary PC and FA mixes with reasonable accuracy.
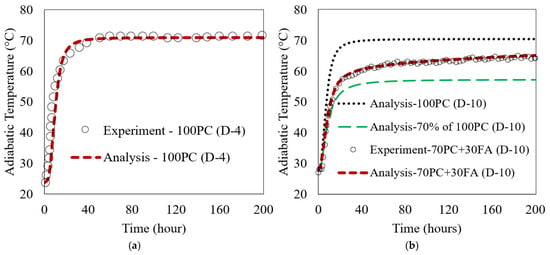
Figure 6.
Comparison of experimental and simulated ATR for concrete mixes: (a) PC (D-4) and (b) with 30 wt.% FA (D-10).
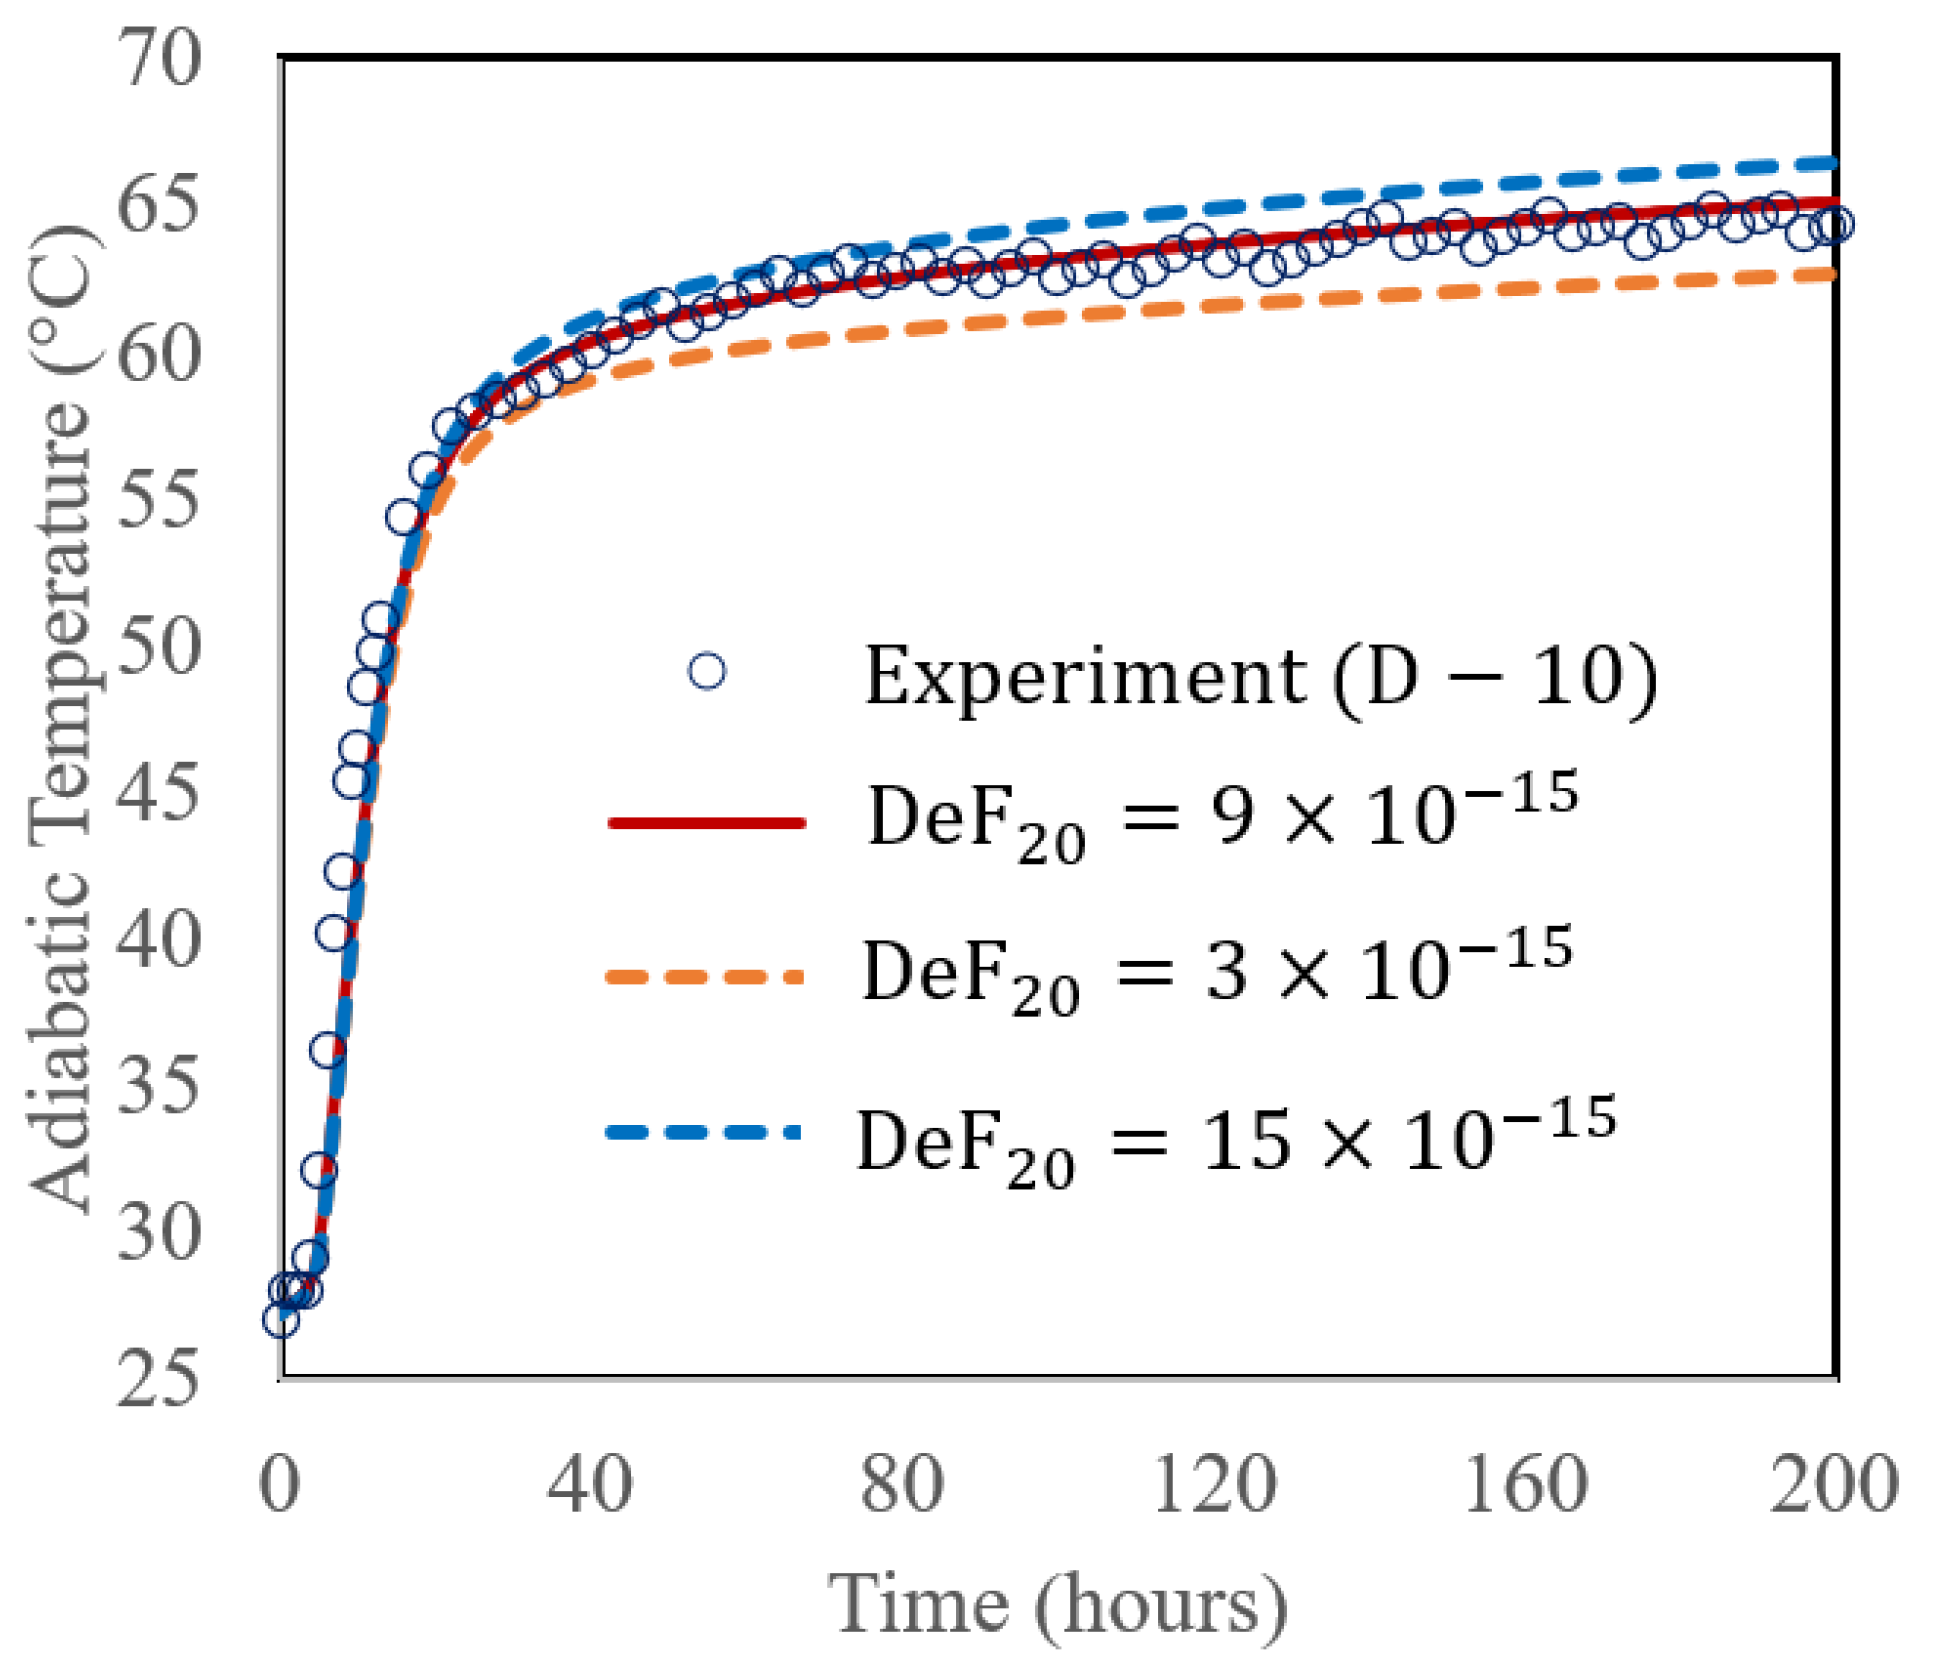
A sensitivity analysis of the proposed method was performed by varying the DeF20 with three different values (3 × 10⁻¹⁵, 9 × 10⁻¹⁵, and 15 × 10−15 cm2/h), and comparing with the experimental data of the D-10 mix (70% PC + 30% FA) with a w/b ratio of 0.496 and cured at 27 °C, shown in Figure 6b. The results in Figure 7 display the adiabatic temperature rise (ATR). As shown in the figure, varying DeF20 affected the ATR. At 200 h, the corresponding ATR values were 62.6 °C, 65.1 °C, and 66.5 °C for those different DeF20 values, respectively. In this simulation, DeF20 was the only parameter altered, while all other input parameters remained constant (as shown in Table 4). This demonstrates that DeF20 has a significant influence on the fly ash reaction rate. As its value increases, the reaction accelerates, leading to a higher heat release and a greater temperature rise. It is reasonable to see a benefit for future application; when simulating the ATR of a PC + FA mix is of interest with a typical Class F fly ash where the chemical composition of the fly ash is similar to those used in the cases of D-10 and this study, DeF20 can be assumed a constant of 9 × 10⁻¹⁵ cm2/h.
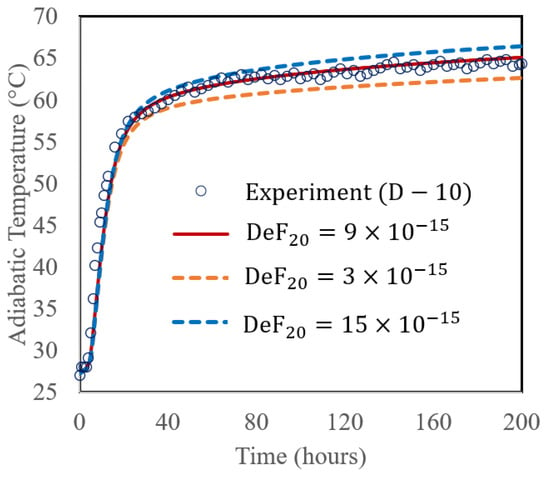
Figure 7.
Calculated ATR with varying DeF20 value (3 × 10⁻¹⁵, 9 × 10⁻¹⁵, and 15 × 10−15 cm2/h).
4. Concrete Cube Experiments
During the experiments, both 0.5 m and 1 m insulated cubes were prepared. The 1.0 m insulated cube was constructed following the design developed by Chen et al. [4]. The cube consisted of steel formwork lined with 0.1 m thick rigid foam insulation on all sides to minimize heat loss. One thermocouple was embedded at the cube center to measure the internal temperature rise, while another sensor was positioned nearby in a shaded area to monitor ambient temperature. This large cube served as a benchmark to validate the temperature results and heat-loss correction of the smaller 0.5 m cube. In the 0.5 m cubes, three thermocouples were embedded, and another thermocouple was used to measure the ambient temperature. The 1 m insulated cube was prepared following Chen et al.’s design, with one temperature logger installed at the center of the concrete to measure the temperature–time history and another logger installed in a shaded area close to the cube to measure the ambient temperature [4]. Besides the temperature measurements of the insulated cubes, an adiabatic calorimeter developed by Lin and Chen [2] was also used to measure the ATR.
A concrete batch containing 33 wt.% FA was delivered by a concrete truck, and the mix design and the measured properties of the concrete are given in Table 5 and Table 6, respectively, shown as FAC-2 batch (33 wt.% FA). The water/binder (w/b) ratio was measured using a revised AASHTO 318-15 method [36] and found to be 0.51. The chemical compositions of the PC and FA are provided in Table 2, shown as in the case of this study. The calculated Bogue compositions (mass fractions) for PC are C3S, C2S, C3A and C4AF are 55.50%, 16.76%, 7.07%, and 9.83%, respectively. This concrete was tested in both 0.5 m cube and 1 m cube.
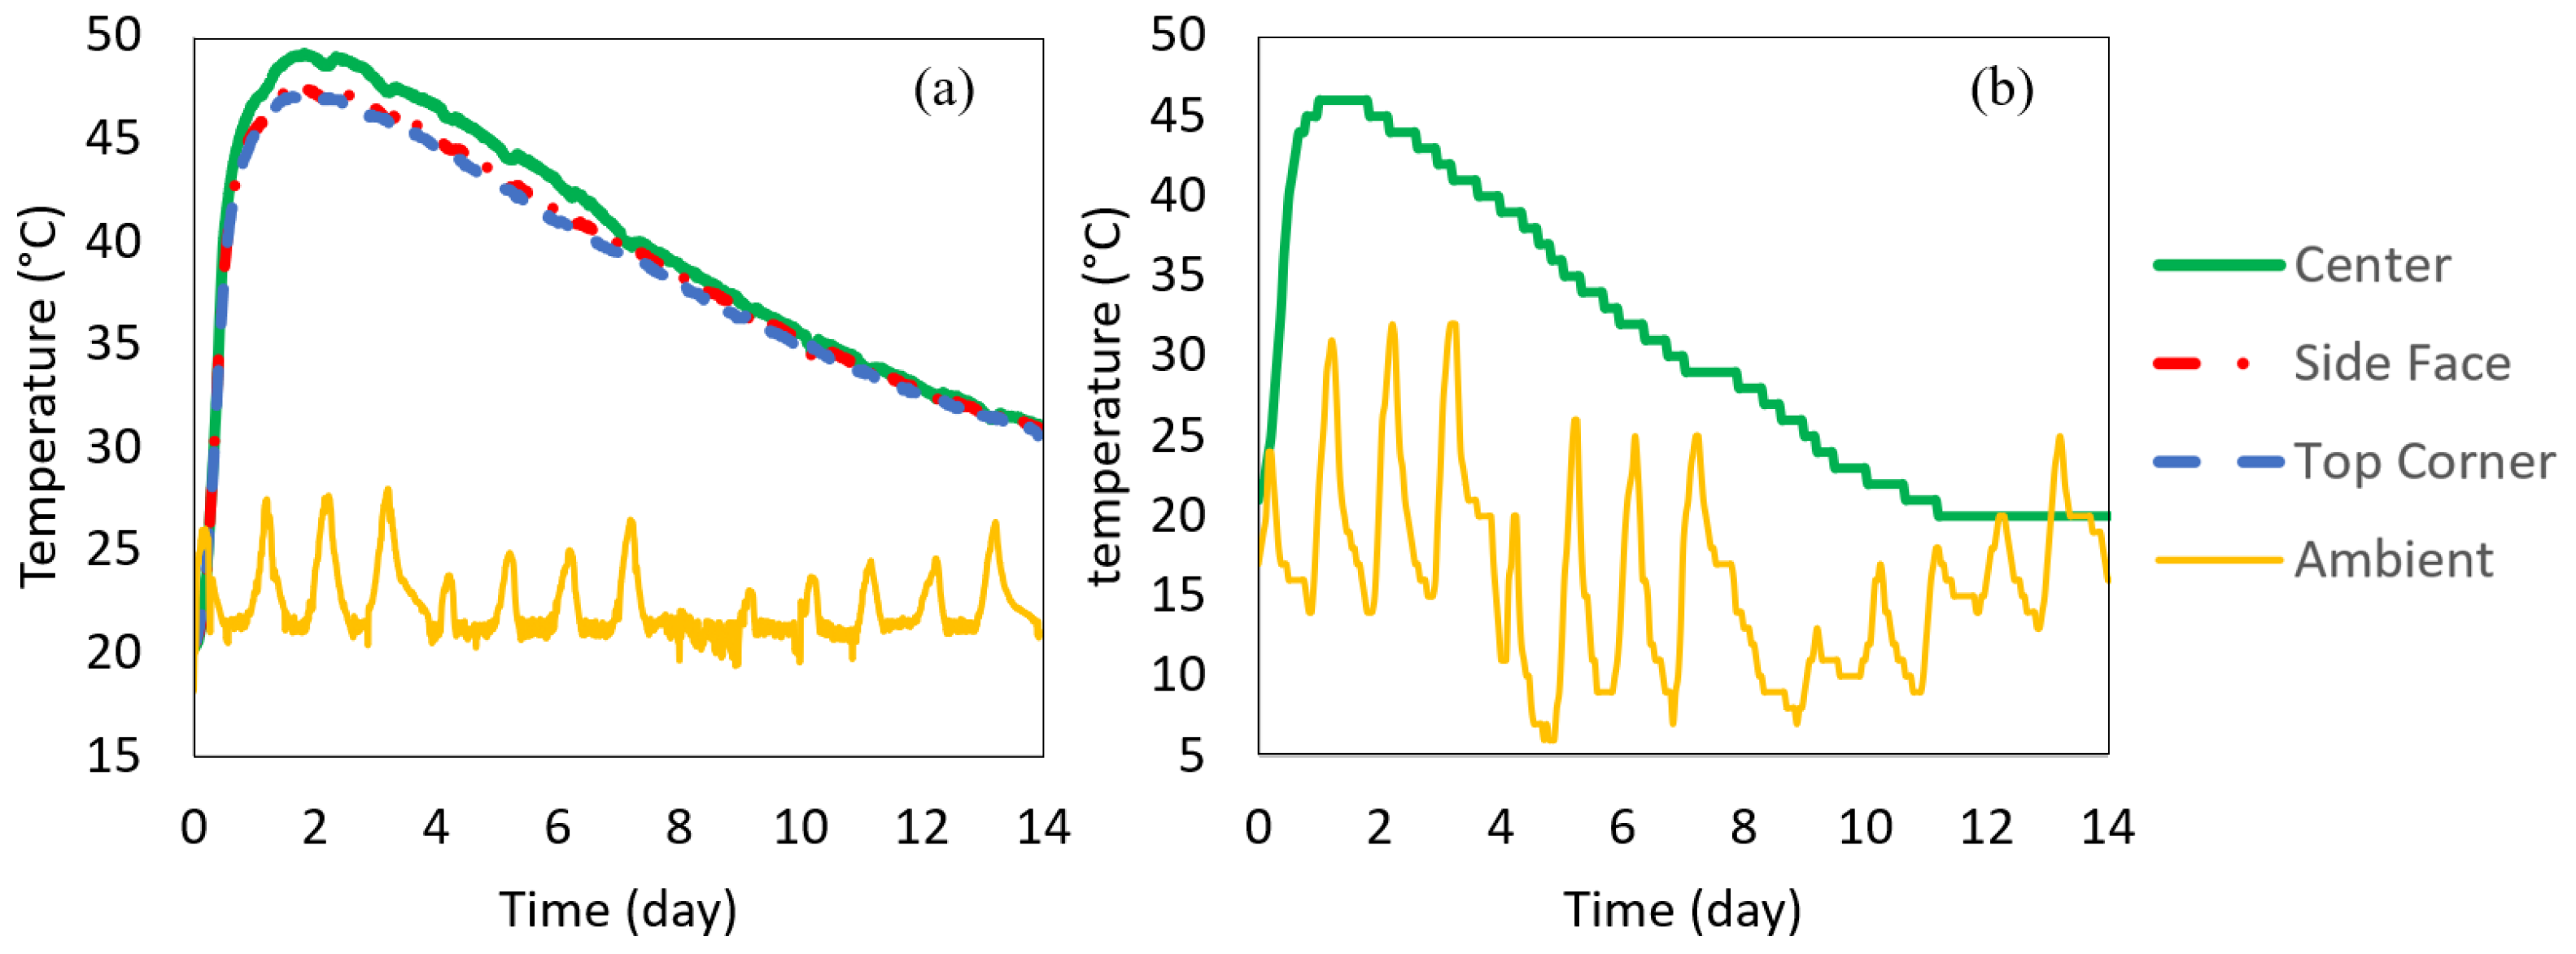
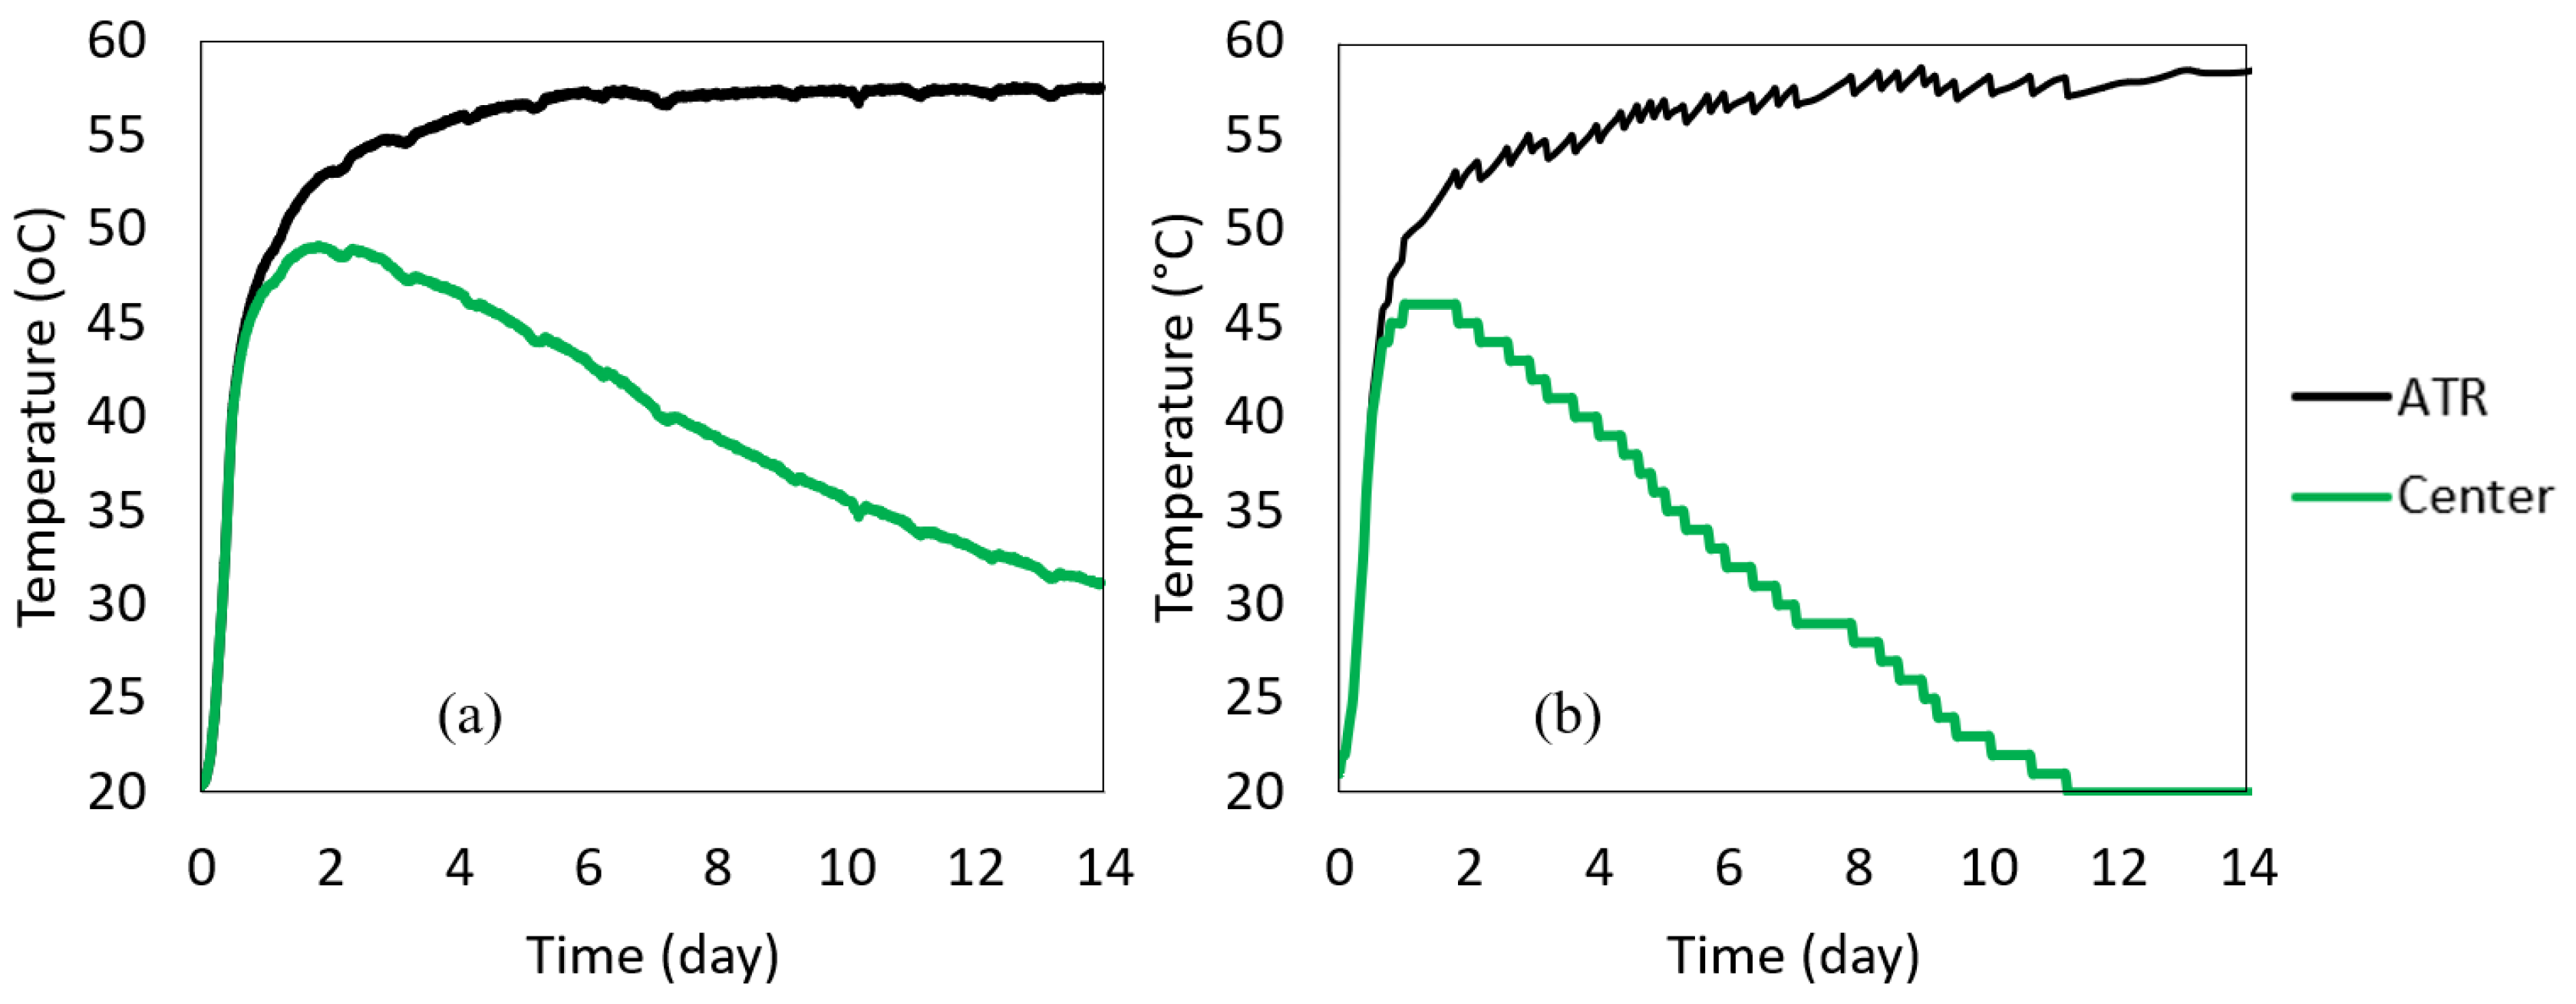
The 0.5 m insulated cube concrete was cast right after measuring the fresh concrete properties. The wooden box containing the 0.5 m insulated cube was closed to prevent heat loss. The temperature–time histories of the center, side center, top corner, and ambient were recorded. The box was placed inside a building and away from the high ambient fluctuations; however, the ambient temperature inside the building was not completely controlled, as seen in Figure 8a. The temperature was recorded every 15 min for 14 days. Using the same delivered batch, the 1 m insulated cube was also cast at the job site (the 1m cube was outside the building), and the temperature histories at the center and the ambient were monitored, shown in Figure 8b. The concrete temperature–time histories measured by the 0.5 m and 1 m cubes are shown in Figure 8. It was found that all three locations in the insulated 0.5 m cube had similar temperatures with less than 3 °C differences. The maximum center temperature depends on the insulation and the size of the specimen. The concrete was placed at an initial temperature of 21 °C. The maximum temperature of the 1 m cube reached 46 °C at 1 day (26 h), while the maximum temperature of the 0.5 m cube reached 49 °C at about 2 days (43 h).
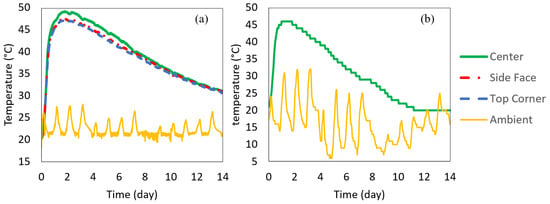
Figure 8.
Measured temperature–time history (a) 0.5 m cube recorded at different locations in the cube (b) 1 m cube recorded at the center of the specimen.
ATR Results and Comparisons
The ATR curves were calculated using the above heat loss compensation method from Equation (5) and plotted in Figure 9, along with each cube’s center temperature. The heat loss characteristic coefficients (average value of λ) were calculated within 140 to 200 h using Equation (6). They were 0.00447 h−1 and 0.00790 h−1 for 0.5 m and 1 m cubes, respectively. The ATR for concrete from each cube was estimated using Equation (4).
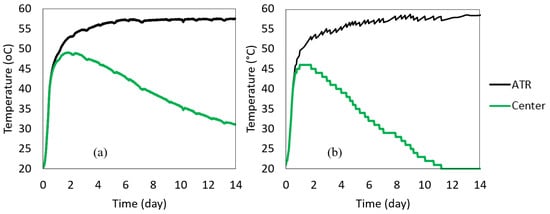
Figure 9.
Calculated ATRs versus the cube’s center temperature (a) 0.5 m cube (b) 1 m cube.
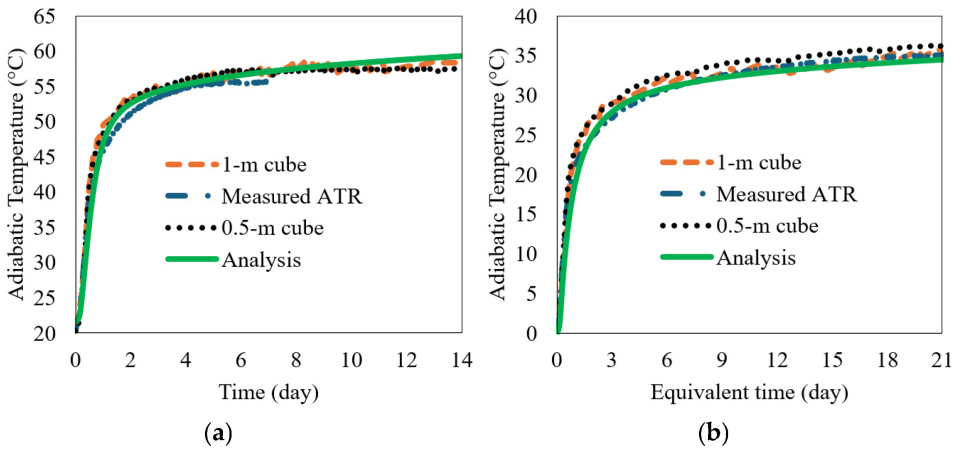
The calculated ATR from the 1 m insulated cube and the direct measurement of the adiabatic calorimetry were compared to the 0.5 m ATR to verify its validity, as can be seen in Figure 10a. The ASTM C1074-04 [37] equivalent age, te, was used in the plot of Figure 10b. The apparent activation energies, Ea (J/mol), were measured according to the experimental results presented in Figure 4b, and R is the universal gas constant (8.314 J/mol/K). The Ea for the FAC-2 (33 wt.% FA) concrete was 41,126 J/mol. The results show that the calculated ATR curves agree reasonably well with the measurements. The equation to obtain the equivalent age of the concrete is presented in Equation (29). The measured ATRs using two insulated cubes (0.5 m cube and 1 m cube) were compared with the analysis results from the kinetic model, as shown in Figure 10a. The coefficients used in the kinetic model for PC and FA of the FAC-2 batch (33 wt.% FA) concrete were shown in Table 3 and Table 4 as this study case. The ATRs were also compared with the measurements of the adiabatic calorimetry and the kinetic model in equivalent time in Figure 10b. The experimental and analytical results show good agreements; therefore, it is concluded that the proposed 0.5 m insulated cube and the kinetic model presented above is capable of predicting the ATR of a concrete mix containing PC + FA with reasonable accuracy.
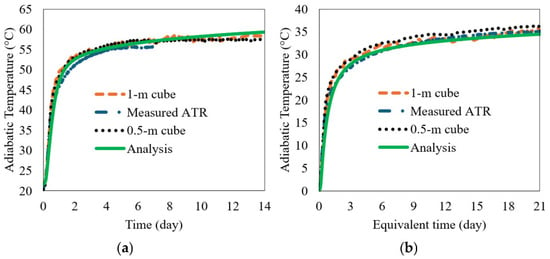
Figure 10.
Comparison of measured and simulated ATR curves for FAC-2 batch (33 wt.% FA) concrete mix: (a) normal time in day and (b) equivalent time in day.
5. Conclusions
In this study, multiple ATR estimation methods were compared. A 0.5 m insulated cube was developed to obtain the ATR using the cube’s center temperature. Besides the 0.5 m insulated cube, testing with a 1 m insulated cube and ATR calorimetry were also conducted. A hydration model was programed to model the hydration kinetics and the ATR of a concrete mix containing fly ash. An FA blended concrete mix was delivered by a concrete truck on-site, and all three experimental measurements were performed on the same delivered concrete mix. The ATR from the 0.5 m cube and the 1 m cube and the adiabatic calorimetry compared well with the analytical simulation of the delivered batch. The 0.5 m cube method can be directly applied by field engineers for on-site evaluation of thermal performance in concrete mixtures. The setup requires minimal equipment and can provide reliable ATR data for mix optimization and thermal-cracking risk assessment. However, care should be taken to shield the cube from direct sunlight and excessive wind exposure, as large ambient temperature fluctuations may affect early-age readings. The proposed 0.5 m insulated cube with a simple heat loss compensation calculation presented herein can be applied to obtain the ATR of delivered concrete, providing an economical and efficient method for measuring ATR in concrete mixes.
Author Contributions
N.S.A.: Conceptualization, Methodology, Software, Validation, Formal analysis, Investigation, Data curation, Writing—original draft, Visualization. H.-L.C.: Writing—review and editing, Validation, Supervision, Resources, Project administration, Investigation, Funding acquisition. All authors have read and agreed to the published version of the manuscript.
Funding
Doctoral Scholarship awarded to Nawaf S. Alsulami for study at West Virginia University, sponsored by Umm Al-Qura University.
Institutional Review Board Statement
Not applicable.
Data Availability Statement
The original contributions presented in this study are included in the article. Further inquiries can be directed to the corresponding author.
Acknowledgments
The authors gratefully acknowledge the Umm Al-Qura University for the doctoral scholarship to WVU. The authors acknowledge the assistance from Guadalupe Leon and Navid Mardmomen, who have read this paper and provided help and advice for developing it. The authors also acknowledge the experimental support provided by WVDOT and FHWA during this study.
Conflicts of Interest
The authors declare no conflicts of interest.
References
- Morabito, P. Adiabatic and Semi Adiabatic Calorimetry to Determine the Temperature Rise in Concrete Due to Hydration Heat of the Cement; Technical Recommendations of RILEM Technical Committee 119 TCE; RILM Publications SARI: Cachan, France, 1994; pp. 10–12. [Google Scholar]
- Lin, Y.; Chen, H.-L. Thermal analysis and adiabatic calorimetry for early-age concrete members. J. Therm. Anal. Calorim. 2015, 122, 937–945. [Google Scholar] [CrossRef]
- Gibbon, G.J.; Ballim, Y.; Grieve, G.R.H. A Low-Cost, Computer-Controlled Adiabatic Calorimeter for Determining the Heat of Hydration of Concrete. J. Test. Eval. 1997, 25, 261–266. [Google Scholar] [CrossRef]
- Chen, H.-L.R.; Mardmomen, S.; Leon, G. On-site measurement of heat of hydration of delivered mass concrete. Constr. Build. Mater. 2020, 269, 121246. [Google Scholar] [CrossRef]
- Yikici, T.A.; Chen, H.-L. Numerical prediction model for temperature development in mass concrete structures. Transp. Res. Rec. 2015, 2508, 102–110. [Google Scholar] [CrossRef]
- Woo, H.-M.; Kim, C.-Y.; Yeon, J.H. Heat of hydration and mechanical properties of mass concrete with high-volume GGBFS replacements. J. Therm. Anal. Calorim. 2018, 132, 599–609. [Google Scholar] [CrossRef]
- Parrot, L.J. Prediction of cement hydration. Proc. Br. Ceram. Soc. 1984, 35, 41–53. [Google Scholar]
- Kishi, T.; Maekawa, K. Multi-component model for hydration heating of Portland cement. Proc. Jpn. Soc. Civ. Eng. 1995, V-29, 97–109. [Google Scholar]
- Swaddiwudhipong, S.; Chen, D.; Zhang, M.H. Simulation of the exothermic hydration process of Portland cement. Adv. Cem. Res. 2002, 14, 61–69. [Google Scholar] [CrossRef]
- Tomosawa, F. Development of a kinetic model for hydration of cement. In Proceedings of the 10th International Congress on the Chemistry of Cement, Gothenburg, Sweden, 2–6 June 1997. [Google Scholar]
- Tomosawa, F.; Noguchi, T.; Hyeon, C. Simulation model for temperature rise and evolution of thermal stress in concrete based on kinetic hydration model of cement. In Proceedings of the 10th International Congress on the Chemistry of Cement, Gothenburg, Sweden, 2–6 June 1997; pp. 72–75. [Google Scholar]
- Park, K.-B.; Noguchi, T.; Plawsky, J. Modeling of hydration reactions using neural networks to predict the average properties of cement paste. Cem. Concr. Res. 2005, 35, 1676–1684. [Google Scholar] [CrossRef]
- Park, K.-B.; Jee, N.-Y.; Yoon, I.-S.; Lee, H.-S. Prediction of temperature distribution in high-strength concrete using hydration model. ACI Mater. J. 2008, 105, 180. [Google Scholar] [CrossRef]
- Maruyama, I.; Matsushita, T.; Noguchi, T. Numerical Modeling of Portland Cement Hydration Based on Particle Kinetic Model and Multi-Component Concept. In Proceedings of the International Congress on the Chemistry of Cement, TH1-08.3, Montreal, QC, Canada, 8–13 July 2007; Available online: https://iccc-online.org/fileadmin/gruppen/iccc/proceedings/12/pdf/fin00454.pdf (accessed on 15 June 2020).
- Narmluk, M.; Nawa, T. Effect of fly ash on the kinetics of Portland cement hydration at different curing temperatures. Cem. Concr. Res. 2011, 41, 579–589. [Google Scholar] [CrossRef]
- Wang, X.-Y.; Lee, H.-S. Modeling the hydration of concrete incorporating fly ash or slag. Cem. Concr. Res. 2010, 40, 984–996. [Google Scholar] [CrossRef]
- Wang, X.-Y. Simulation of temperature rises in hardening Portland cement concrete and fly ash blended concrete. Mag. Concr. Res. 2013, 65, 930–941. [Google Scholar] [CrossRef]
- Wang, X.-Y.; Lee, H.-S.; Park, K.-B. Simulation of low-calcium fly ash blended cement hydration. ACI Mater. J. 2009, 106, 167. [Google Scholar] [CrossRef] [PubMed]
- Wang, X.-Y.; Lee, H.-S. Simulation of a temperature rise in concrete incorporating fly ash or slag. Mater. Struct. 2010, 43, 737–754. [Google Scholar] [CrossRef]
- Ng, P.L.; Ng, I.Y.T.; Kwan, A.K.H. Heat loss compensation in semi-adiabatic curing test of concrete. ACI Mater. J. 2008, 105, 52. [Google Scholar] [CrossRef]
- Ng, P.L.; Kwan, A.K.H. Semi-adiabatic Curing Test with Heat Loss Compensation for Evaluation of Adiabatic Temperature Rise of Concrete. HKIE Trans. 2012, 19, 11–19. [Google Scholar] [CrossRef]
- Navi, P.; Pignat, C. Simulation of cement hydration and the connectivity of the capillary pore space. Adv. Cem. Based Mater. 1996, 4, 58–67. [Google Scholar] [CrossRef]
- Navi, P.; Pignat, C. Three-dimensional characterization of the pore structure of a simulated cement paste. Cem. Concr. Res. 1999, 29, 507–514. [Google Scholar] [CrossRef]
- Navi, P.; Pignat, C. Effects of cement size distribution on capillary pore structure of the simulated cement paste. Comput. Mater. Sci. 1999, 16, 285–293. [Google Scholar] [CrossRef]
- Pignat, C.; Navi, P.; Scrivener, K. Simulation of cement paste microstructure hydration, pore space characterization and permeability determination. Mater. Struct. 2005, 38, 459–466. [Google Scholar] [CrossRef]
- ASTM C125-03; Standard Terminology Relating to Concrete and Concrete Aggregates. ASTM International: West Conshohocken, PA, USA, 2003.
- Wang, X.-Y. Effect of fly ash on properties evolution of cement based materials. Constr. Build. Mater. 2014, 69, 32–40. [Google Scholar] [CrossRef]
- Lam, L.; Wong, Y.L.; Poon, C.S. Degree of hydration and gel/space ratio of high-volume fly ash/cement systems. Cem. Concr. Res. 2000, 30, 747–756. [Google Scholar] [CrossRef]
- Papadakis, V.G. Effect of fly ash on Portland cement systems: Part I. Low-calcium fly ash. Cem. Concr. Res. 1999, 29, 1727–1736. [Google Scholar] [CrossRef]
- Kishi, T.; Maekawa, K. Thermal and mechanical modeling of young concrete based on hydration process of multi-component cement minerals. In Thermal Cracking in Concrete at Early Ages: Proceedings of the International RILEM Symposium; Springenschmid, R., Ed.; CRC Press: Boca Raton, FL, USA, 1995; pp. 11–18. [Google Scholar]
- Han, F.; He, X.; Zhang, Z.; Liu, J. Hydration heat of slag or fly ash in the composite binder at different temperatures. Thermochim. Acta 2017, 655, 202–210. [Google Scholar] [CrossRef]
- Waller, V. Relations Entre Composition des Betons, Exothermie en COURS de Prise et Resistance en Compression. Ph.D. Thesis, Ecole des Ponts, Pairs, France, 1999. Available online: https://hal-enpc.archives-ouvertes.fr/tel-01223803 (accessed on 29 January 2022).
- Lerch, W.; Bogue, R.H. Heat of hydration of portland cement pastes. Bur. Stand. J. Res. 1934, 12, 645. [Google Scholar] [CrossRef]
- Leon, G.; Chen, H.-L.R. Thermal Analysis of Mass Concrete Containing Ground Granulated Blast Furnace Slag. CivilEng 2021, 2, 254–270. [Google Scholar] [CrossRef]
- Chaube, R.; Kishi, T.; Maekawa, K. Modelling of Concrete Performance: Hydration, Microstructure and Mass Transport; CRC Press: Boca Raton, FL, USA, 1999. [Google Scholar]
- Mardmomen, S.; Chen, H.-L.; Leon, G. Revised Method for Rapid Determination of On-Site Water–Cement Ratio using Microwave Oven. Transp. Res. Rec. 2019, 2673, 1–10. [Google Scholar] [CrossRef]
- ASTM C1074-04; Standard Practice for Estimating Concrete Strength by the Maturity Method. ASTM International: West Conshohocken, PA, USA, 2004. Available online: https://www.astm.org/c1074-04.html (accessed on 15 June 2020).
Disclaimer/Publisher’s Note: The statements, opinions and data contained in all publications are solely those of the individual author(s) and contributor(s) and not of MDPI and/or the editor(s). MDPI and/or the editor(s) disclaim responsibility for any injury to people or property resulting from any ideas, methods, instructions or products referred to in the content. |
© 2025 by the authors. Licensee MDPI, Basel, Switzerland. This article is an open access article distributed under the terms and conditions of the Creative Commons Attribution (CC BY) license (https://creativecommons.org/licenses/by/4.0/).

