Article

Low Poisson’s Ratio Measurement on Composites Based on DIC and Frequency Analysis on Tensile Tests

by
Luis Felipe-Sesé
1,*,
Andreas Kenf
2,
Sebastian Schmeer
2,
Elías López-Alba
3 and
Francisco Alberto Díaz
3
1
Departamento de Ingeniería Mecánica y Minera, EPS Linares, University of Jaén, 23700 Linares, Spain
2
Leibniz-Institut für Verbundwerkstoffe, Erwin-Schrödinger-Straße 58, 67655 Kaiserslautern, Germany
3
Departamento de Ingeniería Mecánica y Minera, EPS Jaén, University of Jaén, 23071 Jaén, Spain
*
Author to whom correspondence should be addressed.
J. Compos. Sci. 2025, 9(10), 570; https://doi.org/10.3390/jcs9100570
Submission received: 18 September 2025 / Revised: 9 October 2025 / Accepted: 13 October 2025 / Published: 16 October 2025

Abstract

Accurate determination of elastic properties, especially Poisson’s ratio, is crucial for the design and modeling of composite materials. Traditional methods often struggle with low strain measurements and non-uniform strain distributions inherent in these anisotropic materials. This research work introduces a novel methodology that integrates Digital Image Correlation (DIC) with frequency analysis techniques to improve the precision of Poisson’s ratio determination during tensile tests, particularly at low strain ranges. The focus is on the evaluation of two distinct frequency-based approaches: Phase-Based Motion Magnification (PBMM) and Lock-in filtering. DIC + PBMM, while promising for motion amplification, encountered specific challenges in this application, particularly at very low strain amplitudes, leading to increased variability and computational demands. In contrast, the DIC + Lock-in filtering method proved highly effective. It provided stable, filtered strain distributions, significantly reducing measurement uncertainty compared to traditional DIC and other conventional methods like strain gauges and Video Extensometers. This study demonstrates the robust potential of Lock-in filtering for characterizing subtle periodic mechanical behaviors leading to a reduction of approximately 70% in the standard deviation of the measurement. This work lays a strong foundation for more precise and reliable material characterization, crucial for advancing composite design and engineering applications.

1. Introduction

Composites, defined as the combination of two or more distinct macroscopic materials with an interface between them, allow for designing materials with tailored properties, optimizing aspects such as stiffness, strength, weight, and corrosion resistance in a way that is not possible with individual materials [1]. This is why the scientific interest in composite materials is unquestionable nowadays. In fact, different industries have echoed this potential and applied composites for addressing specific performance requirements, demanding more applied research about it, for instance, in the aerospace, military, or medical industries [2,3,4]. These are just a few examples; the versatility of composites makes them indispensable in demanding applications across diverse industrial landscapes.
Moreover, most woven composite materials exhibit complex mechanical behavior, and the development of predictive models or mechanical simulations for them represents a significant scientific challenge for the practical design of efficient parts [1]. Specifically, within mechanical characterization, the tensile test is a fundamental method [5]. Among other properties, Young’s modulus, tensile strength, and Poisson’s ratio are particularly important parameters to define a material’s behavior under complex stress states and a key input for finite element analysis and material modeling [5,6]. However, the accurate determination of Poisson’s ratio in composites, which offers the fundamental metric by which to compare the performance of any material when strained elastically, can present several complications, such as low, nonlinear, or negatives values [6,7,8,9]. Traditional methods using strain gauges or extensometers require the physical attachment of these sensors to the material, which can influence the mechanical response [1]. Additionally, strain gauges provide average strains over a set gauge length and lack the spatial resolution needed to capture non-uniform strain distributions in composites, which can be significant due to the size of the yarns [10].
To overcome some of these difficulties, advanced optical techniques such as Digital Image Correlation (DIC) allow the measurement of full-field strain without contact [11], which has led to numerous previous investigations related to mechanical characterization of composites [10,12,13]. Among its principal advantages, DIC enables the acquisition of detailed information about the strain distribution on the material’s surface, revealing stress concentrations and complex deformation patterns. It is based on tracking a random pattern, typically a speckle pattern, applied to the material’s surface. In DIC experimentation, digital images are captured before and during deformation, and correlation algorithms find the correspondence between small areas (subsets) in the images. By comparing the position of these subsets, displacement and strain are calculated across the surface. Therefore, the uncertainty and accuracy of DIC measurements are heavily influenced by image resolution. Higher resolution (more pixels per unit area) allows for more precise tracking of subset movement. With higher resolution, interpolation errors are reduced, and smaller displacements can be detected. Nowadays, an accuracy of 0.01 pixels or better can be achieved using commercial software that deals with distortion correction and higher-order spline interpolation functions. However, the subset size is a key consideration: smaller subsets increase spatial resolution but amplify noise, while larger subsets reduce noise but may miss local strain variations. Therefore, proper selection of image resolution and subset size is crucial for minimizing uncertainty and maximizing accuracy in DIC measurements [10,11,14]. These issues, along with speckle pattern quality and out-of-plane motion, are parameters to optimize for accurately measuring small strains, such as transverse strain in tensile tests [15,16]. Therefore, DIC has emerged as a powerful tool for full-field, non-contact measurement of displacement and strain, offering significant advantages over traditional methods for composites [5,10,17] due to, among others, its ability to capture high resolution and simultaneous longitudinal and transverse strains, enabling the direct calculation of Poisson’s ratio [5,10,12]. However, some composite materials exhibit a low Poisson’s ratio, leading to a reduced transversal strain during the tensile test, so DIC could struggle with the resolution and accuracy required for such measurements, or it could even be interesting to accurately measure Poisson’s ratio evolution along different strain ranges [10,15]. Previous investigations indicated that the combination of dynamic mechanical methods with DIC would allow a deeper understanding of material behavior and the simultaneous determination of multiple elastic properties [17].
In this work, to improve the accuracy of low Poisson’s ratio values, a methodology is proposed to merge frequency data analysis with tensile tests. This proposal consists of the performance of a sine of low strain amplitude during the elastic region in the tensile tests. Then, the data obtained from the DIC analysis of that sine section would be suitable to be analyzed using frequency filtering or enhancement. Specifically, Lock-in filtering [18] and Phase-Based Motion Magnification (PBMM) [19] are here evaluated since they have previously obtained good results in integration with DIC.
Lock-in is a simple, efficient frequency analysis method usually employed for Thermoelastic Stress Analysis (TSA) under cyclic loading [20]. It is a common tool for filtering the thermoelastic signal and extracting information at the frequency of interest, as the thermoelastic signal is often very subtle and contaminated by noise. Its popularity stems from the simplicity of Lock-in amplifiers. A wide variety of uses of Lock-in and TSA have been found in the literature for the study of fracture and fatigue phenomena, as well as for the evaluation of stress fields in the modal shapes of individual resonances [20,21]. Lock-in requires a reference signal to filter noise out at that frequency. The result is a data field where the magnitude represents the amplitude of the signal and the phase shift is between the filtered signal and the reference signal. The same idea could be applied to obtain displacement maps. In fact, Fruehmann et al. [18] explored the application of a Lock-in amplifier to process DIC data obtained from components under cyclic loading. Their aim was to obtain precise surface deformation maps in fatigue tests without the need for high-speed cameras. The technique involves applying the Lock-in amplifier to the deformation data derived from images captured at low frame rates. The results demonstrated that this method allows for obtaining precise deformation maps even with loading frequencies higher than the camera’s frame rate. The application of the Lock-in algorithm achieves an improvement in deformation resolution compared to a standard static test. However, recent investigations have shown that it is not necessary to use a Lock-in amplifier and an off-line filtering process could be applied to the displacement maps [20].
Moreover, Phase-Based Motion Magnification (PBMM) is a Eulerian methodology for processing periodic motion in videos. Its main goal is to reveal subtle and imperceptible movements that occur in image sequences by creating a magnified version of these movements [19]. It is a tool with great potential in the analysis of monotonic periodic events and helps in interpreting the deformations occurring in machine parts. In fact, Molina-Viedma et al. [14] explored this combination to analyze mode shapes at high frequencies with DIC. The authors pointed out that while DIC provides quantitative motion information with greater sensitivity than the naked eye, its accuracy decreases at high frequencies due to low displacements. Therefore, they investigated the combination of DIC and PBMM to provide numerical information in magnified videos and perform mode shape characterization by DIC at unprecedented frequencies, by increasing the amplitude of displacements. It was demonstrated that PBMM contributes to improving the DIC visualization of cantilever beam mode shapes. Particularly, higher-order mode shapes could be visualized, expanding the limits of DIC to frequencies up to 6710 Hz in that work. Furthermore, the authors also applied that methodology in 3D-DIC [22] and in the integration of DIC with Fringe Projection [23].
Specifically, this work explores the potential of DIC in combination with PBMM and Lock-in for the obtaining of a low Poisson’s ratio, which is common in composites. The proposal consists of the inclusion of at least one stage during a traditional tensile test where the specimen is also subjected to a sinusoidal excitation controlled by the engineering strain or displacement. The amplitude and strain levels should be reduced compared to the material’s failure strain to avoid generating internal damage on specimens. Images obtained during the sinusoidal excitation are processed with DIC, DIC + PBMM, and Lock-in for filtering strain values during the sine stage, thereby yielding a reliable Poisson’s ratio. This work demonstrates a promising method for accurate material characterization.

2. Fundamentals

2.1. Lock-In Filtering

As previously mentioned, Lock-in amplification is a signal processing technique used to extract a signal with a known frequency from a noisy environment [18,20]. It is particularly effective when the signal of interest is small and embedded in much larger noise at other frequencies.
Lock-in processing requires a reference signal at the exact frequency of the signal to be measured. This reference signal can be derived from the source generating the signal (e.g., the load signal in a mechanical testing machine) or be a synthetically generated signal at the frequency of interest, which leads to off-line Lock-in [20].
Traditionally, Lock-in amplification was performed using dedicated electronic instruments called Lock-in amplifiers [24], which contain the necessary multipliers, filters, and phase-shifting circuitry. With advancements in computing, Lock-in amplification can also be implemented in software through off-line processing of recorded data based on Fourier series. Thus, the signal can be decomposed as sines at the discrete frequencies f n =   n f s N , according to the sampling frequency, f s , and the number of samples, N , with n = 0 , ,   N / 2 when N is even, which is the most common in practice. Using the subscript Y to indicate the frequency of interest, the signal can be decomposed as follows [20]:
y j = A Y sin 2 π f Y t j + ϕ Y   + n = 0 N / 2 1 δ n Y A n sin 2 π f n t j + ϕ n   . t j = j f s   j = 0 , 1 , ,   N 1 . δ n Y = 1   n = Y 0   n Y
where A and ϕ represent the amplitude and phase of each term. Now, consider a reference monotonic signal, x , and its quadrature, x :
x j = 2 sin 2 π f X j f s + ϕ X . x j = 2 cos 2 π f X j f s + ϕ X .
DC terms only depend on the amplitude of the signal, A Y , and the phase shift, Δ ϕ , at the frequency of interest [20]. In addition, this term can be obtained from both modulated signals as the mean value for the N values of the whole sequence, so that
R = 1 N j = 0 N 1 y j x ( j ) = A Y cos Δ ϕ . I = 1 N j = 0 N 1 y j x j = A Y sin Δ ϕ .
from which the amplitude and phase shift can be obtained as follows:
A Y = R 2 + I 2 . Δ ϕ = atan I R   .
When this process is performed at every pixel signal, an image of amplitude A Y   p c o l , p_row and phase shift Δ ϕ p_col,p_row is obtained for the frequency of interest. Using complex algebra, a complex image is obtained, with R and I as the real and imaginary parts, respectively.

2.2. Phase Motion Magnification

Phase-Based Motion Magnification (PBMM) is a computational technique designed to reveal and amplify subtle motions in videos that are often imperceptible to the na-ked eye [19]. Unlike traditional methods that rely on intensity variations or optical flow, PBMM op-erates by analyzing and manipulating the phase information within a video sequence [25]. This approach has proven more robust to noise and capable of handling larger magnification factors compared to intensity-based methods.
The first crucial step in PBMM is to decompose the input video frames into a multi-scale and multi-orientation representation using complex steerable pyramid filters [19]. This is an overcomplete linear transformation that breaks down each image into a set of coefficients corresponding to basic functions localized in position, spatial scale, and orientation. These complex coefficients can be expressed in terms of their amplitude and phase [26].
The phase of these complex coefficients holds critical information about the local spatial structure and, importantly, about motion. The fundamental principle behind PBMM is that small motions in the image sequence correspond to subtle variations in the local phase over time. Once the local phase is extracted for each spatial location, scale, and orientation across the video sequence, temporal signal processing is applied to these phase signals. Typically, a temporal bandpass filter is used to isolate phase variations that occur within a specific frequency band of interest. This allows for the amplification of motions occurring at particular frequencies, such as the vibration frequency of a structure. To avoid phase-wrapping issues, the phases are often unwrapped temporally before filtering [26].
After isolating the phase variations in the desired frequency band, these phase differences are multiplied by a magnification factor (α). According to the Fourier shift theorem, shifts in the spatial domain correspond to linear changes in phase in the frequency domain. By amplifying the temporal variations in the phase, PBMM effectively synthesizes a new video in which these subtle motions are exaggerated approximately in the magnitude (1 + α) [23]. The relationship between phase shift and translation is approximately linear for small motions.
Finally, the modified phase information (with amplified variations) is used along with the original or processed amplitudes of the complex steerable pyramid coefficients to reconstruct the frames of a new video sequence. This reconstruction is essentially the inverse transformation of the complex steerable pyramid decomposition.

3. Methodology

3.1. Materials Studied

In this work, off-line Lock-in and PBMM were evaluated for the analysis of Poisson’s ratio in cases where strains measured are low or the actual ratio is low. Specifically, it has been evaluated in two different materials, the GF-PA6 and CF-PC.
The GF-PA6 is a woven glass fiber (twill 2/2) reinforced polyamid-6 composed of BASF SE with a layer thickness of 0.25 mm. The fiber weight rate was 50%/50%. According to initial tensile tests, the ultimate strength of the material was 830 MPa and the strain for failure was 21 × 10−3 strains. The CF-PC is a unidirectional carbon fiber reinforced polycarbonate composed by Covestro AG Leverkusen, Germany (CF GP 1000T) with a fiber volume fraction of 44% and a layer thickness of 0.17 mm. According to initial tensile tests, the ultimate strength of the material was 22 MPa and the strain for failure was 4.4 × 10⁻³ strains. Specimen shape (25 mm width and 2 mm thickness) and hills colocation were considered according to standard DIN EN ISO 527-4 [27]. The geometrical specifications of the specimens and the orientation of fibers are illustrated in Figure 1.

3.2. Experimental Procedure

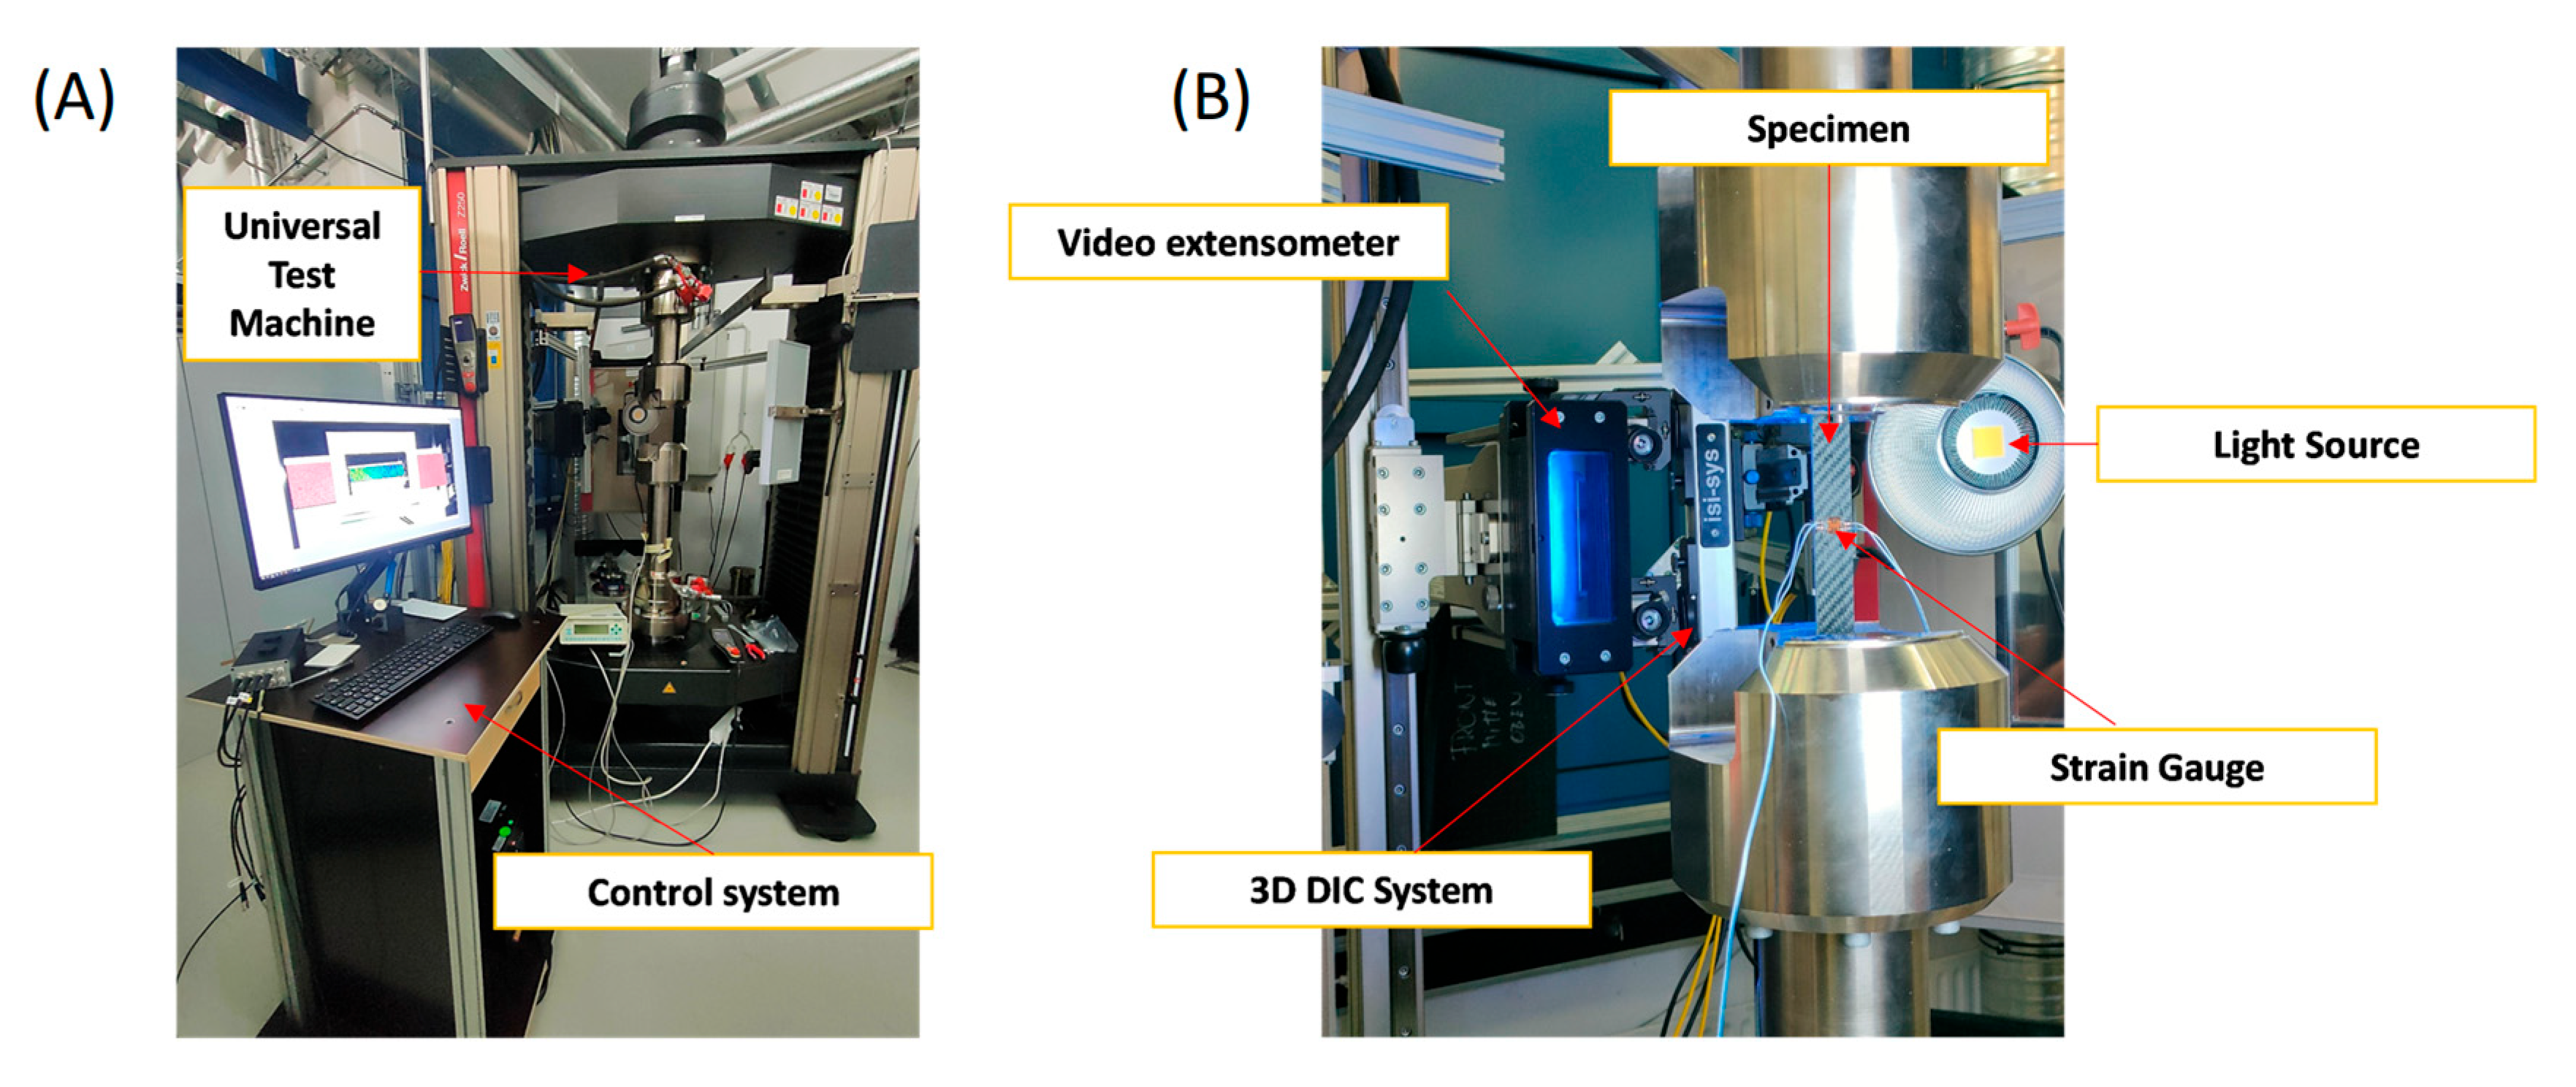
Since the focus was placed on improving the Poisson’s ratio measurement using periodic methodologies such as PBMM and Lock-in, cyclic sinusoidal tests at a low frequency were performed with low strain amplitudes, ensuring that they were well below the respective strain at failure values to avoid generating collateral defects. For the GF-PA6 material two tests at the ranges of 0.05–0.1% and 0.35–0.4% of engineering strains measured by the test machine were commanded. These were designated Test A and Test B. In the case of CF-PC, the other two tests at ranges 0.05–0.1% and 0.2–0.3% of engineering strains were also performed called Test C and Test D, respectively. For all cases, the frequency of the commanded sinusoidal excitation was 0.2 Hz, and a total of 15 load cycles were performed. Tensile tests were executed in a ZwickRoell Z250 universal test machine with a maximum load capacity of 250 kN. The set up employed is shown in Figure 2.
The primary experimental system for strain measurement during the tests was an ISI-SYS 3D Digital Image Correlation set up, employing VIC 3D 8 software and two Basler acA4096-40 um cameras of 9 Megapixel resolution with Schneider Xenoplan 2.8/50 lenses recording at 10 fps. The resolution of each camera was 30.6 px/mm. The calibration of the system was performed by employing a 7 mm space target. The parameters of the DIC processing were a 29 px subset size and 7 px spacing according to recommendations in the bibliography [13], giving a grid of 221 × 74 data points.
For the GF-PA6 specimens, the 3D-DIC, PBMM, and Lock-in results were compared with those obtained from two other experimental systems. One of them was a 2-grid stacked strain gauge (1-XY91-6/120 from Hottinger Brüel & Kjaer GmbH, Nærum, Denmark) covering an area of 8 × 8 mm as illustrated in Figure 1. This size value is important since it is in the order of magnitude of the composite weft. The test machine recorded the εxx and εyy data measured by strain gauge and data were synchronized with the load and displacement. An additional experimental system employed was a Video Extensometer, which used two cameras for longitudinal strain (with a resolution of 29.8 px/mm) and one camera for transverse strain (with a resolution of 23.7 px/mm) (VideoXtens biax 2-150 HP by ZwickRoell GmbH, Ulm, Germany). As in the case of the strain gauge, the εxx and εyy data measured were synchronized with data obtained by the test machine.

3.3. Methodology for PBMM and Lock-In Analysis

To evaluate the performance of PBMM, 200 pairs of images (set of images of Camera 0 and Camera 1 framed with a red dashed line box in Figure 3) corresponding to four cycles were magnified using PBMM with a magnification factor of α = 2 and for CF-PC material also of α = 1. For the PBMM procedure (framed with a purple dashed line box in Figure 3), the PBMM algorithm was adapted for use with image sequences from the code made available by its authors [19]. The sets of original images captured by each camera were magnified independently, which required approximately 40 min on a machine equipped with an Intel i7 9700K CPU and 32 GB of RAM. After magnification, the same images representing the unloaded specimen were considered as the initial reference, similar to the non-magnified image sets. Finally, the magnified sets of images were processed using VIC 3D 8 with the same parameters as the non-magnified image sets. To evaluate the off-line Lock-in filtering (framed with a green dashed line box in Figure 3), an in-house code written in Matlab was developed following the methodology proposed by Molina-Viedma et al. [20]. The inputs for the algorithm were the strain maps obtained from 3D-DIC (procedure framed with a black dashed line box in Figure 3), corresponding to the same four cycles as used for PBMM. The results were one εxx and one εyy filtered maps representing the respective amplitudes; the computation time required was negligible. Figure 3 shows the schematic representation of the procedure explained above to obtain results from DIC, DIC + PBMM, and DIC + Lock-in.

4. Results

4.1. Results for GF-PA6 Material

For illustration, Figure 4 shows the stress–strain results during the test performed on GF-PA6 material, specifically Test A and Test B. As observed, the red lines illustrate the engineering strain measured by the testing machine, which corresponds to the commanded data discussed previously. Nevertheless, as expected, the real strain measured by DIC, strain gauge, and Video Extensometer is significantly lower. Focusing on the details of each graph, the strain measured by Video Extensometer is higher than that measured by DIC, which is also slightly higher than the one measured by strain gauge. It is important to note that the tests were conducted at very low strains, well below the onset of damage or plasticity, as intended.
Focusing on the analysis of the Poisson coefficient, Figure 5 shows the Poisson’s ratio measured from the εxx and εyy values measured with the stain gauge, Video Extensometer, DIC on its traditional procedure, DIC + Lock-in, and DIC + PBMM. The results from the full-field techniques, i.e., DIC and DIC + PBMM, were calculated by averaging each data field corresponding to each couple of images captured. DIC + Lock-in Poisson’s ratio results are calculated by relating the εxx- and εyy-filtered data maps as illustrated on Figure 3.
Figure 5 shows the results for the frames corresponding to the images where PBMM was applied. Additionally, Table 1 presents the average of the measurements calculated over the same range as presented in Figure 5. Comparing the results on the graph, it is clear that the results of Test A were noisier than those obtained in Test B. This is mainly due to the strain level, which is lower in the former. In general, it is also observed that strain gauge obtains Poisson’s ratios which are slightly lower than results obtained by the DIC techniques, but it is also observed that the results obtained from Video Extensometer are notably overestimated with respect to any of the other systems. In fact, the values from Video Extensometer are 346% and 196% times those obtained from strain gauge. This could probably be due to the lower resolution of the system, which is more notorious at lower strains. Nevertheless, the strain gauge size is in the order of magnitude of the composite yarns, so its strain values could be affected by the exact measuring point. Another issue observed is the peaks on the PBMM results for Test A that are not present in Test B. This behavior is answered with the strain level achieved, which was lower in the former. For PBMM results, since displacements were magnified, the lower displacement values tend to zero value, so the relation ν = −εtrans/εlong tends to infinity. To enhance graph clarity, the Poisson’s ratio values higher than 0.1 were not displayed and removed from further calculations. This aspect is not observed in Test B, mainly due to the fact that the average strain during the test was high enough to ensure strains remained sufficiently far from zero values even after magnification. Therefore, tests involving very low strains should be considered with caution when using PBMM, as they represent a critical point-of-care for this method.
Regarding Table 1, Video Extensometer results are not considered since the results could be considered as not suitable for this specific application. The uncertainties of the original measurement systems are not considered either since, in this work, the improvement from original results employing the periodical analysis of PBMM and Lock-in procedures is evaluated. From the two tests, A and B, the average is also calculated together with the standard deviation, considering the two tests for each measurement. As observed, the value of the techniques based on DIC is normally higher than that obtained from strain gauge; however, for the case of DIC + Lock-in in Test B, the Poisson’s ratio is significantly closer (7% of difference with respect to strain gauge). In fact, the standard deviation obtained from DIC + Lock-in was reduced to 37% of that which was obtained from DIC in this case. For the case of DIC + PBMM, for Test A, results were not improved with respect to traditional DIC as commented; however, for Test B, both the mean and standard deviation values were reduced, making them closer to those from DIC + Lock-in but not as close to strain gauge.

4.2. Results for CF-PC Material

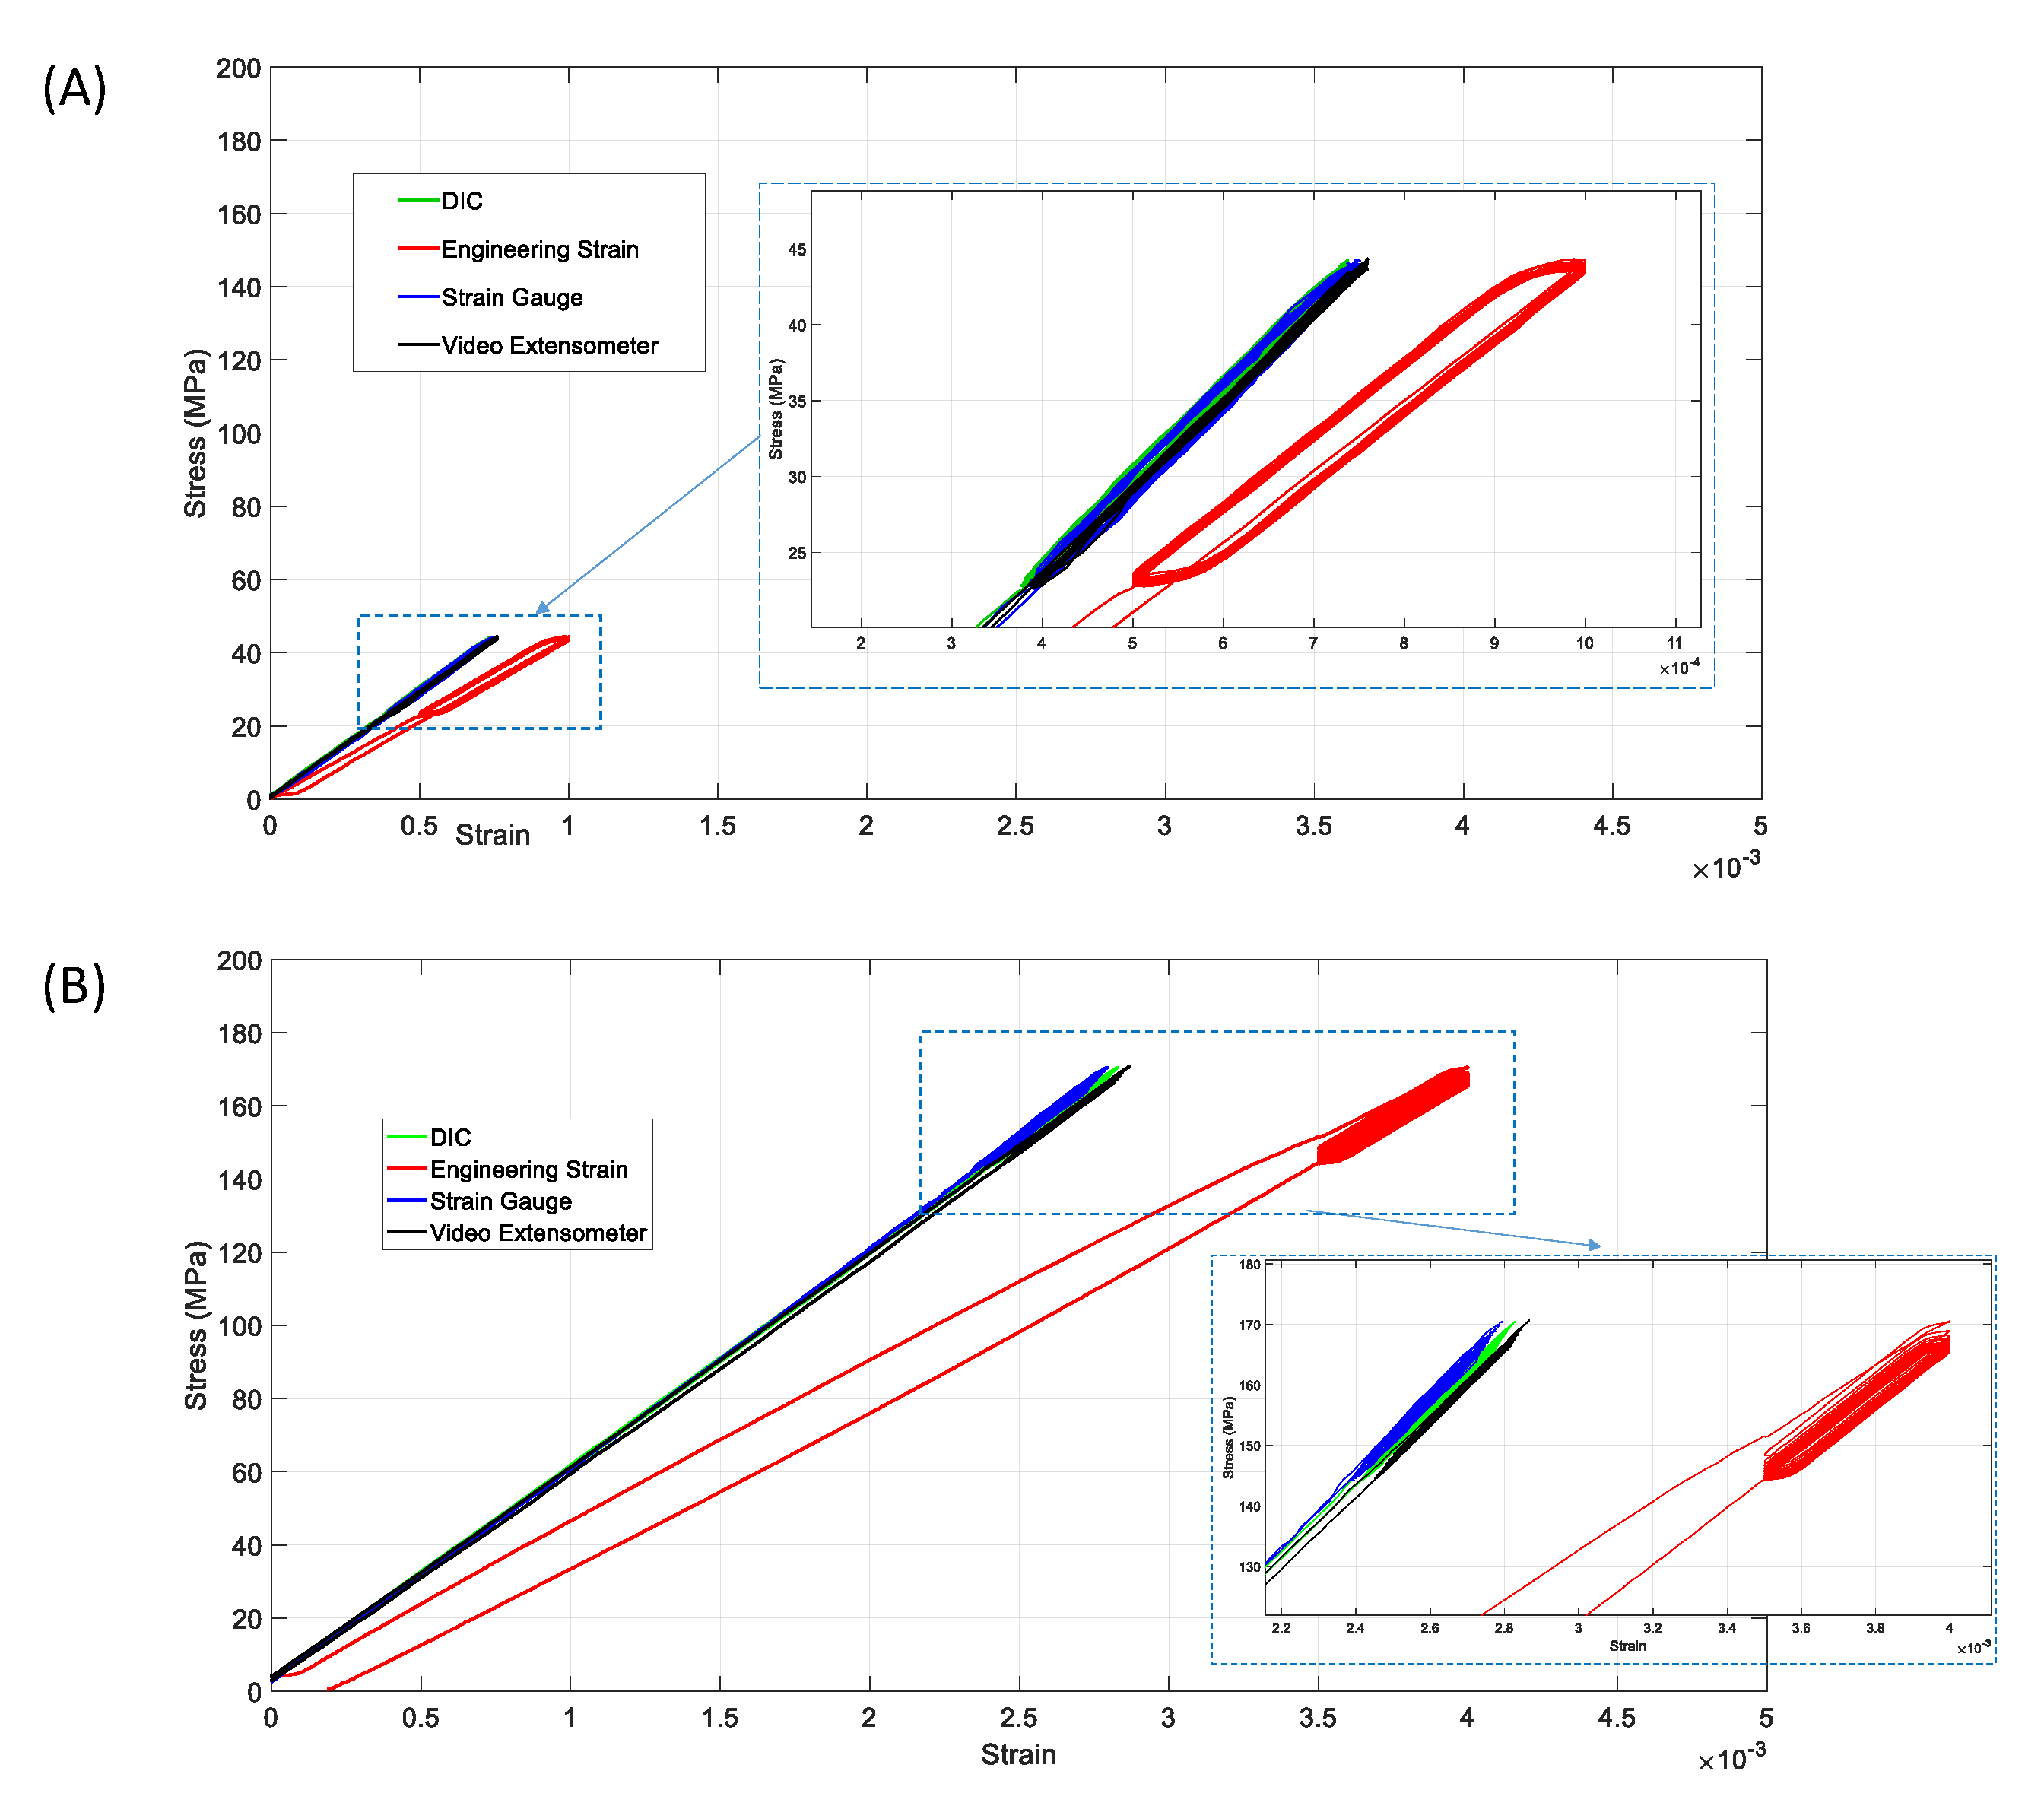
As in the previous section, firstly it is presented in Figure 6 the stress–strain results during the tests performed on CF-PC material, which are Test C and Test D. In these tests, only the DIC system was employed as the measuring technique for real strains. The data from images or from strain maps is employed following the pipeline presented in Figure 3 to process PBMM or Lock-in, respectively. As in the previous test, the real strain measured by DIC is significantly lower than the engineering strain measured by the test machine, as predicted by theory.
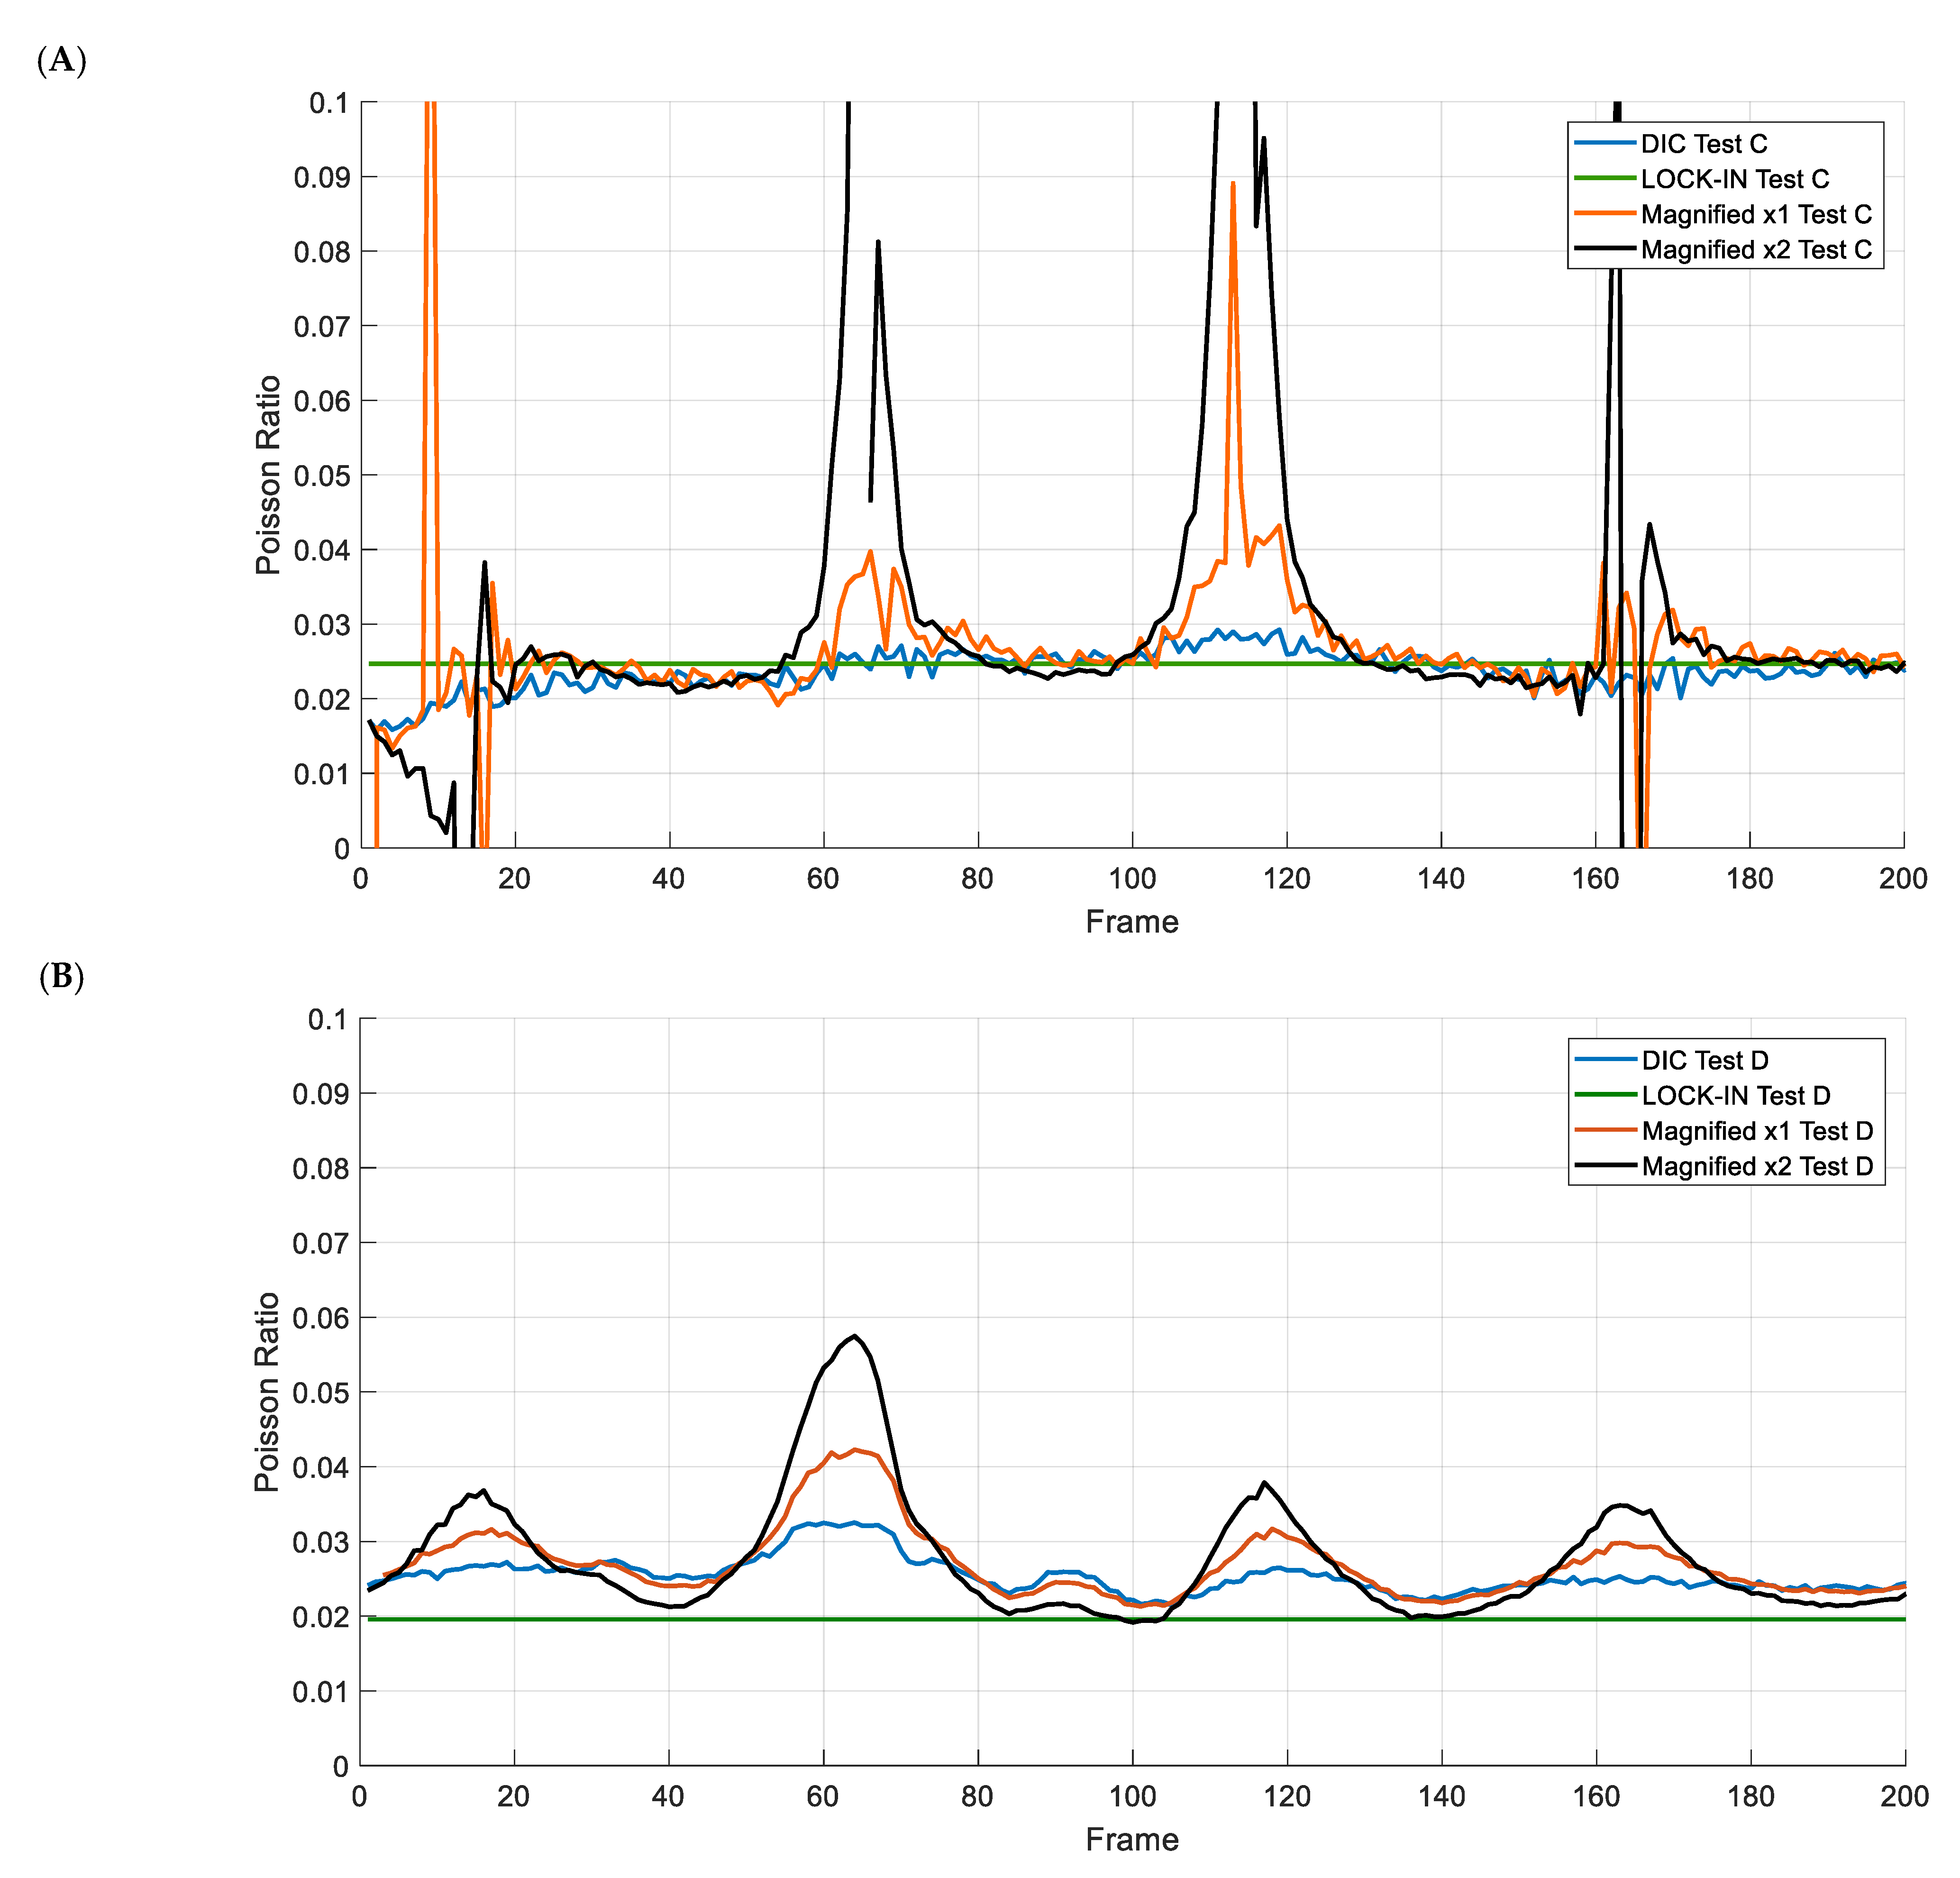
Moreover, Figure 7 shows the Poisson’s ratio measured along the 200 frames corresponding to four cycles of loading. It is notorious that the Poisson’s ratio for this material is much lower than that from previous tests. Results for the two tests, Test C and Test D, were obtained by direct DIC technique, DIC + Lock-in, and DIC + PBMM. In this case, two magnifications factors have been explored, α = 1 and α = 2, in order to evaluate if a lower magnification factor could elude previous drawbacks observed when low strains were achieved after magnification. As observed, the graph highlights the heterogeneity in the Poisson’s ratio calculated with DIC + PBMM as occurred in Test A, when lower strains mean that, after magnification, minimum values of εtransveral tend to 0, leading to incorrect high ν values. Higher peaks were obtained when the magnification factor was α   =   2 . Nevertheless, for magnification values of α = 1, even when reduced, there were also visible some oscillations that could affect the mean value. It is appreciable that direct DIC values are more stable along the frames analyzed, and, logically, DIC + Lock-in present a single filtered value for the complete analyzed period.
In Table 2, the main statistics from the results are summarized. As observed, results for DIC + PBMM were generally affected by a much higher standard deviation due to the oscillations generated. The Poisson’s ratio measured with DIC + Lock-in in Test C was close to that obtained with DIC. However, in Test D, a reduction to 77.1% of the DIC value is observed. Regarding the standard deviation, it was clearly reduced to 27.7% of the original value from DIC.

5. Conclusions

This work successfully demonstrated a novel approach to accurately determine elastic properties, specifically the Poisson’s ratio, at low strain ranges in composite materials. By integrating frequency analysis into traditional tensile testing, it aims to overcome common challenges associated with measuring subtle transverse strains.
The investigation specifically evaluated the potential of two frequency-based methodologies, Phase-Based Motion Magnification (PBMM) and Lock-in filtering, when combined with Digital Image Correlation (DIC). The key findings are summarized as follows:
  • It has uniquely employed frequency analysis techniques in conjunction with tensile testing for the precise determination of elastic properties, particularly at the challenging low strain ranges relevant to composite materials. This represents a significant methodological contribution to material characterization.
  • While DIC + PBMM shows promise for magnifying subtle motions, its application for low Poisson’s ratio measurements presented notable challenges. The primary limitation arose when the low-amplitude strains, especially transverse strains, approached zero after magnification, leading to significant fluctuations and impossibly high (tending to infinity) Poisson’s ratio values. Furthermore, the computational time required for PBMM processing was considerable, making it less practical for routine analysis in this specific application.
  • In contrast, the integration of DIC with Lock-in filtering emerged as a powerful and highly effective tool for accurately determining Poisson’s ratio. This methodology demonstrated no significant drawbacks and incurred negligible computational cost. It consistently provided a filtered and stable strain distribution, leading to more reliable Poisson’s ratio measurements, particularly at low strain amplitudes. In fact, the standard deviation of the measurements was reduced by up to 27.7% of the measurement of the original DIC measurements. The fidelity of Lock-in filtering, already well-established in other fields like Thermoelastic Stress Analysis (TSA) for detecting subtle periodic behaviors, is strongly supported by its successful application and performance in this study. This method offers a robust solution for capturing the elusive characteristics of low Poisson’s ratios in composites.
This work represents a first successful step towards enhancing the precision of Poisson’s ratio measurements in challenging scenarios. Future research could explore the applicability of this method across a wider range of composite types, loading conditions, and frequencies, as well as investigate the long-term stability and automation potential of the technique. This study lays a strong foundation for more precise material modeling and design in industries reliant on composite performance.

Author Contributions

Conceptualization, L.F.-S. and S.S.; methodology, L.F.-S. and A.K.; validation, L.F.-S. and A.K.; resources, E.L.-A., S.S. and F.A.D.; data curation, L.F.-S.; writing—original draft preparation, L.F.-S.; writing—review and editing, L.F.-S., S.S., E.L.-A., F.A.D. and A.K.; project administration, L.F.-S.; funding acquisition, L.F.-S. All authors have read and agreed to the published version of the manuscript.

Funding

This research has been funded by the Ministerio de Ciencia, Innovación y Universidades (MICIU) and the Agencia Estatal de Investigación of the Spanish Government and FEDER, UE by the grant MCIN PID2022-141618OA-I00 “Integroptics” and PID2020-119107RA-I00.

Data Availability Statement

The original contributions presented in this study are included in the article. Further inquiries can be directed to the corresponding author.

Conflicts of Interest

The authors declare no conflict of interest.

References

  1. Pendleton, R.; Tuttle, M. Manual on Experimental Methods for Mechanical Testing of Composites; Society for Experimental Mechanic: London, UK, 1989. [Google Scholar]
  2. Parveez, B.; Kittur, M.I.; Badruddin, I.A.; Kamangar, S.; Hussien, M.; Umarfarooq, M.A. Scientific Advancements in Composite Materials for Aircraft Applications: A Review. Polymers 2022, 14, 5007. [Google Scholar] [CrossRef]
  3. Kamarudin, S.H.; Mohd Basri, M.S.; Rayung, M.; Abu, F.; Ahmad, S.; Norizan, M.N.; Osman, S.; Sarifuddin, N.; Desa, M.S.Z.M.; Abdullah, U.H.; et al. A Review on Natural Fiber Reinforced Polymer Composites (NFRPC) for Sustainable Industrial Applications. Polymers 2022, 14, 3698. [Google Scholar] [CrossRef]
  4. Harussani, M.M.; Sapuan, S.M.; Nadeem, G.; Rafin, T.; Kirubaanand, W. Recent Applications of Carbon-Based Composites in Defence Industry: A Review. Def. Technol. 2022, 18, 1281–1300. [Google Scholar] [CrossRef]
  5. Xu, D.; Cerbu, C.; Wang, H.; Rosca, I.C. Analysis of the Hybrid Composite Materials Reinforced with Natural Fibers Considering Digital Image Correlation (DIC) Measurements. Mech. Mater. 2019, 135, 46–56. [Google Scholar] [CrossRef]
  6. Shen, H.S.; Xiang, Y.; Reddy, J.N. Assessment of the Effect of Negative Poisson’s Ratio on the Thermal Postbuckling of Temperature Dependent FG-GRMMC Laminated Cylindrical Shells. Comput. Methods Appl. Mech. Eng. 2021, 376, 113664. [Google Scholar] [CrossRef]
  7. Mentrasti, L.; Molari, L.; Fabiani, M. Poisson’s Ratio Bounds in Orthotropic Materials. Application to Natural Composites: Wood, Bamboo and Arundo Donax. Compos. Part B Eng. 2021, 209, 108612. [Google Scholar] [CrossRef]
  8. Lempriere, B.M. Poisson’s Ratio in Orthotropic Materials. AIAA J. 1968, 6, 2226–2227. [Google Scholar] [CrossRef]
  9. Greaves, G.N.; Greer, A.L.; Lakes, R.S.; Rouxel, T. Poisson’s Ratio and Modern Materials. Nat. Mater. 2011, 10, 823–837. [Google Scholar] [CrossRef]
  10. Orell, O.; Vuorinen, J.; Jokinen, J.; Kettunen, H.; Hytönen, P.; Turunen, J.; Kanerva, M. Characterization of Elastic Constants of Anisotropic Composites in Compression Using Digital Image Correlation. Compos. Struct. 2018, 185, 176–185. [Google Scholar] [CrossRef]
  11. Schreier, H.; Orteu, J.-J.; Sutton, M.A. Image Correlation for Shape, Motion and Deformation Measurements; Springer: Boston, MA, USA, 2009. [Google Scholar]
  12. Bassir, D.; Guessasma, S.; Zheng, Y.; Cai, Y.; Salzenstein, P. Composite Characterization Using Digital Image Correlation (DIC) Approach for Stress-Strain Prediction. AIP Conf. Proc. 2024, 3094, 230003. [Google Scholar]
  13. Merzkirch, M. Mechanical Characterization Using Digital Image Correlation; Springer Nature: Dordrecht, The Netherlands, 2022. [Google Scholar]
  14. Molina-Viedma, A.J.; Felipe-Sesé, L.; López-Alba, E.; Díaz, F. High Frequency Mode Shapes Characterisation Using Digital Image Correlation and Phase-Based Motion Magnification. Mech. Syst. Signal Process. 2018, 102, 245–261. [Google Scholar] [CrossRef]
  15. Xu, Y.X.; Juang, J.Y. Measurement of Nonlinear Poisson’s Ratio of Thermoplastic Polyurethanes under Cyclic Softening Using 2d Digital Image Correlation. Polymers 2021, 13, 1498. [Google Scholar] [CrossRef]
  16. Ranjan, R.; Murthy, H. 3D-DIC for Mechanical Characterization of Composite Solid Propellant under Uniaxial Compression. Propellants Explos. Pyrotech. 2024, 49, 1–10. [Google Scholar] [CrossRef]
  17. Choi, J.Y.; Yanamandra, K.; Shetty, A.; Gupta, N. Simultaneous Measurement of Elastic Constants from Dynamic Mechanical Analysis with Digital Image Correlation. Polymer 2022, 242, 124562. [Google Scholar] [CrossRef]
  18. Fruehmann, R.K.; Dulieu-Barton, J.M.; Quinn, S.; Tyler, J.P. The Use of a Lock-in Amplifier to Apply Digital Image Correlation to Cyclically Loaded Components. Opt. Lasers Eng. 2015, 68, 149–159. [Google Scholar] [CrossRef]
  19. Wadhwa, N.; Rubinstein, M.; Durand, F.; Freeman, W.T. Phase-Based Video Motion Processing. ACM Trans. Graph. 2013, 32, 80. [Google Scholar] [CrossRef]
  20. Molina-Viedma, A.J.; Felipe-Sesé, L.; López-Alba, E.; Díaz, F.A. Comparison of Lock-in Correlation and a Novel Periodogram Method for Experimental Multi-Harmonic Thermoelastic Analysis. Mech. Syst. Signal Process. 2022, 164, 108235. [Google Scholar] [CrossRef]
  21. Gdoutos, E.E. Thermoelastic Stress Analysis (TSA). In Experimental Mechanics; Solid Mechanics and Its Applications; Springer: Cham, Switzerland, 2022; pp. 261–267. [Google Scholar]
  22. Molina-Viedma, A.J.; Felipe-Sesé, L.; López-Alba, E.; Díaz, F.A. 3D Mode Shapes Characterisation Using Phase-Based Motion Magnification in Large Structures Using Stereoscopic DIC. Mech. Syst. Signal Process. 2018, 108, 140–155. [Google Scholar] [CrossRef]
  23. Felipe-Sesé, L.; Molina-Viedma, A.J.; Pastor-Cintas, M.; López-Alba, E.; Díaz, F.A. Exploiting Phase-Based Motion Magnification for the Measurement of Subtle 3D Deformation Maps with FP + 2D-DIC. Meas. J. Int. Meas. Confed. 2022, 195, 111122. [Google Scholar] [CrossRef]
  24. Scofield, J.H. Frequency-Domain Description of a Lock-in Amplifier. Am. J. Phys. 1994, 62, 129–133. [Google Scholar] [CrossRef]
  25. Sarrafi, A.; Mao, Z.; Niezrecki, C.; Poozesh, P. Vibration-Based Damage Detection in Wind Turbine Blades Using Phase-Based Motion Estimation and Motion Magnification. J. Sound Vib. 2018, 421, 300–318. [Google Scholar] [CrossRef]
  26. Wadhwa, N.; Wu, H.Y.; Davis, A.; Rubinstein, M.; Shih, E.; Mysore, G.J.; Chen, J.G.; Buyukozturk, O.; Guttag, J.V.; Freeman, W.T.; et al. Eulerian Video Magnification and Analysis. Commun. ACM 2017, 60, 87–95. [Google Scholar] [CrossRef]
  27. DIN EN ISO 527-4; Plastics—Determination of Tensile Properties—Part 4: Test Conditions for Isotropic and Orthotropic Fibre-reinforced Plastic Composites. DIN Deutsches Institut für Normung e.V.: Berlin, Germany, 2023.
Figure 1. General layout of the specimens and fiber orientation relative to the direction of stress in the tensile tests for (A) CF-PC (B) GF-PA6.
Jcs 09 00570 g001
Figure 2. (A) General view of the set up (B) Detail of the specimen and measuring systems.
Jcs 09 00570 g002
Figure 3. Pipeline of the processing performed to obtain results from DIC, DIC + PBMM and DIC + Lock-in.
Jcs 09 00570 g003
Figure 4. Stress–strain results from Test A (A) and B (B) on GF-PA6 material.
Jcs 09 00570 g004
Figure 5. Poisson’s ratio measured along the 200 frames corresponding to four cycles for Test A (A) and Test (B).
Jcs 09 00570 g005
Figure 6. Stress–strain results from Test C (A) and D (B) on CF-PC material.
Jcs 09 00570 g006
Figure 7. Poisson Ratios Measured along the 200 frames corresponding to 4 cycles for Test C (A) and D (B) on CF-PC material.
Jcs 09 00570 g007
Table 1. Table resume of Poisson’s ratio obtained in test A and test B.
Strain GaugeDICDIC + PBMMDIC + Lock-In
AverageAverageSTDAverageSTDAverageSTD
Test A0.03070.05280.06680.14230.4150.04790.0225
Test B0.03730.04560.03910.04440.03020.03460.0210
Average0.03330.04930.05300.04710.2160.04330.01275
Table 2. Table resume of Poisson’s ratio obtained in Test C and Test D for CF-PC material.
DICDIC + PBMM ×2DIC + PBMM ×1DIC + Lock-In
AverageSTDAverageSTDAverageSTDAverageSTD
Test C0.02370.02310.02860.68060.01730.44830.02470.0036
Test D0.02540.00970.02770.02350.01900.10120.01960.0055
Average0.02460.01640.02820.3520.01820.2750.02170.00455
Disclaimer/Publisher’s Note: The statements, opinions and data contained in all publications are solely those of the individual author(s) and contributor(s) and not of MDPI and/or the editor(s). MDPI and/or the editor(s) disclaim responsibility for any injury to people or property resulting from any ideas, methods, instructions or products referred to in the content.