Article

Sustainable Reprocessing of Thermoset Composite Waste into Thermoplastics: A Polymer Blend Approach for Circular Material Design

Materials Processing and Applications Development (MPAD) Center, Department of Mechanical and Materials Engineering, The University of Alabama at Birmingham, Birmingham, AL 35233, USA
*
Author to whom correspondence should be addressed.
J. Compos. Sci. 2025, 9(10), 565; https://doi.org/10.3390/jcs9100565
Submission received: 18 September 2025 / Revised: 5 October 2025 / Accepted: 10 October 2025 / Published: 14 October 2025
(This article belongs to the Special Issue Advances in Continuous Fiber Reinforced Thermoplastic Composites)

Abstract

Thermoset composites provide excellent strength but pose major recycling challenges due to their crosslinked structure. In this study, epoxy–polyurethane–glass fiber (EPG) wastes were mechanically recycled into low-density polyethylene (LDPE), high-density polyethylene (HDPE), and polyamide-6 (PA6) matrices to produce second-generation thermoplastic composites (STCs). Fillers at 10–50 wt% were processed by single-screw extrusion and compression molding, and the resulting composites were comprehensively characterized. For LDPE, the tensile modulus increased by ~286–589% and tensile strength increased by 40–47% at 20–30 wt% loading, though ductility decreased at higher levels. HDPE composites showed a ~347% rise in modulus and ~24% increase in strength, but performance declined with more than 40 wt% filler. PA6 offered the most balanced outcome, retaining ~70% of its neat tensile strength while achieving an ~300% modulus improvement at 40 wt% loading. Thermal stability was strongly enhanced, with char residue at 700 °C rising from 0.4% to 38.7% in PA6 and from ~2.5% to 33–46% in polyolefins. In contrast, crystallinity decreased (e.g., LDPE 62.2% → 23.7%), and impact strength dropped at a loading above 30 wt%. Overall, the results demonstrate that EPG wastes can be reprocessed into functional composites without compatibilizers, with PA6 providing the most robust property retention at high filler contents.

1. Introduction

The use of composite materials is rapidly expanding due to their outstanding mechanical, thermal, and chemical properties, yet their end-of-life management remains a critical environmental challenge [1]. In particular, thermoset composites are indispensable in the aviation, automotive, energy, and construction industries because of their resistance to heat and chemicals, high strength-to-weight ratio, and dimensional stability. However, their crosslinked molecular structure prevents re-melting and makes classical chemical recycling infeasible, creating a major bottleneck for circular material use. While incineration provides energy recovery, mechanical and chemical recycling methods have been investigated to obtain higher value-added products from thermoset waste [2].
Mechanical recycling has received particular attention as a scalable and cost-effective route. Numerous studies have shown that shredded thermoset scraps can be reprocessed into second-generation thermoplastic composites (STCs), either by direct incorporation into thermoplastic matrices or by combining them with other fillers [3]. Pickering [4] provided a comprehensive overview of mechanical and thermal recycling processes, while several experimental works confirmed the potential of thermoset-derived fillers in polyolefins and polyamides. For instance, Kismet et al. [5] demonstrated the use of thermoset powder coating wastes in LDPE, Kouparitsas et al. [6] incorporated recycled short fibers from multiple thermoset sources into PP and ionomer matrices, and Bream and Hornsby [7,8] studied dough molding compound (DMC) and glass–phenolic laminates in PP. Similarly, Shuaib and Mativenga [9] addressed process energy efficiency, Zhang et al. [10] correlated fiber length with mechanical performance in PBT composites, and Gröning et al. [11] highlighted that thermoset fillers could perform well in PA6 but require surface treatments in PP. Collectively, these studies establish that mechanical recycling can restore stiffness and partial strength in thermoplastic composites, though interfacial bonding and scalability remain major challenges.
Despite these advances, the performance of recycled thermoset fillers depends strongly on the fiber morphology, matrix type, and interfacial interactions. Weak filler–matrix adhesion often leads to reduced ductility and inconsistent strength, prompting the use of compatibilizers or chemical surface modifications. However, such treatments increase cost and may limit industrial scalability. DeRosa et al. [12] emphasized that poor bonding remains the dominant cause of strength loss in recycled thermoset composites, underlining the need for alternative solutions.
This study investigates a scalable approach for reprocessing epoxy–polyurethane–glass fiber (EPG) pultrusion wastes into LDPE, HDPE, and PA6 matrices through single-screw extrusion and compression molding at filler loadings of 10–50 wt%. LDPE and HDPE were selected for their wide use, low cost, and established roles in thermoplastic composites, while PA6 was chosen for its higher polarity and thermal resistance, which are expected to improve interfacial compatibility with untreated thermoset fillers. Previous studies have suggested that PA6 can incorporate thermoset waste more efficiently than PP without surface treatments [11,13]. Kumar and Kale [14] further demonstrated that PP/PA6 blends exhibit distinct interfacial behavior, depending on the processing conditions, with PA6 consistently contributing to improved structural performance in polar systems. However, its systematic evaluation in recycled composites remains scarce.
By comparing three matrices under identical conditions, this work aims to clarify how matrix characteristics influence fiber dispersion, interfacial bonding, mechanical performance, and water uptake. The findings contribute to identifying performance windows and alternative recycling strategies.
This approach is consistent with circular economy principles, as it extends material lifecycles, reduces landfill dependency, and minimizes resource consumption. By transforming high-volume industrial waste into functional composites without the need for compatibilizers, this study contributes directly to sustainable manufacturing and reducing environmental impacts.
The novelty of this work lies in demonstrating an industry-relevant and cost-efficient recycling strategy that valorizes thermoset composite waste into high-performance products, while ensuring both scalability and environmental benefits.
Nevertheless, important gaps remain to be addressed in the literature. Although LDPE and PP have been widely studied, systematic investigations of HDPE and especially PA6 under identical conditions are still scarce. In addition, most prior works depend on compatibilizers or costly surface modifications, while compatibilizer-free strategies remain largely overlooked. Furthermore, the combined influences of fiber morphology, interfacial bonding, and matrix polarity have not been fully clarified, and very few studies have applied scalable, industry-relevant processes to compare multiple matrices under controlled conditions.

2. Materials and Methods

2.1. Materials

Epoxy–glass fiber–polyurethane foam-based thermoset composite scraps (EPG), consisting of woven glass fiber-reinforced epoxy layers and a polyurethane foam core, were used as filler material. These sandwich panels, with average thicknesses of 5 mm and 15 mm, were manufactured via vacuum-assisted resin transfer molding (VARTM) and the scraps were supplied by the UAB Materials Processing and Applications Development (MPAD) Center, USA. Mechanically recycled EPG scraps were compounded with three different thermoplastic matrices: high-density polyethylene (HDPE), low-density polyethylene (LDPE), and polyamide 6 (PA6). HDPE and LDPE, both polyethylene-based, differ in molecular architecture: HDPE has a linear chain structure with high crystallinity (>90%), while LDPE features a highly branched configuration with lower crystallinity (~50–60%). HDPE (MaxxamTR FR PE V0 Natural 70; ρ = 1.26 g/cm3, tensile strength at break 8.4 MPa, MFI 15 g/10 min) and LDPE (MaxxamTR FR PE 112 Natural; ρ = 0.97 g/cm3, tensile strength at break 10.3 MPa, MFI 9.0 g/10 min) were supplied by Avient Corporation, Birmingham, AL, USA. The PA6 matrix (Nylene 401D; ρ = 1.14 g/cm3, tensile strength at break 80 MPa) was supplied by Nylene, Henderson, KY, USA.

2.2. Preparation and Processing of Second-Generation Thermoplastic Composites

2.2.1. Fiber Recycling Process

The EPG sandwich panels were mechanically processed into filler material. Initially, the panels were sectioned into approximately 30 × 30 cm pieces using a bandsaw and then subjected to size reduction via a disintegrator (SEM Model 1012/B, SEM, Westborough, MA, USA). The fragments were shredded by rotating blades until they reached dimensions suitable to pass through the integrated sieve openings. Shredding was repeated in multiple cycles to increase particle uniformity and promote effective fiber separation. The processed EPG scraps exhibited a heterogeneous structure of fibrous bundles and fine particles. The recycled material was subsequently characterized in terms of the fiber–matrix ratio, fiber length distribution, and particle size-dependent content across sieved fractions [15].

2.2.2. Preparation of Second-Generation Thermoplastic Composites (STCs)

Figure 1 illustrates the production workflow used for manufacturing STCs reinforced with different proportions of EPG filler in LDPE, HDPE, and PA6 matrices. Neat thermoplastics and EPG scrap materials were blended in predetermined ratios to obtain the composite formulations.
The thermoplastic matrix materials (LDPE and HDPE) were conditioned at 80 °C for 2 h prior to extrusion, whereas PA6 pellets required 6 h of conditioning at the same temperature to ensure sufficient moisture removal. EPG components were pre-cleaned using distilled water at 70 °C to remove surface particulates and soluble contaminants. Following this step, they were stored in insulated containers and thermally conditioned at 90 °C for at least 24 h prior to composite formulation. The composite blend formulations were prepared in sealed containers, and no compatibilizers were added during the blending of thermoplastic matrices with EPG scraps. Table 1 presents the formulations and designations of the prepared second-generation thermoplastic composites (STCs) based on filler content, where the abbreviations ‘L’, ‘H’, and ‘P’ correspond to LDPE-, HDPE-, and PA6-based composites, respectively.
STC sample production was carried out using a single-screw extruder (screw diameter: 60 mm, L/D ratio: 12.5) located at the Materials Processing and Application Development (MPAD) Center, University of Alabama. The screw speed was adjusted between 35 and 50 rpm depending on the EPG content. For formulations containing more than 30% filler, the speed was kept below 40 rpm to ensure melt homogeneity and minimize fiber degradation [16]. Composite components were continuously introduced into the extruder using an adjustable vibration-controlled volumetric feeder (FMC, ABD). Optimal feed rates and temperature profiles for each formulation were determined through pilot trials and initial calibrations. To ensure consistent feeding across varying filler ratios, material-specific feeder speeds were identified using combustion tests, which were repeated at the beginning, middle, and end of the process to confirm system reliability [17]. Gravimetric measurements verified that the EPG content in STCs remained within ±1.5 wt% for formulations with less than 30% filler and within ±2 wt% for those exceeding 30% filler.
Extrusion was carried out using a three-zone barrel temperature profile. For LDPE-based composites, the feed, compression, and mold/press zones were maintained at 170–180 °C, 190–210 °C, and 210–220 °C, respectively. HDPE-based systems were processed at slightly higher temperatures of 180–190 °C, 200–220 °C, and 220–230 °C, while PA6-based composites required elevated settings of 200–220 °C, 230–250 °C, and 260–280 °C. The average residence time in the extruder ranged between 2 and 3.5 min, varying with filler loading and the viscosity of the matrix. After homogeneous melt compounding of the thermoplastic matrix with EPG in the extruder, the melt was transferred to a 152 mm × 152 mm mold and pressed on a 300-ton downforce hydraulic press manufactured by LMG Machinery (Trinks Inc., De Pere, WI, USA), held under pressure for ~2 min, and then allowed to cool in the mold before demolding. Once cooling was complete, the samples were removed and prepared for characterization studies.

2.3. Analysis of EPG Thermoset Composite Scrap Materials

Morphological and particle-scale characteristics of EPG constituents were determined to assess their suitability as reinforcements in thermoplastic composites. Mechanical recycling of epoxy–glass fiber–polyurethane foam thermoset waste produced two principal fractions: readily separable fiber bundles and fine particulates. Particle and fiber attributes, including the size, aspect ratio, dispersion, agglomeration tendency, surface roughness, and fiber–matrix interfacial features, were evaluated using optical microscopy and scanning electron microscopy (SEM). Quantifying these morphological and interfacial attributes informs the selection of processing parameters and helps interpret the mechanical response of the resulting composites [18].

2.3.1. Particle Size Determination (Sieving)

Sieving was performed with ASTM E11 [19]-compliant test sieves (mesh openings 4.75 mm to 106 µm) to classify the recycled EPG by particle size. A pneumatic shaker was operated horizontally for 10 min to promote uniform separation of fine particulates. The mass retained on each sieve was measured on a precision analytical balance (Mettler Toledo AG204; readability 0.1 mg; linearity ± 0.2 mg), and weight fractions were computed to obtain the particle size distribution. Fiber bundles were included to capture the full morphological profile of the EPG filler. Weight-based particle size distributions were determined from five independent EPG scrap batches (n = 5), each sieved individually. Results were reported as means ± standard deviations (SDs), and significant differences among groups were evaluated using one-way ANOVA (α = 0.05).

2.3.2. Measurement of EPG Fiber Lengths

Dimensional measurements were performed on fiber bundles obtained from mechanically recycled thermoset composite scrap. From each batch, n = 180 bundles were randomly selected and mounted on adhesive tape for analysis. Length, width, and thickness were measured using digital calipers and ImageJ Software (Version 1.53n) [20]. Bundle dimensions were reported as means ± standard deviations (SDs). The weighted-average fiber length ( W f l ) was calculated to account for the disproportionate contribution of longer fibers to reinforcement efficiency [10,21] using the following equation:
W f l = i = 1 n   w i X i i = 1 n   w i
where n is the number of terms, x i is data values, and w i is the weight applied to x-values.

2.3.3. Burn-Off Test

The glass fiber content was quantified by gravimetric burn-off in a muffle furnace (Ney 2-160 Series II, Dentsply Sirona, York, PA, USA) in accordance with ASTM D3171 [22]. Tests were performed at three process stages: (i) pre-shredding, (ii) post-shredding (fiber bundle fraction), and (iii) after panel fabrication. The furnace was ramped to 515 °C at 40 °C min−1 and held for 1.5 h, then increased to 560 °C and held for 2 h to ensure complete decomposition of the thermoset resin matrix. The residual ash mass was used to calculate the glass fiber content. The results were reported as means ± standard deviations (SDs) based on replicate measurements.

2.4. Analysis of Second-Generation Thermoplastic Composite Materials

Mixing and screw extrusion induced further fragmentation of EPG particulates, altering their morphology and size distribution in the extrudate [23]. To quantify the glass fiber content in molded STC samples, gravimetric burn-off tests were performed on three specimens cut from different regions of each composite panel, in accordance with ASTM D3171. Samples were heated at 565 °C for 4 h to fully degrade the polymer matrix. The residual ash was cooled, weighed, and used to calculate the glass fiber content. Five replicate tests were conducted per configuration, and the results were reported as means ± standard deviations (SDs). Residual fibers were further examined by microscopy, and fiber lengths were measured using ImageJ. For each batch, n = 125 glass fibers were evaluated to determine the average fiber length.

2.4.1. Thermogravimetric Analysis (TGA)

Sample granules of the produced STCs obtained by cold pressing were tested with a TGA/DTA analyzer (TG 209 F1 Libra, Netzsch, Germany) to characterize their thermal stability. The samples were heated from room temperature to 700 °C with a temperature gradient of 10 °C/min, and measurements were made under a nitrogen atmosphere to obtain mass loss graphs resulting from the temperature increase [5,10].

2.4.2. Differential Scanning Calorimetry (DSC) Analysis

The thermal properties of all STCs were examined using a DSC analyzer (DSC 214 Polyma, Netzsch, Germany). All measurements were carried out under a nitrogen atmosphere. The test pieces were first heated to 240 °C and held at this temperature to eliminate a possible thermal history, then cooled to room temperature, and heated again to 240 °C at a constant rate of 10 °C/min. The crystallization (Tc) and melting (Tm) temperatures of the samples were determined by heating and cooling processes, respectively. A second heating–cooling procedure was also performed to determine the glass transition temperature [5,10].

2.4.3. Optical and Scanning Electron Microscopy (SEM) Analyses of STCs

The morphology, distribution, and composition of EPG particulates within the STC matrix were examined by scanning electron microscopy (FEI Quanta 650 FEG, Thermo Fisher Scientific, Hillsboro, OR, USA) at a 1000× nominal magnification with an accelerating voltage of 25 kV. Prior to imaging, fracture surfaces were sputter-coated with gold under vacuum using a coating system (Desk V, Denton Vacuum, Moorestown, NJ, USA) to improve conductivity. Optical micrographs were additionally acquired using a digital microscope (VHX-6000, VHX-6000, Keyence Corporation, Osaka, Japan) equipped with a wide-range zoom lens (VH-Z100R, Keyence Corporation, Osaka, Japan).

2.4.4. Density and Water Absorption of the STCs

Density measurements of STC samples were performed in accordance with ASTM D792 [24] using a precision balance and a density determination kit (Pioneer Precision, OHAUS Corporation, Parsippany, NJ, USA). Water absorption tests were conducted following ASTM D5229 [25] to assess the void content and moisture uptake behavior. Each test was performed on five different specimens (n = 5), and the results were reported as means ± standard deviations (SDs). Composite specimens (100 × 25 mm) were dried, weighed, and immersed in water under controlled conditions. Water absorption was calculated by comparing the initial and final sample weights.

2.5. Mechanical Properties of the STCs

The tensile properties of STC samples were evaluated in accordance with ASTM D3039 [26] using a crosshead speed of 2 mm/min. Prior to testing, specimens were conditioned at room temperature for 48 h to ensure thermal equilibrium. To ensure statistical reliability, each measurement was performed on five independent specimens (n = 5). The tensile tests were conducted to determine key mechanical parameters, including the tensile modulus, ultimate tensile strength, and yield point.
Flexural properties of STC specimens were evaluated by three-point bending tests in accordance with ASTM D7264 [27]. Test specimens measured 127 mm × 12.7 mm (length × width); the thickness was recorded for each specimen. A span-to-depth ratio of 16 was employed (support span: 64 mm). The crosshead speed was set to 1.7 mm/min. Both flexural and tensile tests were conducted on a universal servo-hydraulic universal testing machine (Instron Model 1331, Instron, Norwood, MA, USA).
The Izod impact test was conducted using a pendulum impact tester (IT 504, Tinius Olsen, Horsham, PA, USA) with a Model Impact 104 recorder. Izod tests were conducted according to the ASTM D256 [28] standard to investigate the impact energy absorption of STCs. The notch of the STC test specimens was cut by a laboratory-type CNC machine. Ten specimens (n = 10) were used for each test. The specimens were tested flatwise normally with a 7.56 Joule impactor and an impact speed of 3.85 m/s. All results were reported as means ± standard deviations (SDs).

3. Results and Discussion

3.1. Assessment of Thermoset Composite Scrap Materials (EPG)

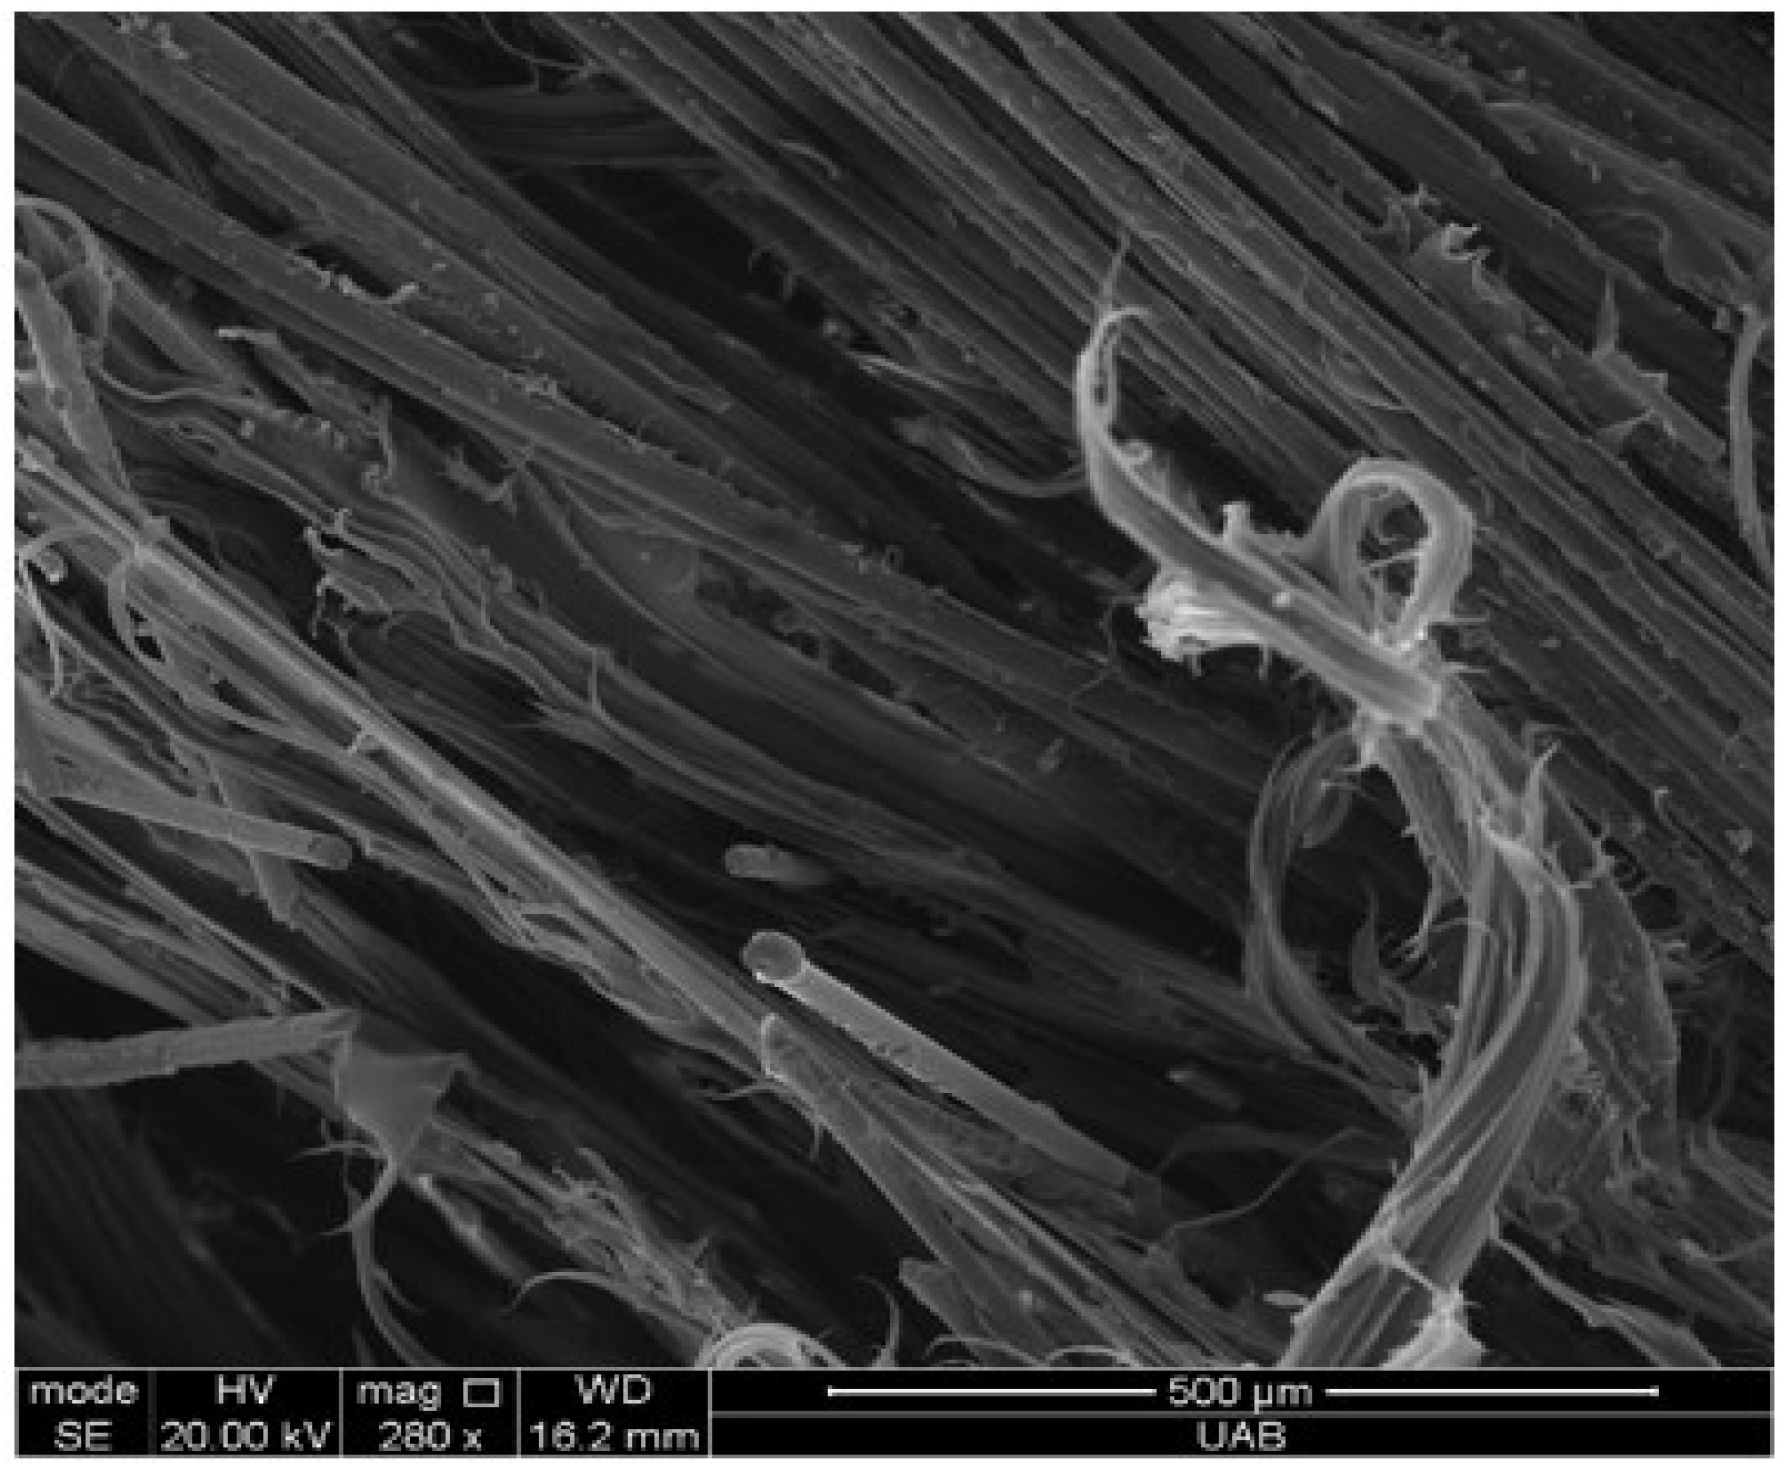
Part of the fiber bundles obtained from the recycled EPGs were still impregnated with a thermoset matrix, as seen in Figure 2. Mechanically recycled glass fiber-reinforced thermoset composite scraps were generally not homogeneous; EPGs were obtained in the form of powder, fiber bundles impregnated by resin, or residual thermoset matrix flakes.
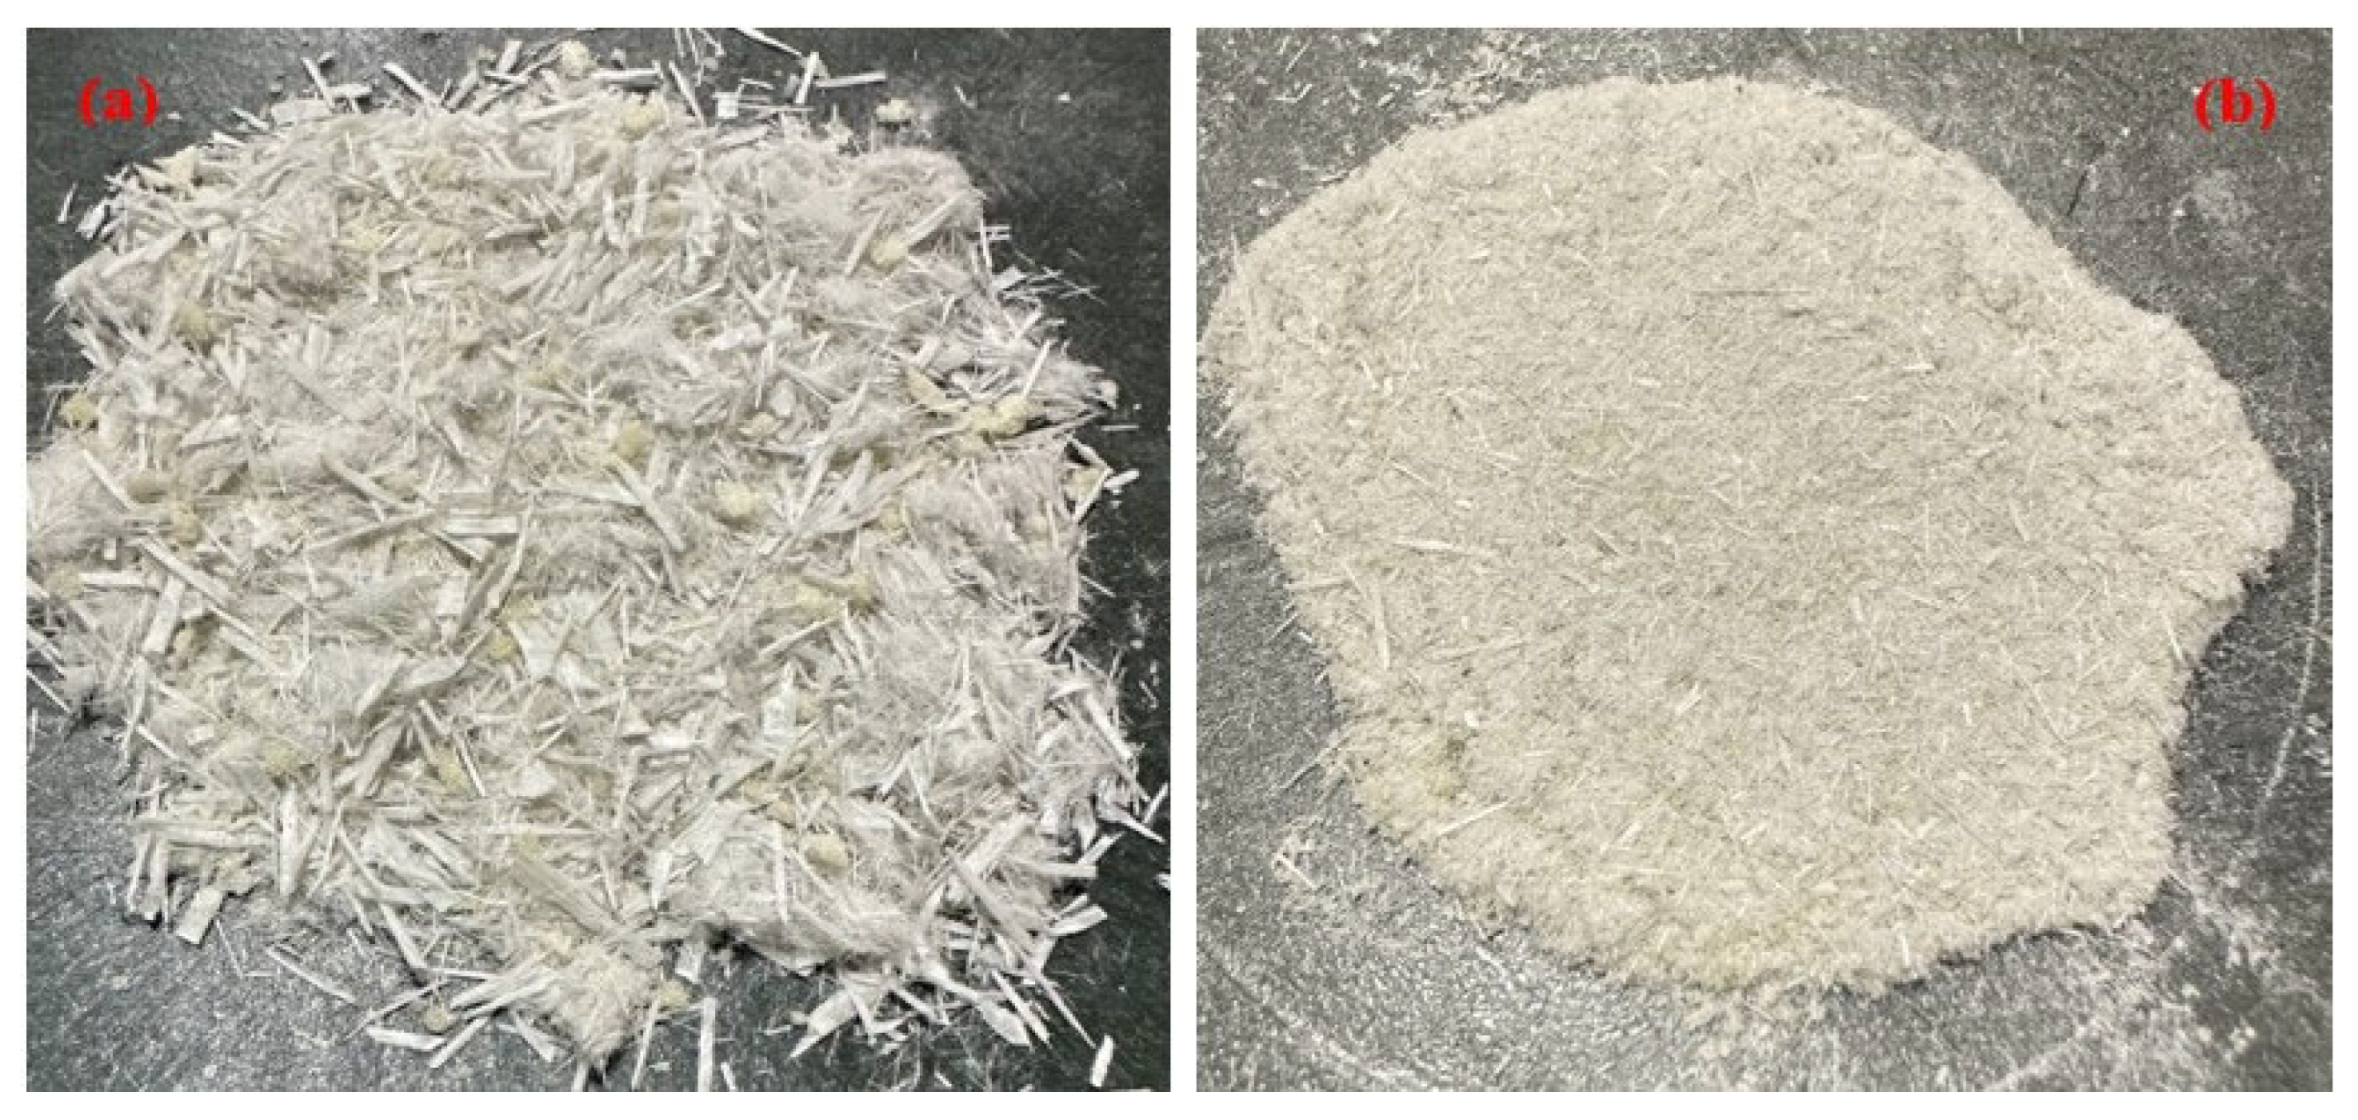
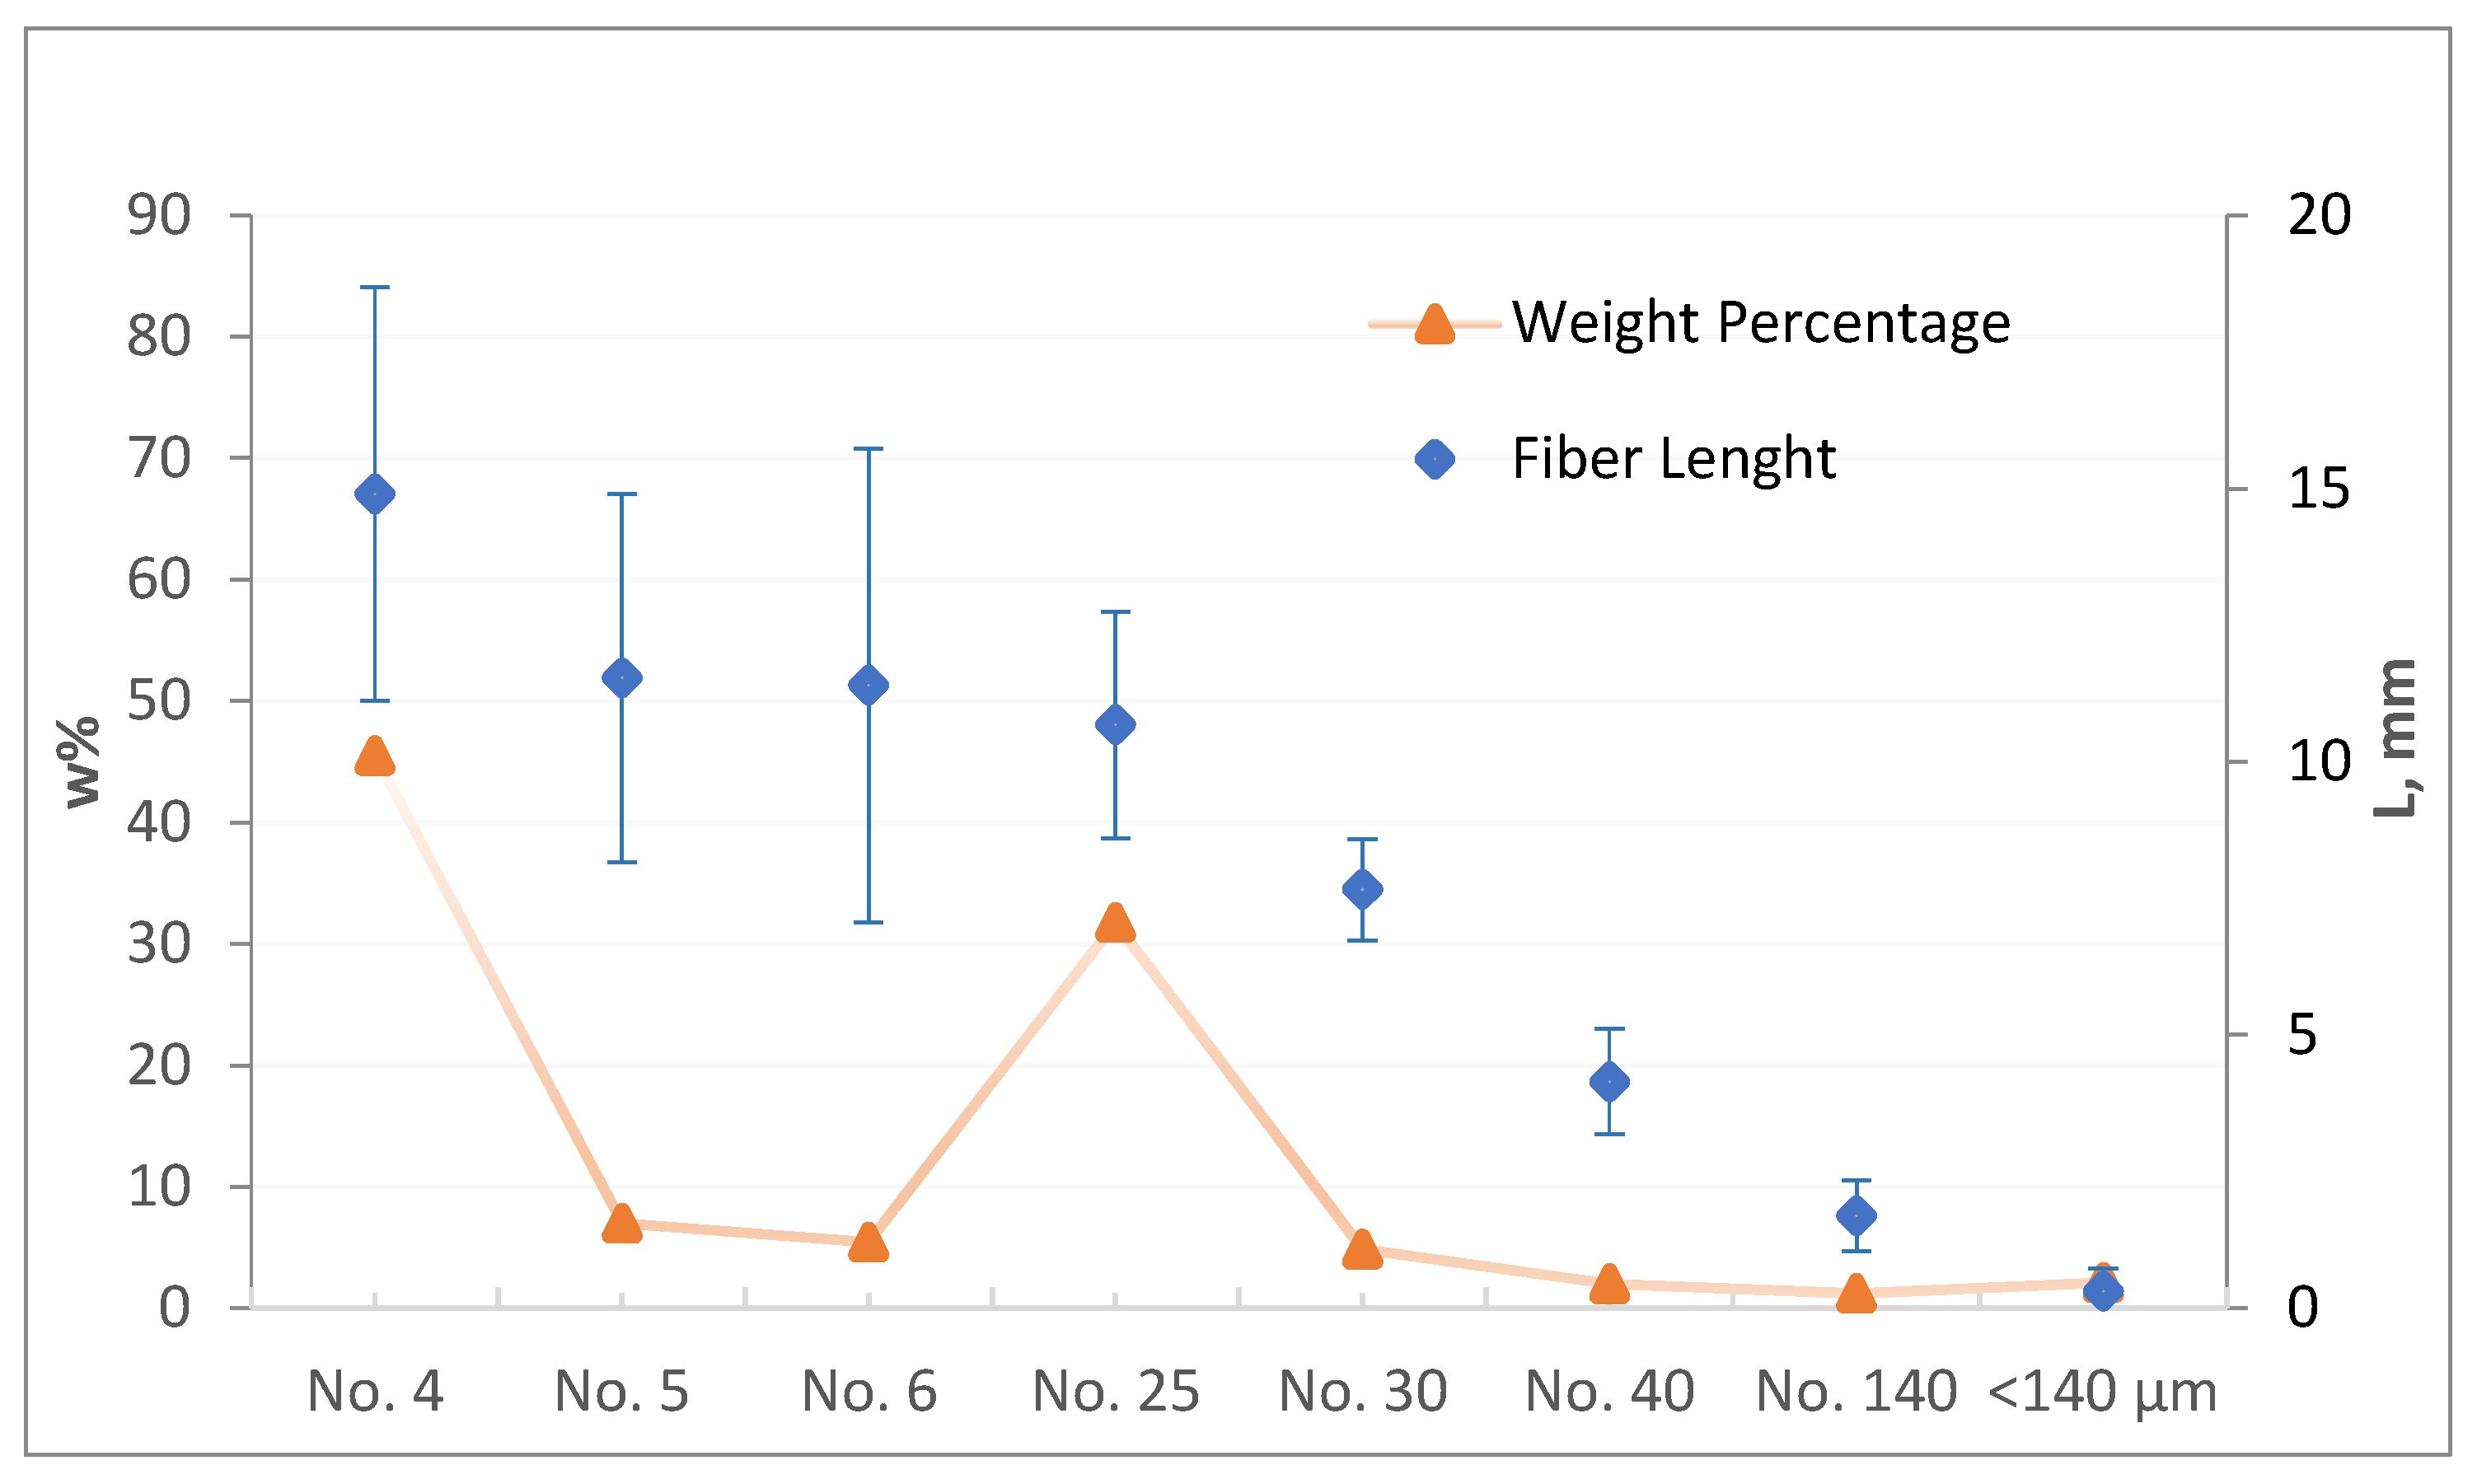
Table 2 lists the material fractions of different-sized particles obtained from the mechanical recycling of EPG thermoset scraps. The fiber length distribution was determined to estimate the reinforcement effect of recycled materials in the composite material. The size of the thermoset scrap was categorized both for their weight fraction and the effective length. Thus, the obtained materials were further classified as fiber bundles (0.71 mm and above) and EPG powders (below 0.71 mm), as shown in Figure 3. Fiber bundles are mostly made up of large flakes and platelets that retain the woven fabric morphologies, while EPG powders are made up of glass and thermoset particles with lower aspect ratios. These fiber bundles and woven platelets were typically one or two plies thick.
The results for the length ranges and weight distribution analysis of the EPG bundle fractions obtained by recycling are presented in Figure 4. The particle size analysis of recycled EPGs revealed that 89.74% were larger than 6 mm, 8.13% were between 1–6 mm, and 2.13% were smaller than 1 mm. The measurements over a wide range showed that the average fiber length was about 8 mm. The fact that EPG fiber lengths span a wide spectrum from <0.1 mm to 21 mm creates complexity in characterizing fiber lengths.
The geometric attributes of the fibers can serve as a basis for identifying correlations between their spatial distribution and the overall performance of the composite material. Fragmentation behavior follows a structured pattern rather than a random pattern and is shaped by factors such as the initial fiber orientation, resin encapsulation level, and bundle geometry. Consequently, the particle size distribution serves merely as a proxy for estimating the fiber length variation [6]. Some mid-range fiber length intervals (e.g., 5.8–8.6 mm, 2.8–5.6 mm, and 0.1–1.1 mm) tend to be underrepresented, whereas other size ranges occur more dominantly. It is important to recognize that the ASTM E11-based classification is affected not only by the fiber length but also by the cross-sectional geometry. Although these fibers may have greater actual lengths, their flattened geometry or partial resin coverage—along with the high aspect ratio of fiber bundles and EPG powders—allow them to pass through sieve openings smaller than their true length. This leads to deviations from the expected size distribution and results in an underestimation of the actual fiber length [7]. The dimensional properties of EPG are expected to have a significant impact on the performance of thermoplastic composites. Furthermore, although increasing the particle size of the EPG can provide a higher reinforcing effect, it can also promote higher stress concentrations if they are not evenly distributed within the matrix, which can lead to a decrease in strength [10,29].
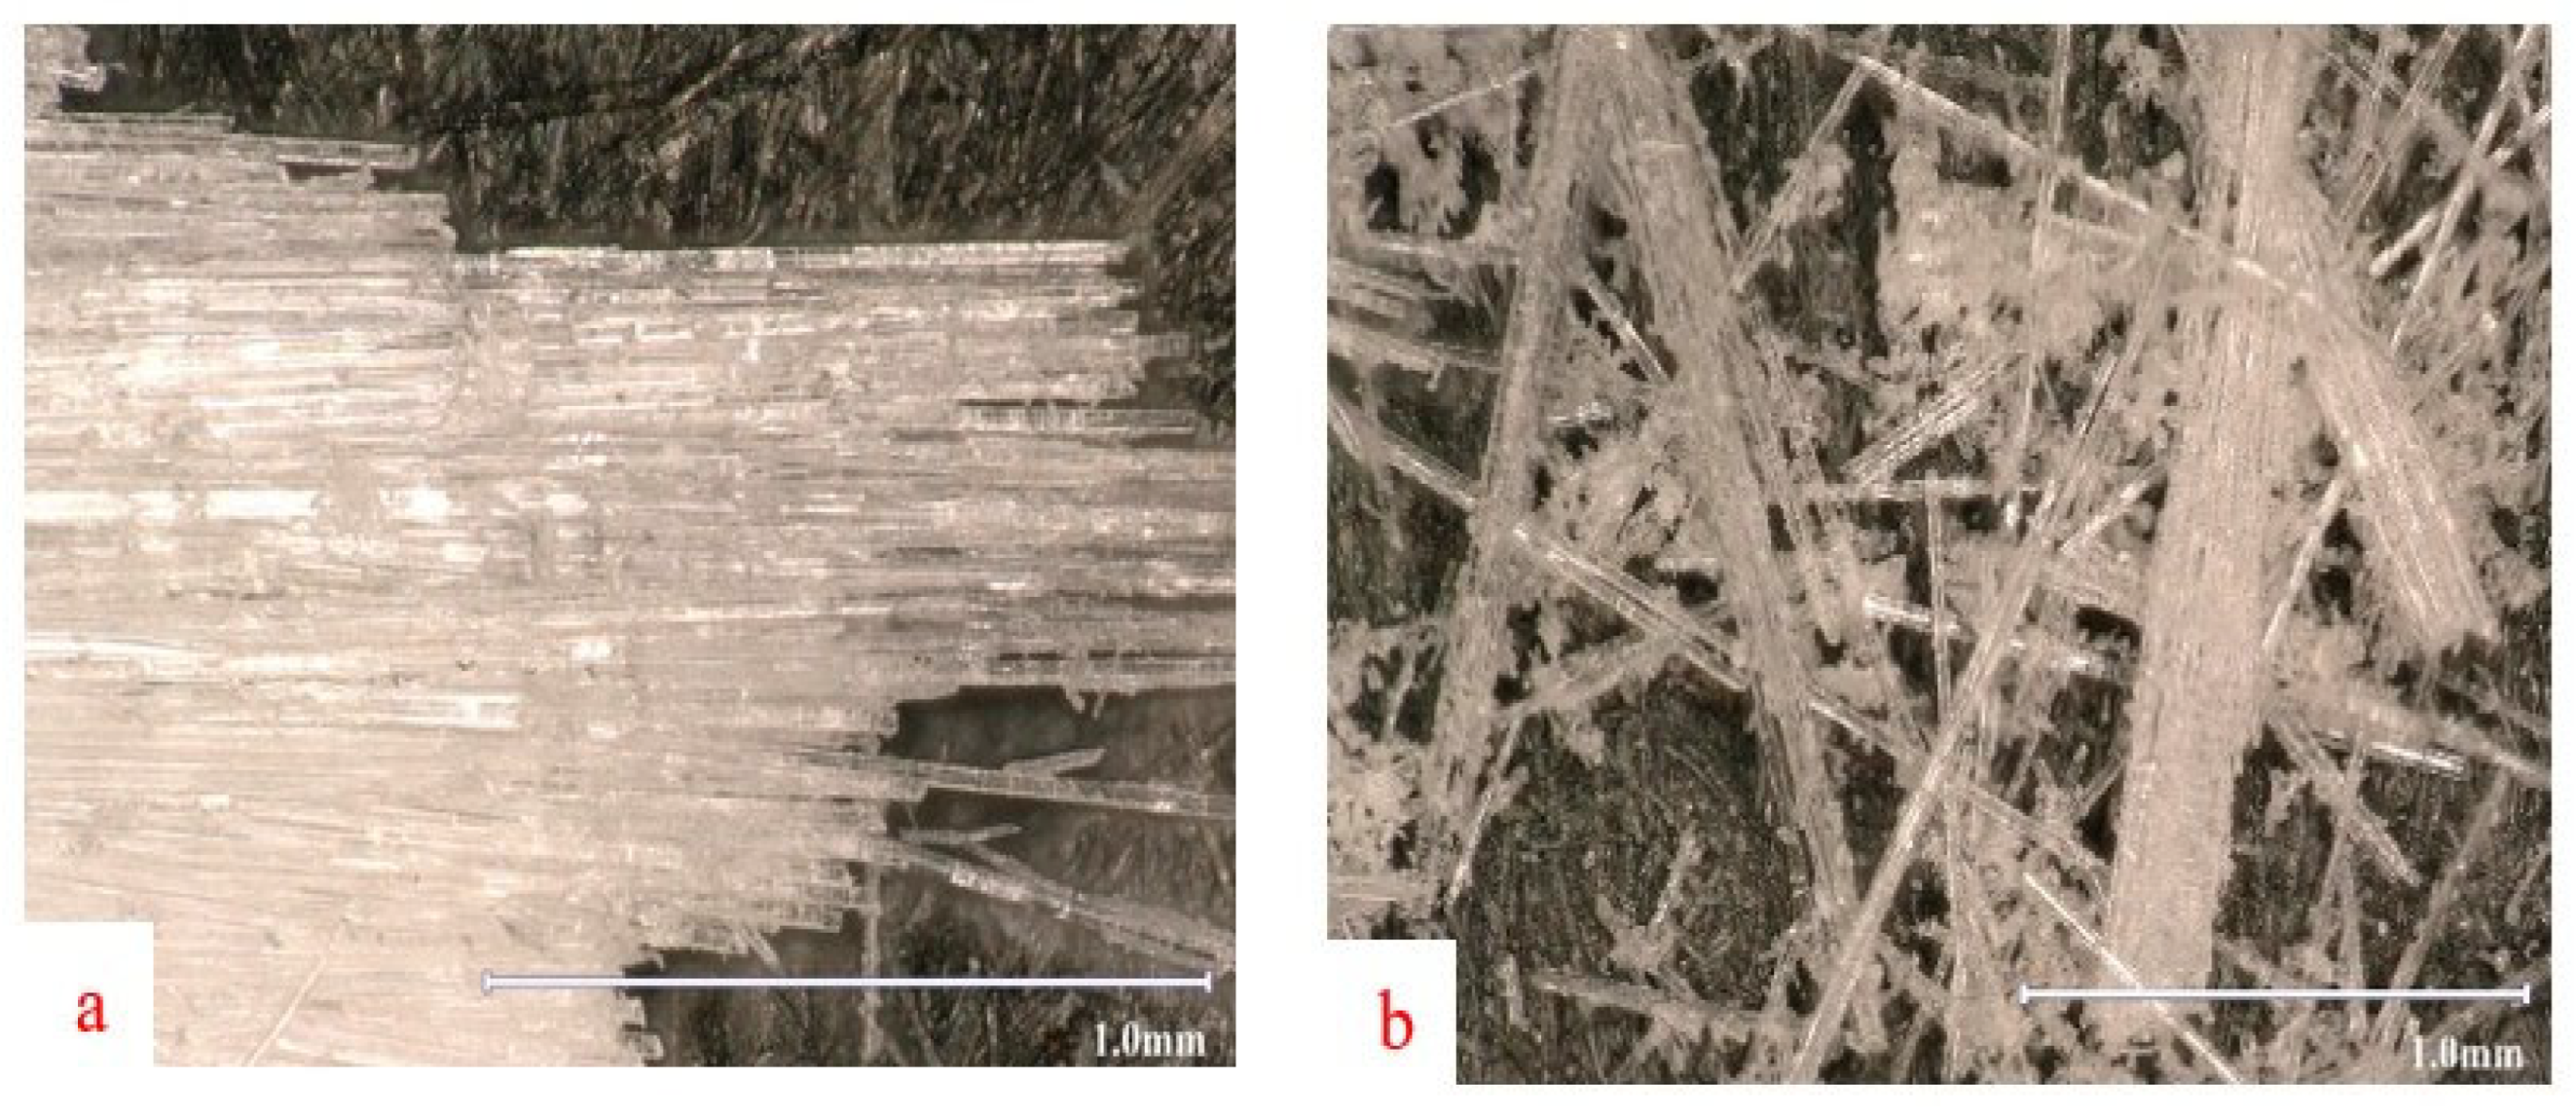
The matrix material remaining on the fiber surfaces is likely to reduce the effectiveness of the surface treatment applications to the underlying fiber bundles and have a poor load transfer ability. The fiber attritions and fragmentation during crushing also have negative effects on the strength of the composite. Recycled fiber bundles with low matrix residue are important for the interfacial bonding between the matrix and the fiber to be effectively established for new composite products. The surface condition of the EPG bundles obtained by recycling is shown in Figure 5a,b.
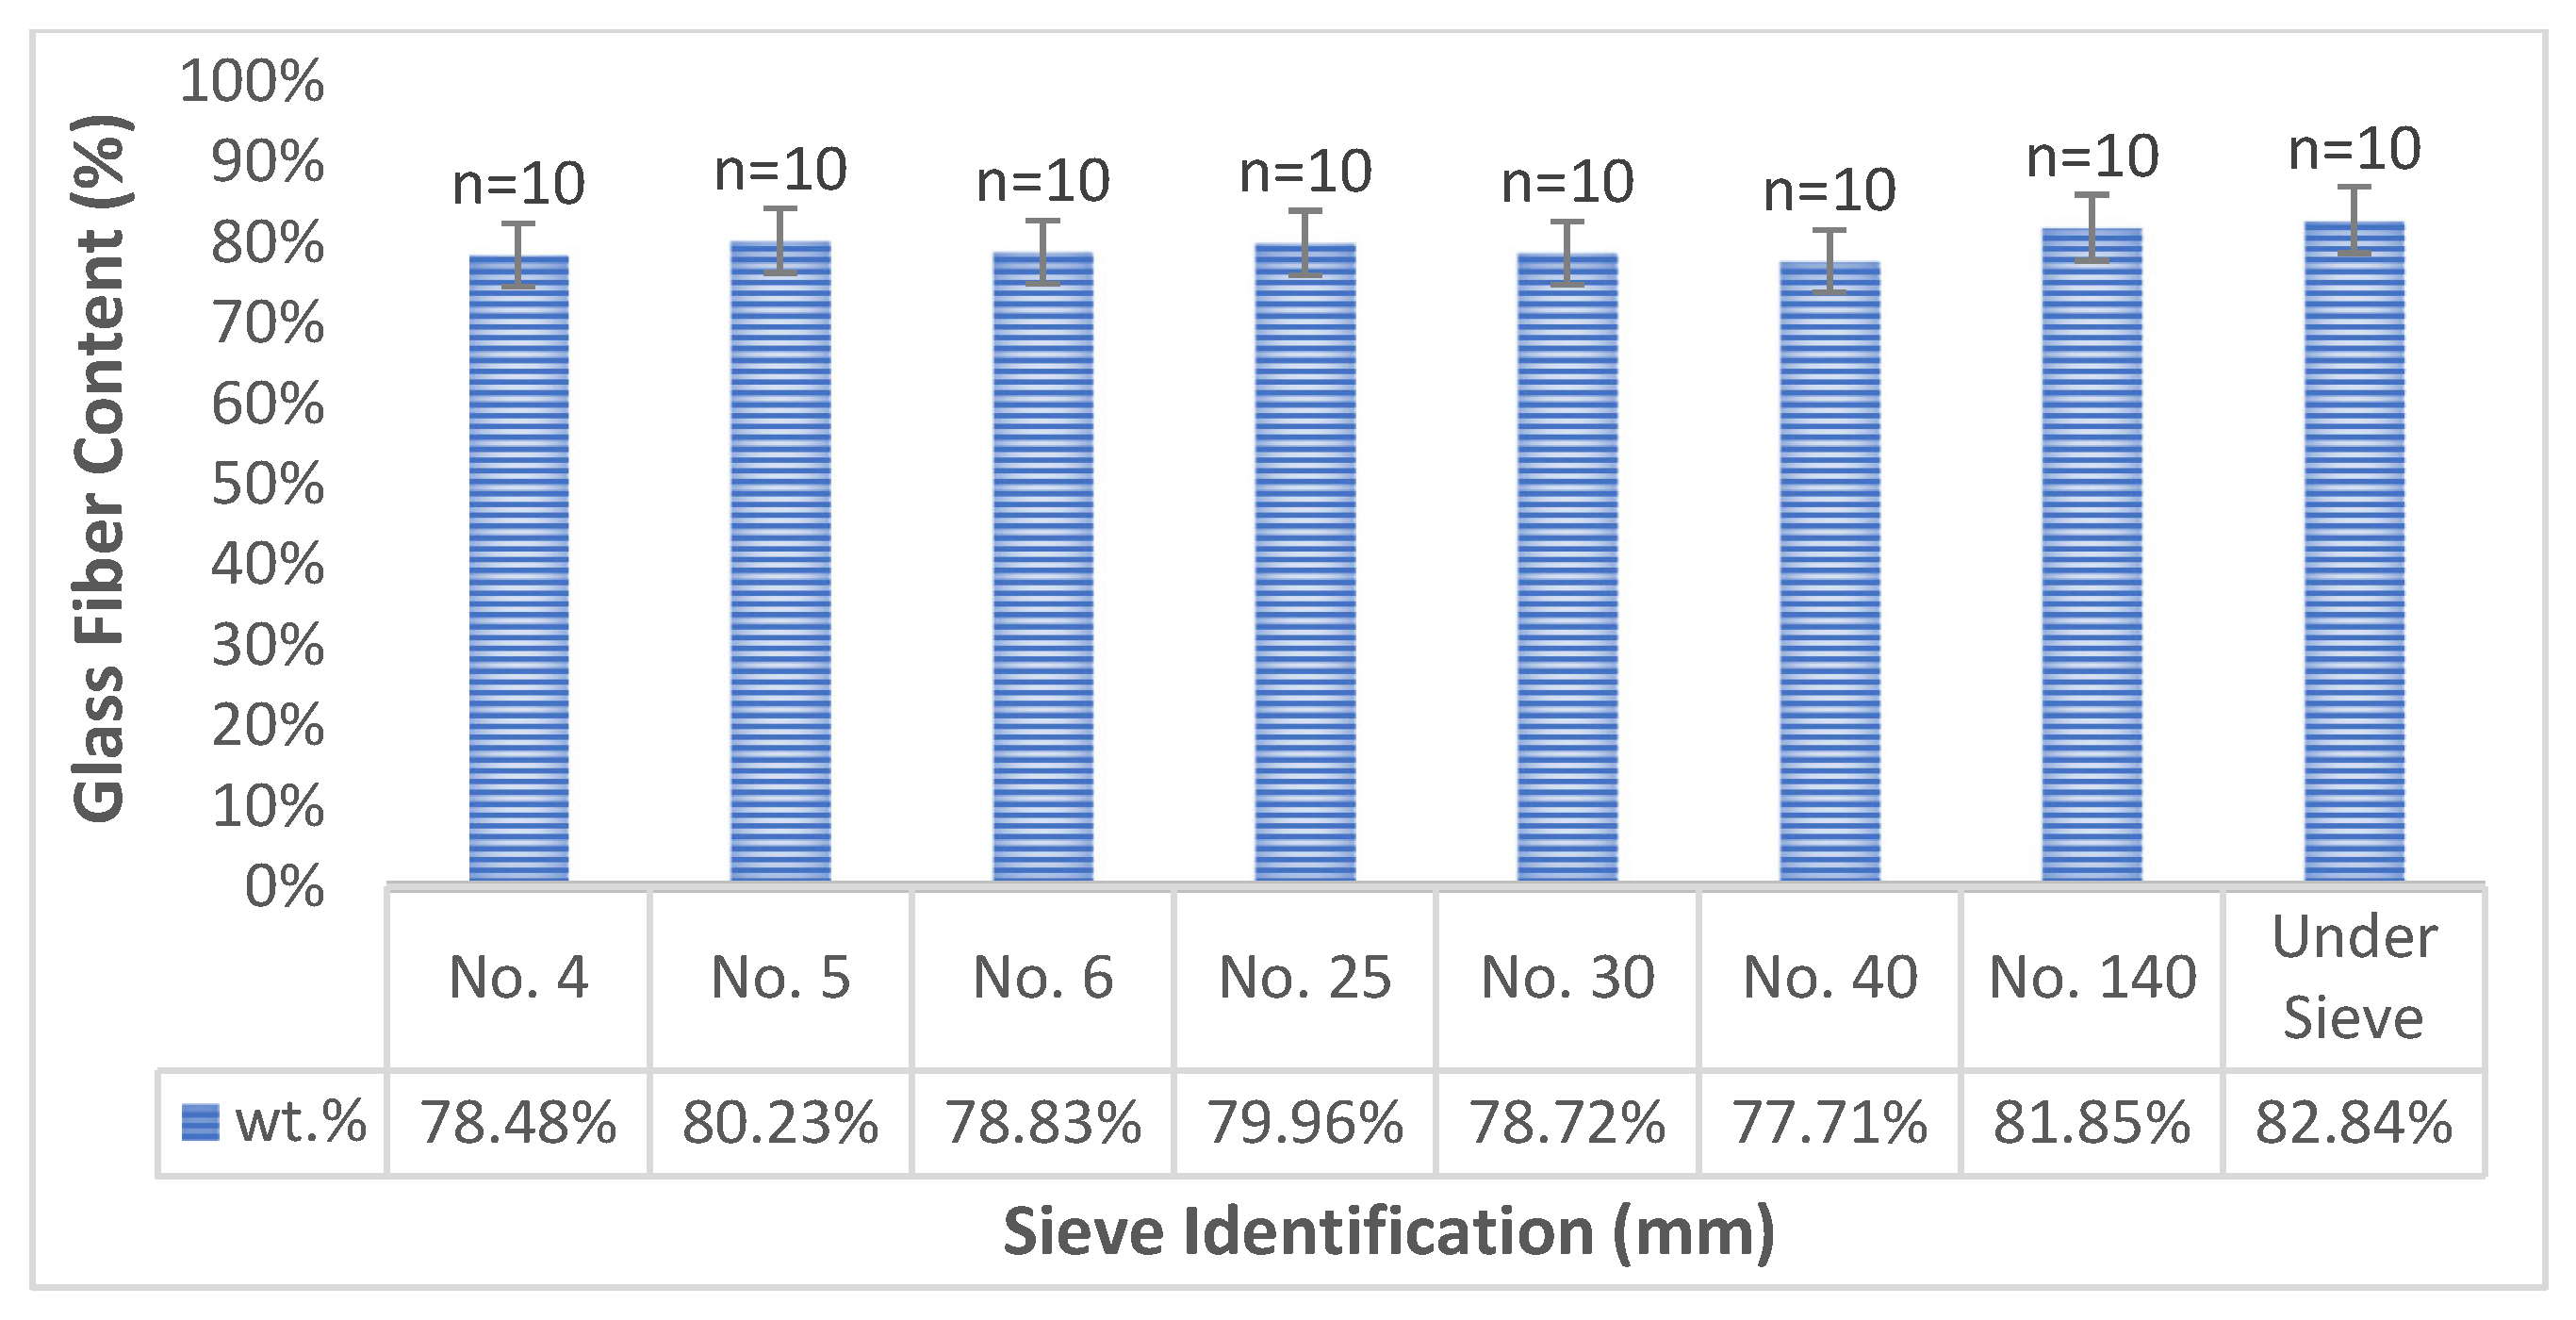
The glass fiber content of recycled thermoset composite materials sieved through mesh sizes ranging from No. 4 to No. 140 was quantified and the corresponding results are presented in Figure 6. After sieving, the recycled EPG waste contained, on average, 79.83 wt% glass fiber and 20.17 wt% polymer matrix. The amount of polyurethane in the content of materials with sieve numbers smaller than No. 30 was determined to be less than 0.01% by weight. Prior to sieving, mechanically shredded EPG recyclate consisted of 77.63 wt% glass fiber and 22.37 wt% polymer matrix. The polyurethane-free glass fiber-reinforced epoxy sheet waste contained 80.78 wt% glass fiber and 19.22 wt% thermoset matrix The polyurethane ratio in the total material content was 2.2% by weight, and this ratio reached negligible (<0.01%) figures as the particle size decreased. The glass fiber content in the EPG material increased in finer sieve fractions. For example, the glass fiber content was 77.71 wt% in the No. 40 fraction, 81.85 wt% in the No. 140 fraction, and 82.84 wt% in the under sieving fraction. As the sieve opening decreased, a pronounced depletion of polyurethane in the EPG material was observed; specifically, material passing through the No. 30 sieve contained < 0.01 wt% polyurethane. For this reason, it is possible that fiber bundles with a higher weight percentage could be reduced in size by a second mechanical recycling process and a more effective interfacial interaction could be achieved [7,8,9]. The size and surface morphology of EPG particles can critically influence the mechanical properties of STC systems. In particular, large EPG fragments act as stress concentrators within the matrix, diminishing load transfer efficiency and ultimately reducing composite strength [30]. The particle size distribution of the recovered EPG does not reliably predict the filler size/dispersions state in the final composite because fragmentation continues during single-screw extrusion [17,31]. Nonuniform thermoset residue on the fibers can raise interfacial friction, trigger microcracking, and degrade composite strength [32].

3.2. Assessment of Second-Generation Thermoplastic Composite Materials

The filler ratios of STC mixtures were prepared according to the amount of thermoset matrix-coated glass fiber bundles and powders rather than the amount of pure glass fiber. Filler loading in the composite does not directly reflect the true glass fiber fraction; therefore, additional measurements were performed to determine this value. The glass fiber content was quantified using a gravimetric burn-off method, and the results are reported in Table 3. To increase statistical reliability, burn-off tests were conducted with ten replicates (n = 10) for each composite group.
Variations in the EPG content and matrix type influence both the mean fiber length and its distribution. The resulting increase in standard deviation signals greater structural heterogeneity and more irregular fiber–matrix interactions. During single-screw extrusion, EPG fiber bundles were exposed to high shear stresses, causing substantial abrasion, length attrition, and size reduction to granules. Interfacial friction at the fiber–matrix boundary further promoted the attrition of some fibers into micron-scale fine particulates [33]. This correlates with the observations from Yan et al. [34], for which they reported that the fiber length will be shortened during processing, regardless of the initial length, and that initially thinner fibers will result in fibers with higher L/D ratios after processing. It was observed that the fiber lengths of the EPG were shortened as the blend bore high tensile and shear stresses when the single screw advances during the extrusion process. Figure 7 presents the distribution of the sample-mean glass fiber length (mm) in STCs, with each mean calculated from measurements of 125 individual fibers per sample after burn-off tests.
Post-extrusion measurements revealed that the average fiber lengths in EPG-filled LDPE, HDPE, and PA6 matrix composites were 6.71 mm, 5.61 mm, and 4.95 mm, respectively. The degree of EPG wear varied across the three thermoplastic matrices, likely due to differences in their material properties. Key contributing factors include the processing temperature, fiber loading level, structural compatibility between thermoplastics and thermoset waste, thermal stability, and the physical morphology of the thermoset fragments. Additionally, the random distribution of EPG within the matrix and localized variations in fiber loading may influence the degree of wear and contribute to easier deformation of STCs due to their morphology [35].

3.2.1. Assessment of Thermogravimetric Analysis (TGA/DTA)

TGA tests were performed to study the effects of EPG thermoset scraps on the thermal degradation behavior of LDPE, HDPE, and PA6 matrix materials. Figure 8a–c show the TG curves of thermal degradation of STCs prepared at 50% and 60% EPG filler ratios of three different matrix materials. To better understand the curves, the results of the 5% mass loss (T5%) of the pure matrix and STCs, the maximum mass loss rate temperatures (Tmax1 and Tmax2) taken from the derivative thermogravimetric (DTG) curves, and the amount of charred residue remaining at 700 °C are shown in Table 4.
The thermal degradation processes of the L4, L5, H4, H5, P4, and P5 composites exhibit two stages. The first stage of degradation of L4 and L5 composites occurs between 285 and 330 °C. The second stage occurs between 330 and 490 °C with a rapid mass loss [36]. Compared to LDPE, the lowest onset temperature (T5%) is 343.4 °C and Tmax2 is 491.1 °C. This is the effect of the thermal degradation of polyurethane and epoxy thermoset materials contained in EPG resulting from interaction with LDPE [37,38]. For the H4 and H5 composites, the first stage of degradation is between 330 and 400 °C, and the second stage is between 400 and 490 °C. For the P4 and P5 composites, the first stage of degradation is between 230 and 325 °C, and the second stage is between 325 and 460 °C.
The differences in the degradation temperatures of STC materials are due to the change in process temperatures and duration, depending on the type of matrix material and the filler ratio. As the EPG filler amount increases, the process times to obtain a homogeneous mixture also increase. This increase affects the interaction of the polyurethane and epoxies in the EPG with the matrix and, therefore, the thermal decomposition temperatures. The above results show that the thermal stability of pure polymer matrix materials can vary significantly depending on the amount of EPG dispersion and its distribution in the mixture.

3.2.2. Assessment of Differential Scanning Calorimetry (DSC) Analysis

The crystallization and melting behaviors of the STCs prepared according to different filler ratios of EPG thermoset scraps were investigated using DSC. Representative DSC thermograms of STC materials (L4, L5, H4, H5, P4, and P5) prepared with 40% and 50% EPG scrap thermoset materials are shown in Figure 9a–c.
Table 5 shows the onset melting temperature (Tom), melting temperature (Tm), crystallization temperature (Tc), and percent crystallinity (Xc) of the pure matrix and STCs. The crystallinity of LDPE, HDPE, and PA6 polymer materials was 62.20%, 56.40%, and 31.10%, respectively. A regular molecular structure and a high degree of crystallinity were observed. With the addition of EPG thermosets into the polymer, the crystallinity rates of L4 and L5 decreased to lower levels of 30.56% and 23.73%, respectively.
Similarly, the crystallinity of the H4 and H5 composites decreased to 47.42% and 44.29%, respectively, and the crystallinity of the P4 and P5 composites decreased to 27.18% and 23.07%, respectively. It can be said that with these modifications, the regular crystal structure of the polymers was disrupted, and a more amorphous structure formed [39]. This change indicates that the mechanical strength and thermal stability of the L4 and L5 composites may have decreased [40]. H4 and H5 are more flexible, and there may be improvements in impact resistance, but there may be some decrease in strength properties [41]. The P4 and P5 composites are expected to exhibit better impact resistance and flexibility but lower heat resistance properties [42].

3.2.3. Assessment of the Density and Moisture Absorption of STCs

The density measurement results for all STCs are shown in Table 6. It was seen that the density values increased with an increase in EPG content in all composites. In addition, LDPE matrix composites showed a lower density change than HDPE and PA6 matrix composites. As the amount of filler in STCs increased, the standard deviation of the density values also increased. Since the measurements were taken from ten different places on the sample test plates, it can be said that the filler material lost its homogeneous distribution feature.
The water absorption behavior of STCs was evaluated through immersion testing, with the results presented in Figure 10. Tests were conducted using deionized water (≤1 µS/cm) at 23 ± 2 °C. The procedure followed general ASTM D5229 guidelines, where specimens were periodically weighed until saturation equilibrium was reached. Prior to testing, sample surfaces were cleaned and dried with ethanol, and all mass measurements were performed with a resolution of 0.1 mg. Water absorption in polymer composites occurs as a result of swelling of the matrix due to voids in the internal structure, the breakdown of the polymer chains of the unsaturated polymer by the reaction of water, and the plasticization of the matrix [43,44]. Although glass fibers hinder moisture diffusion, a high fiber content and irregular microvoids promote water ingress, leading to cracking, relaxation, and fiber erosion in STCs [45,46]. Water absorption across the three composite systems initially increased rapidly, then gradually slowed as equilibrium was approached [42,45]. This behavior corresponds to the Fickian diffusion model, where water molecules penetrate voids within the matrix and at the fiber–matrix interface. This study utilized a single thermoset composite waste (EPG) as the filler in three distinct thermoplastic matrices. By varying the blend ratios between polymer and filler, the influences of polar regions and the void content on water absorption were identified. Lower EPG loadings, particularly in LDPE and HDPE matrices with hydrophobic characteristics, were found to enhance long-term performance by limiting moisture ingress and reducing degradation risks [47,48].
Figure 10a–c illustrate the water absorption profiles of the L, H, and P series composites, showing monotonic uptake followed by saturation. Composites with 40 and 50 wt% EPG (L4, L5, H4, H5, P4, and P5) reached equilibrium more rapidly, plausibly due to voids and capillary pathways created by fragmented thermoset regions. In contrast, lower-EPG samples (L1, L2, H1, and H2) exhibited minor fluctuations in their uptake curves, likely reflecting the non-uniform filler dispersion and particle size variability Lower filler-loading PA6 samples (P1–P2) showed near-linear uptake; at mid-loadings (L3, H3, and P3) uptake accelerated, with L3–H3 approaching saturation while P3 continued over the window. To quantify early-stage diffusion, the data were normalized (Mt/M∞) and plotted against √t; the initial linear region was fitted by least squares, and the slope was used to estimate the diffusion coefficient, as reported in Table 7.

3.3. Assessment of the Morphological Characteristics of STCs

3.3.1. Optical Microscopy Analysis

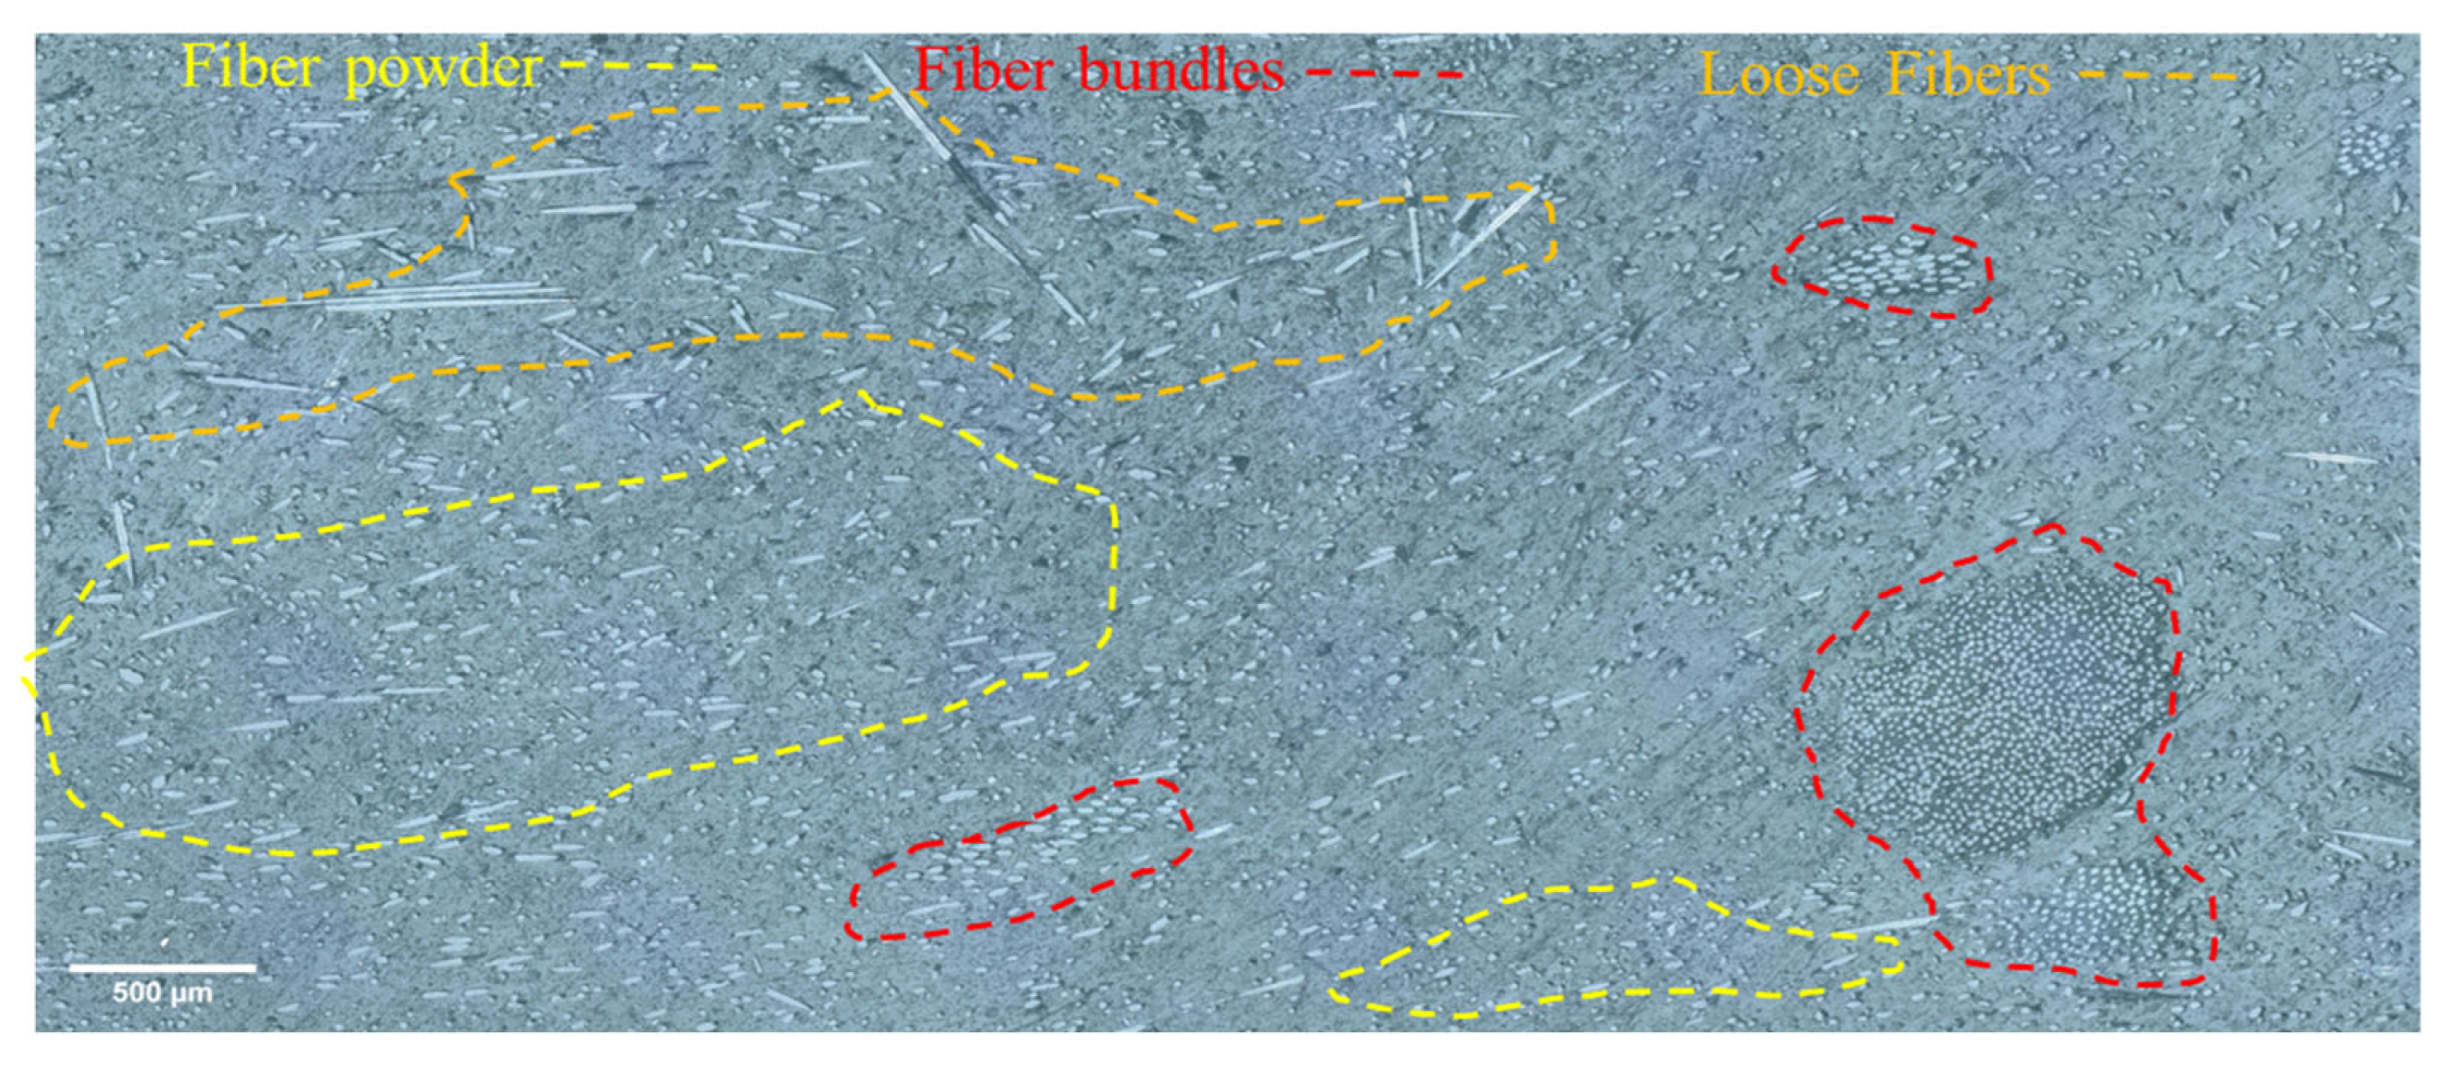
Microstructural analyses were performed to obtain information about the distribution of EPG fiber bundles and EPG powders in the matrix. Optical studies were performed on cross-sectional samples of the L3, L4, L5, H4, H4, H5, P3, P4, and P5 composites with high filler ratios from three matrix types. The images of EPG fiber bundles, loose fibers, and particles randomly distributed in the matrix are shown in Figure 11. The observed anisotropy can result in localized stresses over the fibers and the matrix material that could promote premature failure onset.
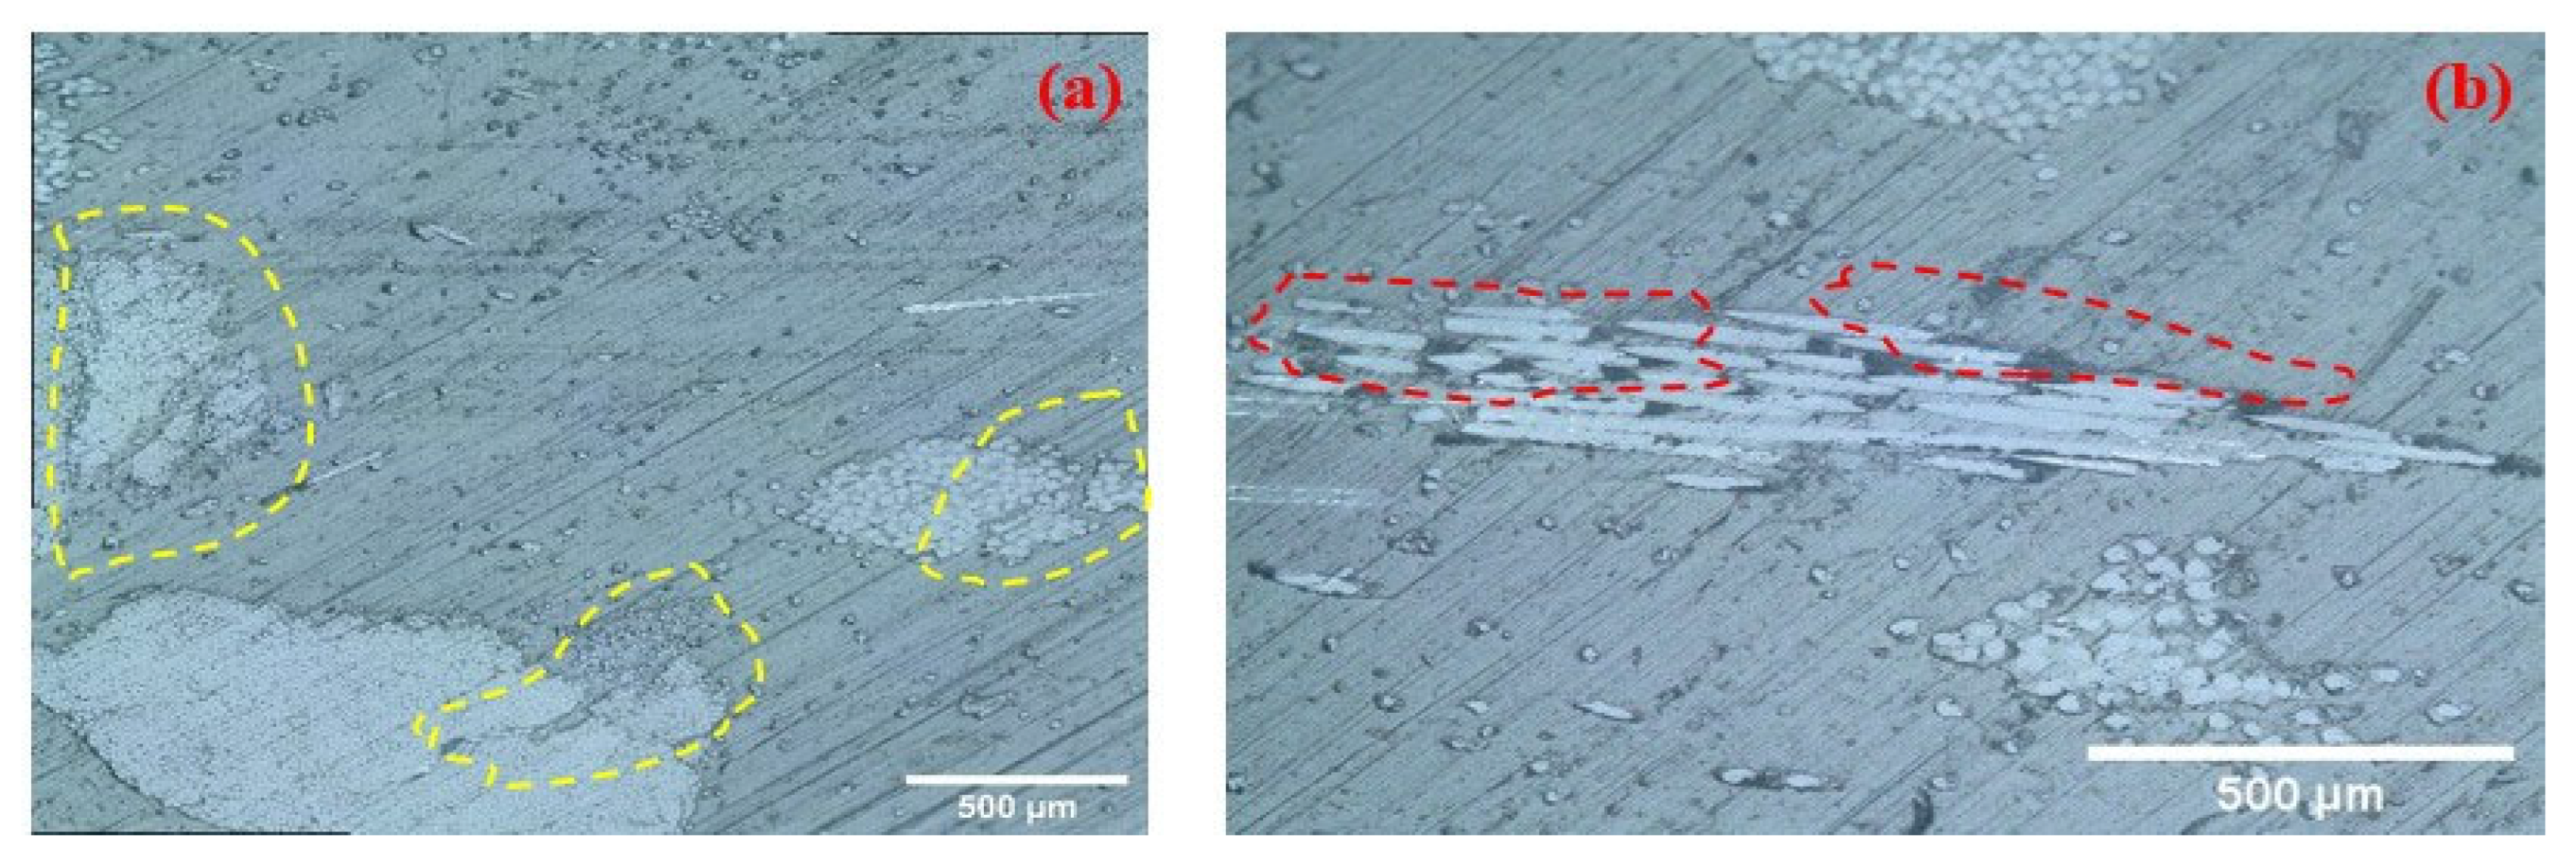
There is also the possibility of microvoids occurring between the glass fibers inside the fiber bundles in the internal structure of STCs. In Figure 12a,b, the dark areas in the fiber bundles are considered the matrix material between the glass fibers forming the EPG fiber bundles. The tendency of the glass fibers to slide over each other during the mixing of the EPG fiber bundles with the matrix material is shown in Figure 12a. The fiber bundles were impregnated partially with their original thermoset and partially with the thermoplastic matrices. This situation causes an increase in the shear stresses due to poor material adhesion. The longitudinal section view of a fiber bundle given in Figure 12b shows the gaps and interaction between the glass fibers and their surrounding fiber–matrix interfaces. The random distribution of the fiber bundles in the matrix increases the tensile load in its internal structure and causes a loss of strength.
Figure 13a shows that the EPG inside STCs is not distributed homogeneously. The mechanical responses of the STCs can vary depending on the loading type and direction, as the load-bearing characteristics of the fiber within the matrix volume can vary. A composite loading status over the STCs can facilitate crack initiation and propagation over different types of interfaces and cause premature failure. Figure 13b shows the thermoset material between the glass fibers of the fiber bundle. It is also seen that EPG fiber bundles, powders, and particles adhere well to matrix materials. The interfacial interaction between the outer surface of EPG and the matrix material is also evident.
In all sample types, a randomly distributed heterogeneous structure was observed, where EPG was found in different forms within the matrix material. The increase in the filler ratio also increased the variety of undesired microstructures contained in the samples (more than 30% filler).

3.3.2. Scanning Electron Microscopy Analysis

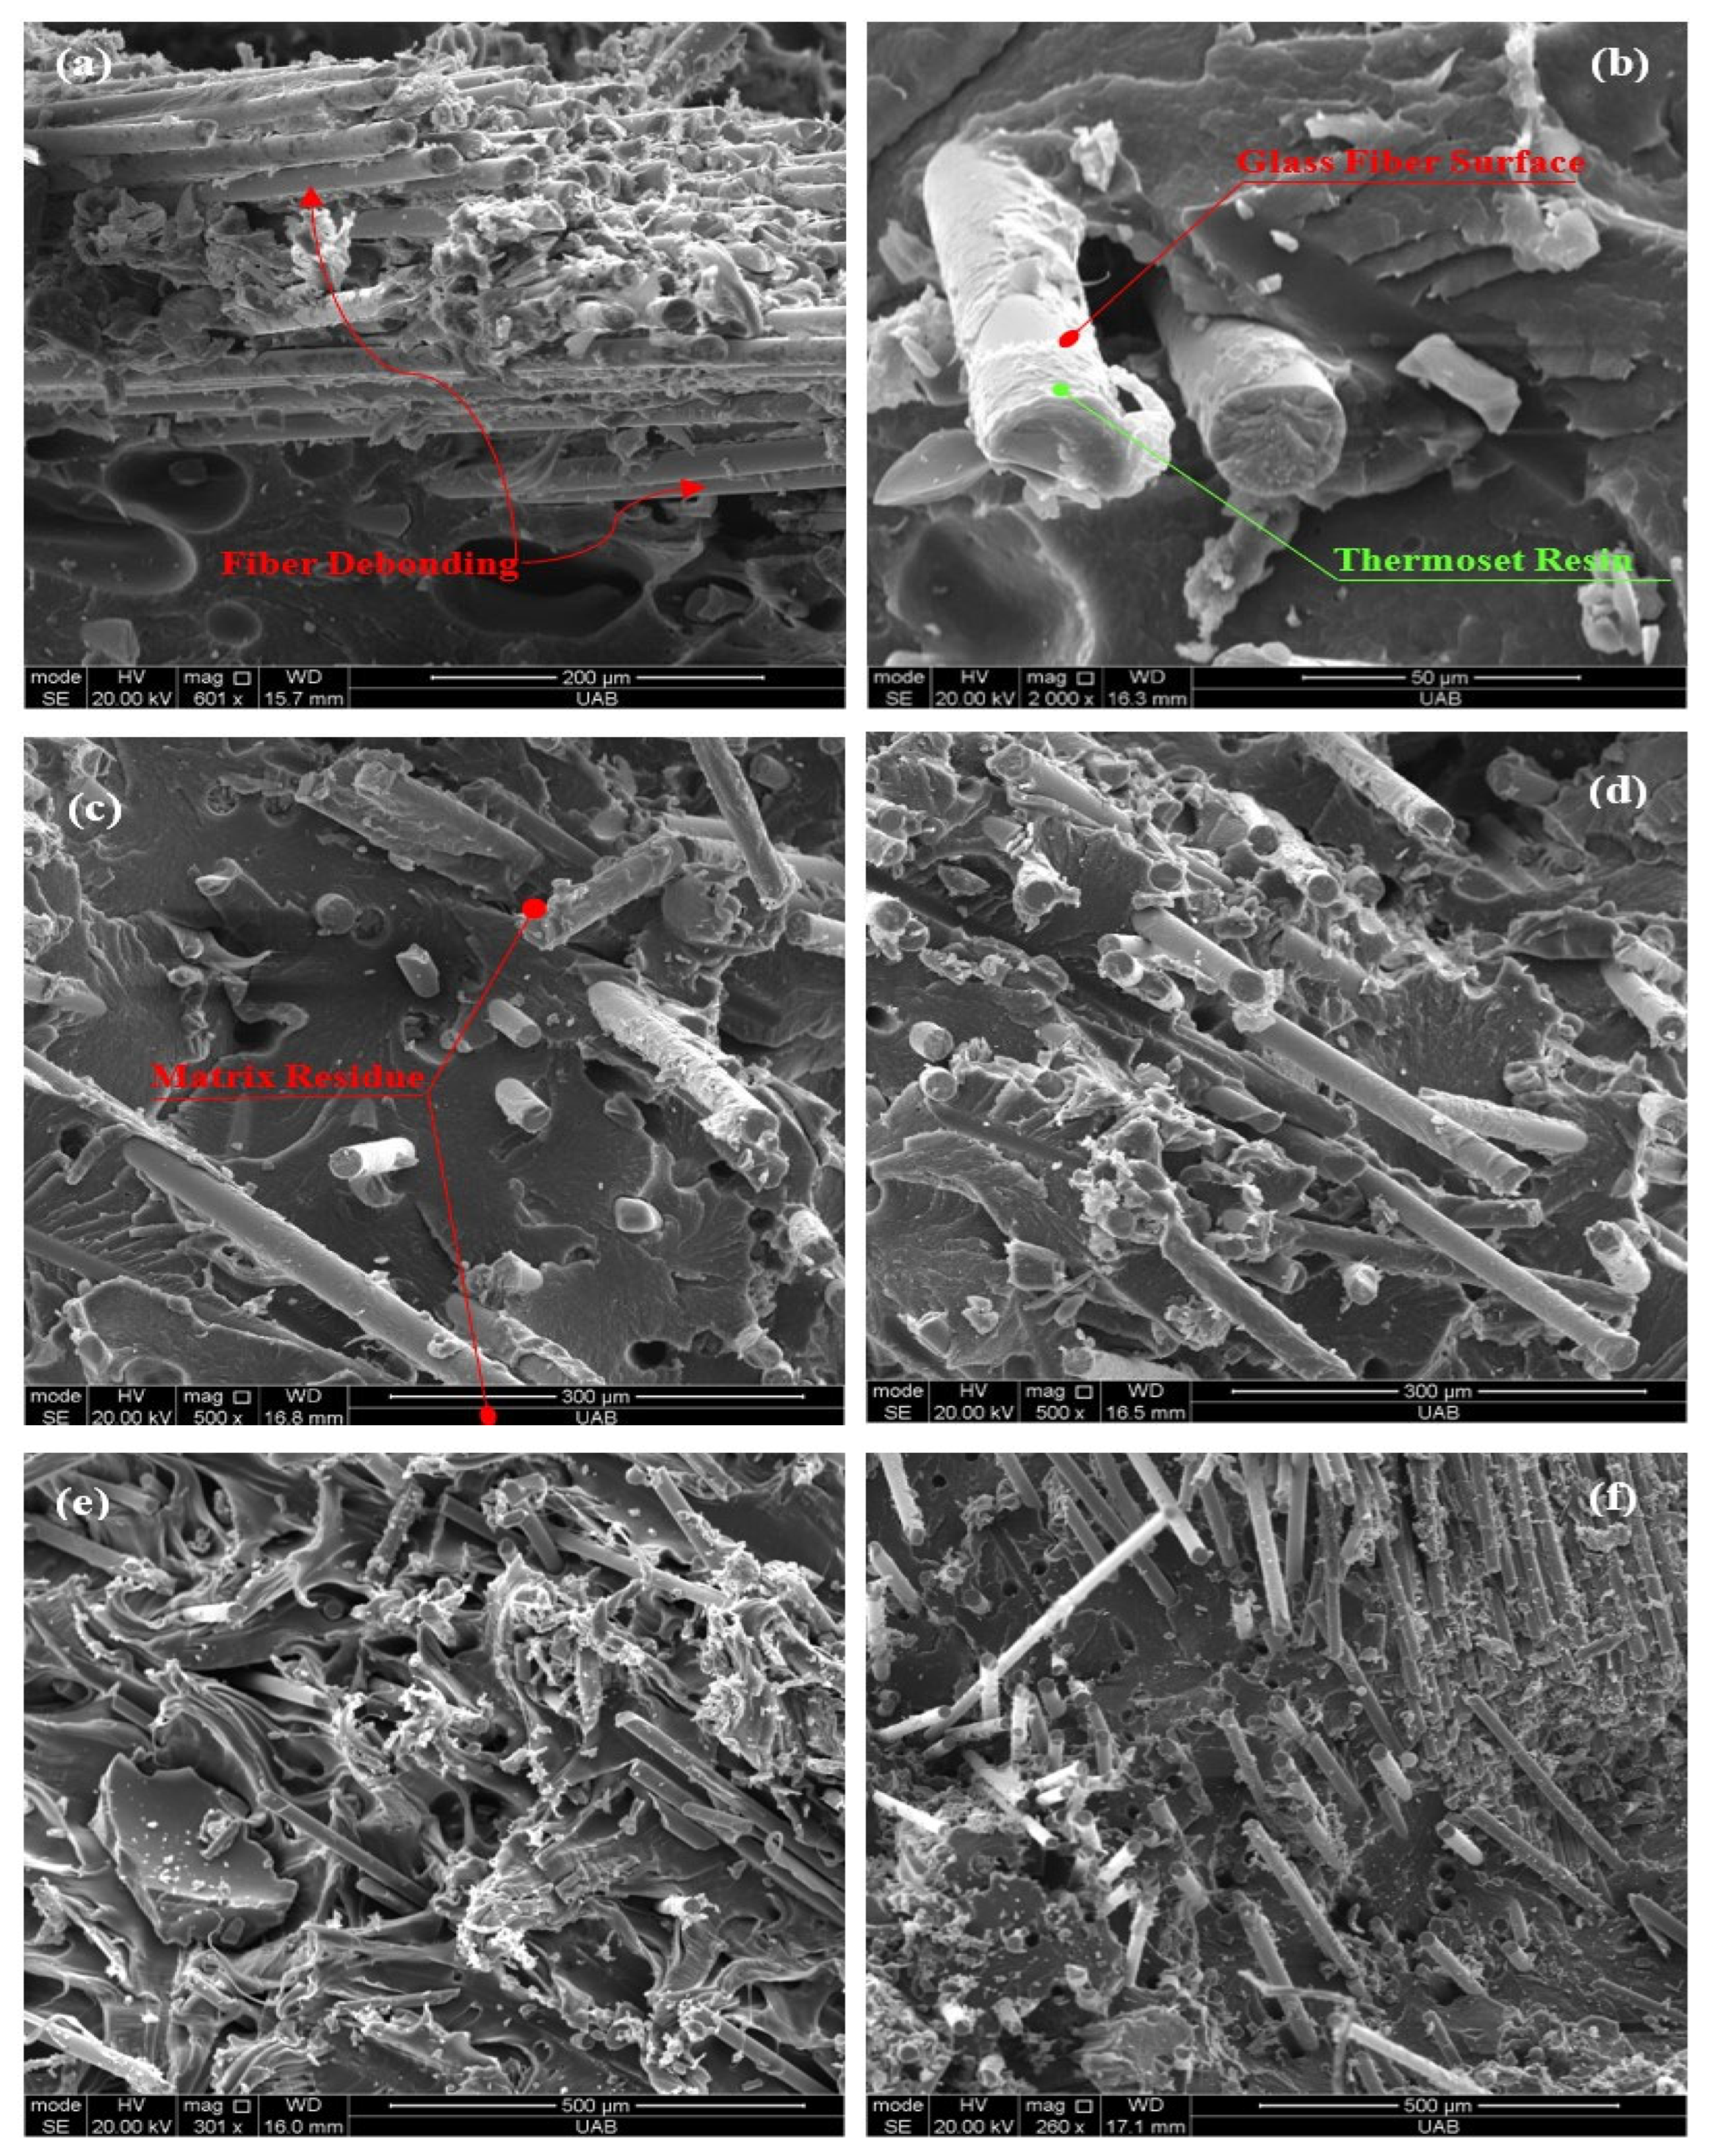
SEM images obtained from fracture surfaces of the tensile tests of STCs with different filling ratios (10%, 20%, 30%, 40%, and 50%) are shown in Figure 14. These SEM images reveal detailed information about the orientation, fiber bundle length, and distribution of EPG in three different thermoplastic matrices (LDPE, HDPE, and PA6).
Very good adhesion between the glass fiber and their impregnated epoxy matrix was observed near the interfaces and surface of the woven fabric composite scrap. The partially impregnated fiber can be found to retain its bundling form for all three matrix materials. Part of the fibers were virtually encapsulated in the epoxy resin, constituting a standalone reinforcing unit within the STC. These woven flakes consisted of several layers of varying morphologies, including some glass fiber–glass fiber interfacial contacts without impregnation of residual thermoset or thermoplastic resin. The fiber–fiber and fiber–matrix debonding characteristics were correlated with the tensile test fracture surfaces. The glass fibers in contact with the EPG fiber bundles exhibited a certain degree of shear tendency along the extension direction, as seen in Figure 14a. The increasing tensile stresses could promote fiber pullout from neighboring matrices due to stress concentration over the anisotropic interfaces, resulting in interfacial slippage and bundle separation of the mobilized fibers.
Mechanical attrition, debonding, and fragmentation can occur during the shredding or the mixing process, causing the glass fibers to break down from their fiber bundles. Glass fibers without thermoset resin on their surfaces can accumulate mechanical damage and reduce the wettability of the fibers due to removal of sizing agents and inhibit the formation of interfacial voids when they interact with the matrix. Figure 14b shows that the resin on the glass fiber is peeled off, and fibers are separated from the bundling matrix. This morphology is desirable, as these interfaces facilitate stronger interfacial adhesion between the fibers, the residual thermoset, and the thermoplastic matrix materials. Figure 14c,d show that the thermoset resin adheres better to the matrix materials than to the glass fiber surface. In the SEM analysis, the adhesion surface between the thermoset resin and the glass fiber is susceptible to premature failure from the localized stress concentration from its immobility. Failure modes include interface decohesion, glass fiber pullout, fiber breakage, and matrix damage [6,48]. The smooth fracture surface of the fibers and fiber bundles of STCs, which made the mechanical responses more brittle as the filler ratio increased, is shown in Figure 14e. On the contrary, the formation of a more ductile structure as the filler ratio decreases is shown in Figure 14f.

3.4. Assessment of the Mechanical Properties of STCs

3.4.1. Tensile Properties of STCs

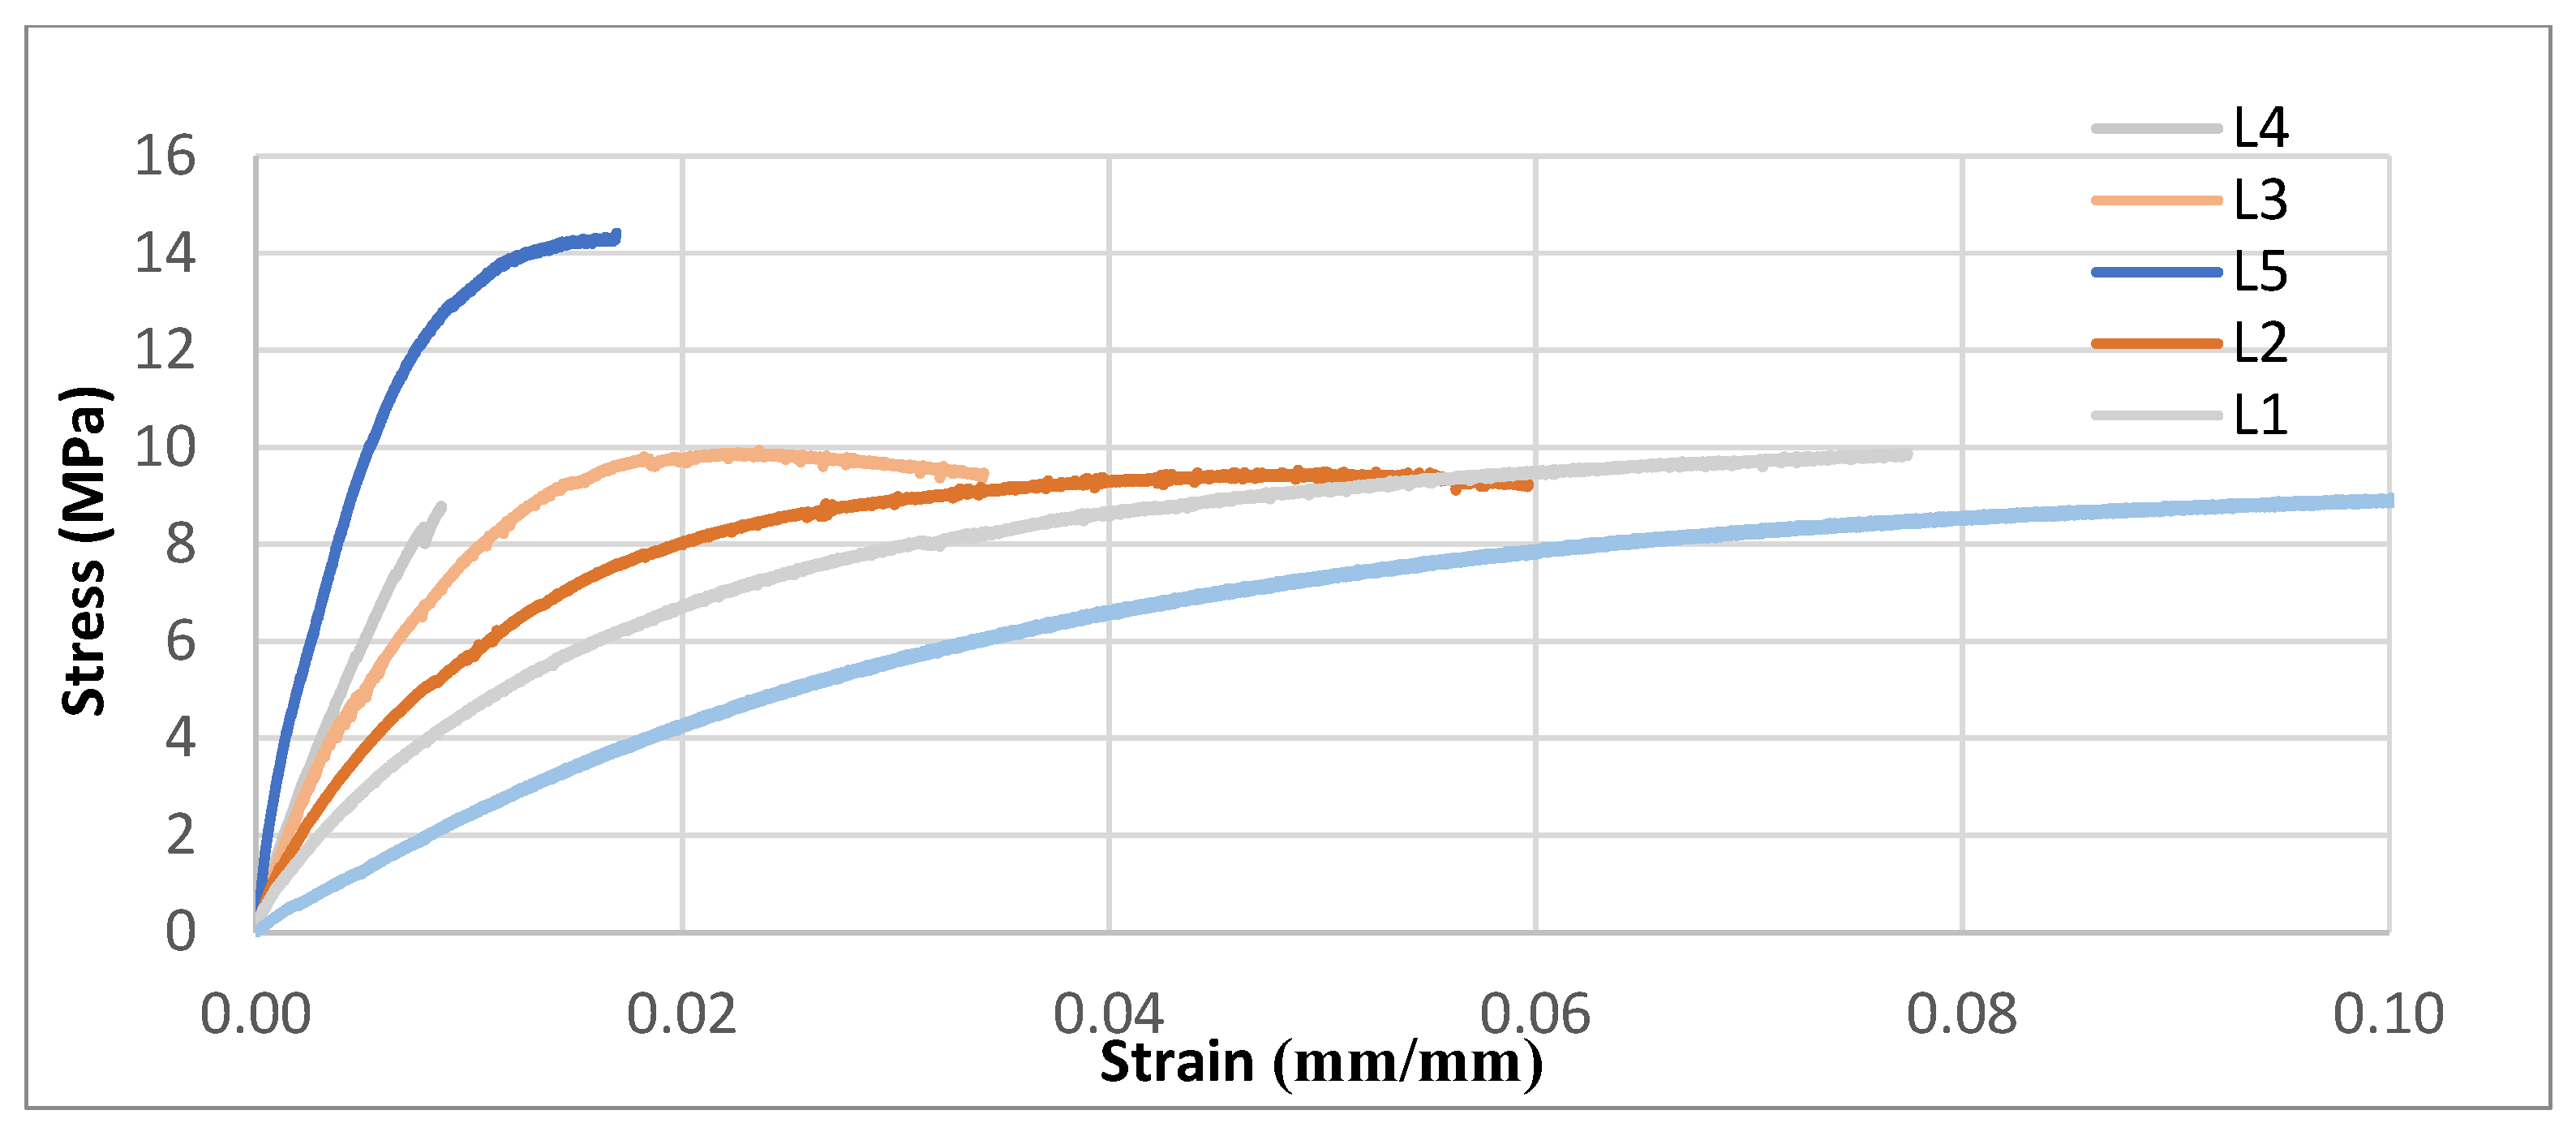
The mechanical performance of thermoplastic composites obtained by adding fillers to polymers generally depends on the inherent properties of the filler used. This study investigates the EPG-reinforced STCs produced via a mechanical recycling route without any surface treatment. The simplicity of the approach guarantees minimal environmental impacts during the recycling process and compatibility to establish a scalable industrial process. The EPG thermoset filler content in STCs shown in Table 3 is between 10% and 50%, but this value does not indicate the amount of glass fiber in the composite. The evaluation of mechanical test results requires taking into account the fact that recycled EPG fiber bundles contain approximately 80% glass fiber by weight. The mechanical test results of STCs with low loading rates (10% and 20%) exhibited a more consistent behavior compared to those with high filler rates. In Figure 15, the effect of recycled thermoset fiber scraps (EPG) on the tensile strength properties of composites (STCs) obtained with LDPE polymer matrix is compared for increasing filler amounts.
The tensile responses of the STCs can be affected by the properties and spatial distribution of the fibrous components, such as woven fabric fragments, which possess an anisotropic or orthotropic material behavior. The distribution of EPG within the matrix, fiber dimensions, and fiber–matrix adhesion interface played an important role in determining the mechanical properties of STCs [49]. Figure 15 shows that the LDPE polymer exhibits a large elongation behavior, while the STCs undergo deformation after a very small plastic zone due to the presence of EPG. The presence of EPG in the LDPE polymer matrix significantly affects the ductility of the polymer material and causes the STC to exhibit a more brittle behavior. The interaction between EPG and the polymer matrix can inhibit chain movements due to their large aspect ratio, which causes STCs to become more brittle [50]. The transfer of the applied load from the matrix to the fibers occurs through the interfacial interaction formed between the fiber bundles and the matrix [51]. The quality of the interfacial adhesion positively affects the strength properties.
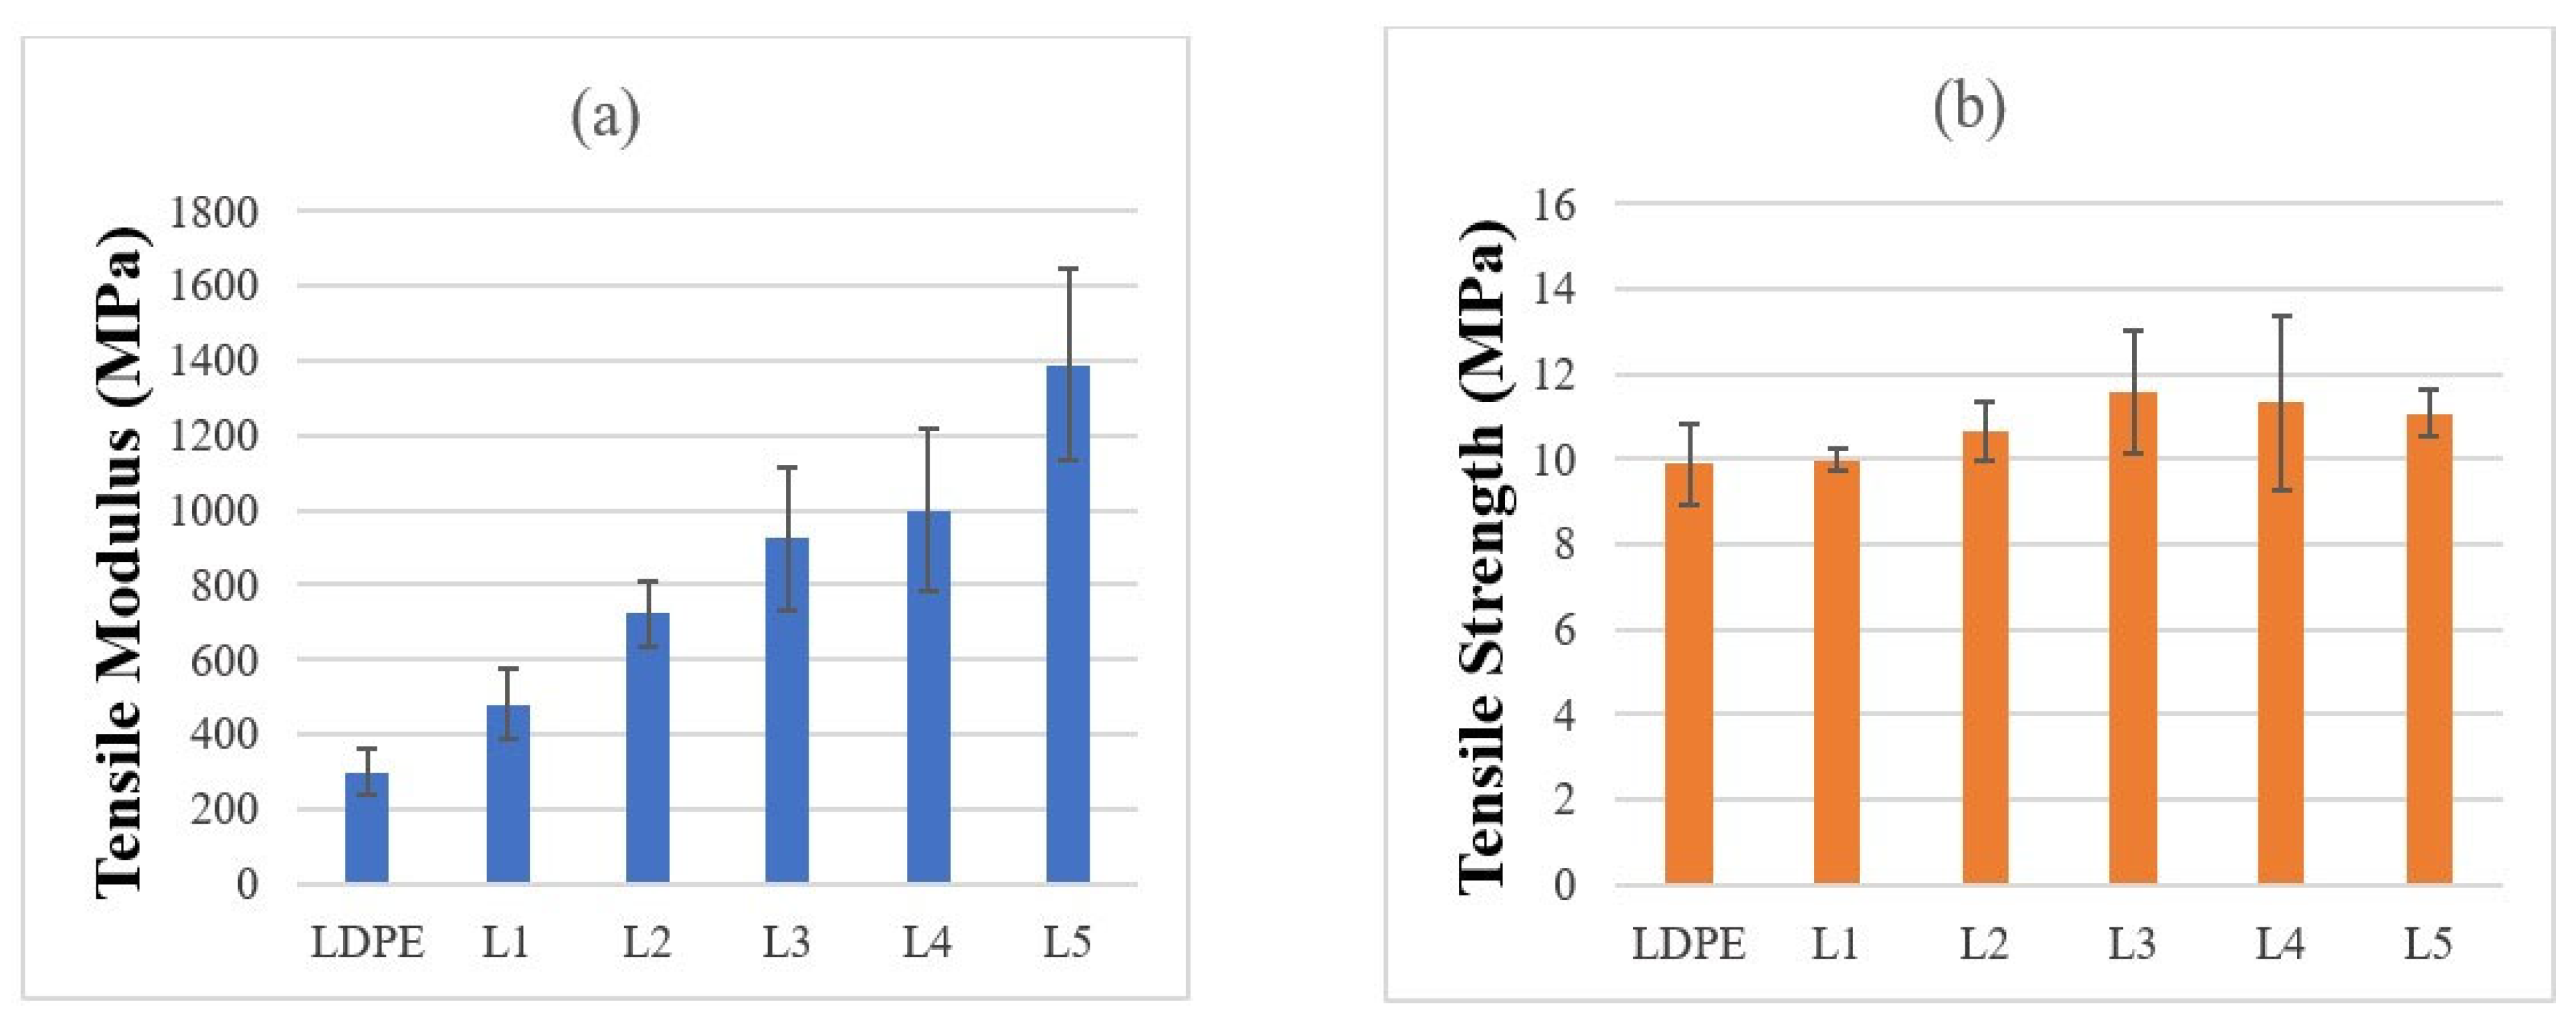
Figure 16 shows the changes in the tensile modulus and tensile strength of STCs obtained by adding LDPE polymer and different amounts of EPG. The tensile modulus values obtained by adding EPG thermoset fiber bundles to the LDPE polymer with a tensile modulus value of 299.67 MPa were obtained as 479.87, 721.61, 923.31, 999.18, 1389.13 MPa for L1, L2, L3, L4, and L5 STCs, respectively. However, as the EPG content increased, a significant decrease in strain at failure was also observed.
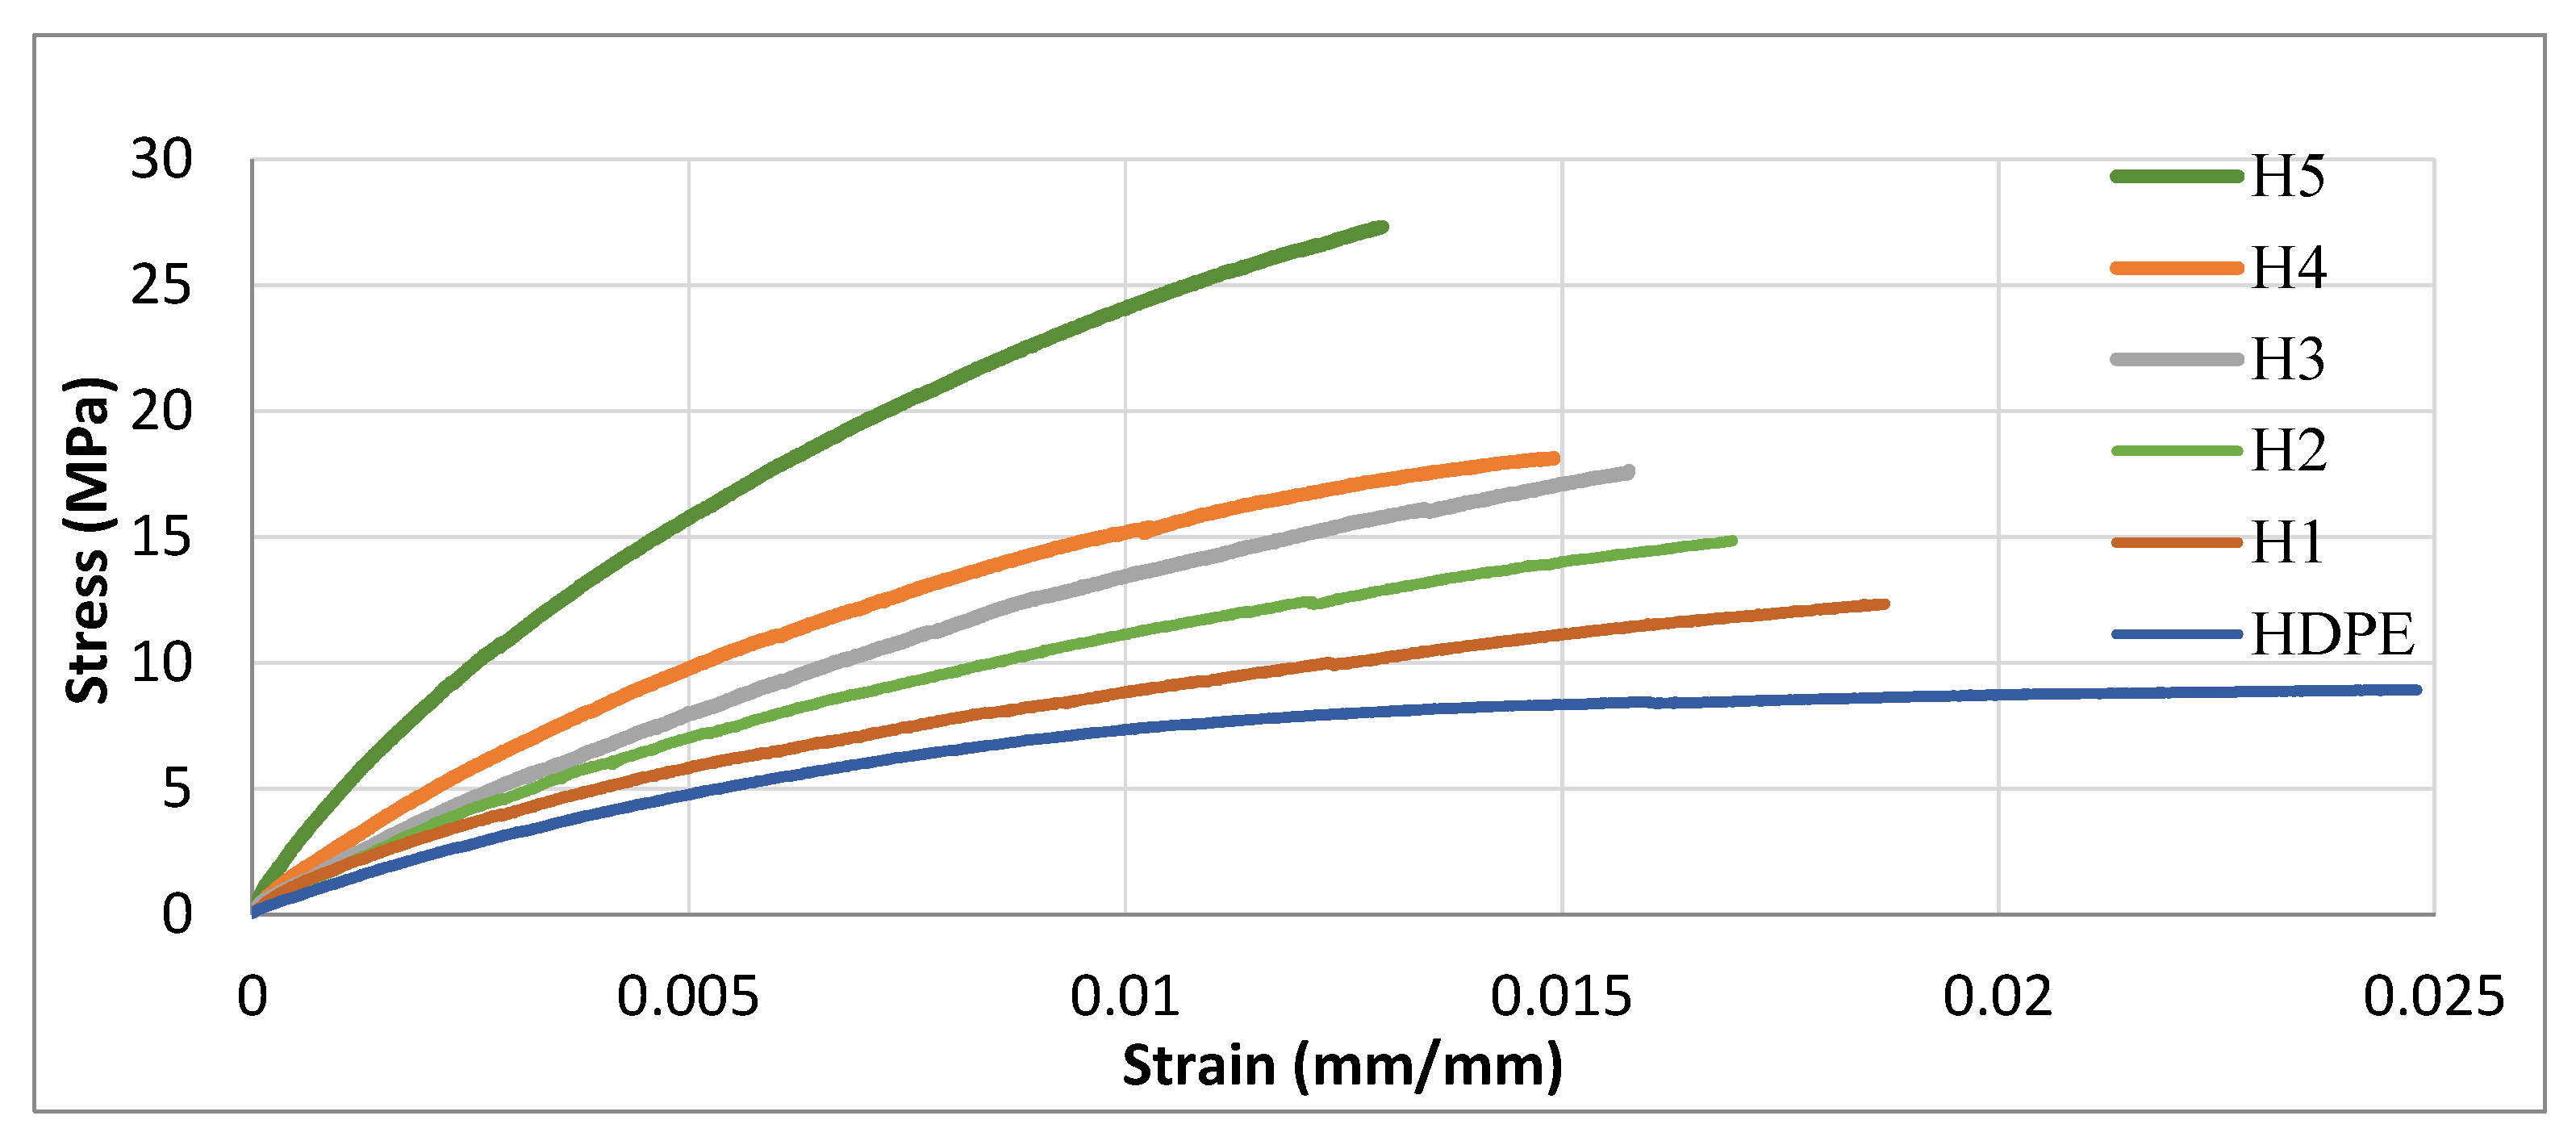
Figure 17 shows the stress–strain comparison curves for pure HDPE and STCs obtained with different EPG loading rates, from which the effects of the presence of EPG on the mechanical properties of the composite were analyzed. A significant increase in the modulus and decrease in failure strain were observed in STCs with higher EPG contents. For the H5 composite, the strain value decreased while the stress value increased. This situation is due to the stress concentration formed in the composites with the addition of thermoset fiber bundles in the matrix.
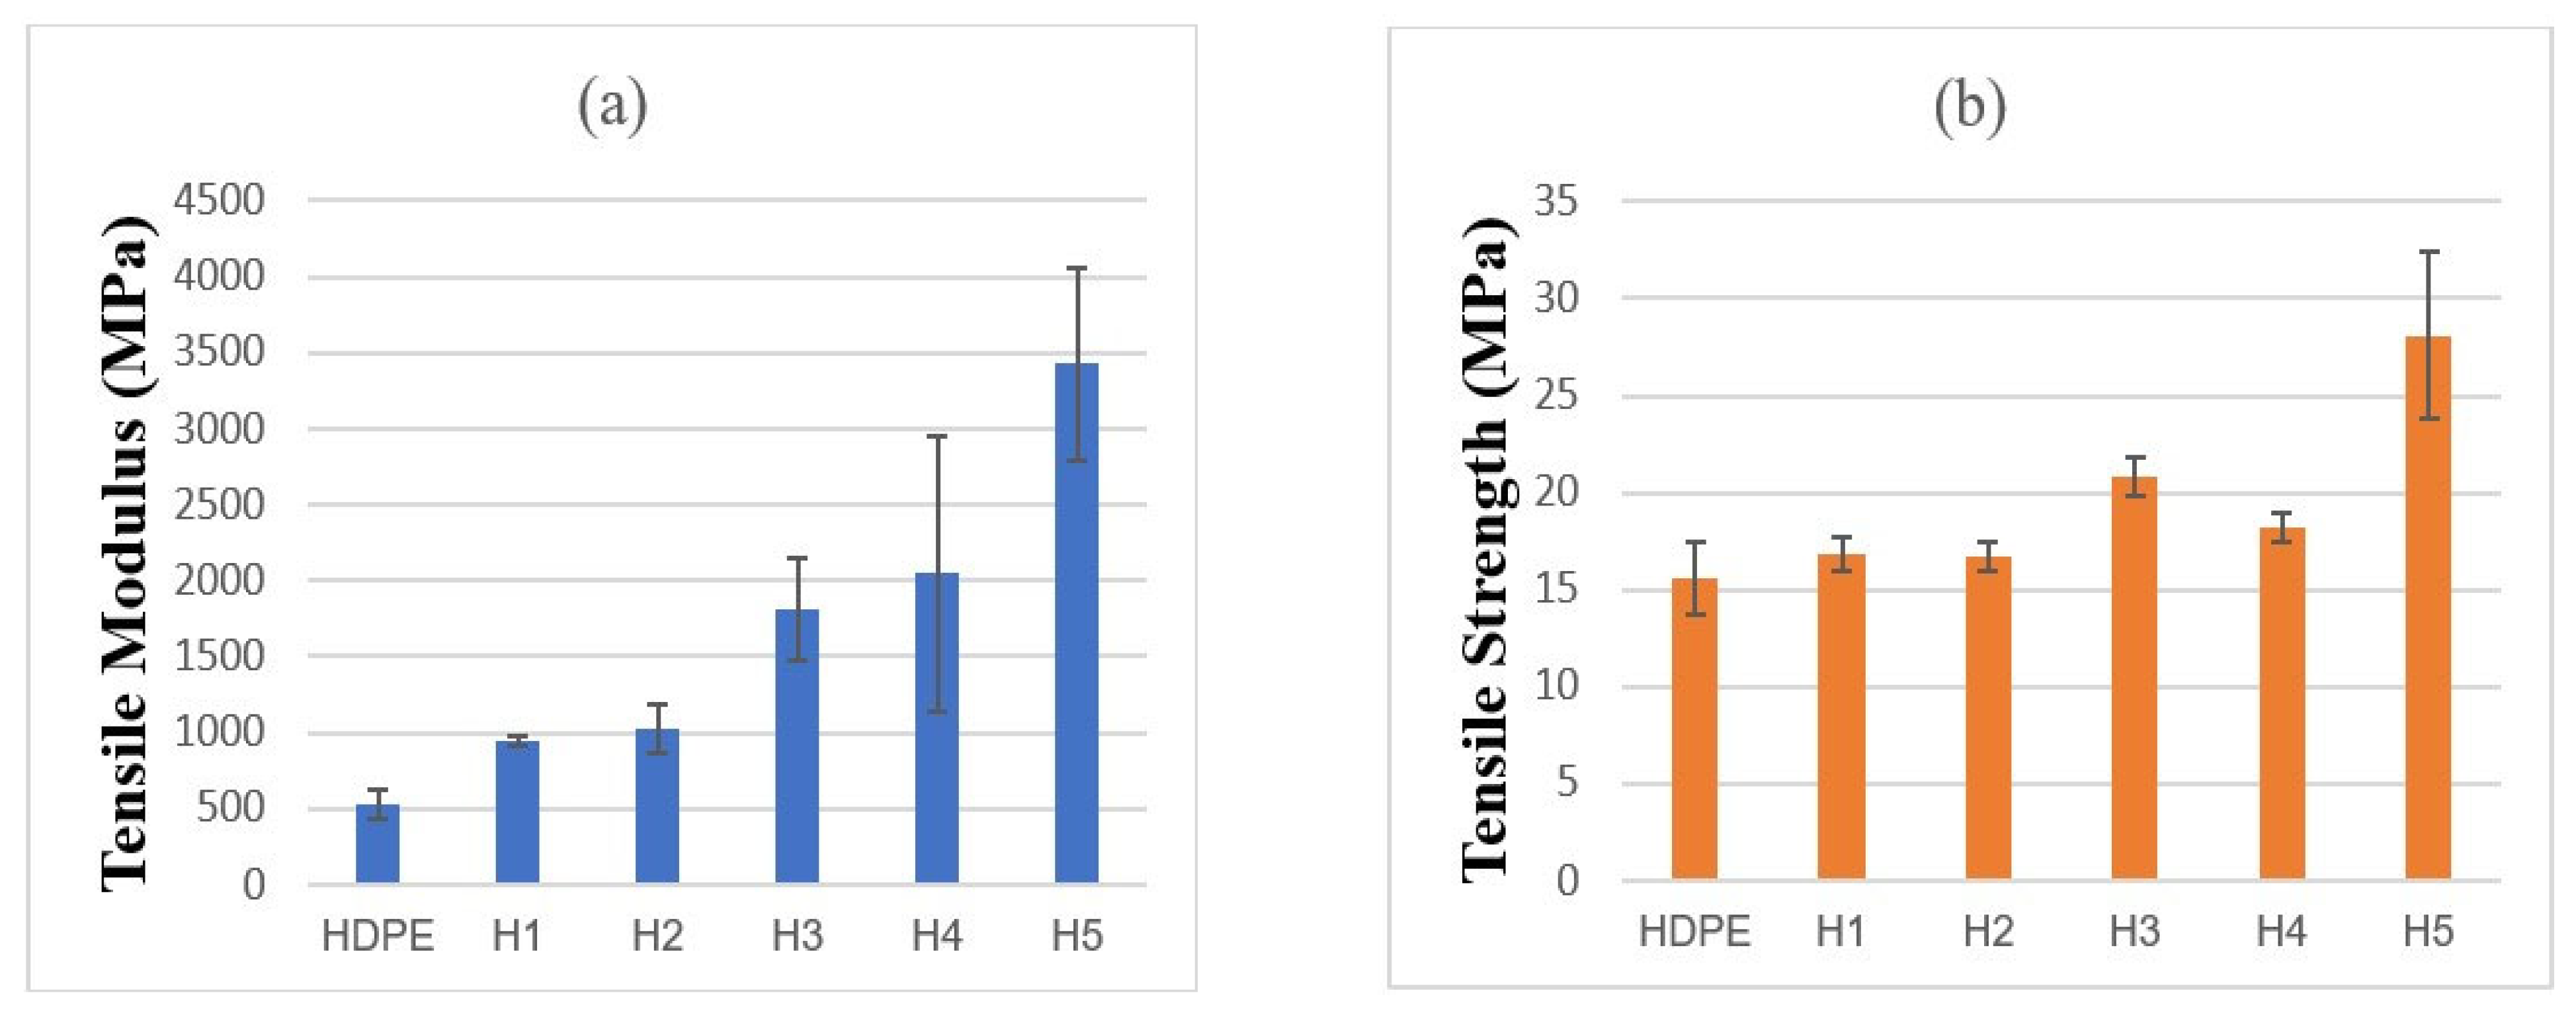
Figure 18 shows the changes in the tensile modulus and tensile strength of STCs obtained by adding LDPE polymer and EPG. Thermoset EPG scraps decreased the tensile modulus of STCs with the HDPE matrix for each loading amount. The tensile modulus of pure HDPE was 522.7 MPa, and the tensile moduli for the H1, H2, H3, H4, and H5 composites were found to be 948, 1021, 1812, 2044, and 3424 MPa.
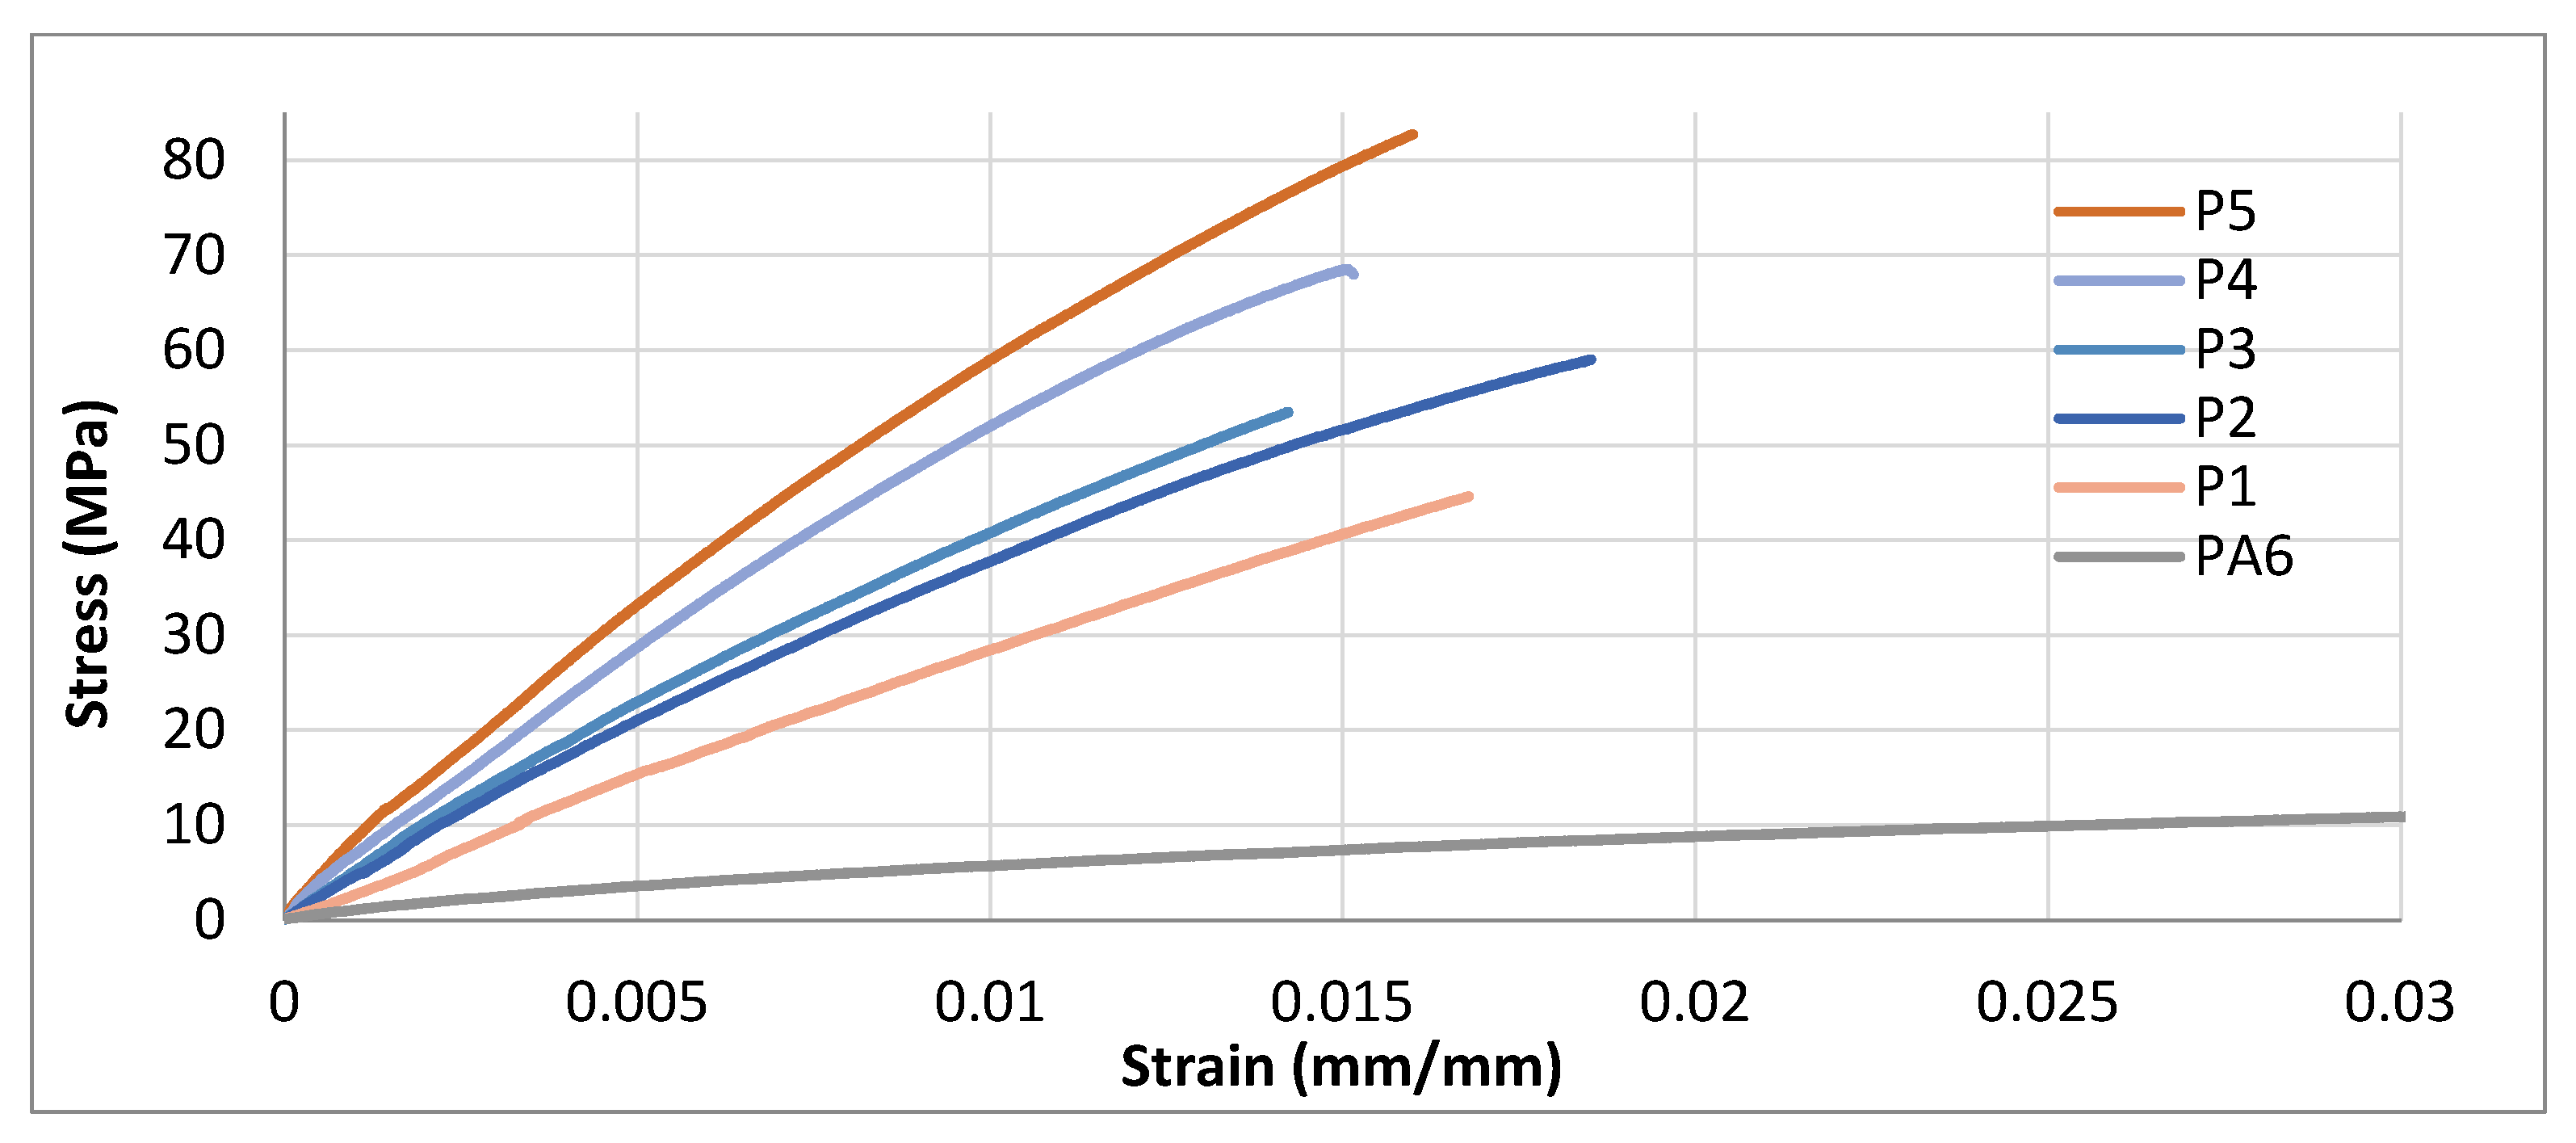
Figure 19 shows the stress–strain curves of composite materials obtained with the PA6 polymer and thermoset scrap wastes. However, the situation was slightly different for STCs produced with PA6. The temperature distribution range of the single screw extruder of the P1, P2, P3, P4, and P5 composites was between 230 °C and 260 °C on average for the feed zone, melt mixing, and exit zone. This temperature range is sufficient for the thermoset materials to start decomposing. In order to obtain a homogeneous mixture, the single screw speed was reduced and the process time was extended. The prolonged thermomechanical cycles enable higher mobility for fibers to debond from the thermoset matrix and epoxy and thermoset polyurethane granulation. This allows the glass fiber to bond better to the polymer matrix, while the thermoset granulates introduce additional crack-inhibiting and plasticizing effects to the STCs. This bonding improves the mechanical properties of the material, restricts the mobility of the polymer chains, and reduces the elongation rates, resulting in a less elastic structure [52,53,54]. Significant changes in filler size distributions and the dimensions of glass fibers (increase from <0.6 mm) were observed in PA6 composites with relatively long mixing times. It is known that reducing the particle size increases the chances of agglomeration within the material and causes a decrease in mechanical performance [8].
Figure 20 shows the changes in the tensile modulus and tensile strength of STCs obtained by adding PA6 polymer and EPGs. The neat PA6 data was retrieved from previous studies conducted in house [55]. EPG scraps increased the tensile modulus of STCs with the PA6 matrix for each loading amount. The tensile modulus values obtained by adding EPG thermoset fiber bundles to the PA6 polymer were obtained as 3035, 3434, 3693, 4769, and 4988 MPa for P1, P2, P3, P4, and P5 STCs, respectively.
The studies with three different polymer matrices have shown that the reinforcing effect of the EPG thermoset filler is significant at a loading of 10–20%. Adverse effects were observed when EPG loading increased to 30–50%, with minimal additional benefits in mechanical reinforcement. Mechanical test results showed that EPG behaved more homogeneously in the polymer internal structure at 10% filler loading. The trend can be explained by two underlying mechanisms that govern effective load transfer and load bearing within the randomly distributed fiber reinforcement.
At a lower EPG loading, the glass fiber can be effectively debonded from the thermoset matrix and properly impregnated by the thermoplastic matrix. Although this results in a relatively lower average fiber length, as evident in Figure 6, the resulting STCs exhibit a balanced modulus–strength performance and a higher processibility. In comparison, the STCs become more brittle when filled with high filler contents (>20 wt%) as fiber–fiber interactions intensify, and the thermoplastic impregnation is less effective. This situation is also seen in the small fluctuations of the curve during the tensile test. These types of STCs exhibit a very small plastic zone and undergo brittle fracture after the stress point. At relatively low filler contents (<20 wt%), the force carried through the matrix activates the necking and cold drawing mechanisms, exhibiting a relatively large elongation property. At relatively low filler ratios (<20 wt%), the force transferred to the fibers through the matrix activates the necking and cold drawing mechanisms, and a larger failure strain was observed [50].
The increase in the EPG content induced a physical disruption of internal load transfer, causing a decrease in elongation and an increase in the stress value due to a lower tendency of damping from the thermoplastic matrix. Another issue affecting the strength properties of STCs is the adhesion, morphologies, and distribution of the fiber–fiber bundle and powders within the matrix cross-section. The load-bearing capacity varies since the fiber bundles are randomly distributed within the matrix based on their inherent fiber angle from the extrusion–compression process. The best adhesion point on the fiber bundle acts as the center of rotation for the force applied through the matrix, changing the direction of the force. This movement causes the beginning of deformation. In addition, crack initiation can occur between the fiber bundles during shredding or the mixing process, causing the fiber to move within itself under load and thus causing deformation [5,11,56]. If cracked fiber bundles or thermoset powders inside EPG are aligned perpendicular to the applied stress, they will not be able to resist the growth of the crack and will trigger the beginning of failure. The presence of cracks between the fiber bundles of EPG obtained from thermoset composites subjected to the crushing process has been explained in previous sections. Figure 21 shows the cracks in the EPG fiber bundles located inside the STCs in the SEM examinations of the samples.

3.4.2. Flexural Properties of STCs

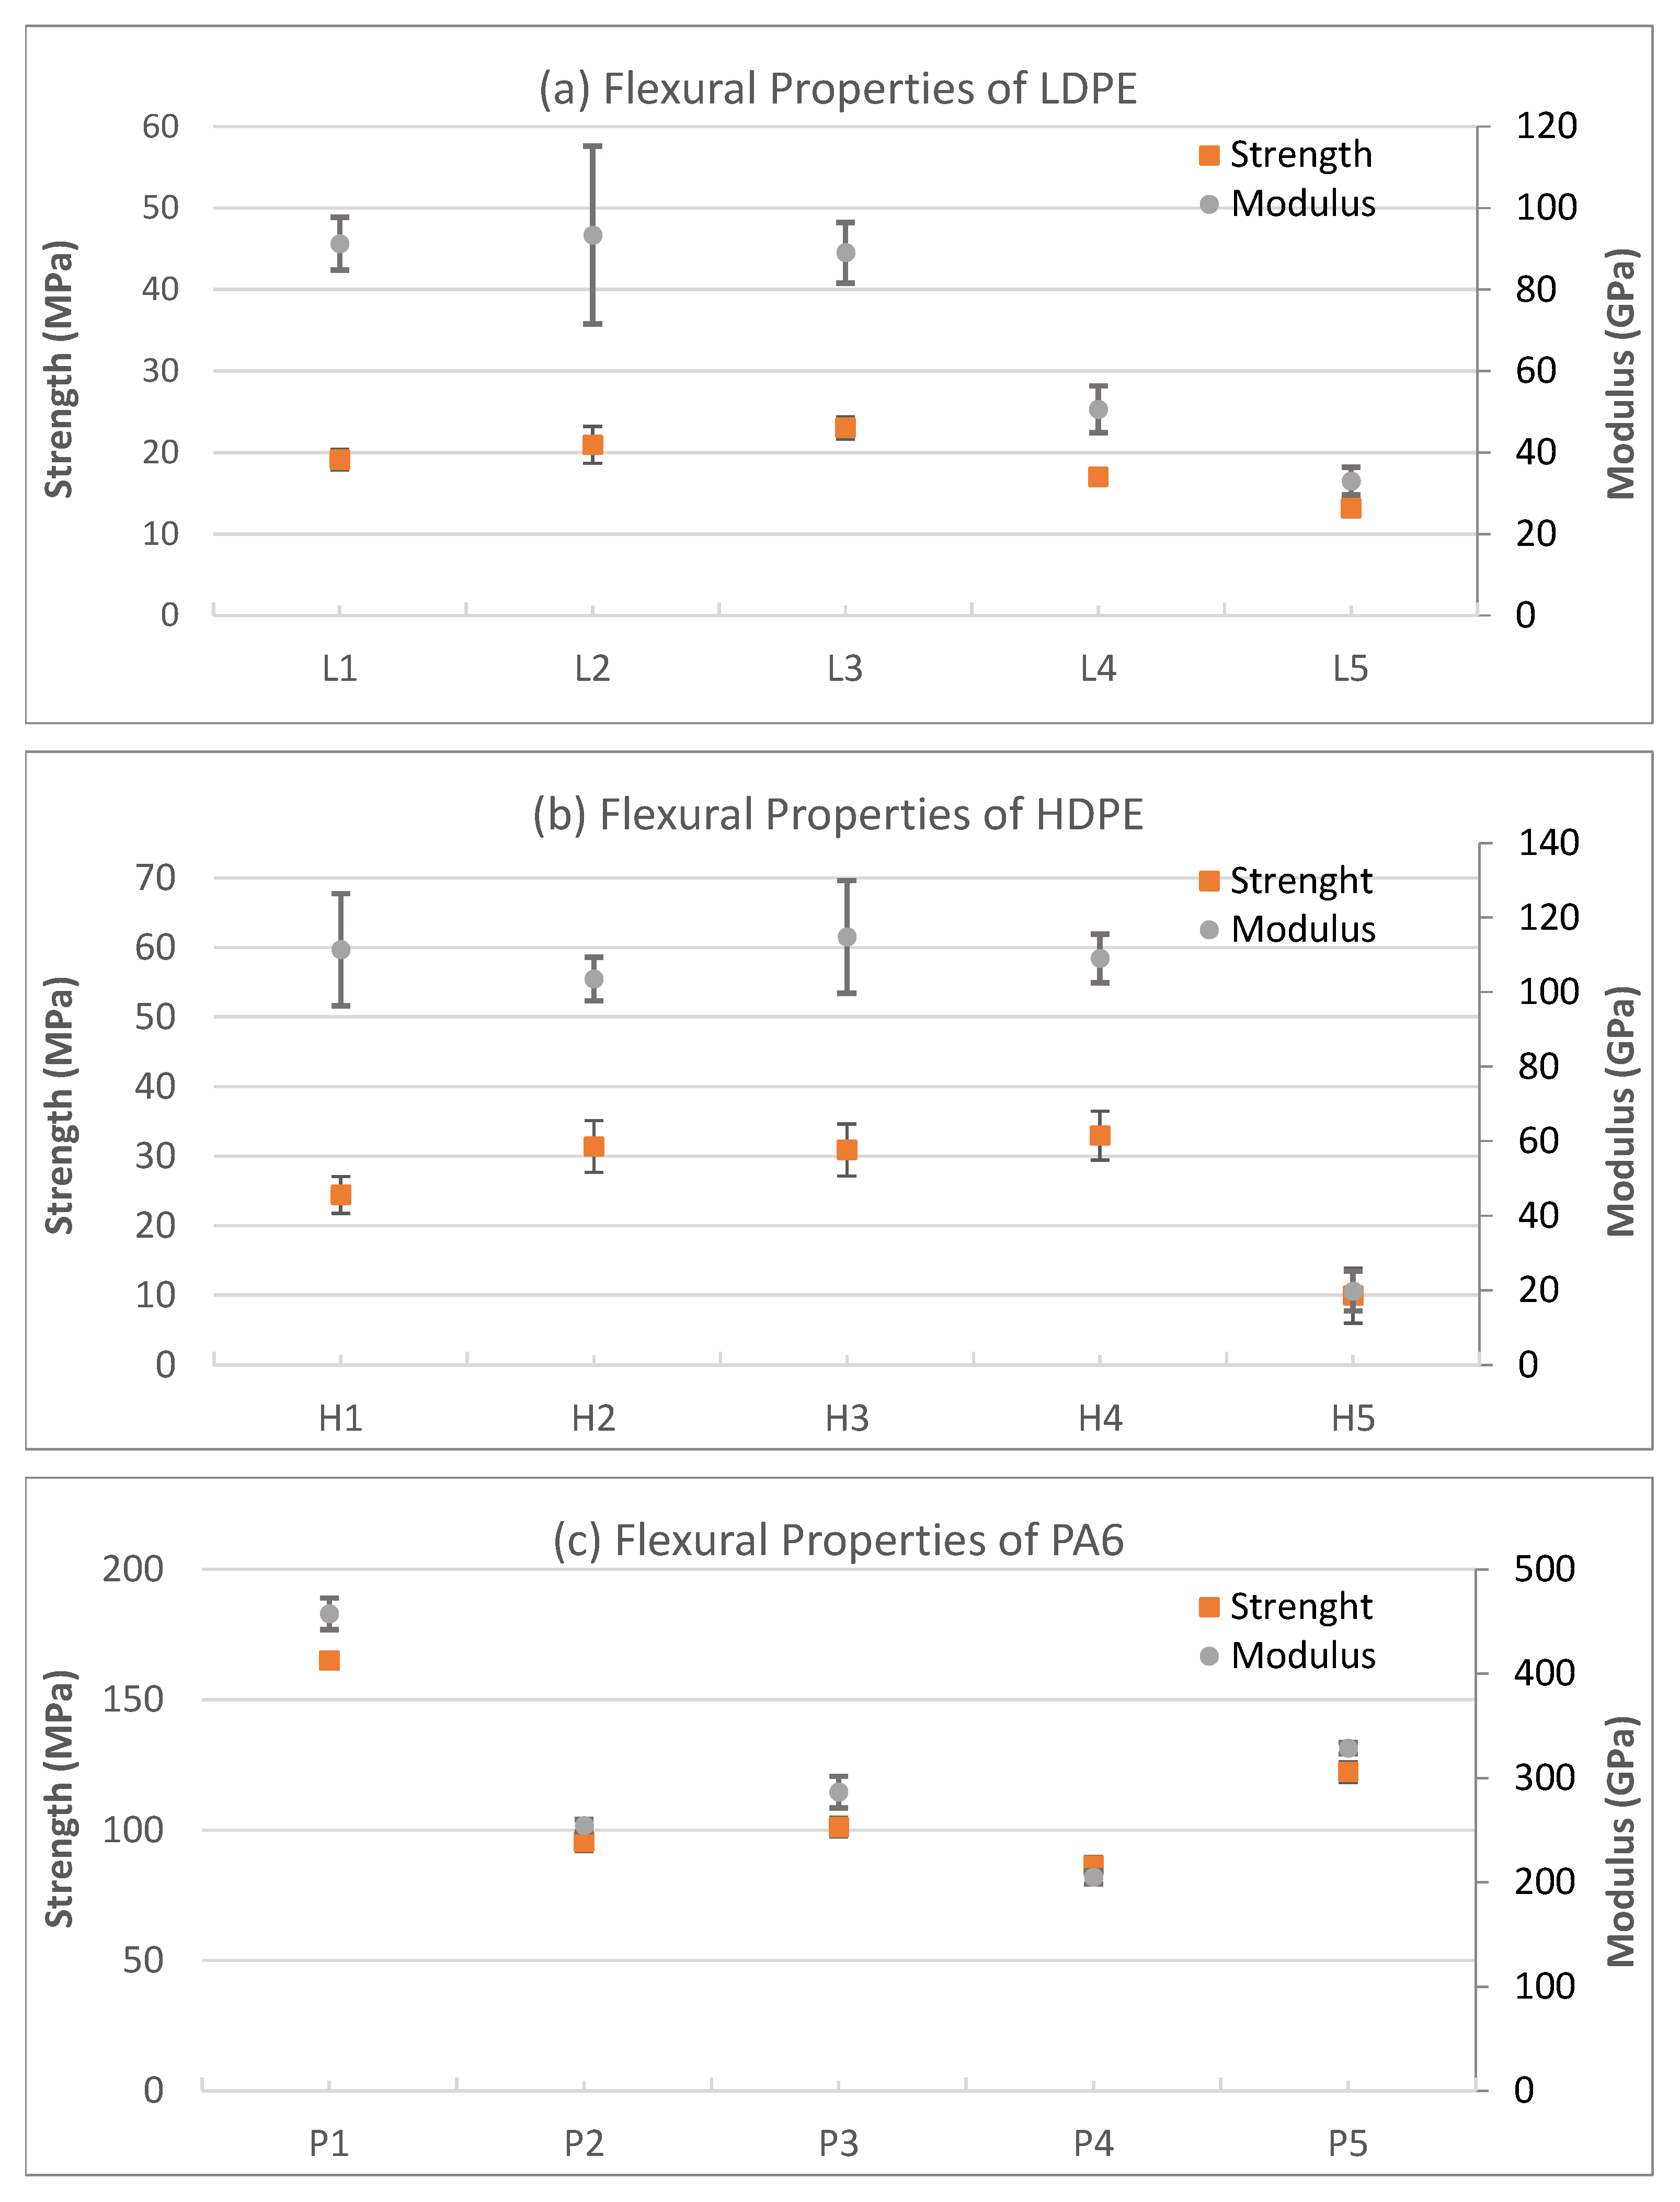
A comparison of the mechanical properties of STC composites, as shown in Figure 22, shows that polyethylene matrix composites exhibit lower mechanical performance. The test results highlight the importance of the interfacial interaction of thermoset fiber scraps with different polymer matrices for high-performance composite applications, the importance of the dimensional properties of the fibers, and the fiber distribution.
On top of the inherently lower strength, the polyethylene matrix composites’ poor mechanical performance can also be attributed to the relatively low processing temperature, causing insufficient adhesion bonding over the EPG–matrix interfaces. The temperature distribution range of a single screw extruder for LDPE and HDPE composites was between 160 °C and 200 °C and 180 °C and 240 °C on average for the feed zone, melt mixing, and outlet zone, respectively. Based on the empirical observation, the outlet zone temperatures were iteratively increased to achieve a homogeneous molten charge. Increasing the EPG filler ratios in polyethylene matrices correlated with an increased flexural modulus. Increasing the EPG content caused a noticeable increase in the flexural modulus and flexural strength values of the LDPE and HDPE composites. Especially for filler ratios above 20%, the change in mechanical flexural properties showed a more consistent behavior [57].
However, higher values were obtained for the flexural strength and flexural modulus values of PA6 matrix composites compared to other polymer matrices. In addition, the increase in infill decreased the flexural strength value, and an increase was observed at the 50% infill ratio. Flexural modulus properties were negatively affected by increasing the EPG infill percentage, and an improvement was only observed at the 50% infill ratio. This situation can be explained by the high-stress conditions in PA6 matrix composites [58]. In composites reinforced with EPG fiber bundles and powders, effects such as the particles’ hardness and the mixture’s homogeneity depend on the filler material’s distribution. As a result of the bending load applied to STC composites, either the fillers in the matrix undergo deformation or the matrix, which exhibits strong adhesion properties, has to flow around these fillers. For this reason, the fact that the samples are more resistant to vertical loads is directly related to the physical condition and interfacial bonding quality of the filler in the matrix.

3.4.3. Izod Impact Properties of the STCs

The Izod impact test results of the STCs are presented in Table 8. The Izod impact strength decreased with increasing filler amount in the three matrix materials. The addition of EPG fiber bundles beyond 20% by volume showed that the Izod impact strength decreased rapidly due to the random distribution and heterogeneity within the composites.
Figure 23 shows a bar chart of the Izod impact strength for all tested samples. A trend was observed that an increasing amount of filler resulted in lower impact strength, possibly due to the immobility introduced by the stiffer fibers, impregnated fiber bundles, and the thermoset residue. This correlated well with the empirical findings, as the highest Izod strengths in different matrices were all observed at a 10% EPG filler loading. Based on the data, LDPE presented the highest Izod strength. The underlying mechanism for their higher impact properties in the LDPE blend can be attributed to the polyurethane flakes preserved within the STCs as they were processed at a lower temperature. A decreasing trend in Izod impact strength was observed in PA6- and HDPE-based composites relative to LDPE, likely due to the higher filler content that may have adversely affected energy absorption capacity under impact.
The fiber distribution, fiber size, and fiber location in the matrix significantly affect the break energy. During the tests, fiber bundles in the fracture area caused the break energy to increase. An example of an individual fiber bundle seen in the cross-sectional area after the test is shown in Figure 24. The location and position of the fibers have also been identified as important factors affecting the break energy.
These results were found to be associated with a better Izod impact strength value for composites reinforced with 10% and 20% EPG fiber bundles by volume. The values found for P1 and H1 composites were 16.95 kJ/m2 and 14.78 kJ/m2, respectively, which were significantly different from the others. Asmare et al. [59] also showed that good mechanical properties can be obtained when balanced and compatible reinforcement is used with the matrix in the composite. Avinash et al. [60] showed that the Izod impact strength of a composite filled with 10% volume fraction was better for composites prepared with 10% and 20% volume fractions of filler together with an epoxy matrix reinforced with E-glass fiber. Another important point is that there is a significant difference in the Izod impact average energy values between the investigated reinforcement percentages (10, 20, 30, 40, and 30 wt%) and polymer type. This confirms the direct relationship to their morphological profiles in volumetric distribution and number of EPG, which relates the Izod impact energy to the processability of the polymer.

4. Conclusions

This study demonstrates that epoxy–polyurethane–glass fiber (EPG) thermoset scraps can be reprocessed into LDPE, HDPE, and PA6 matrices to produce second-generation thermoplastic composites without compatibilizers. The resulting composites were comprehensively analyzed in terms of tensile strength, tensile modulus, thermal properties, Izod impact resistance, density, water uptake, and microstructural characteristics.
  • The mechanical recycling of epoxy–polyurethane–glass fiber (EPG) thermoset wastes has enabled their reuse as reinforcing fillers in LDPE, HDPE, and PA6 matrices, thereby providing a sustainable and cost-effective recycling pathway.
  • The recycled epoxy–polyurethane–glass fiber (EPG) wastes used in this study were found to comprise two main morphological fractions: loosely bound fiber bundles and fine particulates. This heterogeneity in size distribution directly influenced fiber–matrix interactions; in particular, microfiber bundles tended to localize stresses, thereby limiting the efficiency of load transfer.
  • The average fiber length of STCs was strongly affected by matrix viscosity and processing conditions; the recycled EPG, initially ~9 mm, was shortened to ~6.7 mm in LDPE, ~5.6 mm in HDPE, and ~5.0 mm in PA6 composites.
  • Microstructural examinations (optical microscopy and SEM) revealed that at high filler loadings, EPG fiber bundles were not uniformly dispersed, leading to microvoids and localized stress concentrations that limited the mechanical performance. Partial wetting of the fibers by the residual thermoset phase and the thermoplastic matrix weakened interfacial bonding, thereby reducing load transfer efficiency. In particular, filler contents above 30% resulted in more pronounced heterogeneity and microstructural defects, which were directly associated with strength reductions.
  • Among the matrices, LDPE composites exhibited the most pronounced increase in water absorption (+131%), while both LDPE and HDPE showed significant increases in density of ~45%. PA6, in contrast, displayed a more moderate increase in density (+27.5%).
  • Thermal analyses further highlighted the influence of EPG incorporation. Thermogravimetric analysis (TGA) revealed a substantial increase in the amount of char residue at 700 °C, rising from 2.5% to 33.5% in LDPE (+1240%), from 2.6% to 45.7% in HDPE (+1656%), and from 0.4% to 38.7% in PA6 (+9570%), confirming the strong contribution of the inorganic glass content to thermal stability. Differential scanning calorimetry (DSC) showed that crystallinity decreased consistently with filler loading: from 62.2% to 23.7% in LDPE (−61.9%), from 56.4% to 44.3% in HDPE (−21.5%), and from 31.1% to 23.1% in PA6 (−25.9%). These findings demonstrate that while EPG waste increases thermal stability through char formation, it simultaneously reduces crystallinity, reflecting restricted polymer chain mobility in all matrices.
  • Tensile results showed clear reinforcement effects across all matrices. In HDPE, the modulus increased from 523 MPa (neat) to 3424 MPa at 50 wt% (~6-fold), with strength peaking at +23.6% before declining at higher loadings. PA6 composites exhibited the highest stiffness, increasing from 3035 to ~5000 MPa, while tensile strength improved by ~25% at optimal filler levels. LDPE composites showed balanced improvements at 10–20 wt%, with modulus gains up to ~590% and strength increases of ~40–47%, though excessive loading reduced strength. Overall, moderate filler contents offered the best trade-off between stiffness and strength.
  • Flexural tests confirmed significant stiffening with filler addition across all matrices. In LDPE composites, the flexural modulus increased by 286–589%, accompanied by ~40–47% improvement in flexural strength. HDPE composites showed a ~347% rise in the modulus and up to a 23.6% strength enhancement. PA6-based composites exhibited the highest rigidity, with flexural modulus gains exceeding 50% and strength improvements of ~25% at optimal filler loadings. However, at high filler levels (≥40 wt%), heterogeneity and fiber agglomeration led to limited reductions in strength.
  • Izod impact tests showed contrasting trends depending on the matrix. LDPE composites exhibited improved toughness at low filler levels, with impact energy increasing by ~12–18% up to 20 wt%, before declining at higher loadings. HDPE composites, in contrast, showed a continuous decrease, with impact strength reductions of ~15–25% across the filler range. PA6-based composites experienced the most pronounced loss, with impact strength decreasing by ~30–40% at 50 wt% loading, reflecting the matrix’s higher polarity and brittleness. Overall, moderate filler contents in LDPE offered a balance between stiffness gains and acceptable toughness, whereas HDPE and especially PA6 were more sensitive to impact degradation.
Compatibilizer-free reuse of EPG offers a practical route to increase stiffness and the char residue content. HDPE showed the highest relative stiffness gains, PA6 achieved the highest absolute modulus, and LDPE provided processing advantages. The retained fiber lengths (~5–7 mm) enabled reinforcement without costly fiber regeneration. The resulting properties are suitable for semi-structural panels and protective housings where rigidity and thermal stability are prioritized over impact strength. However, high filler levels increase brittleness and moisture uptake, highlighting the need for barrier coatings or surface activation. Future work should systematically map the process–structure–property relationships.

Author Contributions

Conceptualization, H.K. and Y.-C.S.; methodology, H.K., Y.-C.S., S.P. and H.N.; validation, H.K., Y.-C.S., S.P. and H.N.; formal analysis, H.K., Y.-C.S., S.P. and H.N.; investigation, H.K.; resources, S.P. and H.N.; data curation, H.K. and Y.-C.S.; writing—original draft preparation, H.K.; writing—review and editing, H.K., Y.-C.S., S.P. and H.N.; visualization, H.K. and Y.-C.S.; supervision, S.P. and H.N.; project administration, H.K., S.P. and H.N.; funding acquisition, S.P. All authors have read and agreed to the published version of the manuscript.

Funding

This research received no external funding.

Data Availability Statement

The original contributions presented in this study are included in the article. Further inquiries can be directed to the corresponding author.

Acknowledgments

The authors are grateful for the financial support from the scholarship program from Scientific and Technological Research Council of Türkiye (Tubitak). Baris Engin is acknowledged for his help with and support of the thermal and physical testing. Yongzhe Yan is acknowledged for his help with and support of the SEM analysis.

Conflicts of Interest

The authors declare no conflicts of interest.

Abbreviations

EPGEpoxy–Polyurethane–Glass Fiber
GFRPGlass Fiber-Reinforced Plastic
STCSecond-Generation Thermoplastic Composites
LDPELow-Density Polyethylene
HDPEHigh-Density Polyethylene
PA6Polyamide 6
DMCDough Molding Compound
GWPWoven Glass Phenolic Laminate
LGF/PBTGlass Fiber-Reinforced Polybutylene Terephthalate
PPPolypropylene
BMCBulk Molding Compound
VARTMVacuum-Assisted Resin Transfer Molding
MPADMaterials Processing and Applications Development
TGAThermogravimetric Analysis
DSCDifferential Scanning Calorimetry
SEMScanning Electron Microscopy

References

  1. Hopewell, J.; Dvorak, R.; Kosior, E. Plastics recycling: Challenges and opportunities. Philos. Trans. R. Soc. B Biol. Sci. 2009, 364, 2115–2126. [Google Scholar] [CrossRef]
  2. Ragaert, K.; Delva, L.; Van Geem, K. Mechanical and chemical recycling of solid plastic waste. Waste Manag. 2017, 69, 24–58. [Google Scholar] [CrossRef]
  3. Morici, E.; Dintcheva, N.T. Recycling of Thermoset Materials and Thermoset-Based Composites: Challenge and Opportunity. Polymers 2022, 14, 4153. [Google Scholar] [CrossRef]
  4. Pickering, S.J. Recycling technologies for thermoset composite materials-current status. Compos. Part A Appl. Sci. Manuf. 2006, 37, 1206–1215. [Google Scholar] [CrossRef]
  5. Kismet, Y.; Dogan, A.; Wagner, M.H. Thermoset powder coating wastes as filler in LDPE—Characterization of mechanical, thermal and morphological properties. Polym. Test. 2021, 93, 106897. [Google Scholar] [CrossRef]
  6. Kouparitsas, C.E.; Kartalis, C.N.; Varelidis, P.C.; Tsenoglou, C.J.; Papaspyrides, C.D. Recycling of the fibrous fraction of reinforced thermoset composites. Polym. Compos. 2022, 23, 682–689. [Google Scholar] [CrossRef]
  7. Bream, C.E.; Hornsby, P.R. Comminuted thermoset recyclate as a reinforcing filler for thermoplastics: Part I characterisation of recyclate feedstocks. J. Mater. Sci. 2001, 36, 2965–2975. [Google Scholar] [CrossRef]
  8. Bream, C.E.; Hornsby, P.R. Comminuted thermoset recyclate as a reinforcing filler for thermoplastics: Part II Structure–Property effects in polypropylene compositions. J. Mater. Sci. 2001, 36, 2977–2990. [Google Scholar] [CrossRef]
  9. Shuaib, N.A.; Mativenga, P.T. Effect of Process Parameters on Mechanical Recycling of Glass Fibre Thermoset Composites. Procedia CIRP 2016, 48, 134–139. [Google Scholar] [CrossRef]
  10. Zhang, D.; He, M.; Qin, S.; Yu, J. Effect of fiber length and dispersion on properties of long glass fiber reinforced thermoplastic composites based on poly(butylene terephthalate). RSC Adv. 2017, 7, 15439–15454. [Google Scholar] [CrossRef]
  11. Gröning, M.; Hakkarainen, M.; Albertsson, A.C. Recycling of glass-fibre reinforced phenolic prepreg waste. Part 2. Milled prepreg as functional filler in PP and PA6. Polym. Polym. Compos. 2004, 12, 501–509. [Google Scholar] [CrossRef]
  12. DeRosa, R.; Telfeyan, E.; Gaustad, G.; Mayes, S. Strength and microscopic investigation of unsaturated polyester BMC reinforced with SMC-recyclate. J. Thermoplast. Compos. Mater. 2005, 18, 333–349. [Google Scholar] [CrossRef]
  13. Sridhar, A.; Adusumalli, R.B.; Doddipatla, P.; Venkateshan, K.C. Comparative study between dry and wet properties of thermoplastic PA6/PP novel matrix-based carbon fibre composites. Sci. Eng. Compos. Mater. 2021, 28, 579–591. [Google Scholar] [CrossRef]
  14. Pal, S.K.; Kale, D.D. Effect of processing conditions and properties of PP/nylon 6 blends. J. Polym. Res. 2000, 7, 107–113. [Google Scholar] [CrossRef]
  15. Ginder, R.S.; Ozcan, S. Recycling of commercial E-glass reinforced thermoset composites via two temperature step pyrolysis to improve recovered fiber tensile strength and failure strain. Recycling 2019, 4, 24. [Google Scholar] [CrossRef]
  16. Beauson, J.; Madsen, B.; Toncelli, C.; Brøndsted, P.; Ilsted Bech, J. Recycling of shredded composites from wind turbine blades in new thermoset polymer composites. Compos. Part A Appl. Sci. Manuf. 2016, 90, 390–399. [Google Scholar] [CrossRef]
  17. Stewart, K.M.E.; Stonecipher, E.; Ning, H.; Pillay, S.B. Mixing rules for high density polyethylene-polypropylene blends. Can. J. Chem. Eng. 2023, 101, 5395–5407. [Google Scholar] [CrossRef]
  18. Bernatas, R.; Dagreou, S.; Despax-Ferreres, A.; Barasinski, A. Recycling of fiber reinforced composites with a focus on thermoplastic composites. Clean. Eng. Technol. 2021, 5, 100272. [Google Scholar] [CrossRef]
  19. ASTM E11; Standard Specification for Woven Wire Test Sieve Cloth and Test Sieves. ASTM International: West Conshohocken, PA, USA, 2024.
  20. Schindelin, J.; Arganda-Carreras, I.; Frise, E.; Kaynig, V.; Longair, M.; Pietzsch, T.; Preibisch, S.; Rueden, C.; Saalfeld, S.; Schmid, B.; et al. Fiji: An open-source platform for biological-image analysis. Nat. Methods 2012, 9, 676–682. [Google Scholar] [CrossRef]
  21. Ning, H.; Lu, N.; Hassen, A.A.; Chawla, K.; Selim, M.; Pillay, S. A review of Long fibre thermoplastic (LFT) composites. Int. Mater. Rev. 2020, 65, 165–188. [Google Scholar] [CrossRef]
  22. ASTM D3171-22; Standard Test Methods for Constituent Content of Composite Materials. ASTM International: West Conshohocken, PA, USA, 2020.
  23. Tan, Y.; Wang, X.; Wu, D. Preparation, microstructures, and properties of long-glass-fiber-reinforced thermoplastic composites based on polycarbonate/poly(butylene terephthalate) alloys. J. Reinf. Plast. Compos. 2015, 34, 1804–1820. [Google Scholar] [CrossRef]
  24. ASTM D792-20; Standard Test Methods for Density and Specific Gravity (Relative Density) of Plastics by Displacement. ASTM International: West Conshohocken, PA, USA, 2020.
  25. ASTM D5229/D5229M-20; Standard Test Method for Moisture Absorption Properties and Equilibrium Conditioning of Polymer Matrix Composite Materials. ASTM International: West Conshohocken, PA, USA, 2020.
  26. ASTM D3039/D3039M-17; Standard Test Method for Tensile Properties of Polymer Matrix Composite Materials. ASTM International: West Conshohocken, PA, USA, 2017.
  27. ASTM D7264/D7264M-21; Standard Test Method for Flexural Properties of Polymer Matrix Composite Materials. ASTM International: West Conshohocken, PA, USA, 2021.
  28. ASTM D256; Standard Test Methods for Determining the Izod Pendulum Impact Resistance of Plastics. ASTM International: West Conshohocken, PA, USA, 2024.
  29. Delli, E.; Giliopoulos, D.; Bikiaris, D.N.; Chrissafis, K. Fibre length and loading impact on the properties of glass fibre reinforced polypropylene random composites. Compos. Struct. 2021, 263, 113678. [Google Scholar] [CrossRef]
  30. Qiao, J.; Zhang, Q.; Wu, C.; Wu, G.; Li, L. Effects of Fiber Volume Fraction and Length on the Mechanical Properties of Milled Glass Fiber/Polyurea Composites. Polymers 2022, 14, 3080. [Google Scholar] [CrossRef]
  31. Fu, S.Y.; Lauke, B. Effects of fiber length and fiber orientation distributions on the tensile strength of short-fiber-reinforced polymers. Compos. Sci. Technol. 1996, 56, 1179–1190. [Google Scholar] [CrossRef]
  32. Thomason, J.L. The interface region in glass fibre-reinforced epoxy resin composites: 1. Sample preparation, void content and interfacial strength. Composites 1995, 26, 467–475. [Google Scholar] [CrossRef]
  33. Inceoglu, F.; Ville, J.; Ghamri, N.; Pradel, J.L.; Durin, A.; Valette, R.; Vergnes, B. Correlation between processing conditions and fiber breakage during compounding of glass fiber-reinforced polyamide. Polym. Compos. 2011, 32, 1842–1850. [Google Scholar] [CrossRef]
  34. Quijano-Solis, C.; Yan, N.; Zhang, S.Y. Effect of mixing conditions and initial fiber morphology on fiber dimensions after processing. Compos. Part A Appl. Sci. Manuf. 2009, 40, 351–358. [Google Scholar] [CrossRef]
  35. Khanam, P.N.; AlMaadeed, M.A.A. Processing and characterization of polyethylene-based composites. Adv. Manuf. Polym. Compos. Sci. 2015, 1, 63–79. [Google Scholar] [CrossRef]
  36. De Sáenz Juano-Arbona, V.; Vallés-Lluch, A.; Contat-Rodrigo, L.; Ribes-Greus, A. Chemical and thermal characterization of high- and low-density irradiated polyethylenes. J. App. Pol. Sci. 2002, 86, 1953–1958. [Google Scholar] [CrossRef]
  37. Gu, R.; Sain, M.M. Effects of Wood Fiber and Microclay on the Performance of Soy Based Polyurethane Foams. J. Polym. Environ. 2013, 21, 30–38. [Google Scholar] [CrossRef]
  38. Reddy, K.S.K.; Gao, W.J.; Chen, C.H.; Juang, T.Y.; Abu-Omar, M.M.; Lin, C.H. Degradation of Thermal-Mechanically Stable Epoxy Thermosets, Recycling of Carbon Fiber, and Reapplication of the Degraded Products. ACS Sustain. Chem. Eng. 2021, 9, 5304–5314. [Google Scholar] [CrossRef]
  39. Polińska, M.; Rozanski, A.; Galeski, A.; Bojda, J. The Modulus of the Amorphous Phase of Semicrystalline Polymers. Macromolecules 2021, 54, 9113–9123. [Google Scholar] [CrossRef]
  40. Jordan, J.L.; Casem, D.T.; Bradley, J.M.; Dwivedi, A.K.; Brown, E.N.; Jordan, C.W. Mechanical Properties of Low Density Polyethylene. J. Dyn. Behav. Mater. 2016, 2, 411–420. [Google Scholar] [CrossRef]
  41. Wang, Y.; Wang, C.; Dong, S.; Zu, L.; Lan, T. The study on microstructure and mechanical properties of multi-component composite based on HDPE. Des. Monomers Polym. 2020, 23, 164–176. [Google Scholar] [CrossRef] [PubMed]
  42. Mahmud, M.B.; Anstey, A.; Shaayegan, V.; Lee, P.C.; Park, C.B. Enhancing the mechanical performance of PA6 based composites by altering their crystallization and rheological behavior via in-situ generated PPS nanofibrils. Compos. Part B Eng. 2020, 195, 108067. [Google Scholar] [CrossRef]
  43. Franzén, B.; Klason, C.; Kubát, J.; Kitano, T. Fibre degradation during processing of short fibre reinforced thermoplastics. Composites 1989, 20, 65–76. [Google Scholar] [CrossRef]
  44. Naito, K.; Nagai, C. Effects of temperature and water absorption on the interfacial mechanical properties of carbon/glass-reinforced thermoplastic epoxy hybrid composite rods. Compos. Struct. 2022, 282, 115103. [Google Scholar] [CrossRef]
  45. Camino, G.; Luda, M.P.; Polishchuk, A.Y.; Revellino, M.; Blancon, R.; Merle, G.; Martinez-Vega, J. Kinetic aspects of water sorption in polyester-resin/glass-fibre composites. Compos. Sci. Technol. 1997, 57, 1469–1482. [Google Scholar] [CrossRef]
  46. Sala, G. Composite degradation due to fluid absorption. Compos. Part B Eng. 2000, 31, 357–373. [Google Scholar] [CrossRef]
  47. Thomason, J.L. The interface region in glass fibre-reinforced epoxy resin composites: 2. Water absorption, voids and the interface. Composites 1995, 26, 477–485. [Google Scholar] [CrossRef]
  48. Zhou, P.; Li, C.; Bai, Y.; Dong, S.; Xian, G.; Vedernikov, A.; Akhatov, I.; Safanov, A.; Yue, Q. Durability study on the interlaminar shear behavior of glass-fibre reinforced polypropylene (GFRPP) bars for marine applications. Constr. Build. Mater. 2022, 349, 128694. [Google Scholar] [CrossRef]
  49. Cui, J.; Wang, S.; Wang, S.; Li, G.; Wang, P.; Liang, C. The effects of strain rates on mechanical properties and failure behavior of long glass fiber reinforced thermoplastic composites. Polymers 2019, 11, 2019. [Google Scholar] [CrossRef]
  50. Carotenuto, G.; De Nicola, S.; Palomba, M.; Pullini, D.; Horsewell, A.; Hansen, T.W.; Nicolais, L. Mechanical properties of low-density polyethylene filled by graphite nanoplatelets. Nanotechnology 2012, 23, 485705. [Google Scholar] [CrossRef] [PubMed]
  51. Cao, Z.; Daly, M.; Geever, L.M.; Major, I.; Higginbotham, C.L.; Devine, D.M. Synthesis and characterization of high density polyethylene/peat ash composites. Compos. Part B Eng. 2019, 94, 312–321. [Google Scholar] [CrossRef]
  52. Heflin, D.G.; Mansson, J.A.E. Mechanisms for combining polyamide and epoxy and their effects on mechanical performance—A review. Polym. Polym. Compos. 2022, 30, 1–19. [Google Scholar] [CrossRef]
  53. Tohidi, S.D.; Denchev, Z.; Dencheva, N.V.; Rocha, A.M.; Rosa, L.A.; Engesser, B. Development of polyamide 6 based single polymer composites reinforced by novel stitched plain fabrics. Mater. Today Commun. 2020, 24, 101068. [Google Scholar] [CrossRef]
  54. Karakaya, N.; Papila, M.; Özkoç, G. Overmolded hybrid composites of polyamide-6 on continuous carbon and glass fiber/epoxy composites: ‘An assessment of the interface’. Compos. Part A Appl. Sci. Manuf. 2020, 131, 105771. [Google Scholar] [CrossRef]
  55. Sadik, W.A.; El-Demerdash, A.G.M.; Abokhateeb, A.E.A.; Elessawy, N.A. Innovative high-density polyethylene/waste glass powder composite with remarkable mechanical, thermal and recyclable properties for technical applications. Heliyon 2021, 7, e06627. [Google Scholar] [CrossRef]
  56. Åkesson, D.; Krishnamoorthi, R.; Foltynowicz, Z.; Christéen, J.; Kalantar, A.; Skrifvars, M. Glass fibres recovered by microwave pyrolysis as a reinforcement for polypropylene. Polym. Polym. Compos. 2013, 21, 333–340. [Google Scholar] [CrossRef]
  57. Ye, L.; Lu, M.; Mai, Y.W. Thermal de-consolidation of thermoplastic matrix composites-I. Growth of voids. Compos. Sci. Technol. 2022, 62, 2121–2130. [Google Scholar] [CrossRef]
  58. Tapper, R.J.; Longana, M.L.; Yu, H.; Hamerton, I.; Potter, K.D. Development of a closed-loop recycling process for discontinuous carbon fibre polypropylene composites. Compos. Part B Eng. 2018, 146, 222–231. [Google Scholar] [CrossRef]
  59. Asmare, S.; Yoseph, B.; Jamir, T.M. Investigating the impact resistance of E-glass/Polyester composite materials in variable fiber-to-matrix weight ratio composition. Cogent Eng. 2023, 10, 2178110. [Google Scholar] [CrossRef]
  60. Avinash, S.; Karunagaran, N. Izod impact behaviouron e-glass fibre reinforced with epoxy matrix addition of novel ButeaMonosperma filler in comparison with plain GFRP epoxy hybrid composites. AIP Conf. Proc. 2023, 2822, 020187. [Google Scholar] [CrossRef]
Figure 1. Process flow of second-generation thermoplastic composite (STC) panel manufacturing.
Jcs 09 00565 g001
Figure 2. Thermoset matrix-coated fiber bundles.
Jcs 09 00565 g002
Figure 3. Appearance of EPGs after sieving for (a) coarse fiber bundles and (b) EPG powders.
Jcs 09 00565 g003
Figure 4. Length and weight distributions of the recycled fibers.
Jcs 09 00565 g004
Figure 5. Surface conditions of EPG bundles: (a) powder adhered to the surface and (b) matrix residues.
Jcs 09 00565 g005
Figure 6. The glass fiber content in sieved EPGs.
Jcs 09 00565 g006
Figure 7. Plot of the average glass fiber length distribution in STCs.
Jcs 09 00565 g007
Figure 8. TGA curves of STCs in a nitrogen atmosphere. (a) LDPE samples, (b) HDPE samples, and (c) PA6 samples.
Jcs 09 00565 g008
Figure 9. DSC curves of STCs in a nitrogen atmosphere. (a) LDPE samples, (b) HDPE samples, and (c) PA6 samples.
Jcs 09 00565 g009aJcs 09 00565 g009b
Figure 10. Water absorption results. (a) LDPE–thermoset scraps, (b) HDPE–thermoset scraps, and (c) PA6–thermoset scraps.
Jcs 09 00565 g010
Figure 11. Optical microscopy image obtained for LDPE/EPG (50:50), mag. 200×.
Jcs 09 00565 g011
Figure 12. Images of the internal structures of LDPE/EPG, mag. 300×, (a) shear effect, and (b) fiber interactions and gaps.
Jcs 09 00565 g012
Figure 13. Internal structure distribution of STCs (50:50): (a) HDPE/EPG (50:50), mag. 400×, and (b) HDPE/EPG (50:50), mag. 700×.
Jcs 09 00565 g013
Figure 14. SEM images of the fracture surface of STCs. (a) H3, 30 wt%; (b) H5, 50 wt%; (c) L2, 20 wt%; (d) L4, 40 wt%; (e) P1, 10 wt%; and (f) P5, 50 wt%.
Jcs 09 00565 g014
Figure 15. The stress–strain curves for LDPE and LDPE composites with increasing contents of EPG.
Jcs 09 00565 g015
Figure 16. (a) Tensile modulus and (b) tensile strength of LDPE and LDPE composites.
Jcs 09 00565 g016
Figure 17. The stress–strain curves for neat HDPE and HDPE composites with increasing contents of EPG.
Jcs 09 00565 g017
Figure 18. (a) Tensile modulus and (b) tensile strength of HDPE and HDPE composites.
Jcs 09 00565 g018
Figure 19. The stress–strain curves for PA6 composites with increasing contents of EPG.
Jcs 09 00565 g019
Figure 20. (a) Tensile modulus and (b) tensile strength of PA6 and PA6 composites.
Jcs 09 00565 g020
Figure 21. SEM image showing cracks in the EPG inside the STCs.
Jcs 09 00565 g021
Figure 22. Flexural test results for the STCs: (a) LDPE, (b) HDPE, and (c) PA6 composites.
Jcs 09 00565 g022
Figure 23. Izod impact energies for all STCs.
Jcs 09 00565 g023
Figure 24. Positions and locations of the fiber bundles after the Izod impact test.
Jcs 09 00565 g024
Table 1. Formulations of the second-generation composites (STCs).
Definition of STCsThermoplastic MatrixThermoset Scraps (wt%)
Typewt%
L1LDPE9010
L28020
L37030
L46040
L55050
H1HDPE9010
H28020
H37030
H46040
H55050
P1PA69010
P28020
P37030
P46040
P55050
Table 2. Material fractions obtained from glass fiber–epoxy–polyurethane foam scraps.
Sieve IdentificationSieve DimensionsDescription of the Resulting EPG MaterialsWeight Percentage (%)
no. 4>4.75 mmcoarse fiber bundles45.53%
no. 5>4 mmmedium fiber bundles7.00%
no. 6>3.35 mmsmall fiber bundles5.43%
no. 25>0.71 mmdusty fiber bundles31.78%
no. 30>0.6 mmcoarse EPG powder4.88%
no. 40>0.425 mmmedium EPG powder2.03%
no. 140>0.106 mmsmall EPG powder1.22%
under sieve<0.106 mmfine EPG powder2.13%
Table 3. Glass fiber contents of the produced STCs.
Definition of STCsLoading FractionPost-Test Content
Matrix (wt%)EPG Scraps (wt%)Matrix (wt%)Glass Fiber (wt%)σSD 1
L1901092.047.960.47
L2802084.1615.840.66
L3703076.3923.610.66
L4604068.9031.101.65
L5505059.6340.372.05
H1901092.027.980.33
H2802084.0515.950.59
H3703076.2623.740.77
H4604068.1431.861.70
H5505059.7140.291.44
P1901091.998.010.26
P2802084.0615.940.69
P3703075.9524.051.44
P4604067.9532.051.51
P5505059.8440.162.54
1 Standard deviation of the glass fiber content.
Table 4. T5%, Tmax, and residues of STCs.
Definition of STCsT5%/°CTmax1%/°CTmax2%/°CResidues at 700 °C (%)
LDPE394.74458-2.5
L4357.4321.8487.226.71
L5343.4331.1491.133.48
HDPE420490.8-2.6
H4400.3417.2485.623.58
H5399.7421.2484.345.67
PA6391.6456-0.4
P4322.3341.4453.426.66
P5312.4347.6451.738.68
Table 5. Characteristic temperatures for thermal events in the STCs.
Definition of STCsTom (°C)Tm (°C)Tc (°C)Xc (%)
LDPE117.1130.6110.8562.20%
L4118.5129.611130.56%
L5120.3130.5110.923.73%
HDPE126.3134.25114.9556.40%
H4120.5130.3115.947.42%
H5121.4130.2115.344.29%
PA6213.1227.418931.10%
P4204.3218.8186.727.18%
P5198.2213.917823.07%
Table 6. Density measurement results for STCs.
Definition of STCsLoading FractionPost-Test Content
Matrix (wt%)EPG Scraps (wt%)Density g/cm3σSD (*)
L190100.960.021
L280201.070.020
L370301.090.021
L460401.190.032
L550501.200.051
H190100.980.016
H280201.040.031
H370301.090.013
H460401.190.035
H550501.210.064
P190101.180.007
P280201.240.004
P370301.310.014
P460401.380.008
P550501.440.009
(*) Standard deviation of density.
Table 7. Initial Fickian diffusion parameters derived from water sorption data.
Definition of STCsInitial Mass (g)Saturated Mass (g)Coefficient of DeterminationDiffusion Coefficient (m2/s)
L15.63835.63980.9935.13 × 10−13
L25.42025.42180.9554.97 × 10−13
L35.88035.88190.9686.15 × 10−13
L45.74575.74740.9659.92 × 10−13
L55.57095.57250.9651.33 × 10−12
H15.38435.38560.9333.58 × 10−13
H25.96855.97020.9815.26 × 10−13
H36.02456.02620.9107.51 × 10−13
H45.74655.74830.9359.43 × 10−13
H55.41225.41390.9621.24 × 10−12
P16.1446.23890.9328.35 × 10−13
P25.99986.09370.8668.12 × 10−13
P36.14596.24340.8487.09 × 10−13
P46.23746.33910.8819.61 × 10−13
P56.47536.58180.8971.05 × 10−12
Table 8. Results of the Izod impact test for STCs.
Definition of STCsTest Results
Break Energy (J)σSD (*)Izod Impact Strength (kJ/m2)σSD (*)
L11.650.0640.581.34
L21.370.0534.931.51
L31.080.0222.370.77
L40.790.0719.631.36
L50.580.0816.902.87
H10.710.1914.783.94
H20.610.1313.482.85
H30.620.1610.921.88
H40.580.1012.501.62
H50.330.065.160.86
P10.580.1716.954.46
P20.510.0713.782.03
P30.280.137.493.39
P40.390.078.201.20
P50.320.094.601.04
(*) Standard deviation.
Disclaimer/Publisher’s Note: The statements, opinions and data contained in all publications are solely those of the individual author(s) and contributor(s) and not of MDPI and/or the editor(s). MDPI and/or the editor(s) disclaim responsibility for any injury to people or property resulting from any ideas, methods, instructions or products referred to in the content.