Abstract
This work provides a comparison of two commercial carbon fiber reinforced plastic (CFRP) materials: HexPly® M18 1/G939 and RTM6/G939. Differences due to the additional thermoplastic in one CFRP are investigated for the two otherwise nearly identical, aromatic epoxy-based composites with respect to thermal degradation. The scenario chosen for testing is based on real incidents of repeated overheating by hot gases between roughly 200 and 320 °C, leading to moderate thermal damage. A special test setup is designed to continuously and alternately load CFRP with hot air in a rapid change. Post-mortem analysis is performed by mass loss, ultrasonic, and mechanical testing. Polymer degradation is analyzed by infrared spectroscopy. Even if the temperature-resistant thermoplastic polyetherimide (PEI) in the M18-1 matrix is enriched between the plies and a compensation of thermal strain during rapid temperature changes is expected, only a weak improvement is observed for residual strength in the presence of PEI, for continuous as well as alternating thermal loading. Thermally induced delaminations are even more pronounced in M18-1/G939. Deep insight is gained into degradation after repeated overheating of CFRP within the chosen scenario. Multivariate data analyses based on infrared spectroscopy allow for the determination of thermal history and residual strength, valuable for failure analysis.
1. Introduction
Carbon fiber-reinforced plastic materials (CFRP) are widely used in aircraft construction because of their lightweight properties [1,2,3,4,5,6,7]. However, due to the polymer content, their thermal resistance is limited [8]. Thermal damage of in-service aircraft components has been reported for scenarios with overheating of electronic components or brakes, mistakes and accidents during repair [9,10], impact of fire [11,12,13], or lightning strike [14], etc. In a military context, weapon strikes such as Molotov cocktails [15,16,17] or by high-energy lasers [18] are also relevant. For typical scenarios, thermal damage is initiated from one side of the material [19]. Within this paper, a focus is laid on damage induced by hot air, as relevant for hot exhaust gases from aircraft turbines or by launching rockets from an aircraft [20]. These thermal loads are short-term, without reaching a thermal equilibrium, but leading to steep temperature gradients through the composite material. More importantly, these thermal events do not often occur as a single incident but happen repeatedly and are accompanied by rapid heating and cooling cycles, which imply additional temperature gradients and thermal strain in the material.
Mechanisms of thermal damage of polymer composites start with the debonding of fiber and resin due to the preferred degradation of the interphase [21]. At higher thermal loads, delamination of fiber plies and formation of cracks [22,23,24] are accompanied by decomposition of the polymer matrix [25,26]. During excessive heating, areas of resin-depleted fibers, areas with cracks in the polymer matrix, and nearly intact matrix are observed through the cross-section of a component when heated from one side [27]. At very high temperatures beyond 600 °C, even carbon fibers are decomposed in air. Within this work, a moderate level of thermal degradation is investigated, when the resin starts to decompose at the hot side of the specimens, accompanied by delaminations underneath. However, in this scenario, no pronounced areas of resin depletion are expected, and mass loss due to formation of volatile decomposition products is below 5 wt% [28].
The ability to quantify thermal damage of CFRP is of major importance in aircraft service, structural health monitoring, and failure analysis [29]. Analytical techniques to evaluate degradation effects are preferably easy to use, fast, and non-destructive [30]. Ultrasonic and thermographic examinations, computer tomography (µCT), or hammer tapping can only be applied when pronounced thermal damage, such as delaminations, has already occurred in a composite component [31,32]. For an incipient thermal damage, the decomposition of the polymer matrix can be analyzed by methods such as laser-induced fluorescence [33] or, a more established method, using infrared spectroscopy [34,35]. Infrared spectroscopy was additionally applied to characterize thermal degradation along the depth profile of CFRP specimens [19] and to assess the occurrence of delaminations [36], in order to precisely predict residual strength [37]. Under certain conditions, the residual strength of an overheated composite component may decrease below 50% of the initial value, and yet remains undetectable by ultrasonic testing, but may very well be detectable, for example, by infrared spectroscopy [38,39]. For this work, typical damages are investigated, which start from incipient heat damages slightly beyond the glass transition temperature of the resin, reaching more pronounced damages, which are visually observable and accompanied by delaminations. Therefore, thermal load between 200 °C and 330 °C is chosen for the epoxy-based composites.
Epoxy-based CFRP is often applied in aircraft construction. In order to overcome their brittleness and to improve their impact tolerance and thermal properties, they are typically modified by thermoplastic tougheners, which are more temperature resistant than the epoxy resin [40,41]. Examples of tougheners for this purpose are poly(ether)imides, poly(ether)sulfones, or bismaleinimides, etc. Mechanisms of energy dissipation and damping performance are described, for example, in [42]. Within this work, two commercial carbon fiber-reinforced epoxy systems: HexPly® M18-1/G939 and Hexflow® RTM6/G939 by Hexcel Corp. are investigated. They primarily differ in the additional content of a thermoplastic toughener polyetherimide (PEI) in the M18-1 resin, whereas epoxy resin (EP) and fiber reinforcement are nearly identical. PEI provides a slightly higher glass transition temperature (~217 °C) than EP (~200 °C) [43].
A first goal of this work is to assess whether the additional thermoplastic improves the thermal resistance of the CFRP under the chosen thermal loading scenarios. Additionally, it is investigated whether there is an influence of alternating versus continuous thermal loading, and whether the thermoplastic modifier is able to improve the composites’ mechanical performance, especially for repeated overheating. With an enriched concentration of polyetherimide between the fiber plies, M18-1/G939 may be more tolerant towards alternating thermal load, as the thermoplastic may contribute to a compensation of thermally induced strain between the fiber plies. Finally, various non-destructive evaluation methods are compared to ideally quantify the residual strength of the thermally loaded composites. Focus is laid on the chemometric analysis of infrared spectra.
2. Materials and Methods
2.1. Materials
All tests were performed on the commercial carbon fiber-reinforced epoxy systems HexPly® M18-1/G939 and Hexflow® RTM6/G939 by Hexcel (Stade, Germany). Material data is summarized in Table 1. RTM6 is a pure epoxy resin (TGMDA, MBDA, MBIMA, DDS) typically used for resin transfer molding. In contrast, the matrix of M18-1/G939 prepregs consists of the same epoxy resin (EP), which is, however, toughened with a temperature-resistant thermoplastic polyetherimide (PEI). PEI is not homogeneously distributed in the EP matrix but enriched between the plies in M18-1/G939 [39] (see Figure 1). M18-1/G939 additionally contains flame retardants: magnesium hydroxide and zinc borate act at temperatures beginning from 350 °C [44], uncritical for the investigated temperature range. Fiber mass fraction is ~54 wt% for the two CFRP systems. All investigated laminates consist of 2 mm thick quasi-isotropic (QI) lay-ups. For thermogravimetric investigations, polymeric components were extracted directly from the prepreg. First, the epoxy resin is dissolved by acetone, and, afterwards, polyetherimide is separated by dimethylformamide in a Soxhlet apparatus [40].
The M18-1/G939 prepreg laminates were cured in an autoclave according to the manufacturer’s recommended conditions at a maximum temperature of 180 °C [43]. In the uncured prepreg material, the average molecular weight of the epoxy component is 900 g/mol and >100,000 g/mol for PEI [40]. The seizing of the G939 carbon fiber fabric is proprietary but was analyzed by pyrolysis–gas chromatography/mass spectrometry to be based on a bisphenol-A epoxy component. RTM6/G939 is hand laminated according to [45] and cured at a maximum temperature of 180 °C.
The cured laminates were cut with a water-cooled diamond wheel saw and visually inspected for surface defects. Ultrasonic C-scans were performed to ensure that the test laminates were free of delamination, voids and fiber orientation errors.

Figure 1.
ATR-FTIR microscopic image of a cross section through an M18-1/G939 sample showing the inhomogeneous distribution of EP (blue) and PEI (orange) by a cluster analysis of IR spectra with analyzed bands at 1780 cm−1 for PEI and 1510 cm−1 for EP; green areas can not be grouped; each red square is one ATR measuring spot [46].

Table 1.
Investigated material [40,47].
Table 1.
Investigated material [40,47].
| CFRP | Type | Polymer Content * | Flame Retardants | Lay-Up (2 mm) |
|---|---|---|---|---|
| RTM6/G939 | resin + fabric | EP: ~47 wt% | - | 8 plies: [(+45/−45)(90/0) (−45/45)(0/90)]S |
| M18-1/G939 | fabric prepreg | EP: ~36 wt% PEI: ~6 wt% | Zinc borate: ~1.6 wt% Magnesium hydroxide: ~1.6 wt% |
* EP: Tetraglycidylmethylenedianiline (TGMDA), 4,4′-Methylenbis-(2,6-diethylanilin) (MBDA), 4,4′-Methylenbis-(2-isopropyl-6-methylanilin) (MBIMA), 4,4′-Diaminodiphenylsulfone (DDS); PEI: Polyetherimide.
Mass fraction of carbon fibers for both CFRP after curing: ~54 wt%.
2.2. Experimental
The 100 mm × 100 mm × 2 mm specimens were supported vertically by a metal clamp with minimum thermal contact to the composite. Specimens were charged with a hot-air blower LEISTER Triac S (1.6 kW, jet diameter: 20 mm; distance to specimen: 40 mm) by Leister Process Technologies (Kägiswil, Switzerland) with a maximum air temperature at the nozzle of 580 °C determined by type K thermocouples. Air stream at 20 °C is 230 L/min; air speed (wheel anemometer) is 3.1 m/s. For one-sided thermal loading, temperatures at the samples’ surface between 200 °C and 330 °C for up to 1 h were chosen (for exact conditions, see Table 2).

Table 2.
Chosen conditions (surface temperature and time) for continuous (c) and cyclic (a) hot-air loading of M18-1/G939 and RTM6/G939 CFRP. Cyclic loading implies 8, 16, 24, and 32 temperature cycles for 15, 30, 45, and 60 min, respectively.
Surface temperatures of the hot-air-treated specimens were recorded with a high-resolution thermal imaging camera (Typ PI 160, Optris, 160 × 120 pixel; pixel size: 25 µm × 25 µm; temperature range: −20 °C to 900 °C; sampling rate: 4 Hz) [48]. The correlation of air temperature at the nozzle (Ta) and the samples’ surface temperature (Ts) is given in Figure 2. Temperatures determined by the thermal imaging camera were verified with a thermocouple attached to the air blower’s nozzle and corrected. The camera simultaneously recorded all temperatures in one image. Lateral temperature distribution over the small samples’ surface is determined to be nearly constant. Back-side temperatures (“not impinged side”) were not recorded routinely, but are roughly 10 °C lower when the maximum front side temperature is reached.
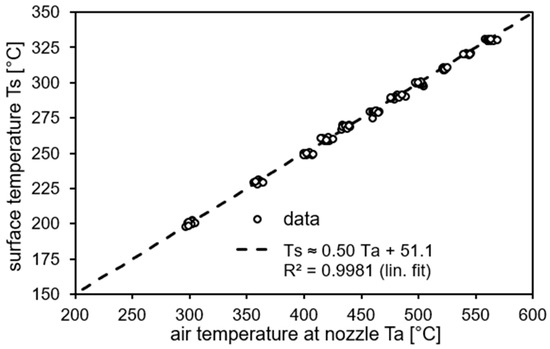
Figure 2.
Correlation of air temperature at the blower nozzle (Ta) and temperature at CFRP sample surface (Ts) in thermal equilibrium (front side, 40 mm distance; standard deviation: 2–4 °C).
For a cyclic thermal load, the samples were repeatedly positioned in the hot-air stream and afterwards in an air stream at room temperature with the same flow conditions by a robotic arm (KUKA, Augsburg, Germany). A typical temperature profile is exemplarily given in Figure 3. The duration of heating was chosen to be 120 s, and for cooling, to 60 s for each cycle. To make the continuous and alternating heat load comparable, the integral over temperature was chosen for the continuous and alternating thermal load. As a result, 15 min of continuous thermal load are best correlated to an alternating thermal load of 8 heating and cooling cycles; 30 min of constant load is comparable to 16 cycles, 45 min to 24 cycles, and 60 min to 32 cycles.
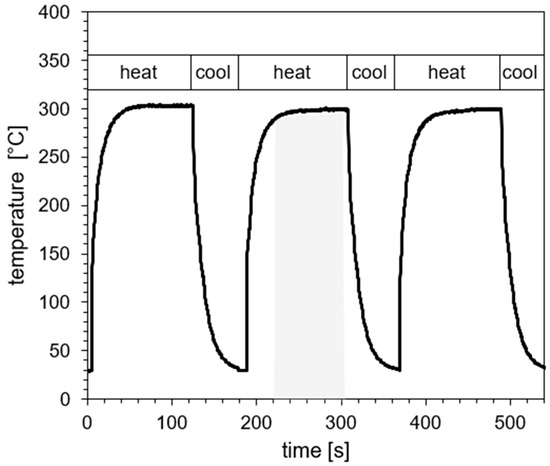
Figure 3.
Exemplary section of a profile for the temperature at the samples’ surface for an alternating heat load (heating and cooling) of max. 300 °C. (Air temperature at nozzle: 500 °C). The gray shaded area exemplarily represents the duration of thermal load used for comparison with continuous load (T = Ttarget − 5 °C, see text).
In order to compare heat damage for continuous and alternating thermal loads, time intervals are defined in the temperature profiles of alternating loads, which begin 5 °C below the target temperature (see shaded area in Figure 3). This time interval is typically 85 ± 5 s, averaged for all experiments. Therefore, the product of this time interval and the number of cycles is used for a comparison with the continuous loading scenario, meaning: 8 cycles correspond to 11.3 min; 16 cycles to 22.7 min; 24 cycles to 34.0 min; and 32 cycles to 45.3 min.
Masses were determined with an accuracy of 0.01 mg for three samples for each loading condition. Original masses were determined after drying at 70 °C for two weeks. Fiber to matrix ratios were determined according to EN 2564 [49] by dissolution of the matrix in concentrated sulphuric acid and 30% hydrogen peroxide and subsequent gravimetric analysis. Interlaminar Shear Strength (ILSS) tests were performed in accordance with DIN EN 2563 [50]. Changes in the composition of the polymer matrix were analyzed by micro-attenuated total reflection Fourier Transform Infrared Spectroscopy (µ-ATR-FTIR). Spectra were recorded with a hand-held Agilent Exoscan 4100 spectrometer (Waldbronn, Germany) equipped with a diamond ATR crystal (diameter: 0.1 mm) at the specimen surface. Four spectra were recorded close to the center of each sample. Chemometric analyses were performed with the Quant2 module of the Bruker OPUS® software (version 7).
Thermogravimetric analyses (TGA) were carried out with a TA Instruments TGA/DTA SDT 2960 under nitrogen and synthetic air (heating rate: 10 °C/min, sample mass: 20 ± 0.1 mg, flow: 100 mL/min). All composite samples were ground prior to analysis with a cutting mill, resulting in particles containing fibers shorter than 3 mm. All TGA samples were measured twice.
Ultrasonic c-scans were recorded with an HFUS 2000 by Dr. Hillger (Braunschweig, Germany).
3. Results
3.1. Basic Characterization of Thermal Damage
In order to obtain extensive data for a correlation with thermal loading conditions and for a basic characterization of thermal properties of the two composites, mass loss and residual ILS strength were determined, and ultrasonic testing was carried out for a large number of conditioned samples. Additionally, thermogravimetric analyses were performed, and infrared spectra were recorded to characterize polymer degradation.
3.2. Thermogravimetric Analysis
To contextualize the temperatures employed in the experiments with a hot-air blower, thermogravimetric analyses in air as well as nitrogen atmosphere were performed. In detail, samples of M18-1/G939 (“with thermoplastic”) and RTM6/G939 (“without thermoplastic”) composites, as well as polymer components thereof, PEI (from M18-1) and EP (epoxy resin, from RTM6), were investigated. The results are shown in Figure 4. In a nitrogen atmosphere, a 5% mass loss is reached at 348 °C for EP and at 383 °C for PEI. The main mass loss of PEI at those temperatures is caused by solvent residues since the thermoplastic was extracted from M18-1/G939 prepregs. Nevertheless, a high thermal stability of PEI in comparison to the EP is indicated. A 5% mass loss for the composites is reached at 353 °C for RTM6/G939 and at 357 °C for M18-1/G939, similar to the temperature of EP, but already influenced by the PEI content in M18-1/G939.
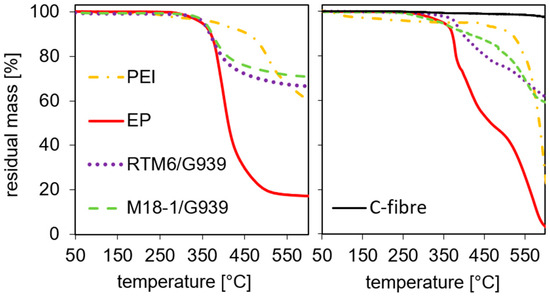
Figure 4.
TG measurements of PEI, epoxy resin (EP), RTM6/G939, and M18-1/G939 in nitrogen (left) and air (right). Additionally, the curve for carbon fibers measured in air is given.
Since measurements in nitrogen neglect the influence of oxygen in air, which is present in the experiments using a hot-air blower, reaching surface temperatures between 200 °C and 330 °C, TG measurements in air were carried out as well. At 200 °C, there is only an initial mass loss for PEI observed, which can be fully attributed to solvent evaporation. At 300 °C, the residual mass is quite different for the various samples. It is 98% for EP, 97% for M18-1/G939, 99% for RTM6/G939, and 100% for carbon fibers. Since the curve of PEI shows a plateau at 95% residual mass, this mass loss is assigned in its entirety to solvent evaporation. An additional 5% mass loss after this plateau is reached at 512 °C, which exceeds the observed temperatures in the following experiments by far. For the other samples, 5% mass loss is observed at 340 °C for M18-1/G939, 350 °C for EP, 377 °C for RTM6/G939, and 635 °C for carbon fibers. Since PEI and carbon fibers show little mass loss for the temperatures used in further experiments, the entire mass loss can be attributed to the thermal decomposition of the epoxy resin.
3.3. Mass Loss
Figure 5 shows the mass loss at different temperatures in dependence on time for continuous (red) and cyclic (black) thermal loads with a hot-air blower. Mass loss increases with temperature and time. Yet, the most distinctive changes in mass occur in the first 20 min of heating.
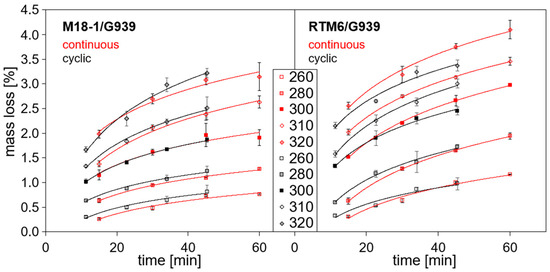
Figure 5.
Mass loss in dependence on time for different loading temperatures at the surface of the front side of the samples starting from 260 °C: continuous (red) and cyclic (black) thermal load with a hot-air blower.
Firstly, the mass loss for continuous thermal load is compared. While the mass loss is almost similar for RTM6/G939 and M18-1/G939 at temperatures between 200 °C and 230 °C (not depicted in Figure 5), the mass loss of RTM6/G939 (“without thermoplastic”) samples increases more rapidly than for M18-1/G939 (“with thermoplastic”) samples. This is shown in Table 3. It presents the mass loss after 15 and 60 min for selected temperatures beginning from 200 °C. The difference between mass loss for identically treated RTM6/G939 and M18-1/G939 samples increases with temperature and time. For example, for samples treated at 200 °C, mass loss lies between 0.02% (M18/G939, 15 min) and 0.08% (RTM6/G939, 60 min), which is very low and similar for both composites. In contrast, mass loss for samples treated at 320 °C ranges from 1.98% (M18/G939, 15 min) to 4.10% (RTM6, 60 min). In general, temperature has a stronger influence on mass loss than time of thermal load, because temperatures were chosen in the range of beginning thermal decomposition of the resin matrix, as shown in TGA measurements (Section 3.2). For comparison, temperatures higher than 430 °C were necessary to ignite the composites during irradiation with an electrical heater at 50 kW/m2 [44].

Table 3.
Mass loss at exemplary temperatures and times for M18-1/G939 and RTM6/G939.
For cyclic thermal load, mass loss is similar to continuous thermal load, and similar dependencies are observed. The mass loss rate is highest for the first 16 cycles of thermal load (~23 min), and continuing thermal loading leads to less significant changes in mass. The fact that mass loss is similar for continuous and cyclic thermal loads confirms that the method chosen for making durations of cyclic thermal load comparable to durations of continuous load is reasonable.
Only at high temperatures and prolonged loading, RTM6/G939 samples seem to exhibit slightly higher mass losses for continuous than for cyclic thermal load. A possible reason might be found in a different delamination behavior. However, the effect is not very pronounced, and mass loss is not a suitable parameter for detecting delaminations.
Figure 6 shows a comparison of mass loss for M18-1/G939 and RTM6/G939 samples for identical treatments. It summarizes that RTM6/G939 is more prone to thermal decomposition of the resin matrix, leading to higher mass loss than M18-1/G939 since there are a large number of values above the bisecting line. At lower temperatures, the mass loss is almost identical for both composites, but at higher temperatures, the difference between RTM6/G939 and M18-1/G939 is more significant. The higher content of epoxy resin in RTM6/G939 compared to M18-1/G939 can explain these observations.
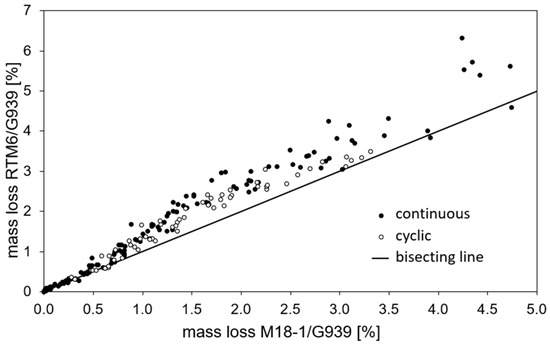
Figure 6.
Comparison of mass loss for RTM6/G939 and M18-1/G93 (bisecting line represents identical mass loss for compared composites).
3.4. Infrared Spectroscopy
ATR-FTIR spectroscopy is used to characterize thermal degradation of the polymer matrix. Since M18-1 contains aromatic epoxy resin and even more thermally resistant polyetherimide, faster thermal decomposition of the epoxy resin is expected, and traced by a decrease in the intensity of the band at 1510 cm−1 characteristic for the C-C valence vibration of the aromatic ring in the epoxy resin [47,51]. Figure 7 shows infrared spectra of variously treated M18-1/G939 samples. With increasing thermal load, additionally, bands characteristic for C-H groups (~3000 cm−1) disappear due to their oxidation. Simultaneously, a broad band between 1600 and 1800 cm−1 arises, attributed to various carbonyl-group-containing species. A detailed attribution of bands and a comprehensive analysis of oxidation and thermal decomposition products for M18-/G939 is given in [47]. For a quantification of thermal damage of the M18-1 resin matrix, the band attributed to the aromatic ring in EP (1510 cm−1) (“epoxy” in Figure 7) is normalized by the signal at 1720 cm−1, characteristic for the carbonyl valence vibration in the imide ring of polyetherimide (“PEI”). Its band intensity is expected to be nearly constant under the chosen conditions due to the high thermal resistance of PEI. For RTM6 (see Figure 8), there is no additional polymer component in the matrix. Therefore, the arising “carbonyl” band (1650 cm−1), originating from oxidation products of the epoxy resin, is used for quantification of thermal damage by the corresponding intensity ratio given in Figure 8. Again, a higher thermal damage leads to a lower band intensity ratio, since the “epoxy” band (1510 cm−1) is reduced and the carbonyl band increases in intensity. Due to the different band intensity ratios, a comparison of thermal degradation between M18-1/G939 and RTM6/G939 is limited.
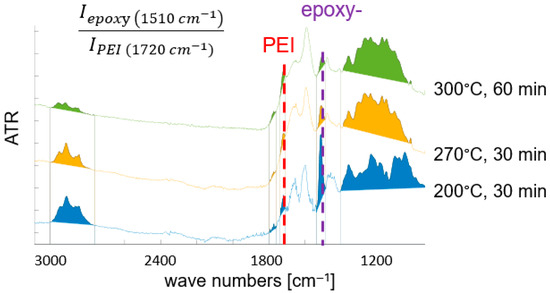
Figure 7.
Selected ATR-FTIR spectra of variously treated M18-1/G939 samples, with indicated band intensity ratio for characterizing thermal damage (see text) (Thermal load increases from bottom to top spectra. Limits for band integration are given).
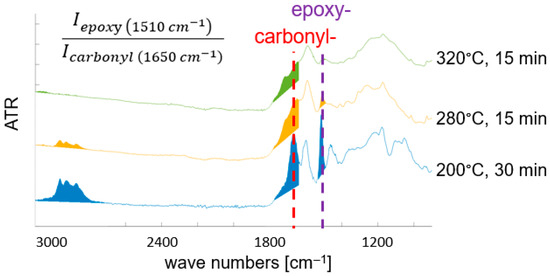
Figure 8.
Selected ATR-FTIR spectra of variously treated RTM6/G939 samples, with indicated band intensity ratio for characterizing thermal damage (see text). (Thermal load increases from bottom to top spectra. Limits for band integration are given).
Figure 9 shows a comparison of the described band intensity ratios for front and back side spectra of RTM6/G939 samples treated continuously. Even the smallest thermal loads at 200 °C lead to a predominant oxidation and decomposition of the epoxy resin on the surface impinged by hot air, as indicated by an exponential drop of the intensity ratios. The polymer on the back side is significantly less damaged than at the front side, since the intensity ratios are higher compared to the front side, and the back-side temperatures are lower than at the front. Starting at a temperature of 290 °C, the data are very similar to each other, because polymer degradation is very pronounced and the recorded IR spectra become successively less intense. The observed trends for M18-1/G939 are comparable and therefore not depicted.
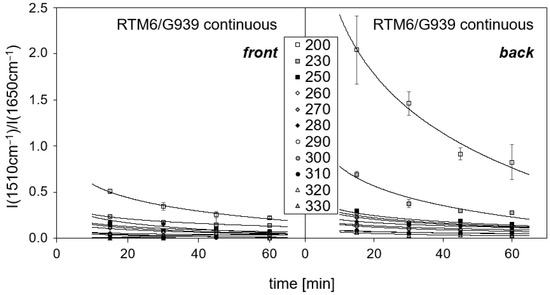
Figure 9.
Band intensity ratio for RTM6/G939 samples in dependence on time and temperature of treatment. Temperatures at the front side are given. (Intensity ratio for untreated sample cannot be determined accurately, because no band attributed to oxidation is present).
In the following comparison of continuous and cyclic thermal load, the samples’ back sides are examined, since on the back side, spectra are more intense, and values for the band intensity ratio are more reliable. Previous studies considered gradients of polymer degradation throughout the depth of a specimen after one-sided thermal load [19], which is, however, beyond the scope of this work.
The comparison of continuous and cyclic thermal load is depicted in Figure 10 for M18-1/G939. No significant differences within standard deviations of the band intensity ratios are observed between continuous or cyclic treated samples. Standard deviations are quite high because of strongly overlapping bands around 1720 cm−1, impeding an accurate determination of band intensity.
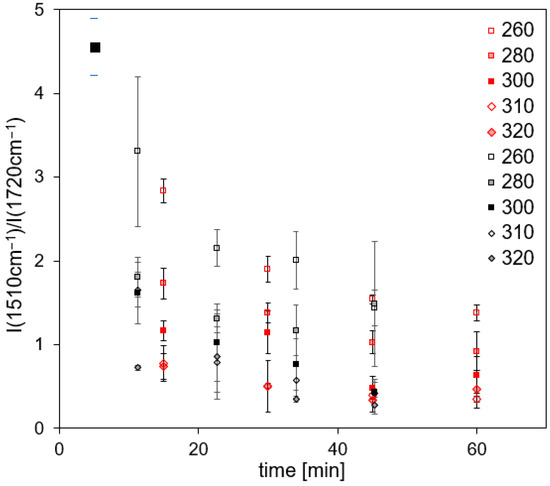
Figure 10.
Band intensity ratios of M18-1/G939 samples (back side) in dependence on time and temperature for continuous (red) and cyclic (black) treatment.
For RTM6/G939 samples (Figure 11), the band intensity ratios also decrease. Again, no significant differences occur for cyclic and continuous loads. A direct comparison with the corresponding data of M18-1/G939 is not possible due to the different bands chosen for calculating the intensity ratios.
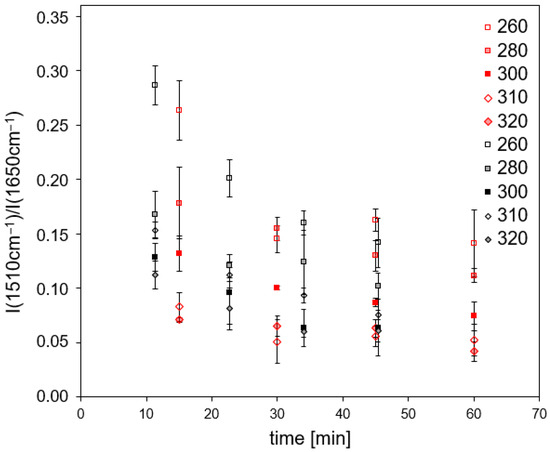
Figure 11.
Band intensity ratio of RTM6/G939 samples (back side) in dependence on time and temperature for continuous (red) and cyclic (black) treatment.
Assuming that in a first approach, thermal degradation traced by infrared spectroscopy follows a simple first-order reaction kinetics (~e−kt), the rate constant k of a chemical reaction for each temperature T can be determined, after normalization of the data. The linearized correlation of rate constant (ln k) and temperature (T−1) is derived from the Arrhenius equation (k = A e−(EA/RT)), from which activation energy (EA) can be determined from the slope of the line (−EA/R) (R = 8.314 JK−1mol−1). Exemplary Arrhenius plots are presented in Figure 12. Activation energy is a key element for the simple description of the degradation velocity of materials in dependence on time and temperature [52]. When comparing activation energies for different reactions, higher values imply a stronger dependence of reaction velocity on reaction temperature.
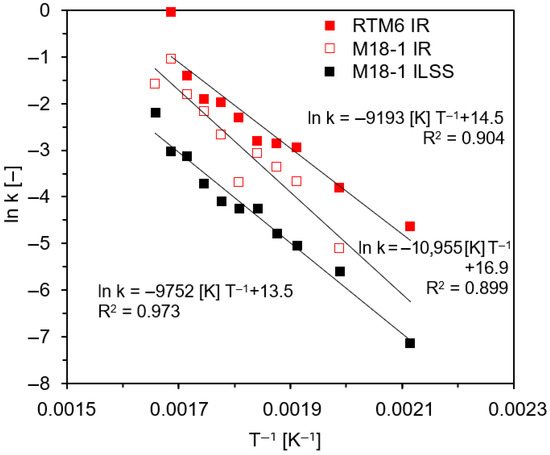
Figure 12.
Exemplary Arrhenius plots for continuous thermal load of RTM6/G939 and M18-1/G939 samples for IR band intensities (back side, for data, see Figure 10 and Figure 11) as well as interlaminar shear strength (ILSS, for data, see below (Section 3.6)).
The calculated values for activation energy based on all obtained data given in Figure 10 and Figure 11 are 91 ± 20 kJ/mol (continuous thermal load) and 76 ± 20 kJ/mol (cyclic thermal load) for M18-1/G939 and 82 ± 20 kJ/mol (continuous thermal load) and 81 ± 20 kJ/mol (cyclic thermal load) for RTM6/G939. These values are within standard deviations quite similar, since, in all cases, predominantly, the epoxy resin is decomposed, and there is no significant difference between continuous and cyclic thermal load in regard to IR spectra analysis. Given standard deviations are high because of deviations of the data from the fit of exponential decay (e−kt) and the linearization in the Arrhenius plot (Figure 12). A similar activation energy of 110 ± 20 kJ/mol was reported for the thermal degradation of M18-1/G939 induced by irradiation [47] for corresponding IR data, even if the investigated temperature range was different: 100 °C to 350 °C.
3.5. Ultrasonic Measurements
Figure 13 shows ultrasonic C-scans of M18-1/G939 samples in dependence on time of hot-air loading and surface temperature for cyclic thermal load. Damages such as delaminations appear as an area with higher absorption in the image.
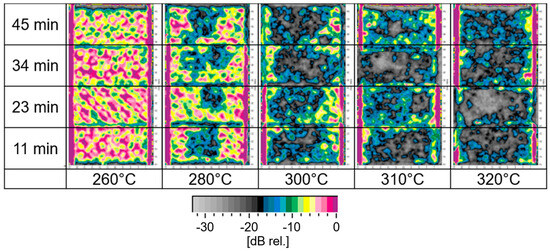
Figure 13.
Ultrasonic C-scans of cyclic-treated M18-1/G939 samples. (Delaminations are indicated especially by blue and black areas.)
A transition of samples without damage, such as delaminations, to samples with delaminations after thermal load is observed between 260 °C and 280 °C. This temperature range for beginning delamination has already been reported for M18-1/G939 for isothermal loading [47]. Within the chosen durations of thermal load, no significant influence of time, but only of temperature, is found. And 270 °C marks the onset of detecting damage by ultrasonic testing. For comparison of the sensitivities of ultrasonic testing and IR spectroscopy, the sample treated at 260 °C for 11 min does not exhibit damage by ultrasonic testing. However, a reduction in the described intensity ratio of IR bands down to 65% of the initial value has already been observed. Therefore, IR spectroscopy as a non-destructive testing method is far more sensitive towards the beginning, thermally induced damage than ultrasonic testing, as already slight changes in the polymer at the surface are detected.
Delaminations are first observed in the center of the samples. For temperatures higher than 280 °C, a more or less uniform distribution of delaminations can be found. As the nozzle diameter of the hot-air blower is 20 mm, a homogeneous heat uptake of the small CFRP samples is expected. Nevertheless, for the beginning formation of delaminations at 280 °C, accumulated heat in the center of the specimen causes the beginning delamination there. In general, the heat uptake of CFRP in a hot-air stream is better comparable between various CFRP compared to irradiation experiments. Within irradiation experiments of different CFRP, additionally, different reflection and scattering of impinging radiation at the samples’ surface play a significant role.
For M18-1/G939, continuous thermal load seems to lead to more areal damage, while for cyclic thermal loads, damage may be more punctiform. Ultrasonic scans of RTM6/G939 samples show no significant differences between cyclic and continuous thermal load (images not depicted). Since the position of damage along the depth of the sample is not known, ultrasonic B-scans (Figure 14) were recorded. For a series of samples with 32 cycles of treatment (45 min), the depth of occurring damage is determined (see Figure 15). The residual specimen thickness that shows no damage decreases with an increase in temperature, as expected, starting from roughly 270 °C. The overall finding is that M18/G939 is more delaminated, with damage occurring in deeper areas of the samples than RTM6/G939.
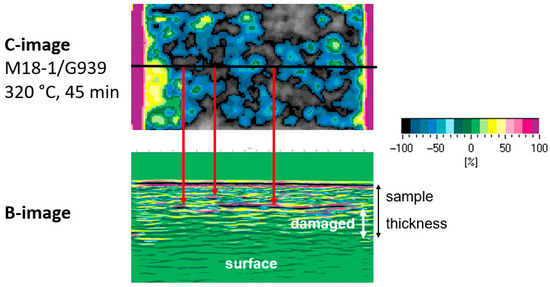
Figure 14.
Exemplary C-image (top) and correlation to B-image (bottom) of an M18-1/G939 sample treated at 320 °C for 45 min.
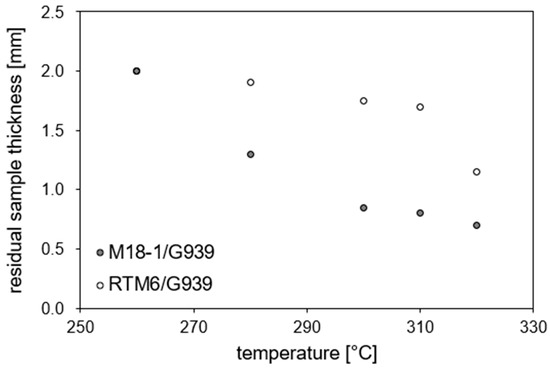
Figure 15.
Residual sample thickness in dependence on temperature for a cyclic treatment with a duration of 45 min obtained from ultrasonic B scans (2 mm corresponds to intact material).
3.6. Interlaminar Shear Strength
Interlaminar shear strength (ILSS) was chosen as an indicator for the mechanical performance of the investigated CFRP, since it is known to be most sensitive towards thermal polymer decomposition compared to tensile, compression, and flexural strength [36].
ILSS of untreated M18-1/G939 (“with thermoplastic”) samples is slightly higher (67 ± 3 MPa) than for RTM6/G939 (“without thermoplastic”) (60 ± 3 MPa). In general, residual ILSS decreases continuously with increasing thermal load on the material. At 200 °C constant thermal load, which is in the range of glass transition temperatures of M18-1 (196 °C) and RTM6 (~200 °C) [43], there is only a minor influence on ILSS in comparison to non-treated samples. After 60 min of treatment, ILSS is reduced by 5% for M18-1/G939 and RTM6/G939, which is in the range of the standard deviation of determined ILSS values. At 250 °C constant load, RTM6/G939 loses 32% strength compared to 20% for M18-1/G939 after 60 min of treatment. Therefore, M18-1/G939 provides a slightly improved thermal resistance compared to RTM/G939 in the temperature range up to 250 °C.
Figure 16 shows the normalized residual strength in dependence on time and temperature for continuous and cyclic treatment of RTM6/G939, as well as M18-1/G939, starting from 260 °C. For these conditions, delaminations are observed in the samples (see Section 3.5). Treatment temperature exerts a stronger influence on ILSS than duration. The main loss of strength occurs within the first 15 min of treatment. As the temperature increases, the residual strength decreases significantly. At 320 °C, the loss is 90% of the initial value after 60 min, while 75% loss is already reached after 15 min. High temperatures lead to a significant loss in ILSS even after short periods of time for both materials. For both materials, no significant differences are observed, neither for constant nor for cyclic loading. Therefore, determined activation energies (see Section 3.4, example in Figure 12) based on ILSS data are similar for M18-1/G939 and RTM6/G939: 81 ± 20 kJ (continuous thermal load) and 80 ± 20 kJ (cyclic thermal load) for M18-1/G939 and 54 ± 20 kJ (continuous thermal load) and 71 ± 20 kJ (cyclic thermal load) for RTM6/G939. Activation energies are also comparable to a reported value for irradiation experiments with M18-1/G939 for ILSS, 120 ± 20 kJ/mol [47], and the values based on IR spectroscopy (see Section 3.4), which might be interpreted as the velocity of matrix decomposition determines the decrease in residual strength. However, the activation energies are calculated empirically from the ILSS data, and they might not directly characterize the degradation process responsible for the mechanical failure of the test samples.
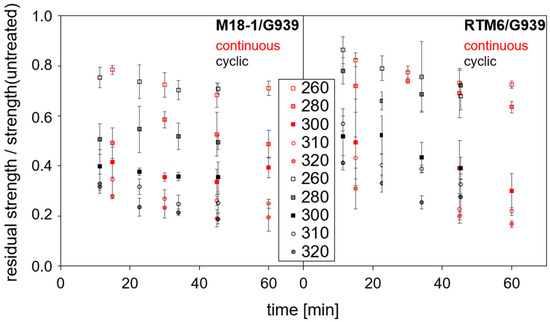
Figure 16.
Normalized residual interlaminar shear strength for different samples beginning from 260 °C.
Additionally, the type of failure during ILSS testing is determined. Less harshly treated samples (<260 °C) show mostly failing in one plane, as indicated by a constant increase in force with displacement. Severely treated samples typically show more frequent failures in two or more planes [36], which can be recognized by weak drops in the force–displacement curves. Failing in multiple planes occurs for RTM6/G939 samples more frequently and under less harsh treatment conditions starting from 260 °C than for M18-1/G939 samples (280 °C). Obviously, the presence of PEI can alter the type of failure in ILSS measurements (one or multiple planes), which was expected, as it acts as an impact modifier, also indicated by the slightly higher ILSS of intact M18-1/G939.
A slight trend towards failing in multiple planes is found for continuously treated samples compared to cyclic treatment for both CFRP.
4. Discussion
4.1. Interpretation of Thermal Damage Effects
Thermal damage of the composites M18-1/G939 and RTM6/G939 within the chosen temperature range between 200 °C and 330 °C is dominated by the decomposition of the epoxy resin (EP). For mass loss, lower values are observed for M18-1/G939 compared to RTM6/G939, as the content of EP is lower in M18-1/G939. For example, mass loss is 4.0% for RTM6/G939 and 3.0% for M18-1/G939 after continuous loading for 60 min. This ratio represents the contents of EP in the composites: 47% and 36%, respectively.
Under the chosen experimental conditions, polyetherimide does not significantly decompose, as documented by IR spectroscopy. Polyetherimide (PEI) is known as a highly temperature-resistant thermoplastic, improving the impact tolerance of brittle EP composites. However, thermal decomposition of the epoxy resin cannot be compensated for by PEI. As long as the polymers are not thermally damaged, intact adhesion between the polymers provides improved impact tolerance. Beyond the glass transition temperature and the beginning degradation of fiber–matrix adhesion, dissipation of impact forces is impeded. Fiber–matrix adhesion is known to degrade first during the occurrence of thermal load. As EP is responsible for fiber–matrix adhesion alone, because the already polymeric PEI does not contribute to curing of the prepreg material, EP, in combination with the epoxy-based fiber sizing, represents the weakest link in the composite matrix. The same effect is supposed to be amplified when adhesion of EP and PEI decreases due to EP decomposition [41,53]. Therefore, the additional presence of PEI, especially when it is separated from the epoxy matrix and enriched between the carbon fiber plies in M18-1/G939 does not significantly improve the decrease in mechanical properties after thermal load. M18-1/G939 exhibits a slightly higher pristine ILS strength (67 ± 3 MPa) than RTM6/G939 (60 ± 3 MPa). However, the strength loss in dependence on temperature and time is comparable between the two composites. For this reason, the performance of M18-1/G939 after cyclic thermal loading is also not significantly improved. The results show that both materials act almost similarly under the selected treatment conditions. Only for temperatures below 250 °C, a slightly slower decrease in residual strength for constant loading was observed for M18-1/G939. Therefore, it can be concluded that for conditions of intact resin matrix and only beginning matrix decomposition, a positive effect of present PEI on residual strength occurs.
Again, these results are contrary to the expectations. It was expected that M18-1/G939 provide a higher residual strength than RTM6/G939, because of the added PEI in the matrix, which works as an impact modifier and can repress thermal strain [54]. Especially for cyclic thermal load, this could lead to improved residual shear strength because of compensating thermal strain induced by fast heating and cooling.
On the contrary, for the investigated thermal loading conditions, temperatures are high enough so that the samples are damaged by EP decomposition in a short period of time, and other effects have almost no influence on the observed parameters. The debonding of EP and PEI even leads to more delaminations in deeper areas in M18-1/G939 compared to RTM6/G939, as indicated by the ultrasonic B-scans. On the other hand, these delaminations in deeper areas of M18-1/G939 do not lead to a more pronounced failure in multiple planes compared to samples of RTM6/G939 in ILSS testing. As delaminations do not directly contribute to residual strength, they are not a precise pre-indicator of the type of failure. Again, fiber–matrix adhesion, dominated by EP decomposition, is decisive for the occurring type of failure.
M18-1/G939 additionally contains a synergistic flame retardant system: Mg(OH)2 and zinc borate. An influence of these flame retardants on the thermal decomposition of the resin matrix cannot be fully excluded, even if they act beyond 350 °C. However, for a catalytic decomposition of the resin, the dispersion of the flame retardants is poor with particle diameters > 1 µm for Mg(OH)2 and >3 µm for zinc borate [44]. Related to volume ratio, the interphase between fiber and matrix is by far larger than between flame retardants and matrix. Therefore, it is deduced that influences on mechanical performance by a degradation of fiber–matrix adhesion are more relevant than the influence of the flame retardants.
As an outlook, these results are in contrast to the reaction-to-fire properties of the two composites [55]. The presence of PEI improves the performance of M18-1/G939 by means of reduced heat release rates and higher amounts of formed char compared to RTM6/G939.
4.2. Correlation of Residual Strength and Infrared Measurements
The correlation of residual strength and infrared measurements results in a powerful tool that allows us to non-destructively estimate residual strength based on IR spectra of CFRP samples with unknown thermal history [39]. Based on this, operational limits for these materials can be defined. This method, however, is limited to the sample surface; additional delamination processes inside the material are not directly assessable. An effort was made to characterize thermal degradation along the depth profile by IR spectroscopy [19] and to assess the occurrence of delaminations [36,37]. By this, threshold values can be defined for matrix degradation measured by IR spectroscopy, allowing for a prediction of the presence of delaminations from surface IR spectra [36]. This is shown in Figure 17, giving a correlation between residual strength and IR band intensity ratio (see Section 3.4). A smaller band intensity ratio correlates with a lower residual strength. A sudden loss of residual strength (marked gray in Figure 17) is due to the beginning of delamination, that are not explicitly detectable by IR measurements.
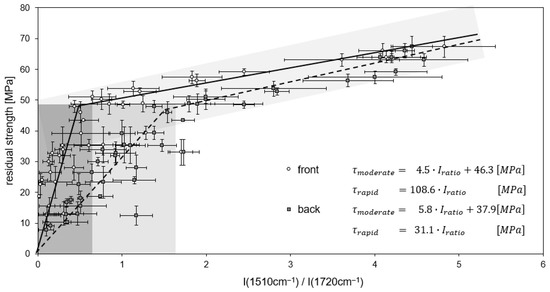
Figure 17.
Correlation of residual ILS strength and band intensity ratio for M18-1/G939 after continuous thermal treatment. Lines of regression (front side: full lines, back side: stripped lines) and the associated linear equations are shown. Gray shades represent estimated uncertainty.
Figure 17 shows the correlations of residual strength and band intensity ratio for spectra recorded on the samples’ back and front sides for continuous thermal treatment of M18-1/G939. For front side spectra, a linear correlation between intensity ratios of 0.65 to 5.0 is found for moderate thermal damage. At this threshold value of 0.65, 70% (about 50 MPa) of the initial shear strength is maintained. At intensity ratios below 0.65, there is a massive decrease in residual strength due to the occurrence of delaminations in the samples [28]. The correlations between residual ILSS (τ) and band intensity ratio (Iratio) can be described by linear equations (see insert in Figure 17). Thereby, rapid and moderate decreases in residual strength are described by two different equations. The equations can be used for the prediction of residual strength based on a non-destructive infrared spectroscopic analysis. Uncertainty for predicted residual ILSS is estimated to be 10%, as implied by the gray shades in Figure 17.
For IR spectra recorded on the back side of the samples, similar linear correlations are found. However, band intensity ratios are higher, as the resin is less decomposed on the back side of the samples. The threshold value for the intensity ratio between a moderate and a rapid decrease in residual strength is 1.7 in this case.
M18-1/G939 samples after cyclic thermal treatment (Figure 18) show similar correlations compared to continuous thermal load. The threshold values between rapid and moderate decrease in residual ILSS are for both front and back side spectra, almost similar to continuously treated samples. But as only a few data points, obtained for a treatment at 260 °C, are assigned to a moderate decrease, a distinct uncertainty results for the linear equation.
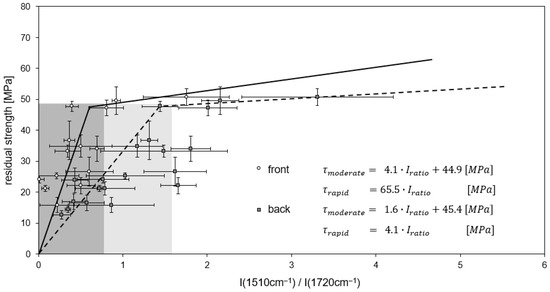
Figure 18.
Correlation of residual ILS strength and intensity ratio for M18-1/G939 after cyclic thermal treatment. Lines of regression (front side: full lines, back side: stripped lines) and the associated linear equations are shown. Gray shades represent estimated uncertainty.
For continuously treated RTM6/G939 samples (Figure 19), the rapid decrease in residual ILSS (up to 83%) is detected for intensity ratios between 0 and 0.25, whereas ratios above 0.25 are attributed to a moderate decrease in residual ILSS. The distinction of these areas is more concise for measurements on the back side than at the front side, as band intensity ratios are higher there due to the less pronounced decomposition of the EP. For a cyclic thermal treatment at temperatures of 260 °C and higher, all values are assigned to a rapid decrease in residual ILSS (Figure 20).
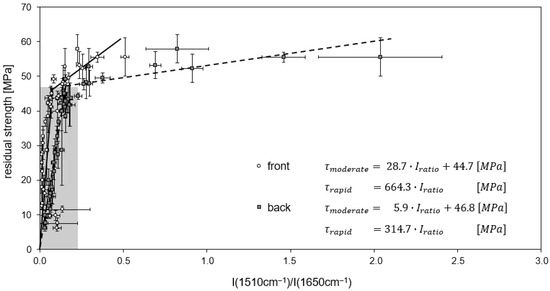
Figure 19.
Correlation of residual ILS strength and band intensity ratio for RTM6/G939 after continuous thermal treatment. Lines of regression (front side: full lines, back side: stripped lines) and the associated linear equations are shown.
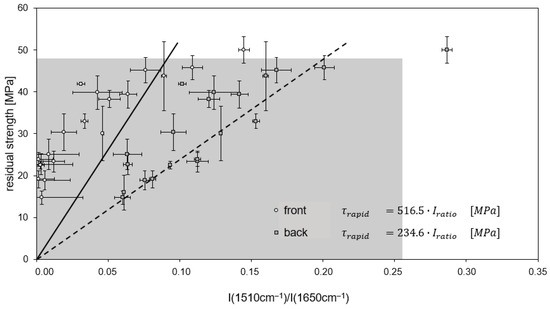
Figure 20.
Correlation of residual ILS strength and band intensity ratio for RTM6/G939 after cyclic thermal treatment. Lines of regression (front side: full line, back side: stripped line) and the associated linear equations are shown.
As band intensity ratios are small for RTM6/G939 samples due to the selected IR signals, the uncertainty of these values is relatively high, and a prediction of residual strength is expected to be less precise.
A correlation of ILSS and mass loss is not suitable for a non-destructive prediction of residual strength as presented for IR spectroscopy. However, it gives further insight into how the ILS strength drops with increasing thermal damage (see Figure 21). With increasing thermal load and mass loss, a continuous decrease in residual strength is observed. The courses of data are very similar for RTM6/G939 and M18-1/G939, with slightly higher mass losses for RTM6/G939 (see above). As mass loss regards the whole volume of the sample compared to the surface selectivity of IR spectroscopy [47], a continuous course of data is obtained, and not a kinked one as for IR spectroscopy. Additionally, the correlation might be interpreted as a further indication that the decomposition of the epoxy resin is dominantly responsible for the loss in strength. However, as the correlation in Figure 21 is not strictly linear, a more complex mechanism explaining the deterioration of residual strength is expected.
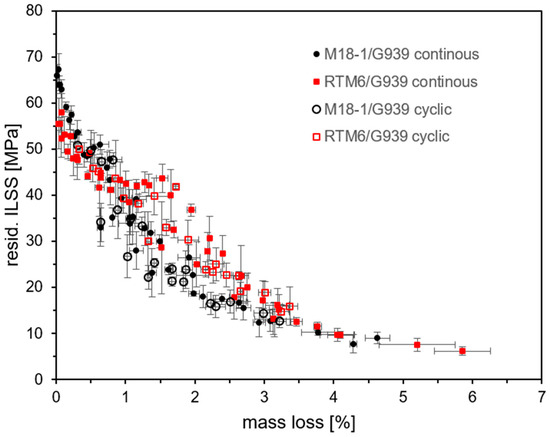
Figure 21.
Correlation of residual ILSS and mass loss for both composites.
4.3. Multivariate Data Analyses
In general, multivariate data analyses, also known as chemometric analyses, use chemical data (e.g., IR spectra) depending on several independent variables (e.g., temperature and duration, etc.). A correlation can be established by multivariate statistics from a set of samples with experimentally determined variables [56]. This training set forms the basis for predicting values of the variables from the spectrum of an unknown sample.
The chemometric method utilizes slight differences in the IR spectra due to the experienced temperature, exceeding the indication by the considered band intensity ratio (see above). This way, it was shown that a separate prediction of temperature and duration of thermal load is possible [47]. This is possible because bands of oxidation products represented by carbonyl species in the range of 1600 to 1750 cm−1, carbonate species, as well as C-O single bond species in a range of 1000 to 1400 cm−1 [51,57], appear with varying band shapes and intensities depending on pre-treatment temperature due to slightly differing degradation mechanisms.
A more detailed analysis of the chemical composition of surface degradation products is beyond the scope of this investigation. However, it is clear that various degradation processes, such as oxidation (fast) and degradation of the aromatic polymer backbone (slow), occur, differing in their reaction rate, which is required for the chemometric analysis [39].
Ca. 300 calibration IR spectra were recorded on the front and back sides of thermally treated specimens. For a chemometric analysis (partial least squares regression), the first derivative of the spectra was calculated. Spectra were additionally vector normalized, and a cross validation was carried out for the selected spectral range between 3580 cm−1–2578 cm−1 and 1830 cm−1–723 cm−1.
For spectra recorded at the specimens’ surface on the front side, a root mean squared error of cross validation (RMSECV) of 4.4 MPa for residual ILS strength is calculated (Figure 22). RMSECV of 4.4 MPa means that the calculated residual ILSS on the basis of IR spectra deviates by 4.4 MPa from the real value, when all data used for calibration are averaged. Thus, the method is able to accurately predict ILS strength in a range of 0–70 MPa, as well as temperature in a range of 180–340 °C, with an RMSECV of 8.3 °C. Correspondingly, the correlation coefficients (R2) are higher than 0.90. Whereas the prediction of mass loss is comparably accurate with similar correlation coefficients, the calculated duration of thermal load is uncertain (see Table 4). Here, RMSECV values are typically higher than 10 min, and correlation coefficients are poor, typically below 0.5. The main reason for an inaccurate prediction of loading duration is that only four different durations are used for calibration, for constant and continuous loading, respectively.
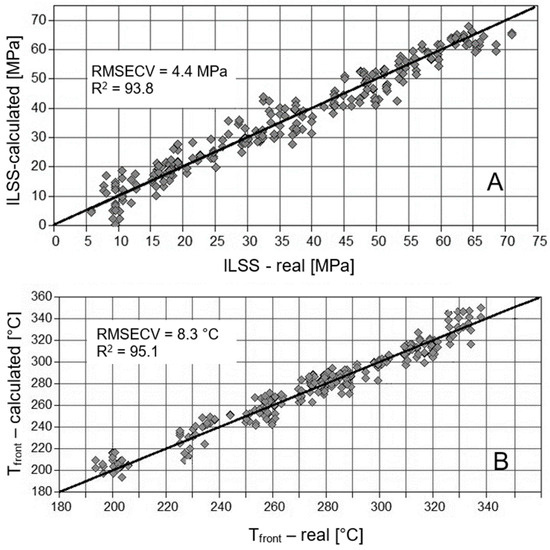
Figure 22.
Predicted vs. real ILSS (A) and real front side temperatures (B) based on chemometric analyses of front side IR-spectra of M18-1/G939.

Table 4.
Summary characterizing the quality of all performed chemometric analyses by means of RMSECV and R2 (in brackets) of cross validations for the predicted parameters surface temperature (Tsurface), time of thermal load, mass loss, and residual interlaminar shear strength (ILSS) in the given ranges.
No significant differences are observed regarding the accuracy of the methods, dependent on the CFRP and the side of the sample, where spectra are recorded. For example, the RMSECV for the temperature prediction is 8.2 °C for RTM6 and 8.3 °C for M18-1, when back side spectra are considered. For front side spectra, the corresponding RMSECV are 8.9 °C and 8.3 °C, respectively. Therefore, it can be concluded that the quality of the front and back side IR spectra is similar. In detail, this means that, at the front side, polymer degradation is in a range where still-intensive IR spectra are obtained, and decomposition is not so far pronounced that carbon fibers are set free or developed black char hinders the recording of IR spectra.
All trends considering the precision of the chemometric methods observed for a continuous load are also found for an alternating load. In detail, the accuracy of the methods is slightly higher.
In summary, chemometric analysis of IR spectra not only provides the possibility to separately determine time and duration of a thermal pre-load, but—in contrast to the empirical correlation (Section 4.2)—also allows a precise prediction of residual strength for more severely damaged specimens with residual strength below 40 MPa.
5. Conclusions
This work describes an experimental setup to compare the properties of different CFRPs at different heat impact scenarios. In detail, continuous and cyclic impingement of hot air from room temperature to 320 °C at the sample’s surface for up to 60 min was compared. Small samples of two commercial, nearly identical CFRP materials, M18-1/G939 and RTM6/G939, are investigated. The M18-1 matrix contains an additional thermoplastic PEI as a toughening agent, when comparing the otherwise nearly identical CFRP.
The presence of the toughening agent slightly improves the interlaminar shear strength of the pristine material. However, under the chosen conditions of thermal treatment, the added PEI only has a minor influence on the change in mechanical properties. Whereas at the onset of decomposition of the polymer matrix at temperatures below 250 °C, improved residual strength is maintained for M18-1/G939, at higher temperatures, both CFRP degrade similarly. Regarding thermal damage, PEI plays no significant role, as damage is mainly influenced by the less temperature-resistant epoxy resin, which is identical for RTM6 and M18-1. Calculated activation energies determined by IR or ILSS data are similar for both CFRP and may be regarded as further indication that decomposition of epoxy resin is dominantly responsible for the loss of strength.
Also, no significant differences were found for the constant and alternating thermal load of the two CFRP. Therefore, additional thermal strain by alternating thermal load does not play a role in the loss of strength. Again, a positive influence of the thermoplastic is not observed when a temperature range beyond the beginning decomposition of the polymer matrix is investigated.
Additionally, a multivariate data analysis tool was established for the two CFRP materials. This tool allows us to determine the degree of damage of samples with unknown thermal history by non-destructive IR spectroscopy, so that the residual strength can be predicted. Residual ILSS was determined to lie between 5 and 95% depending on the type of treatment. The empirical correlation between IR spectra and residual ILSS defines limits for the usage of these materials and provides a reliable support for predicted values of residual ILSS by multivariate data analysis. The combination of empirical correlation and multivariate data analysis may be advantageous for failure analysis.
Further investigations should focus on less harsh treatment conditions to uncover the subtleties. In this work, the fast-thermal damage of the matrix covers other possible mechanisms, but it provides a solid base for following experiments with wider sample ranges. The presented multivariate data analysis is already a reliable tool to connect IR data and residual strength, as well as mass loss and treatment temperature.
Author Contributions
Conceptualization, S.E.; methodology, S.E.; formal analysis, S.E. and L.G.; investigation, S.E.; data curation, S.E. and L.G.; writing—original draft preparation, S.E. and L.G.; writing—review and editing, S.E. and L.G.; visualization, S.E. and L.G.; project administration, S.E. All authors have read and agreed to the published version of the manuscript.
Funding
This research received no external funding.
Data Availability Statement
The raw data supporting the conclusions of this article will be made available by the authors on request.
Acknowledgments
The authors thank Michael Reindl for performing many experiments.
Conflicts of Interest
The authors declare no conflicts of interest.
Abbreviations
The following abbreviations are used in this manuscript:
| CFRP | carbon fiber-reinforced plastic |
| PEI | polyetherimide |
| µCT | computer tomography |
| QI | quasi-isotropic |
| ILSS | interlaminar shear strength |
| µ-ATR-FTIR | micro-attenuated total reflection Fourier transform infrared spectroscopy |
| ATR | attenuated total reflection |
| TGA | thermogravimetric analyses |
| EP | epoxy resin |
| EA | activation energy |
| RMSECV | root mean squared error of cross validation |
References
- Lengsfeld, H.; Lacalle, J.; Neumeyer, T.; Altstädt, V. Faserverbundwerkstoffe, Prepregs und Ihre Verarbeitung 1. Aufl.; Carl Hanser Verlag GmbH & Co. KG: Munich, Germany, 2016; ISBN 978-3446433007. [Google Scholar]
- Schürmann, H. Konstruieren mit Faser-Kunststoff-Verbunden, 2nd ed.; Springer: New York, NY, USA, 2007. [Google Scholar]
- Ehrenstein, G.W. Faserverbund-Kunststoffe: Werkstoffe—Verarbeitung—Eigenschaften, 2nd ed.; Carl Hanser Verlag GmbH & Co. KG: Munich, Germany, 2006; ISBN 9783446227163. [Google Scholar]
- Gandhi, U.; Goris, S.; Osswald, T.A. Discontinuous Fiber-Reinforced Composites: Fundamentals and Applications, 1st ed.; Carl Hanser Verlag GmbH & Co. KG: Munich, Germany, 2020; ISBN 9781569906941. [Google Scholar]
- Eurofighter Jagdflugzeug GmbH. Eurofighter Typhoon: Technical Guide. 2013. Available online: https://www.eurofighter.com. (accessed on 27 April 2025).
- Zhang, J.; Lin, G.; Vaidya, U.; Wang, H. Past, present and future prospective of global carbon fibre composite developments and applications. Compos. Part B Eng. 2023, 250, 110463. [Google Scholar] [CrossRef]
- Sreejith, M.; Rajeev, R.S. Fiber reinforced composites for aerospace and sports applications. In Fiber Reinforced Composites, 1st ed.; Kuruvilla, J., Kristiina, O., Gejo, G., Runcy, W., Saritha, A., Eds.; Woodhead Publishing: Cambridge, UK, 2021; pp. 821–859. [Google Scholar] [CrossRef]
- Wang, Y.C.; Wong, P.M.H.; Kodur, V. An experimental study of the mechanical properties of fibre reinforced polymer (FRP) and steel reinforcing bars at elevated temperatures. Compos. Struct. 2006, 80, 131–140. [Google Scholar] [CrossRef]
- Gong, T.; Xie, Q.; Huang, X. Fire behaviors of flame-retardant cables part I: Decomposition, swelling and spontaneous ignition. Fire Saf. J. 2018, 95, 113–121. [Google Scholar] [CrossRef]
- Spinner, N.S.; Field, C.R.; Hammond, M.H.; Williams, B.A.; Myers, K.M.; Lubrano, A.L.; Rose-Pehrsson, S.L.; Tuttle, S.G. Physical and chemical analysis of lithium-ion battery cell-to-cell failure events inside custom fire chamber. J. Power Sources 2015, 279, 713–721. [Google Scholar] [CrossRef]
- McAllister, J.L.; Carpenter, D.J.; Roby, R.J.; Purser, D. The Importance of Autopsy and Injury Data in the Investigation of Fires. Fire Technol. 2013, 50, 1357–1377. [Google Scholar] [CrossRef]
- Schartel, B.; Hull, T.R. Development of fire-retarded materials—Interpretation of cone calorimeter data. Fire Mater. 2007, 31, 327–354. [Google Scholar] [CrossRef]
- McLean, A.D. Burns and military clothing. J. R. Army Med. Corps 2001, 147, 97–106. [Google Scholar] [CrossRef]
- Wang, Y.; Zhupanska, O.I. Lightning strike thermal damage model for glass fiber reinforced polymer matrix composites and its application to wind turbine blades. Compos. Struct. 2015, 132, 1182–1191. [Google Scholar] [CrossRef]
- Dorofeev, S.B.; Sidorov, V.P.; Efimenko, A.A.; Kochurko, A.S.; Kuznetsov, M.S.; Chaivanov, B.B.; Matsukov, D.I.; Pereverzev, A.K.; Avenyan, V.A. Fireballs from deflagration and detonation of heterogeneous fuel-rich clouds. Fire Saf. J. 1995, 25, 323–336. [Google Scholar] [CrossRef]
- Rajic, D.; Kamberovic, Z.; Karkalic, R.; Ivankovic, N.; Senic, Z. Thermal resistance testing of standard and protective filtering military garment on the burning napalm mixture. Hem. Ind. 2013, 67, 941–950. [Google Scholar] [CrossRef]
- Eibl, S. Damage by Improvised Incendiary Devices on Carbon Fiber-Reinforced Polymer Matrix Composites. J. Compos. Sci. 2021, 5, 72. [Google Scholar] [CrossRef]
- Wolfrum, J.; Eibl, S.; Oeltjen, E.; Osterholz, J.; Wickert, M. High-energy laser effects on carbon fiber reinforced polymer composites with a focus on perforation time. J. Compos. Mater. 2021, 55, 2249–2262. [Google Scholar] [CrossRef]
- Vetter, T.M.; Bibinger, J.; Zimmer, F.; Eibl, S.; Gudladt, H.-J. Characterization of one-sided thermal damage of carbon fiber reinforced polymers by means of depth profiles. J. Compos. Mater. 2020, 54, 3699–3713. [Google Scholar] [CrossRef]
- Maurente, A.; Alves, C.G. Radiation heat transfer in a gas slab with properties characteristics of a jet engine combustor. Int. J. Heat Mass Transf. 2019, 145, 118734. [Google Scholar] [CrossRef]
- Skourlis, T.P.; McCullough, R.L. The Effect of Temperature on the Behavior of the Interphase in Polymeric Composites. Compos. Sci. Technol. 1993, 49, 363–368. [Google Scholar] [CrossRef]
- Milke, J.A.; Vizzini, A.J. Thermal Response of Fibre-Exposed Composites. J. Compos. Technol. Res. 1991, 13, 145–151. [Google Scholar] [CrossRef]
- Burcham, L.J.; Eduljee, R.F.; Gillespie, J.W. Investigation on the Microcracking Behavior of Bismaleimide Composites During thermal Aging. Polym. Compos. 1995, 16, 507–517. [Google Scholar] [CrossRef]
- Mascia, L.; Zhang, J. Mechanical properties and thermal aging of a perfluoroether-modified epoxy resin in castings and glass fibre composites. Composites 1995, 26, 379–385. [Google Scholar] [CrossRef]
- Dao, B.; Hodkin, J.; Krstina, J.; Mardel, J.; Tian, W. Accelerated Aging versus realistic aging in aerospace composite Materials, II Chemistry of thermal aging in a structural composite. J. Appl. Polym. Sci. 2006, 102, 3221–3232. [Google Scholar] [CrossRef]
- Bondzic, S.; Hodkin, J.; Krstina, J.; Mardel, J. Chemistry of thermal aging in aerospace epoxy composites. J. Appl. Polym. Sci. 2005, 100, 2210–2219. [Google Scholar] [CrossRef]
- Bibinger, J. Charakterisierung der Degradationsmechanismen von CFK bei Verschiedenen Thermischen Belastungsszenarien (Characterization of Degradation Mechanisms of CFRP Under Different Loading Scenarios). Ph.D. Thesis, Universität der Bundeswehr München, Neubiberg, Germany, 2024. [Google Scholar]
- Wolfrum, J.; Whitney, E.; Eibl, S. Approaches to understand and predict the influence of rapid heat-up on degradation and strength of carbon fibre polymer matrix composites. J. Comp. Mat. 2017, 51, 2435–2447. [Google Scholar] [CrossRef]
- Mehrkam, P.A.; Armstrong-Carroli, E.; Cochran, R. Characterization of Heat Damage in Graphite Epoxy Composites; Report NAWCADWAR 9400-4; ASTM International: West Conshohocken, PA, USA, May 1994. [Google Scholar]
- Mallick, P.K. Non-destructive tests. In Composites Engineering Handbook; CRC Press: Boca Raton, FL, USA, 1997; pp. 857–873. [Google Scholar]
- Wróbel, G.; Stabik, J.; Rojek, M. Non-destructive diagnostic methods of polymer matrix composites degradation. J. Achiev. Mater. Manuf. Eng. 2008, 31, 53–59. [Google Scholar]
- Callinan, R.J.; Wang, J.; White, C. Residual Strength of a Helicopter Composite Structure Subjected to Small Arms Fire. In Material Science Forum; Trans Tech Publications Ltd.: Baech, Switzerland, 2010; Volume 654–656, pp. 2596–2599. [Google Scholar] [CrossRef]
- Fisher, W.G.; Storey, J.M.E.; Sharp, S.L.; Janke, C.J.; Wachter, E.A. Wachter, Non-destructive Inspection of Graphite-Epoxy Composites for Heat Damage Using Laser-Induced Fluorescence. Appl. Spectrosc. 1995, 49, 1225–1231. [Google Scholar] [CrossRef]
- Dara, I.H.; Ankara, A.; Akovali, G.; Suzer, S. Heat Damage Assessment of Carbon-fiber-Reinforced Polymer Composites by Diffuse Reflectance Infrared Spectroscopy. J. Appl. Polym. Sci. 2005, 96, 1222–1230. Available online: https://hdl.handle.net/11511/12433 (accessed on 7 September 2025). [CrossRef]
- Shelley, P.; Vahey, P.; Werner, G. Thermal Effect Measurement with Mid-Infrared Spectroscopy. US Patent 2010/0038544 A1, 8 August 2013. [Google Scholar]
- Vetter, T.M.; Eibl, S.; Gudladt, H.J. Predicting Delaminations and Residual Strength of Carbon Fibre Reinforced Polymers (CFRP) After One-Sided Thermal Loading by Means of Infrared Spectroscopy. Appl. Compos. Mater. 2021, 28, 427–446. [Google Scholar] [CrossRef]
- Vetter, T.M.; Zimmer, F.; Eibl, S.; Gudladt, H.J. Using infrared spectroscopy in combination with multivariate data analysis to predict residual strength of carbon fiber reinforced polymers after one-sided thermal loading. Polym. Compos. 2021, 42, 4138. [Google Scholar] [CrossRef]
- Eibl, S. Thermal and reaction to fire properties of CFRP under various heat impact scenarios—Specific hazards. In Proceedings of the 17th European Conference on Composite Materials, Munich, Germany, 26–30 June 2016. [Google Scholar]
- Eibl, S.; Wolfrum, J. Prospects to separately estimate temperature and duration of a thermal pre-load on a polymer matrix composite. J. Comp. Mat. 2013, 47, 3011–3025. [Google Scholar] [CrossRef]
- Eibl, S. Observing inhomogeneity of plastic components in carbon fibre reinforced polymer materials by ATR-FTIR spectroscopy in the micrometer scale. J. Comp. Mat. 2008, 42, 1231–1246. [Google Scholar] [CrossRef]
- Bruckbauer, P. Struktur-Eigenschafts-Beziehungen von Interphasen zwischen Epoxidharz und thermoplastischen Funktionsschichten für Faserverbundwerkstoffe (Structure-Property-Relations of Interphases Between Epoxy Resin and Thermoplastic Function Layers for CFRP). Ph.D. Thesis, Technical University of Munich, Munich, Germany, 2018. [Google Scholar]
- Zhang, M.; Yu, Y.; Li, L.; Zhou, H.; Gong, L.; Zhou, H. A molecular dynamics assisted insight on damping enhancement in carbon fiber reinforced polymer composites with oriented multilayer graphene oxide coatings. Microstructures 2024, 4, 2024051. [Google Scholar] [CrossRef]
- Product Data Sheets. Hexcel Inc. Available online: www.hexcel.com (accessed on 1 March 2025).
- Gröger, L. Einfluss des Lagenaufbaus und von Flammschutzmitteln auf das Abbrandverhalten von CFK (Influence of Lay-up and Flame Retardants on Reaction-to-Fire Properties of CFRP). Bachelor’s Thesis, University of Applied Sciences, Department Chemical Engineering, Münster, Germany, 2013. [Google Scholar]
- Schuster, T.; Eibl, S.; Gudladt, H.-J. Influence of carbon nanotubes on thermal response and reaction to fire properties of carbon fiber-reinforced plastic material. J. Comp. Mat. 2017, 52, 567–579. [Google Scholar] [CrossRef]
- Bahlmann, J. Einfluss von Modifikationen der Matrix auf die Thermische Schädigung von CFK. Bachelor’s Thesis, Universität der Bundeswehr München, Neubiberg, Germany, 2014. [Google Scholar]
- Eibl, S. Comparison of surface and bulk analytical techniques for the distinct quantification of a moderate thermal pre-load on a carbon fibre reinforced plastic material. Polym. Degrad. Stab. 2017, 135, 31–42. [Google Scholar] [CrossRef]
- Broschure Optris PI Series, Optris GmbH&Co KG, Berlin, Germany. Available online: www.optris.com (accessed on 7 September 2025).
- DIN EN 2564:1998-08; Aerospace Series—Carbon Fiber Reinforced Plastics—Unidirectional Laminates; Determination of Fiber, Resin and Pore Content. Deutsches Institut für Normung: Berlin, Germany, 1998.
- DIN EN 2563; Aerospace Series—Carbon Fiber Reinforced Plastics—Unidirectional Laminates; Determination of Apparent Interlaminar Shear Strength. Beuth Verlag: Berlin, Germany, 1997.
- Hummel, O.; Scholl, F. Atlas of Polymer and Plastics Analysis; Carl Hanser Verlag: Munich, Germany, 1988; Volume 2. [Google Scholar]
- Davis, M.E.; Davis, R.J. Fundamentals of Chemical Reaction Engineering; McGraw-Hill: Boston, MA, USA, 2003; p. 54. [Google Scholar]
- Heitzmann, M.T.; Hou, M.; Veidt, M.; Vandi, L.J.; Paton, R. Morphology of an Interface between Polyetherimide and Epoxy Prepreg. Adv. Mater. Res. 2012, 393–395, 184–188. [Google Scholar] [CrossRef]
- Raghava, R.S. Development and characterization of thermosetting—Thermoplastic polymer blends for applications in damage-tolerant composites. J. Polym. Sci. Part B Polym. Phys. 1988, 26, 65–81. [Google Scholar] [CrossRef]
- Eibl, S. Influence of unwoven roving and woven fabric carbon fiber reinforcements on reaction-to-fire properties of polymer matrix composites. Fire Mater. 2020, 44, 557–572. [Google Scholar] [CrossRef]
- Mark, H.; Workman, J. Chemometrics in Spectroscopy; Academic Press-Elsevier: Amsterdam, The Netherlands, 2007. [Google Scholar]
- Chalmers, J.M.; Griffiths, P.R. Handbook of Vibrational Spectroscopy; Wiley-VCH: Hoboken, NJ, USA, 2002; p. 2226. [Google Scholar]
Disclaimer/Publisher’s Note: The statements, opinions and data contained in all publications are solely those of the individual author(s) and contributor(s) and not of MDPI and/or the editor(s). MDPI and/or the editor(s) disclaim responsibility for any injury to people or property resulting from any ideas, methods, instructions or products referred to in the content. |
© 2025 by the authors. Licensee MDPI, Basel, Switzerland. This article is an open access article distributed under the terms and conditions of the Creative Commons Attribution (CC BY) license (https://creativecommons.org/licenses/by/4.0/).