Article

Influence of Steel Fiber and Rebar Ratio on the Flexural Performance of UHPC T-Beams

1
Beijing Municipal Engineering Research Institute, Beijing 100037, China
2
The Key Laboratory of Urban Security and Disaster Engineering, Ministry of Education, Beijing University of Technology, Beijing 100124, China
*
Authors to whom correspondence should be addressed.
J. Compos. Sci. 2025, 9(10), 545; https://doi.org/10.3390/jcs9100545
Submission received: 16 September 2025 / Revised: 30 September 2025 / Accepted: 2 October 2025 / Published: 4 October 2025
(This article belongs to the Special Issue Concrete Composites in Hybrid Structures)

Abstract

To address the bottleneck issues of traditional concrete T-beams, such as excessive self-weight, susceptibility to cracking, and insufficient durability, this study investigates the flexural performance of Ultra-High-Performance Concrete (UHPC) T-beams. Through systematic experiments, the combined effects of three UHPC material ratios and three rebar schemes were analyzed. Six UHPC T-beam specimens were designed, and flexural performance tests were conducted using a staged loading approach, focusing on crack propagation, failure modes, and load-deflection curves to reveal their mechanical behavior and failure mechanisms. The results indicate that steel fibers significantly enhance UHPC toughness. At a fiber content of 1.5%, the specimens exhibited a yield load of 395–418 kN, with an ultimate load increase of 93% compared to the fiber-free specimens. The failure mode transitioned from brittle shear to ductile flexural. Increasing the rebar ratio improved load-bearing capacity, with a 4.58% rebar ratio yielding an ultimate load of 543 kN (51% higher than B1-02), but reduced ductility by 36%. Steel fibers restricted crack widths to 0.1 mm via crack-bridging effects, raising the cracking load by 53% and the shear capacity by 2.8 times. UHPC mix ratio adjustments had a limited impact on beam performance at the same fiber content. Overall, UHPC T-beams exhibited a compressive concrete crushing-dominated failure mode, with load-deflection curves showing a 42% gentler slope than conventional concrete. The ductility coefficient ranged from 3.8 to 5.2. For engineering applications, it is recommended to maintain a steel fiber content of at least 1.5% and a rebar ratio of 2.5–4.0% to strike a balance between strength and ductility.

1. Introduction

With the rapid development of modern engineering technology, the requirements for the performance of building materials are increasingly stringent, especially in extreme environments such as long-span bridges, high-rise buildings, and offshore platforms, where higher demands are placed on material strength, durability, and ductility [1,2,3,4]. Although traditional concrete materials have been widely used in various engineering projects, their limitations in terms of strength, toughness, and durability have gradually become apparent, making it difficult to meet the demand for high-performance materials in modern engineering. Therefore, the development of new high-performance building materials has become one of the research hotspots in the field of civil engineering [5,6,7,8].
Ultra-high-performance concrete (UHPC), as a new type of cement-based composite material, has garnered significant attention due to its ultra-high strength (120–250 MPa) [9,10], excellent durability, and favorable workability [11,12]. By optimizing the particle gradation of cementitious materials, incorporating reactive powders, high-efficiency water reducers, nanomaterials, and steel fibers, UHPC achieves a significant improvement in material performance [13,14,15,16,17,18,19] and maintains its mechanical properties even in harsh environments. The addition of steel fibers not only significantly enhances the tensile strength and toughness of UHPC but also effectively inhibits crack propagation, thereby greatly improving the overall structural performance [20]. Compared to traditional concrete, UHPC exhibits superior workability, mechanical properties, and durability, and is often regarded as the preferred material for seismic design [21].
T-beams, as an economical and efficient bridge structure, significantly reduce the bridge’s self-weight by minimizing the concrete volume in the tension zone, thereby improving structural design economy [22,23]. Since the 1950s, they have been widely used in highway transportation systems. T-beams shorten construction periods, reduce costs, and are particularly suitable for projects with rugged terrain [24]. However, with the increase in traffic loads and service years, early-constructed T-beam bridges have gradually revealed issues such as insufficient structural stability, weak transverse connections, and concrete cracking [25]. These defects have prompted researchers to explore multi-dimensional improvements, including material innovation, structural optimization, and reinforcement engineering. Alampalli [26] studied the application of Fiber-Reinforced Polymer (FRP) composite laminates in reinforcing reinforced concrete T-beam bridges. The results showed that after installing FRP composite plates, the stress of the main rebar moderately decreased, the flexural and shear stresses in the concrete moderately increased, and the distribution of transverse live loads on the beam slightly improved. Deifalla [27] investigated the mechanical behavior of various reinforced Light-Weight-Foam Concrete (LWFC) T-beams under shear, torsion, and moment, finding that LWFC T-beams experienced a 9% reduction in maximum strength, a 25% increase in maximum deflection, absorbed more energy before failure, and exhibited greater deformation after yielding.
UHPC is reshaping the design paradigm and application boundaries of T-beam bridges. Traditional concrete T-beam bridges have long faced challenges such as heavy self-weight, susceptibility to cracking, and insufficient durability. In marine environments or under heavy traffic, issues such as weak transverse connections, concrete carbonation, and chloride ion-induced degradation are particularly prominent [28]. The mechanical behavior of UHPC and its synergistic working mechanism with steel rebar differ significantly from those of traditional concrete, leading to profound innovations and structural optimizations in T-beams. UHPC significantly enhances the light-weighting, crack resistance, and service life of bridges, providing new pathways for industrialized construction and long-term operation and maintenance in bridge engineering [29]. Hao [30] tested the shear performance of five precast high-strength reinforced UHPC T-beams with different shear span ratios, finding that shear strength significantly increased with a decreasing shear span ratio. All specimens exhibited diagonal compression failure and shear compression failure, with steel fibers effectively preventing UHPC spalling and limiting internal steel rebar. Zhao [31] studied the flexural performance of UHPC T- and Hot-Rolled Steel (HRS) H-section Composite Beams (HUCBs), concluding that the strength of HRS and the total depth of the cross-section significantly influenced the moment-curvature response of HUCBs. The yield point was primarily determined by the HRS H-section steel, while the tensile strength of UHPC had a minimal impact on yield, ultimate moments, and ductility.
Although some scholars have conducted research on UHPC T-beams, there is a lack of in-depth studies on the flexural performance of T-beams under different UHPC materials and rebar schemes, as well as a limited understanding of failure mechanisms. To address this research gap, this study systematically investigates the mechanical performance and failure mechanisms of UHPC T-beams under different UHPC materials and rebar schemes. Detailed research is conducted on the preparation and hydration reaction mechanisms of UHPC materials, and flexural tests are performed to analyze the effects of different mix ratios and rebar schemes on the flexural performance, crack development patterns, failure modes, and ultimate load-bearing capacity and ductility of UHPC T-beams. The experimental results reveal the interactive influence mechanism of three variables—steel fiber content, UHPC matrix mix proportion, and reinforcement ratio—on the flexural performance of T-beams. They elucidate the intrinsic mechanism by which steel fibers transform the failure mode from brittle shear to ductile bending through crack-arresting effects. The synergistic behavior between flange compression and web shear resistance in T-beams provides a new perspective for calculating the effective flange width and analyzing shear lag effects in rectangular beam-slab structures. This study is expected to offer a scientific basis for the optimized design and engineering application of ultra-high-performance concrete (UHPC) T-beams.

2. Mix Ratio Design

A corresponding study was conducted on the hydration reaction and mix proportion formulation of UHPC. Three UHPC mix proportions with compressive strengths around 130 MPa were developed. Mix 1: Base material components unchanged, no steel fibers incorporated. Mix 2: Material quantities adjusted, 1.5% steel fibers incorporated. Mix 3: Based on Mix 1, with 1.5% steel fibers incorporated. The three mix rules are shown in Table 1, and the detailed mix proportions are provided in Table 2.

3. UHPC Compressive Strength

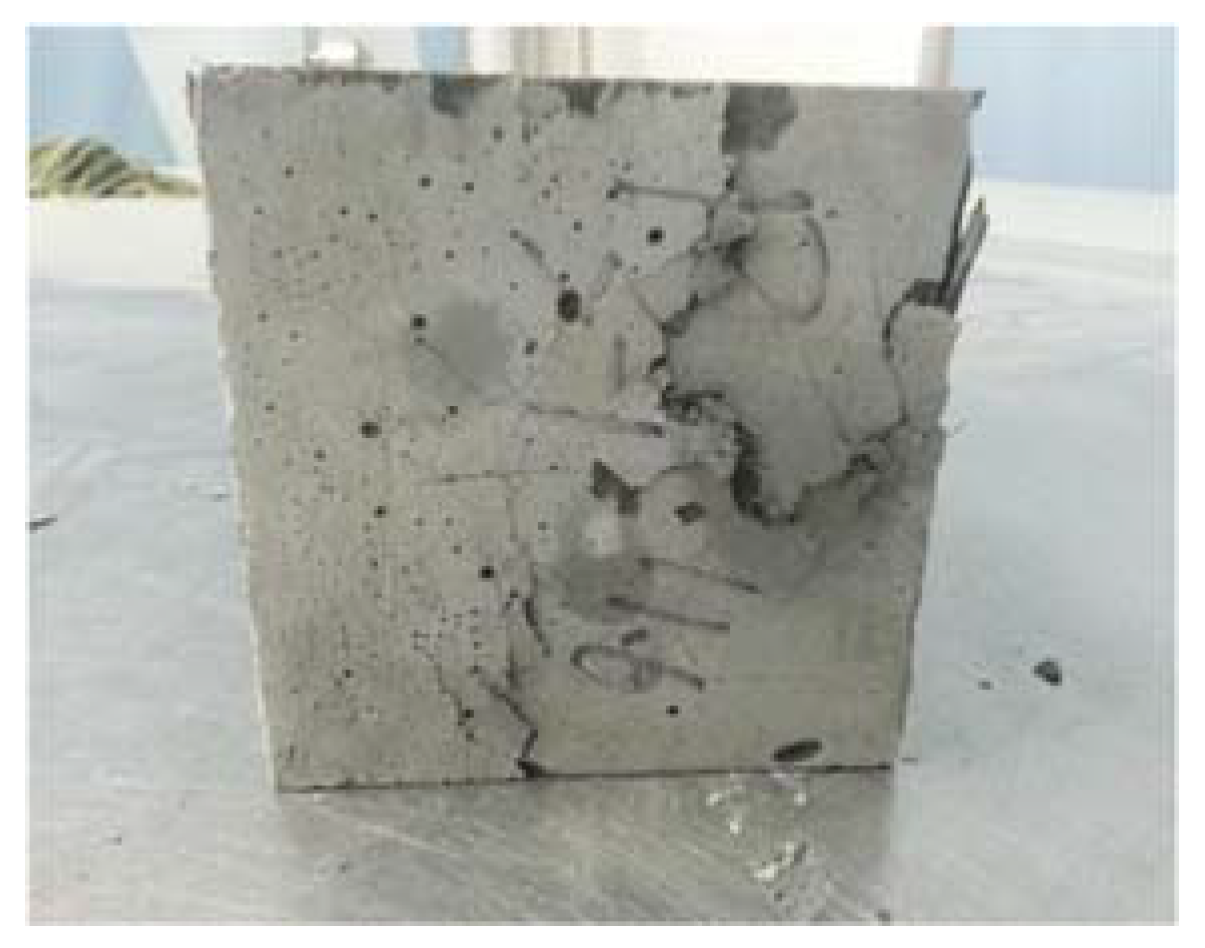
Referring to GB/T50081 Standard for test method of mechanical properties on ordinary concrete. Beijing, China 2019 [32], 40 mm, 70 mm, and 100 mm cubic specimens were used to determine the compressive strength of UHPC. The specimens without steel fibers exhibited brittle failure, with concrete spalling off from all sides of the cubes, as shown in Figure 1. For the second and third mix proportions with steel fibers, as the load approached the ultimate level, sounds of steel fibers being pulled and concrete being crushed were heard. When the load reached its maximum, the specimens failed, accompanied by a clear bursting sound. Compared to the specimens without steel fibers, their surfaces remained relatively intact without concrete fragmentation or spalling, as shown in Figure 2. The compressive strengths of each group of UHPC specimens are presented in Table 3.

4. Design of Flexural Test for T-Beams

4.1. Test Purpose and Scope

This study designed a flexural test of T-beams composed of UHPC and HRB500 steel rebar, investigating their mechanical performance and failure mechanisms through experimental observations and conclusions. The main test variables included three rebar schemes and three UHPC mix ratios. Key details of the T-beams, such as the rebar schemes, steel fiber content, and quantity, are presented in Table 4.

4.2. Specimen Preparation Process

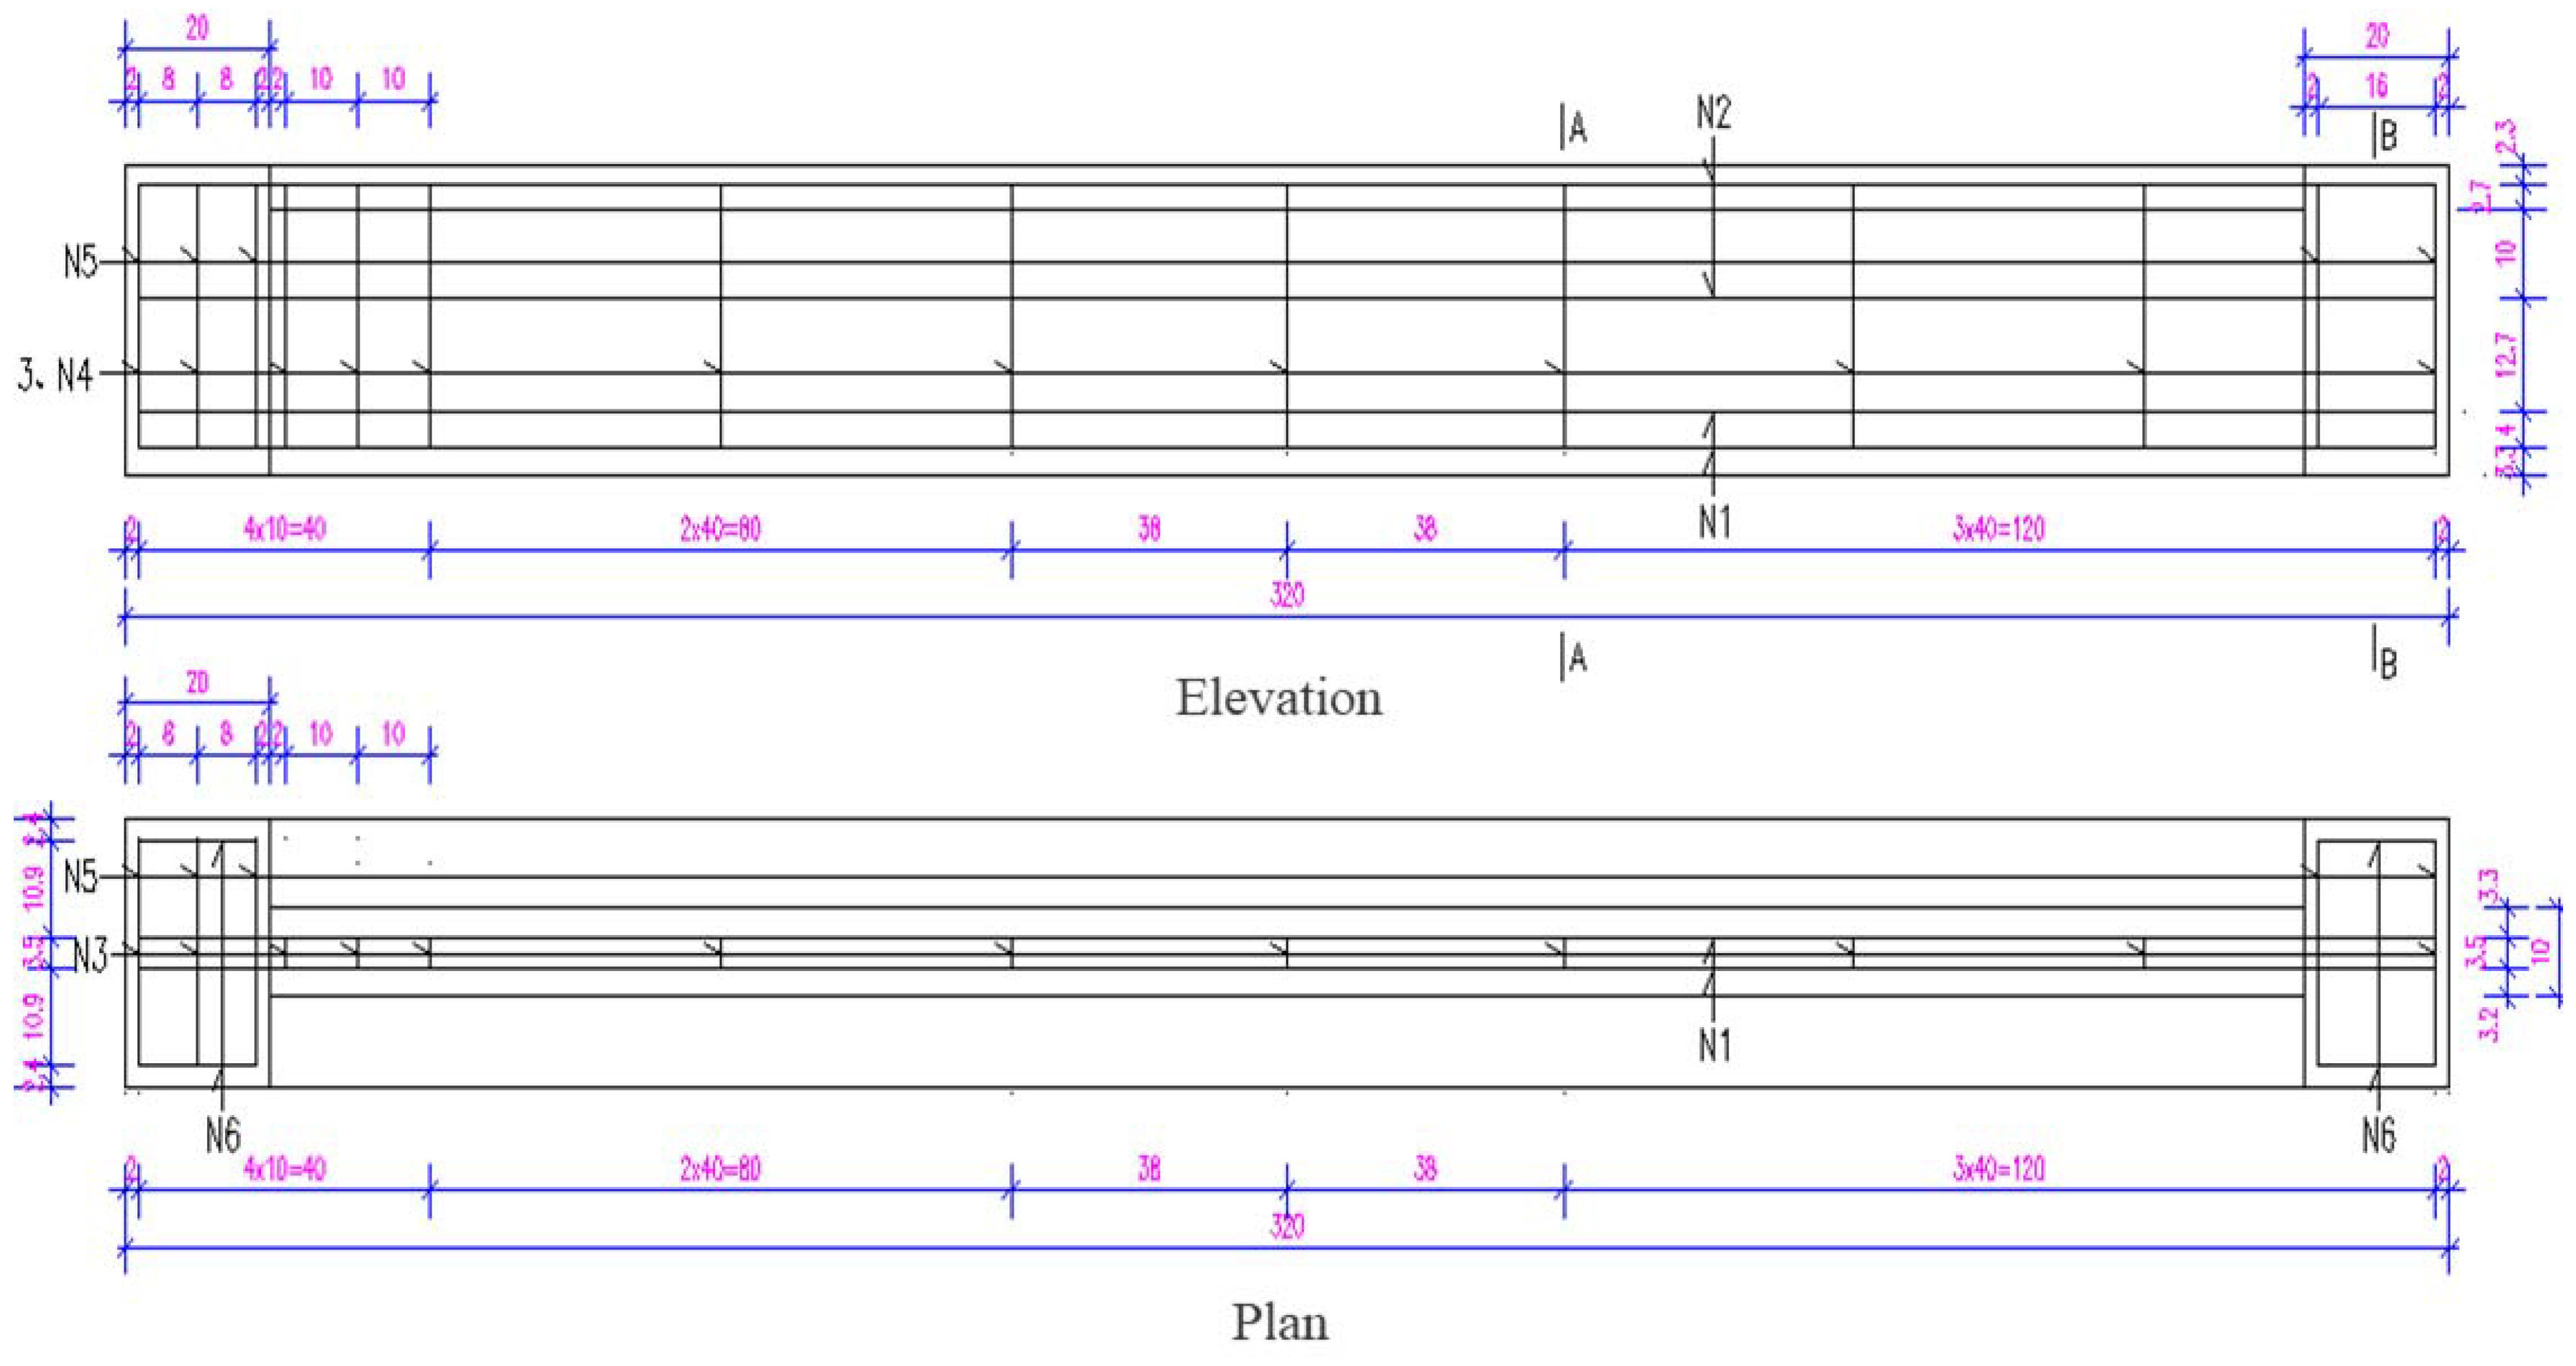
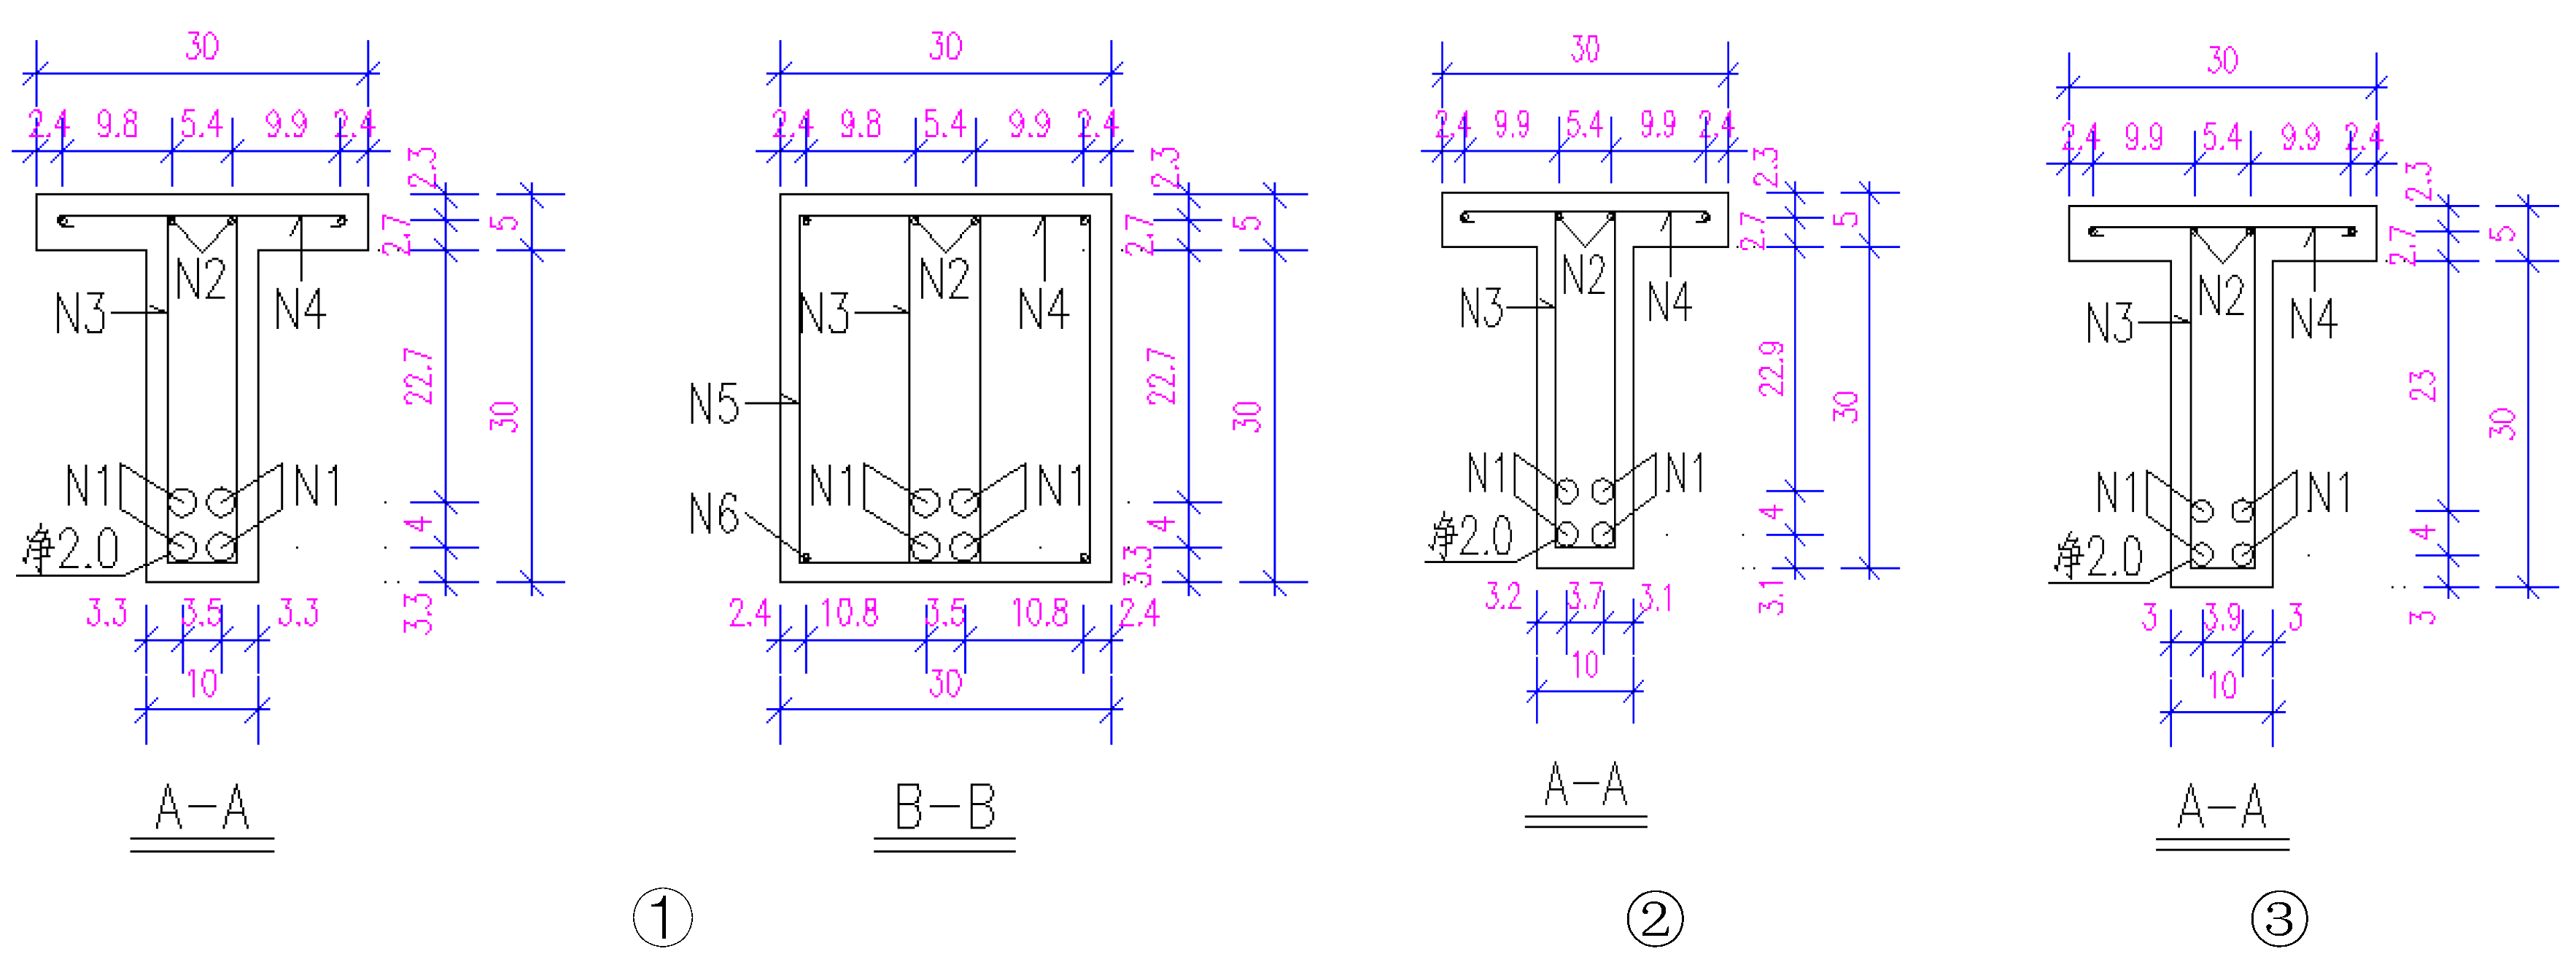
The dimensions and rebar schemes of the T-beam specimens are shown in Figure 3 and Figure 4. Design the T-beam formwork according to Figure 3, ensuring a consistent concrete cover thickness and preventing displacement during casting. Subsequently, assemble the reinforcement according to the plan in Figure 4, ensuring the main reinforcement bars are correctly positioned. Next, prepare the UHPC mixture. First, evenly dry-mix the cement, mineral powder, silica fume, and quartz sand. Then, add water and a water-reducing agent, mixing until a fluid state is achieved. Slowly incorporate the steel fibers to prevent clumping and continue mixing until they are uniformly dispersed. Afterwards, pour the UHPC into the formwork. Compact the mixture in layers through vibration, paying special attention to the junction between the web and the flange. Finally, level the surface of the T-beam to eliminate air bubbles and other defects. After curing at room temperature for 24 h, remove the formwork. The T-beam should then undergo standard curing until the commencement of the tests.
In Figure 4, ① designation is applicable to beam B3-02, where N1 consists of 2 pieces of 25 mm diameter and 2 pieces of 20 mm diameter HRB500 steel bars. ② designation is applicable to beams B2-01/02/03, where N1 consists of 4 pieces of 20 mm diameter HRB500 steel bars. ③ designation is applicable to beam B1-02, where N1 consists of 4 pieces of 20 mm diameter HRB500 steel bars.

4.3. Load Scheme

This study adopted a staged loading protocol. Before the steel rebar yielded, a load-controlled loading method was employed at a rate of 20 kN/min, with increments of 30 kN per stage. After yielding occurred, the loading method was switched to displacement control at a rate of 5 mm/min, with increments of 10 mm per stage, until specimen failure. The arrangement of the loading setup is shown in Figure 5.
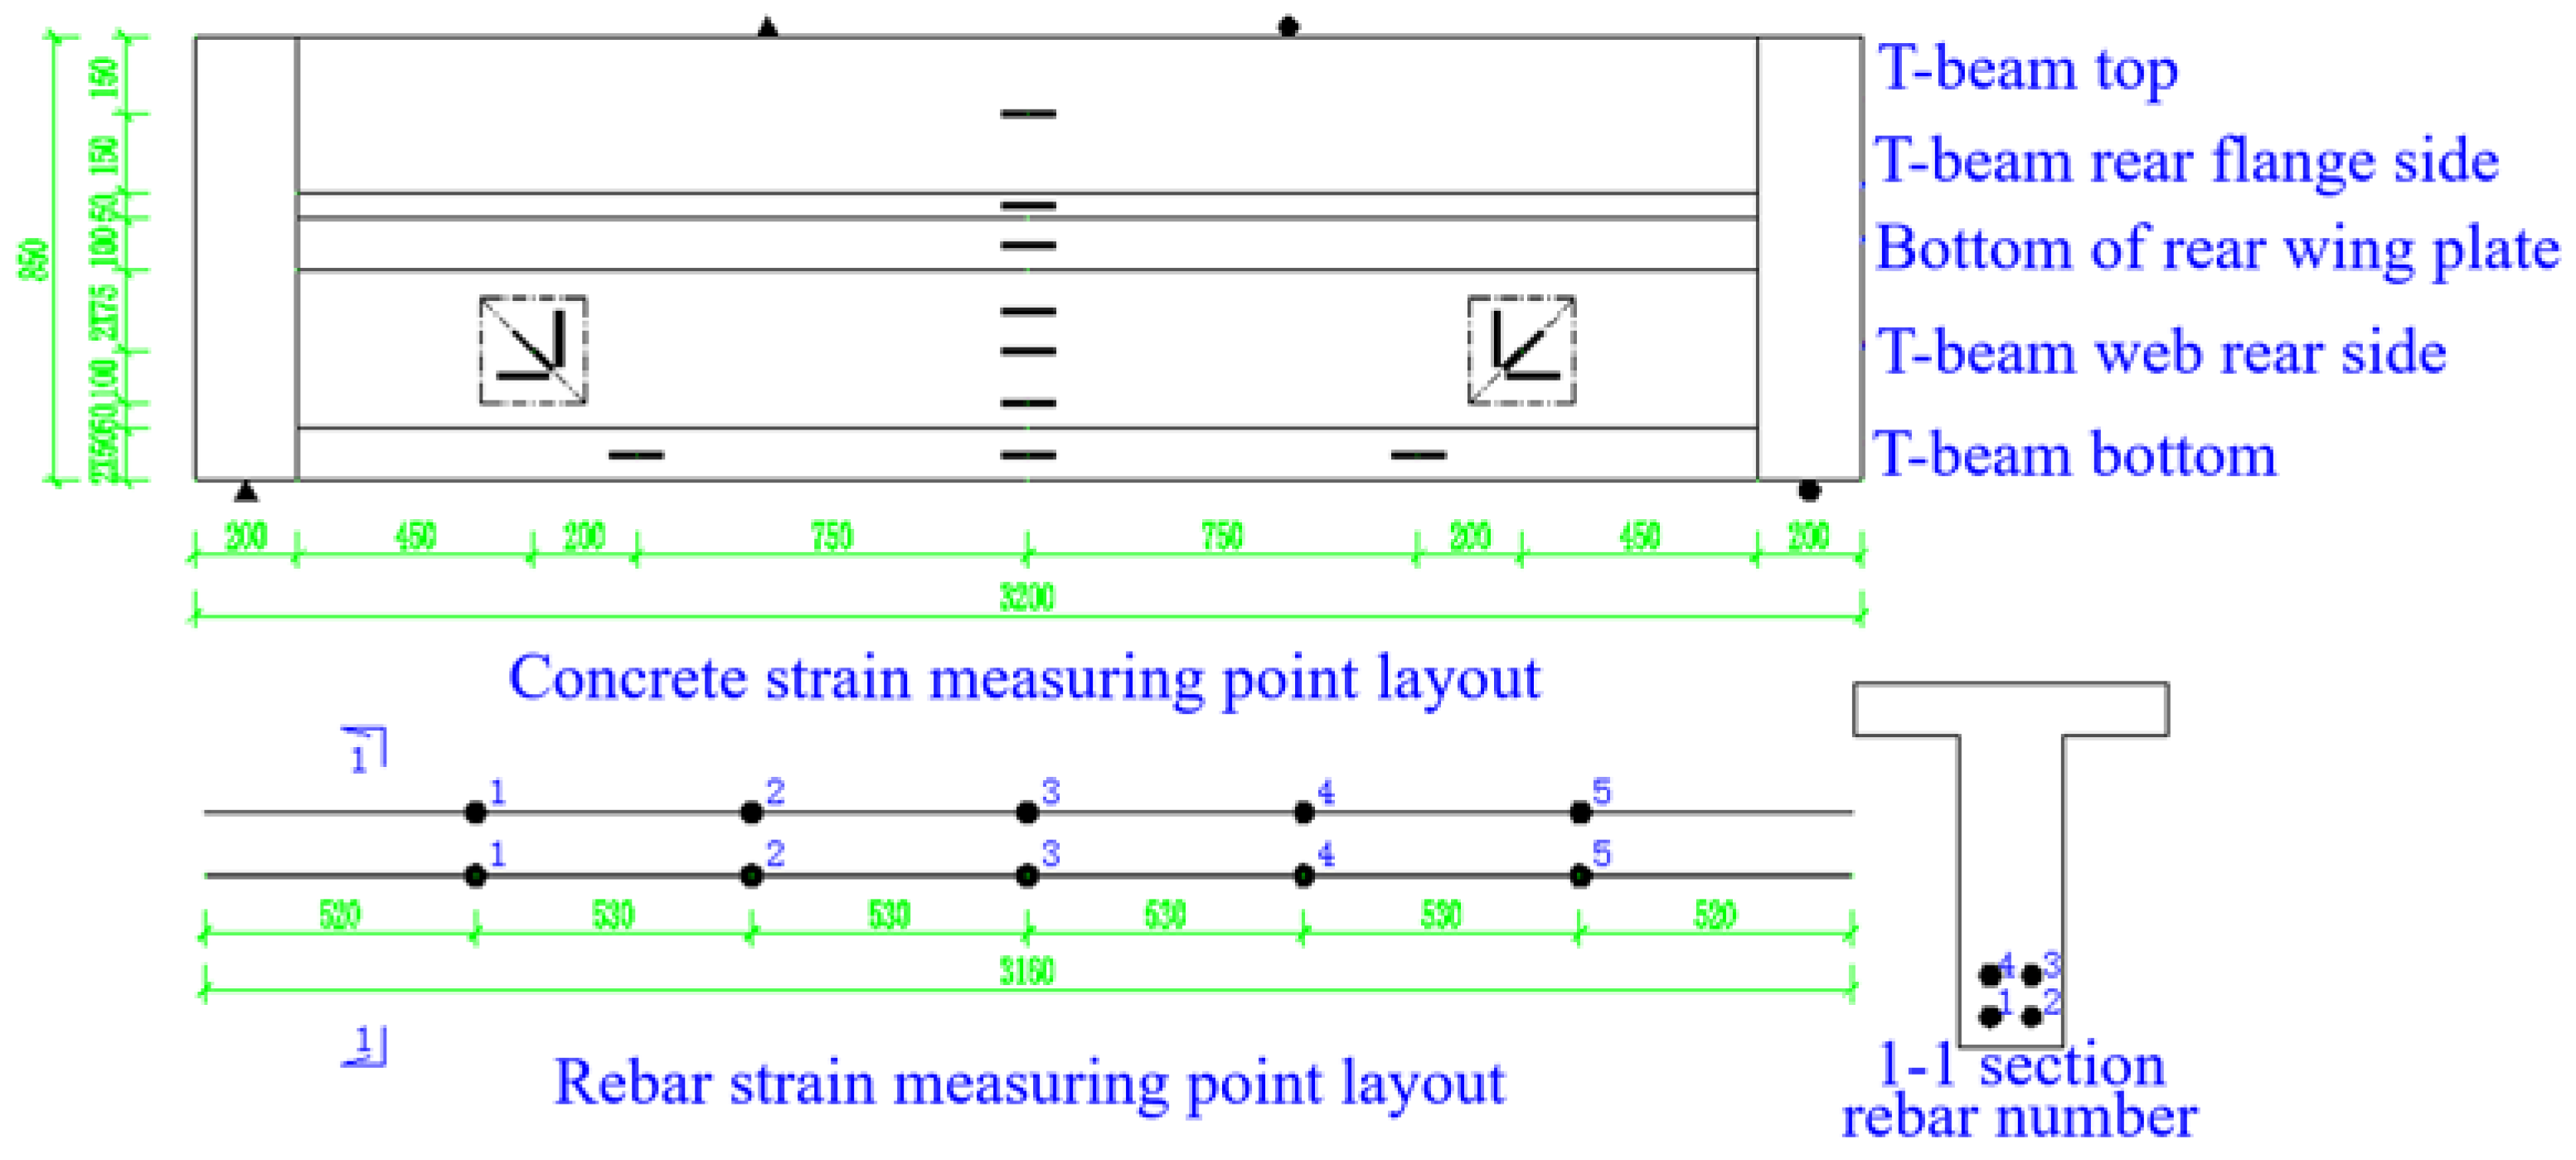
To ensure more accurate data for the experiment, measurements were taken for load, mid-span deflection, rebar strain, and concrete strain. The strain gauge positions are shown in Figure 6.

5. T-Beam Flexural Test Results

5.1. B1-02 T-Beam Test Procedure and Results

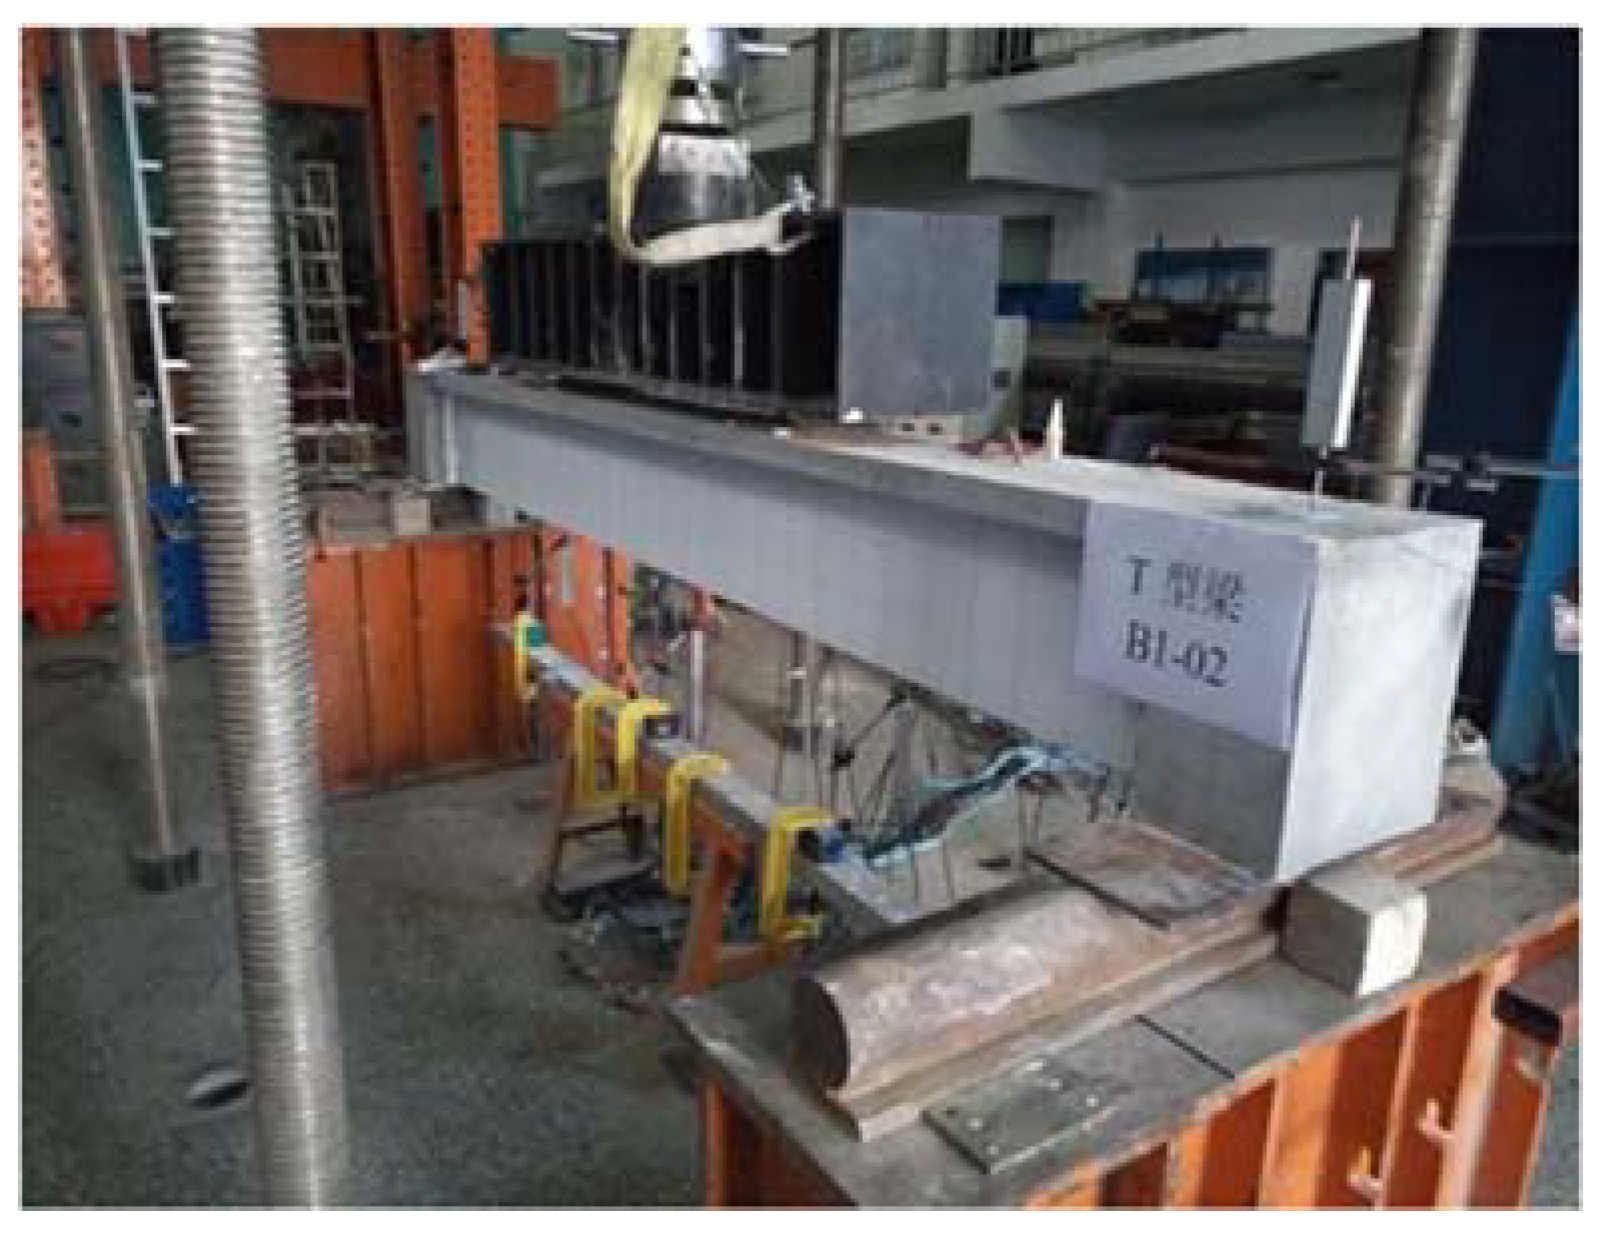
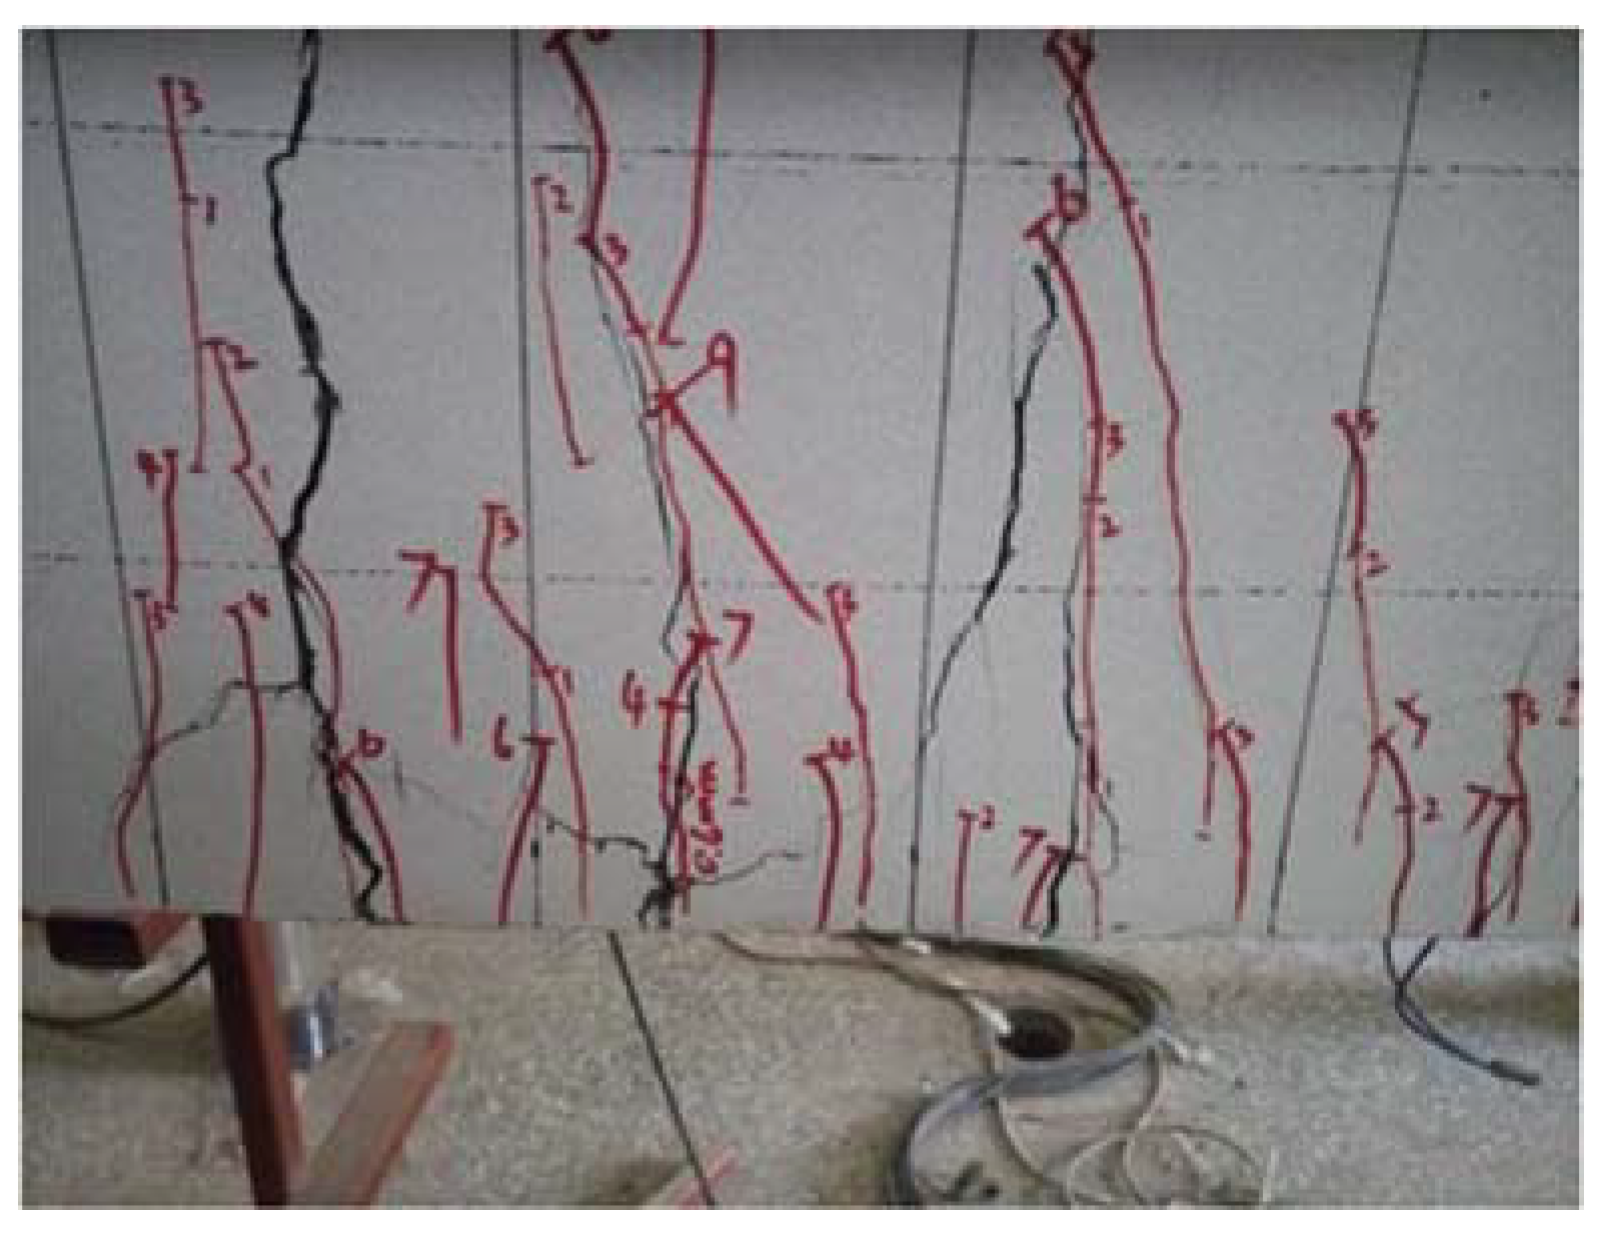
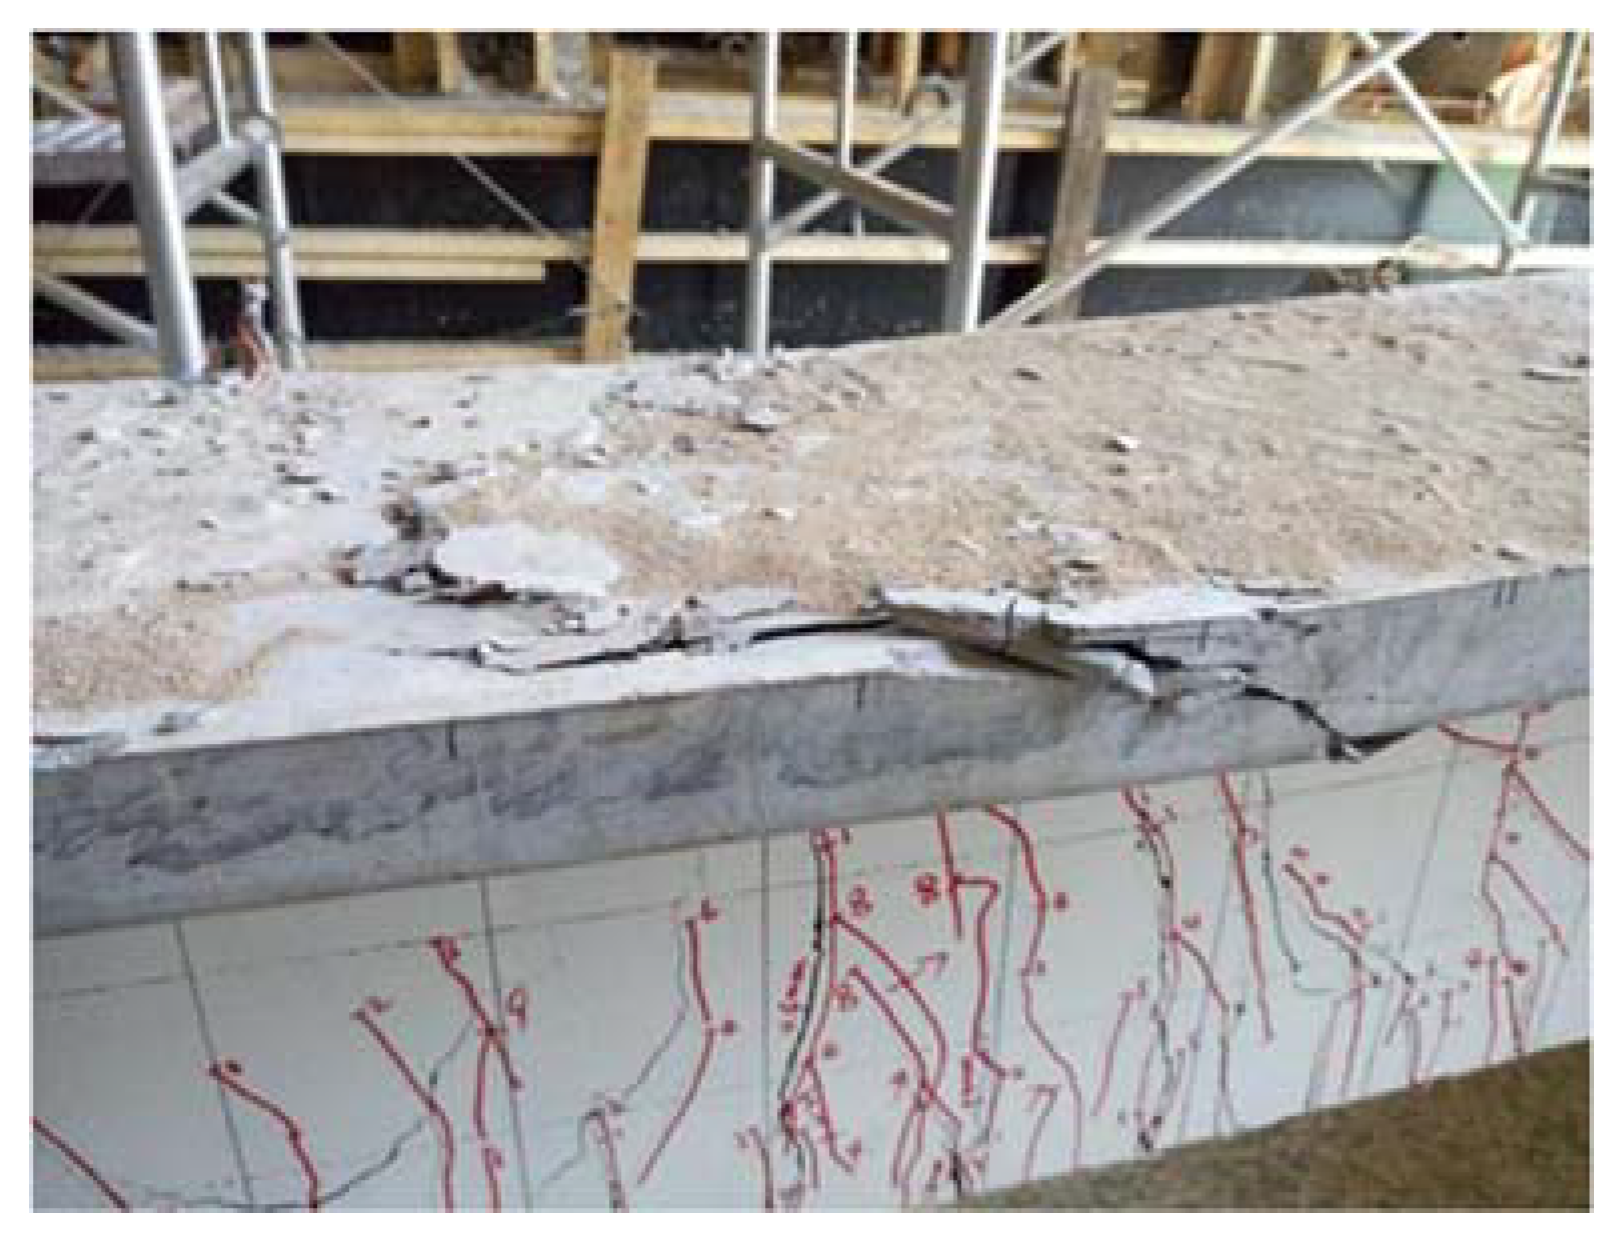
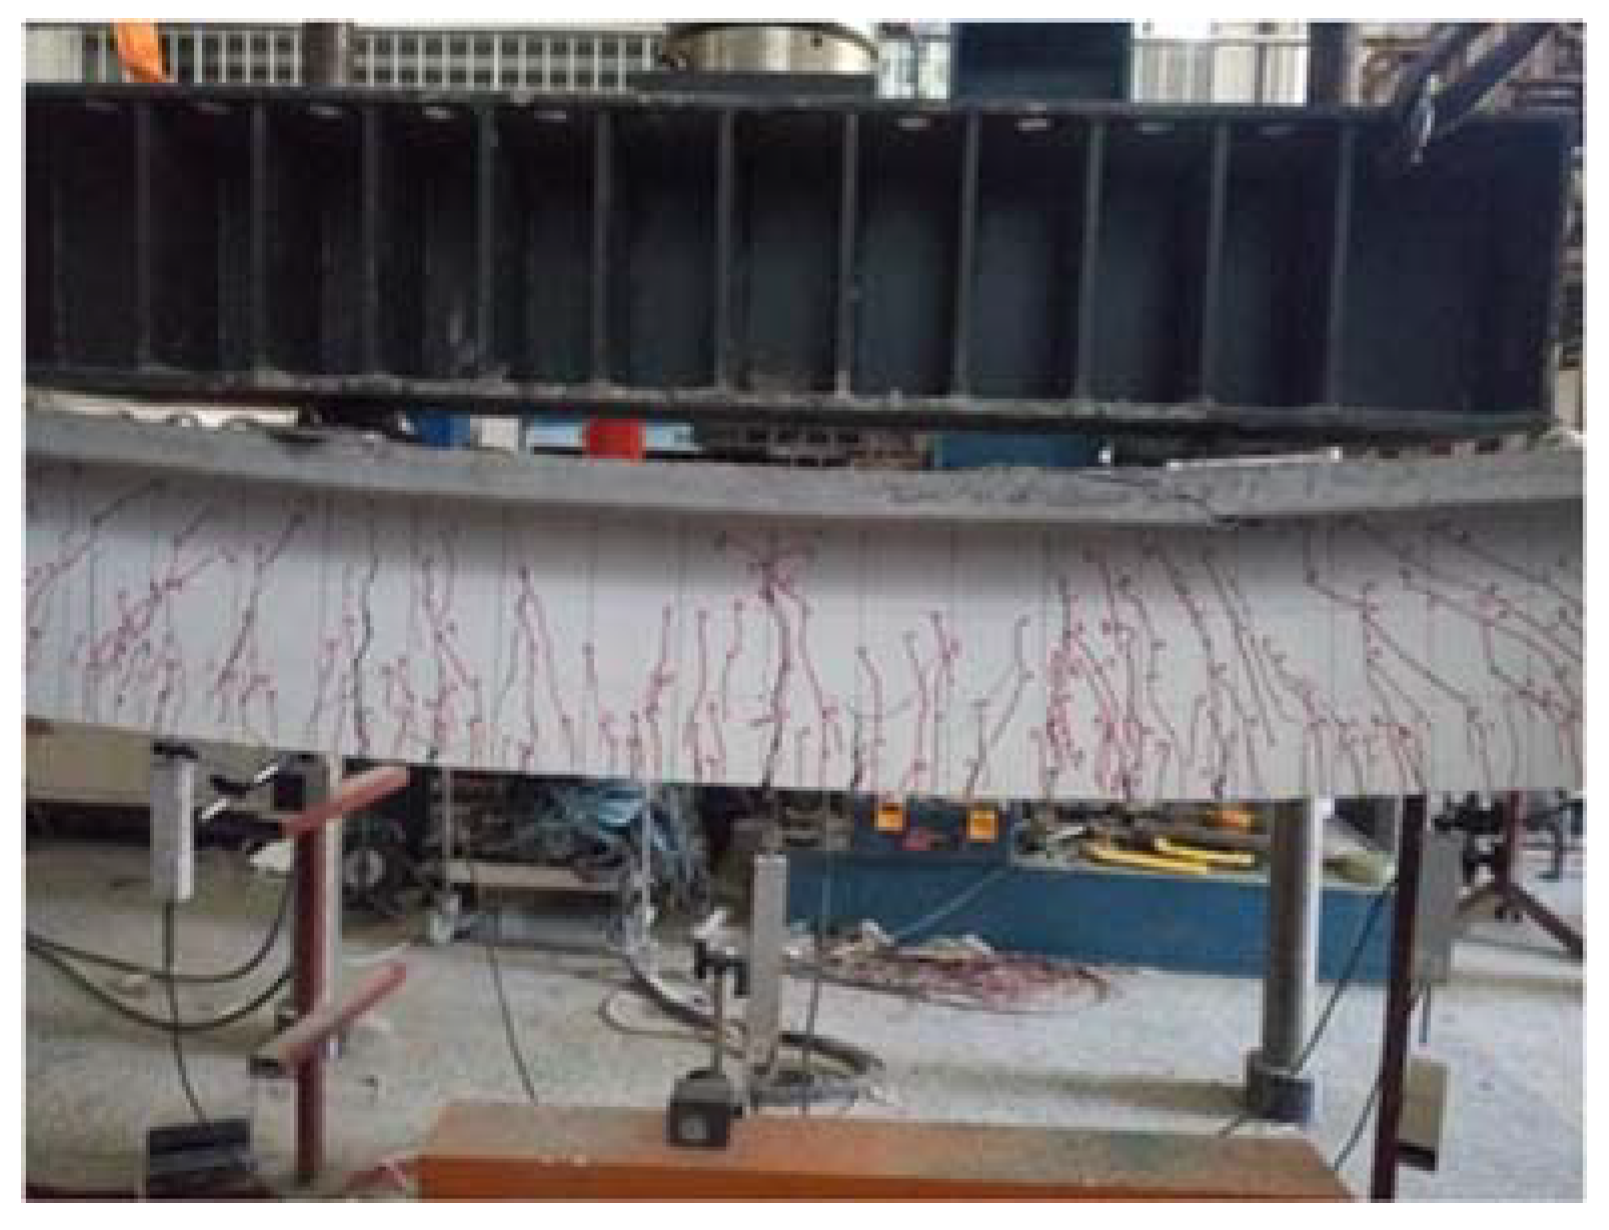
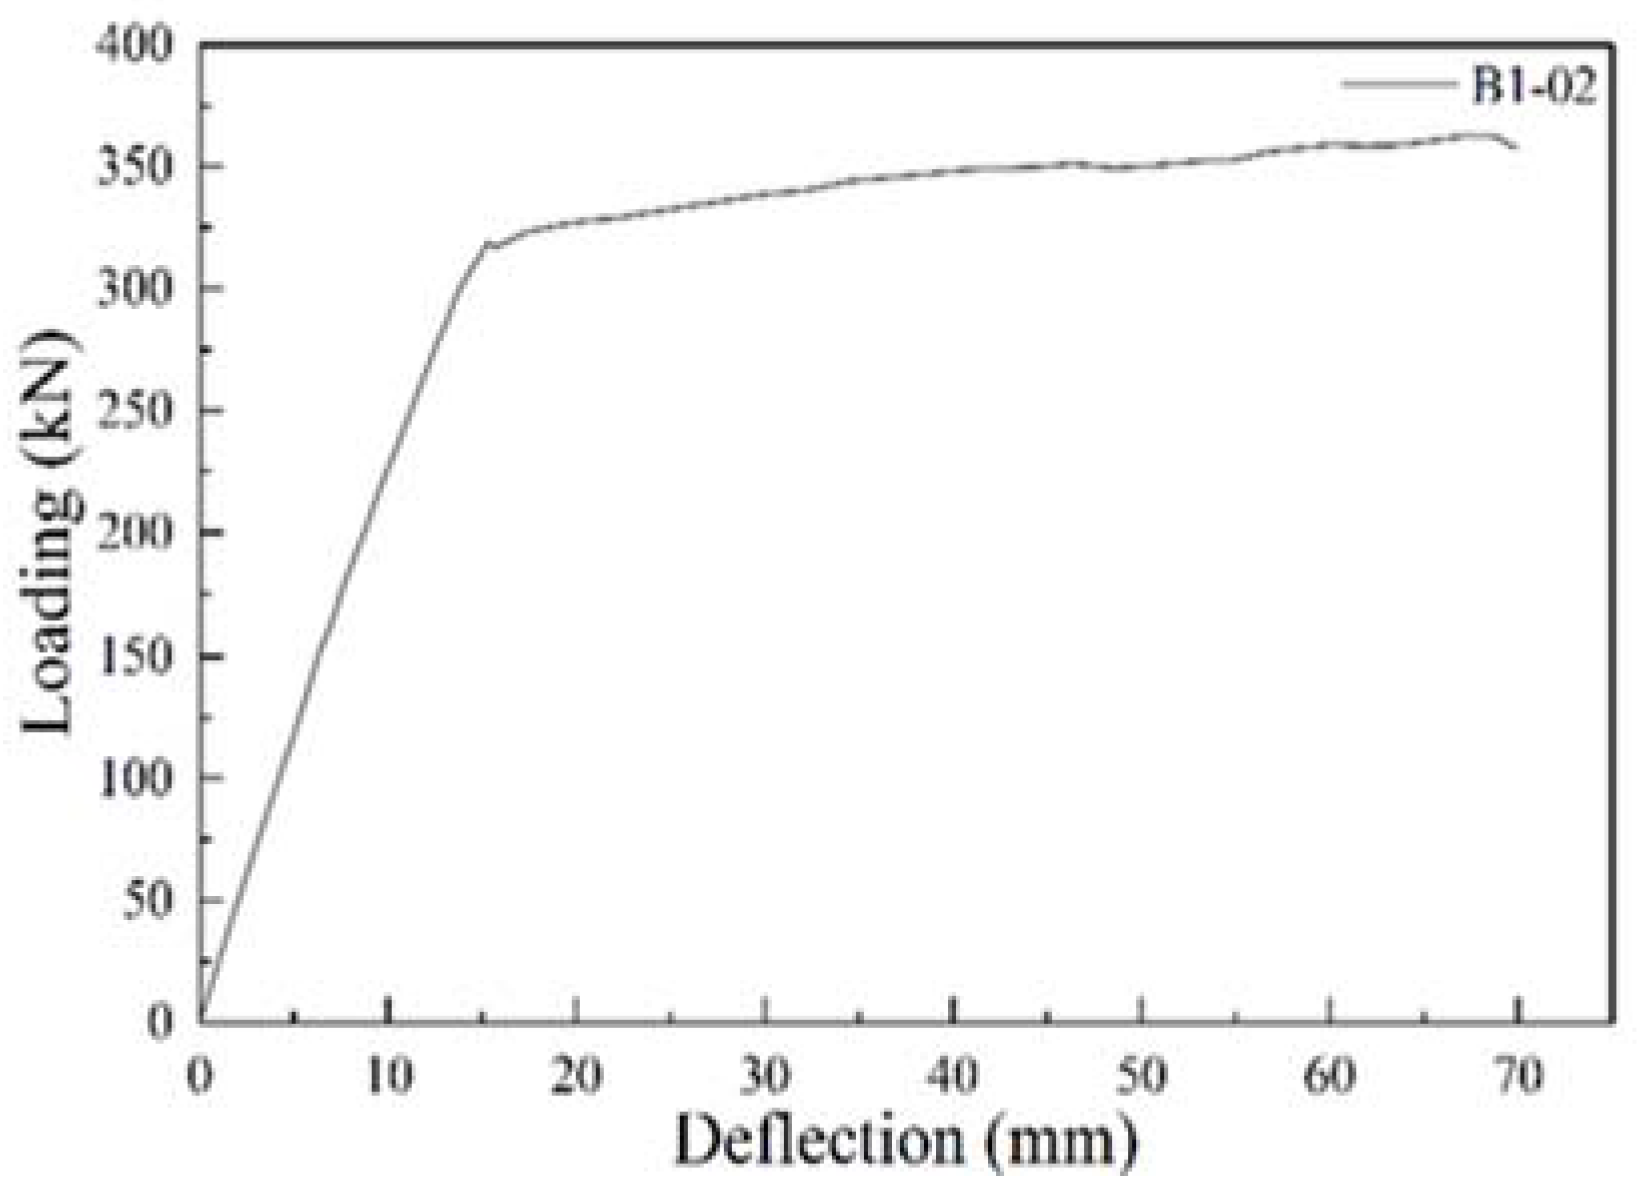
The loading process and crack conditions of beam B1-02 are shown in Figure 7, Figure 8, Figure 9, Figure 10 and Figure 11. When the load reached 76 kN, hairline cracks appeared on the side surface of the beam. As the load increased, the number of cracks gradually multiplied, and their width progressively expanded. At 319 kN, the load-deflection curve ceased to be linear, exhibiting a distinct inflection point, indicating that the beam had entered the yield stage, with a deflection of 16 mm at yield. Upon reaching 360 kN, the beam attained its ultimate load capacity, after which its bearing capacity began to decline gradually, while the mid-span deflection reached 70 mm at this stage.
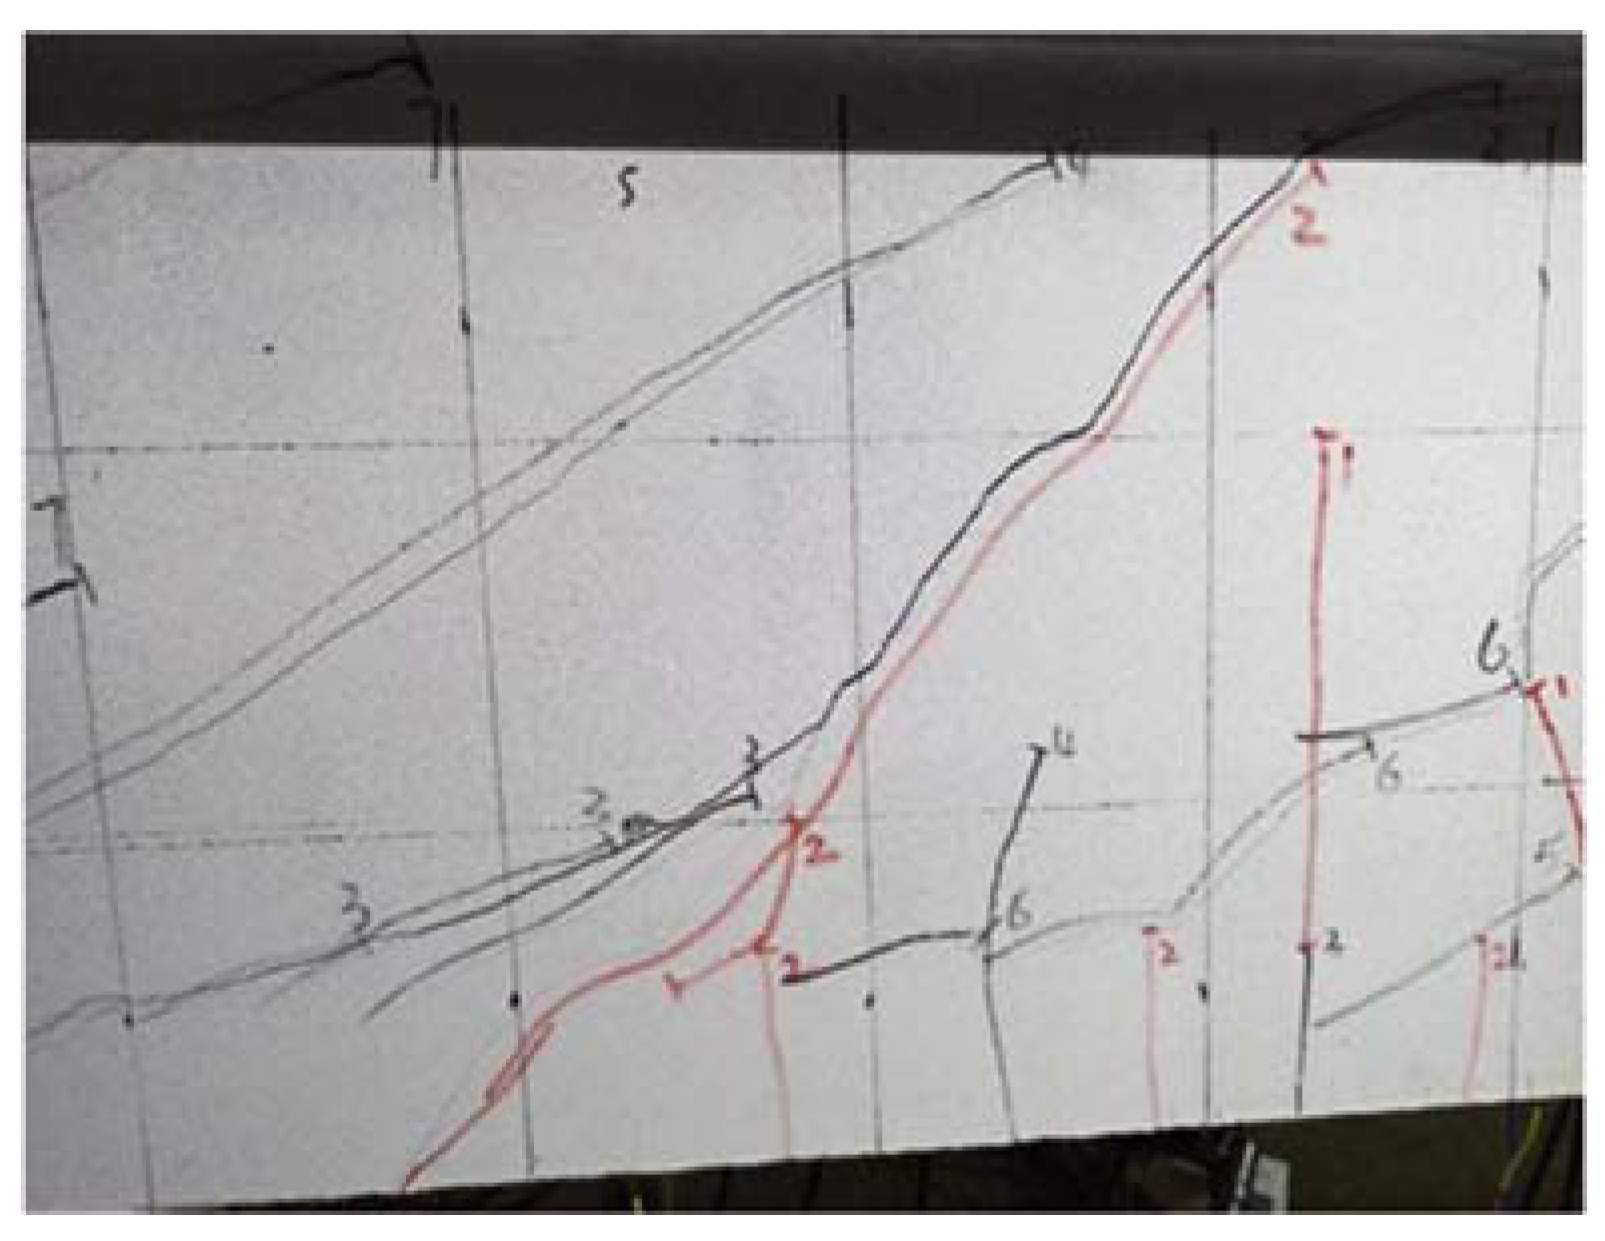
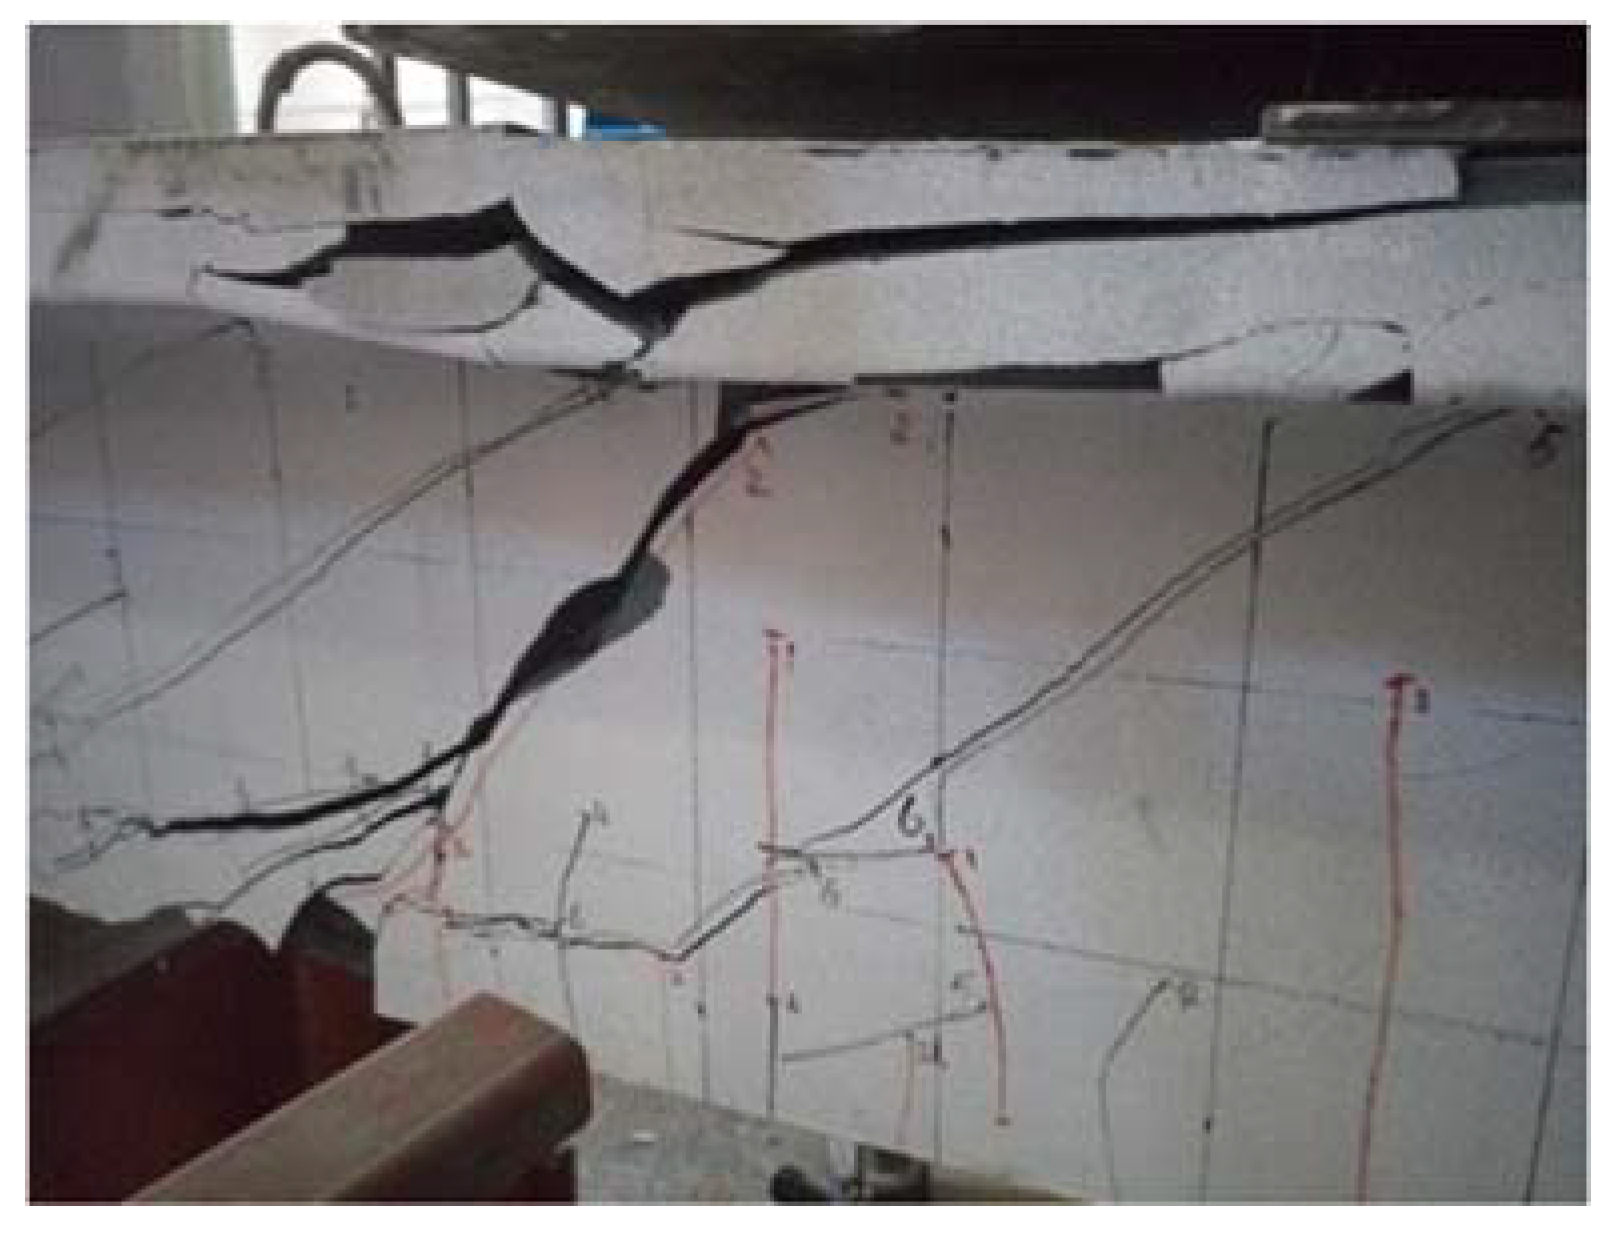
The crack pattern of beam B1-02 is shown in Figure 7, and its failure condition is illustrated in Figure 11. Cracks initiated at the mid-span bottom of the beam. As the load increased, cracks also began to appear in the shear zone, with the mid-span cracks propagating upward. With further load increase, the crack widths started to enlarge, particularly at a faster rate in the shear zone. Subsequently, the crack width in the shear zone stabilized around 0.1 mm, while the mid-span cracks began to widen significantly. After rebar yielding, numerous cracks developed at the mid-span and beneath the right loading point as deflection increased. The concrete cover gradually cracked (Figure 9), and these cracks continued to expand with increasing load until failure occurred in the compression zone at the top of the beam, as depicted in Figure 10.
The load-deflection curve of beam B1-02 is shown in Figure 12. Through the load-midspan deflection curve, it can be clearly observed that the elastic stage (0–15 mm) exhibits linear growth. During the elastic-plastic transition stage (15–40 mm), the curve slope decreases significantly, with a stiffness reduction rate of 82%, accompanied by the formation of a yield plateau, showing a nonlinear relationship. In the plastic development stage (40–70 mm), the load stabilizes within the range of 340–350 kN, and the load-to-deflection ratio reaches 1:0.016, entering the stage of large structural deformation. The ultimate bearing capacity is 348.7 kN (corresponding to 70 mm deflection). The failure mode aligns with the characteristics of typical flexural members.

5.2. B2-01 T-Beam Test Procedure and Results

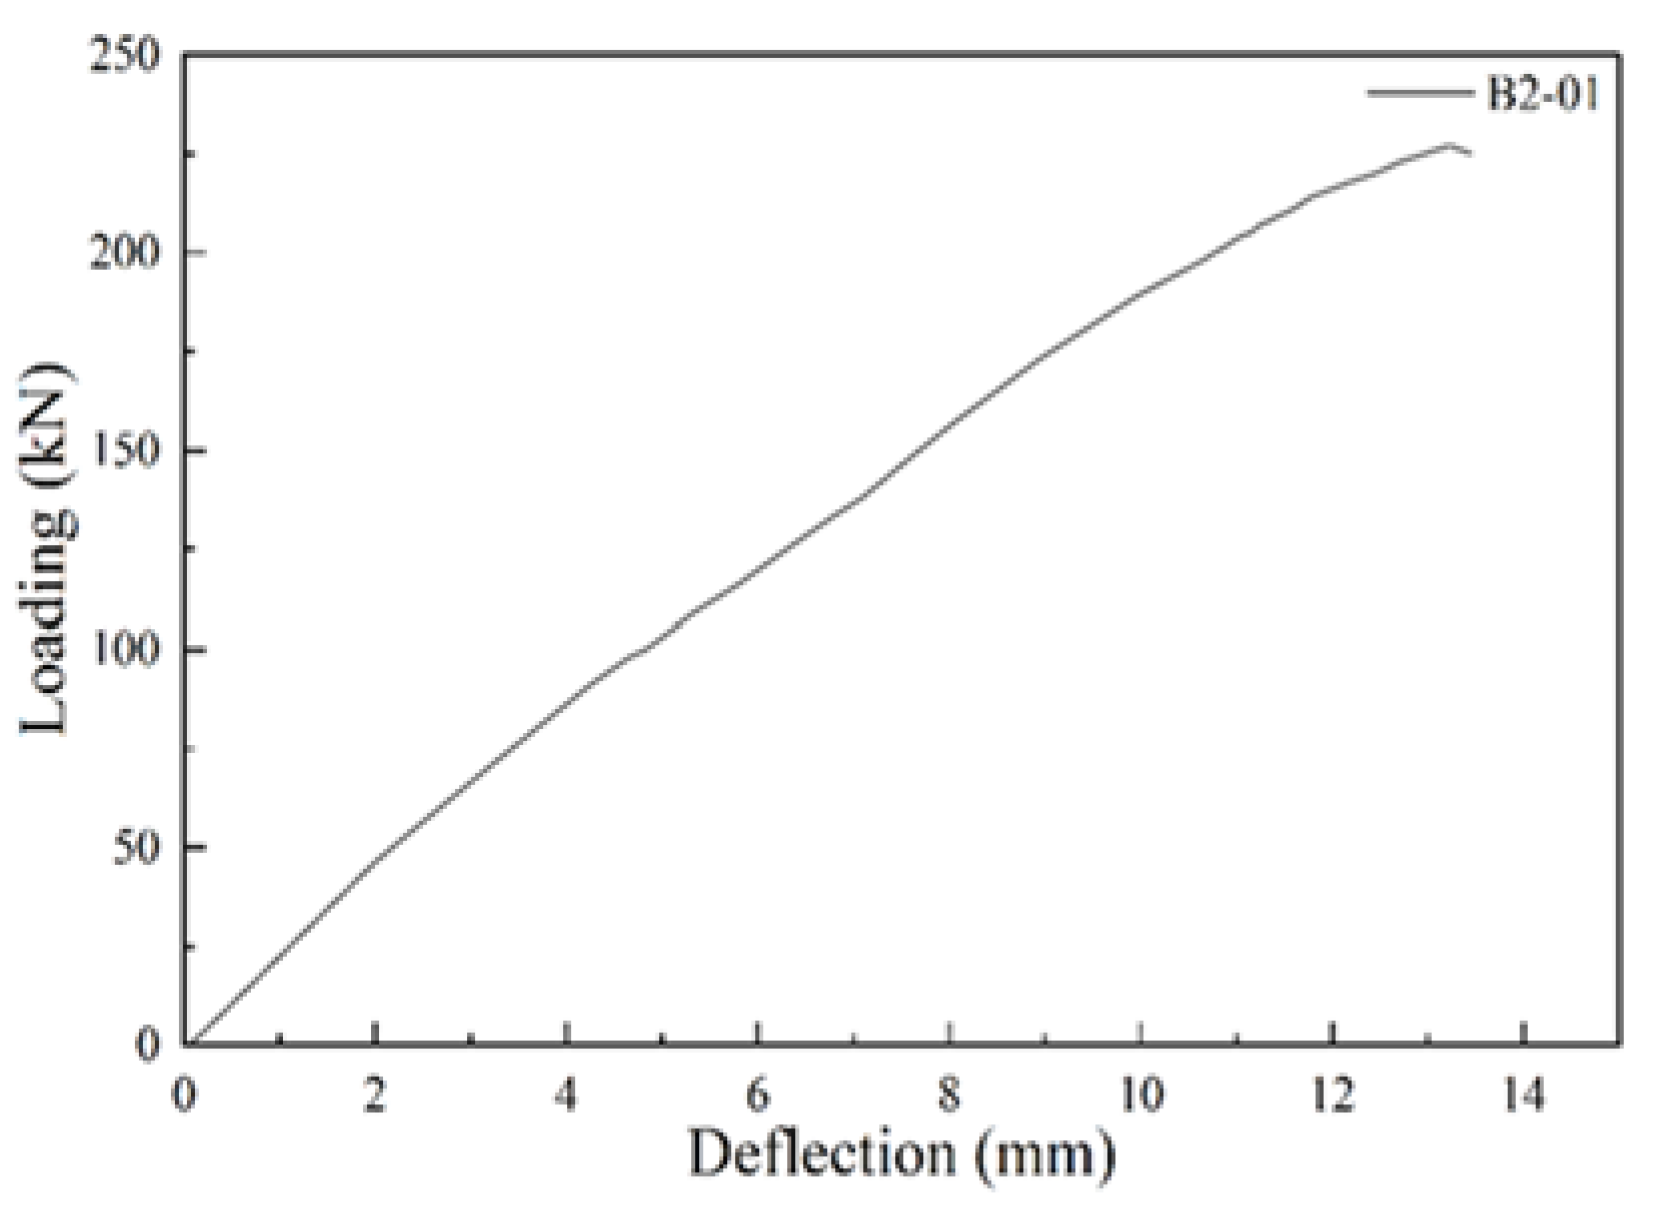
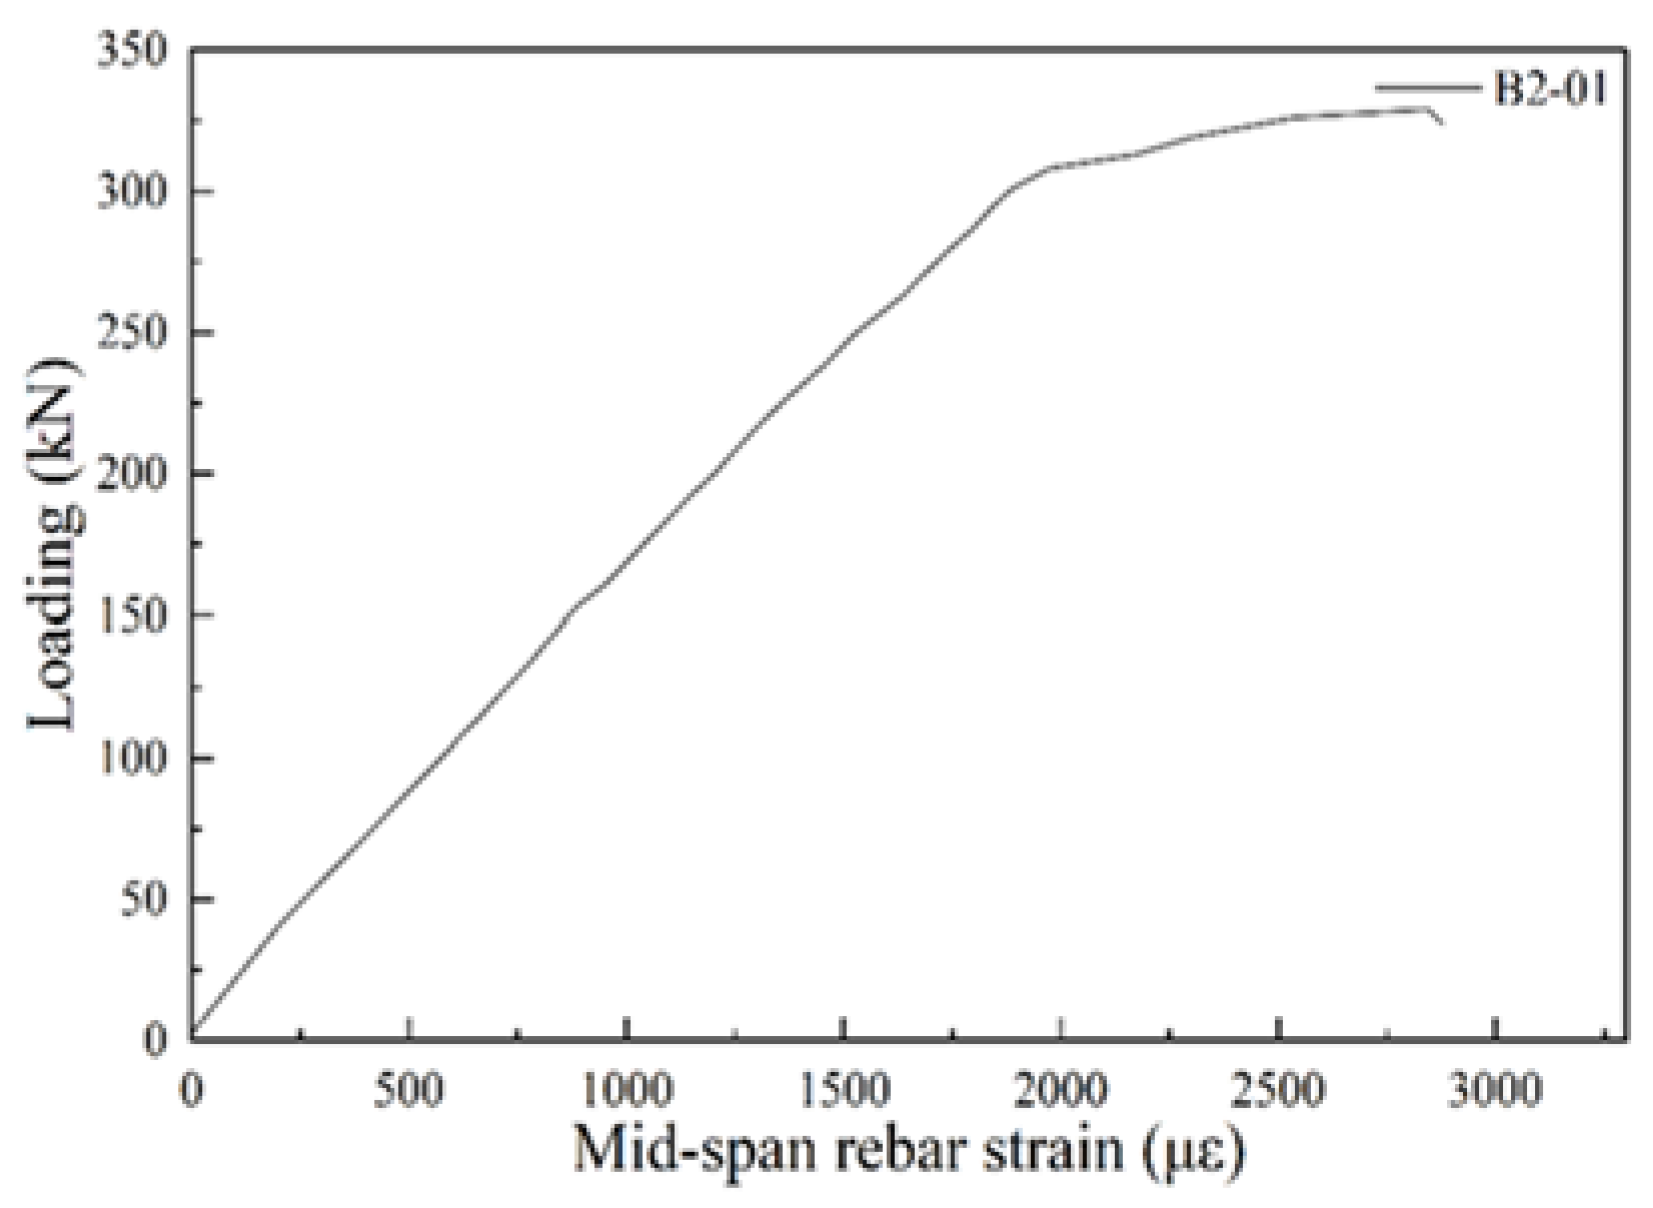
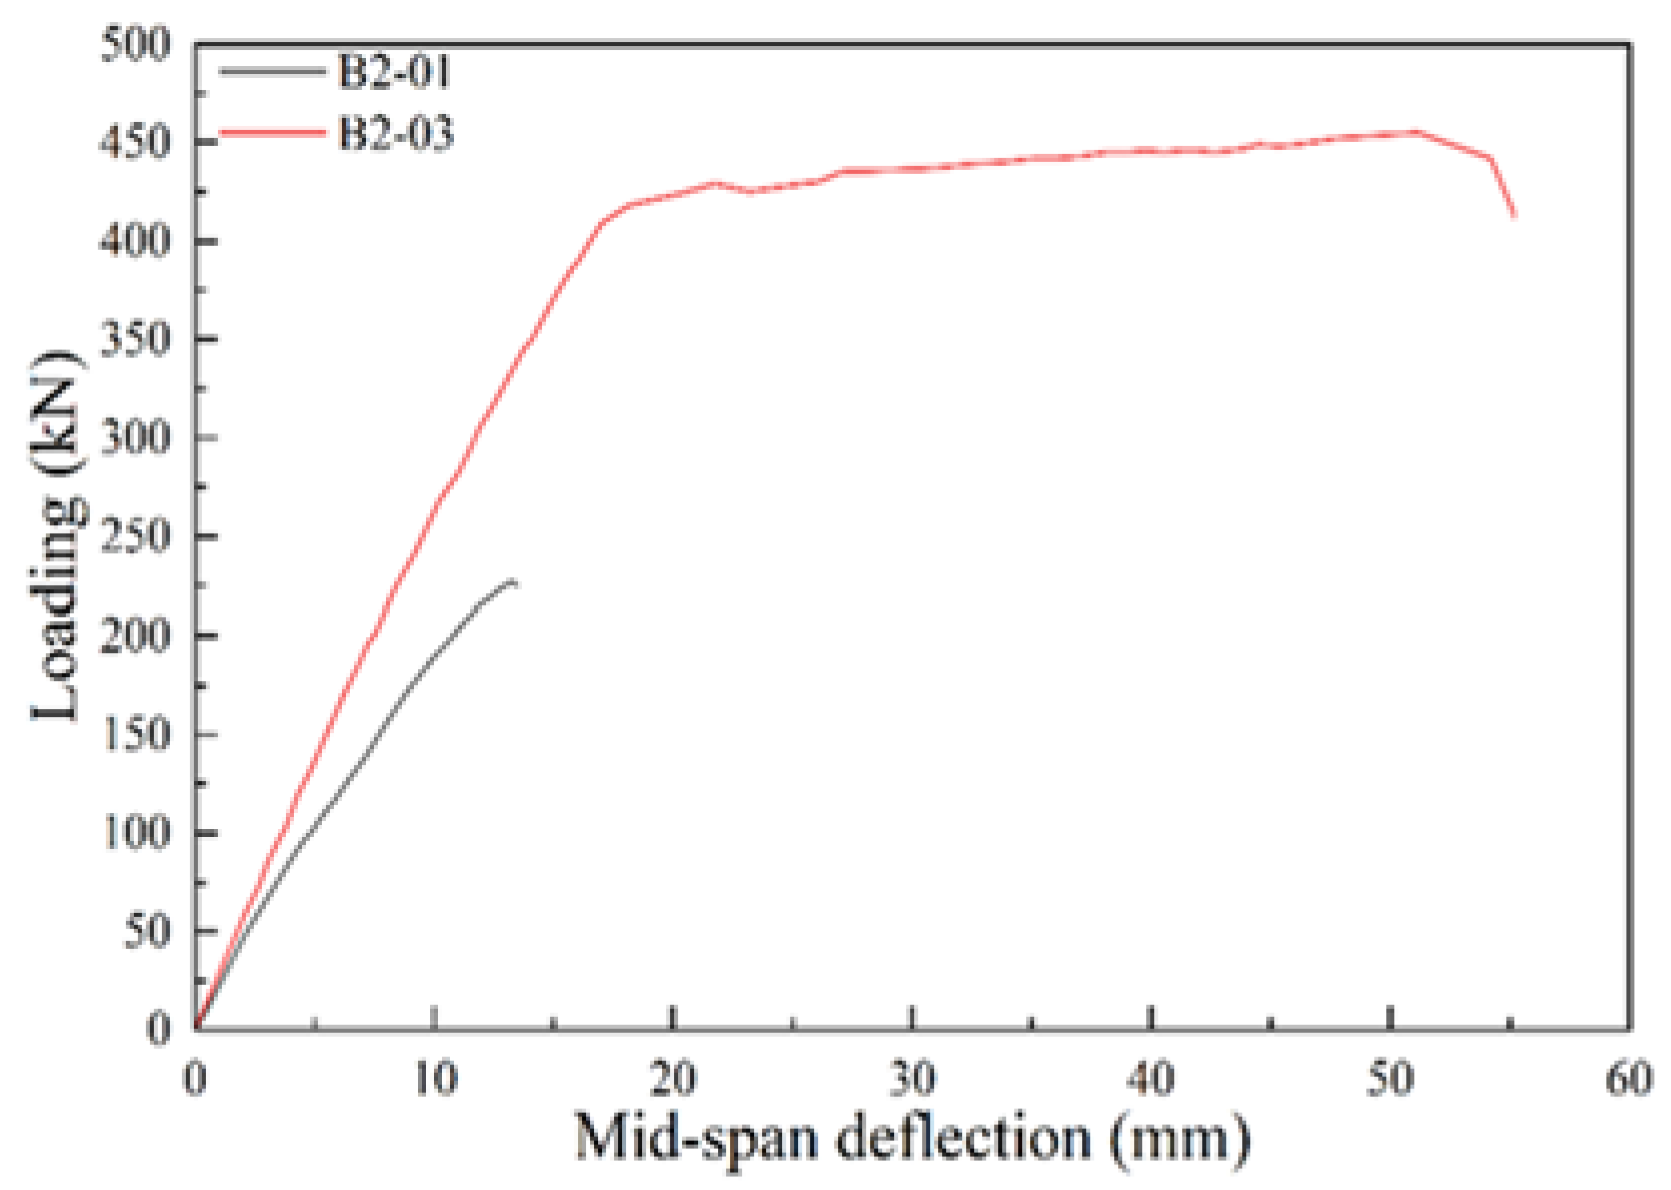
Figure 13, Figure 14, Figure 15, Figure 16 and Figure 17 depict the loading process and crack patterns of beam B2-01. This beam is a T-beam with a mix proportion of 01, which contains no steel fibers. During the initial loading stage at 45 kN, fine cracks first appeared in the tensile zone at the bottom of the beam. As the load increased, the cracks extended upward along the direction of principal tensile stress, forming longitudinal cracks penetrating the entire height of the beam. When the load reached the critical value of 225 kN, diagonal cracks occurred in the shear zone due to shear stress concentration. The crack width continuously increased with the load (Figure 15), eventually leading to the spalling of the concrete cover (Figure 17), which exposed the main rebar, accompanied by concrete crushing. The beam exhibited brittle failure without a distinct yield plateau, with shear failure being prominent, as shown in Figure 16. The crack morphology is illustrated in Figure 13. The ultimate load is 329 kN.
The beam is dominated by shear failure without a significant yield stage, exhibiting a three-stage failure pattern: cracking in the tension zone, propagation of diagonal cracks in the shear zone, and spalling of the protective cover. The significant increase in crack width in the shear zone confirms the criticality of shear-controlled failure. The spalling of the concrete cover exposes the issue of bond failure at the concrete-steel interface, necessitating the optimization of cover thickness and improvement of materials.
Figure 18 displays the load-deflection curve of beam B2-01. During the initial stage (0–12 mm), the load increases linearly with deflection, corresponding to the elastic working state of the beam. At this stage, concrete and rebar loads synergistically, and cracks remain in a stable propagation phase. When deflection exceeds 12 mm, the curve slope drops sharply, indicating that the beam enters a shear failure-dominated inelastic stage. Subsequently, the member fails rapidly as the rebar cover spalls off.

5.3. B2-02(1) T-Beam Test Procedure and Results

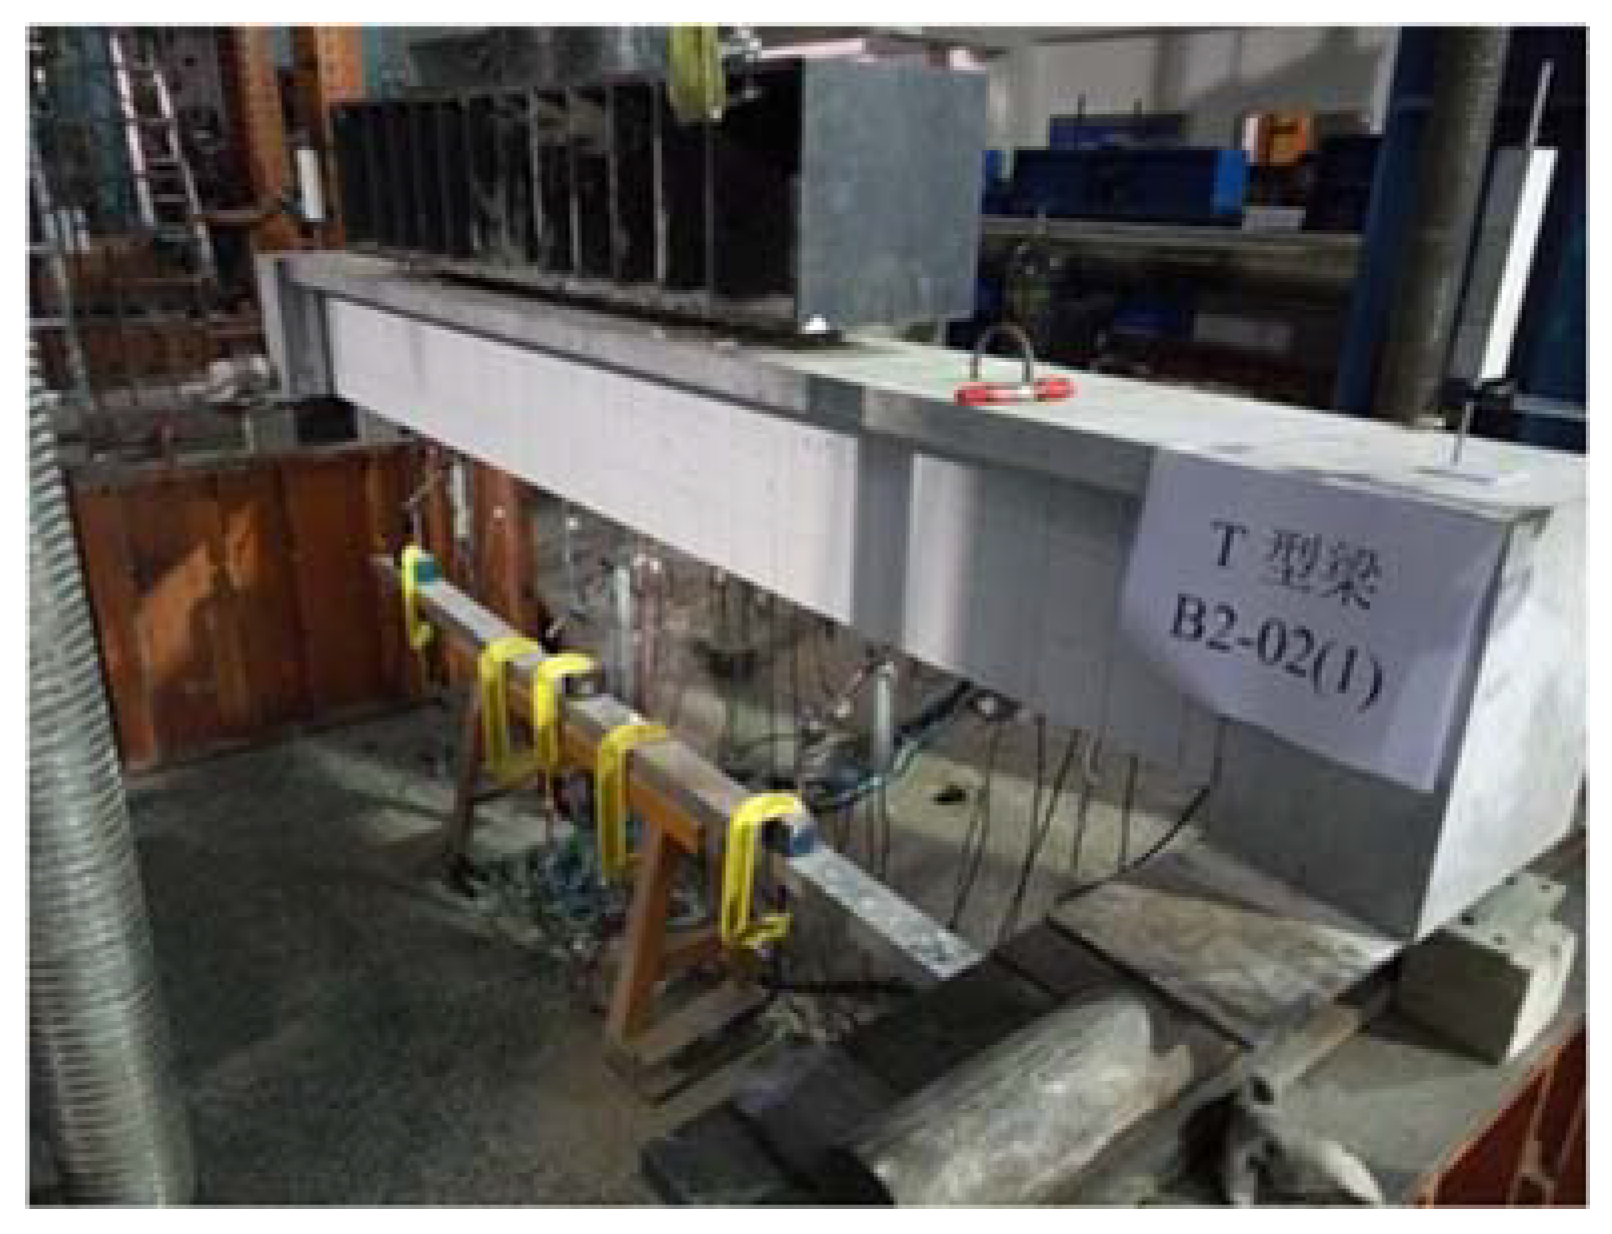
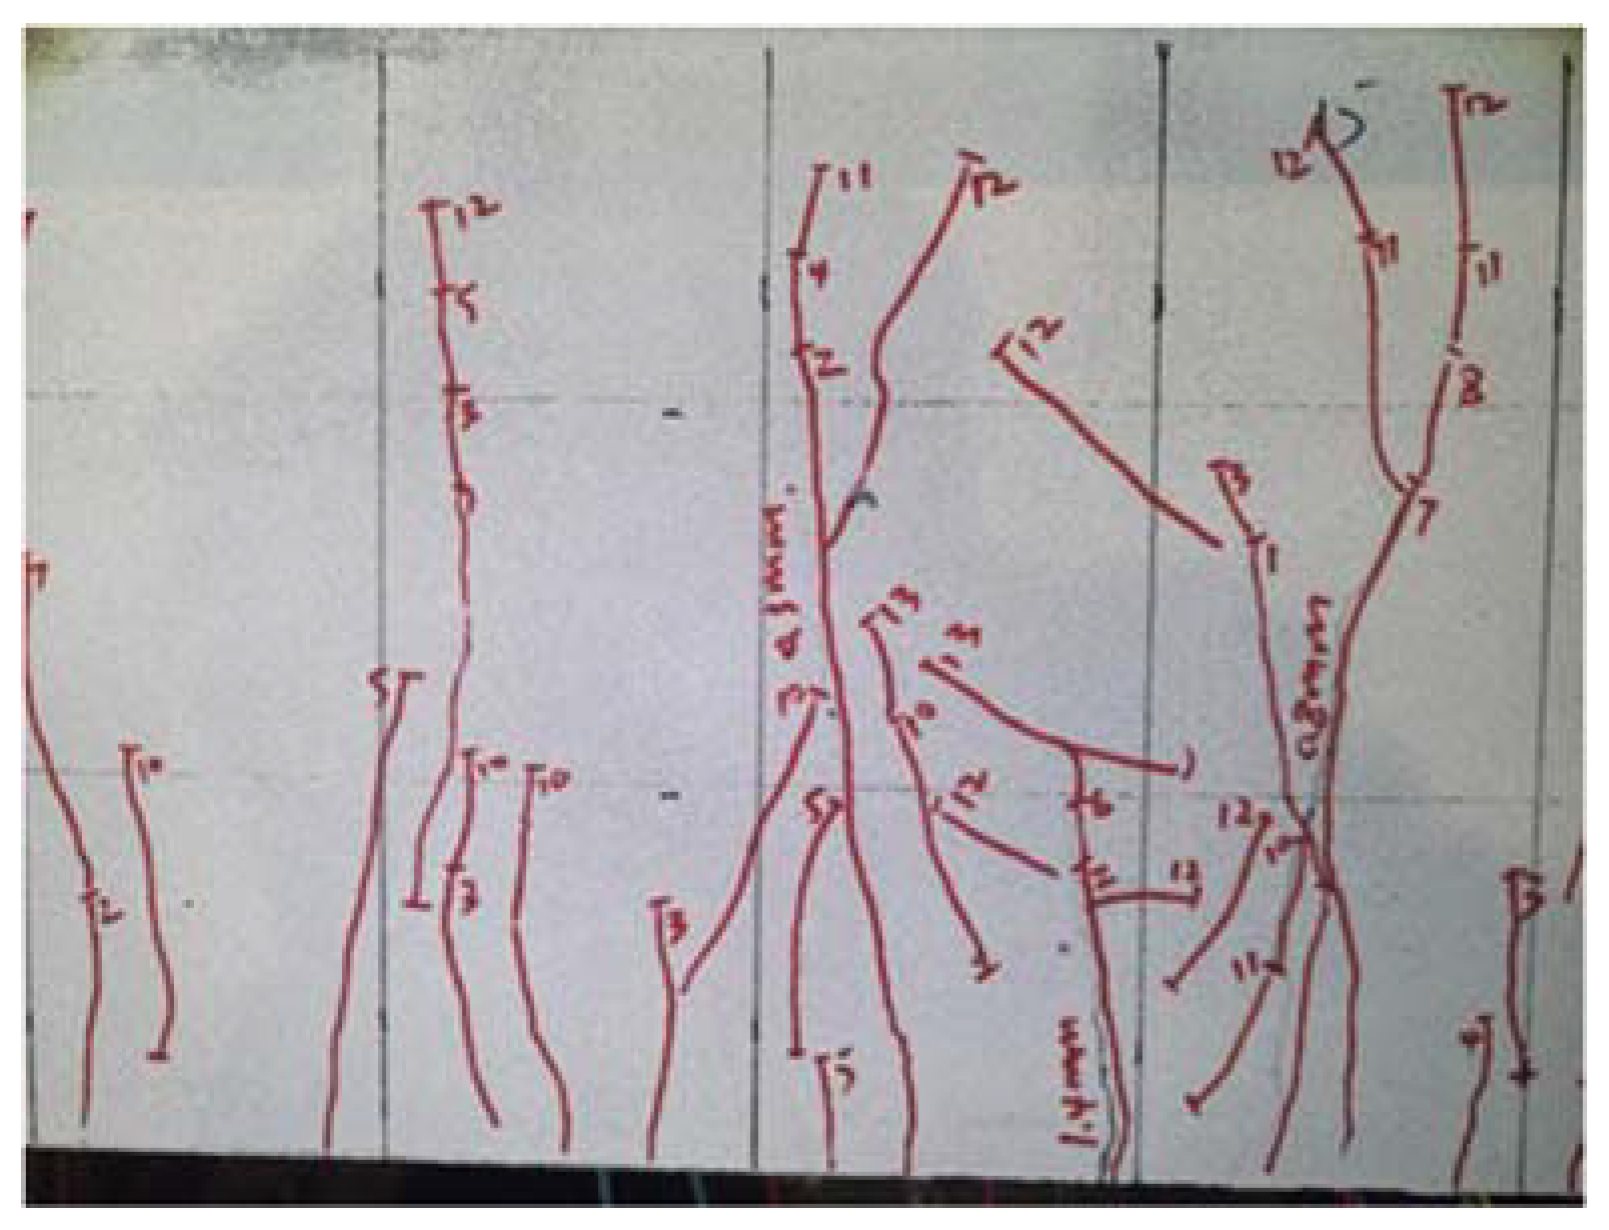
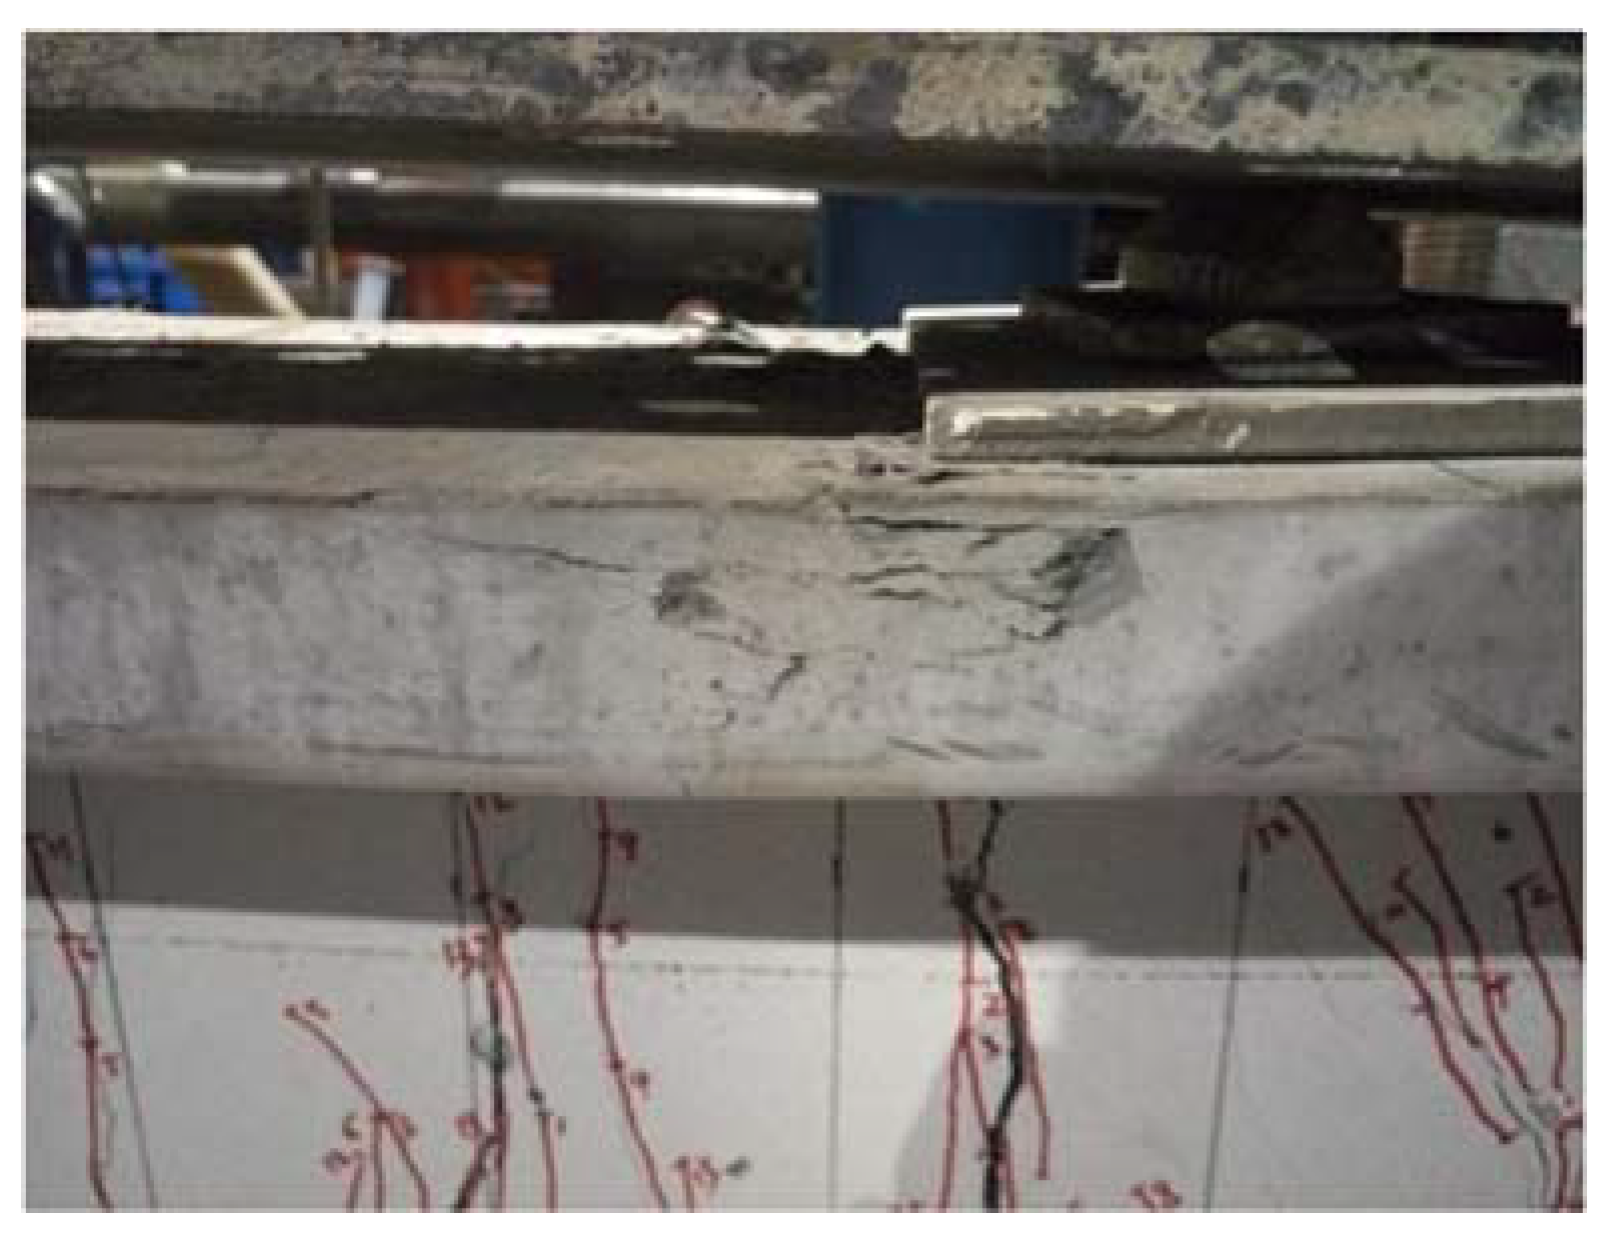
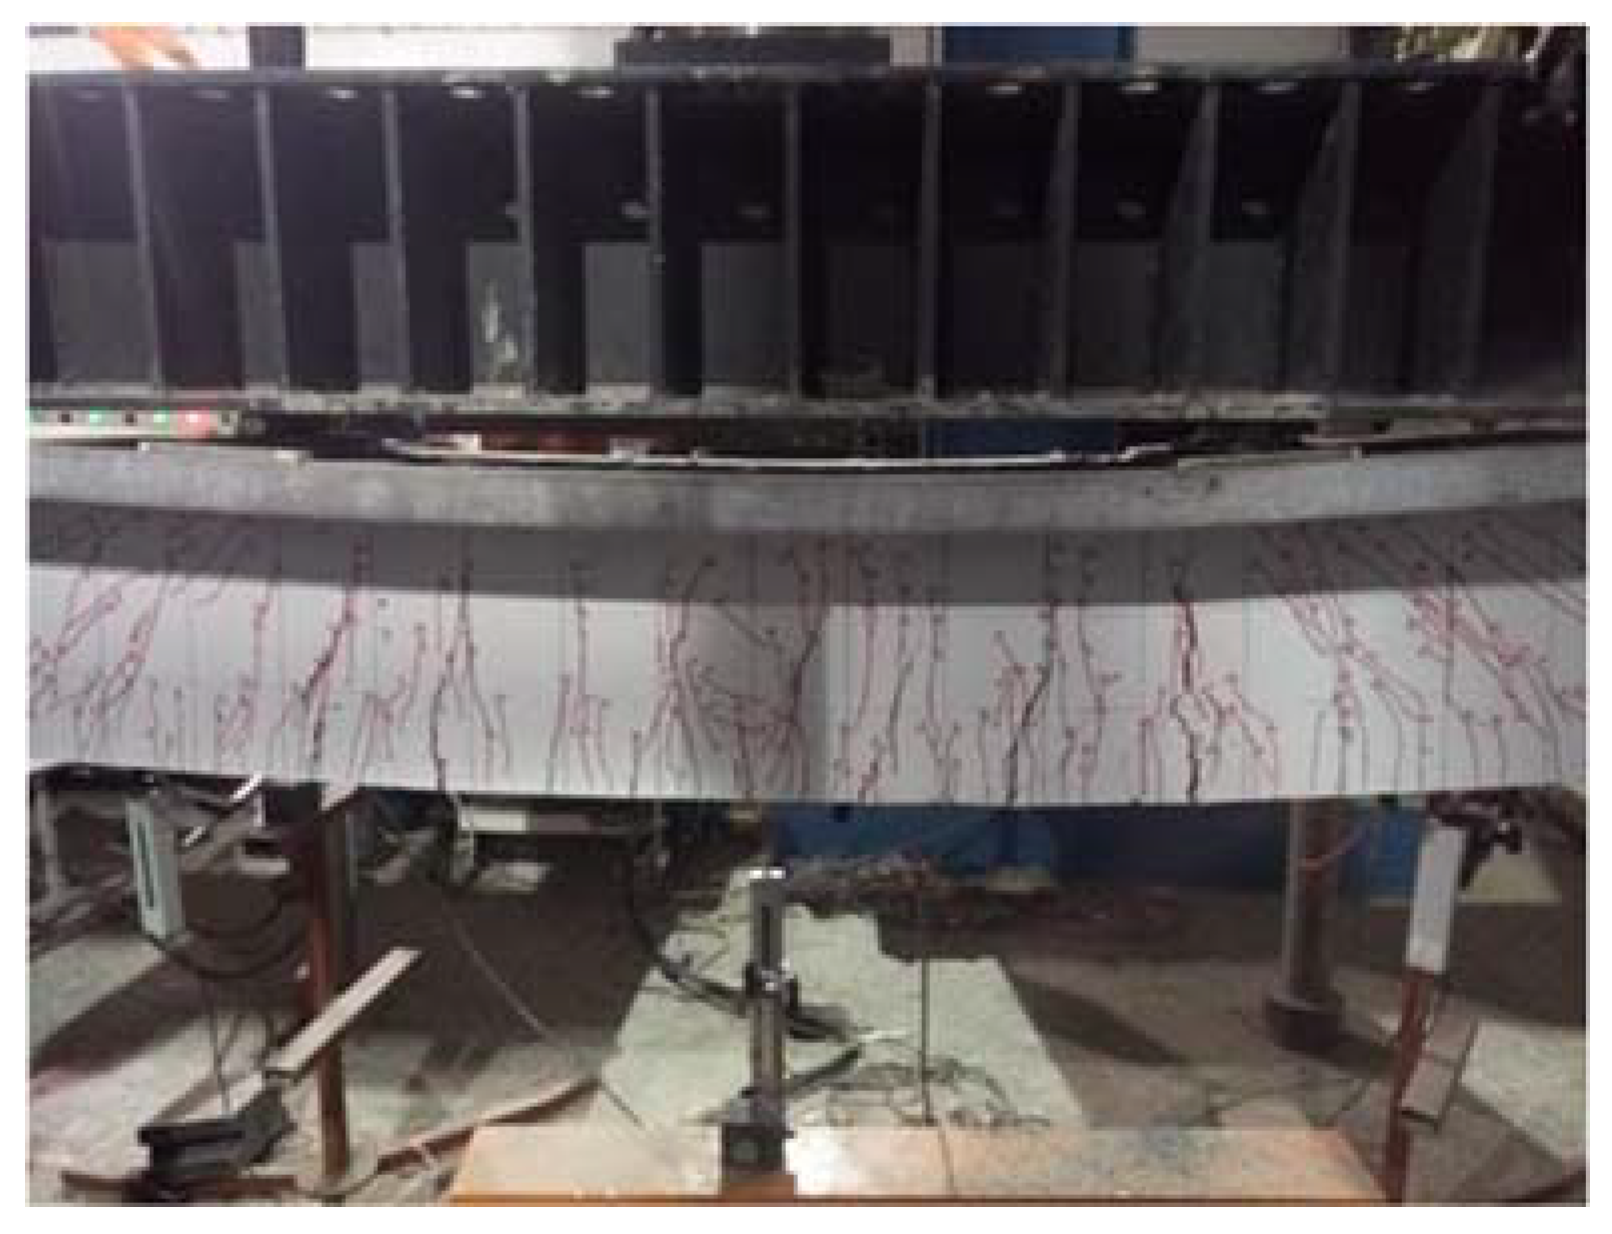
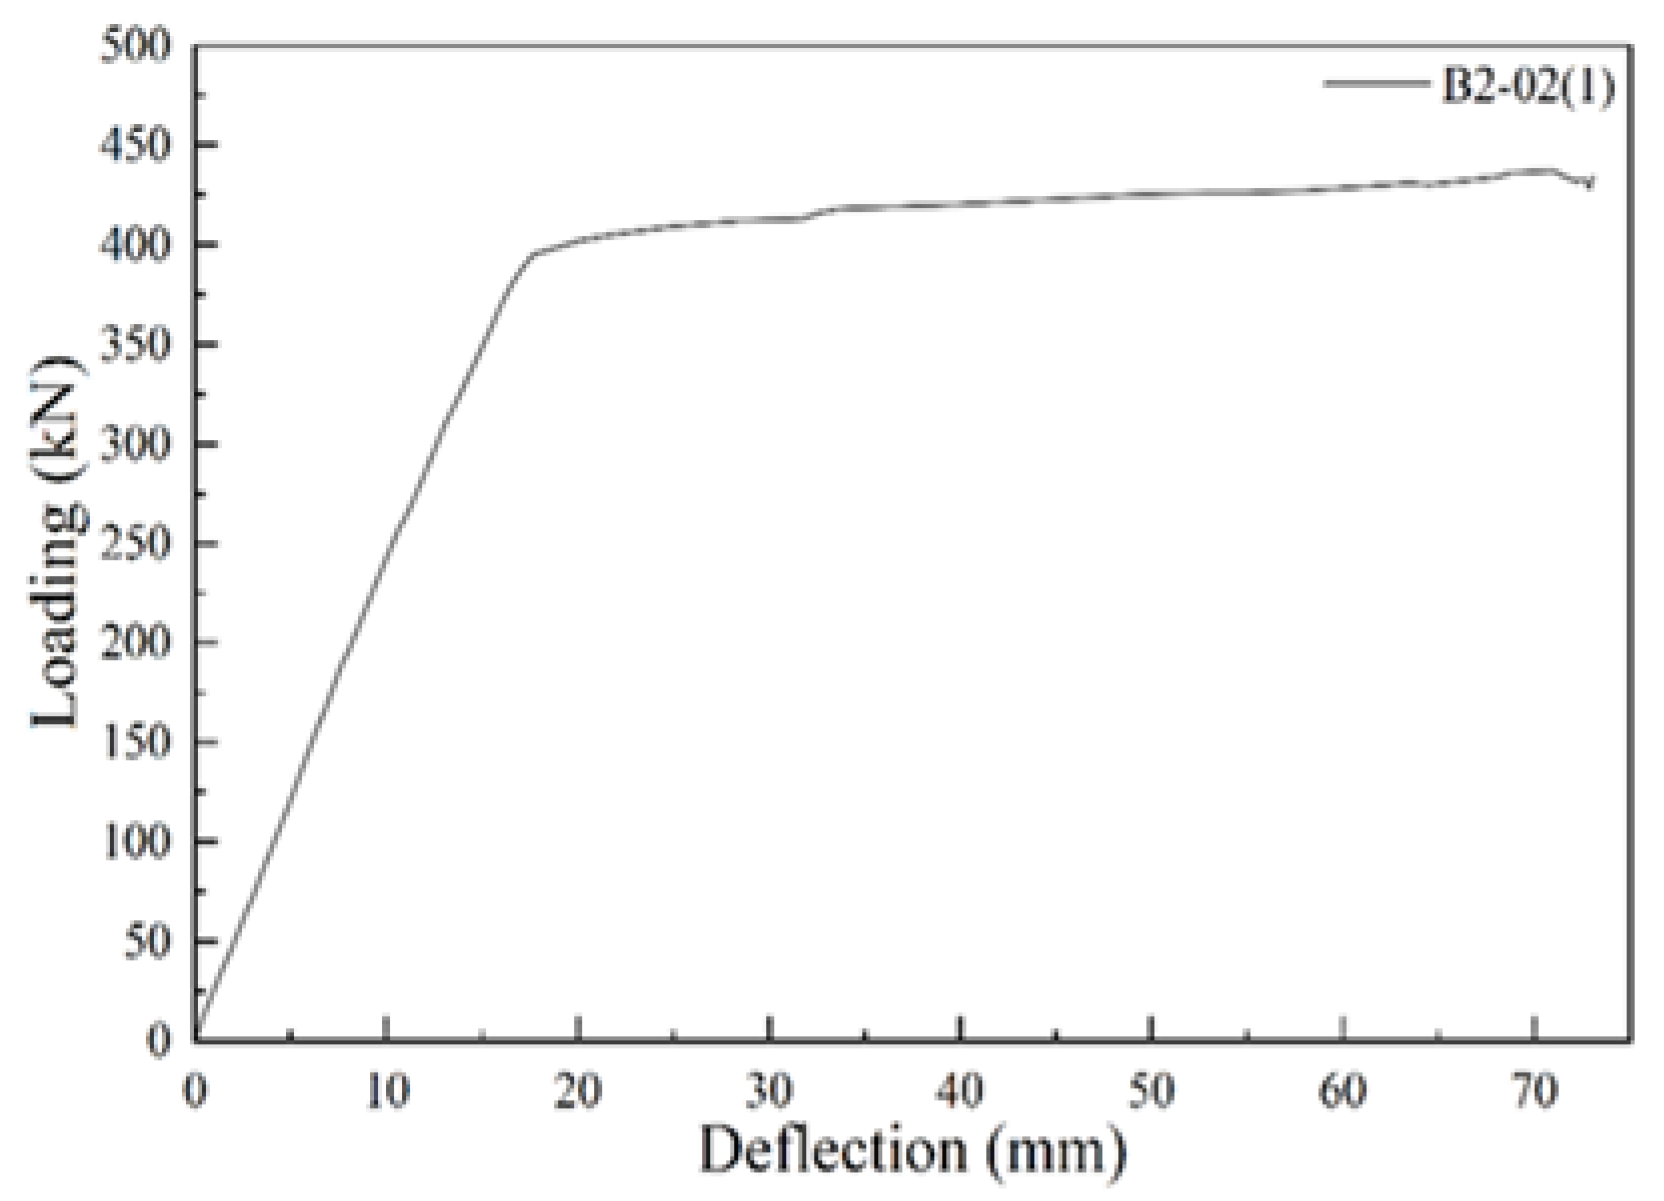
The loading process and crack development of beam B2-02(1) are illustrated in Figure 19, Figure 20, Figure 21, Figure 22 and Figure 23. Beam B2-02(1) is a T-beam with Mix 2. When loaded to 69 kN, fine cracks appeared on the side surface of the beam, indicating it was in the elastic stage. As the load increased, vertical cracks first emerged at the bottom of the mid-span, subsequently extending upward along the principal stress direction toward the compression zone (Figure 21). At a load of 395 kN, the load-deflection curve exhibited a distinct turning point, signifying the beam entered the yield stage with a deflection of 17 mm. Continued loading to a mid-span deflection of 72 mm caused the beam’s load-bearing capacity to decline, reaching its ultimate limit state. The peak ultimate load was 434 kN. At this point, localized crushing occurred in the compression zone concrete due to concentrated compressive stress, ultimately leading to overall failure of the beam caused by compression zone failure (Figure 22).
B2-02(1): The crack pattern of the beam is shown in Figure 19, with the failure mode being typical flexural failure. Cracks initiate from the bottom at mid-span and propagate upwards. Crushing of concrete in the compression zone is the ultimate failure indicator. Crack density exhibits a positive correlation with the applied load. Stress concentration near the loading points results in a dense distribution of cracks. At a peak load of approximately 450 kN, corresponding to a deflection of 20 mm, the load-deflection curve subsequently drops sharply, indicating significant structural stiffness degradation. The failure process was dominated by the synergistic effect of the tensile rebar yielding and the concrete crushing in the compression zone.
The load-deflection curve of beam B2-02(1) is shown in Figure 24. The curve exhibits a three-stage characteristic. Elastic stage: The curve maintains a constant slope, reflecting the initial stiffness of the beam. Plastic development stage: The slope decreases, corresponding to crack propagation and steel bar yielding. Ultimate failure stage: The load drops sharply due to concrete crushing in the compression zone, leading to loss of bearing capacity. The inflection point of the curve corresponds to the yield strength of the steel bars, the peak point represents the ultimate bearing capacity, and the descending segment reflects the residual bearing capacity. This curve quantifies the stiffness degradation law of the beam and validates the typical failure path under flexural failure mode, where tensile steel bar yielding precedes compression zone crushing.

5.4. B2-02(2) T-Beam Test Procedure and Results

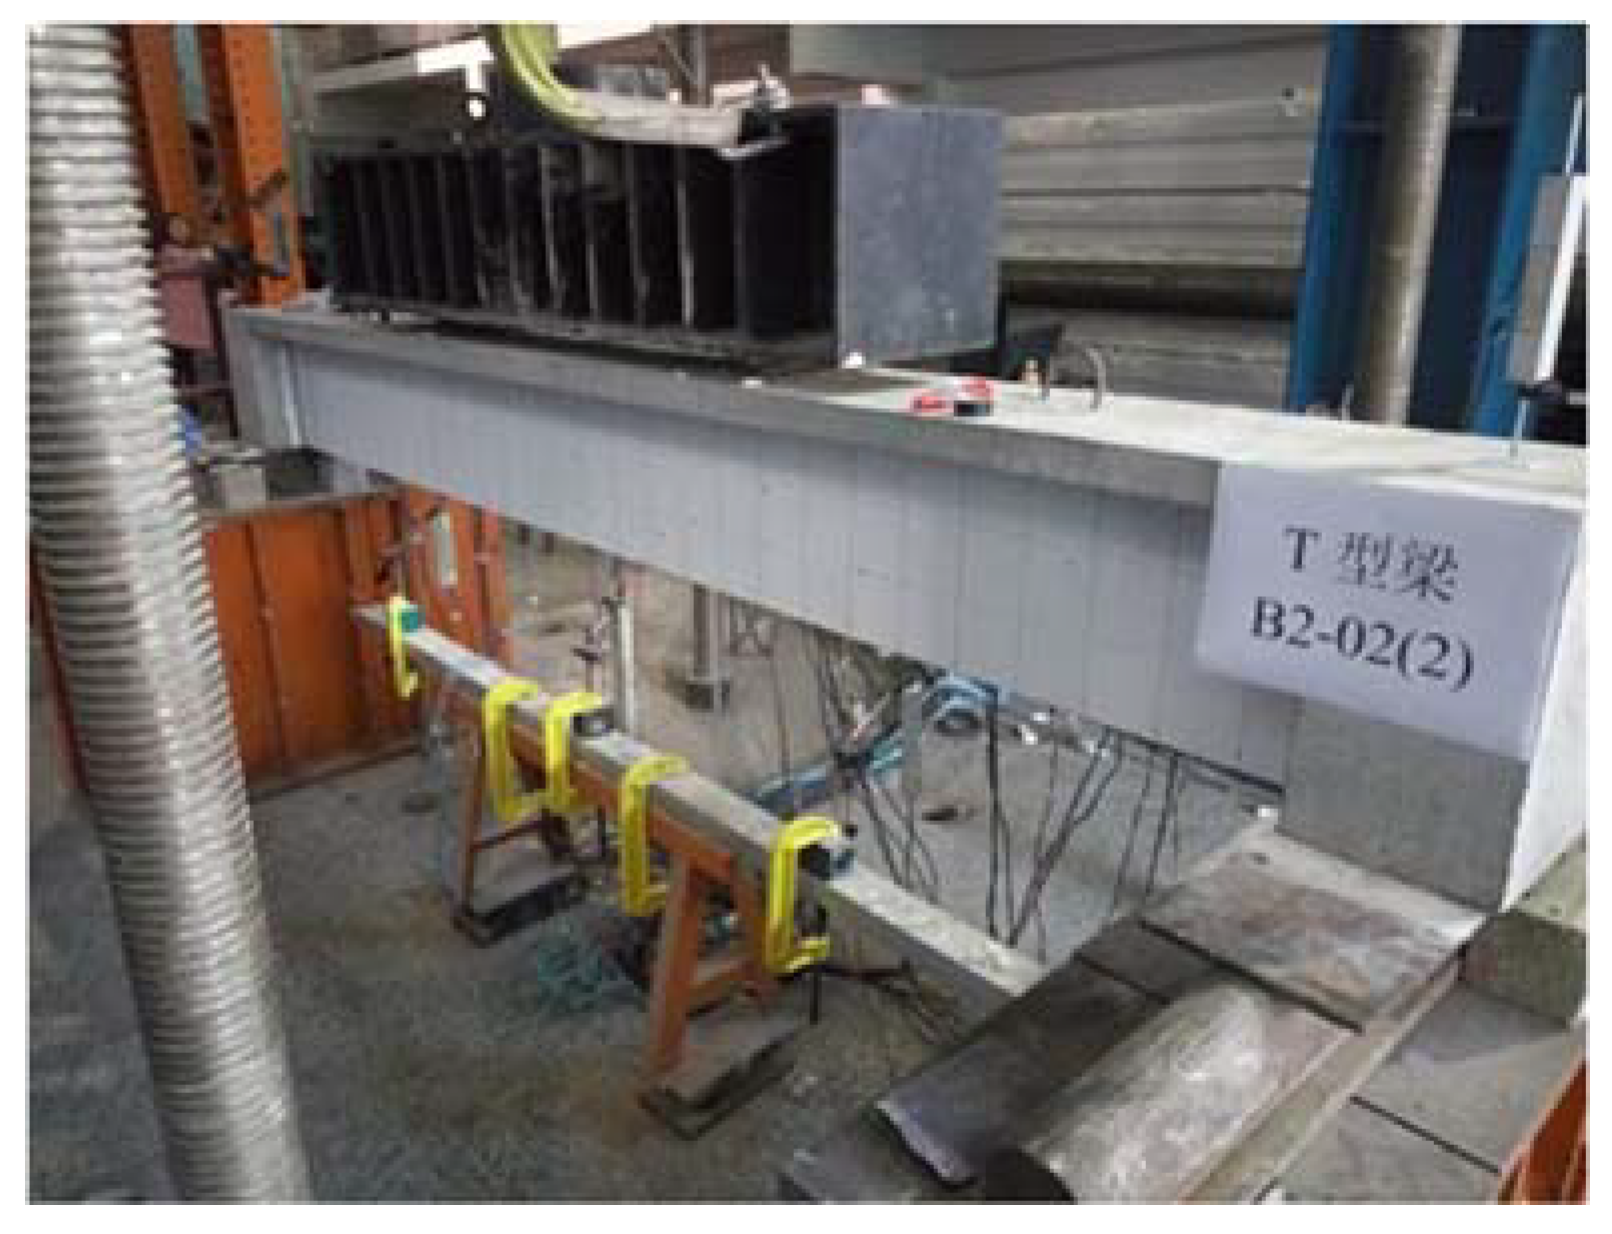
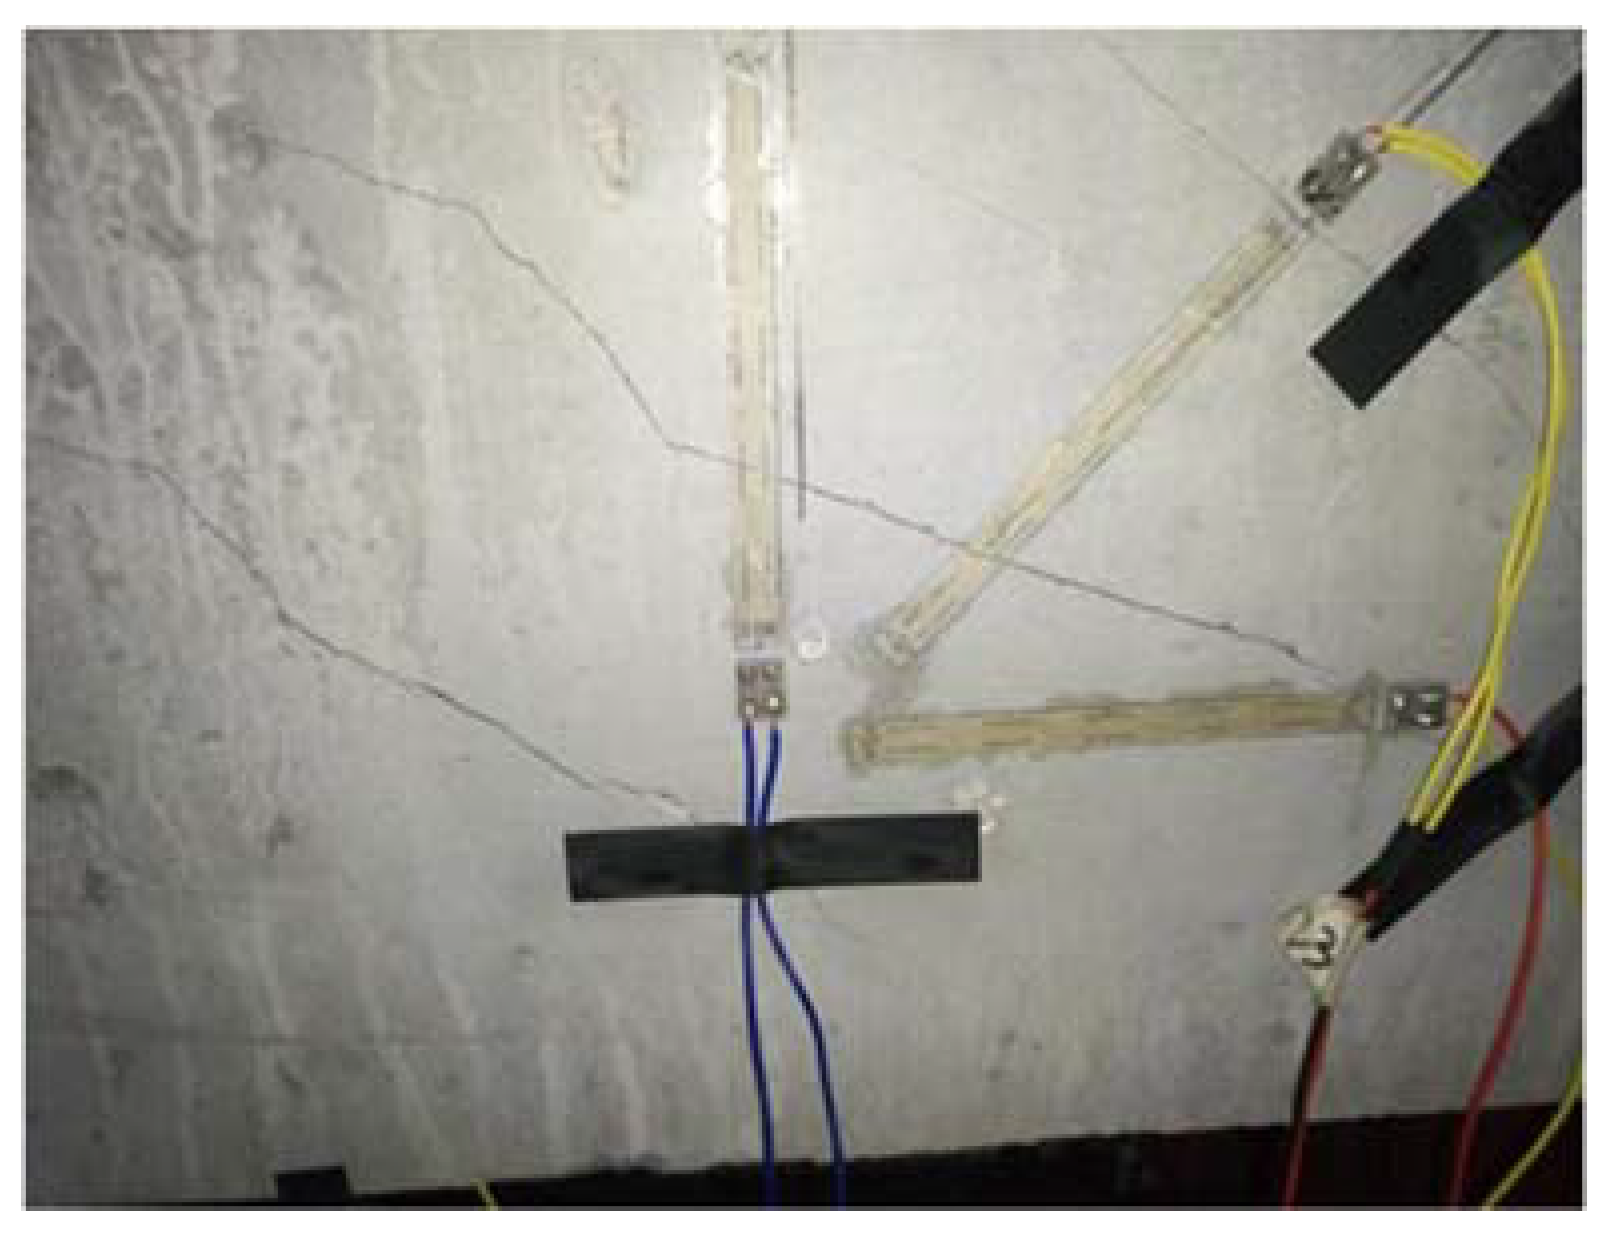
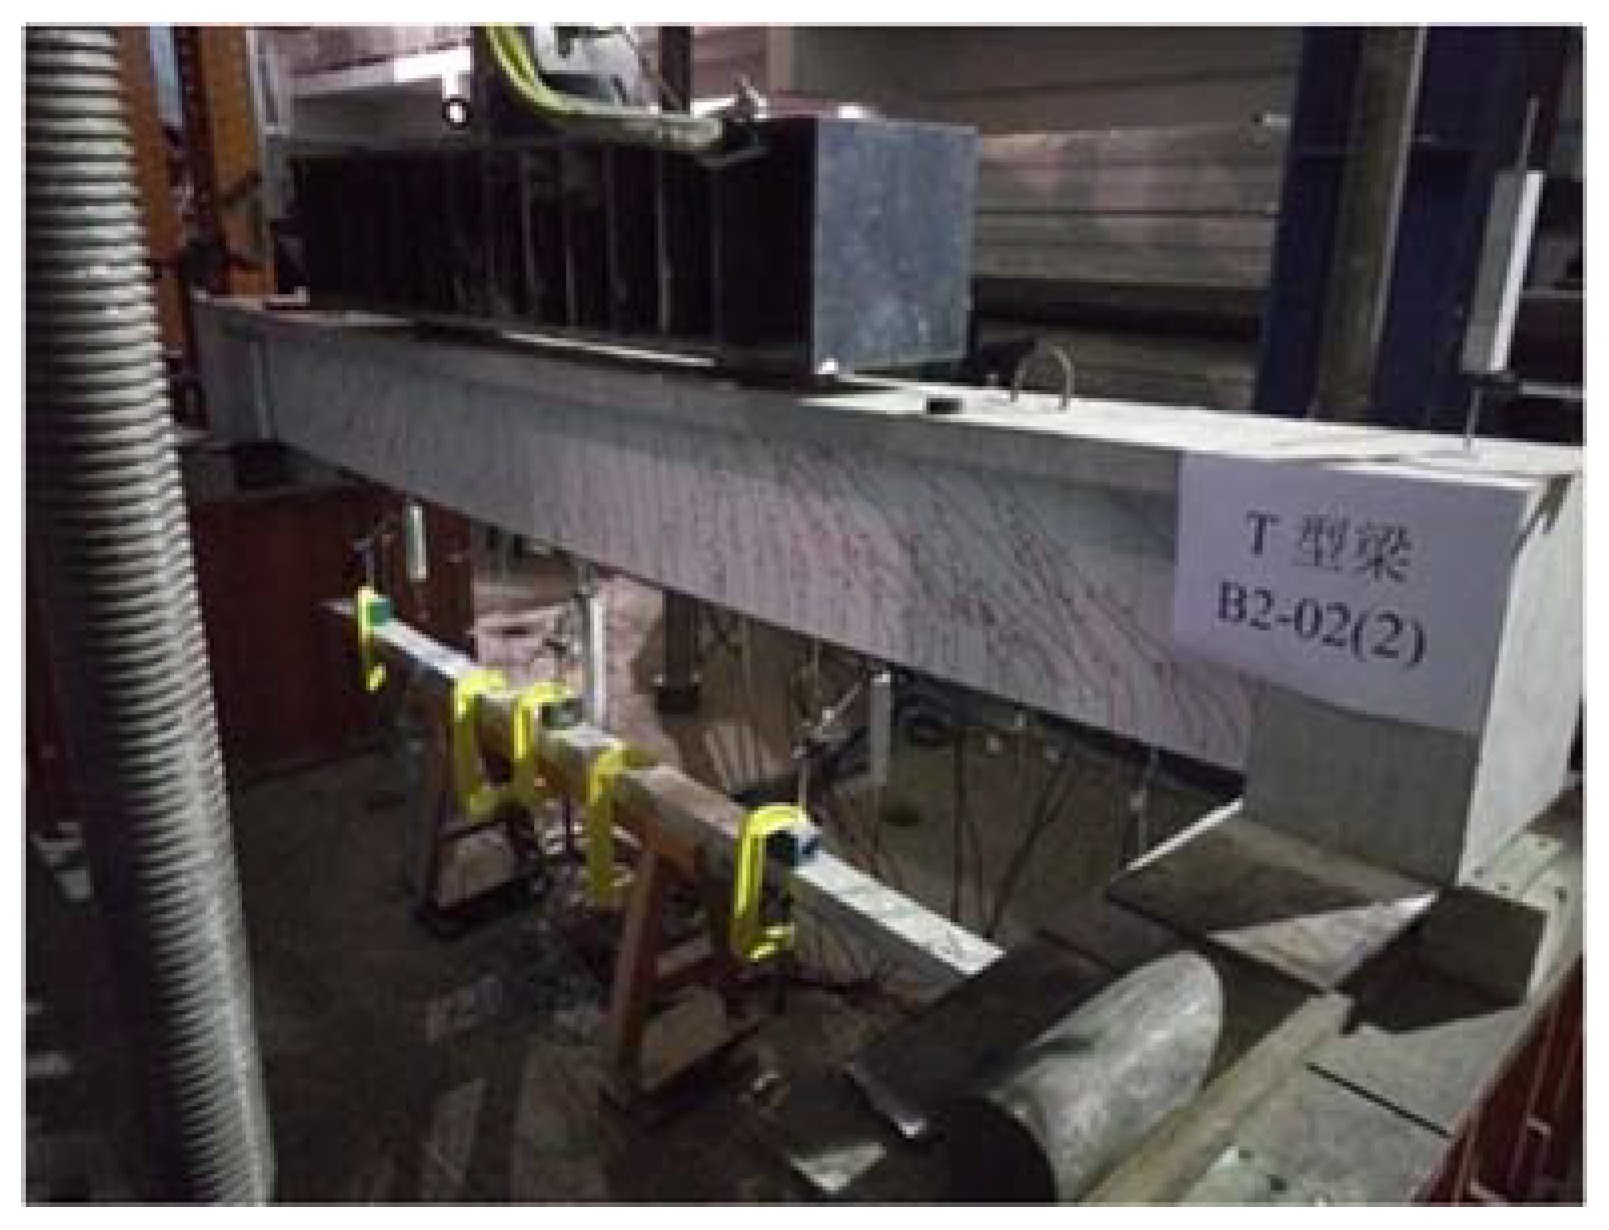
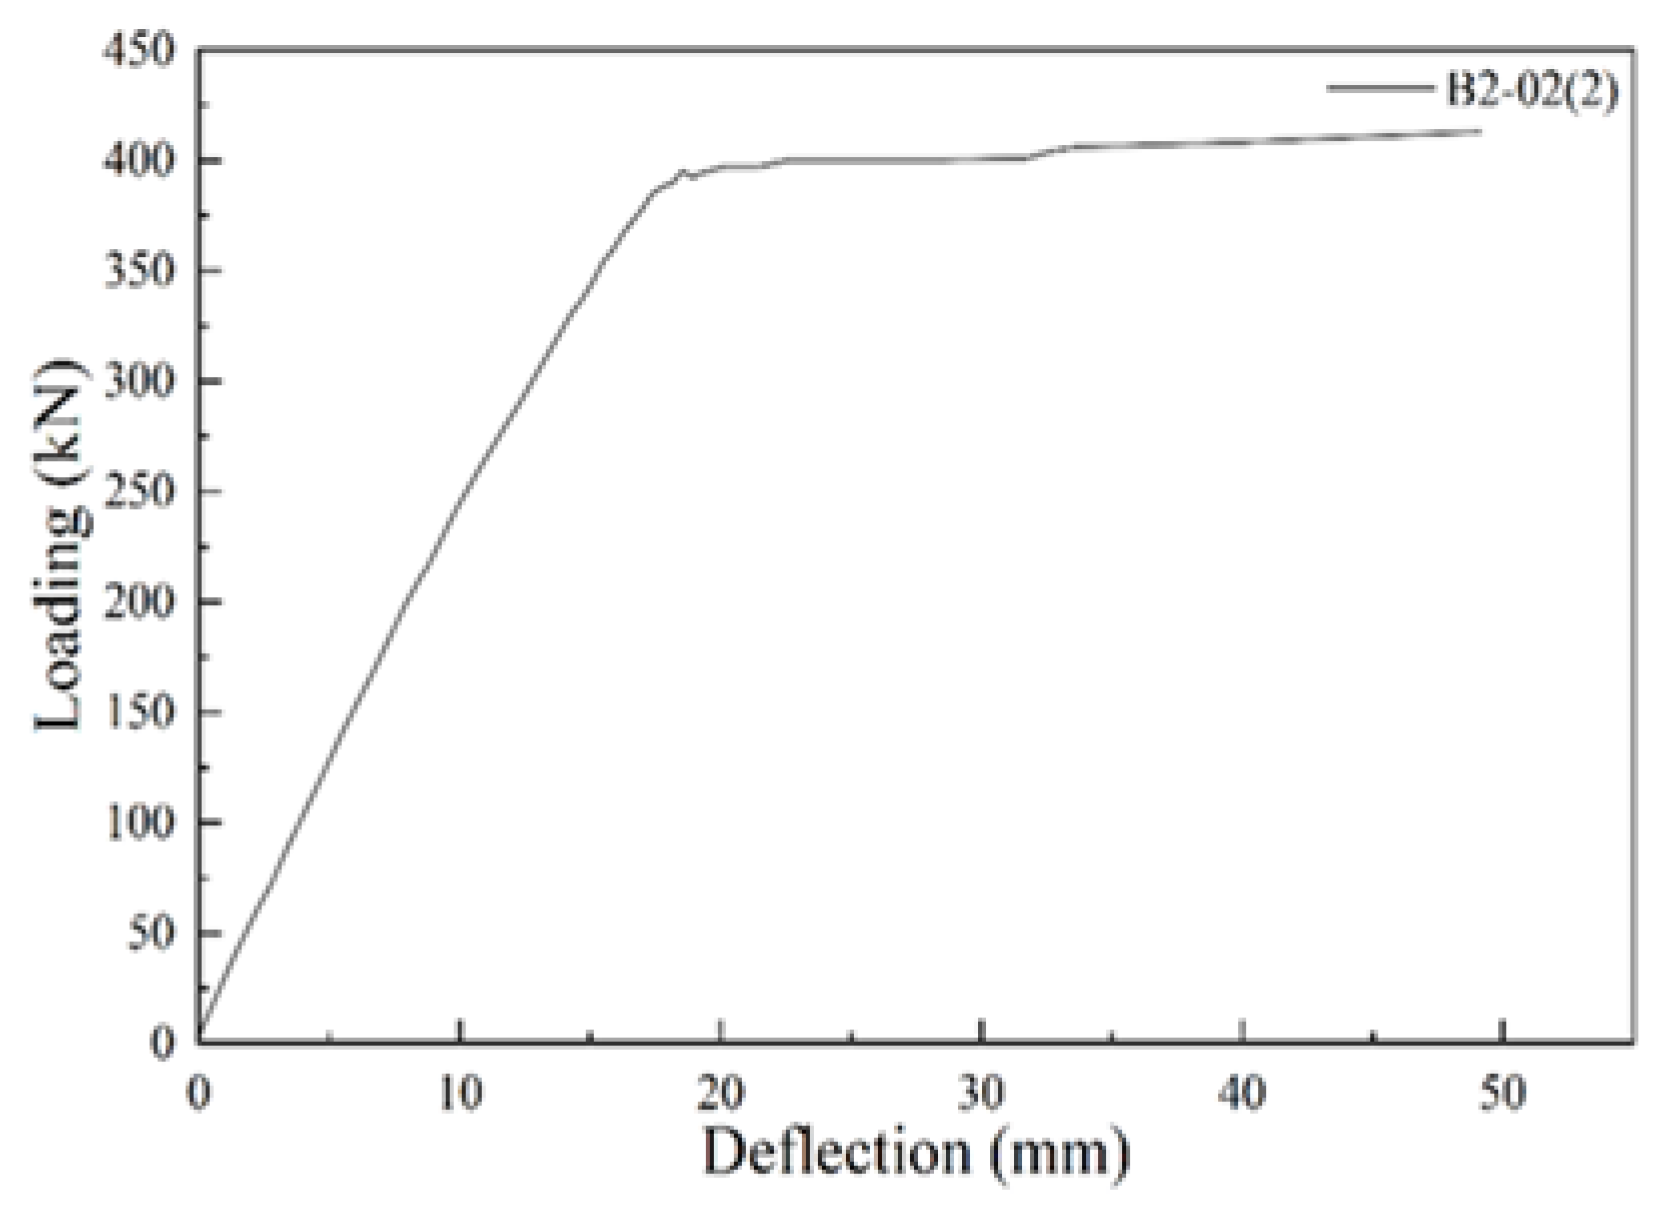
The loading process and crack patterns of beam B2-02(2) are shown in Figure 25, Figure 26, Figure 27, Figure 28 and Figure 29. Beam B2-02(2) served as a parallel test to beam B2-02(1), with its crack morphology presented in Figure 25. During the experiment, this beam underwent three distinct stages: elastic loading, crack initiation and propagation, and ultimate failure. Initially, under loading, the beam remained in the elastic deformation phase. At a load of 72 kN, fine cracks first appeared in the web of the pure flexural section. As the load increased, these cracks extended vertically downward and expanded laterally, forming a network-like distribution. Subsequently, inclined cracks gradually emerged in the shear zone due to stress concentration. When the load reached 389 kN, a distinct turning point occurred on the load-deflection curve, indicating the beam had entered the yield stage. At this point, the deflection reached 18 mm. Ultimately, the primary cracks penetrated through the entire beam body, signifying structural failure. The ultimate load is 434 kN.
B2-02(2) The tensile zone in the pure flexural section of the beam serves as the initial failure initiation site, while the shear zone acts as a secondary weak link. The density and orientation of crack networks are highly correlated with stress distribution. After rebar yields, with increasing deflection, significant cracks appear at the midspan and progressively extend toward the top, as shown in Figure 28.
The load-deflection curve for beam B2-02(2) is presented in Figure 30. The linear elastic stage corresponds to the initiation of micro-cracks. During the plastic development stage (0–18 mm deflection), the load growth slows down, which corresponds to the propagation of macro-cracks. This is followed by the yield stage (18–47 mm deflection). In the failure stage, the load drops sharply, reflecting the fracture of the concrete. The inflection point on the curve corresponds to the peak nominal flexural capacity (approximately 420 kN). The plateau section extends for 29 mm, indicating that the beam exhibits limited ductility.

5.5. B2-03 T-Beam Test Procedure and Results

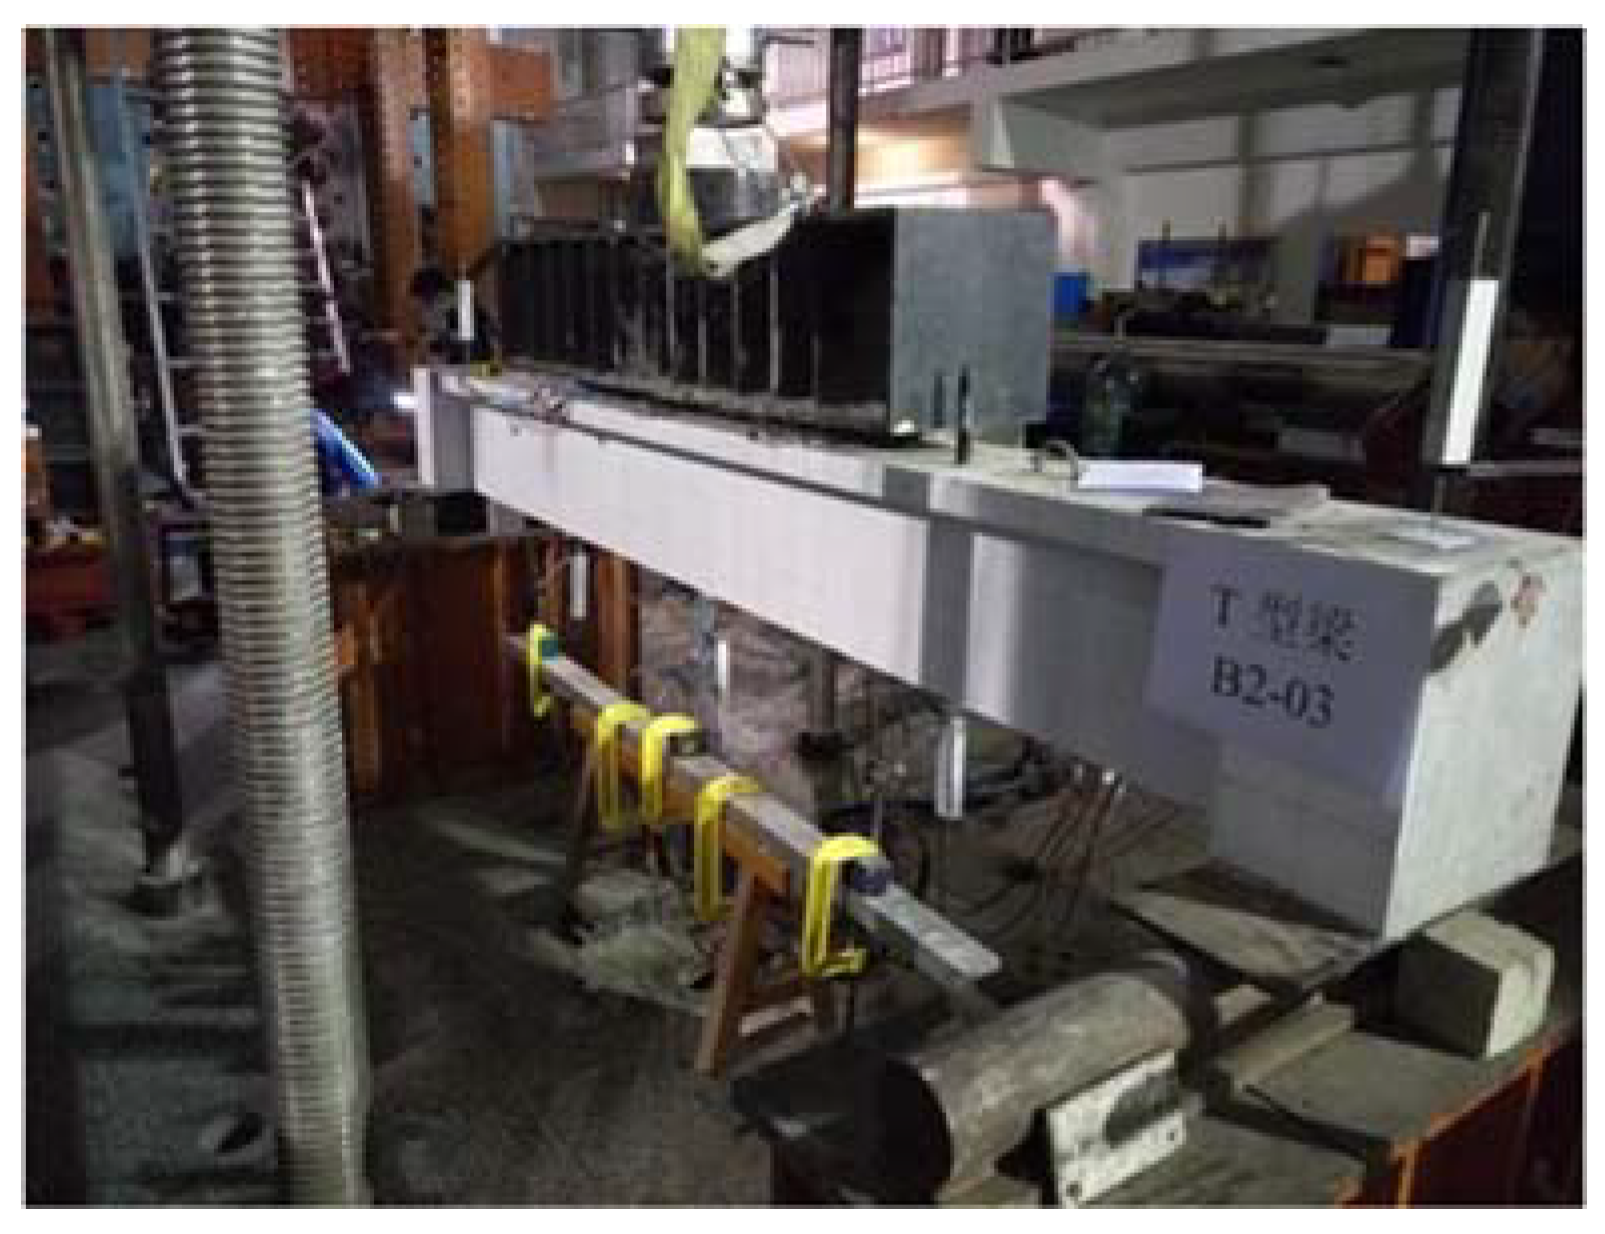
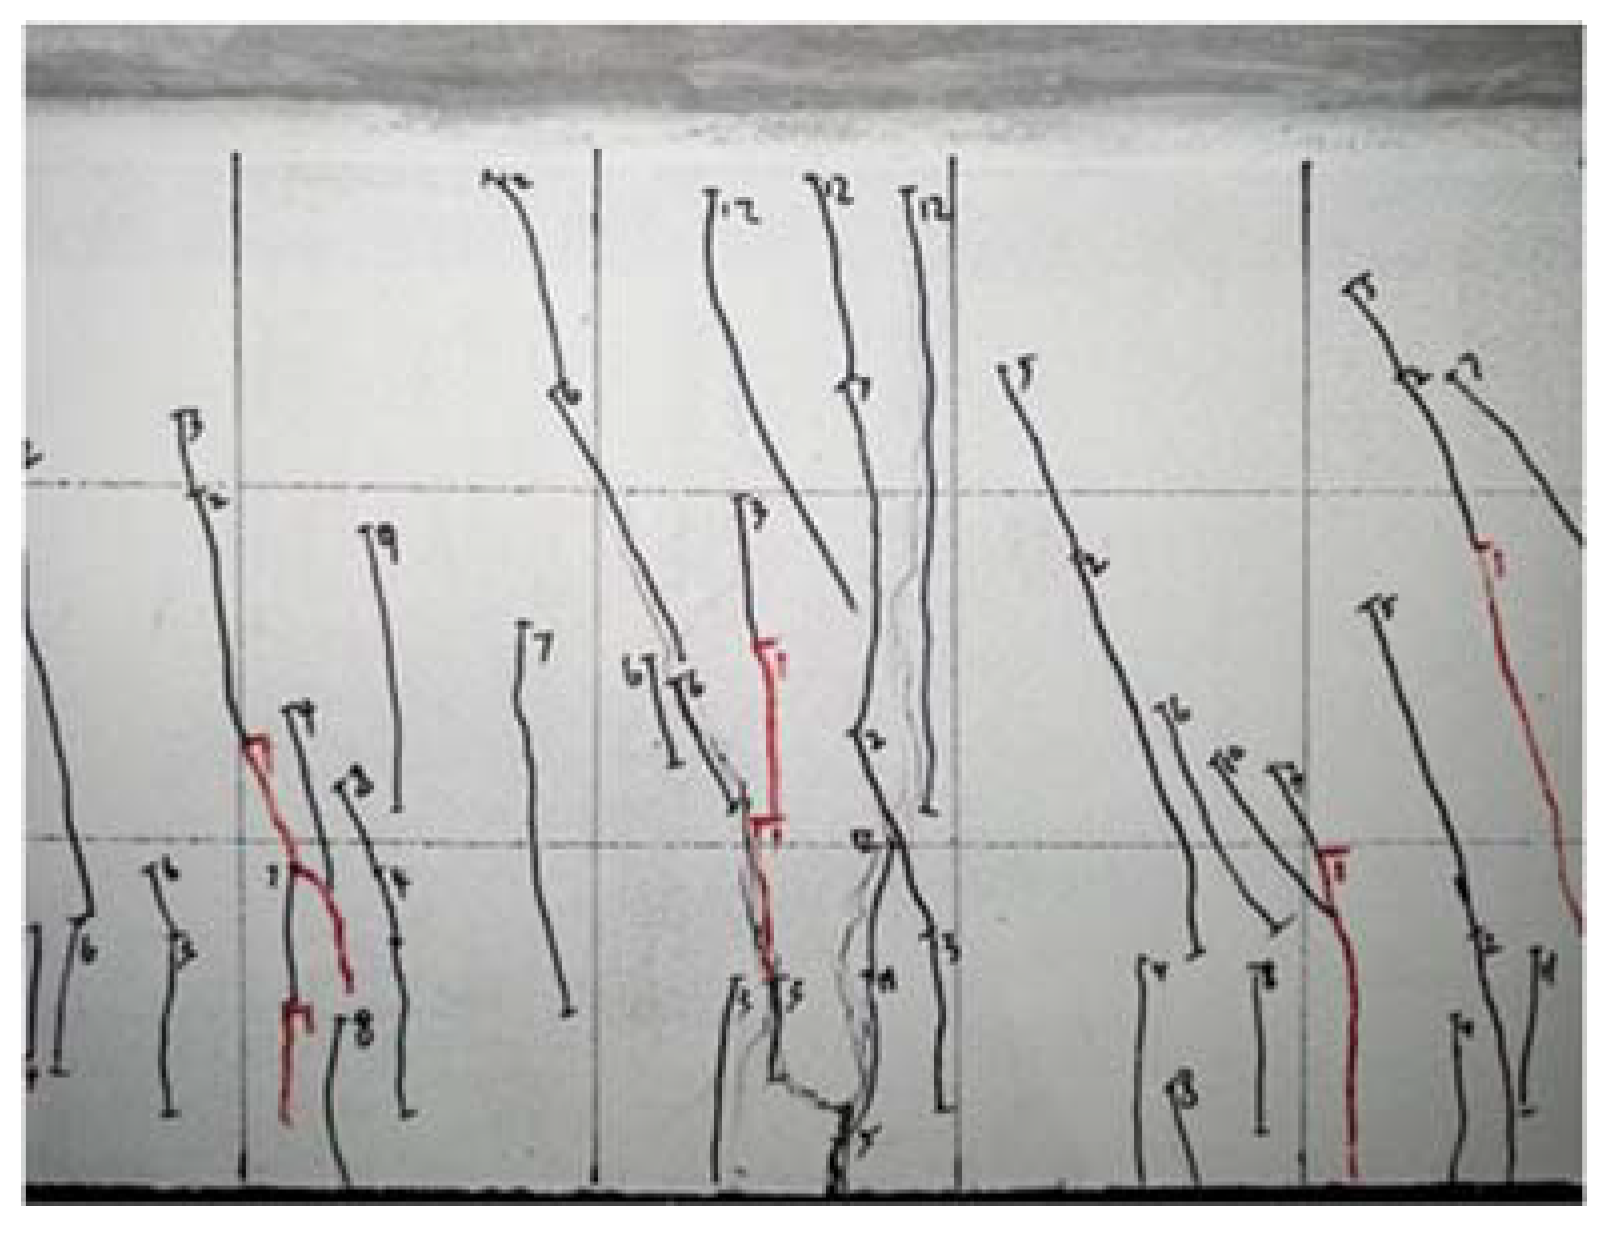
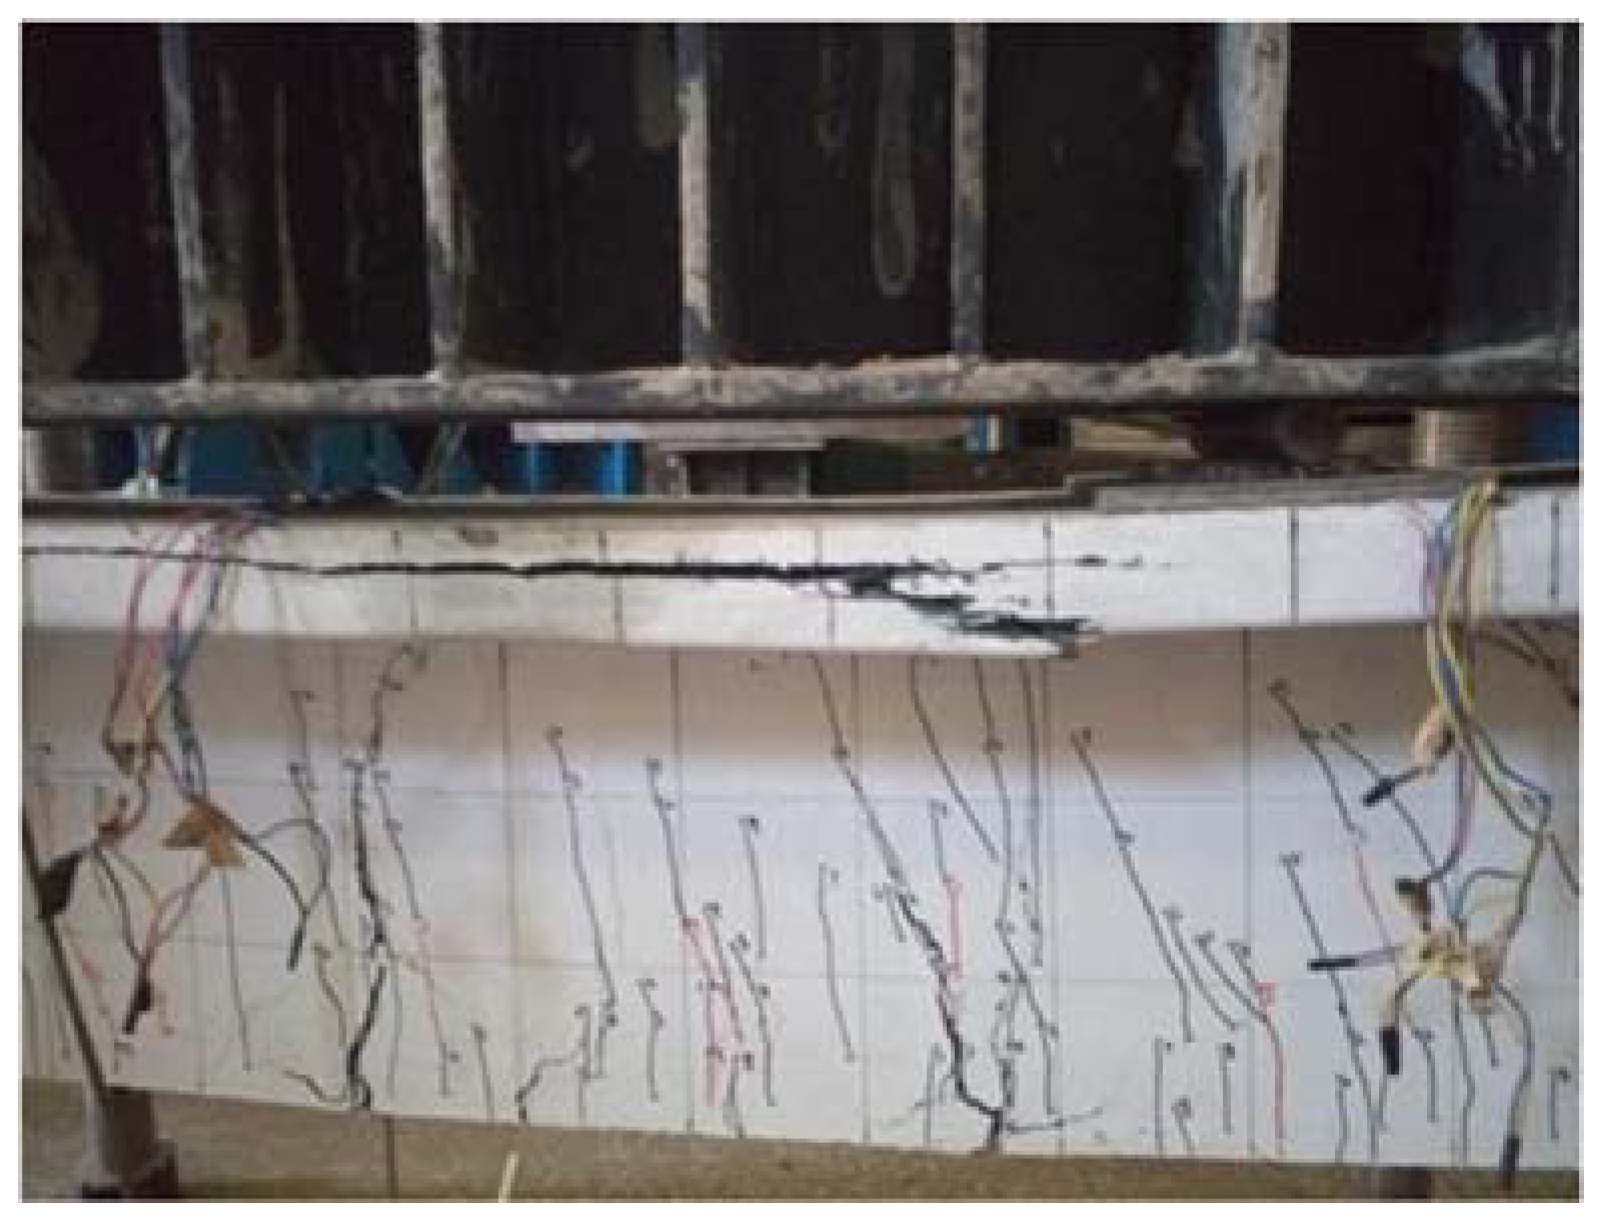
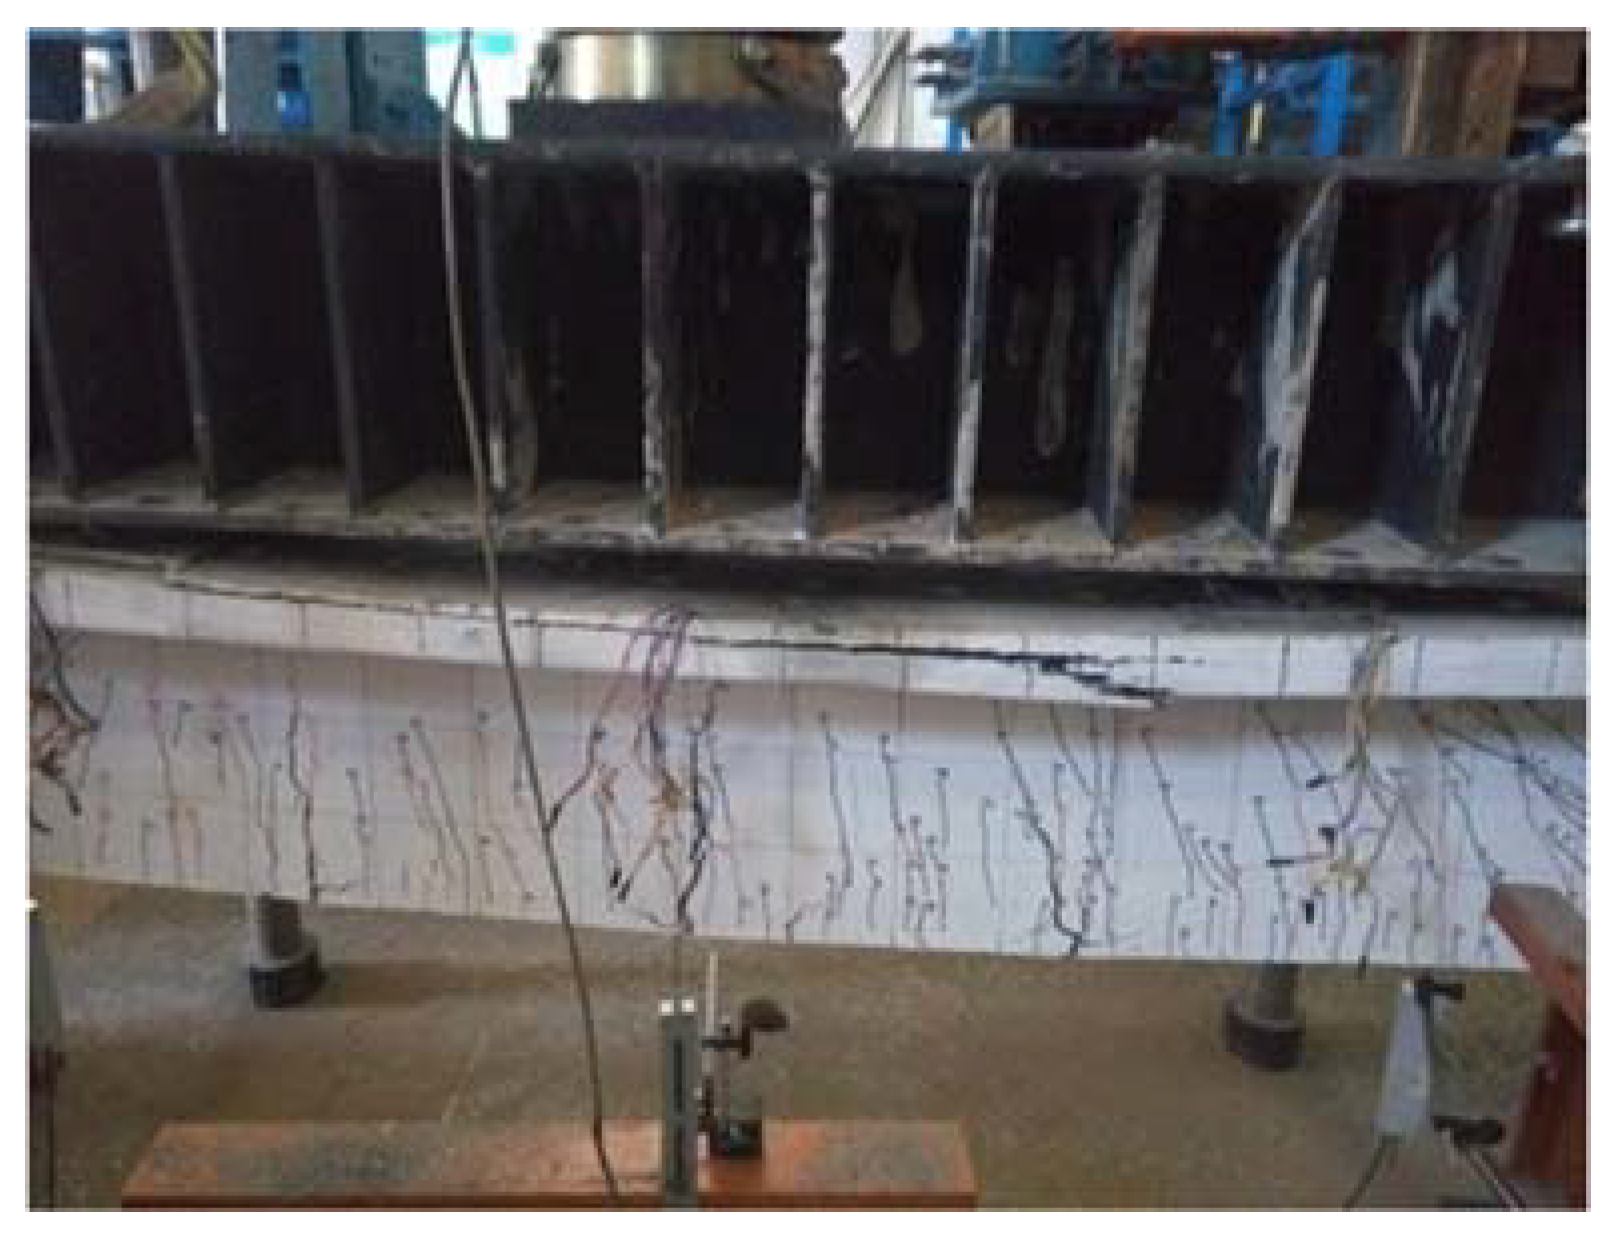
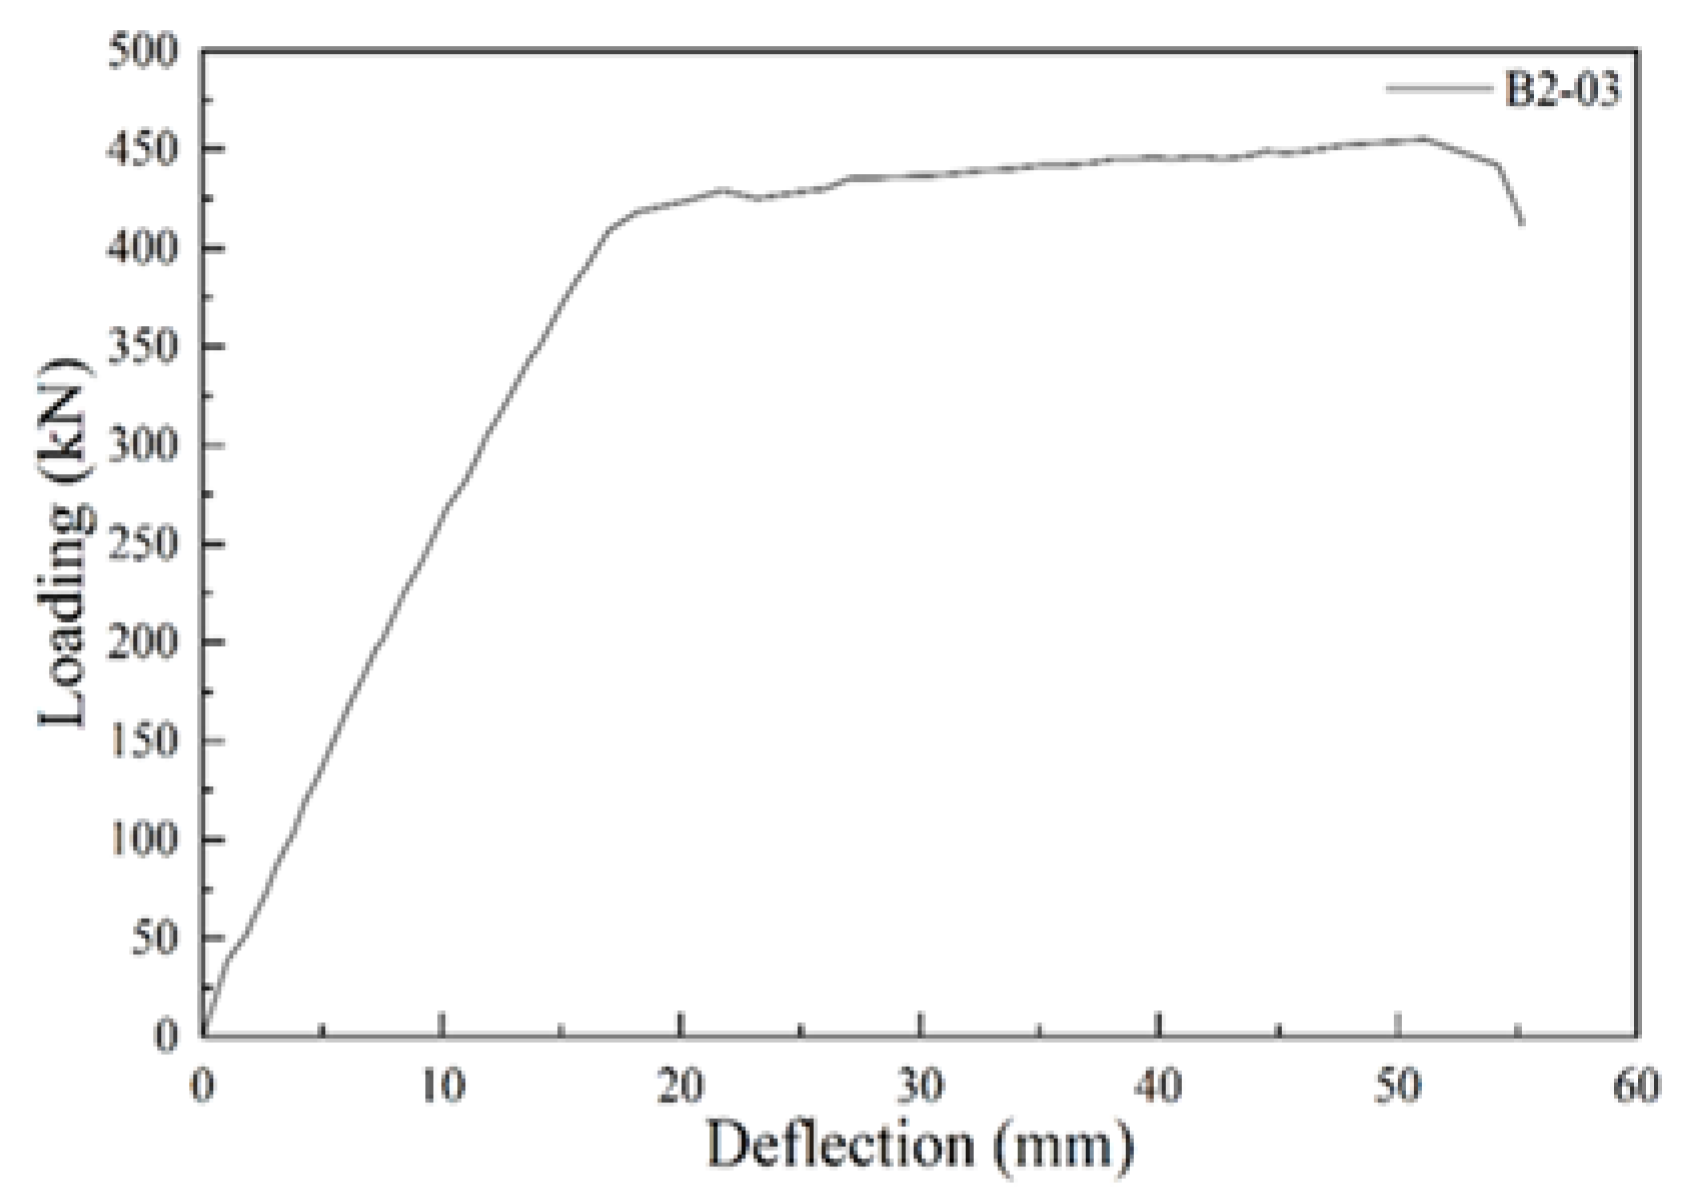
The loading process and crack conditions of beam B2-03 are shown in Figure 31, Figure 32, Figure 33, Figure 34 and Figure 35. Beam B2-03 is a T-beam with a mix proportion of 0:3. When loaded to 70 kN, fine cracks first appeared in the tension zone at the bottom of the beam (bottom of mid-span). As the load increased, the cracks began to extend to both sides and the compression zone along the principal stress direction, forming a network of cracks, and the crack width also gradually increased. When loaded to 418 kN, the load-deflection curve showed a significant turning point, the beam entered the yield stage, and the deflection reached 18 mm. When loaded to 455 kN, the ultimate bearing capacity was reached. The concrete in the compression zone experienced local crushing due to compressive stress concentration, cracks penetrated through the beam body, concrete in the compression zone spalled off, the beam lost its bearing capacity, and the mid-span deflection reached 55 mm. The entire process demonstrated the progressive failure characteristics from local cracking to overall instability.
The failure mode of beam B2-03 is predominantly characterized by flexurally induced tensile failure. The tensile zone exhibits high crack density and large crack widths, while the compressive zone is marked by crushing failure. Cracks initiate at the midspan, bottom of the beam. As the load increases, cracks begin to appear in the shear span, and midspan cracks propagate toward the top of the beam. With further loading, crack widths in the shear zone enlarge. Crack propagation in the shear zone ceases when the width reaches approximately 0.1 mm. After rebar yielding, significant cracks develop at the midspan with increasing deflection, as shown in Figure 33. The maximum crack width at the midspan bottom exhibits nonlinear growth with increasing load. The crushing area in the compressive zone is concentrated within approximately one-third of the span range on the inner side of the loading point, as illustrated in Figure 34. The midspan deflection reaches about 3–5 times that of the initial elastic stage, indicating that plastic deformation of concrete dominates.
The load-deflection curve of beam B2-03 is shown in Figure 36. The curve exhibits typical brittle material flexural failure characteristics: In the initial stage, the load and deflection show an approximately linear relationship, reflecting elastic deformation; during the yield plateau, the curve slope decreases significantly, corresponding to stable crack propagation; in the strengthening stage, concrete in the compression zone gradually crushes, with the load experiencing a slight recovery followed by rapid decline, ultimately reaching a deflection 8 to 10 times the value corresponding to the failure load.

5.6. B3-02 T-Beam Test Procedure and Results

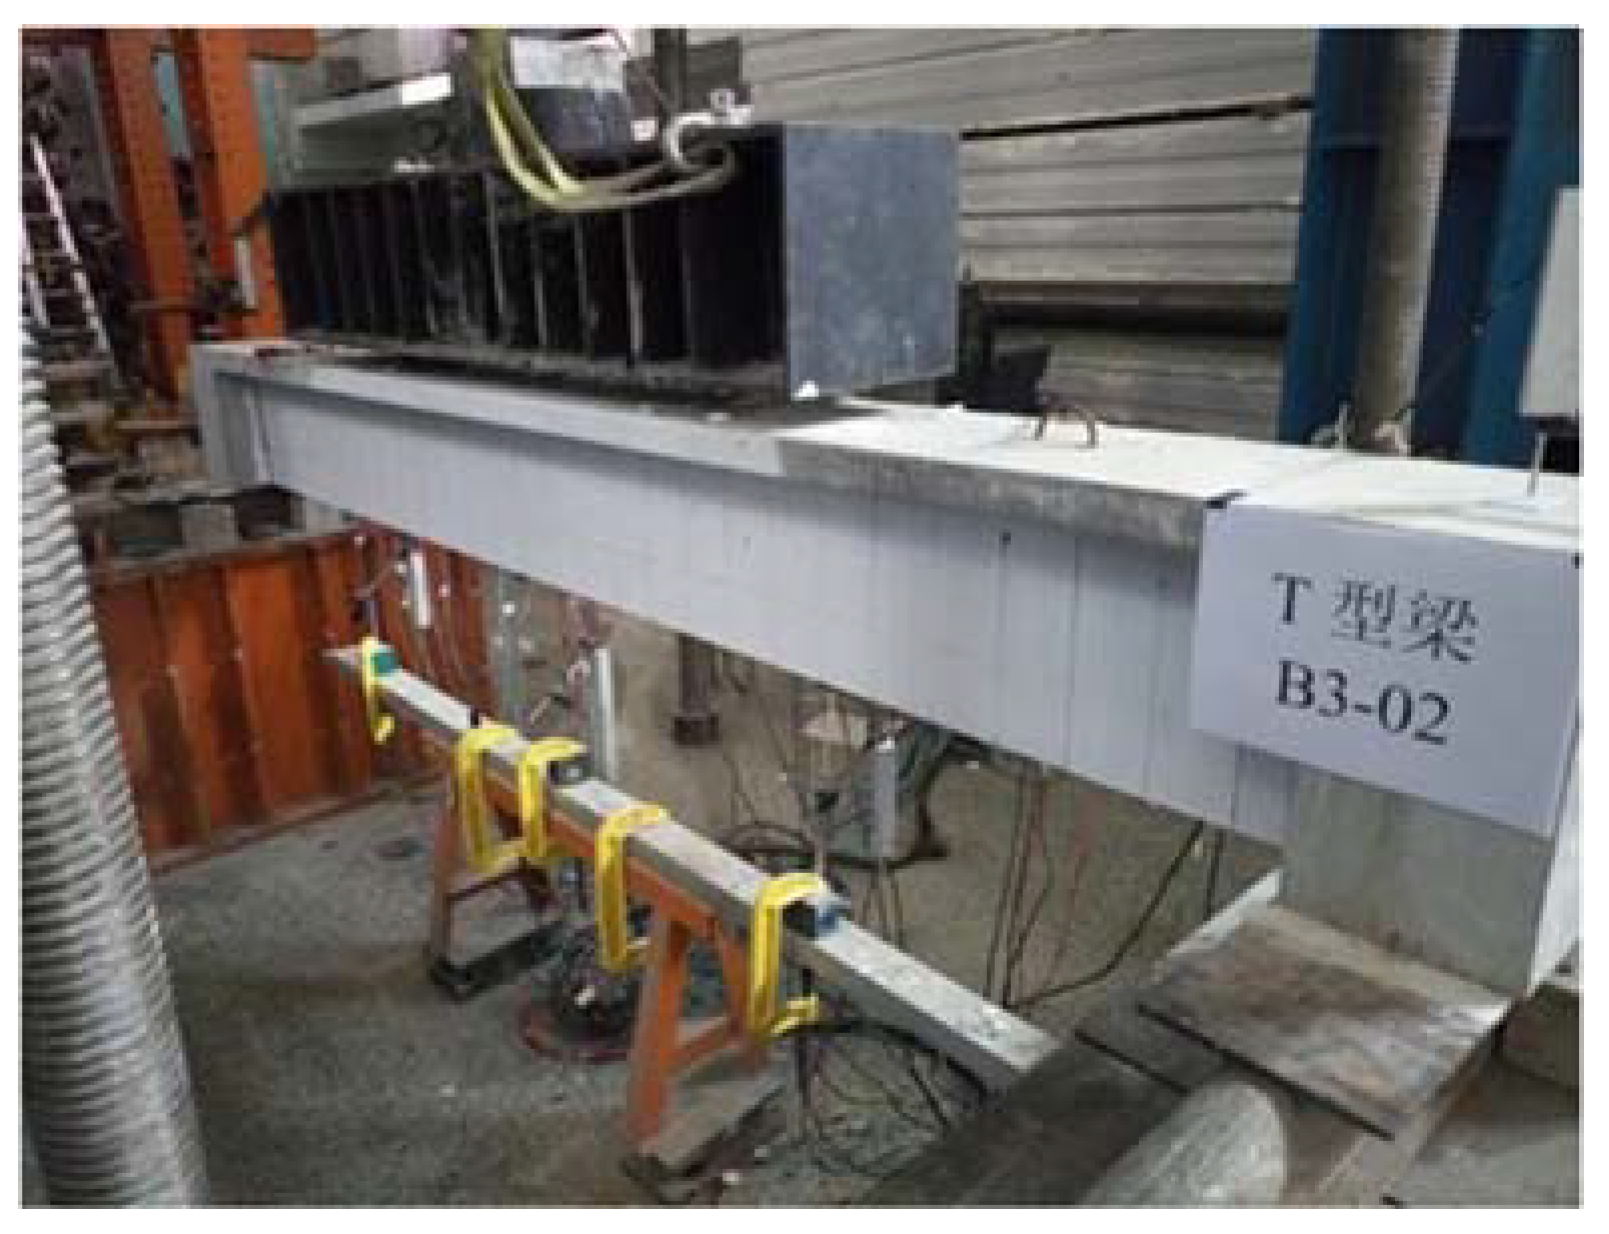
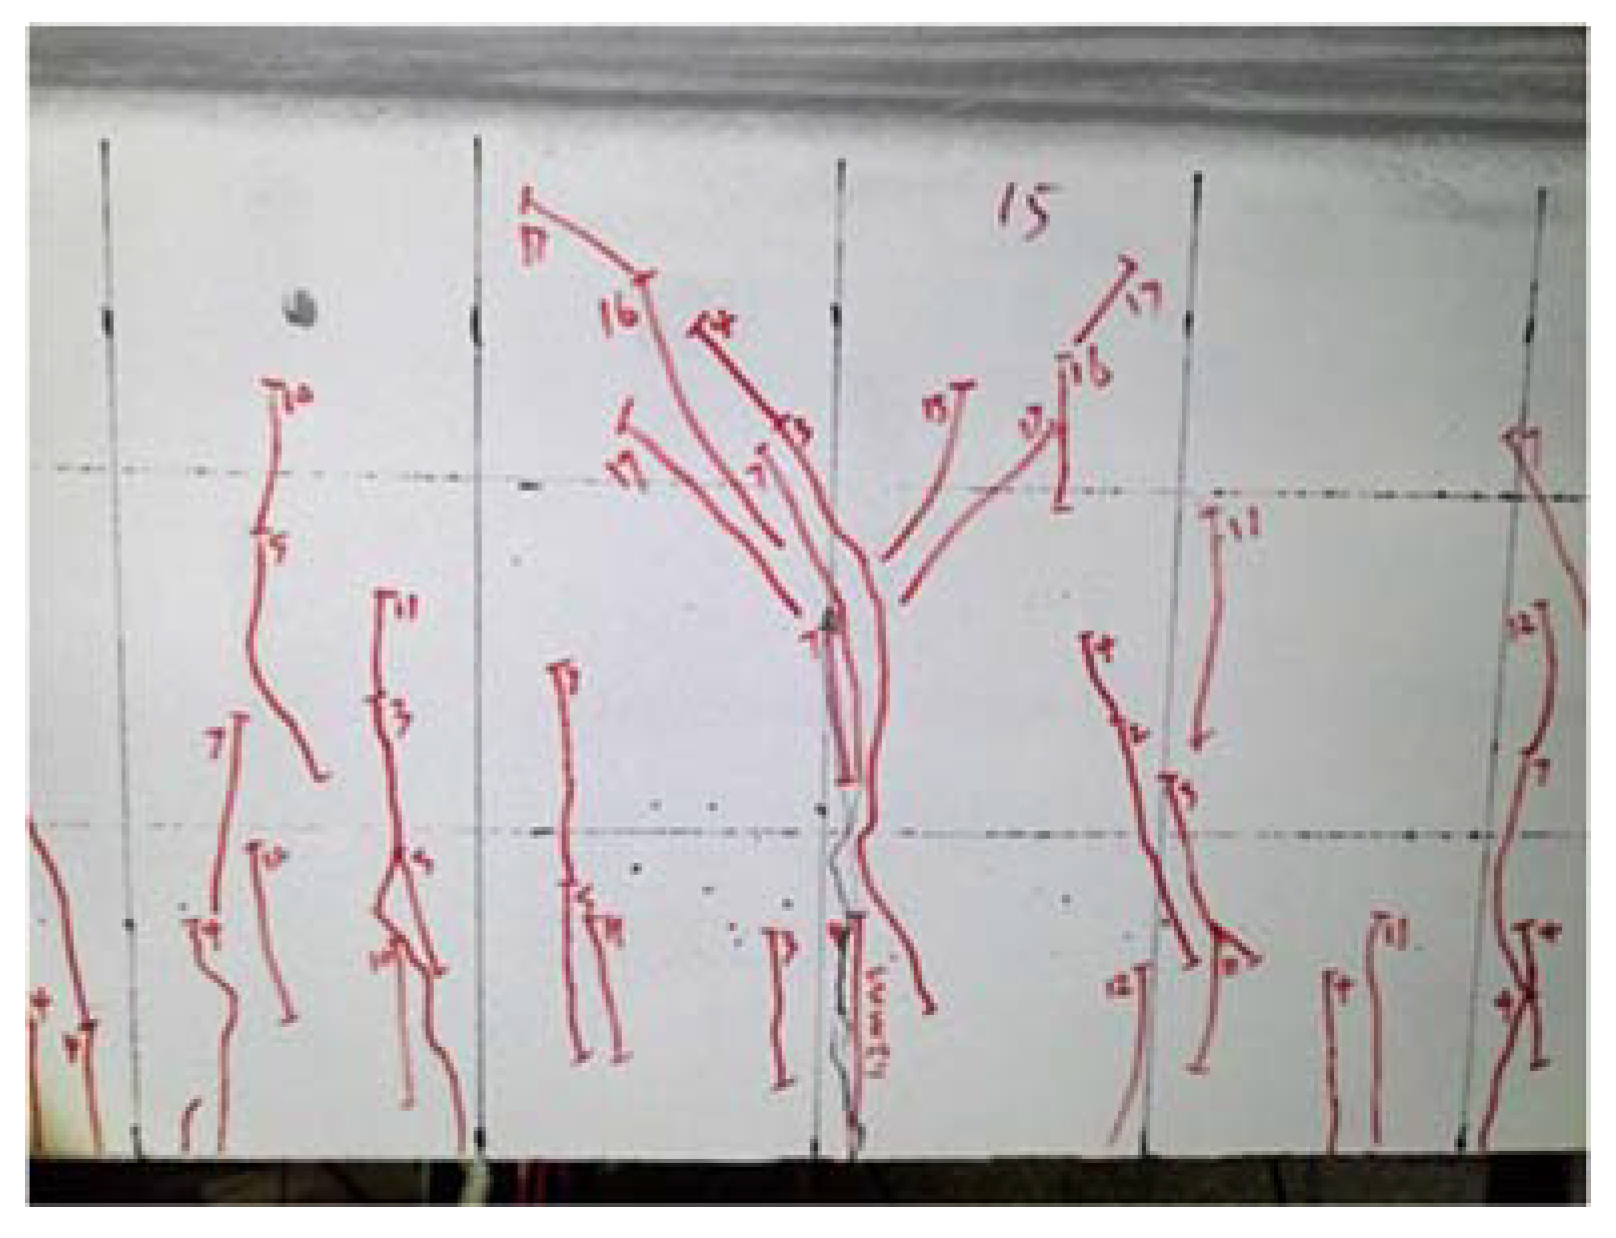
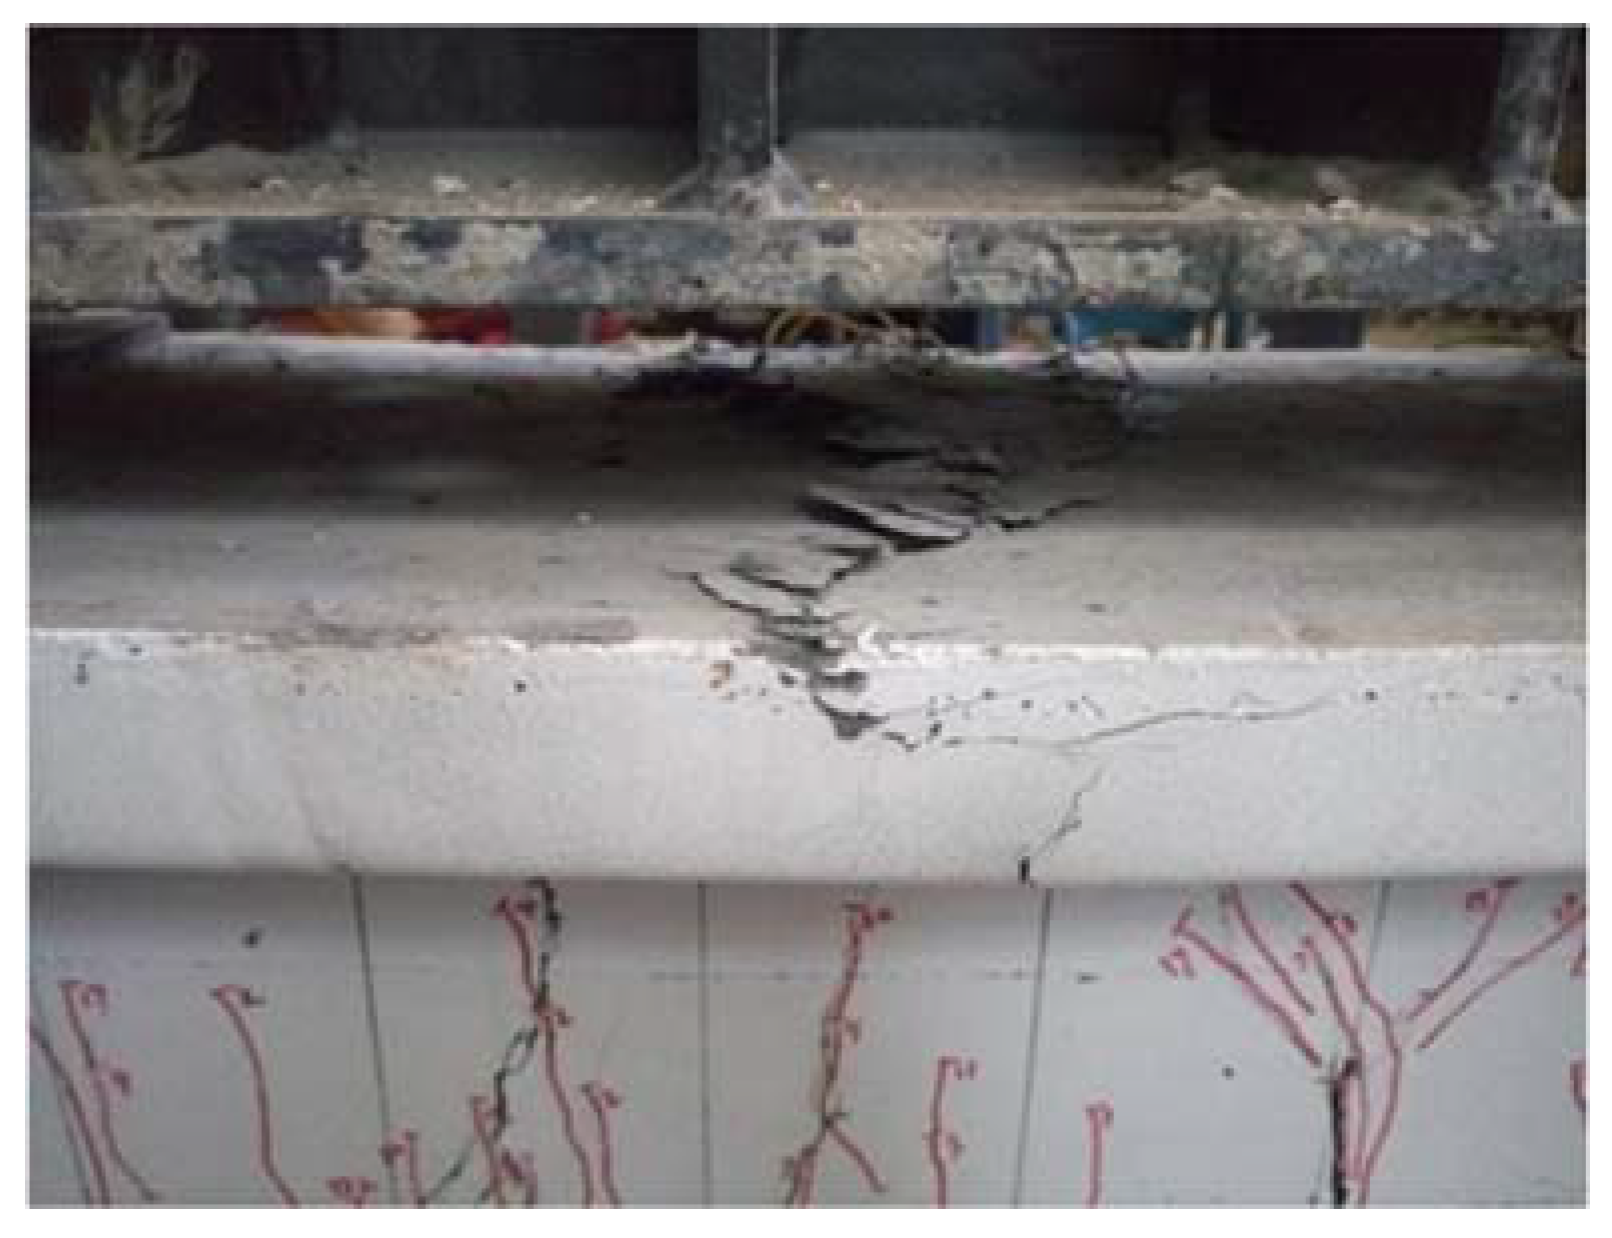
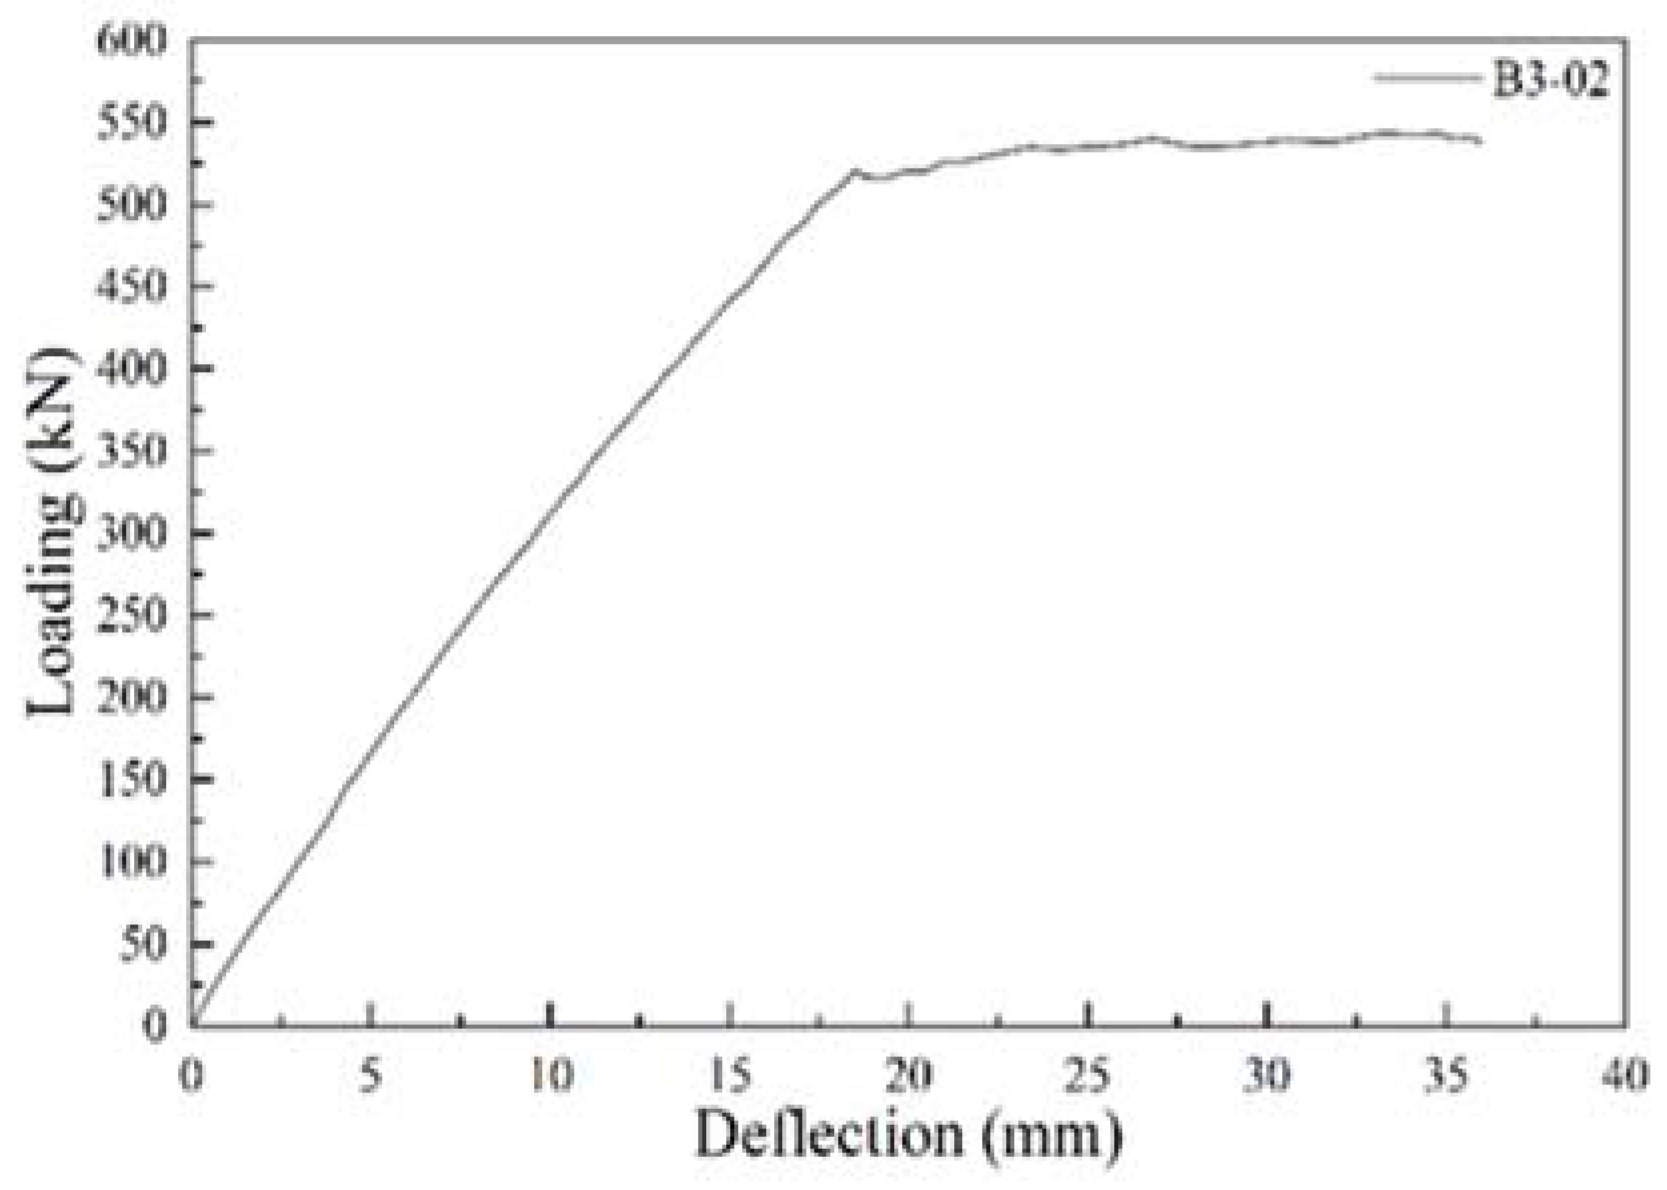
Figure 37, Figure 38, Figure 39, Figure 40 and Figure 41 illustrate the loading process and crack development of beam B3-02. When the load reached 74 kN, fine cracks first appeared in the tensile zone at the bottom of the beam due to the insufficient tensile strength of the concrete. Subsequently, the cracks propagated along the principal stress direction toward both sides and the compression zone. As the load increased (plastic stage), the mid-span region became a weak point due to concentrated flexural moments, resulting in a significant increase in crack network density. The concrete in the compression zone gradually experienced local crushing accompanied by spalling fragments. At a load of 517 kN, the load-deflection curve exhibited a significant turning point, indicating the beam entered the yield stage with a deflection of 18.7 mm. When the load reached 543 kN, the concrete in the compression zone failed, causing the beam’s bearing capacity to decline and reach its ultimate bearing capacity, while the mid-span deflection reached 36 mm.
The crack in beam B3-02 exhibited a V-shaped pattern extending toward both sides of the midspan. Initial fine cracks appeared at the bottom of the beam near the midspan. As the load increased, cracks began to emerge in the shear span, while the midspan cracks progressively propagated toward the top of the beam. With further loading, the number of cracks in the shear span continuously increased, and one crack widened. As the load continued to rise, the cracks in the shear span ceased to expand, stabilizing at a width of approximately 0.1 mm. After the rebar yielded, significant cracks developed at the midspan and beneath the loading points as deflection increased (as shown in Figure 39). These cracks continuously widened with increasing deflection until the compression zone at the top of the beam failed. As depicted in Figure 40, the crushing of the compression zone revealed concrete fragments distributed in a radiating pattern, with the crushed area extending to roughly one-third of the cross-sectional height.
The load–deflection curve of T-beam B3-02 is shown in Figure 42. The 0–5 mm range is the elastic stage, where the load and deflection show a linear relationship. The 5–8.2 mm range is the plastic development stage, where the curve slope decreases by 30%, and cracks enter the stable growth stage. After 8.2 mm, it enters the destruction stage, with a sudden drop in load.
Test data for each specimen and rebar information are shown in Table 5.

6. T-Beam Flexural Test Analysis

6.1. Flexural Failure Mode

The experimental results indicate that the flexural behavior and failure mode of UHPC T-beams are similar to the normal section flexural failure of conventional concrete. The process can be divided into three stages: the elastic stage, the cracked working stage, and the failure stage.
(I) Elastic stage. When the applied load is small, the internal forces within the cross-section are also minimal. Stress is proportional to strain, resulting in a linear stress distribution across the section, and no cracks appear in the beam. As the load continues to increase, the internal forces within the section also increase. When the load reaches a specific value that causes the tensile strength of the concrete in the tension zone to meet the critical cracking strength, a critical state occurs just before cracking at a weak section.
(II) Cracked working stage. Once the section reaches the critical state, a slight increase in load immediately causes cracking to occur. Stress redistribution occurs, and the beam enters the cracked working stage. At the crack locations, concrete no longer carries tensile force; the tensile force previously borne by the concrete is transferred to the rebar. Significant plastic deformation becomes evident in the concrete’s tension zone. Subsequently, as the load continues to increase, the cracks propagate further. When the load increases to a certain level, the longitudinal rebar in the tension zone begins to yield.
(III) Failure stage. After yielding of the longitudinal rebar in the tension zone, the load-bearing capacity of the section shows no significant increase. However, plastic deformation develops rapidly, and cracks propagate and extend upward into the compression zone. The area of the compression zone decreases, and the compressive stress in the concrete of the compression zone increases sharply. Under a nearly constant load, cracks propagate further and more drastically. Vertical cracks appear in the concrete of the compression zone, the concrete becomes completely crushed, and the section fails.
To further analyze the characteristics of the failure mode of T-beams, a comparison is made with the failure mode of tubular section beams [33,34,35,36,37]. The behavior of T-sections is dependent on the direction of the bending moment, with failure often arising from concrete crushing or shear. In contrast, the core risk for tubular sections is the local buckling of their thin walls, which can lead to brittle instability. Cracks in T-sections develop asymmetrically in the web or flange, whereas cracks or yielding in tubular sections are relatively symmetrical, although their development is governed by the stability of the wall panels. The ductility of T-sections is determined by the reinforcement and the depth of the compression zone. Conversely, the ductility of tubular sections mainly depends on their width-to-thickness ratio and lateral confinement, allowing for significant plasticity. The design of T-sections necessitates differentiating between positive and negative bending moments and enhancing shear resistance. In contrast, the design of tubular sections primarily focuses on controlling the width-to-thickness ratio and meticulously detailing the joint connections to leverage their high performance.

6.2. Rebar Strain Analysis

Figure 43 shows the load-rebar strain curve for beam B1-02. As observed from the figure, the rebar strain increases with the applied load. Initially, the strain increases at a relatively small rate. When concrete cracking and deformation occur, the rebar begins to bear the primary load, resulting in a larger increase in strain. This behavior is consistent with the development trend where the rebar transitions from an assisting role to the primary load-bearing component. The strain trends for the other beams are fundamentally similar, so redundant descriptions are avoided.

6.3. Initial Stiffness Analysis

Initial stiffness ( K ) is a crucial parameter, which is determined by the ratio of the load ( P ) to the deflection ( δ ) in the elastic stage, i.e., K = P / δ . According to the data presented in this study, the load range and deflection range for each specimen in the elastic stage are as follows (Table 6):
The stiffness of the specimen without steel fibers (B2-01) decreased by 6%, whereas the stiffness of the specimens with 1.5% steel fiber content (B2-02/B2-03) increased by approximately 16%. This indicates that steel fibers significantly enhance the elastic modulus of UHPC. Steel fibers inhibit the propagation of microcracks through a crack-bridging effect, thereby delaying stiffness degradation. The specimen with a high reinforcement ratio (B3-02) showed a 38.7% increase in stiffness, indicating that increasing the cross-sectional area of the main reinforcement directly improves the flexural stiffness of the section. The similar stiffness of B2-02 and B2-03 suggests that, for a given steel fiber content, adjustments to the matrix mix proportion have a limited effect on the initial stiffness.

6.4. Comparative Analysis of Different Rebar Ratios

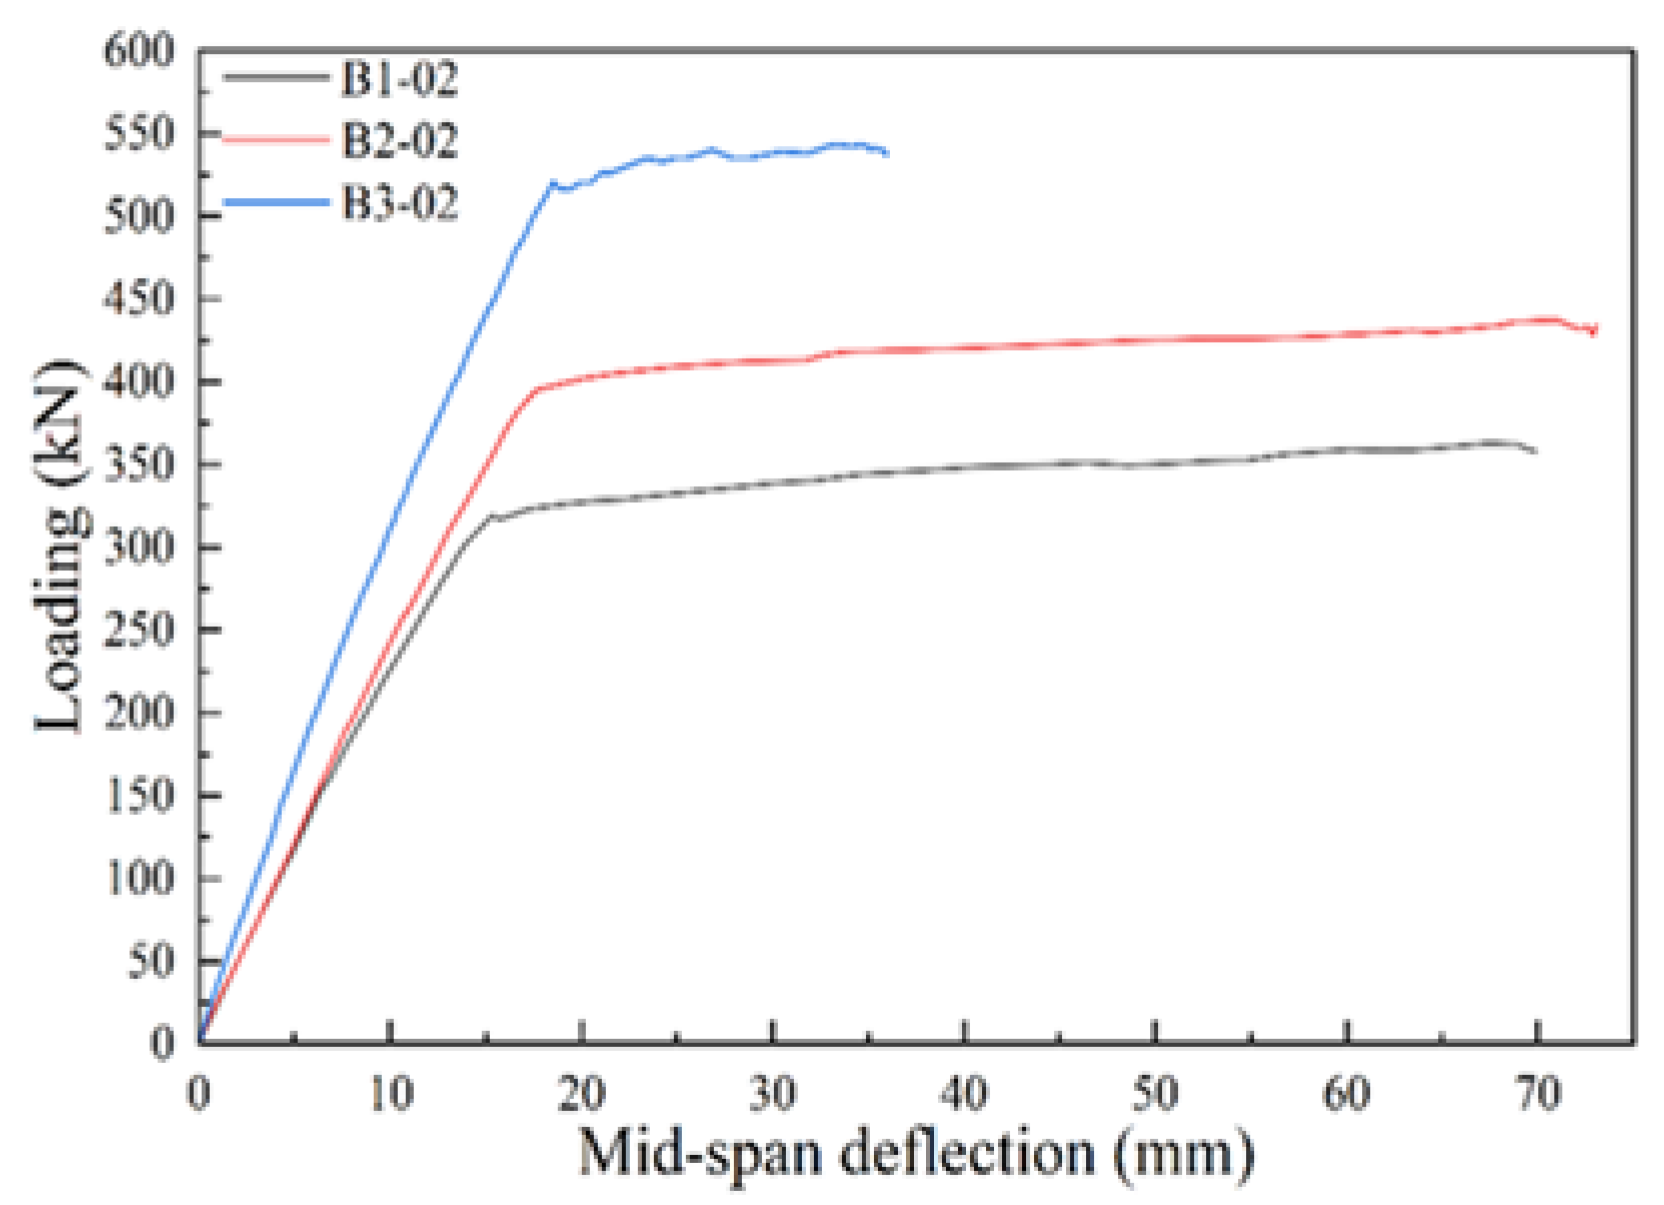
Based on the experimental data of components B1-02, B2-02, and B3-02, it can be observed that as the rebar ratio increases, the cracking load slightly decreases, while both the yield load and ultimate bearing capacity increase. The possible reason for the reduction in cracking load is that an increased rebar ratio enlarges the contact area between rebar and concrete, thereby enhancing the bond stress between them, which affects the cracking load. After concrete cracking, the rebar in the flexural zone begins to bear the load. Consequently, an increase in the rebar ratio elevates both the yield load and ultimate load. Based on the observed superior crack control performance, it is cautiously considered that UHPC-T beams hold potential in reducing stirrup reinforcement. Further research is planned to determine the exact extent of the reduction.
Figure 44 shows the comparison of load-deflection curves for components B1-02, B2-02, and B3-02. For component B4-02, compressive failure occurred in the concrete compression zone shortly after rebar yielding, resulting in a smaller deflection compared to the other two groups. The analysis indicates that the increased load-bearing capacity of the beam caused concrete crushing when the compression zone height matched that of the other two components. Consequently, its ductility was less pronounced than that of the first two groups.

6.5. Comparative Analysis of Different Steel Fiber Addition Rates

A comparison of the data from specimens B2-01 and B2-03 reveals that steel fibers can effectively improve the failure mode of T-beams. Specimen B2-01, without steel fibers, exhibited brittle failure during the test. Specifically, shear failure occurred before the steel reinforcement could yield, which is detrimental to seismic performance and requires further improvement. In contrast, specimen B2-03, which incorporated steel fibers, showed a significant improvement in its mechanical performance. The cracking load was substantially increased, indicating that the addition of steel fibers effectively delayed the initiation and propagation of cracks. After the steel reinforcement yielded, the cracks extended to the compression zone. The section did not fail until the concrete in the compression zone was completely crushed. This experiment demonstrates that the failure mode was transformed from brittle to ductile with the addition of steel fibers. This fact is because steel fibers have a pronounced crack-arresting effect on the UHPC matrix. When micro-cracks appear in the UHPC matrix, the steel fibers bridge across them, transferring tensile stress from the cracked matrix to the uncracked regions. After the main crack forms, the bond between the steel fibers and the matrix causes them to be gradually pulled out, a process that consumes a significant amount of energy. Simultaneously, the fibers continue to bridge the two sides of the crack. Furthermore, the collective action of numerous steel fibers makes the propagation path of the main crack more tortuous and restricts its width. For the T-beam with steel fibers, the load-bearing mechanism shifts from being carried solely by the conventional steel reinforcement to a synergistic system where the load is shared by the UHPC and the steel reinforcement. A comparison of the load-deflection curves for B2-01 and B2-03 is presented in Figure 45.
Based on the experimental data from B2-02 and B2-03, it can be observed that when the steel fiber content and rebar ratio are identical, the yield load, ultimate load, and the variation patterns of the load-deflection curves of the two groups of specimens are essentially identical. This aligns with the mechanical behavior of conventional reinforced concrete members. A comparison of the load-deflection curves for B2-02 and B2-03 is presented in Figure 46.

7. Conclusions

This paper presents a systematic experimental study on the flexural performance of UHPC T-beams, deeply investigating the mechanical properties of UHPC material and its application potential in reinforced concrete structures. The experiments covered the mechanical behavior and failure mechanisms of T-beams under different UHPC mix proportions and rebar ratios, with comparative analysis conducted against conventional reinforced concrete members. The main conclusions are as follows:
(1) This study achieved a high-strength UHPC matrix by optimizing the material particle gradation. Steel fibers significantly improved material properties. Specimens with steel fibers (B2-02, B2-03) exhibited a distinct yield stage, with the ultimate load increasing to 434–455 kN (a 93% increase), the strength reaching 147 MPa, the ultimate compressive strain improving by approximately 40%, and the compressive toughness enhancing by 2.3 times.
(2) UHPC T-beams demonstrated superior ductility and load-bearing capacity during flexural. After crack initiation, the beams continued to sustain load without sudden fracture. Beams incorporating steel fibers showed a clear yield stage prior to failure, characteristic of ductile failure. UHPC T-beams exhibited a concrete crushing-dominated failure mode in the compression zone, fundamentally differing from the brittle shear failure of conventional concrete beams. This indicates that steel fibers play a significant role in enhancing the flexural performance and ductility of UHPC beams.
(3) Steel fibers suppressed crack propagation through a crack-arresting effect, stabilizing crack widths at approximately 0.1 mm. This delayed the crushing process of concrete in the compression zone and significantly improved member ductility.
(4) Increasing the rebar ratio significantly enhanced the beam’s load-bearing capacity. When the rebar ratio increased from 2.26% to 4.58% (B3-02), the ultimate load increased by 51% (from 360 kN to 543 kN). However, a high rebar ratio reduced ductility. A 1.5% steel fiber dosage increased the cracking load by 53% (from 45 kN to 70 kN) and the yield load by 75% (from 225 kN to 395 kN). The failure mode shifted from shear to flexural failure, and shear capacity improved by 2.8 times.
(5) Under the condition of constant steel fiber content, varying the matrix mix ratio has an insignificant impact on the mechanical properties of the beams. Specifically, the yield loads (395 kN and 418 kN), ultimate loads (434 kN and 455 kN), and the trends of the load-deflection curves of the two sets of specimens, B2-02 and B2-03, are relatively similar, conforming to the general mechanical behavior of conventional reinforced concrete.
This study is subject to certain limitations. First, the number of test specimens is relatively small, and the variations in reinforcement ratio and fiber content were not detailed enough. The shear span ratio and flange thickness of the T-beams were kept constant, leading to a lack of abundant experimental data. In subsequent research, we plan to conduct experiments on T-beams with different shear span ratios and flange thicknesses to further enrich the experimental data. It is also noteworthy that UHPC with steel fiber has high requirements for construction processes (mixing, casting, vibrating, and curing). In practical engineering, a high reinforcement ratio brings significant construction difficulties, and the cost is relatively high. Moreover, there is a certain gap between the standard conditions in the laboratory and those in actual engineering projects.

Author Contributions

Conceptualization, H.X. and S.M.; methodology, H.X.; software, H.X.; validation, S.M., L.W., and Z.D.; formal analysis, H.X.; investigation, S.M.; resources, H.X.; data curation, L.W.; writing—original draft preparation, Z.D.; writing—review and editing, H.X.; visualization, L.W.; supervision, Z.D.; project administration, S.M.; funding acquisition, H.X. All authors have read and agreed to the published version of the manuscript.

Funding

This research was funded by the National Natural Science Foundation of China (Nos. 51578021 and 51378032) and Key Science and Technology Projects of the Beijing Natural Science Foundation (No. KZ201810005008).

Data Availability Statement

The original contributions presented in this study are included in this article; further inquiries can be directed to the corresponding author.

Acknowledgments

The authors would like to thank all the anonymous reviewers and editors for their efforts. Additionally, the authors would like to thank their institutions for their support.

Conflicts of Interest

The authors declare no conflicts of interest.

References

  1. Sun, Z.; Wang, Y.; Dong, Z.; Li, H.; Wang, D. Vulnerability analysis of high-strength steel-reinforced UHPC frame structures. J. Harbin Inst. Technol. 2024, 45, 1896–1903. [Google Scholar]
  2. Wang, J.; Liu, Y.; Zhang, Z.; Li, C.; Li, Y.; Guo, J. Study on seismic damage and control measures of the long-span continuous rigid frame bridge with high piers. J. Harbin Inst. Technol. 2025, 46, 720–726. [Google Scholar]
  3. Han, H.; Xue, X.; Hou, D.; Li, W.; Han, H.; Han, Y. Effect of Polyethylene and Steel Fibers on the Fracture Behavior of Coral Sand Ultra-High Performance Concrete. J. Compos. Sci. 2025, 9, 493. [Google Scholar] [CrossRef]
  4. Dong, C.; Vaidyan, J.A.P. Optimisation of Fibre-Reinforced Hybrid Composites Under Combined Loading. J. Compos. Sci. 2025, 9, 486. [Google Scholar] [CrossRef]
  5. Wang, L.; Tang, S. High-Performance construction materials: Latest advances and prospects. Buildings 2022, 12, 928. [Google Scholar] [CrossRef]
  6. Wang, P.; Wang, F.; Ma, M. The research progress and Hotspot analysis of polymer cement mortar based on bibliometrics. Front. Mater. 2024, 11, 1401816. [Google Scholar] [CrossRef]
  7. Al Fuhaid, A. Effects of Recycled and Supplemented Cementitious Materials on Corrosion Resistance and Mechanical Properties in Reinforced Concrete. J. Compos. Sci. 2025, 9, 457. [Google Scholar] [CrossRef]
  8. Si, W.; Carr, L.; Zia, A.; Khan, M.; McNally, C. Advancing 3D Printable Concrete with Nanoclays: Rheological and Me-chanical Insights for Construction Applications. J. Compos. Sci. 2025, 9, 449. [Google Scholar] [CrossRef]
  9. Deng, Z.; Li, H.; Huang, S. Flexural toughness and impact behavior of hybrid fibers reinforced UHPC. J. Harbin Inst. Technol. 2025, 12, 1–9. [Google Scholar]
  10. Wang, L.; Deng, Z. Investigation of tensile cracking characteristics of high strength and toughness ECC (HST-ECC) and CFRP reinforced HST-ECC. Cem. Concr. Compos. 2025, 159, 106004. [Google Scholar] [CrossRef]
  11. Bajaber, M.A.; Hakeem, I.Y. UHPC evolution, development, and utilization in construction: A review. J. Mater. Res. Technol. 2021, 10, 1058–1074. [Google Scholar] [CrossRef]
  12. Ma, P.; Yuan, S.; Jia, S. Bond Behavior Between Fabric-Reinforced Cementitious Ma-trix (FRCM) Composites and Different Substrates: An Experimental Investigation. J. Compos. Sci. 2025, 9, 407. [Google Scholar] [CrossRef]
  13. Sharma, R.; Jang, J.G.; Bansal, P.P. A comprehensive review on effects of mineral admixtures and fibers on engineering properties of ultra-high-performance concrete. J. Build. Eng. 2021, 45, 103314. [Google Scholar] [CrossRef]
  14. Hakeem, I.Y.; Amin, M.; Agwa, I.S.; Rizk, M.S.; Abdelmagied, M.F. Effect of using sugarcane leaf ash and granite dust as partial replacements for cement on characteristics of ultra-high performance concrete. Case Stud. Constr. Mater. 2023, 19, e02266. [Google Scholar] [CrossRef]
  15. Çiftçioğlu, A.Ö.; Kazemi, F.; Shafighfard, T. Grey wolf optimizer integrated within boosting algorithm: Application in mechanical properties prediction of ultra high-performance concrete including carbon nanotubes. Appl. Mater. Today 2025, 42, 102601. [Google Scholar] [CrossRef]
  16. Çiftçioğlu, A.Ö.; Delikanlı, A.; Shafighfard, T.; Bagherzadeh, F. Machine learning based shear strength prediction in reinforced concrete beams using Levy flight enhanced decision trees. Sci. Rep. 2025, 15, 27488. [Google Scholar] [CrossRef]
  17. Kazemi, F.; Asgarkhani, N.; Shafighfard, T.; Jankowski, R.; Yoo, D.Y. Machine-learning methods for estimating performance of structural concrete members reinforced with fiber-reinforced polymers. Arch. Comput. Methods Eng. 2025, 32, 571–603. [Google Scholar] [CrossRef]
  18. Okasha, N.M.; Mirrashid, M.; Naderpour, H.; Ciftcioglu, A.O.; Meddage, D.P.P.; Ezami, N. Machine learning approach to predict the mechanical properties of cementitious materials containing carbon nanotubes. Dev. Built Environ. 2024, 19, 100494. [Google Scholar] [CrossRef]
  19. Altıok, T.Y.; Üstüner, B.; Özyüksel, Ç.A.; Demir, A. Enhancing Structural Evaluation: Machine Learning Approaches for Inadequate Reinforced Concrete Frames. Iran. J. Sci. Technol. Trans. Civ. Eng. 2024, 48, 3027–3047. [Google Scholar] [CrossRef]
  20. Deng, Z.; Xue, H. Flexural toughness of hybrid fiber-reinforced ultra-high performance concrete. J. Harbin Inst. Technol. 2023, 44, 1288–1294. [Google Scholar]
  21. Yoo, D.Y.; Kang, S.T.; Yoon, Y.S. Enhancing the flexural performance of ultra-high-performance concrete using long steel fibers. Compos. Struct. 2016, 147, 220–230. [Google Scholar] [CrossRef]
  22. Wie, B.; Yue, N.; Yu, P.; Zhou, S.; Jiang, L. Experimental and numerical study on honeycomb T-beam bridge deck. Eng. Fail. Anal. 2024, 164, 108686. [Google Scholar] [CrossRef]
  23. Ghamari, A.; Thongchom, C.; Zapris, A.G.; Kytinou, V.K. Novel Ductile Moment-Resisting Frame Compound of Steel Gusset Plate for Beam-to-Column Connections and I-Shaped FRP Profile Sections. J. Compos. Sci. 2025, 9, 280. [Google Scholar] [CrossRef]
  24. Zaman, A.; Gutub, S.A.; Wafa, M.A. A review on FRP composites applications and durability concerns in the construction sector. J. Reinf. Plast. Compos. 2013, 32, 1966–1988. [Google Scholar] [CrossRef]
  25. Das, S.; Brenkus, N.R.; Tatar, J. Strategies for prevention, protection, and repair of bridge girders vulnerable to over-height vehicle impacts: A state-of-the-art review. Structures 2022, 44, 514–533. [Google Scholar] [CrossRef]
  26. Hag-Elsafi, O.; Almpalli, S.; Kunin, J. Application of FRP laminates for strengthening of a reinforced-concrete T-beam bridge structure. Compos. Struct. 2001, 52, 3–4. [Google Scholar] [CrossRef]
  27. Deifalla, A.; Awad, A.; Seleem, H.; Abdekrahman, A. Investigating the behavior of lightweight foamed concrete T-beams under torsion, shear, and flexure. Eng. Struct. 2020, 219, 110741. [Google Scholar] [CrossRef]
  28. Liu, C.W.; Mao, J.Y.; Dong, K.; Miao, J.J.; Gu, Z.J.; Li, L.H. Calculation method of the residual bearing capacities of concrete T-shaped beams considering the effect of fire cracks. Fire Technol. 2023, 59, 305–329. [Google Scholar] [CrossRef]
  29. Zhou, M.; Lu, W.; Song, J.; Lee, G.C. Application of ultra-high performance concrete in bridge engineering. Constr. Build. Mater. 2018, 186, 1256–1267. [Google Scholar] [CrossRef]
  30. Hao, N.; Yang, Y.; Xue, Y.; Xu, L.; Feng, S.; Sun, X. Shear performance of deep partially precast high-strength steel reinforced UHPC T-beam: Experimental study and a novel shear model. Eng. Struct. 2025, 323, 119256. [Google Scholar] [CrossRef]
  31. Zhao, X.; Shao, X.; Cao, X.; Cao, J.; Fu, Y. Experimental and analytical investigations into flexural behavior of composite beams with UHPC T-section and HRS H-section. Eng. Struct. 2024, 315, 118445. [Google Scholar] [CrossRef]
  32. GB/T50081; Standard for Test Method of Mechanical Properties on Ordinary Concrete. Ministry of Construction of the People’s Republic of China and Quality Supervision Inspection and Quarantine of the People’s Republic of China: Beijing, China, 2019.
  33. Zeng, J.J.; Pan, B.Z.; Fan, T.H.; Zhuge, Y.; Liu, F.; Li, L.J. Shear behavior of FRP-UHPC tubular beams. Compos. Struct. 2023, 307, 116576. [Google Scholar] [CrossRef]
  34. Li, Z.; Li, L.; Lin, R.; Guo, H.; Zhang, B.; Ren, J.; Liu, F.; Xiong, Z. The mechanical and microstructural study on the cement pastes adding various cementitious capillary crystalline waterproof materials. J. Build. Eng. 2025, 104, 112393. [Google Scholar] [CrossRef]
  35. Fan, T.H.; Zeng, J.J.; Hu, X.; Chen, J.D.; Wu, P.P.; Liu, H.T.; Zhuge, Y. Flexural fatigue behavior of FRP-reinforced UHPC tubular beams. Eng. Struct. 2025, 330, 119848. [Google Scholar] [CrossRef]
  36. Liao, J.J.; Zeng, J.J.; Zheng, Y.; Liu, Y.; Zhuge, Y.; Zhang, L. Constitutive models of ultra-high performance concrete (UHPC) under true tri-axial compression and an analysis-oriented model for FRP-confined UHPC. Eng. Struct. 2024, 305, 117656. [Google Scholar] [CrossRef]
  37. Pan, B.; Liu, F.; Zhuge, Y.; Zeng, J.J.; Liao, J.J. ECCs/UHPFRCCs with and without FRP reinforcement for structural strengthening/repairing: A state-of-the-art review. Constr. Build. Mater. 2022, 316, 125824. [Google Scholar] [CrossRef]
Figure 1. Failure diagram of test blocks without steel fibers.
Jcs 09 00545 g001
Figure 2. Destruction diagram of steel fiber-reinforced concrete test specimens.
Jcs 09 00545 g002
Figure 3. T-beam elevation and plan view.
Jcs 09 00545 g003
Figure 4. T-beam cross-section and rebar schemes.
Jcs 09 00545 g004
Figure 5. Layout of T-beam loading device.
Jcs 09 00545 g005
Figure 6. Strain gauge locations on T-beam.
Jcs 09 00545 g006
Figure 7. B1-02 Beam crack diagram.
Jcs 09 00545 g007
Figure 8. B1-02 Beam loading diagram.
Jcs 09 00545 g008
Figure 9. Cracking of the protective layer in the tension zone of the B1-02 beam.
Jcs 09 00545 g009
Figure 10. Compressive crushing failure of the B1-02 beam.
Jcs 09 00545 g010
Figure 11. B1-02 Beam failure condition.
Jcs 09 00545 g011
Figure 12. B1-02 Beam load-deflection curve.
Jcs 09 00545 g012
Figure 13. B2-01 Beam crack diagram.
Jcs 09 00545 g013
Figure 14. B2-01 Beam loading diagram.
Jcs 09 00545 g014
Figure 15. B2-01 Beam shear zone cracks are relatively wide.
Jcs 09 00545 g015
Figure 16. B2-01 Beam shear failure is severe.
Jcs 09 00545 g016
Figure 17. B2-01 Beam rebar cover has fallen off.
Jcs 09 00545 g017
Figure 18. B2-01 Beam load-deflection curve.
Jcs 09 00545 g018
Figure 19. B2-01(1) Beam crack diagram.
Jcs 09 00545 g019
Figure 20. B2-02(1) Beam loading diagram.
Jcs 09 00545 g020
Figure 21. B2-02(1) Significant cracks in the middle of the beam span.
Jcs 09 00545 g021
Figure 22. B2-02(1) Beam compression zone crushing.
Jcs 09 00545 g022
Figure 23. B2-02(1) Beam damage condition.
Jcs 09 00545 g023
Figure 24. B2-02(1) Beam load-deflection curve.
Jcs 09 00545 g024
Figure 25. B2-02(2) Beam crack diagram.
Jcs 09 00545 g025
Figure 26. B2-02(2) Beam loading diagram.
Jcs 09 00545 g026
Figure 27. B2-02(2) Beam shear zone cracks.
Jcs 09 00545 g027
Figure 28. B2-02(2) Beam pure flexural zone near left crack.
Jcs 09 00545 g028
Figure 29. B2-02(2) Distribution of cracks in beams.
Jcs 09 00545 g029
Figure 30. B2-02(2) Beam load-deflection curve.
Jcs 09 00545 g030
Figure 31. B2-03 Beam crack diagram.
Jcs 09 00545 g031
Figure 32. B2-03 Beam loading diagram.
Jcs 09 00545 g032
Figure 33. Obvious cracks in the middle span of beam B2-03.
Jcs 09 00545 g033
Figure 34. B2-03 Beam compression zone crushing.
Jcs 09 00545 g034
Figure 35. B2-03 Beam damage condition.
Jcs 09 00545 g035
Figure 36. B2-03 Beam load-deflection curve.
Jcs 09 00545 g036
Figure 37. B3-02 Beam crack morphology diagram.
Jcs 09 00545 g037
Figure 38. B3-02 Beam loading diagram.
Jcs 09 00545 g038
Figure 39. B3-02 Maximum crack in beam.
Jcs 09 00545 g039
Figure 40. B3-02 Beam compression zone crushing.
Jcs 09 00545 g040
Figure 41. B3-02 Beam failure condition.
Jcs 09 00545 g041
Figure 42. B3-02 Beam crack diagram.
Jcs 09 00545 g042
Figure 43. B1-02 Beam load-rebar strain curve.
Jcs 09 00545 g043
Figure 44. Comparison of load-deflection for components with different rebar ratios.
Jcs 09 00545 g044
Figure 45. Load-deflection curves of components with and without steel fibers.
Jcs 09 00545 g045
Figure 46. Comparison of load–deflection curves for components with different concrete mix designs.
Jcs 09 00545 g046
Table 1. Material mix ratio rules.
Mix Ratio IDCompressive Strength (MPa)Steel Fiber Content (%)Variable
011300The base material remains unchanged without adding steel fibers
021301.5Adjust the base material composition by adding 1.5% steel fibers
03>1301.5Based on mix ratio 1, add 1.5% steel fibers
The specific information of the materials used is as follows: Type 42.5 Portland cement, S95-grade ground powdered slag, 100–200 mesh quartz sand, 40–70 mesh quartz sand, steel fibers with a diameter of 0.2 mm and a length of 1–1.5 cm, Sika polycarboxylate superplasticizer (SP), and 3‰ defoamer.
Table 2. Detailed material mix ratio(kg/m3).
SPWaterCementPowdered Slag100–200 Mesh Quartz Sand40–70 Mesh Quartz SandSteel Fiber
36.71737002508002000
40170700250960240117
36.7173700250800200117
Table 3. UHPC cube compressive strength (MPa).
Cube SizeMix Ratio 1Mix Ratio 2Mix Ratio 3
C-40 mm146.6138.3147.5
C-70 mm143.8135.6144.5
C-100 mm133.8132.1135.7
Table 4. Basic information about UHPC T-beams.
IDSteel Fiber ContentSpecimen Rebar PlacementNumber of Specimens
B1-021.5%4D181
B2-010.0%4D201
B2-02(1)1.5%4D202
B2-02(2)
B2-031.5%4D201
B3-021.5%2D20 + 2D251
B represents the flexural test of T-beams, where the first digit after B (1, 2, or 3) indicates three different rebar schemes. The numbers after the hyphen (01, 02, or 03) represent three different UHPC mix ratios.
Table 5. T-beam test data comparison table.
IDRebar RatioCracking LoadYielding LoadUltimate Load CapacityMaximum Deflection at Mid-Span
B1-022.267631936070
B2-012.7945Rebar not yielded225Brittle shear failure
B2-022.796939543472
B2-032.797041845555
B3-024.585951754336
B1-022.267631936070
Table 6. T-beam initial stiffness comparison table.
IDLoad Range in the Elastic Stage (kN)Corresponding Deflection Range (mm)Initial Stiffness
B1-020–3190–1619.94
B2-010–2250–1218.75
B2-020–3950–1723.24
B2-030–3890–1821.61
B3-020–4180–1823.22
B1-020–5170–18.727.65
Disclaimer/Publisher’s Note: The statements, opinions and data contained in all publications are solely those of the individual author(s) and contributor(s) and not of MDPI and/or the editor(s). MDPI and/or the editor(s) disclaim responsibility for any injury to people or property resulting from any ideas, methods, instructions or products referred to in the content.