Abstract
A non-destructive method for determining the properties of laminated composite materials made of twill-weave glass fibre fabric is considered. To determine the elastic characteristics of the composite monolayer, a combined numerical–experimental method is used. The method combines the results of experimental tests and numerical modelling methods using optimization techniques. Firstly, the method for determining the properties is tested in a virtual experiment to determine the influence of the elastic characteristics of the material that do not affect the frequency response. The adequacy of the approximation equations and the influence of elastic constants on frequency response are evaluated using Analysis of Variance (ANOVA). Using the results obtained, the properties of the elastic characteristics of layered composite plates made of twill-weave glass fibre fabric using vacuum infusion are determined. To compare the properties obtained from the dynamic calculation, a series of static measurements of tensile samples were carried out. The results showed that the elastic modulus from the static test and the flexural test do not coincide by 4% and 23%, respectively. The technique demonstrates high accuracy and applicability for the non-destructive determination of dynamic material properties in engineering practice.
1. Introduction
Polymer fibre-reinforced composite materials have become widespread owing to their unique physical–mechanical properties and high-performance characteristics. Unlike traditional materials, they have high specific strength and stiffness, and can be used to create large-sized structures of complex shapes. With the development of technology, their production is becoming more and more accessible, while the quality remains high.
Multilayered composites are widely applied in the aerospace and aviation structures, automotive engineering, shipbuilding, civil engineering, energy engineering, and military equipment [1,2,3,4]. Their exceptional properties provide lightweight products with high strength, wear resistance, rigidity, and fatigue strength.
For designing structures from polymer composite materials and quality monitoring during production, experimental data on elastic characteristics are required. They depend on the properties of fibre and binder materials, reinforcement scheme, technological and operational factors. The data on the properties of composite materials available in the literature are often contradictory and require verification when performing important calculations.
Determining the elastic properties of composite materials, such as Young’s moduli, shear moduli, and Poisson’s ratios, is a key step in engineering modelling and design of structures. Traditional methods based on static mechanical testing require standardized specimens and are often labour-intensive and destructive. It is necessary to perform a series of shear, bending, and tensile tests by using expensive testing and measuring equipment and many specimens manufactured according to the developed standards [5]. The problem is determining a large number of the parameters included in the material model.
Non-destructive methods for determining the elastic properties of composite materials can be considered as an alternative to the destructive methods and allow one to reduce the cost of experiments. The advantages of these methods are the ability to determine the material properties after external influences (temperature, ageing, water absorption, etc.), which allows one to reduce the consumption of material [6,7,8,9].
Non-destructive methods for determining the elastic properties of a material can be divided into static and vibration ones. During static test, a quasi-static load is applied to the specimen, and its elastic strains are measured. To determine the elastic characteristics, an optimization method is applied, and experimental and calculated strains of the specimens are compared [10,11]. The vibration method is usually considered in the context of experimental modal analysis, which allows determining the modal parameters of the system, such as natural frequencies, natural vibration modes, and natural attenuation coefficients. A method based on the analytical relationships linking the dimensions of specimens and the lowest natural frequencies of vibrations with elastic characteristics is implemented in the ASTM E1876-15 standard [12]. However, this standard does not allow the determining of the values of the elastic characteristics of a composite material.
Inverse methods comparing the experimental and numerical frequency responses have become widely popular for determining material properties. This approach is based on solving an inverse problem: the material parameters are selected so that the numerical model reproduces the natural frequencies and vibration modes measured. The process includes building a numerical model of the specimen under study, conducting a modal analysis, and then optimizing the model parameters in order to minimize the discrepancy between the experimental and numerical modal characteristics. The error function is used as a criterion, taking into account the difference between frequencies and vibration modes.
The most known works are Mota’s [13], which applied Mindlin’s plate theory with a finite element model, and Araujo’s [14], which applied a higher-order displacement with a finite element model. These works are close to the developments of Pedersen [15], who applied the classical theory of plates. The Rayleigh–Ritz method, along with the classical plate theory, was presented by Wilde and Sol [16,17,18] for the study of symmetric single-layer materials. An approach combining numerical and experimental methods using a Ritz-type model and an optimization algorithm to minimize the discrepancy between experimental and numerical modal data was proposed in Ref. [19]. The authors demonstrated the effectiveness of the method using 3D-printed specimens expecting to exhibit orthotropic behaviour due to the manufacturing technology.
The next step in the development of the identification method was the application of a response surface methodology (RSM). RSM is one of the powerful tools for determining the mechanical properties of the material compared to traditional methods and belongs to the design of experiments (DOE) family. With this technique, it became possible to determine a larger number of elastic constants of the composite material. This method is widely applied in modelling the plate structures using finite element programmes. Finite element models are typically created to obtain numerical modal parameters, with the elastic properties of the material specified as input data. This allows for an accurate analysis of the structure’s dynamic behaviour and the use of the results for subsequent identification of material characteristics [20].
Rikards and Chate [21,22,23] used a numerical–experimental method to identify the elastic properties of a unidirectional laminated polymer composite plate made of carbon. Experimental data on the measured natural frequencies were used. The six parameters of the transverse isotropic layer were identified. The advantage of using RSM-based methods for system identification is that they consume much less computing power compared to traditional methods. This method was later applied by many researchers to determine the properties of composite materials or using the identification procedure [24,25,26,27,28]. In the work [29], the authors demonstrated the applicability of using a numerical–experimental method to determine the mechanical properties of unidirectional and woven composites. The influence of numerical model errors associated with the hypothesis of the material description on the mechanical properties determined was demonstrated. It was assumed that the layup is known, but the type of material is not. For this purpose, two beam-shaped specimens with different reinforcement schemes were made using the hand lay-up technique. The properties of the plates were determined based on the results of vibration tests using the assumptions of a unidirectional and woven composite. The sensitivity of the identified material properties on the model and the experimental errors was studied in [30,31,32] with the purpose to improve the accuracy and effectiveness of the inverse technique based on vibration tests.
It should be noted that the inverse method based on simple vibration tests can be used not only to determine the elastic or dynamic constants, but also the loss modulus or damping properties of a material. Matter et al. presented a numerical–experimental identification method for determining the elastic and dissipative parameters of composite plates based on the natural frequencies, modal damping coefficients and modal shapes of specimens [33]. In this case, the elastic properties and damping parameters were determined with high accuracy.
Numerous studies have been devoted to determining the elastic properties of composite materials using vibration methods. A review of the approaches used in this area was prepared by Tam et al. [34,35].
In majority publications, the authors identify the mechanical properties of composite materials made from unidirectional carbon fibre-reinforced plastics. There are even fewer studies in which the identified mechanical properties of a monolayer are compared with those determined using failure test methods.
The objective of this work is to evaluate the accuracy of the experimental-calculation method for identifying the elastic characteristics of composite materials using experimental data on the natural frequencies and vibration modes of plate-shaped specimens using twill-weave glass fibre fabric material. A method developed by Rikards and Chate [21,22,23] is used in this research.
The study consists of two parts. Firstly, the elastic properties of the monolayer are determined using a virtual experiment. This virtual test allows us to refine the method for determining material properties, reduce the errors concerned with external factors, and determine the influence of each material constant on the measured natural frequencies. Then, the material properties are determined using the plates made from twill-weave glass fibre fabric material.
2. Materials and Methods
2.1. Materials
The study object is a layered glass-fibre-reinforced plastic made of twill-weave glass fibre fabric with a density of 200 g/m2. The composite material is manufactured using the vacuum infusion method, which ensures the uniform impregnation of the reinforcing fibres with a polymer matrix and minimizes the presence of pores. At the first stage of preparation, dry reinforcing layers of twill-weave glass fibre fabric 200 T (Olomouc, Czech Republic) are laid. A total of 8, 12, and 16 layers of 2 × 2 twill-weave glass fibre fabric each with a thickness of 0.17 mm were placed over the glass mould and the fibres in the weft direction were aligned.
Glass, the surface of which is treated with a separating wax, is used as a base for laying the layers of glass fibre fabric. The infusion zone is limited by a sealing tape (vacuum sealing tape), which ensures the sealing of the moulding zone. A breather layer was placed before the resin outlet.
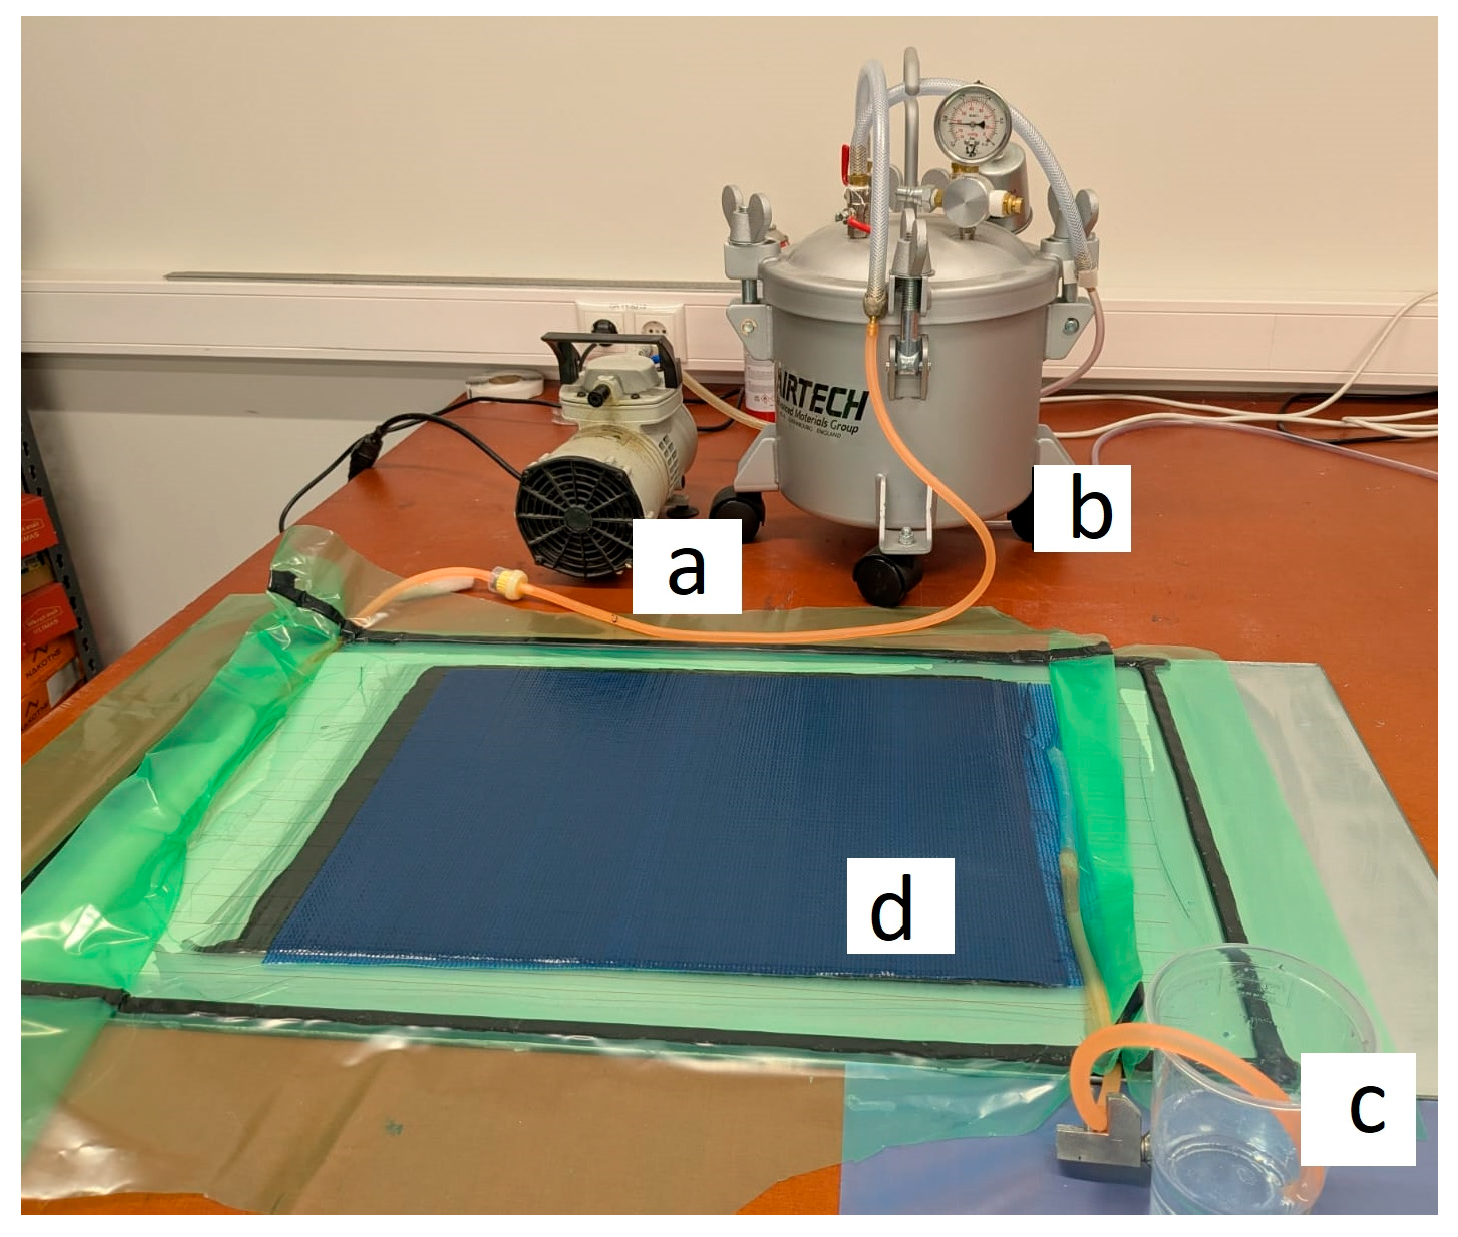
For vacuum infusion, epoxy binder LG 700 epoxy resin with HG 700 hardener (GRM Systems, Olomouc, Czech Republic) is used in a weight ratio of 10:3. The process is carried out at a room temperature of 25 °C for 10 min; the pressure of 0.8 bar is maintained in the system. A vacuum infusion pressure of 0.8 bar was set to avoid the heating of the resin and exothermal reaction of free radical polymerization [36,37]. Figure 1 presents an infusion set-up before curing. After the infusion process, the composite plates were cured on a glass table at 25 °C for 20 h. Then, the specimens were post-cured in an oven at 50 °C for 8 h.
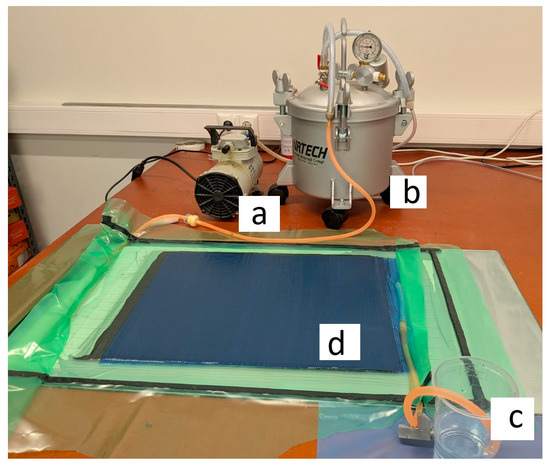
Figure 1.
Infusion set-up: (a) vacuum pump; (b) catch pot with pressure valve; (c) epoxy binder; (d) glass fibre specimen in vacuum bag.
2.2. Procedure for Determining the Material Properties of Layered Composites
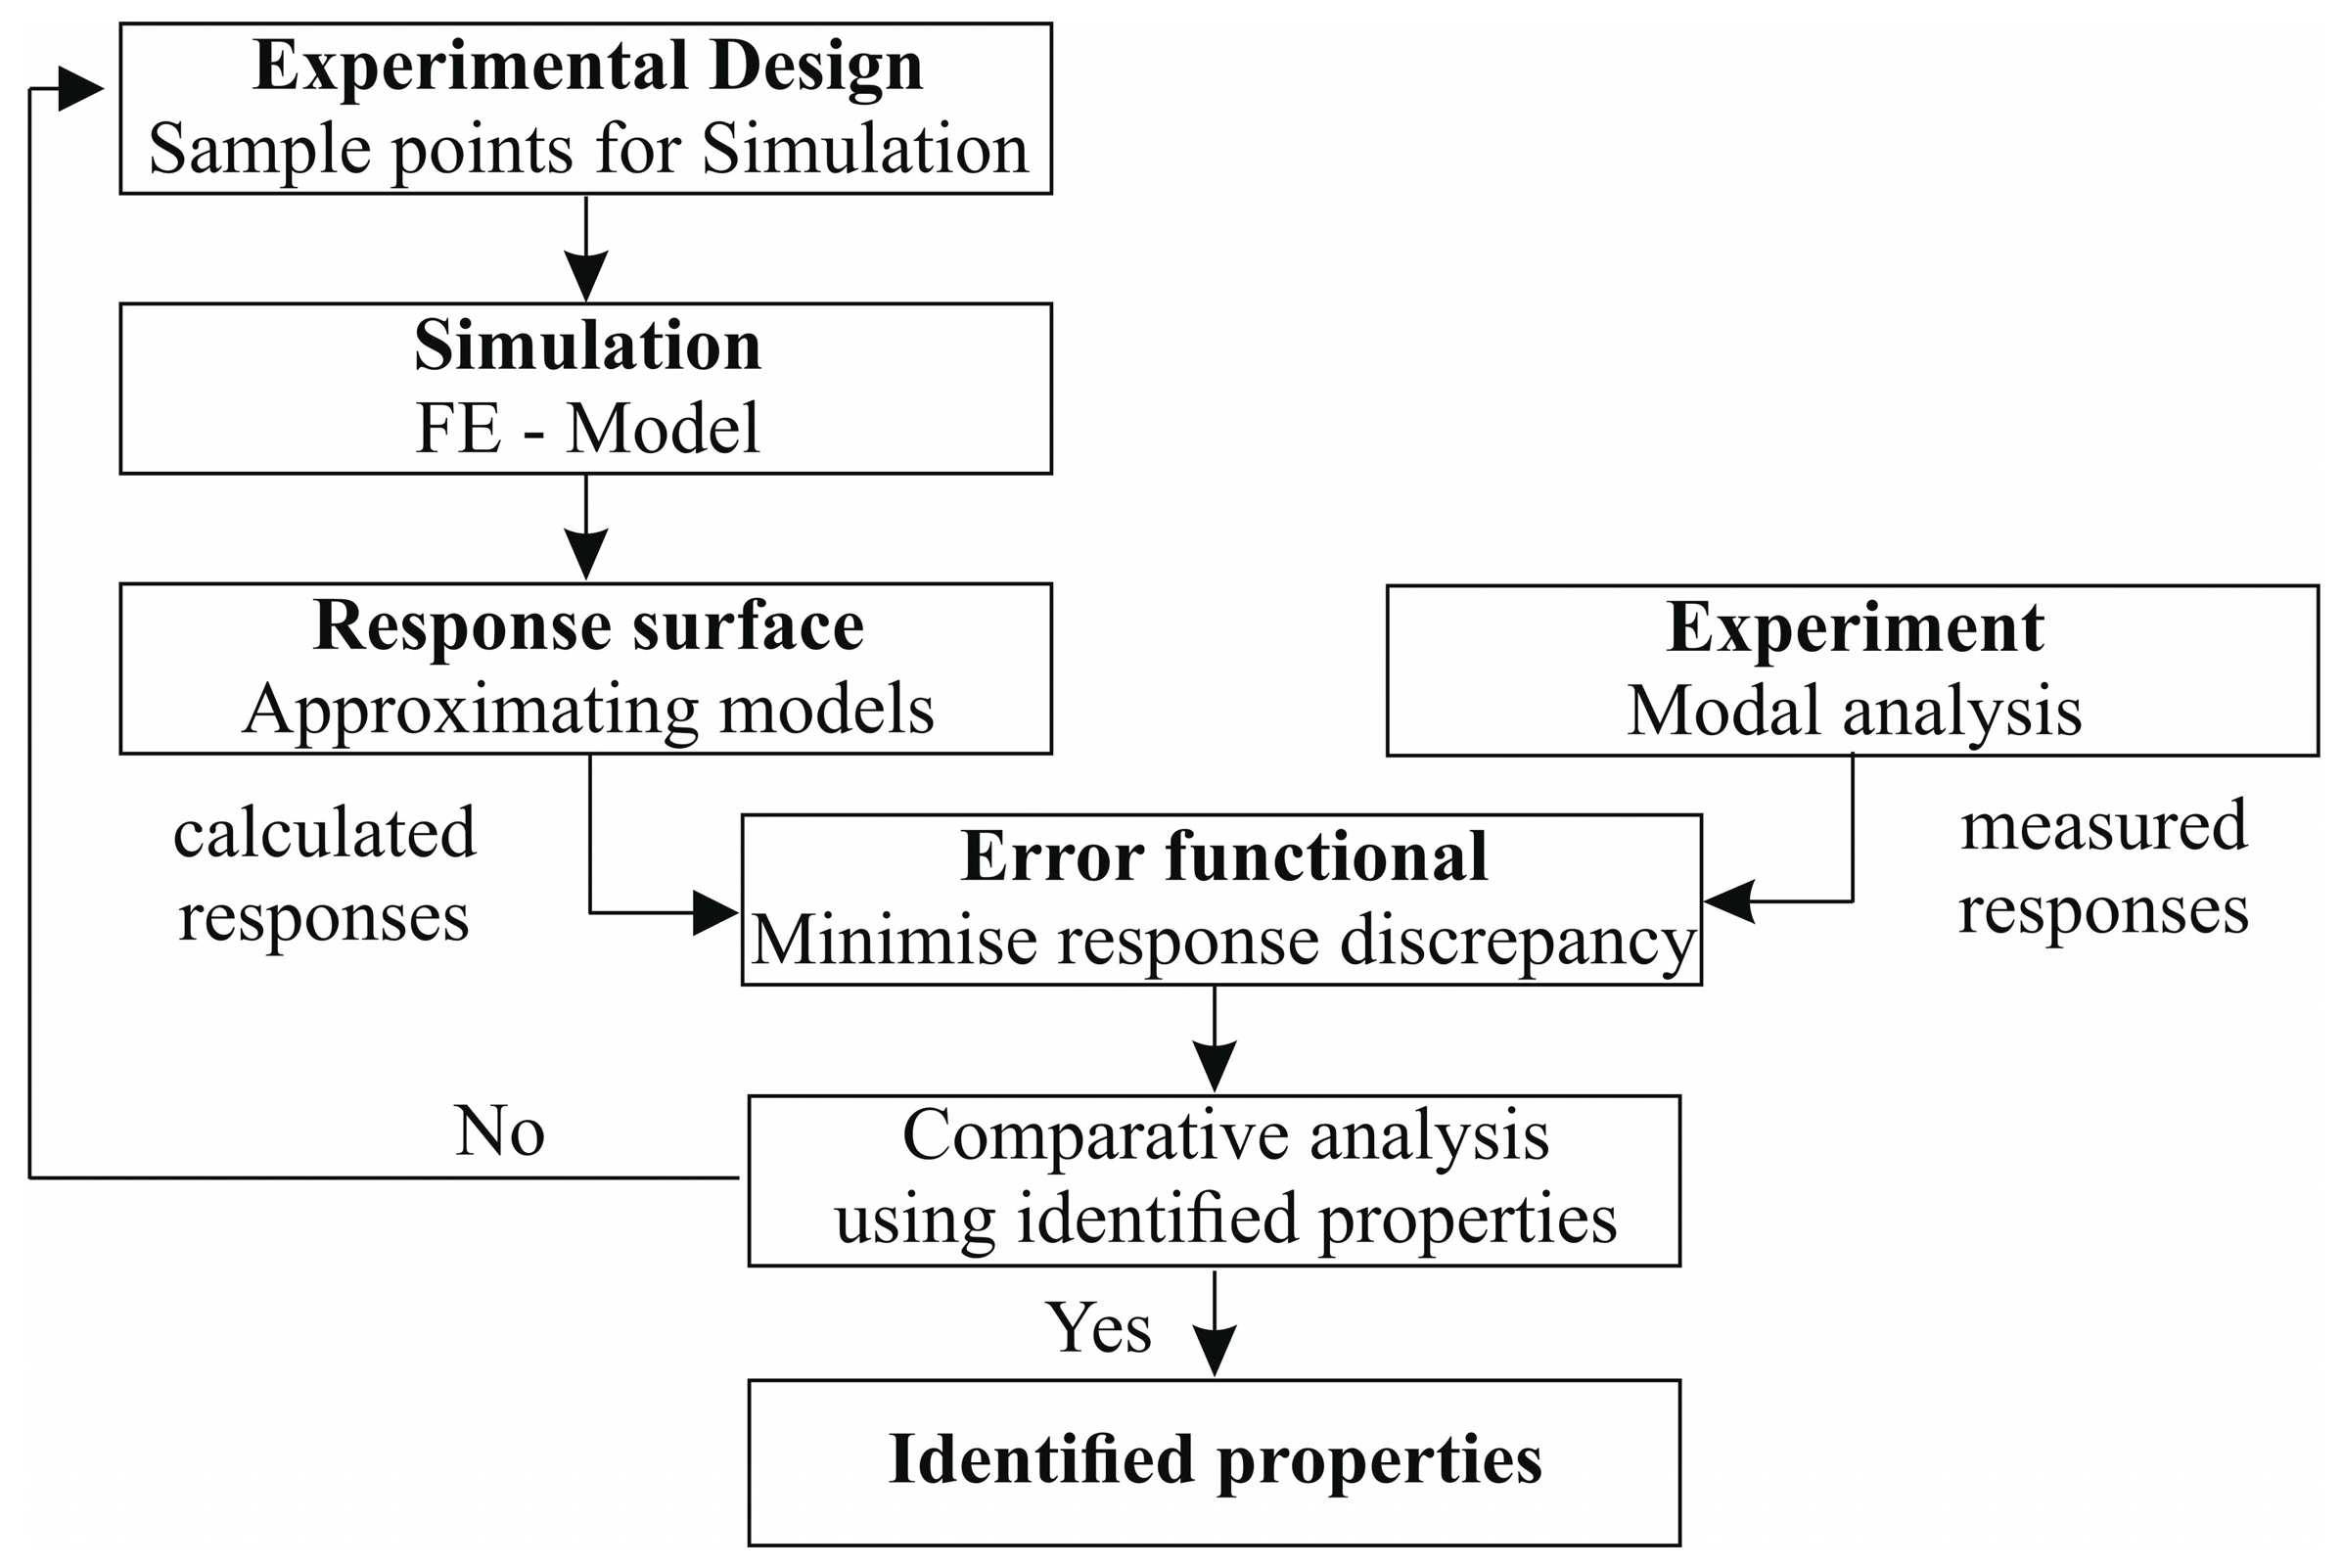
The procedure for determining the elastic properties of a layered composite material includes solving the inverse problem, when the elastic properties of a composite monolayer are determined from the natural frequencies of vibrations of a rectangular specimen. The solution to this problem consists of several stages (Figure 2).
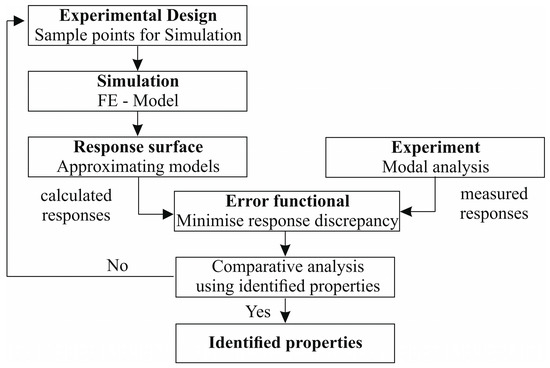
Figure 2.
General flowchart for the identification of elastic properties.
At the beginning, the scanning laser vibrometry method is used. An experimental modal analysis of the specimen is carried out and the natural frequencies and vibration modes are determined. The objective of this stage is to obtain reliable information on the dynamic characteristics of the specimen, which is required for the subsequent determination of the properties of the layered composite from the calculation model.
At the next stage, a finite element model is developed and an experimental plan is constructed, which includes the elastic properties of the material to be determined. Numerical data of the natural frequencies obtained are used for building approximation equations. Approximation equations and regression coefficients are analyzed using Analysis of Variance (ANOVA). Using experimental data and the approximation equations obtained for each frequency, the discrepancy between the calculated values of natural frequencies is estimated.
The characteristics of the composite material determined by means of identification are introduced into a numerical model, and the mode shapes and natural frequencies experimentally measured are compared with numerically calculated ones. In the case of large discrepancies between the frequencies compared, mismatches in the vibration modes, or reaching the boundaries of the experimental plan by the determined properties of the material, the identification problem is recalculated with changing the boundaries of the experimental plan.
2.2.1. Measured Responses
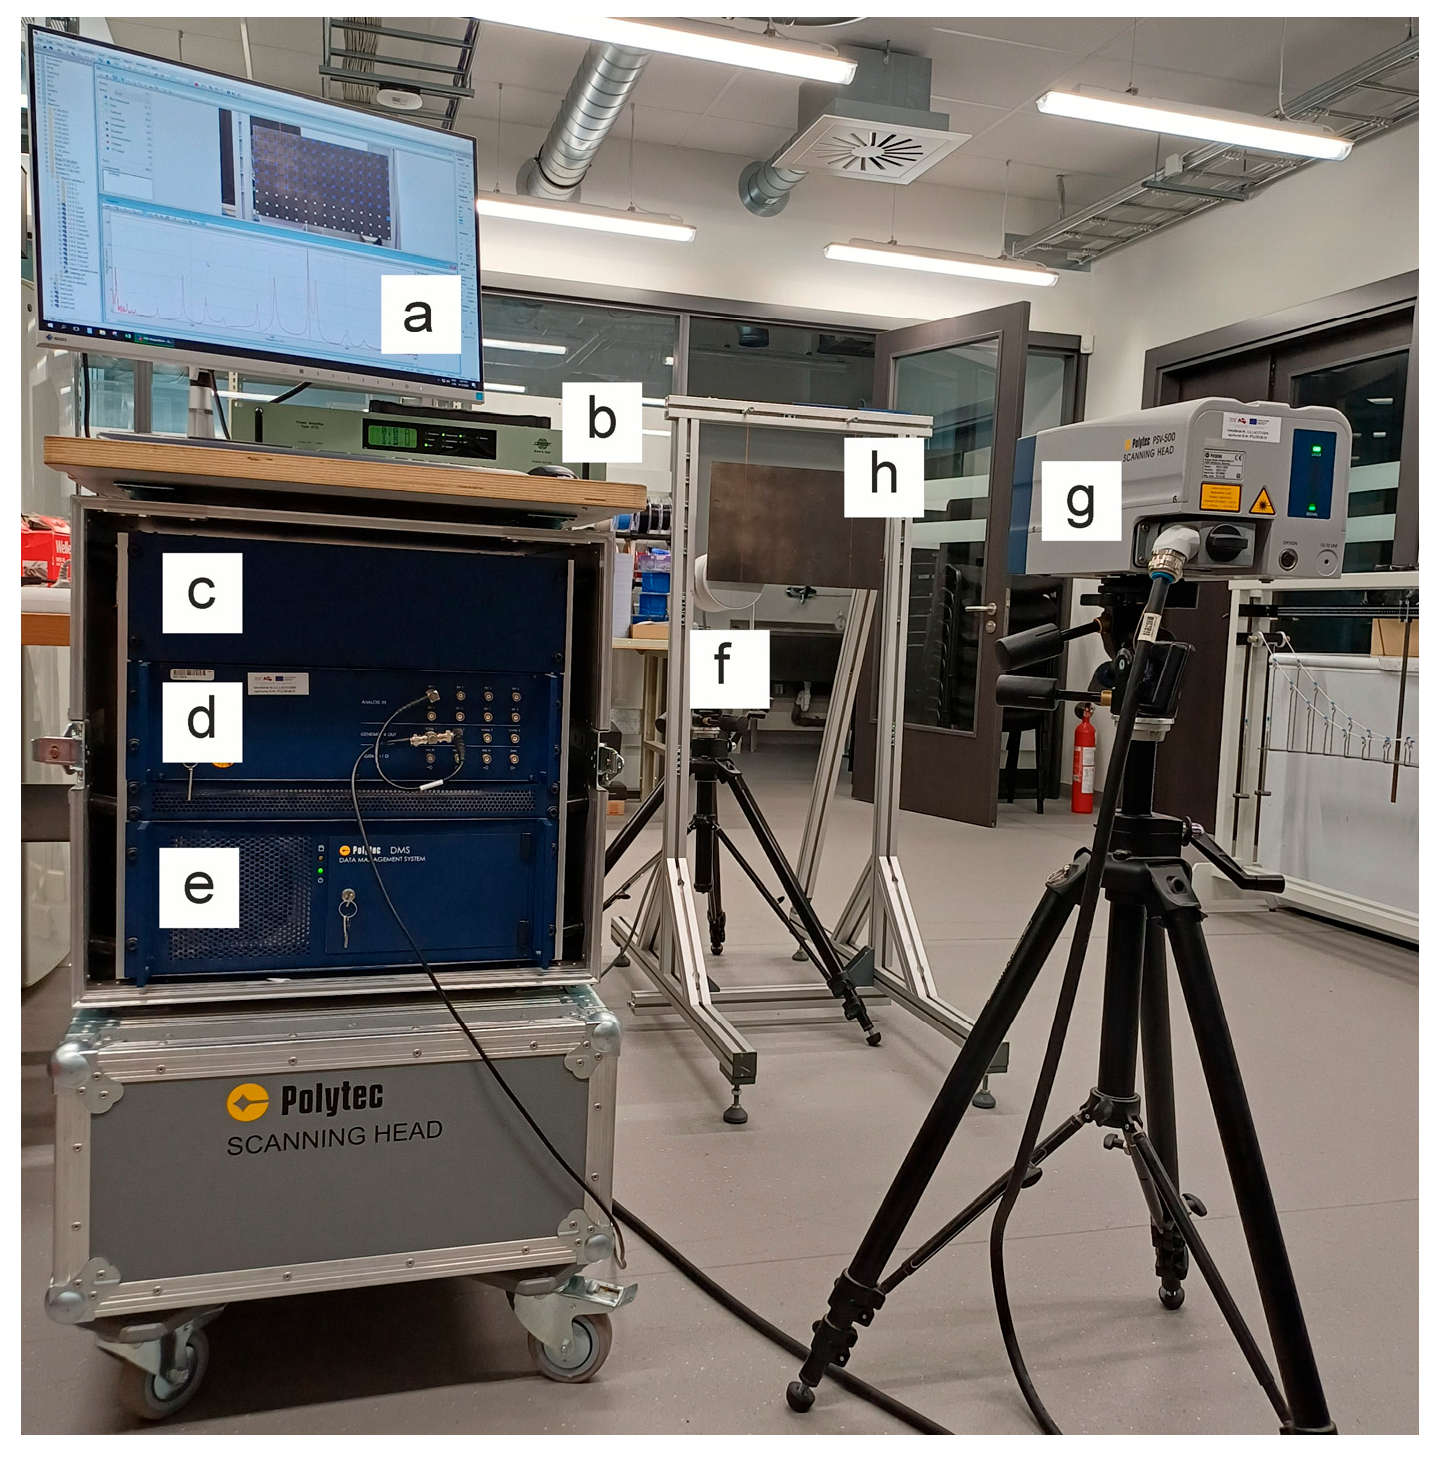
To determine the natural frequencies and vibration modes, a scanning laser vibrometer Polytec PSV500 (Waldbronn, Germany) was used (Figure 3). The photo shows the experimental set-up of the Polytec and its control box, the signal generator, the amplifier, an acoustic speaker for the excitation of vibrations and a testing specimen. The Polytec vibrometer operates using optical interference, which allows a contactless measurement of vibration parameters with high accuracy and spatial resolution. The device measures the frequency shift in a laser beam reflected from a vibrating surface and calculates instantaneous values of vibration velocity and vibration displacement.
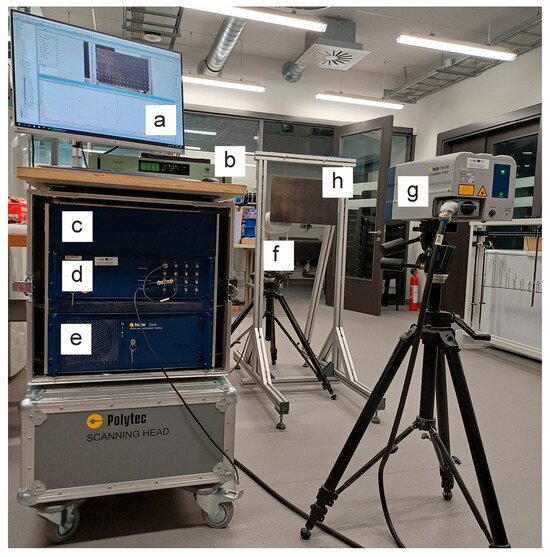
Figure 3.
Set-up. The Polytec Scanning Vibrometer PSV-500-3D: (a) monitor; (b) amplifier; (c) controller; (d) junction box; (e) PC; (f) loudspeaker; (h) specimen; (g) scanning head.
The specimen investigated is fixed on a rigid frame in the flexible elastic suspensions, which allows bringing the conditions of fixation as close as possible to the absence of restrictions on movements, convenient for reproduction in subsequent calculations. Excitation of vibrations is carried out contactless with the help of an acoustic speaker, to which a signal is fed, changing in time according to the harmonic law with constant amplitude and increasing to the required frequency range (Periodic Chirp).
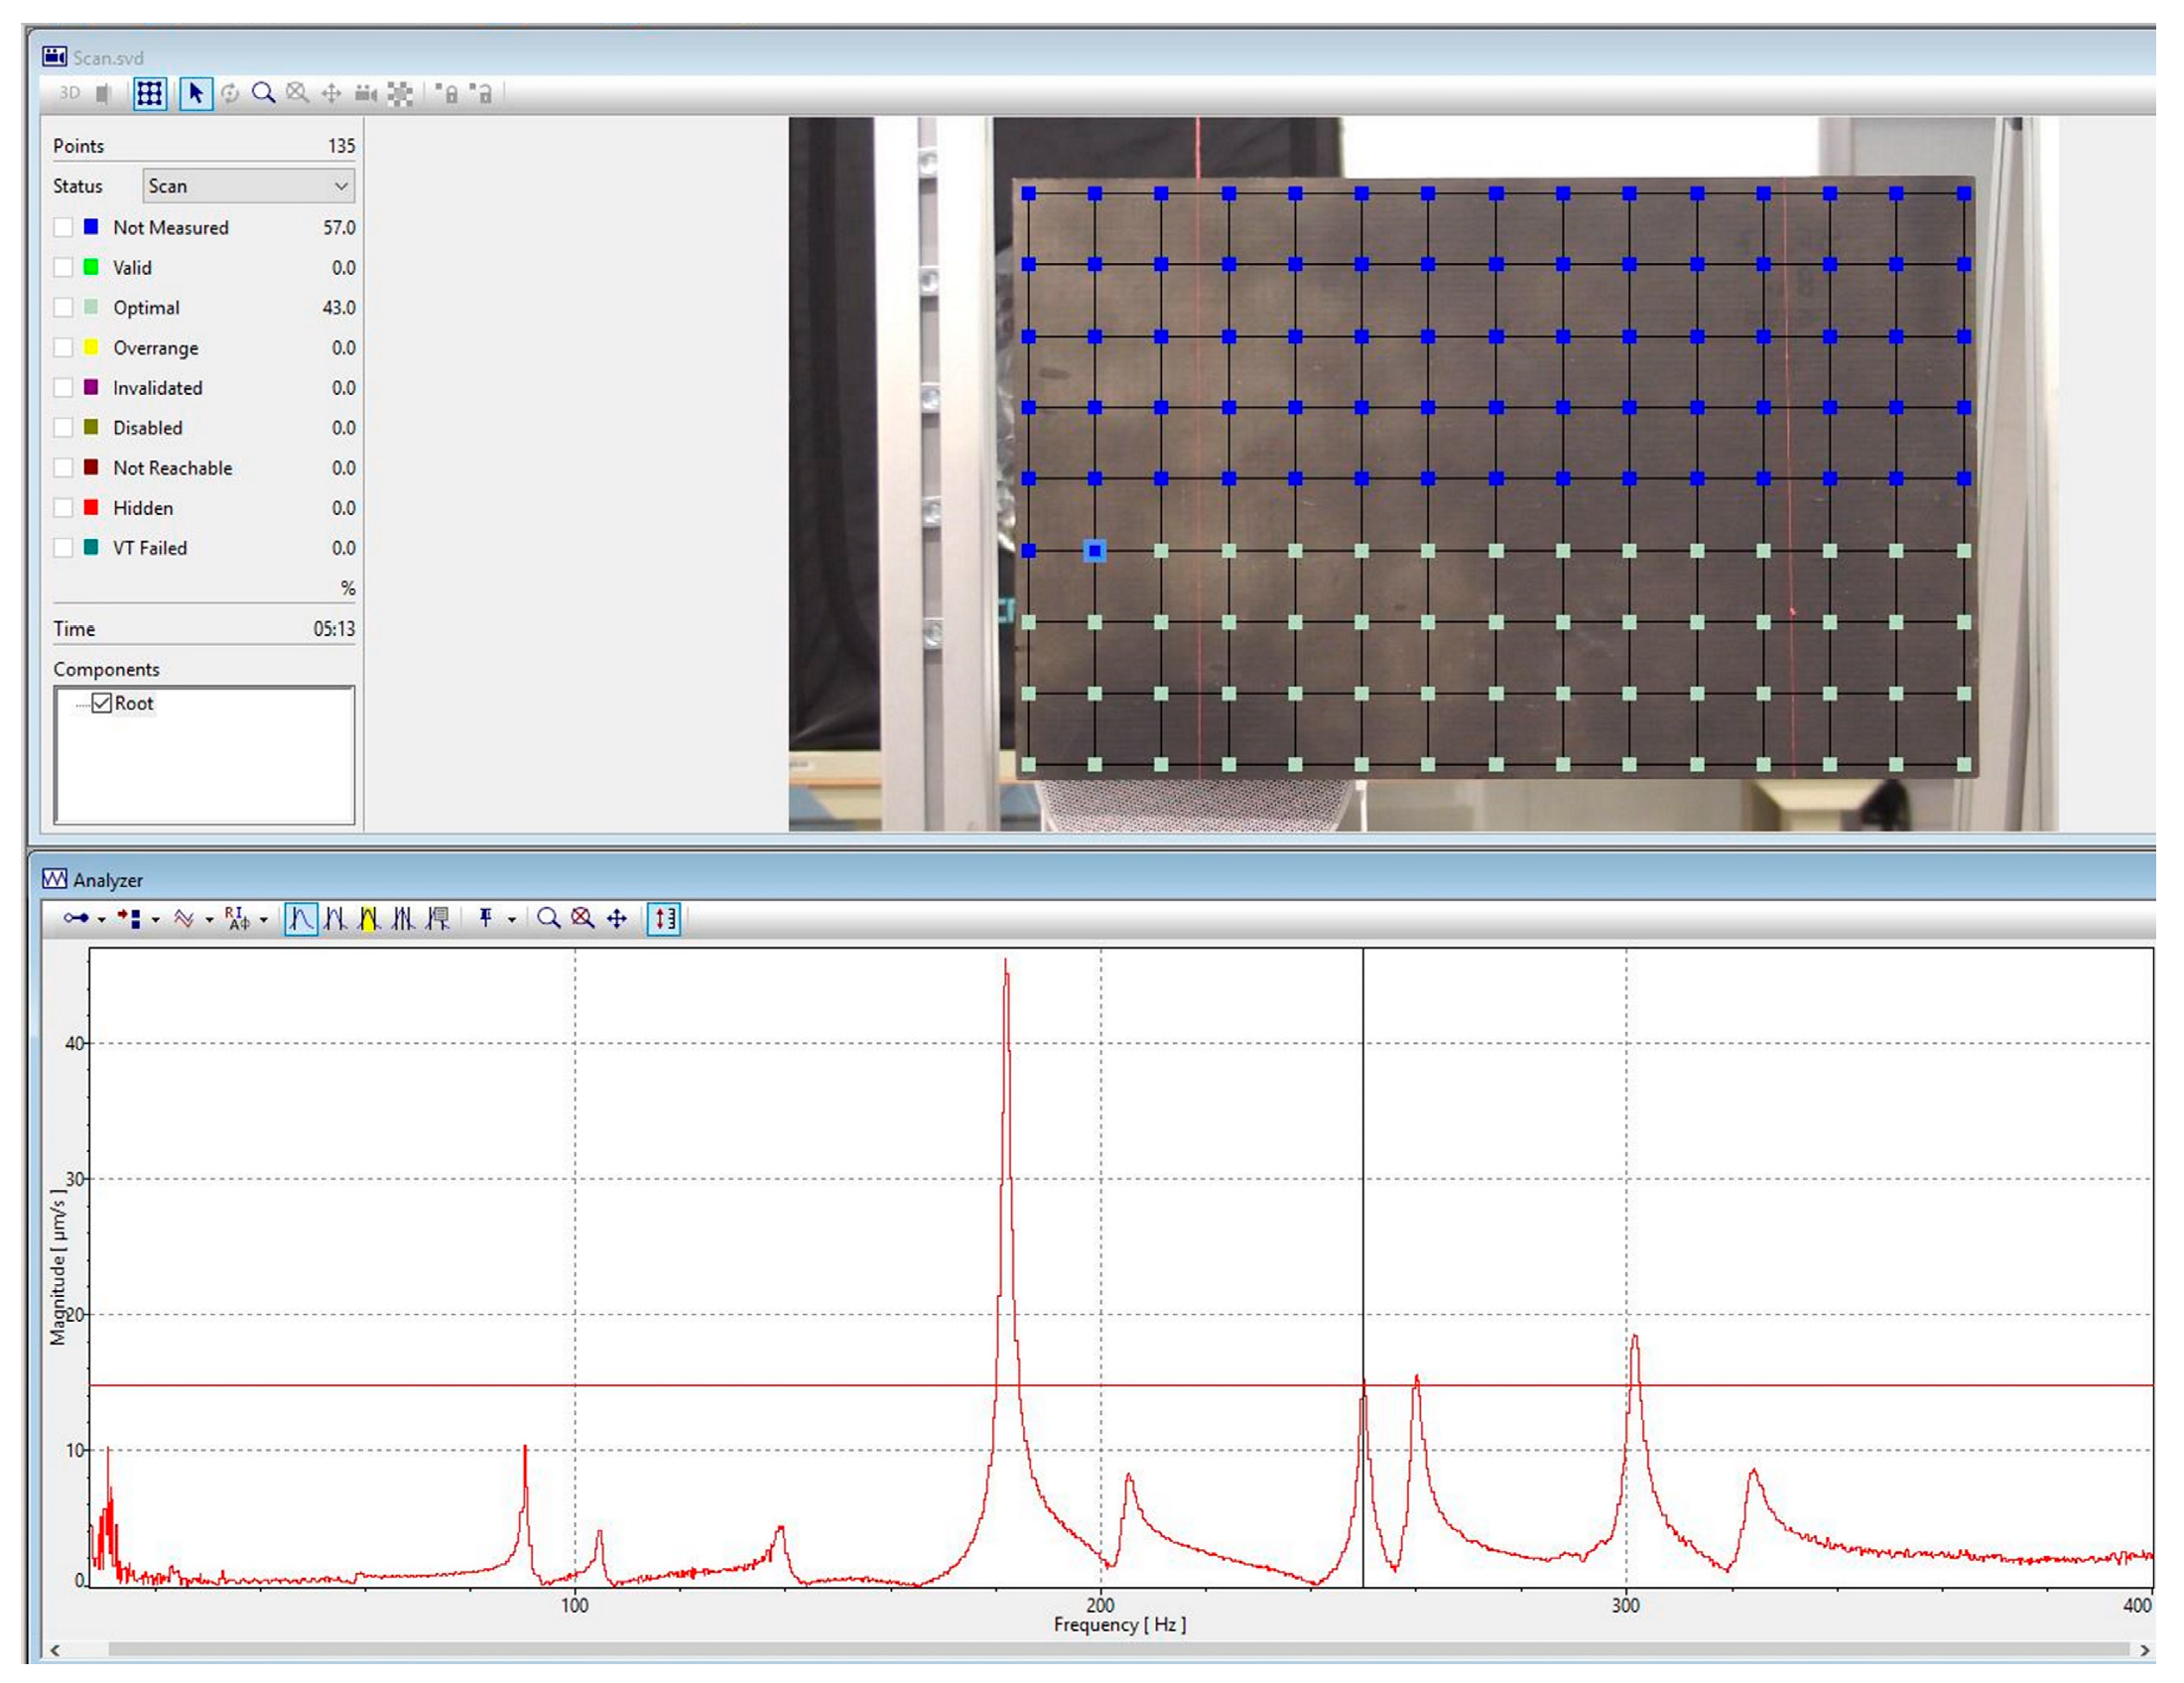
Before scanning the specimen, the surface is divided into a grid of points. During scanning, the laser beam moves sequentially along the specified grid of points. At each point, the vibration is measured depending on the exciting signal. Thanks to the grid on the surface of the scanning specimen, the shape of the natural vibrations can be seen. Before scanning specimens made using glass fibres, the surface is covered with a thin layer of black paint so that the laser beam does not shine through the specimens and does not create interference during scanning.
Figure 4 demonstrates an example of the amplitude-frequency characteristic of the specimen and the scanning grid. The smallest measurement step of 0.25 Hz in the Polytec laser vibrometer is used to determine the natural frequencies. The natural frequencies are determined by the peaks on the measured amplitude-frequency characteristic. To determine the elastic properties of the material, the first 12 natural frequencies and vibration modes are required. All measurements were performed under controlled environmental conditions: a room temperature of about 19 °C and a relative humidity of 45%. Each specimen was subjected to a single test.
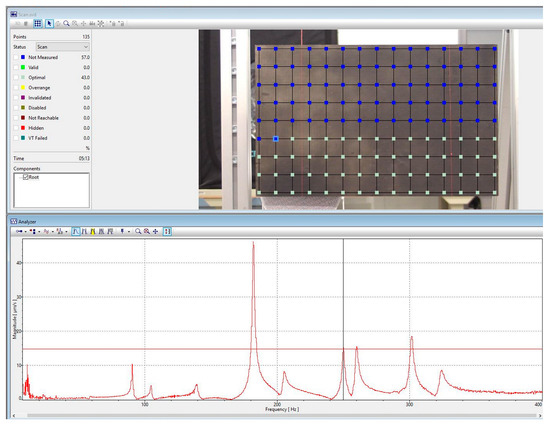
Figure 4.
Scanning grid and amplitude-frequency characteristic.
Dynamic characteristics such as natural frequencies are highly sensitive to experimental errors and the approximations in numerical models. These errors often arise due to poorly simulated boundary conditions, added mass of the sensors and actuators and measurement noise. Non-contact methods—like using a loudspeaker for excitation and a laser vibrometer for response measurement—help to eliminate mass-related distortions. Modern laser vibrometers also effectively suppress noise through built-in signal correction. To avoid stiffness and energy dissipation from clamping, the specimens are tested under free boundary conditions.
2.2.2. Calculated Responses
Having performed the experimental modal analysis of the specimen, an experimental plan is developed to determine the elastic properties of a monolayer of a layered composite material. The identified characteristics of the monolayer are subjected by the restrictions in the form of search range boundaries:
In the calculations performed, the limitations may be within the range of ±10% to ±30% for some a priori values of the elastic characteristics of the material, assigned on the basis of literary or estimated data. During the determination of the material properties, the range limit may be reduced or changed to determine a more precise value of the elastic properties of the material under study.
Having determined the boundaries of the elastic characteristics of the material under study, a Latin Hypercube (LH) type experiment plan is constructed. This model-independent approach was originally proposed by the authors of Refs. [21,38].
The initial inputs for developing the experimental plan are the number of factors and the total number of experiments . The experimental points are distributed within the factor space as uniformly as possible to ensure a balanced coverage of the domain. For this reason, the following criterion is used:
where is the distance between the points having numbers and (). Physically, this corresponds to the configuration that minimizes the potential energy of repulsive forces between unit-mass points, assuming that the magnitude of these forces is inversely proportional to the distance between the points.
The plan of the experiment is characterized by the matrix of plan . The domain of the experiments is determined as and the points of the experiments are calculated by the following expression:
Here, and .
After constructing the experimental plan, a finite element model is developed for conducting computational modal analysis. The problem is solved by the finite element method (FEM) in the ANSYS Mechanical APDL 16.2 software package. The layered 8-node shell element SHELL 281 is used to model the composite specimens. The free–free fixation conditions, as in a real experiment, are applied. Before numerical calculations, the mesh convergence analysis was carried out to obtain the results with acceptable accuracy. Finite element calculations for determining the natural frequencies and modes of vibrations were performed at each point of the experimental plan.
The calculation of modal analysis without taking into account damping using the FEM can be written in matrix form by the equation:
where and are the matrices of mass and stiffness, respectively, and and are the vectors of displacements and accelerations at the nodes of the finite element model, respectively.
The calculation of natural frequencies and vibration modes (where k is the mode number) reduces to an algebraic eigenvalue problem [39]:
The stiffness matrix is calculated through the components of the tensor of elastic constants , which, in turn, for the considered case of an orthotropic layer under a plane stress state are determined through the identifiable technical characteristics of elasticity.
Having performed the calculation at each point of the experimental plan, approximating frequency functions are constructed for each modal form. The approximation equation is described by a second-degree polynomial equation:
where is the response, and are the variables, is the constant coefficient, , and are the linear, quadratic, and interactive coefficients, respectively, and is the number of the factors.
Adequacy of the approximation equations is evaluated using ANOVA, along with the help of the coefficient of determination and adjusted coefficient of determination . These coefficients allow understanding the goodness of the model’s fit. The coefficient of determination is calculated as
where is the residual sum of squares, is the total sum of squares, is the actual observed values, is the predicted values from the model, and is the mean of the observed values.
In cases where the number of fitting coefficients is less than the number of experimental runs , the quality of the approximation can also be evaluated using the adjusted coefficient of determination:
The coefficients of determination presented for regression model validation have to indicate the high model reliability and be close to 1.
The application of ANOVA allows us to evaluate the significance of the coefficient terms in the approximation equations. In ANOVA, the -value helps determine whether the differences between group means are statistically significant. Using the 5% significance level, a model was considered significant if < 0.05. Thus, all estimates were considered simultaneously to evaluate the accuracy and reliability of the regression models developed.
At the last stage, the problem of determining the properties of the elastic characteristics of a monolayer in a composite material is solved. The identification problem is considered as optimization with a target function, which is the sum of the squares of the differences between the experimental and calculated values of natural frequencies (obtained from the approximation equations), corresponding to the same natural vibration modes of the specimen:
2.3. Tension Experiment
The mechanical properties of the material are the elastic characteristics determined based on the experimental modal analysis, which ensures their compliance with the dynamic parameters of the material. In order to compare the obtained values of elastic characteristics, a static evaluation of the material was carried out by means of tensile tests, since this method is generally accepted and widely used in practice to determine the mechanical properties of materials.
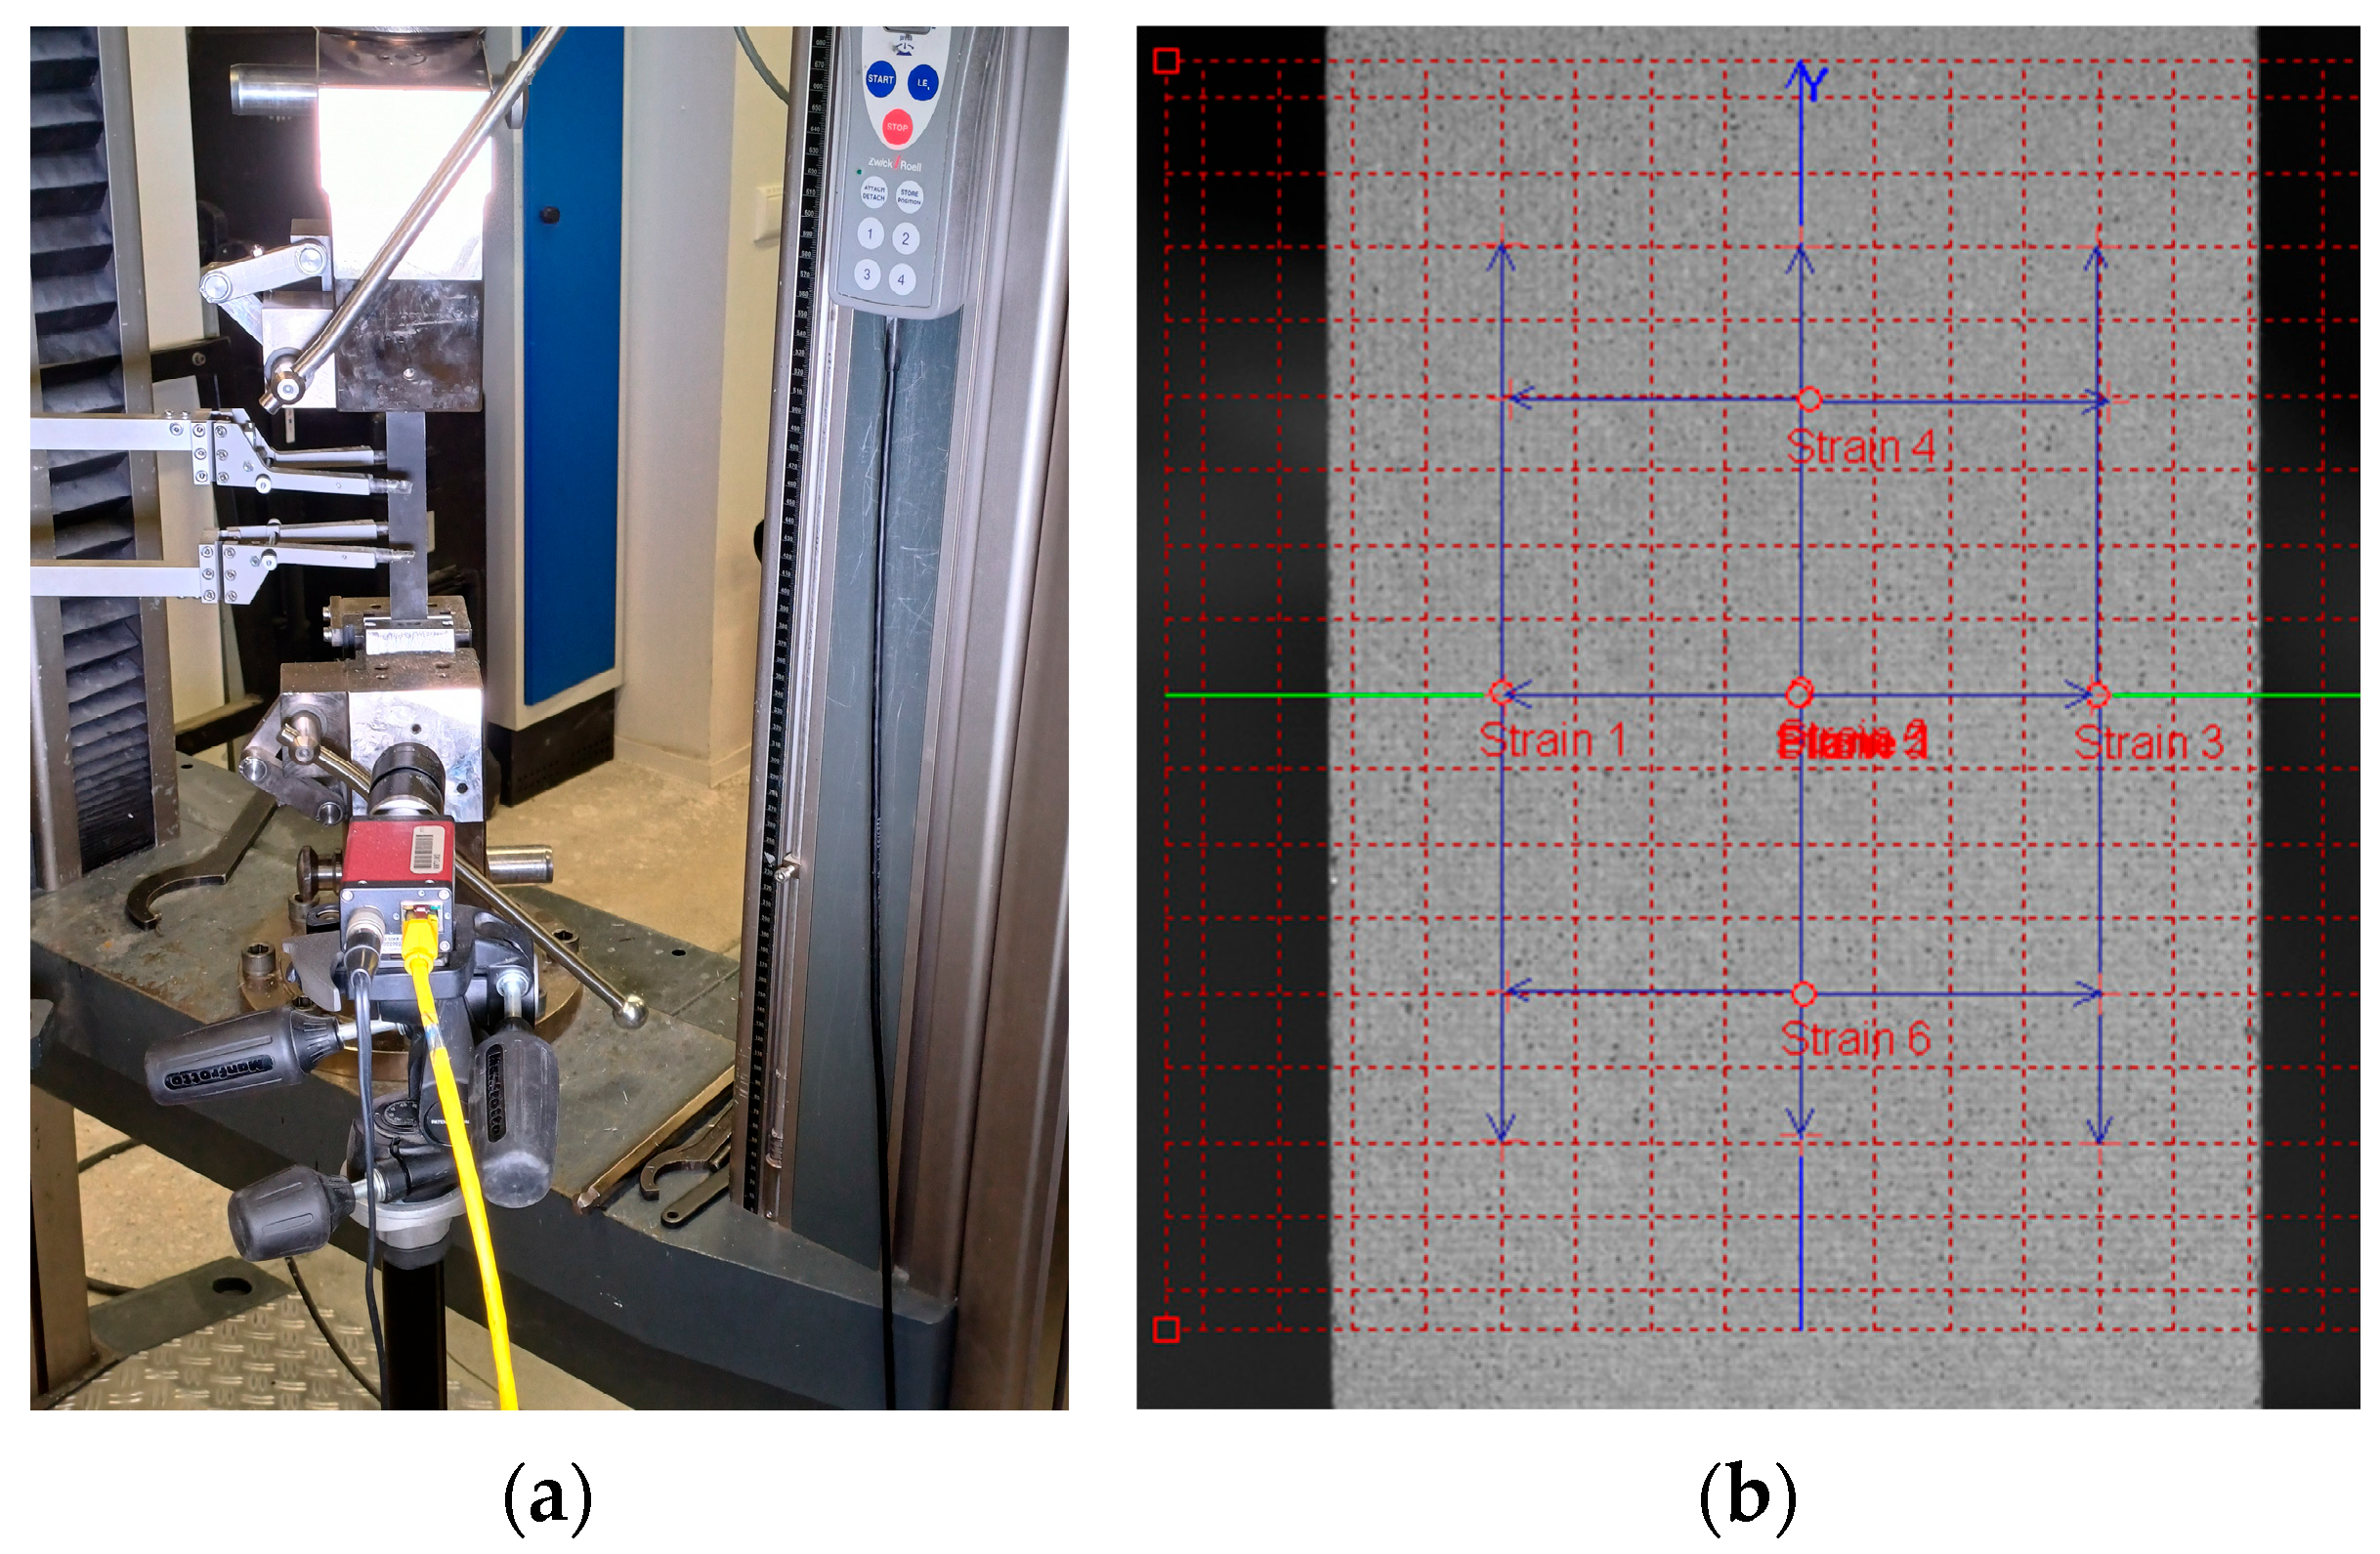
Tensile tests were carried out according to ASTM D 3039 standard [40] on Zwick Z100 equipment (Ulm, Germany) at the rate of 3 mm/min and temperature of 25 °C (Figure 5a). The strains were measured using the extensometer of the ZWICK testing machine and by Imetrum contactless video extensometer (Bristol, UK), which allows for highly accurate strain measurements without physical interaction with the specimen (Figure 5b). Figure 5b shows that strains were measured at three locations, both along and across the specimen, to determine Poisson’s ratio. This enables a comparison of the results obtained from the three measurements. This is important when working with composite materials, where contact methods can affect test results.
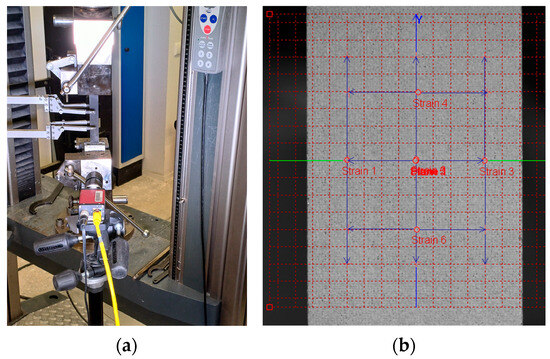
Figure 5.
Set-up tension test: (a) Zwick Z100 with video gage camera; (b) longitudinal and transverse strain measurements using Imetrum.
The ultimate tensile strength , longitudinal tensile modulus , and Poisson’s were calculated as
where (in N) is the maximum force that caused failure, (in mm2) is the cross-sectional area, (in MPa) and are the increments of longitudinal stress and strain, respectively, and is the increment of transverse strain measured at the linear section of the stress–strain curve.
2.4. Flexural Experiment
The mechanical properties of polymer composite materials are often the main ones, since in almost all applications, composite material products are subjected to force loads. Using the determined properties of the elastic characteristics of the composite monolayer, numerical and natural experiments are carried out on the specimens of layered composite material for three-point bending. The force-displacement diagrams obtained were compared.
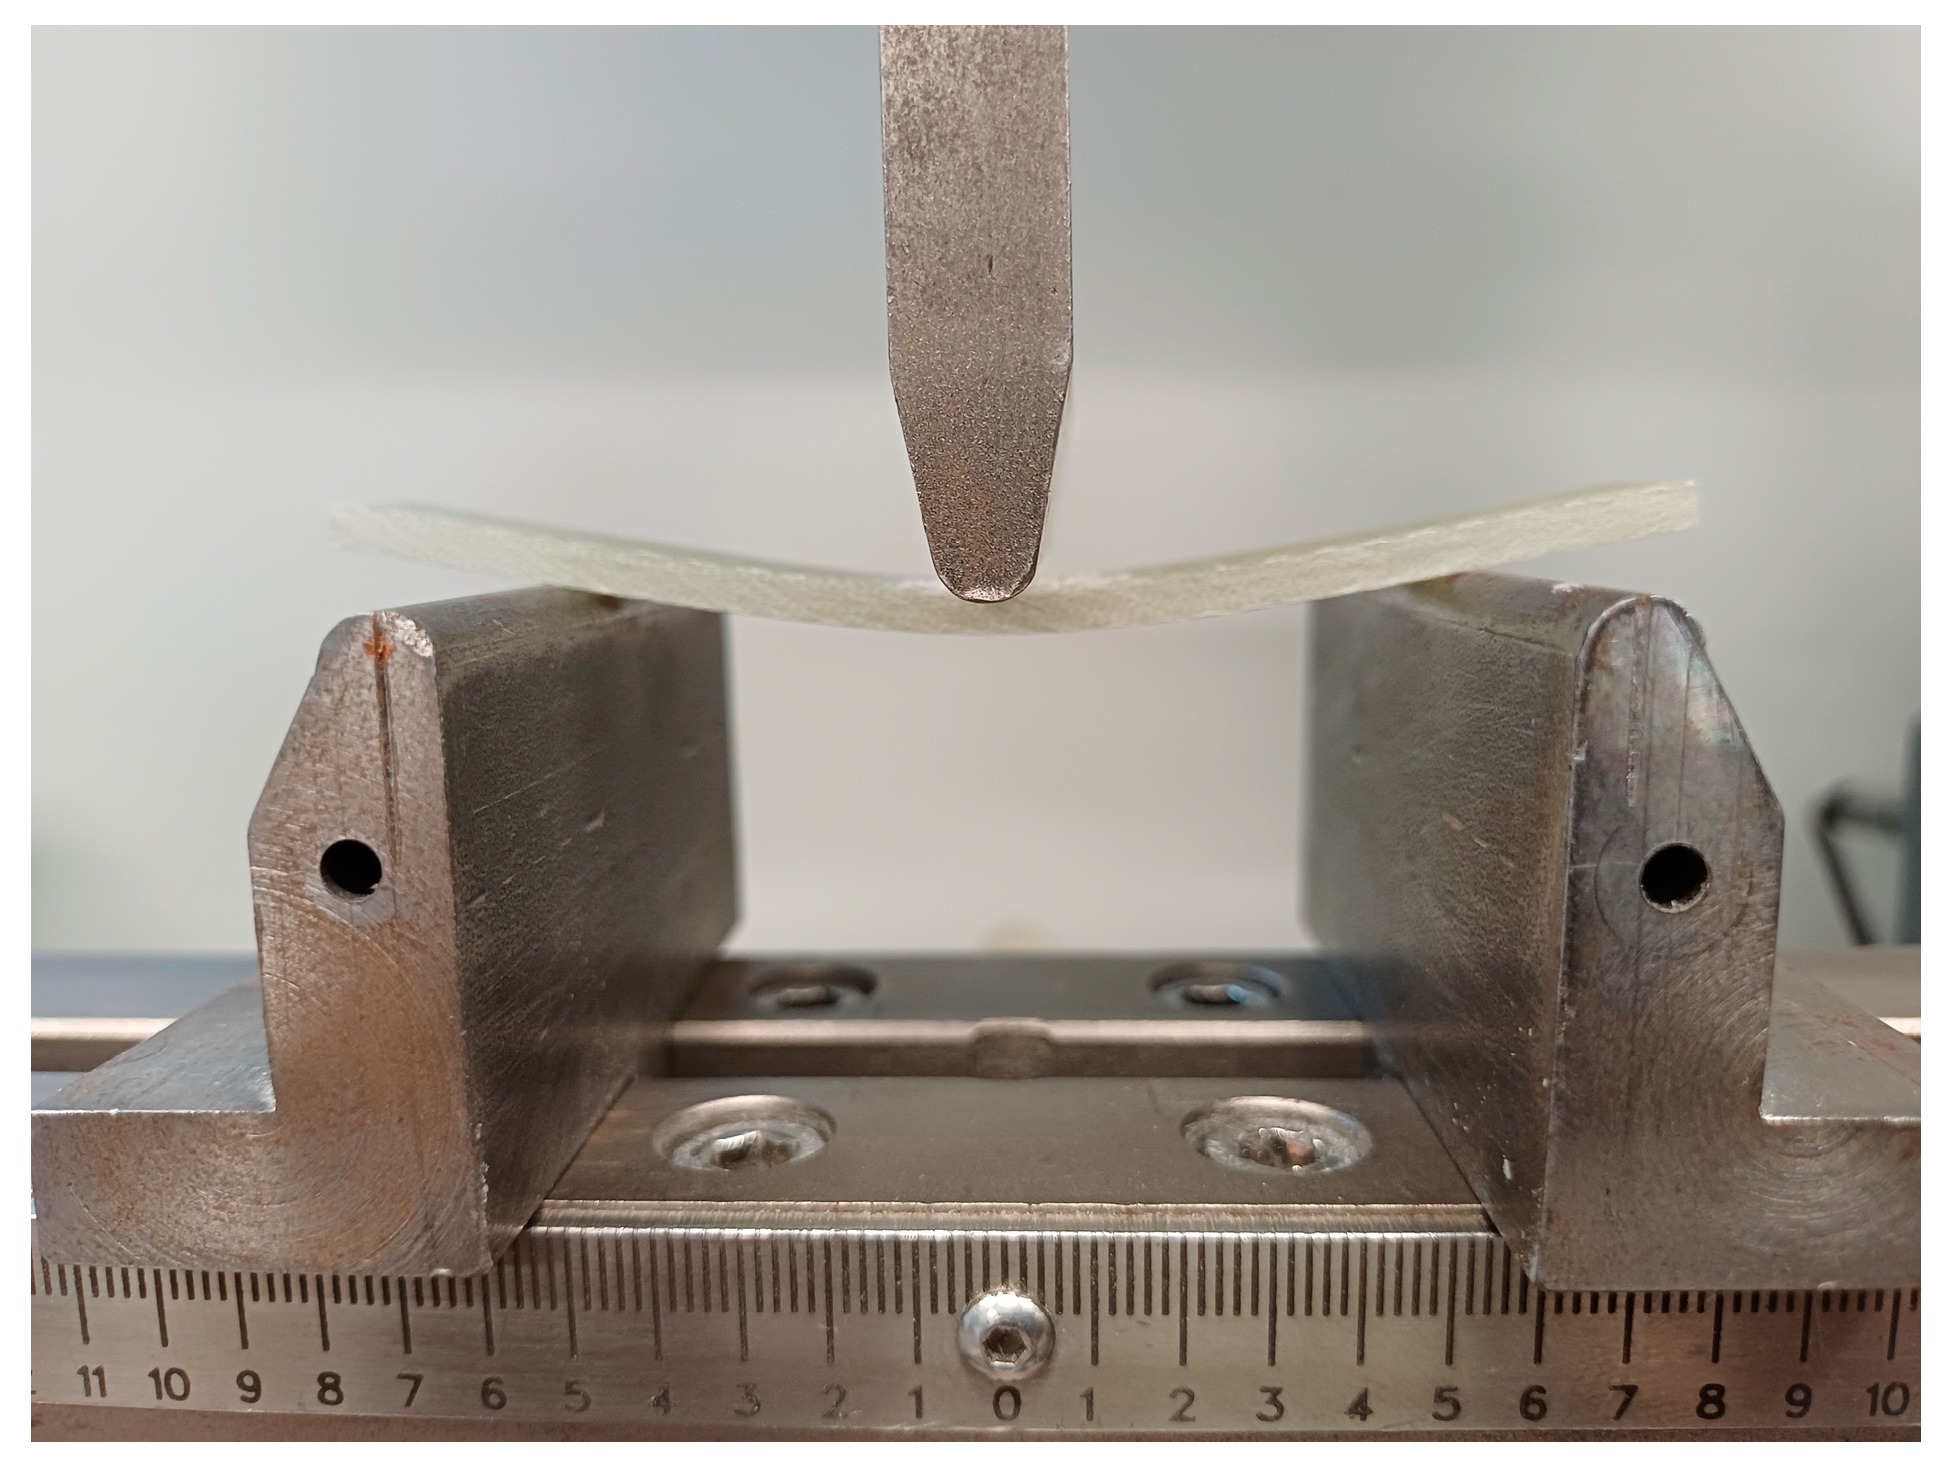
Three-bending tests were carried out according to the ASTM D790 standard using an Instron E3000 testing machine (Instron, Norwood, MA, USA) at a room temperature of 25 °C and a crosshead rate of 3 mm/min (Figure 6). Figure 6 illustrates a specimen made of glass-fibre plate during the three-point bending test. According to the recommendation of the ASTM D790 standard, the span-to-thickness ratio was chosen, . The resulting values of the bending test are the averaged results of five repeated tests [41].
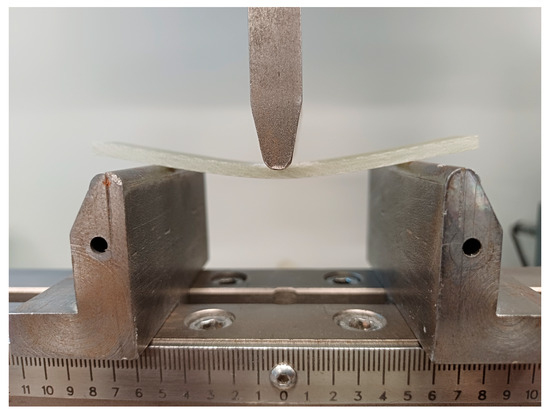
Figure 6.
Set-up flexural test.
3. Results and Discussion
3.1. Virtual Test Identification Results
To study the influence of each parameter of the composite material properties on the frequency response and its exclusion from the experimental plan for real specimens, a virtual experiment was carried out. The virtual experiment allows us to develop a method for determining the elastic characteristics from frequency analysis, as well as to study the influence of the elastic characteristics of a monolayer on the frequency response. The properties of the material for the virtual experiment are taken from the publication [42].
The dimensions of the composite plate are 400 × 250 mm. The plate consists of 8 single layers whose total thickness is 1.36 mm. The density of the plate is = 2000 kg/m3. To determine the elastic properties of a multilayered fibreglass composite, an experimental design was developed that included six variables: Young’s moduli (, ), shear moduli (, ), and Poisson’s ratios (, ). The boundaries of the experimental design and the characteristics of the test specimen are presented in Table 1. The material is the twill-weave glass fibre fabric-reinforced composite.

Table 1.
Borders of design experiments and the elastic properties of the used composite material.
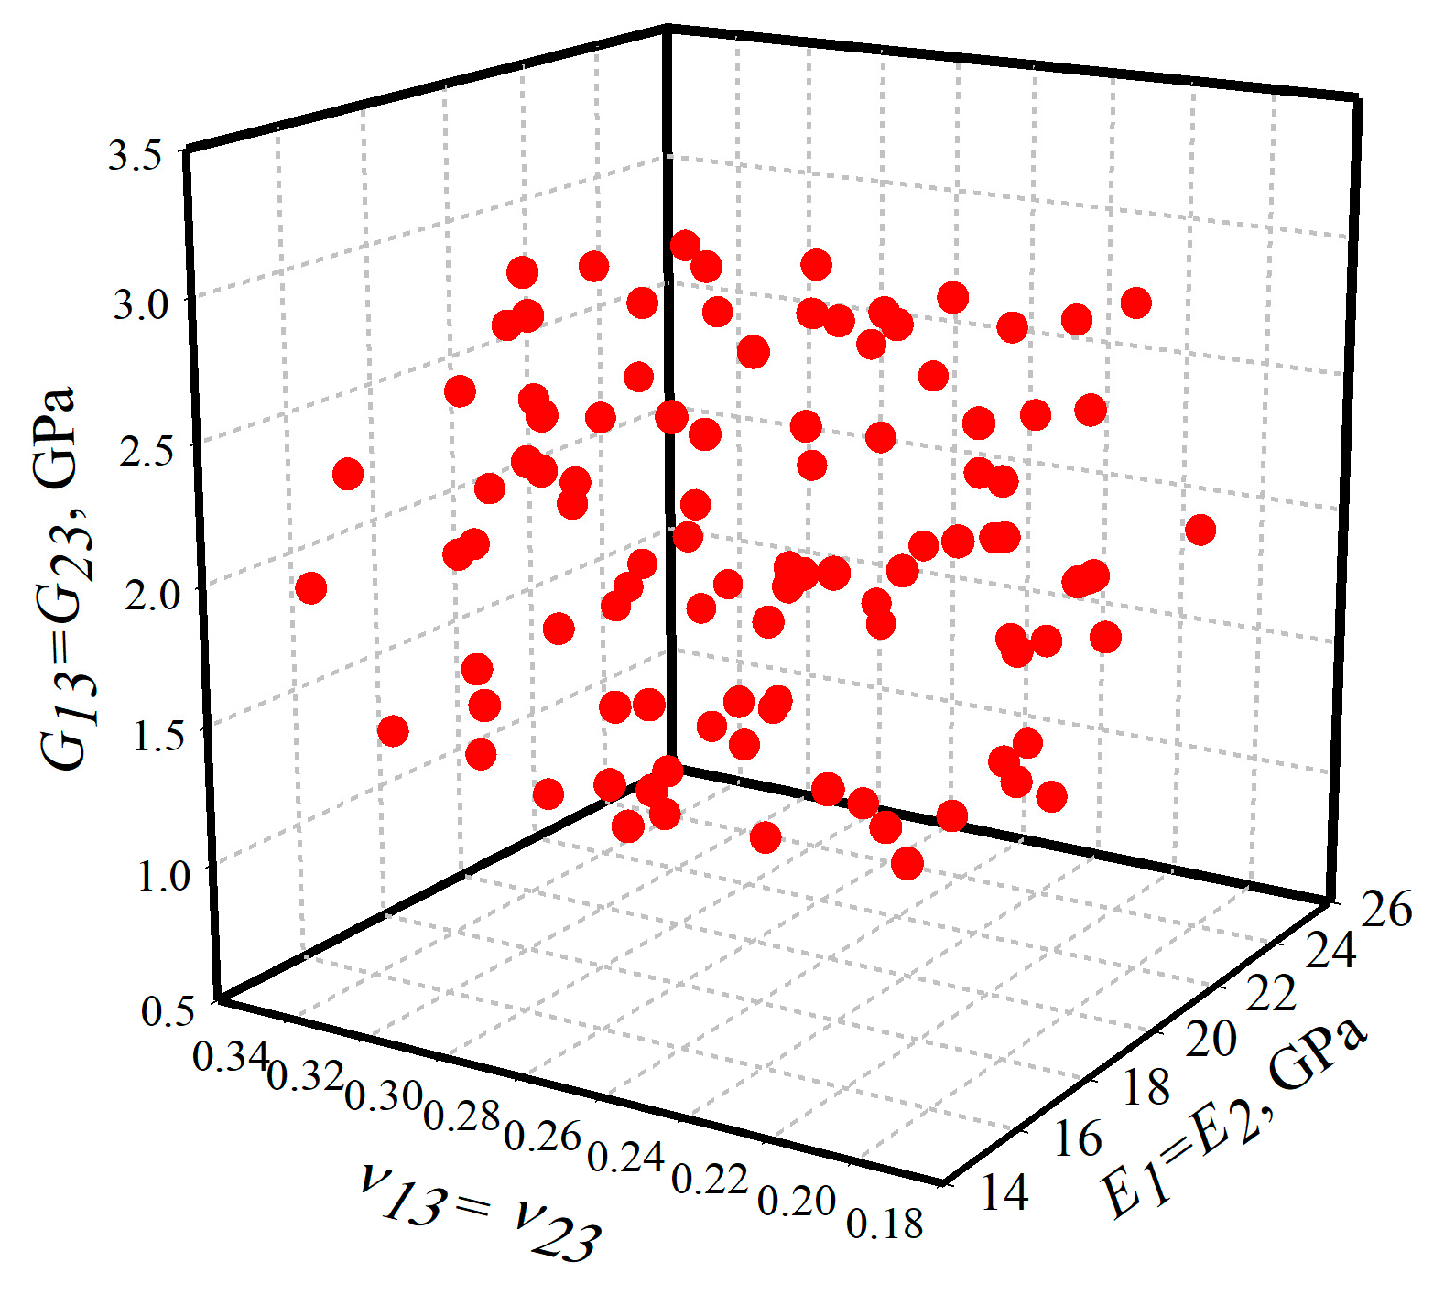
Six identification variables were applied by Latin Hypercube (LH) using the EdaOpt programme (RTU, Riga, Latvia) [43]. The design consisted of 101 runs. Depending on the accuracy of the obtained values of the material properties, the number of experiments and the boundary of the experimental plan may change during subsequent recalculation. An example of the experimental design is presented in Figure 7.
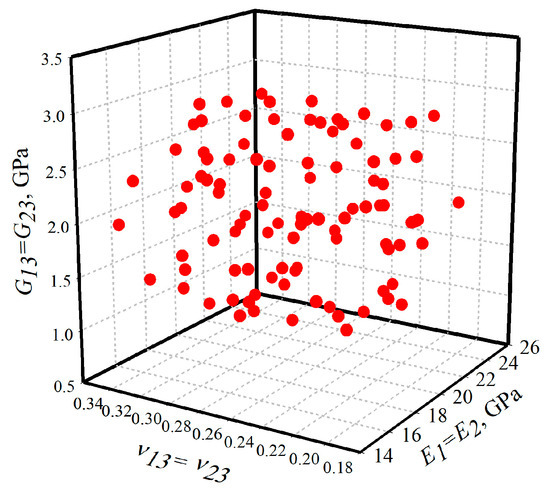
Figure 7.
Design of experiment: 3D view.
In the first step, a virtual experimental modal analysis of the composite plate is carried out and the natural frequencies and vibration modes are determined using the material properties of Ref. [42]. In the range up to 200 Hz, 12 natural vibration modes and corresponding frequencies were identified (Table 2). Among them, five are bending and seven are torsional modes. Natural vibration modes are characterized by a pair of parameters (, ), where is the number of half-waves along the short side of the shell, and is the number of half-waves along the long side.

Table 2.
Calculated mode shapes ( and natural frequencies and natural frequencies (in Hz) of the composite plate.
At the next stage, a finite element model is developed, and natural frequencies were obtained using material properties from the design of experiments. Numerical data of the natural frequencies obtained are used for building approximation equations. All frequency response data were analyzed using ANOVA and regression analysis to fit the linear model and evaluate the significance of the coefficient terms. The results are presented in Table 3. The goodness of approximation equations was inspected using the coefficients of determination. The results showed that the coefficients of determination for each approximation equation are very good and more than 99%.

Table 3.
Goodness of coefficient terms and approximation equations.
The influence of each parameter was evaluated based on minimal p-values (p < 0.0001) within a 95% confidence level. It is seen that the elastic constants E1 = E2 have a statistically significant effect on all the frequency responses. Poisson’s ratio ν12 has no effect on the first two frequencies that correspond to the first torsional and flexural mode shapes but has a significant effect on all other responses. Shear modulus G12 has no effect on the four frequencies that correspond to the 2, 4, 9, and 12 mode shapes. The remaining terms of the approximation equation, which include the thickness direction, were found to be insignificant.
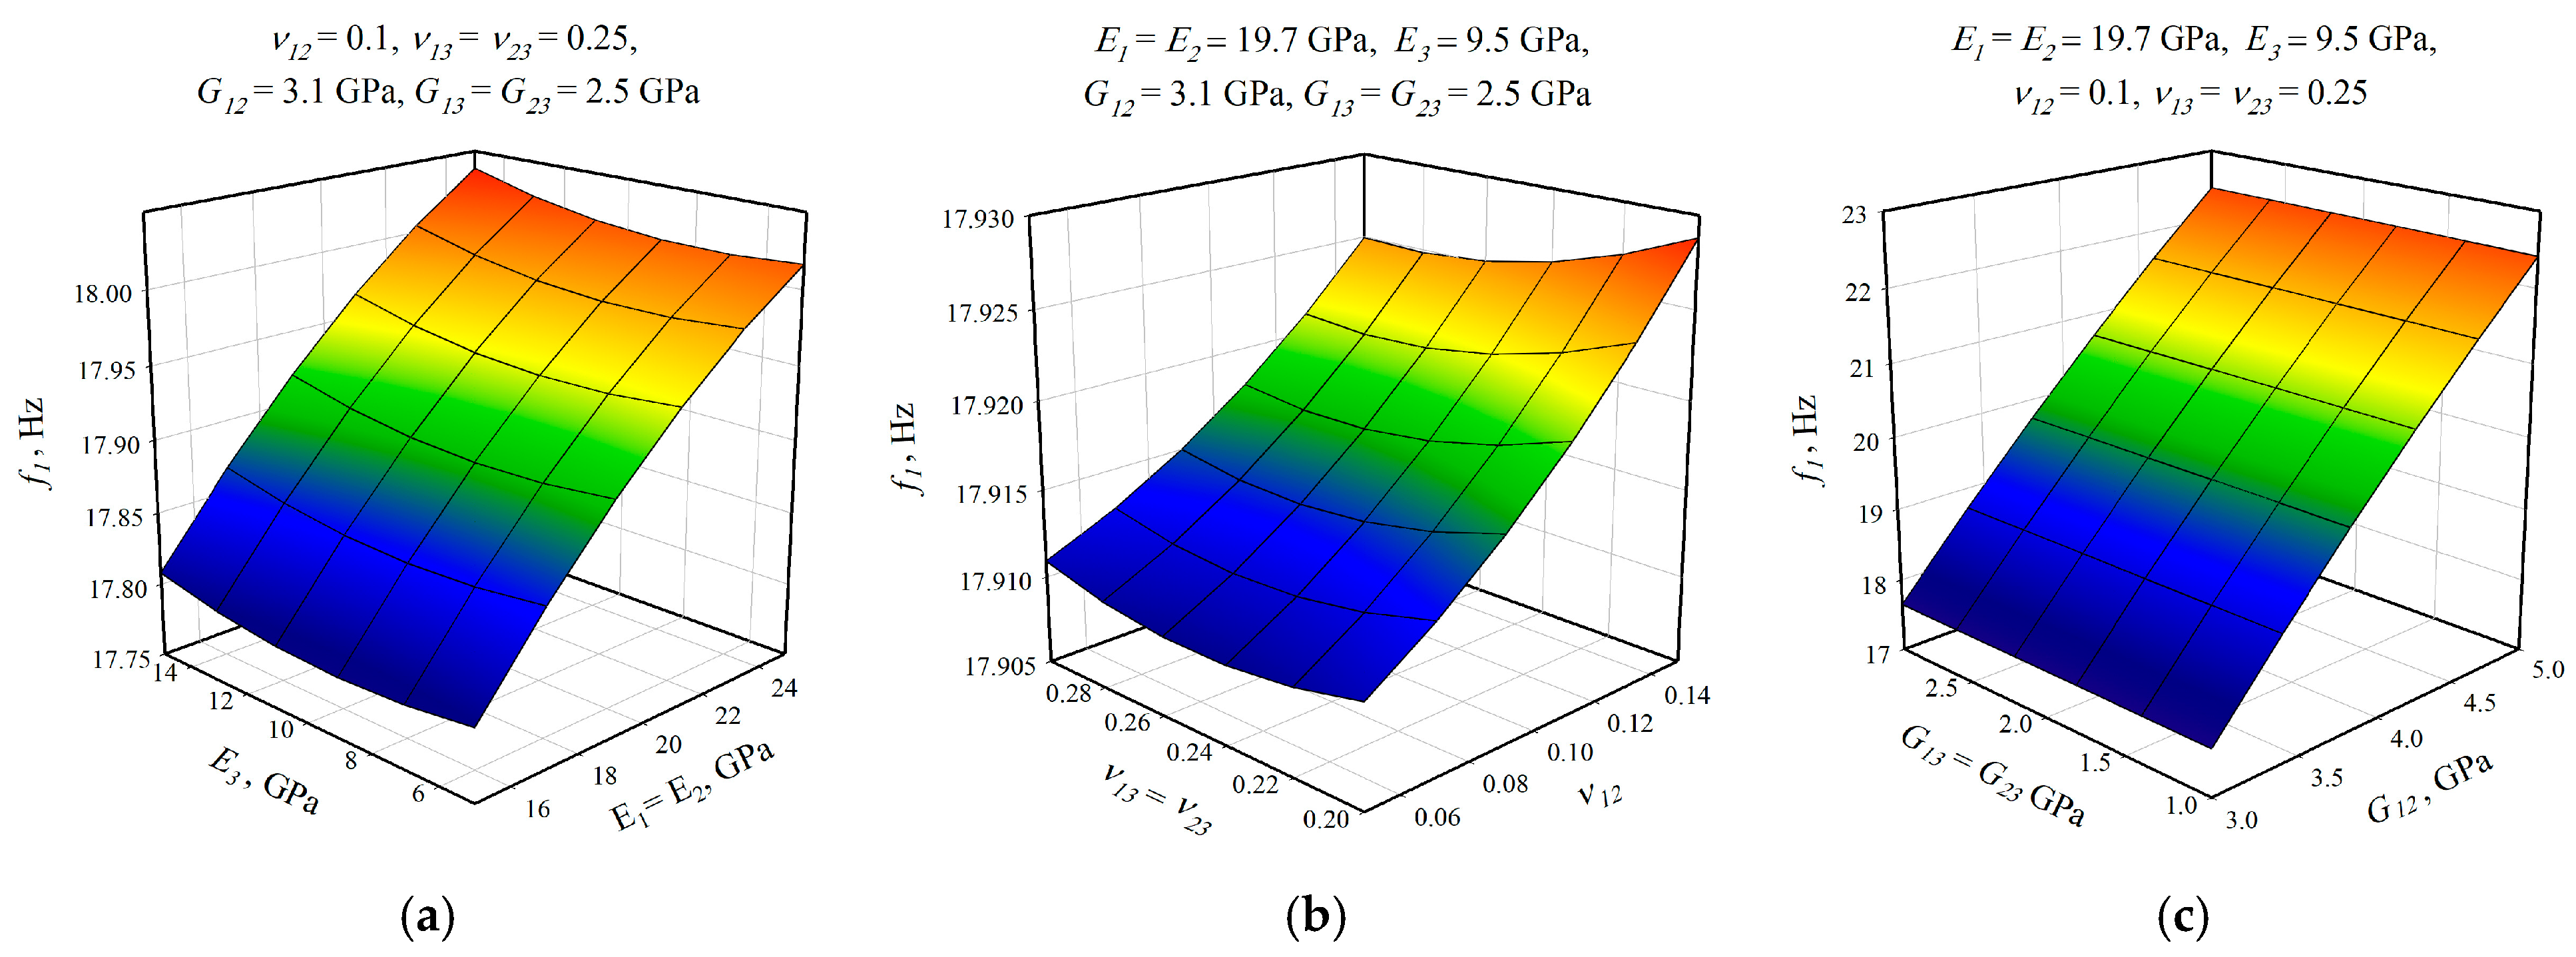
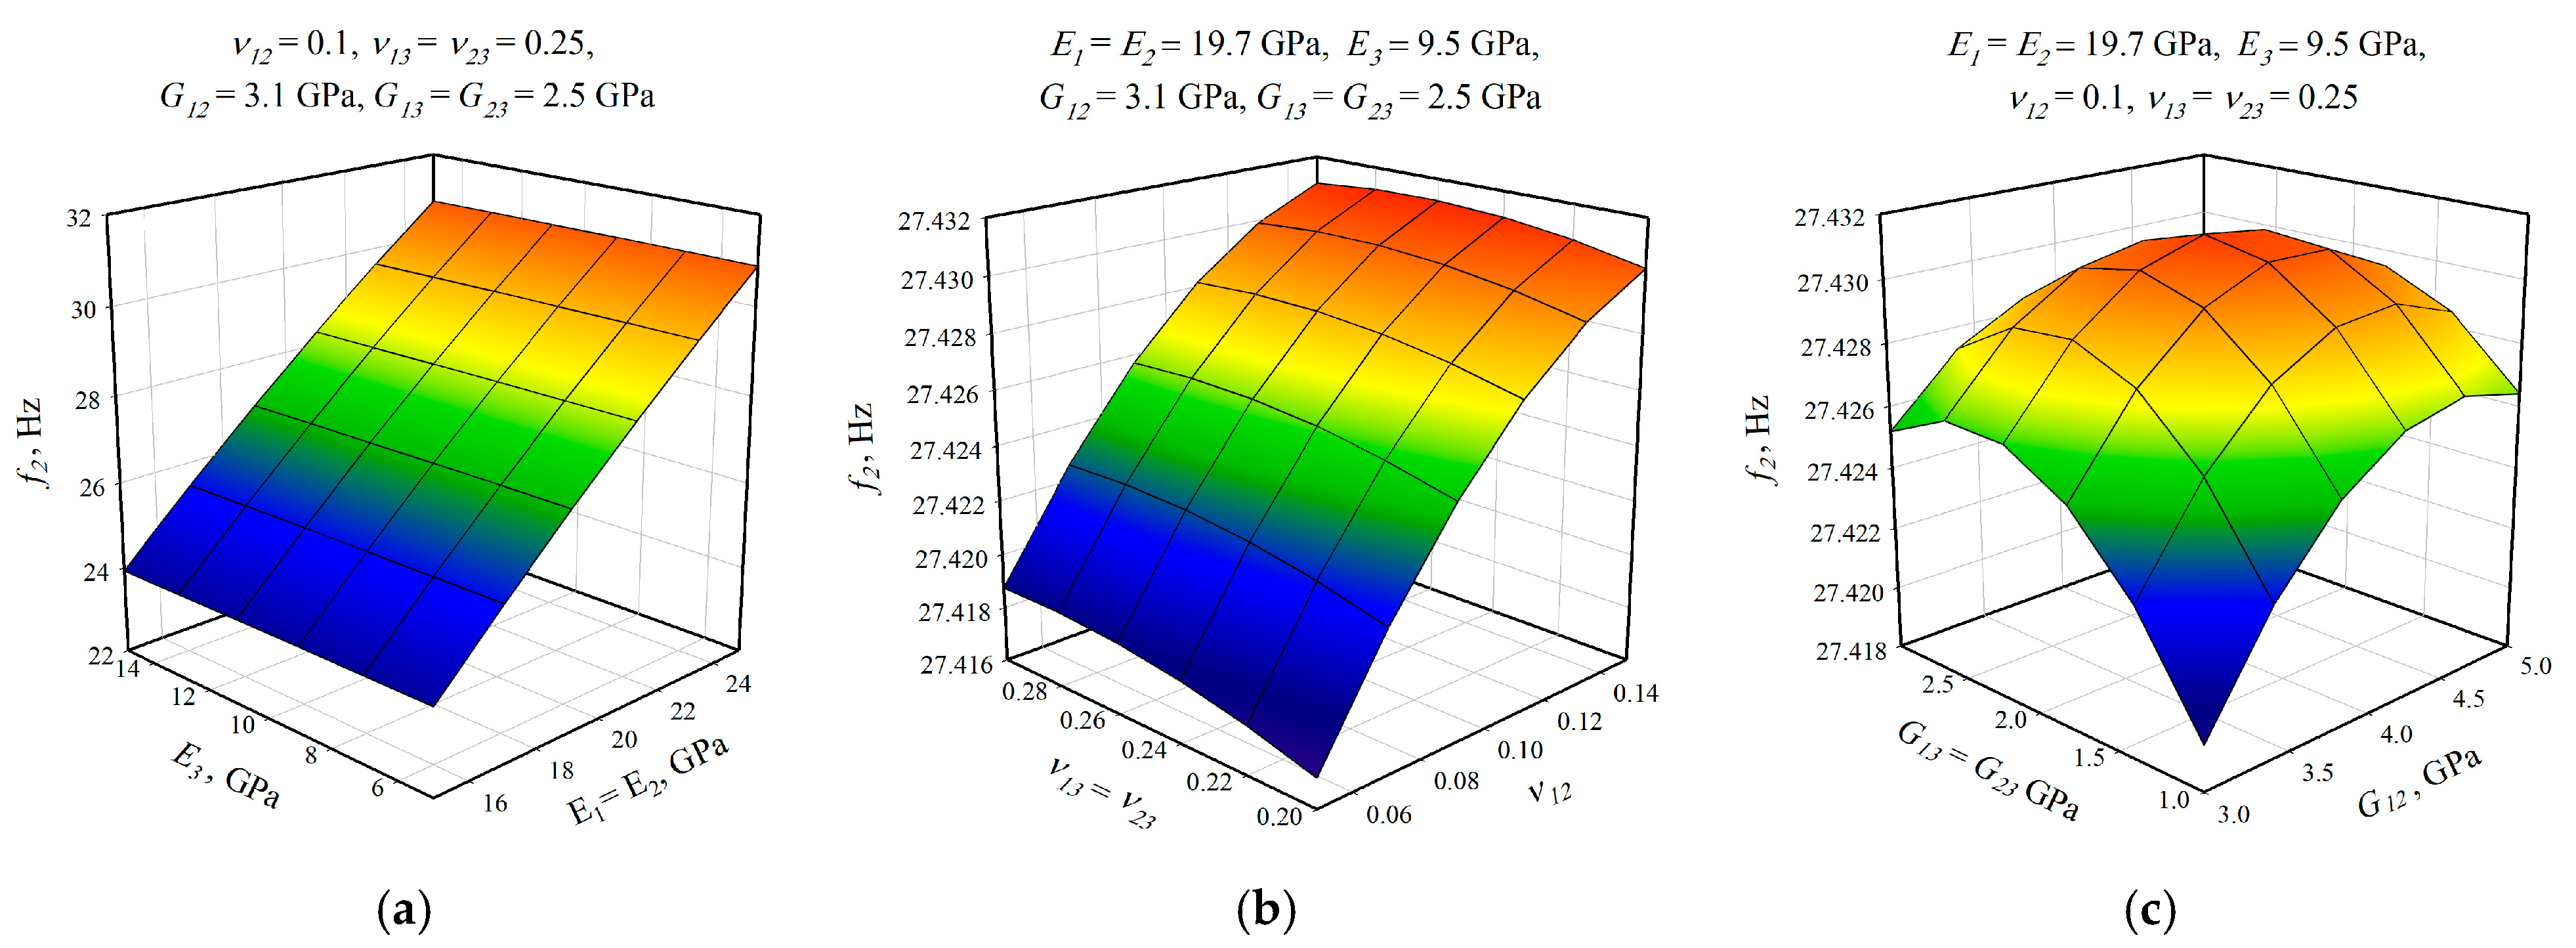
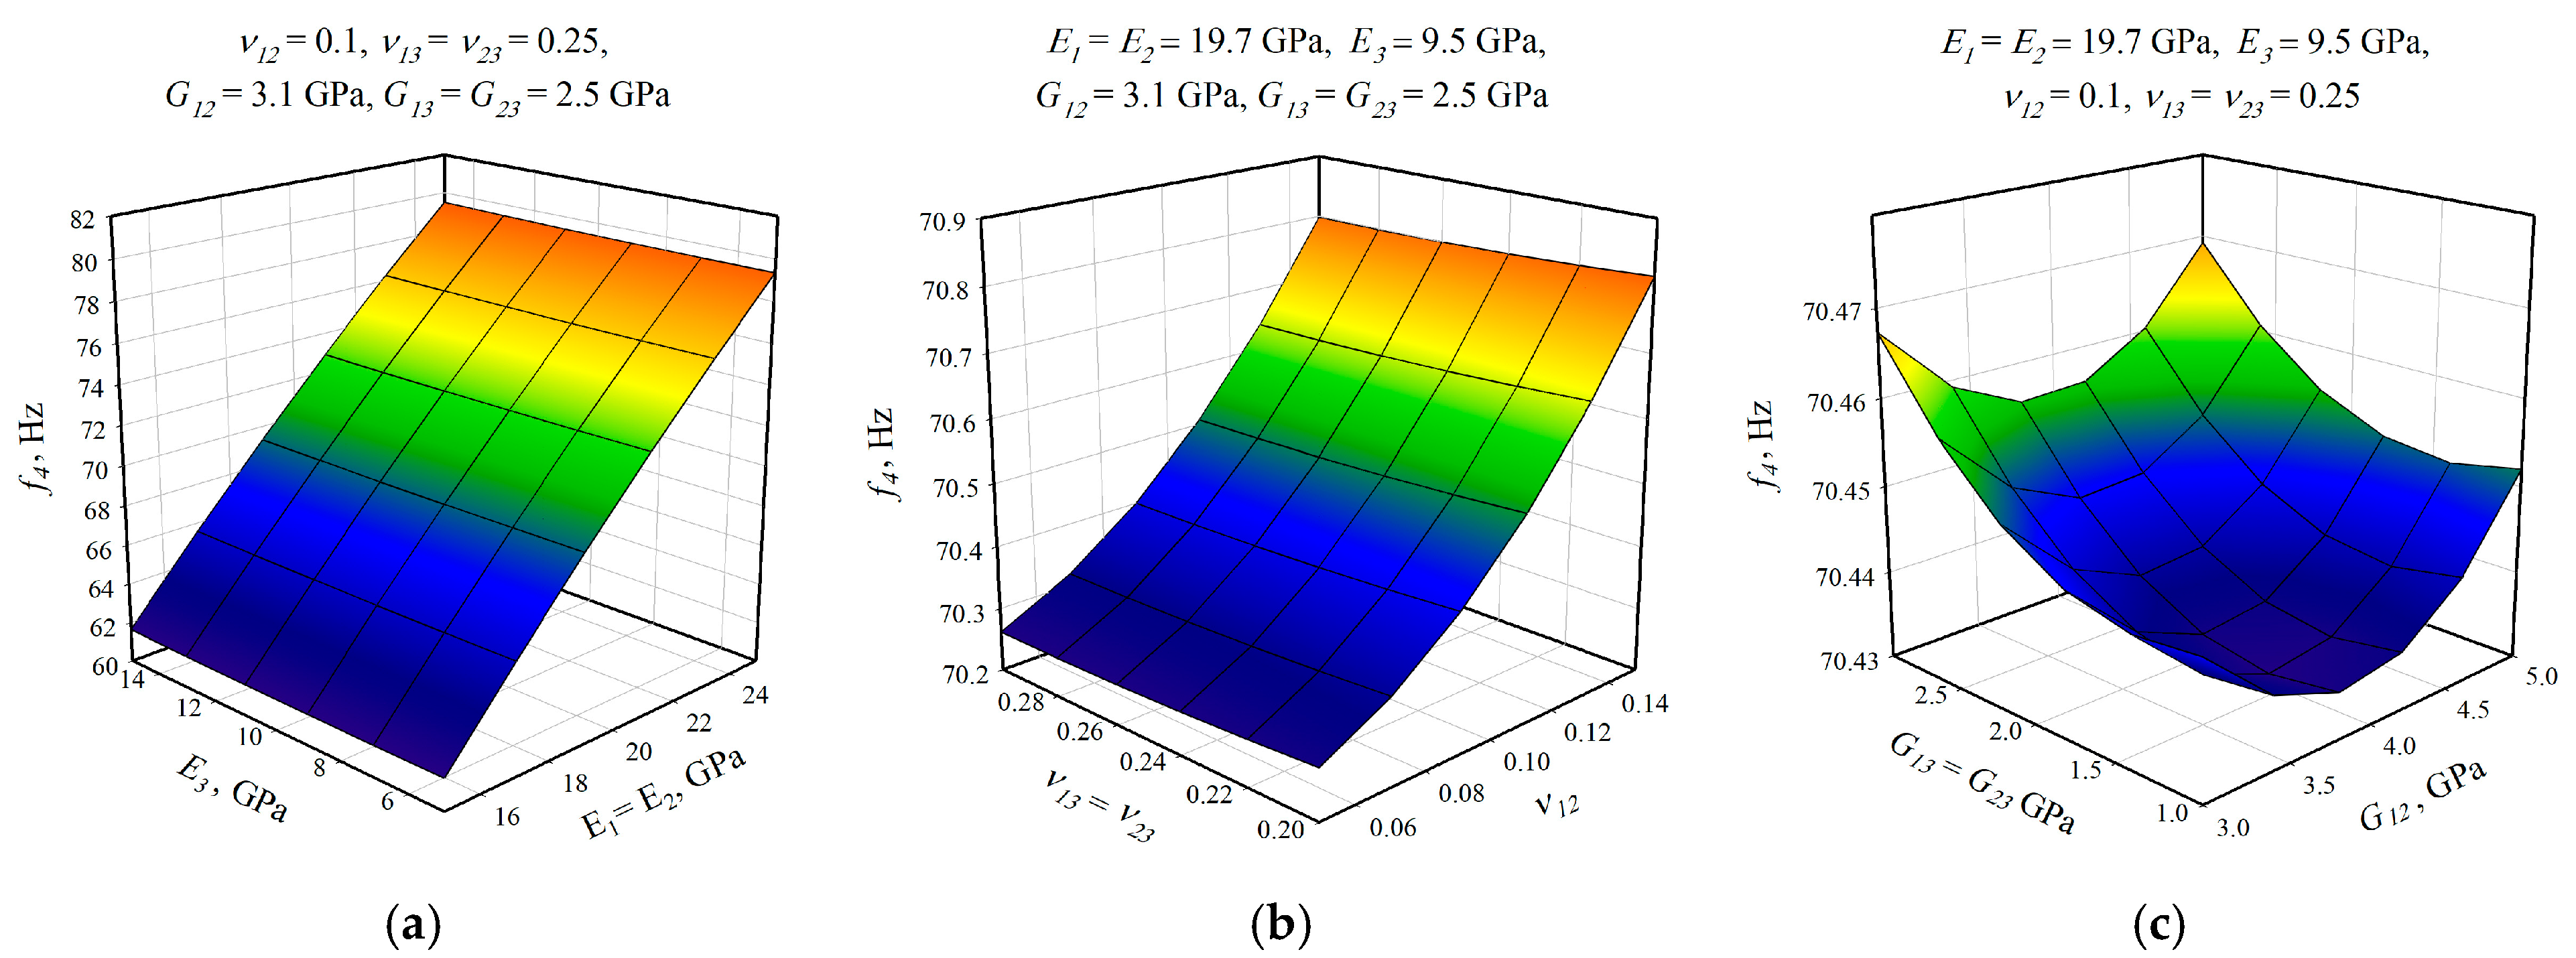
After the selection of the equation of regression, the parametric studies can be carried out additionally to study the influence of the design variables on frequencies. This can be performed by displaying 3D graphs of approximating functions. As an example, Figure 8, Figure 9 and Figure 10 present the results obtained for the 1st, 2nd, and 4th natural frequencies with different values of elastic properties according to three types of mode shapes. The first frequency corresponds to the torsional mode shape. The second and third frequencies correspond to the flexure mode shapes along the short side of the shell, and along the long one, respectively.
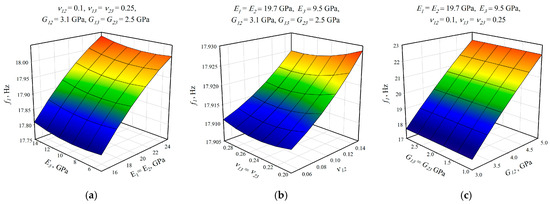
Figure 8.
Graphical illustration of the dependence of the 1st frequency on the elastic properties; (a) influence of Young’s modulus; (b) influence of Poisson’s ratio; (c) influence of shear modulus.
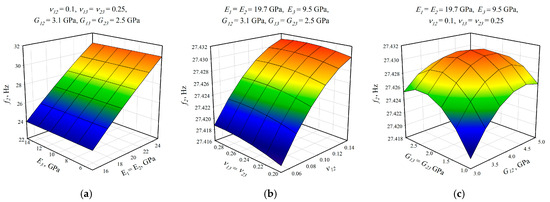
Figure 9.
Graphical illustration of the dependence of the 2nd frequency on the elastic properties; (a) influence of Young’s modulus; (b) influence of Poisson’s ratio; (c) influence of shear modulus.
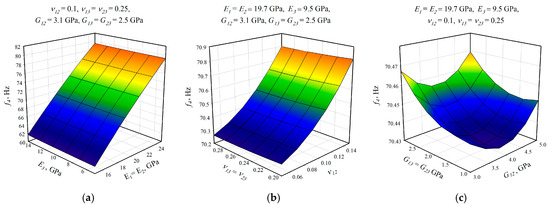
Figure 10.
Graphical illustration of the dependence of the 4th frequency on the elastic properties; (a) influence of Young’s modulus; (b) influence of Poisson’s ratio; (c) influence of shear modulus.
The value of the first torsional frequency begins to grow with an increase in Young’s moduli . Young’s modulus does not change significantly (Figure 8a). However, if we look at the frequency variation range, the changes are not significant. Figure 8b shows an increase in Poisson’s ratios but the frequency variation range also has a negligible effect. For the torsional mode shape corresponding to the 1st frequency, shear modulus has the greatest influence. The changes exceed 21%. For the bending mode corresponding to the 2nd natural frequency, the elastic moduli demonstrate the most significant influence (Figure 9a), with a variation of approximately 22%. A similar trend was observed for the bending mode of the 4th frequency, where again shows the highest impact, resulting in a frequency change of 22%. Other material properties did not exhibit such a pronounced effect on the frequency response.
Using the second-order approximation equations obtained, the identification problem for determining elastic characteristics was solved. Optimization of the objective function was performed using the EdaOpt programme. To solve this problem, the quasi-random search method was used in combination with finite element modal analysis [43,44]. Using the experimental data of the experiment, the objective function is solved as
Having calculated the sum of the squares of the differences between the experimental and calculated values of the natural frequencies using the approximation equations, we determine the elastic characteristics of the monolayer. The values of the initial experimental elastic characteristics and the calculated ones are presented in Table 4.

Table 4.
Comparison of virtual and identified values of elastic constants.
The residuals errors between the experimental and calculated natural frequencies are calculated by the expression
where are the experimental values of natural frequencies and are the values of the natural frequencies determined by the identification problem.
From Table 4, it is evident that the greatest discrepancy between the experimental and calculated values of the elastic characteristics of the composite monolayer was obtained for the elastic modulus and shear moduli . From Table 3, it follows that the value > 0.0001 for these parameters and the elastic characteristics obtained do not affect the frequencies in the approximation equations. Despite the fact that the Poisson’s ratios , as a result of the study of the parameters in the approximation equation, did not show an effect on the frequency response in this example, the experimental and calculated values coincided after identification.
At the last stage, the elastic characteristics of the composite monolayer determined were used for a comparative analysis of the natural frequencies and the corresponding modal forms. The results are presented in Table 5. It is evident from the table that despite the different values of and of the monolayer, the frequency values determined using the experimental and identification elastic characteristics do not exceed 0.02%.

Table 5.
Comparison of the virtual and calculated values of natural frequencies (in Hz).
3.2. Identification of Twill-Weave Glass Fabric-Reinforced Polymer
In the second part of the study, the numerical–experimental method of determining the properties of a layered composite plate is used to determine the elastic characteristics of a monolayer of material using three layered composite plates with different thicknesses as an example. The dimensions of the composite plate are 400 × 250 mm. The main characteristics of the specimens are presented in Table 6.

Table 6.
Description of the specimens.
To determine the elastic properties based on the results of the vibration tests of the specimens, an experimental plan was developed including three design parameters and 101 experiments. The plan included the following three parameters: Young’s modulus , shear modulus , and Poisson’s ratio . Some design parameters representing out-of-plane properties of the material cannot be determined from the results of vibration tests on thin specimens (see Section 3.1). Therefore, Young’s modulus , shear moduli , and Poisson’s ratios are taken as the constants. The average density of the plate is = 1760 kg/m3. The density of the plate is measured by hydraulic weighing. The thickness of the monolayers is 0.1760 mm.
The values of the constant parameters were taken from the virtual calculation (Table 1). It should be noted that in order to determine the elastic characteristics of a monolayer of woven composite material, it is necessary to know approximately the range of changes in the elastic properties of the composite material to draw up an experimental plan. After obtaining the first result, it is necessary to evaluate not only the determined values of the identified parameters, but also to evaluate the elastic characteristics, which are accepted as constant values. The borders of the design experiments are provided in Table 7. It can be observed that certain design parameters—representing out-of-plane material properties—remain constant, as they cannot be identified through vibration tests conducted on thin specimens.

Table 7.
Borders of design experiments.
Finite element modal analysis was performed for all points of the experimental design of each composite plate under study. The obtained first 12 frequencies were approximated by second-order polynomials. The ANOVA results of the experimental modal analysis performed on composite specimens are presented in Table 8. It can be seen that the approximation equations obtained have a high accuracy and meet all the reliability requirements set out in Section 2.2.

Table 8.
Goodness of coefficient terms and approximation equations of composite plates with different thicknesses.
Finally, approximation equations and experimental values of resonance frequencies were used in the error functional (Equation (9)). All vibration measurements were carried out at a room temperature of 27 °C on the same day. As a result of its minimization, the elastic characteristics of individual layers of the laminated material were determined. The characteristics of the composite material obtained by means of identification for each specimen are presented in Table 9.

Table 9.
Elastic characteristics determined by means of identification method.
The identified properties of the material are estimated by the values of the coefficient of variation CV, equal to the ratio of the standard deviation to the mean value. Values of CV, characterizing in this case the material properties of three specimens, do not exceed 6.84%. The largest error corresponds to Poisson’s ratio .
Verification of the material property values applied in the finite element analysis was achieved by comparing the calculated values of the vibration modes and natural frequencies with the experimental results. The relative errors between the experimental and numerical natural frequencies, characterizing the accuracy of the identification procedure, are presented in Table 10. The greatest discrepancy between the experimental and calculated values for all samples is observed for vibration mode 2 and amounts to 4.0% (16 layers composite plate). Differences between measured and identified vibration frequencies often come from issues during the specimen’s manufacturing. These include small mistakes like laying angle, the specimen not being perfectly flat, or its thickness varying from what the computer model expected.

Table 10.
Comparison of the experimental and identified natural frequencies (in Hz).
In Equation (9), it is important that the calculated and experimental values of the natural frequencies correspond to the same vibration modes. In more complex cases, the MAC matrix analysis can be used for this [45]. In the present work, the comparison of the calculated and experimental vibration modes was carried out based on the analysis of their animation representation. The patterns of vibration modes are presented in Table 10. These mode shapes were taken during the comparison of the experimental and identified natural frequencies from Table 11. Experimental and numerical mode shapes coincide for all three measurements and identifications.

Table 11.
Experimental and calculated vibration mode shapes (m, n) of the composite plates with identified elastic characteristic.
The differences in elastic modulus are particularly notable when comparing isotropic and layered composite materials. In isotropic materials, the elastic and flexural moduli are approximately equal due to uniform mechanical behaviour in all directions. However, in the layered composite materials, the difference between elastic and flexural modulus becomes significant. Some authors compare the identified elastic modulus with the elastic modulus determined only from tension tests. To compare the elastic characteristics of the composite plate material determined by means of the identification problem and using the results of modal analysis, the static tensile tests and bending tests of the specimens were carried out.
In tension tests, from each plate used for the experimental modal analysis, standard specimens of 250 mm in length and 25 mm in width were cut for static testing. During tensile testing, the extensometer gauge length was set to 50 mm. The average tensile properties (longitudinal elastic modulus and Poisson’s ratio ) were determined based on the results of nine repeated tests. The average results of the static tests are presented in Table 12 and compared with identified properties.

Table 12.
Comparison of elastic modules and Poisson’s ratio from the vibration and static tensile test.
In flexural tests, from each plate used for the experimental modal analysis, standard specimens of 90 mm in length and 15 mm in width were cut for flexural testing. The average flexural properties (bending modulus ) was determined based on the results of 5 repeated tests. The average results of the flexural tests are presented in Table 13 and compared with the identified properties.

Table 13.
Comparison of elastic modules from the vibration and flexural test.
4. Conclusions
The aim of this work was to determine the elastic characteristics of a layered composite plate made of twill-weave glass fibre fabric using an experimental modal analysis and identification procedure. Six elastic constants of a thin composite plate were used in this procedure: the elastic moduli along the warp and along the weft , the elastic modulus across the thickness of the plate , the shear moduli , , , and the Poisson’s ratios , , .
The effects of the elastic characteristics of the orthotropic composite plate on the frequency response of the cut-out specimen were estimated by using the virtual experiment method. The greatest influence on the natural frequencies of vibrations is exerted by the elastic moduli in the directions of the warp and weft , the shear modulus , and the Poisson’s ratio . Elastic characteristics characterizing the out-of-plane properties of the material cannot be determined from the results of the vibration tests of thin specimens. These characteristics in the identification problem have to be specified as constant values.
The identification methodology was tested on three specimens of twill-weave glass fibre fabric, considering the influence of the elastic properties of the material on the frequency response. Three series of rectangular specimens with different numbers of glass fabric layers were used for the study.
Usually, the literature does not emphasize that the method considered in this research allows obtaining dynamic elastic characteristics. This study shows that the dynamic flexural modulus is 23% higher than the static flexural modulus. A good agreement is obtained between the identified value of the elastic modulus and determined in the tensile test, with very low residual level 3.7%. The coincidence of the dynamic flexural modulus with the static tensile modulus cannot be extended to all other materials and layouts without additional research.
The results obtained demonstrated the high efficiency of the proposed method in identifying unknown material constants and emphasized the significant advantages inherent in dynamic testing. One of the key aspects is the speed of testing: specimens for the static tests require preliminary preparation for installing strain gauges, which is a labour-intensive process. In contrast, preparation for dynamic testing is much faster and involves only marking the test grid and attaching two elastic hangers. In addition, dynamic testing is completely non-destructive, which allows for multiple tests on the same specimen, reducing material consumption, which can be expensive. The method enables the use of a “single specimen principle”. For example, changes in the modulus caused by different processes affecting the structure and properties of laminated composite material, for example, different kinds of ageing of polymer materials, absorption of liquids (water), and vapours by a certain material, and so on, can be studied on a solitary [on one and the same] specimen. The method proposed is applicable not only to small-scale specimens but also to complex structures used in experimental modal analysis [46].
Author Contributions
Conceptualization, A.K.; methodology, A.K.; software, A.K.; validation, A.K. and V.K. (Vitalijs Kuzmickis); formal analysis, A.K.; investigation, A.K. and V.K. (Vitalijs Kuzmickis); resources, A.K.; data curation, A.K. and V.K. (Vitalijs Kuzmickis); writing—original draft preparation, A.K. and V.K. (Vladimir Kulakov); writing—review and editing, A.K. and V.K. (Vladimir Kulakov); visualization, A.K.; supervision, A.K.; project administration, A.K.; funding acquisition, A.K. All authors have read and agreed to the published version of the manuscript.
Funding
This research was funded by the Latvian Council of Science, project “Smart twisting active rotor blades with a functionally graded foam core (SmarTARB)” No. lzp-2023/1-0587.
Data Availability Statement
The original contributions presented in this study are included in this article; further inquiries can be directed to the corresponding author.
Conflicts of Interest
The author declares no conflicts of interest.
Abbreviations
The following abbreviations are used in this manuscript:
| ANOVA | Analysis of Variance |
| RSM | Response surface methodology |
| FEM | Finite element method |
References
- Bukvić, M.; Milojević, S.; Gajević, S.; Đorđević, M.; Stojanović, B. Production Technologies and Application of Polymer Composites in Engineering: A Review. Polymers 2025, 17, 2187. [Google Scholar] [CrossRef]
- Low, I.M.; Dong, Y. Composite Materials: Manufacturing, Properties and Applications, 1st ed.; Elsevier: Amsterdam, The Netherlands, 2021. [Google Scholar]
- Kovalovs, A.; Barkanov, E.; Rucevskis, S.; Wesolowski, M. Modeling and Design of a Full-Scale Rotor Blade with Embedded Piezocomposite Actuators. Mech. Compos. Mater. 2017, 53, 179–192. [Google Scholar] [CrossRef]
- Yilmaz, M.; Yasin, M.; Mercimek, O. Experimental study on out-of-plane behaviour of masonry walls strengthening with carbon fiber reinforced polymer sheets. Sci. Work. Azerbaijan Univ. Archit. Constr. 2023, 2, 58–66. [Google Scholar] [CrossRef]
- ASTM. Standards and Literature References for Composite Materials, 2nd ed.; ASTM: West Conshohocken, PA, USA, 1990. [Google Scholar]
- Huan, H.; Liu, L.; Mandelis, A.; Peng, C.; Chen, X.; Zhan, J. Mechanical Strength Evaluation of Elastic Materials by Multiphysical Nondestructive Methods: A Review. Appl. Sci. 2020, 10, 1588. [Google Scholar] [CrossRef]
- Gluhih, S.; Kovalov, A.; Tishkunov, A.; Akishin, A.; Chate, A.; Auzins, E.; Kalnins, M. Identification of the elastic modulus of polymeric materials by using thin-walled cylindrical specimens. Mech. Compos. Mater. 2012, 48, 57–64. [Google Scholar] [CrossRef]
- Liu, G.R.; Ma, W.B.; Han, X. An inverse procedure for determination of material constants of composite laminates using elastic waves. Comput Methods. Appl. Mech. Eng. 2002, 191, 3543–3554. [Google Scholar] [CrossRef]
- Golub, M.V.; Doroshenko, O.V.; Arsenov, M.A.; Bareiko, I.A.; Eremin, A.A. Identification of Material Properties of Elastic Plate Using Guided Waves Based on the Matrix Pencil Method and Laser Doppler Vibrometry. Symmetry 2022, 14, 1077. [Google Scholar] [CrossRef]
- Wang, W.T.; Kam, T.Y. Material characterization of laminated composite plates via static testing. Compos. Struct. 2000, 50, 347–352. [Google Scholar] [CrossRef]
- Kam, T.Y.; Chen, C.M.; Yang, S.H. Material characterization of laminated composite materials using a three-point-bending technique. Compos. Struct. 2009, 88, 624–628. [Google Scholar] [CrossRef]
- ASTM E1876-15; Standard Test Method for Dynamic Young’s Modulus, Shear Modulus, and Poisson’s Ratio by Impulse Excitation of Vibration. ASTM: West Conshohocken, PA, USA, 2015.
- Mota Soares, C.M.; Moreira de Freitas, M.; Araujo, A.L.; Pedersen, P. Identiacation of material properties of composite plate specimens. Compos. Struct. 1993, 25, 277–285. [Google Scholar] [CrossRef]
- Araujo, A.L.; Mota Soares, C.M.; Moreira de Freitas, M.J. Characterization of material parameters of composite plate specimens using optimization and experimental vibrational data. Compos. Part B Eng. 1996, 27B, 185–191. [Google Scholar] [CrossRef]
- Pedersen, P. Optimization method applied to identiacation of material parameters. In Discretization Methods and Structural Optimization Procedures and Applications; Eschenauer, H.A., Thierauf, G., Eds.; Springer: Berlin, Germany, 1989; pp. 277–283. [Google Scholar]
- Wilde, W.P.; Sol, H. Anisotropic Material Identification Using Measured Resonant Frequencies of Rectangular Composite Plates, 2nd ed.; Marshall, I.H., Ed.; Composite Structures 4; Elsevier Applied Science: London, UK, 1987; Volume 2, pp. 2317–2324. [Google Scholar] [CrossRef]
- Sol, H. Identification of the complex moduli of composite materials by a mixed numerical/experimental method. In Composite Materials Design and Analysis; Wilde, W.P., Blain, W.R., Eds.; Springer: Berlin, Germany, 1990; pp. 267–279. [Google Scholar]
- Wilde, W.P. Identification of the rigidities of composite systems by mixed numerical/experimental methods. In Mechanical Identification of Composites; Vautrin, A., Sol, H., Eds.; Elsevier: Amsterdam, The Netherlands, 1991; pp. 1–15. [Google Scholar]
- De Nunzio, A.V.; Nobile, R.; Faraco, G.; Messina, A. Experimental validation of an innovative inverse material constants identification method based on natural frequencies. Compos. Struct. 2025, 372, 119540. [Google Scholar] [CrossRef]
- Araújo, A.L.; Mota Soares, C.M.; Moreira de Freitas, M.J.; Pedersen, P.; Herskovits, J. Combined numerical–experimental model for the identification of mechanical properties of laminated structures. Compos. Struct. 2000, 50, 363–372. [Google Scholar] [CrossRef]
- Rikards, R.; Bledzkij, A.K.; Eglajs, V.; Chate, A.; Kurek, K. Elaboration of optimal design models for composite materials from data of experiments. Mech. Compos. Mater. 1993, 28, 295–304. [Google Scholar] [CrossRef]
- Rikards, R.; Chate, A. Identification of elastic properties of composites by method of planning of experiments. Compos. Struct. 1998, 42, 257–263. [Google Scholar] [CrossRef]
- Rikards, R.; Abramovich, H.; Green, T.; Auzins, J.; Chate, A. Identification of Elastic Properties of Composite Laminates. Mech. Adv. Mater. Struct. 2003, 10, 335–352. [Google Scholar] [CrossRef]
- Krasnikovs, A.; Kononova, O.; Machanovskis, A.; Zaharevskis, V.; Akishins, P.; Ruchevskis, S. Characterization of mechanical properties by inverse technique for composite reinforced by knitted fabric. Part 2. Experimental evaluation of mechanical properties by frequency eigenvalues method. J. Vibroeng. 2012, 14, 691–698. [Google Scholar]
- Mironovs, V.; Osipova, M.; Akishin, P.; Zemchenkovs, V.; Serdjuks, D. Methods for Evaluating the Elastic Properties of Stainless Steel Perforated Plates. Metals 2025, 15, 711. [Google Scholar] [CrossRef]
- Nikhamkin, M.; Semenov, S.; Silberschmidt, V.V.; Solomonov, D. Identification of elastic parameters of laminated carbon fiber plates using experimental modal analysis. ARPN J. Eng. Appl. Sci. 2019, 14, 2279–2285. [Google Scholar]
- Li, H.; Xue, P.; Rong, W.; Li, X.; Wen, B. Identification of mechanical parameters of fiber-reinforced composites by frequency response function approximation method. Sci. Prog. 2019, 103, 1–26. [Google Scholar] [CrossRef]
- Athi Sankar, P.; Machavaram, R.; Shankar, K. System identification of a composite plate using hybrid response surface methodology and particle swarm optimization in time domain. Measurement 2014, 55, 499–511. [Google Scholar] [CrossRef]
- Barkanov, E.; Akishin, P.; Lvov, G.; Chate, A. An Influence of Hypotheses Used for a Material Description on Identified Mechanical Properties of Laminated Composites. Mech. Compos. Mater. 2025, 61, 41–52. [Google Scholar] [CrossRef]
- Wesolowski, M.; Barkanov, E. Model Errors Influence on Identified Composite Material Properties. Compos. Struct. 2012, 94, 2716–2723. [Google Scholar] [CrossRef]
- Barkanov, E.; Wesolowski, M.; Hufenbach, W.; Dannemann, M. An Effectiveness Improvement of the Inverse Technique Based on Vibration Tests. Comput. Struct. 2015, 146, 152–162. [Google Scholar] [CrossRef]
- Lauwagie, T.; Sol, H.; Heylen, W. Handling uncertainties in mixed numerical-experimental techniques for vibration based material identification. J. Sound Vib. 2006, 291, 723–739. [Google Scholar] [CrossRef]
- Matter, M.; Gmür, T.; Cugnoni, J.; Schorderet, A. Numerical-experimental identification of the elastic and damping properties in composite plates. Compos. Struct. 2000, 90, 180–187. [Google Scholar] [CrossRef]
- Tam, J.H.; Ong, Z.C.; Ismail, Z.; Ang, B.C.; Khoo, S.Y. Identification of material properties of composite materials using nondestructive vibrational evaluation approaches: A review. Mech. Adv. Mater. Struct. 2016, 24, 971–986. [Google Scholar] [CrossRef]
- Tam, J.H. Identification of elastic properties utilizing non-destructive vibrational evaluation methods with emphasis on definition of objective functions: A review. Struct. Multidisc. Optim. 2020, 61, 1677–1710. [Google Scholar] [CrossRef]
- Palmieri, B.; Petriccione, S.; Tommaso, G.; de Giordano, M.; Martone, A. An Efficient Thermal Cure Profile for Thick Parts Made by Reactive Processing of Acrylic Thermoplastic Composites. J. Compos. Sci. 2021, 5, 229. [Google Scholar] [CrossRef]
- Murray, R.E.; Penumadu, D.; Cousins, D.; Beach, R.; Snowberg, D.; Berry, D.; Suzuki, Y.; Stebner, A. Manufacturing and Flexural Characterization of Infusion-Reacted Thermoplastic Wind Turbine Blade Subcomponents. Appl. Compos. Mater. 2019, 26, 945–961. [Google Scholar] [CrossRef]
- Bates, S.J.; Sienz, J.; Langley, D.S. Formulation of the Audze–Eglais Uniform Latin Hypercube design of experiments. Adv. Eng. Softw. 2003, 34, 493–506. [Google Scholar] [CrossRef]
- Zenkevich, O. The Finite Element Method in Engineering Science; McGraw-Hill: London, UK; New York, NY, USA, 1971; 521p. [Google Scholar]
- ASTM D3039; Standard Test Method for Tensile Properties of Polymer Matrix Composite Materials. ASTM International: West Conshohocken, PA, USA, 2017.
- ASTM D790; Standard Test Methods for Flexural properties of Unreinforced and Reinforced Plastics and Electrical Insulating Materials. ASTM International: West Conshohocken, PA, USA, 2017.
- Kostopoulos, V.; Markopoulos, Y.P.; Giannopoulos, G.; Vlachos, D.E. Finite element analysis of impact damage response of composite motorcycle safety helmets. Compos. Part B Eng. 2002, 33, 99–107. [Google Scholar] [CrossRef]
- Auzins, J.; Janushevskis, A.; Janushevskis, J.; Skukis, E. Software EdaOpt for experimental design, analysis and multiobjective robust optimization. In Proceedings of the International Conference on Engineering and Applied Science Optimization, Kos Island, Greece, 4–6 June 2014; pp. 101–123. [Google Scholar]
- Janushevskis, A.; Akinfiev, T.; Auzins, J.; Boyko, A. A comparative analysis of global search procedures. Proc. Estonian Acad. Sci. Eng. 2004, 10, 236–250. [Google Scholar] [CrossRef]
- Heylen, W.; Lamens, S.; Sas, P. Modal Analyses. Theory and Testing; Leven University: Leuven, Belgium, 2003; 325p. [Google Scholar]
- Mironov, A.; Kovalovs, A.; Chate, A.; Safonovs, A. Static Loads Influence on Modal Properties of the Composite Cylindrical Shells with Integrated Sensor Network. Sensors 2023, 23, 3327. [Google Scholar] [CrossRef]
Disclaimer/Publisher’s Note: The statements, opinions and data contained in all publications are solely those of the individual author(s) and contributor(s) and not of MDPI and/or the editor(s). MDPI and/or the editor(s) disclaim responsibility for any injury to people or property resulting from any ideas, methods, instructions or products referred to in the content. |
© 2025 by the authors. Licensee MDPI, Basel, Switzerland. This article is an open access article distributed under the terms and conditions of the Creative Commons Attribution (CC BY) license (https://creativecommons.org/licenses/by/4.0/).

