Article

Shear Capacity of Fiber-Reinforced Polymer (FRP)–Reinforced Concrete (RC) Beams Without Stirrups: Comparative Modeling with FRP Modulus, Longitudinal Ratio, and Shear Span-to-Depth

by
Mereen Hassan Fahmi Rasheed
1,
Bahman Omar Taha
1,
Ayad Zaki Saber Agha
1,
Mohamed M. Arbili
1,* and
Payam Ismael Abdulrahman
2
1
Department of Civil Engineering, Erbil Technical Engineering College, Erbil Polytechnic University, Erbil 44001, Iraq
2
Civil Engineering Department, Tishk International University, Erbil 44001, Iraq
*
Author to whom correspondence should be addressed.
J. Compos. Sci. 2025, 9(10), 554; https://doi.org/10.3390/jcs9100554
Submission received: 10 September 2025 / Revised: 28 September 2025 / Accepted: 9 October 2025 / Published: 10 October 2025
(This article belongs to the Special Issue Concrete Composites in Hybrid Structures)

Abstract

This study develops data-driven models for predicting the shear capacity of reinforced concrete (RC) beams longitudinally reinforced with fiber-reinforced polymer (FRP) bars and lacking transverse reinforcement. Owing to the comparatively low elastic modulus and linear–elastic–brittle behavior of FRP bars, reliable shear prediction remains a design challenge. A curated database of 402 tests was compiled from the literature, spanning wide ranges of beam size (width b, effective depth d), concrete compressive strength (f′c), FRP elastic modulus (Ef), longitudinal reinforcement ratio (ρf), and shear span-to-depth ratio (a/d). Multiple multivariate regression formulations—both linear and nonlinear—were developed using combinations of these variables, including a mechanics-informed reinforcement index (ρf·Ef). Model predictions were benchmarked against 15 existing expressions drawn from design codes, standards, and prior studies. Across the full database, the proposed models demonstrated consistently stronger agreement with experimental results than the existing predictors, yielding higher correlation and lower prediction error. The resulting closed-form equations are transparent and straightforward to implement, offering improved accuracy for the preliminary design and assessment of FRP-RC beams without stirrups while highlighting the influential roles of Ef, ρf, and a/d within the observed parameter ranges.

1. Introduction

Fiber Reinforced Polymer (FRP) bars have emerged as a promising alternative to traditional steel reinforcement in concrete structures, especially in environments susceptible to corrosion, such as those exposed to deicing salts. FRP offers advantages like high corrosion resistance, a favorable strength-to-weight ratio, and magnetic neutrality [1]. However, it also has limitations, including low elasticity (particularly in Glass FRP) and brittleness, which means it lacks a clear yield point.
Standards for the design of FRP-reinforced concrete structures have been developed by various organizations such as ACI [2], CSA 2002 [3], and JSCA [4] differ in whether they explicitly include a/d, axial stiffness ρf Ef, and member size, which strongly affects accuracy for FRP-RC without stirrups. These standards generally follow classical plane section assumptions, like those used in steel-reinforced concrete, but account for the brittle behavior of FRP. In beams without shear reinforcement, strength is determined by factors such as the effective reinforcement ratio (ρf Ef/Es) [5,6], and shear strength is influenced by contributions from both concrete and FRP reinforcement. Design codes like CEBFIP [7], JSCE [8], and BS 8110 [9] provide equations for predicting shear resistance, incorporating variables such as shear span ratio and concrete strength.
Several experimental studies have explored the shear behavior of FRP-reinforced concrete beams. For example, Hassan and Yousif [10] examined the shear capacity of haunched (non-prismatic) concrete beams reinforced with basalt FRP (BFRP) bars, showing that increasing the tapered angles of the beams significantly enhanced their shear strength. Ketenci and Dogan [11] studied the shear strengthening of concrete beams using fiber blocks (FB), finding that fully wrapping the beams increased both strength and ductility. Zhou et al. [12] investigated the shear performance of beams made with seawater and sea-sand self-compacting concrete, reinforced with glass FRP (GFRP) bars and stirrups, and found that beam depth, reinforcement ratio, and shear-span ratio significantly influenced shear capacity. Kar and Biswal [13] presented results from over 250 tests on FRP-strengthened, shear-deficient RC T-beams, evaluating key material characteristics. The study compared seven design guidelines for predicting FRP shear contribution and found that most performed poorly.
Other researchers have focused on developing models to predict the shear strength of FRP-reinforced beams. For instance, Askandar et al. [14] evaluated different models, including artificial neural networks (ANNs), for predicting torsional strength. They found that ANN models provided highly accurate predictions. Chowdhury et al. [15] proposed a simplified model for predicting the shear strength of FRP-reinforced beams, while Alam and Hussein [16] suggested a unified equation that considers factors such as the shear-span ratio, axial stiffness, and concrete strength. These models frequently exceed current design codes regarding shear strength prediction, especially for beams without shear reinforcement.
Additionally, numerous studies have compared experimental results with design code predictions. For example, Razaqpur et al. [17] tested beams reinforced with carbon FRP bars and found that the ACI design code tends to be more conservative than Canadian and JSCE recommendations. Similarly, El-Sayed et al. [18] found that Canadian and JSCE codes provided higher predictions for shear strength than ACI guidelines in tests of FRP-reinforced concrete slabs.
However, FRP offers promising advantages over steel reinforcement, its brittle nature and the challenges in predicting shear behavior remain areas of active research. Experimental studies and model development continue to enhance understanding and provide more accurate design methods for FRP-reinforced concrete structures. These efforts are crucial for optimizing the use of FRP materials in practical applications, particularly in structures subject to harsh environmental conditions.
The development of highly accurate models for predicting the shear strength of concrete beams reinforced with Fiber Reinforced Polymer (FRP) bars without stirrups is the significance of this research paper. The low elasticity modulus and brittle behaviour of FRP bars, which make it difficult to predict shear strength, present a significant challenge in structural engineering. Due to their excellent strength-to-weight ratio and resistance to corrosion, FRP bars are being used more often as steel replacements. Through a comparison of different proposed models with existing models from codes, standards, and literature, the study provides an in-depth analysis and offers a more reliable basis for designing concrete beams reinforced with FRP bars. It highlights the limitations of current models, which often produce conservative or inaccurate results, and proposes models that incorporate key variables such as beam size, reinforcement index, and shear span ratio. The significance of this research resides in the ability to improve the safety and efficiency of structural designs, particularly in situations where corrosion may cause traditional steel reinforcement to fail.
Elevated-Temperature Behaviour and Fire Design Considerations. While FRP bars provide high corrosion resistance and favorable strength-to-weight ratios, their performance degrades at elevated temperatures due to polymer-matrix softening and potential fiber–matrix deboning as temperatures approach the glass-transition temperature (Tg) of the resin. Reported effects include reductions in tensile strength and elastic modulus of FRP reinforcement and, critically, loss of bond to concrete under heating and thermal gradients, which can compromise force transfer and shear mechanisms. For example, Rosa et al. investigated the bond behaviour of GFRP bars to concrete under elevated temperatures using pull-out tests and observed significant bond deterioration as temperature increased, underscoring the need for explicit fire-resistance design measures when FRP is used in buildings Rosa et al. [19]. The present study focuses on ambient-temperature shear capacity of FRP-RC beams without stirrups; the database and proposed models were compiled and calibrated under room-temperature testing conditions and are not intended for direct application to fire scenarios or sustained high-temperature service. Designers should account for national code provisions on fire resistance and consider mitigation strategies such as increased concrete cover, passive fire protection, or use of high-Tg resin systems when FRP-RC members must satisfy fire-rating requirements
The aim of this paper is to develop transparent, closed-form models for predicting the shear strength of concrete beams reinforced with longitudinal FRP bars without stirrups; to overcome limitations and inaccuracies in current code provisions, we assemble a 402-test database and derive models that explicitly embed a/d, ρfEf (axial stiffness), depth effects, concrete compressive strength f′c, and related size/reinforcement indices—outperforming 15 established expressions; our objective is to improve predictive accuracy and, through extensive experimental benchmarking against existing formulations, recommend the most effective model for design.

2. Methodology

Figure 1 shows the methodology of the research work that includes several key steps, as follows:
  • Data Collection: The study uses a database of 402 data points from experimental tests on concrete beams reinforced with FRP bars without stirrups. These data were collected from existing literature as demonstrated in Table 1.
  • Variable Selection: Identifying and considering key variables that influence shear strength, including beam size (depth and width), reinforcement index, modulus of elasticity of FRP bars, concrete compressive strengths, and shear/span ratio.
  • Model Development: Proposing different models for predicting shear strength by considering various combinations of the variables. The models are developed using both linear and nonlinear regression analysis methods.
  • Comparison with Existing Models: The predicted results from the proposed models are compared with 15 existing models from codes, standards, and literature to evaluate their accuracy and correlation with experimental data.
  • Analysis and Recommendation: The study analyses the performance of these models, identifies the best-performing model, and recommends it for predicting the shear strength of concrete beams reinforced with FRP bars.
This methodology allows the study to address the shortcomings of existing models and provide a more accurate prediction of shear strength for this specific type of reinforced concrete.

2.1. Database Assembly, Screening, and Validation

We compiled a literature-based database of 402 tests on one-way FRP-RC members without transverse shear reinforcement. The following criteria governed selection and screening:
Inclusion: (i) Simply supported members (beams or slab-strips) tested in three- or four-point bending; (ii) normal-weight concrete with reported geometric and material variables (b, d, fc, ρf, Ef) and shear span-to-depth ratio (a/d); (iii) nominal shear at failure Vexp or sufficient data to compute it; (iv) longitudinal FRP reinforcement type identified (GFRP/CFRP/BFRP). Non-prismatic/haunched members were included only where the effective depth at the shear-critical region and the corresponding a/d were explicitly documented; d in the dataset denotes that critical-section value.
Exclusion: We excluded specimens with any of the following: shear reinforcement or external shear strengthening; prestressing or continuous spans; lightweight or fiber-reinforced concretes where density class could not be confirmed as normal-weight; composite or non-rectangular sections lacking unambiguous dimensions; premature anchorage failures or FRP rupture remote from the shear-critical region; incomplete metadata (missing any of b, d, fc, ρf, Ef, a/d, Vexp. Data harmonization and checks. Units were standardized to SI. For four-point bending we used Vexp = P/2V (per shear span); for three-point bending
Vexp = PV: For un symmetric setups we adopted the larger support reaction as Vexp and verified the reported a/d. Duplicated entries across secondary compilations were reconciled to the original source.
Outlier handling and robustness: We fit the multivariate models and examined student zed residuals (threshold ∣r∣ > 3) and Cook’s distance (Di > 4/nDi) to flag influential points. Flagged data were cross-checked against test reports for transcription/experimental anomalies. Sensitivity refits—excluding flagged points—did not materially alter coefficients or goodness-of-fit; consequently, we report models on the full curated database and note that conclusions are robust to outlier treatment.
Resulting ranges: The final dataset spans d ≈ 73–970 mm, a/d ≈ 1.1–12.5, b ≈ 89–1000 mm, ρf ≈ 0.12–2.22%, fc ≈ 20–93 MPa, and Ef ≈ 25–192 GPa, with observed shear failure modes including diagonal tension, shear compression, and shear tension (see Table 1).

2.2. Modeling

The shear strength of concrete beams reinforced with Fiber Reinforced Polymer (FRP) bars is predicted using a variety of models in this study. The models included a number of significant variables, such as the modulus of elasticity of FRP bars (Ef), reinforcement index (f), concrete compressive strength (f′c), beam width (bw), effective beam depth (d), and shear-span ratio (a/d). The analysis uses both linear and nonlinear regression analysis techniques to determine the coefficients in the models.

2.2.1. Multi-Non-Linear Regression (MNLR) Model

The comprehensive equation using a power function offers several benefits in predicting the shear strength of concrete beams reinforced with FRP bars. By incorporating key factors such as beam width (bw), effective depth (d), concrete compressive strength (f′c), shear-span ratio (a/d), modulus of elasticity of FRP bars (Ef), and reinforcement index (ρf), this model captures the real influence of these variables on shear strength in the form shown in Equation (1).
V c = α °   ( b w ) α 1   ( d )   α 2   f c α 3   a d α 4   E f α 5   ρ f α 6
The equation’s use of nonlinear regression analysis allows for the accurate determination of coefficients (α0, α1, …, α6). This approach provides a more precise and robust prediction of shear strength compared to simpler linear models, making it highly effective for accounting for the complex interactions between different variables. The flexibility of this equation also enables it to accommodate a wide range of beam configurations and material properties, enhancing its practical applicability in engineering design.

2.2.2. Modified ACI Equations

The basic ACI shear strength equation was modified by introducing a correction factor that accounts for key variables like modular ratio (Ef/Es), reinforcement index (ρf), and shear-span ratio (a/d). In the following proposed equation, the basic equation of ACI code [36] for shear strength is modified by adding a correction factor including the effect of the variables separately or combined. The modified equation takes the following form (Equation (2)):
V c = α V c A C I    
where VcACI = 1/6 √f′c bw d and α is shear proposed modification factor.

2.2.3. Multi-Linear Regression (MLR) Model

Using multi-linear regression analysis, further modifications to the ACI equation were proposed, resulting in new correction factors as a function of the studied variables. These equations continued to enhance predictive accuracy while being simpler and more adaptable for practical use, although they introduced a slight trade-off in precision compared to more complex models.
c = 1 + α 1 ρ f + α 2 a d + α 3 E f ρ f E s V c A C I

2.2.4. Power Function Models

Power function models are developed by taking individual effects of variables (Ef/Es, ρf, and a/d) into account separately. These equations reduced computational effort while maintaining an acceptable level of prediction accuracy. The effect of each variable was separated out to simplify the equations for real-world applications, though with a slightly lower correlation than in the comprehensive models.
V c = α o ( E f . ρ f E s ) α 1 V c A C I
V c = α o ( a d ) α 1 V c A C I
V c = α o ( ρ f ρ b ) α 1 V c A C I
where ρ b = 0.85 × β 1 f c f y 0.003 0.003 + f y .

3. Results and Discussion

3.1. Relationship Between Predicted and Measured Shear Strength

3.1.1. Multi-Non-Linear Regression (MNLR) Model

The multi-nonlinear power function was used to evaluate the influence of key variables on concrete shear strength, including beam width (bw), effective depth (d), concrete compressive strength (f′c), shear-span ratio (a/d), modulus of elasticity of FRP bars (Ef), and reinforcement index (ρf). Nonlinear regression analysis was applied to available experimental data from the literature, and the following equation is determined:
V c = 34.4   ( b w ) 1.08     ( f c ) 0.14   ( d ) 0.58 E f . ρ f E s 0.24     ( a d ) 0.75
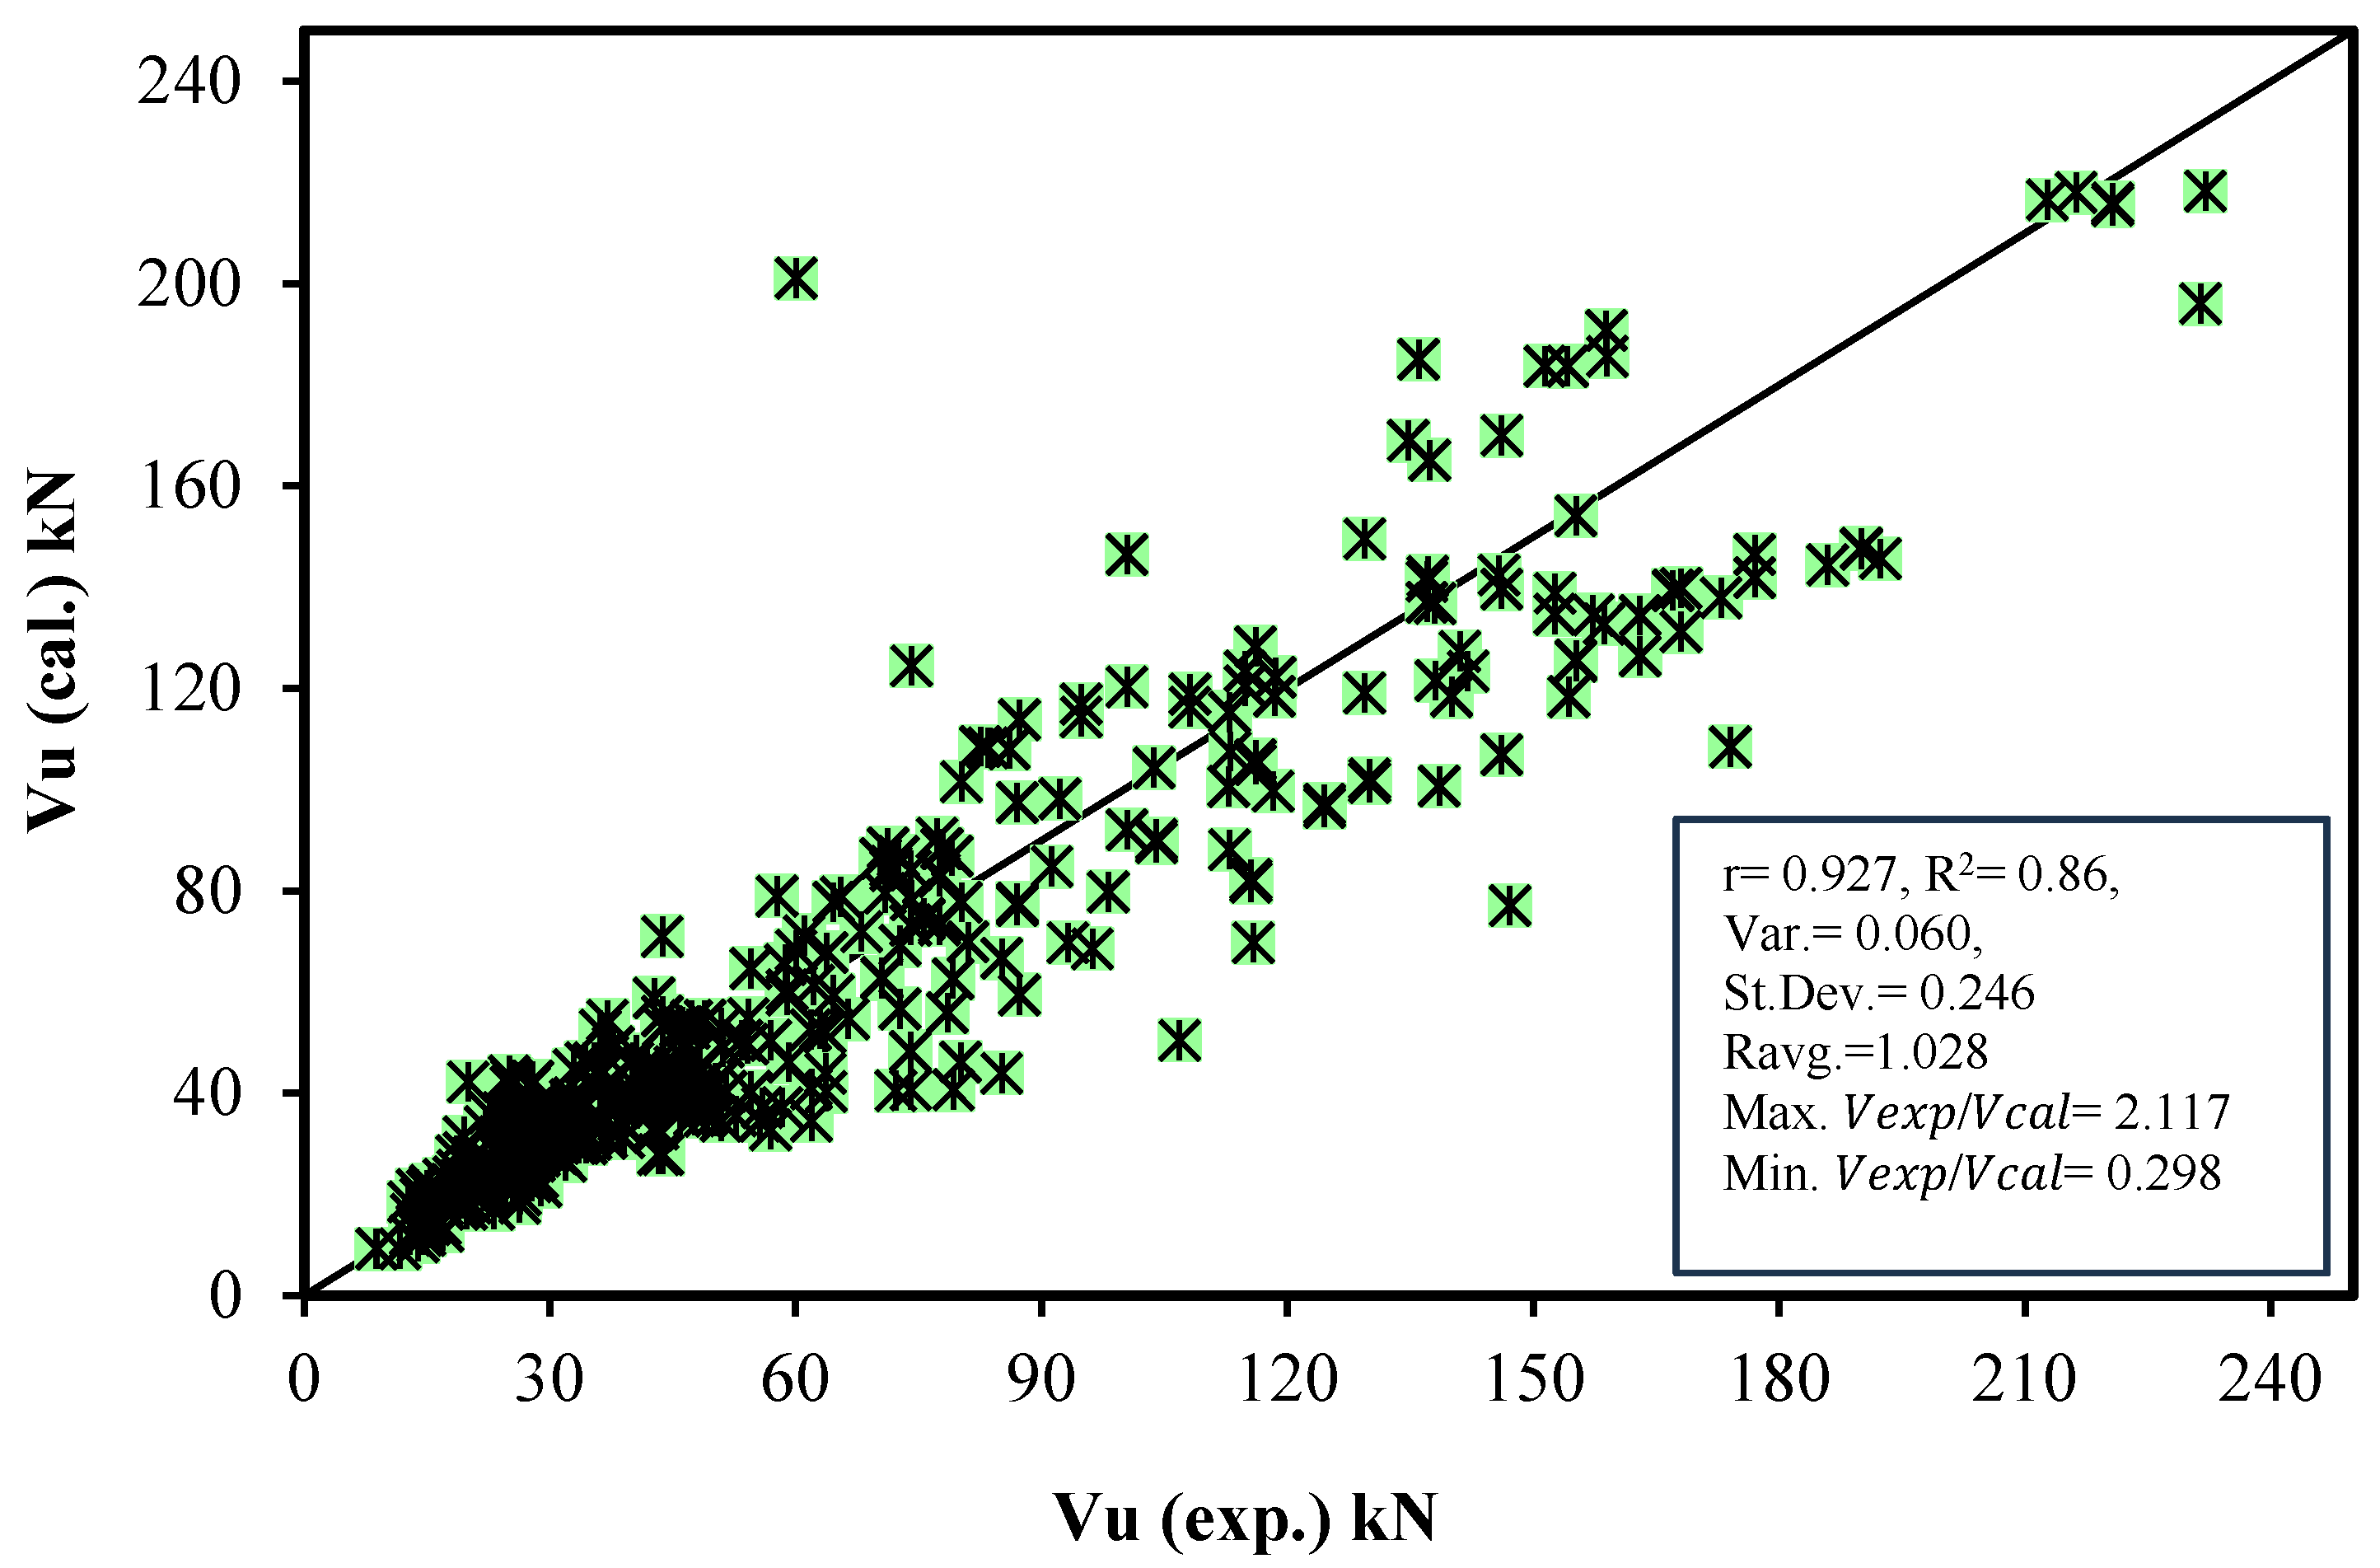
The predicted shear strengths from this equation were plotted against the experimental data as shown in Figure 2, revealing a strong correlation, with a correlation coefficient (r) of 0.927. The findings have a standard deviation (σ) of 0.246 and an average experimental-to-predicted ratio (Ravg) of 1.028, demonstrating the model’s accuracy. The maximum and minimum experimental-to-predicted ratios were 2.117 and 0.298, respectively, further supporting the equation’s validity in predicting shear strength.

3.1.2. Modified ACI Equations

The basic ACI shear strength equation was modified to incorporate a correction factor that accounts for key variables such as modular ratio (Ef/Es), reinforcement index (ρf), and shear-span ratio (a/d). This modification aimed to improve prediction accuracy by better aligning the equation with experimental data. Using nonlinear regression analysis and experimental data, the proposed correction factor (α) was modeled as a function of the modular ratio, reinforcement index, and shear-span ratio, Equation (8).
V c = 4.288 ( E f . ρ f E s ) 0.18 ( a d ) 0.50 V c A C I
Simplified power function equations were developed by taking the individual effects of key variables such as the modular ratio (Ef/Es), reinforcement index (ρf), and shear-span ratio (a/d). While these simplified models aimed to reduce computational complexity, they maintained reasonable prediction accuracy, though with slightly reduced correlation when compared to the more comprehensive models. Each variable’s impact on the shear strength was treated separately, making these equations easier to apply in practical scenarios.
The effect of the variables; (Ef/Es. ρf), (a/d), and (ρf/ρb) are taken individually in proposing the correction factor (α) by taking the same procedures (Equations (9)–(11)).
V c = 1.625 ( E f . ρ f E s ) 0.1187 V c A C I
V c = 1.3 ( a d ) 0.39 V c A C I
V c = 1.0 ( ρ f ρ b ) 0.1522 V c A C I
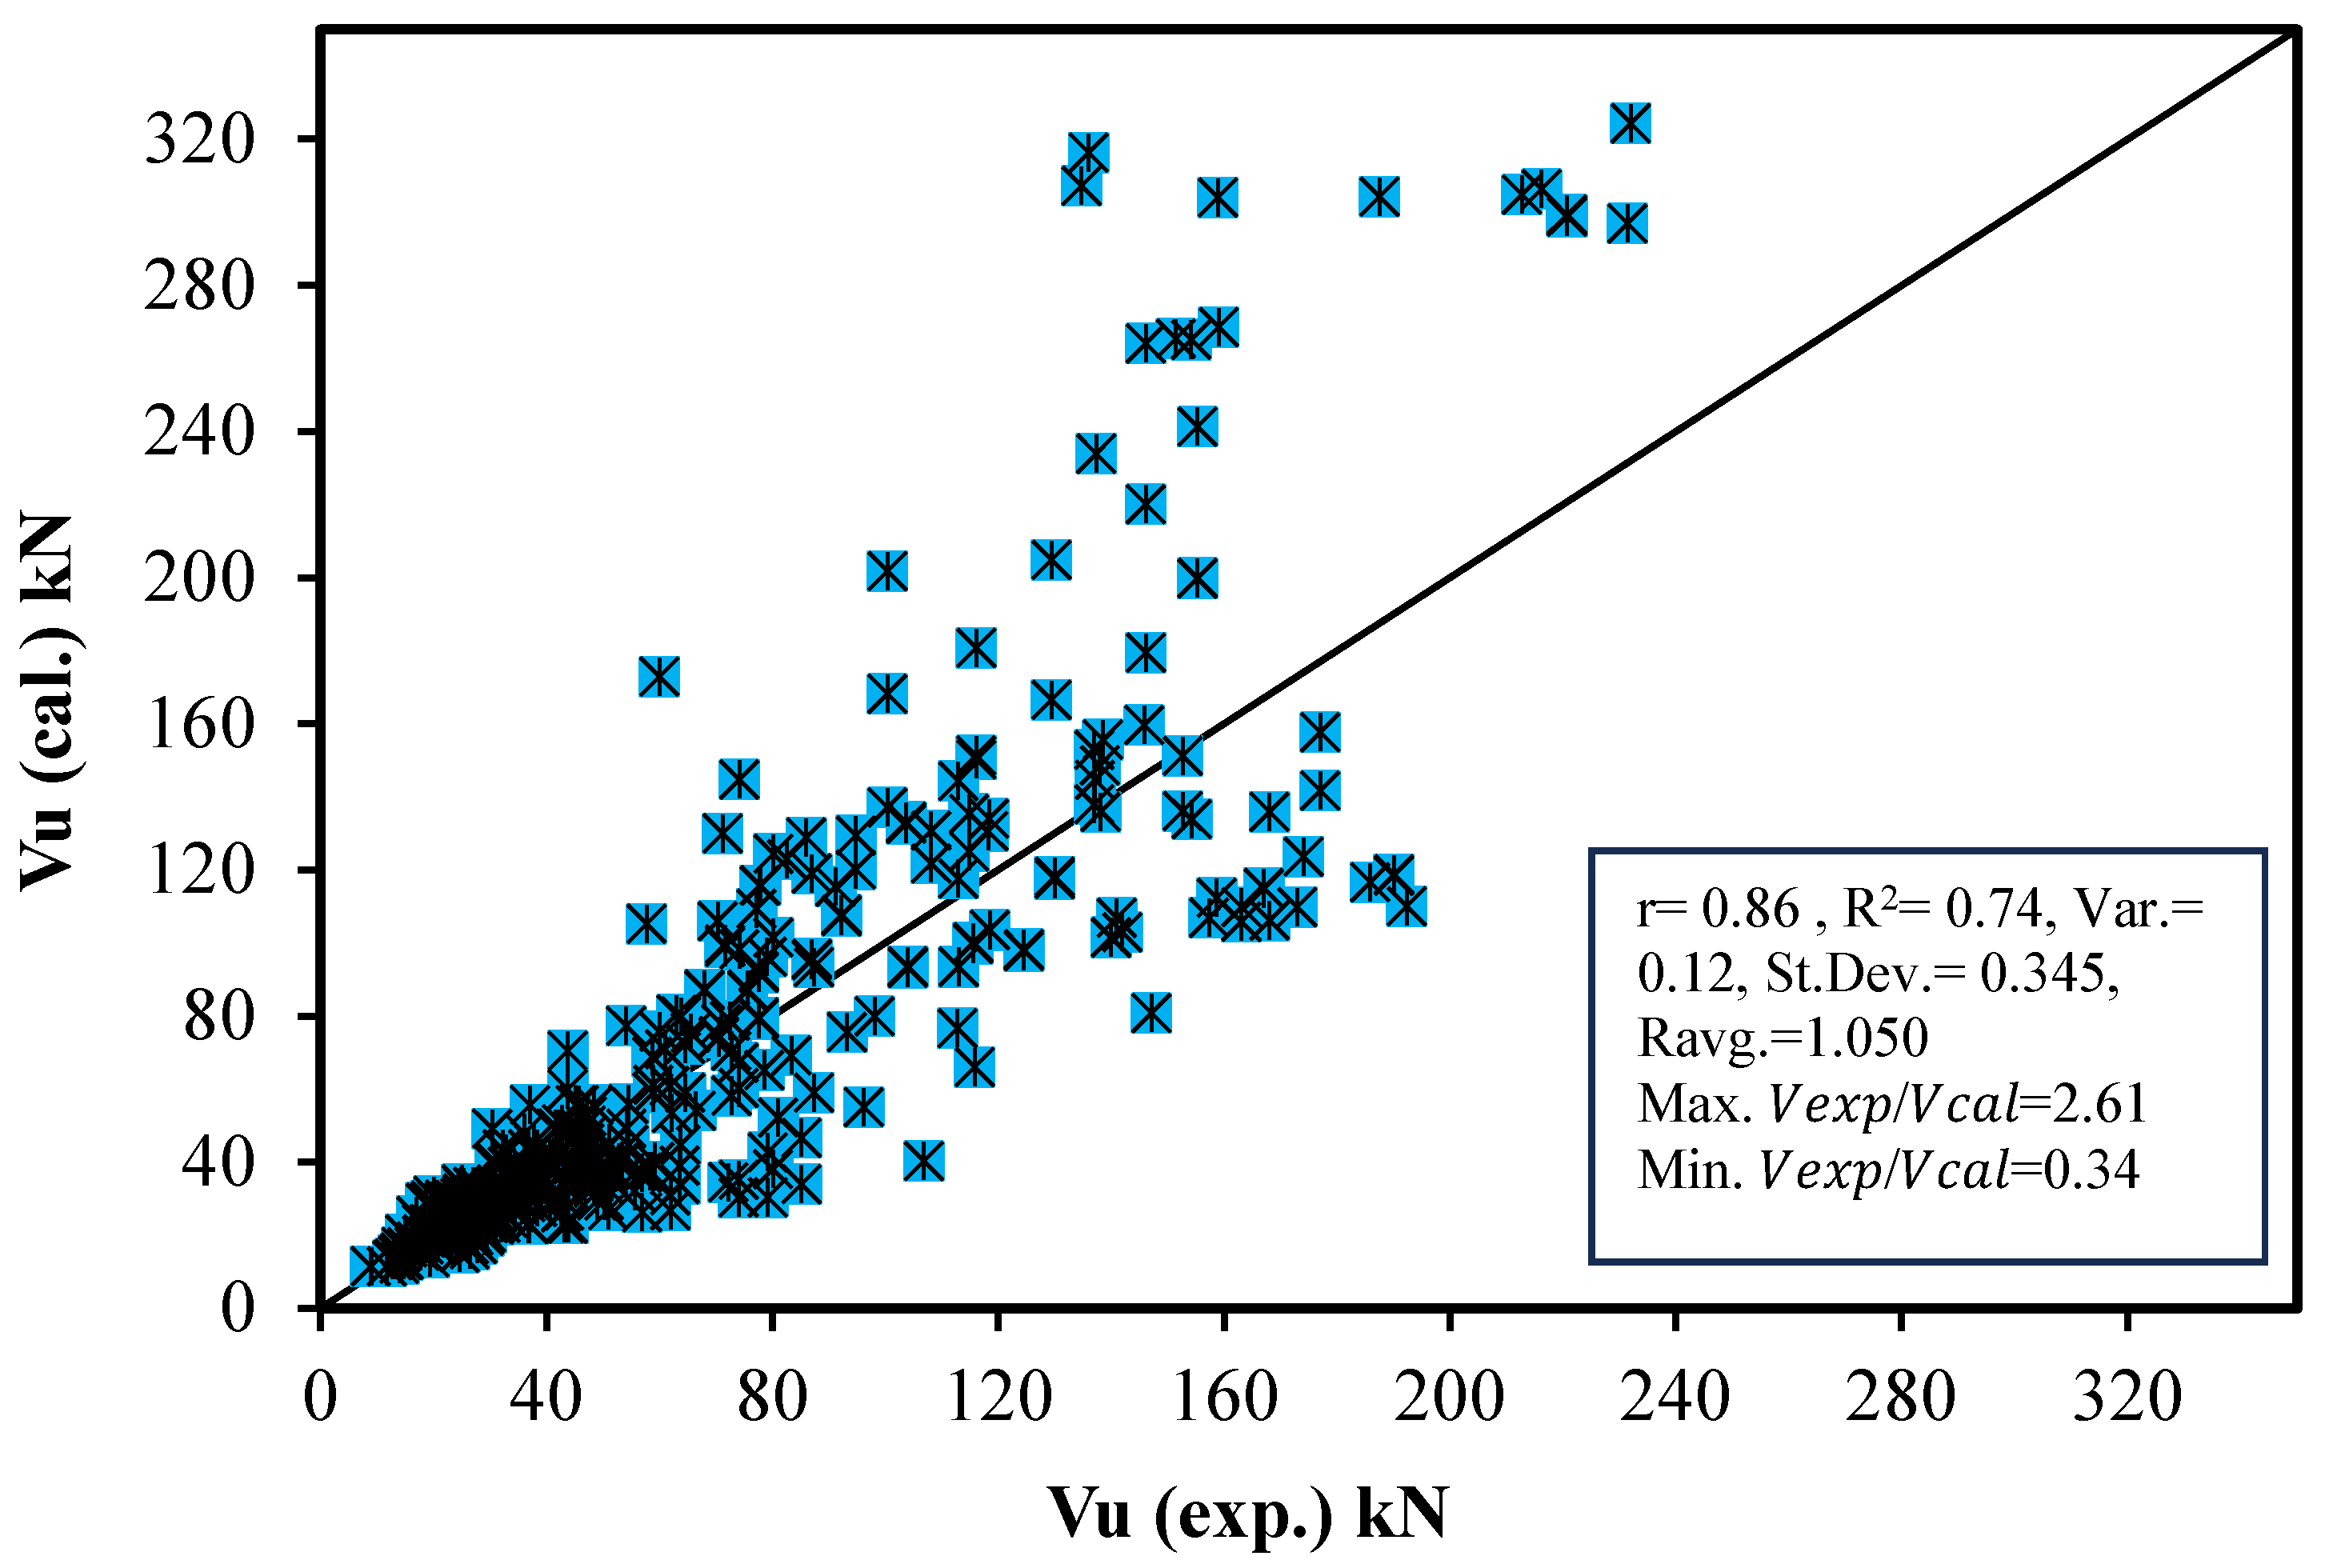
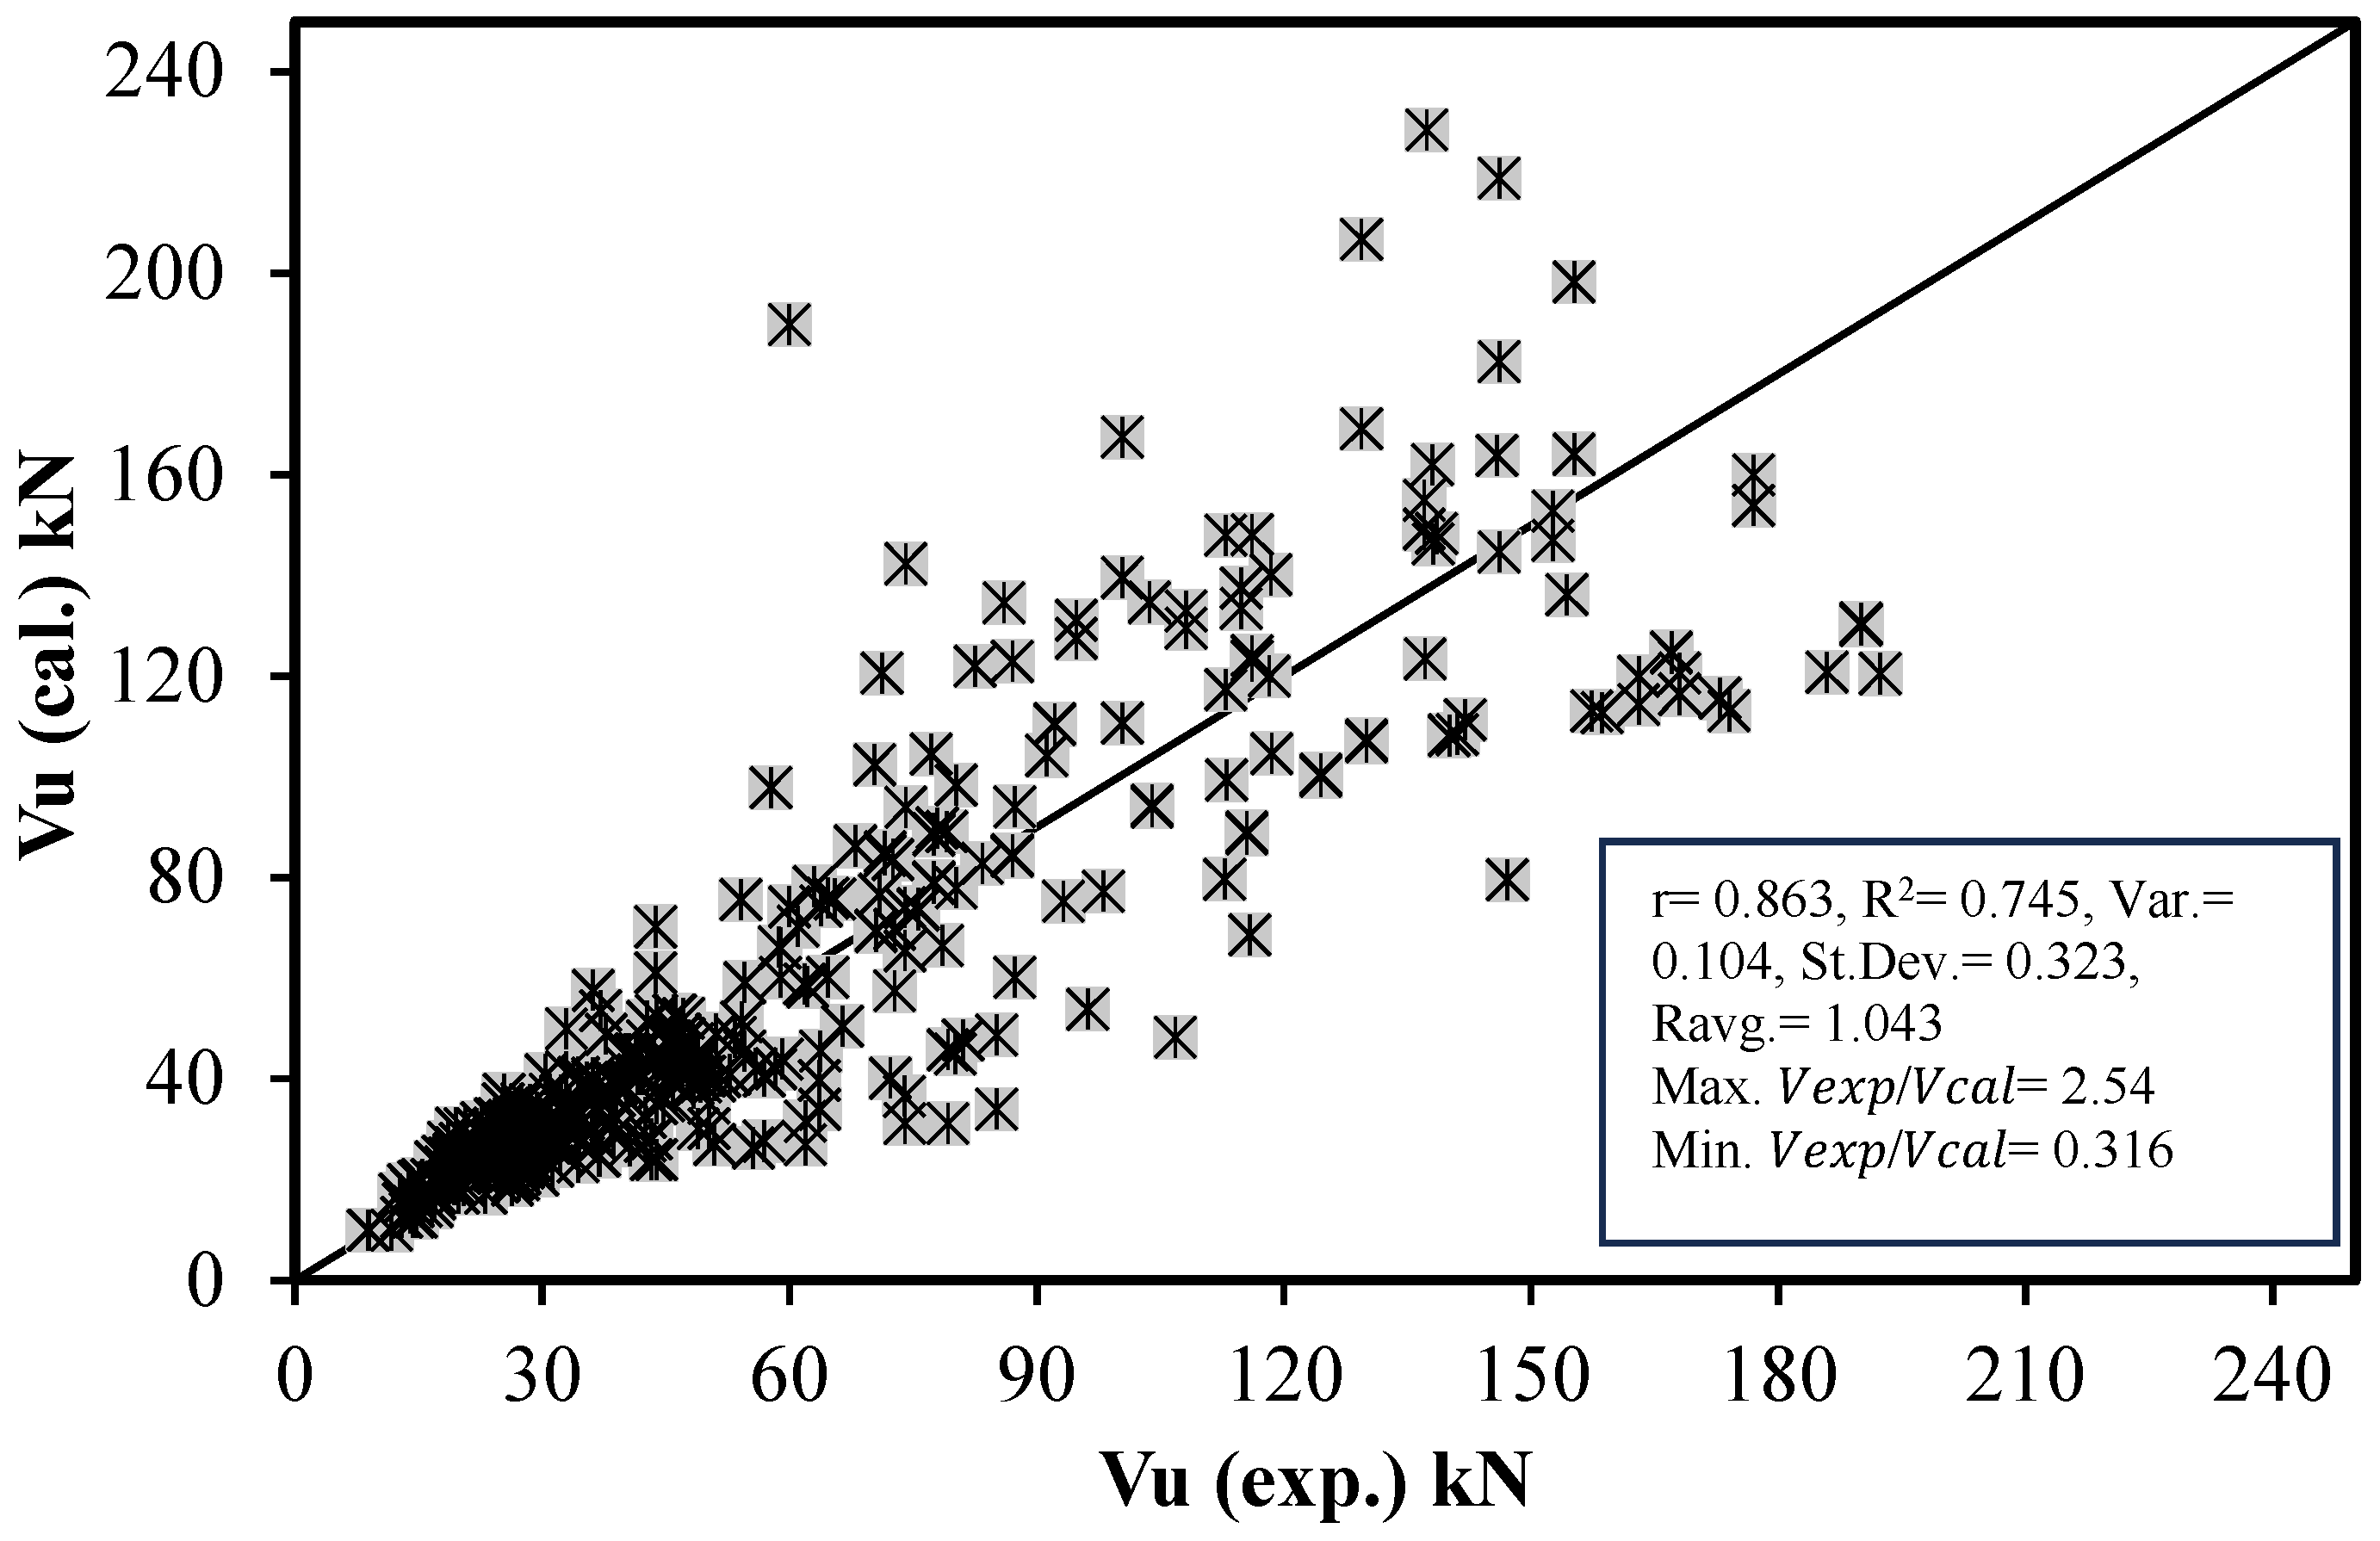
Equation (8), which incorporated the modular ratio, reinforcement index, and shear-span ratio, provided an improved correlation between predicted and experimental shear strength values. The correlation coefficient for this model was 0.860, with a variance of 0.120 and an average experimental-to-predicted ratio (Ravg) of 1.050. Figure 3 illustrates the relationship between the predicted and experimental values. Further, individual models (Equations (9)–(11)), which isolated the effects of the variables separately, yielded correlation coefficients ranging from 0.816 to 0.875. This indicates that while these simpler models provided reasonable accuracy, they were less effective than the comprehensive model in Equation (8). Figure 4, Figure 5 and Figure 6 show the plots of experimental versus predicted shear strengths for these models, further highlighting the effectiveness of the comprehensive approach in capturing the combined effects of the variables.
In one of the proposed simplified models, the exponent for the concrete compressive strength (f′c) was reduced from 0.5 to 0.16, reflecting the real influence of compressive strength on shear capacity more accurately, Equation (12).
V c = 0.468 ( f c ) 0.16 b w d
Mechanistic basis for the concrete-strength exponent in Equation (12). The fitted dependence V∝(fc) 0.16 is consistent with the shear-transfer mechanisms specific to FRP-RC members without transverse reinforcement:
Aggregate interlock is crack-width-controlled. In FRP-RC, larger flexural-shear crack widths arise from the lower axial stiffness of the longitudinal reinforcement and the absence of yielding. Because the effective contact area and roughness engagement across a crack decrease rapidly with crack opening, the marginal gain from higher f′c (stronger paste and stronger coarse-aggregate bridging) is diminished. Thus, the interlock contribution scales weakly with fc′ when crack width is the governing state variable.
Limited dowel action of FRP bars. The dowel component depends on the bar’s shear/axial stiffness and bond transfer. FRP bars (especially GFRP) provide lower dowel stiffness than steel and exhibit different bond mechanics; consequently, the portion of shear that would indirectly benefit from higher f′c through confinement and crack-face clamping is reduced.
Compression-field/arching governed by a/d and ρfEf. The concrete-compression field and arching action mobilize with the shear-span-to-depth ratio and the axial-stiffness index ρfEf, which controls crack inclination and strain compatibility. In this regime, f′c influences capacity primarily as a limiting stress rather than as the main driver of the force path; its exponent is therefore lower than the classical 1221 used for steel-RC. Net effect. When aggregate interlock is crack-width-limited, dowel action is modest, and the compression field is geometry/stiffness-controlled, the concrete strength enters with a sub-square-root sensitivity—captured here by the empirical exponent 0.16—while ρfEf and a/d carry the dominant variation in V. This mechanistic picture explains the reduced f′c sensitivity in Equation (12) and aligns with the observed stabilized residuals when predictions are expressed in terms of a/d and ρfEf.
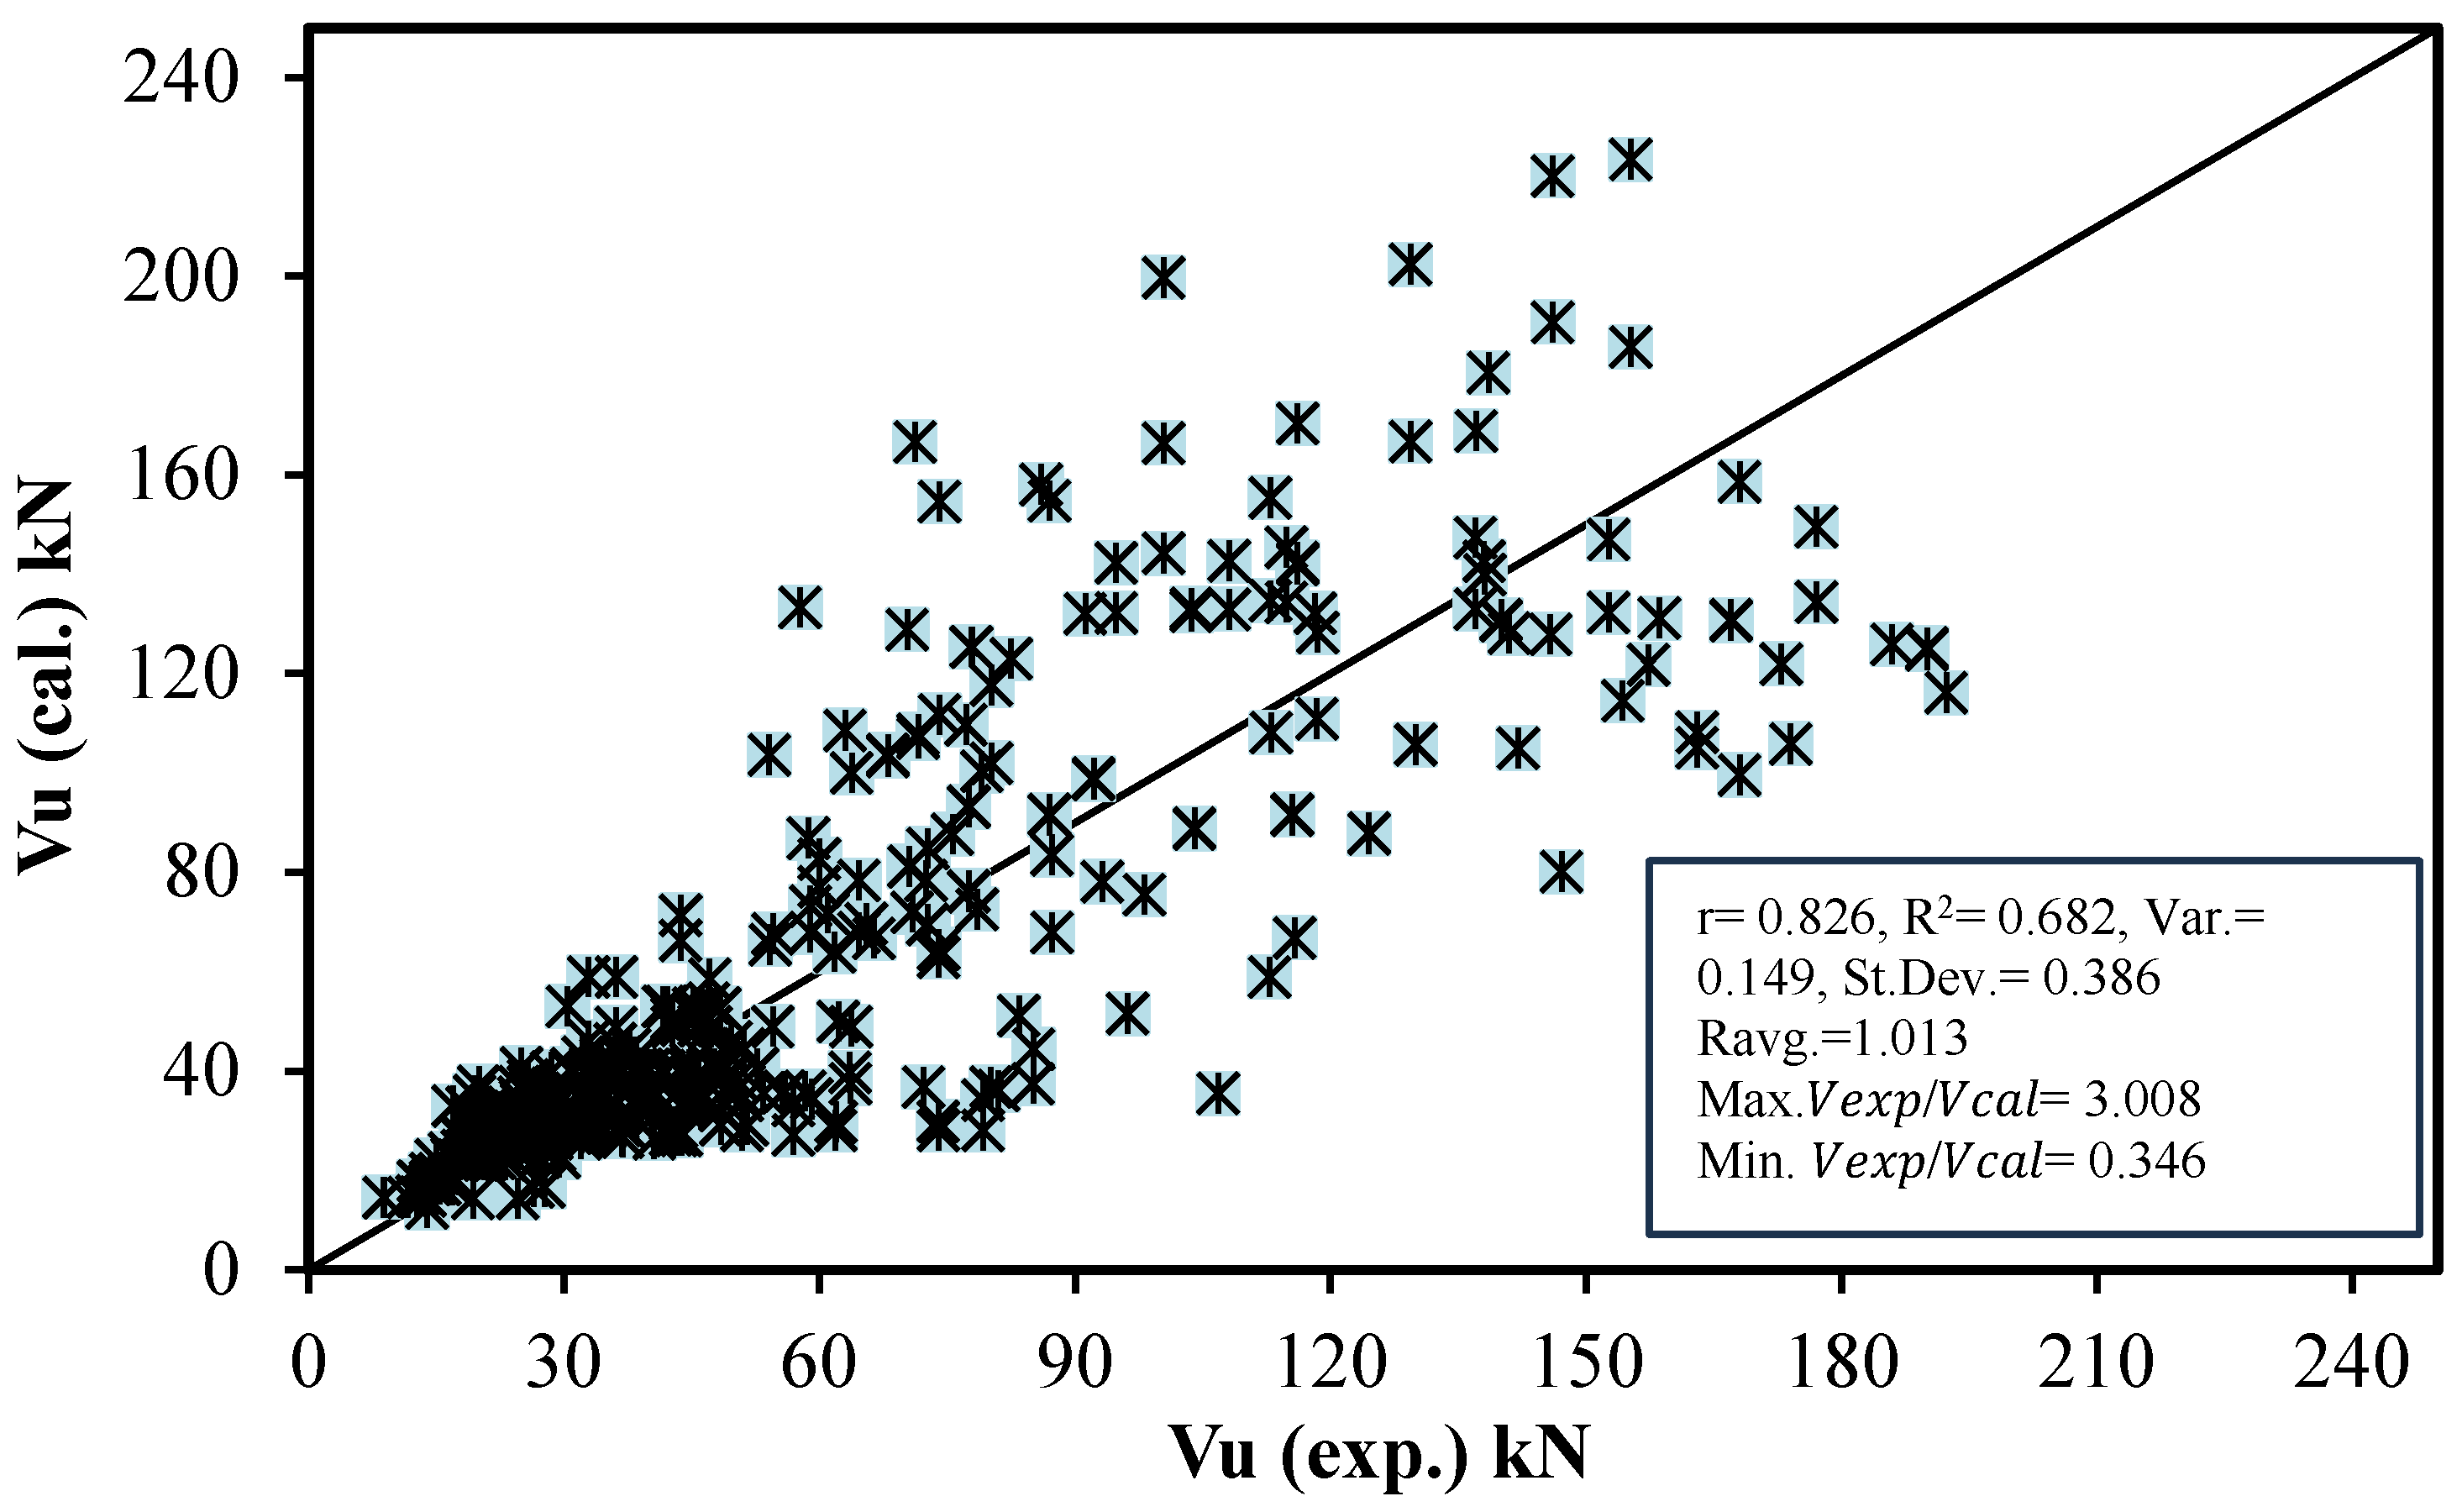
This equation yielded a correlation coefficient (r) of 0.826, with a variance of 0.177 and an average experimental-to-predicted ratio (Ravg) of 1.066. Figure 7 shows the plot of experimental versus predicted shear strengths, demonstrating a reasonably good fit despite the simplified nature of the model. The above proposed model accounted for the real influence of the concrete compressive strength (f′c).
Keeping the powers of the beam width (bw) and effective depth (d) fixed at 1 and including the effect of the variables (f′c, (Ef.ρf)/Es and a/d) together the following equation is determined, Equation (13).
V c = 2.5 ( f c ) 0.18 ( E f . ρ f E s ) 0.205 ( a d ) 0.418 b w d
This equation showed a reasonable balance between simplicity and predictive accuracy. Figure 8 shows the plot of experimental versus predicted shear strengths.

3.1.3. Multi-Linear Regression (MLR) Model

Using multi-linear regression analysis, further modifications to the basic ACI shear strength equation were proposed. These modifications resulted in new correction factors that account for key variables such as the reinforcement index (ρf), modular ratio (Ef/Es), and shear-span ratio (a/d).
Equations (14) and (15) are determined.
V c = 1 + 0.05 ρ f 0.07 a d + 0.28 E f E s V c A C I
V c = 1 0.0460 a d + 1.755 ρ f . E f E s V c A C I
Equations (14) and (15) yielded a correlation coefficient of 0.826. The plots of experimental shear strength (Vexp) versus calculated shear strength (Vcal) are presented in Figure 9 and Figure 10, demonstrating a good fit between the experimental and predicted results.
Further modifications were proposed by combining linear equations to separately account for the effects of each variable. The correction factor (ψ) was expressed as the product of three components, each representing the effect of the shear-span ratio, reinforcement index, and modular ratio, respectively.
V c = ψ   V c   A C I
ψ = A + B a d C + D ρ f ρ b [ E + F E f E s ]
The constants (A, B, C, D, E and F) are determined using stepwise linear regression analysis and Equations (17) and (18) are proposed.
V c = 1.174 0.085 a d 1 + 0.002 ρ f ρ b 0.91 + 0.26 E f E s V c A C I
V c = 1.174 0.085 a d 1 + 1.6 ρ f . E f E s V c A C I
Equations (17) and (18) provided correlation coefficients of 0.815 and 0.808, respectively, the plots of Vexp versus Vcal are shown in Figure 11 and Figure 12.

3.2. Evaluation of Proposed Models

Table 2 presents an overview of various shear strength equations proposed by 11 references. The basic ACI equation (Vc = 1/6 √f′c b_w d) was modified by Michaluk et al. [29], introducing a factor based on the modulus of elasticity ratio between FRP and steel (Ef/Es). However, this modification led to predictions that were overly conservative. Deitz et al. [32] attempted further adjustment by multiplying the ACI equation by (3 Ef/Es), but this still resulted in overestimated predictions and poor correlation with experimental data.
The CSA [3], ISIS-M03-01 [61], and CSA 2004 [62] equations made distinctions based on beam depth but did not account for shear span ratio. Among them, the CSA 2002 [3] equation for beams with d ≤ 300 mm provided more accurate results compared to other models. The JSCE 1997 [4] model incorporated factors like beam size and axial stiffness, leading to relatively accurate predictions. Similarly, the ISE 1999 [63] model, which also accounted for beam size and axial forces, provided improved predictions. However, neither the Canadian Standard Association (CSA) equations nor most of the other models considered shear span ratio.
Most of the models discussed, including those by Michaluk and Deitz, failed to include shear span ratio in their predictions. The Michaluk model was found to give conservative results, while the Canadian code equations provided predictions that closely matched experimental data. The CSA [3] and CSA [62] models divided shear strength predictions into two categories based on beam depth (d ≤ 300 mm and d > 300 mm), and the CSA-S806 [3] model considered the effect of shear span ratio (a/d) for beams with d ≤ 300 mm.
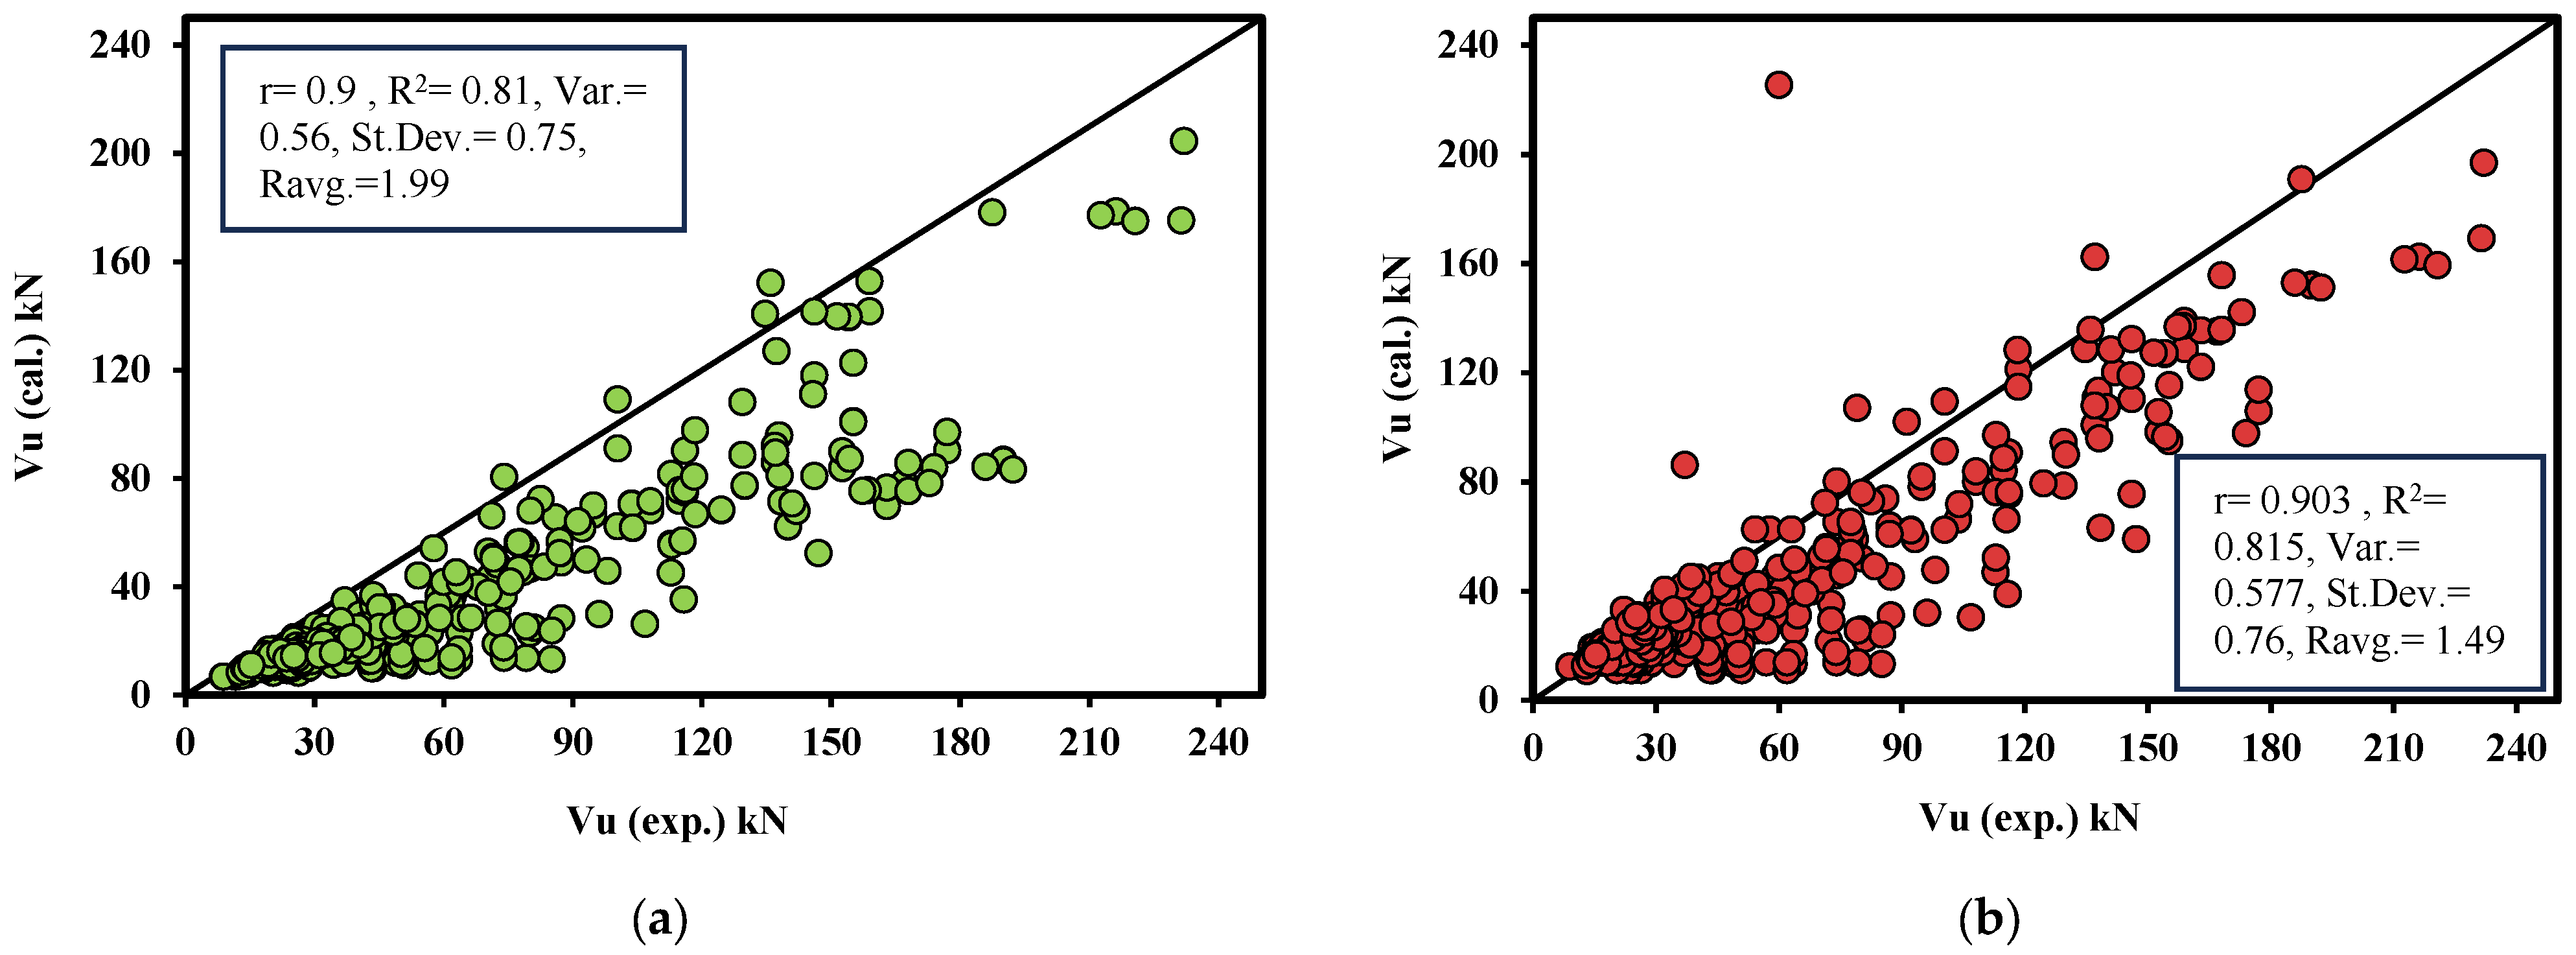
These models’ predictions were compared with experimental data and are shown in Figure 13.
Most models did not account for key factors such as shear span ratio, reinforcement ratio, modulus of elasticity of FRP bars, or beam size. This study addresses these gaps by applying linear and non-linear regression analysis, along with the least squares method, to develop a more accurate shear strength equation. The study examines different combinations of these variables to determine the optimal form of the proposed equation, as applied to beams reinforced with FRP bars and without stirrups, based on the beam tests reported in the previous literature, as shown in Table 2.

3.3. Effect of Parameters

This section interprets how the principal variables—shear span-to-depth ratio (a/d), FRP axial stiffness (ρf·Ef), longitudinal reinforcement ratio (ρf), FRP elastic modulus (Ef), concrete compressive strength (f′c), and member size (bw, d)—govern the shear capacity of FRP-RC beams without stirrups, as reflected by the proposed regression models and their benchmarking results.

3.3.1. Shear Span-to-Depth Ratio (a/d)

Across all formulations, a/d exerts a dominant, negative influence on shear capacity. Increasing a/d lengthens the diagonal crack path and reduces the arching (strut-and-tie) contribution, thereby decreasing the concrete contribution Vc. Models that embed a/d (e.g., the MNLR and the modified-ACI with combined correction factor) exhibit markedly improved correlation relative to expressions that neglect it, underscoring a/d as a first-order design variable. The comprehensive MNLR model (Equation (7)) achieved the highest agreement (r ≈ 0.927), while the modified-ACI model with a combined correction in a/d, ρf, and Ef/Es also improved fit (r ≈ 0.860). The observed improvement after adding a/d corroborates prior findings that shear capacity decreases systematically with increasing a/d (Ashour & Kara [25] and Jang et al. [43]).

3.3.2. Longitudinal Reinforcement and Axial Stiffness (ρf, ρf·Ef, Ef/Es)

The longitudinal FRP controls crack width and spacing, enhancing aggregate interlock and dowel action; however, its effectiveness depends on axial stiffness. Accordingly, models formulated in terms of the reinforcement index ρf·Ef (or the modular ratio Ef/Es together with ρf) outperform those using ρf alone. In the power-function family, treating ρf and Ef jointly produced higher correlations than isolating either parameter; simplified single-parameter variants (Equations (9)–(11)) retained reasonable accuracy (r ≈ 0.816–0.875) but trailed the combined form. Practically, increases in ρf or upgrading from low-modulus GFRP to higher-modulus CFRP shift responses toward smaller crack widths and higher Vc, with diminishing returns at high axial stiffness.
Mechanistic link between crack kinematics and axial stiffness. In FRP-RC members without stirrups, the longitudinal reinforcement governs the crack field (width w and spacing s) primarily through its axial stiffness ρfEf. Larger ρfEf restrains opening and increases crack density, which (i) enhances aggregate interlock along inclined cracks by reducing w, (ii) improves longitudinal dowel contribution by limiting bar slip and maintaining load transfer across cracks, and (iii) stabilizes the compression zone and strut-and-tie action at moderate a/d. Consistent with these kinematics, the fitted exponents show a positive, diminishing-returns sensitivity to ρfEf (strongest at intermediate a/d, while the sub-√fc dependence reflects that, with larger w in low-stiffness cases, concrete strength confers limited additional interlock. Thus, the empirical coefficients are not merely statistical: they codify how axial stiffness shapes the crack pattern that controls Vc, aligning the regression trends with the expected mechanics across the database ranges.

3.3.3. Concrete Compressive Strength (f′c)

The influence of f′c on Vc is positive but sub-linear. When calibrated to the FRP database, the classical √f′c trend embedded in steel-RC provisions was found to overstate the sensitivity. A simplified proposed model reduced the f′c exponent from 0.5 to 0.16 (Equation (12)), which improved fidelity to test evidence (r ≈ 0.826) and aligns with the mechanics of FRP-RC where larger crack widths and the absence of yielding limit aggregate-interlock gains from stronger concrete.

3.3.4. Member Size Effects (bw, d)

Width bw enters approximately linearly in force-based formulations, so Vc increases with bw. Depth d has a dual role: while Vc (kN) scales with d, the normalized shear stress v = Vc/(bw d) decreases with increasing d (size effect). The proposed MNLR/power models implicitly capture this by exponents on d below unity when expressed in stress terms, yielding better agreement for deep members than code expressions that lack explicit size control.

3.3.5. Interactions and Model Hierarchy

Parameter interactions are non-separable: the beneficial effect of axial stiffness (ρf·Ef) is more pronounced at moderate a/d, whereas at very large a/d the concrete contribution becomes crack-span-dominated and less responsive to reinforcement tuning. Capturing multiple variables simultaneously (Equation (7); r ≈ 0.927; σ ≈ 0.246; Ravg ≈ 1.03) consistently outperforms single-parameter corrections (Equations (9)–(11)) and purely linear adjustments (Equations (17) and (18); r ≈ 0.808–0.815). This hierarchy—MNLR > combined modified-ACI > single-parameter power/linear—highlights the necessity of multi-variable forms for reliable prediction across the broad database ranges (d ≈ 73–970 mm; a/d ≈ 1.1–12.5; f′c ≈ 20–93 MPa; Ef ≈ 25–192 GPa).

3.3.6. Design Implications

Always include a/d explicitly in shear checks for FRP-RC without stirrups; neglecting it is a primary source of bias. Use axial stiffness (ρf·Ef) rather than ρ*f alone to represent longitudinal reinforcement effects. Adopt sub-√f′c dependence for FRP-RC (e.g., f′c0.16) to avoid over-prediction at high strengths. Account for size effects with depth-sensitive formulations when extrapolating beyond the calibration range. Collectively, these trends explain the improved accuracy of the proposed equations relative to 15 existing models and provide a mechanics-consistent basis for preliminary design and assessment of FRP-RC beams without transverse reinforcement.

3.4. Segmented Validation and Boundary Assessment

To complement the global metrics, we validated the proposed models across targeted parameter intervals that reflect practical design regimes and the database boundaries. Stratification followed these bins (selected to balance physical meaning and adequate sample sizes):
  • Shear span-to-depth: low a/d < 2.5, medium 2.5 ≤ a/d ≤ 4.5, high a/d > 4.5.
  • FRP elastic modulus Ef: low < 50 GPa (typical GFRP), medium 50–100 GPa, high > 100 GPa (CFRP/BFRP upper range).
  • Longitudinal reinforcement: ρf low/med/high (tertiles), and axial stiffness ρfEf low/med/high (tertiles).
  • Member depth d: shallow d < 200 mm, intermediate 200–400 mm, deep d > 400 mm; we additionally flag very deep d ≥ 800 mm.
  • Concrete strength fc: low < 30 MPa, medium 30–60 MPa, high > 60 MPa.

4. Conclusions

The contribution of concrete to shear strength (Vc) depends on several factors, including concrete strength (f′c), the FRP reinforcement index (ρf), the modulus of elasticity of FRP bars (Ef), beam dimensions (bw and d), and the shear span ratio (a/d). However, the shear behavior of FRP-reinforced concrete beams remains not fully understood, which highlights the need for further research to develop an accurate equation or model that accounts for all these variables—FRP reinforcement index (ρf), modulus of elasticity (Ef), concrete strength (f′c), and shear span ratio (a/d)—to predict shear strength (Vc).
In this study, linear and nonlinear regression analysis methods are employed to propose several models for predicting the shear strength (Vc) of concrete beams reinforced with FRP bars without stirrups. Various combinations of key variables are considered, including beam depth (d), width (bw), FRP reinforcement index (ρf), modulus of elasticity (Ef), concrete strength (f′c), and shear span ratio (a/d), to develop the most accurate prediction equation.
A large database of test results from FRP-reinforced concrete beams found in the literature is utilized to develop the proposed models. The predictions from these models showed strong agreement with experimental data, with an average ratio of Vexp/Vcal close to one, indicating accurate predictions. The results of the proposed models are compared with predictions from 11 different models found in existing codes, standards, and literature to validate their accuracy.

Author Contributions

Conceptualization, M.H.F.R. and B.O.T.; methodology, B.O.T. and M.M.A.; validation, B.O.T., A.Z.S.A. and M.M.A.; formal analysis, M.M.A.; investigation, B.O.T.; resources, B.O.T.; data curation, B.O.T.; writing—original draft preparation, B.O.T.; writing—review and editing, M.M.A. and P.I.A.; visualization, B.O.T.; supervision, M.H.F.R.; project administration, B.O.T. All authors have read and agreed to the published version of the manuscript.

Funding

This research received no external funding.

Data Availability Statement

The original contributions presented in this study are included in the article. Further inquiries can be directed to the corresponding author.

Conflicts of Interest

The author declares no conflicts of interest.

References

  1. Thimmegowda, D.Y.; Hindi, J.; Markunti, G.B.; Kakunje, M. Enhancement of Mechanical Properties of Natural Fiber Reinforced Polymer Composites Using Different Approaches—A Review. J. Compos. Sci. 2025, 9, 220. [Google Scholar] [CrossRef]
  2. ACI Committee 440. Guide for the Design and Construction of Concrete Reinforced with FRP Bars; ACI 440.1R-01; American Concrete Institute: Farmington Hills, MI, USA, 2001. [Google Scholar]
  3. CSA S806-02; Design and Construction of Building Components with Fibre-Reinforced Polymers. Canadian Standards Association (CSA): Rexdale, ON, Canada, 2002; 177p.
  4. JSCE. Recommendation for Design and Construction of Concrete Structures Using Continuous Fiber Reinforced Materials; Machida, A., Ed.; Research Committee on Continuous Fiber Reinforced Materials; Japan Society of Civil Engineers: Tokyo, Japan, 1997. [Google Scholar]
  5. Tureyen, A.K.; Frosch, R.J. Shear Strength of FRP-Reinforced Concrete Beams without Stirrups. ACI Struct. J. 2002, 99, 427–443. [Google Scholar]
  6. El-Sayed, A.K.; El-Salakawy, E.F.; Benmokrane, B. Shear capacity of high-strength concrete beams reinforced with FRP bars. ACI Struct. J. 2006, 103, 383–389. [Google Scholar]
  7. Comité Euro-International du Béton; Fédération Internationale de la Précontrainte (CEB–FIP). Model Code 1990; Thomas Telford: London, UK, 1993. [Google Scholar]
  8. JSCE. Standard Specifications for Design and Construction of Concrete Structures. Part 1: Design; Japan Society of Civil Engineers: Tokyo, Japan, 1998. [Google Scholar]
  9. BS 8110:1985; Structural Use of Concrete—Code of Practice. British Standards Institution (BSI): London, UK, 1985.
  10. Hassan, B.R.; Yousif, A.R. Shear performance and strength of reinforced concrete non-prismatic beams with basalt fiber-reinforced polymer rebars. Structures 2024, 65, 106571. [Google Scholar]
  11. Ketenci, M.S.; Doğan, G. Enhancing the shear strengthening of reinforced concrete T-shaped beams using innovative fiber blocks/panels. Structures 2024, 63, 106294. [Google Scholar] [CrossRef]
  12. Zhao, W.; Maruyama, K. Shear behavior of concrete beams reinforced by FRP rods as longitudinal and shear reinforcement. In Non-Metallic (FRP) Reinforcement for Concrete Structures (FRPRCS-2); Taerwe, L., Ed.; CRC Press: Ghent, Belgium, 1995; pp. 352–359. [Google Scholar]
  13. Kar, S.; Biswal, K.C. Shear strengthening of reinforced concrete T-beams using fiber-reinforced polymer composites: A data analysis. Arab. J. Sci. Eng. 2020, 45, 4203–4234. [Google Scholar] [CrossRef]
  14. Askandar, N.H.; Jumaa, G.B.; Ahmed, G.H. Modeling for torsional strength prediction of strengthened RC beams. Multiscale Multidiscip. Model. Exp. Des. 2024, 7, 2535–2553. [Google Scholar] [CrossRef]
  15. Chowdhury, M.A.; Ibna Zahid, Z.; Islam, M.M. Development of shear capacity prediction model for FRP-RC beam without web reinforcement. Adv. Mater. Sci. Eng. 2016, 2016, 4356967. [Google Scholar] [CrossRef]
  16. Alam, M.S.; Hussein, A. Relationship between the shear capacity and the flexural cracking load of FRP-reinforced concrete beams. Constr. Build. Mater. 2017, 154, 819–828. [Google Scholar] [CrossRef]
  17. Razaqpur, A.G.; Isgor, O.B.; Greenaway, S.; Selley, A. Concrete contribution to the shear resistance of fiber-reinforced polymer reinforced concrete members. J. Compos. Constr. 2004, 8, 452–460. [Google Scholar] [CrossRef]
  18. El-Sayed, A.K.; Salakawy, E.; Benmokrane, B. Shear strength of one-way concrete slabs reinforced with fiber-reinforced polymer composite bars. J. Compos. Constr. 2005, 9, 147–157. [Google Scholar] [CrossRef]
  19. Rosa, I.C.; Firmo, J.P.; Correia, J.R.; Bisby, L.A. Fire behavior of GFRP-reinforced concrete structural members: A state-of-the-art review. J. Compos. Constr. 2023, 27, 03123002. [Google Scholar] [CrossRef]
  20. Matta, M.; Nanni, A.; Galati, N.; Mosele, F. Size effect on shear strength of concrete beams reinforced with FRP bars. In Proceedings of the 6th International Conference on Fracture Mechanics of Concrete and Concrete Structures (FraMCoS’08); 2008; Volume 2, pp. 17–22. [Google Scholar]
  21. Yost, J.R.; Gross, S.P.; Dinehart, D.W. Shear strength of normal-strength concrete beams reinforced with deformed GFRP bars. J. Compos. Constr. 2001, 5, 268–275. [Google Scholar] [CrossRef]
  22. Razaqpur, A.G.; Shedid, M.; Isgor, O.B. Shear strength of fiber-reinforced polymer reinforced concrete beams subjected to unsymmetric loading. J. Compos. Constr. 2011, 15, 512. [Google Scholar] [CrossRef]
  23. Abdul-Salam, B.; Farghaly, A.S.; Benmokrane, B. Evaluation of shear behaviour for one-way concrete slabs reinforced with carbon FRP bars. In Proceedings of the CSCE 2013 General Conference, Montréal, QC, Canada, 29 May–1 June 2013. [Google Scholar]
  24. Kim, C.H.; Jang, H.S. Concrete shear strength of normal and lightweight concrete beams reinforced with FRP bars. J. Compos. Constr. 2014, 18, 04013038. [Google Scholar] [CrossRef]
  25. Ashour, A.F.; Kara, I.F. Size effect on shear strength of FRP-reinforced concrete beams. Compos. Part B Eng. 2014, 60, 612–620. [Google Scholar] [CrossRef]
  26. Ashour, A.F. Flexural and shear capacities of concrete beams reinforced with GFRP bars. Constr. Build. Mater. 2006, 20, 1005–1015. [Google Scholar] [CrossRef]
  27. Guadagnini, M.; Pilakoutas, K.; Waldron, P. Shear resistance of FRP-RC beams: Experimental study. J. Compos. Constr. 2006, 10, 464–473. [Google Scholar] [CrossRef]
  28. Olivito, R.S.; Zuccarello, F.A. On the shear behaviour of concrete beams reinforced by carbon fibre-reinforced polymer bars: An experimental investigation by means of acoustic emission technique. Strain 2010, 46, 470–481. [Google Scholar] [CrossRef]
  29. Michaluk, C.R.; Rizkalla, S.H.; Tadros, G.; Benmokrane, B. Flexural behavior of one-way concrete slabs reinforced by fiber-reinforced plastic reinforcements. ACI Struct. J. 1998, 95, 353–365. [Google Scholar]
  30. Issa, M.A.; Ovitigala, T.; Ibrahim, M. Shear behavior of basalt fiber-reinforced concrete beams with and without basalt FRP stirrups. J. Compos. Constr. 2016, 20, 04015083. [Google Scholar] [CrossRef]
  31. El Refai, A.; Abed, F. Concrete contribution to shear strength of beams reinforced with basalt fiber-reinforced bars. J. Compos. Constr. 2016, 20, 04015082. [Google Scholar] [CrossRef]
  32. Deitz, D.H.; Harik, I.E.; Gesund, H. One-way slabs reinforced with glass fiber-reinforced polymer reinforcing bars. In Proceedings of the 4th International Symposium, Bordeaux, France, 13–16 September 1999; American Concrete Institute: Detroit, MI, USA, 1999; pp. 279–286. [Google Scholar]
  33. El-Sayed, A.K.; El-Salakawy, E.F.; Benmokrane, B. Shear strength of FRP-reinforced concrete beams without transverse reinforcement. ACI Struct. J. 2006, 103, 235–243. [Google Scholar] [CrossRef]
  34. Alkhrdaji, T.; Wideman, M.; Belarbi, A.; Nanni, A. Shear strength of RC beams and slabs. In Composites in Construction; Figueiras, J., Juvandes, L., Faria, R., Eds.; A.A. Balkema: Lisse, The Netherlands, 2001; pp. 409–414. [Google Scholar]
  35. Tariq, M.; Newhook, J.P. Shear testing of FRP-reinforced concrete without transverse reinforcement. In Proceedings of the Annual Conference of the Canadian Society for Civil Engineering, Moncton, NB, Canada, 4–7 June 2003; pp. 1330–1339. [Google Scholar]
  36. Mizukawa, Y.; Sato, Y.; Ueda, T.; Kakuta, Y. A study on shear fatigue behavior of concrete beams with FRP rods. In Proceedings of the 3rd International Symposium on Non-Metallic (FRP) Reinforcement for Concrete Structures (FRPRCS-3), Sapporo, Japan, 14–16 October 1997; Japan Concrete Institute: Sapporo, Japan, 1997; pp. 309–316. [Google Scholar]
  37. Alam, M.S. Influence of Different Parameters on Shear Strength of FRP-Reinforced Concrete Beams without Web Reinforcement. Ph.D. Thesis, Memorial University of Newfoundland, St. John’s, NL, Canada, 2010. [Google Scholar]
  38. Steiner, S.; El-Sayed, A.K.; Benmokrane, B.; Matta, F.; Nanni, A. Shear strength of large-size concrete beams reinforced with glass FRP bars. In Proceedings of the 5th International Conference on Advanced Composite Materials in Bridges and Structures (ACMBS-V), Winnipeg, MB, Canada, 22–24 September 2008. [Google Scholar]
  39. Duranovic, N.; Pilakoutas, K.; Waldron, P. Tests on concrete beams reinforced with glass fiber-reinforced plastic bars. In Proceedings of the 3rd International Symposium on Non-Metallic (FRP) Reinforcement for Concrete Structures (FRPRCS-3), Sapporo, Japan, 14–16 October 1997; Japan Concrete Institute: Sapporo, Japan, 1997; pp. 479–486. [Google Scholar]
  40. Bentz, E.C.; Massam, L.; Collins, M.P. Shear strength of large concrete members with FRP reinforcement. J. Compos. Constr. 2010, 14, 637–646. [Google Scholar] [CrossRef]
  41. Matta, F.; El-Sayed, A.K.; Nanni, A.; Benmokrane, B. Size effect on concrete shear strength in beams reinforced with fiber-reinforced polymer bars. ACI Struct. J. 2013, 110, 617–628. [Google Scholar] [CrossRef]
  42. Gross, S.P.; Yost, J.R.; Dinehart, D.; Suensen, E.; Liu, N. Shear strength of normal- and high-strength concrete beams reinforced with GFRP reinforcing bars. In Proceedings of the International Conference on High Performance Materials in Bridges; American Society of Civil Engineers (ASCE): Reston, VA, USA, 2003; pp. 426–437. [Google Scholar]
  43. Jang, H.; Kim, M.; Cho, J.; Kim, C. Concrete shear strength of beams reinforced with FRP bars according to flexural reinforcement ratio and shear span-to-depth ratio. In Proceedings of the 9th International Symposium on Fiber-Reinforced Polymer Reinforcement for Concrete Structures (FRPRCS-9), Adelaide, Australia, 12–15 July 2009. [Google Scholar]
  44. Tottori, S.; Wakui, H. Shear Capacity of RC and PC Beams Using FRP Reinforcement; ACI Special Publication: Farmington Hills, MI, USA, 1993; Volume 138. [Google Scholar]
  45. Nagasaka, T.; Fukuyama, H.; Tanigak, M. Shear Performance of Concrete Beams Reinforced with FRP Stirrups; ACI Special Publication: Farmington Hills, MI, USA, 1993; Volume 138. [Google Scholar]
  46. Nakamura, H.; Higai, T. Evaluation of shear strength of concrete beams reinforced with FRP. Proc. Jpn. Soc. Civ. Eng. 1995, 26, 89–100. [Google Scholar] [CrossRef] [PubMed]
  47. Massam, L. The Behaviour of GFRP Reinforced Concrete Beams in Shear. Master’s Thesis, University of Toronto, Toronto, ON, Canada, 1993. [Google Scholar]
  48. Alkhrdaji, T.; Nanni, A. Surface-bonded FRP reinforcement for strengthening/repair of reinforced concrete structures. In Proceedings of the ICRI–NRCC Workshop, Baltimore, MD, USA, 30 October 1999; p. 19. [Google Scholar]
  49. Gross, S.P.; Walkup, S.L.; Musselman, E.S.; Stefanski, D.J. Influence of gross-to-cracked section moment of inertia ratio on long-term deflections in GFRP-reinforced concrete members. J. Compos. Constr. 2018, 22, 04018059. [Google Scholar] [CrossRef]
  50. Swamy, R.N.; Aburawi, M. Structural implications of using GFRP bars as concrete reinforcement. In Proceedings of the 3rd International Symposium on Non-Metallic (FRP) Reinforcement for Concrete Structures (FRPRCS-3), Sapporo, Japan, 14–16 October 1997; Japan Concrete Institute: Sapporo, Japan, 1997; Volume 2, pp. 503–510. [Google Scholar]
  51. Maruyama, K.; Zhao, W.J. Flexural and shear behavior of concrete beams reinforced with FRP rods. In Corrosion and Corrosion Protection of Steel in Concrete; Sheffield Academic Press: London, UK, 1994; pp. 1330–1339. [Google Scholar]
  52. Lubell, A.; Sherwood, T.; Bentz, E.C.; Collins, M.P. Safe shear design of large wide beams. Concr. Int. 2004, 26, 66–78. [Google Scholar]
  53. Alam, M.S.; Hussein, A. Effect of member depth on shear strength of high-strength FRP-reinforced concrete beams. J. Compos. Constr. 2012, 16, 119–126. [Google Scholar] [CrossRef]
  54. Kilpatrick, A.E.; Easden, L.R. Shear Capacity of GFRP-Reinforced High Strength Concrete Slabs. In Developments in Mechanics of Structures and Materials; Deeks, A.J., Hao, H., Eds.; Taylor & Francis: Abingdon, UK, 2005; Volume 1, pp. 119–124. [Google Scholar]
  55. Kilpatrick, A.E.; Dawborn, R. Flexural Shear Capacity of High Strength Concrete Slabs Reinforced with Longitudinal GFRP Bars. In Proceedings of the FIB Conference, Naples, Italy, 5–8 June 2006; pp. 1–10. [Google Scholar]
  56. Niewels, J. Zum Tragverhalten von Betonbauteilen mit Faserverbundkunststoff-Bewehrung. Ph.D. Thesis, Aachen University, Aachen, Germany, 2008. [Google Scholar]
  57. El-Sayed, A.K.; Soudki, K.; Kling, E. Flexural Behaviour of Self-Consolidating Concrete Slabs Reinforced with GFRP Bars. In Proceedings of the FRPRCS-9, Sydney, Australia, 13–15 July 2009. [Google Scholar]
  58. Caporale, A.; Luciano, R. Indagine Sperimentale e Numerica sulla Resistenza a Taglio di Travi di Calcestruzzo Armate con Barre di GFRP. In XXXVIII Convegno Nazionale AIAS; AIAS: Washington, DC, USA, 2009; p. 10. [Google Scholar]
  59. Jumaa, G.B.; Yousif, A.R. Predicting shear capacity of FRP-reinforced concrete beams without stirrups by artificial neural networks, gene expression programming, and regression analysis. Adv. Civ. Eng. 2018, 2018, 5157824. 16p. [Google Scholar] [CrossRef]
  60. ACI Committee 318. Building Code Requirements for Structural Concrete (ACI 318-19) and Commentary (ACI 318R-19); American Concrete Institute: Farmington Hills, MI, USA, 2019. [Google Scholar]
  61. ISIS Canada. Reinforced Concrete Structures with Fibre-Reinforced Polymers: Design Manual No. 3; ISIS-M03-01; Intelligent Sensing for Innovative Structures, The Canadian Network of Centres of Excellence, University of Manitoba: Winnipeg, MB, Canada, 2001; 81p. [Google Scholar]
  62. CAN/CSA-S806-02; Design and Construction of Building Components with Fibre-Reinforced Polymers. Canadian Standards Association (CSA): Mississauga, ON, Canada, 2004.
  63. ISE, Institution of Structural Engineers (IStructE). Interim Guidance on the Design of Reinforced Concrete Structures Using Fibre Composite Reinforcement; Institution of Structural Engineers: London, UK, 1999. [Google Scholar]
  64. CAN3-A23.3-M94; Design of Concrete Structures for Buildings. Canadian Standards Association (CSA): Rexdale, ON, Canada, 1994.
Figure 1. Research Design and Analytical Workflow.
Jcs 09 00554 g001
Figure 2. Experimental shear versus predicted from Equation (7).
Jcs 09 00554 g002
Figure 3. Experimental shear versus predicted from Equation (8).
Jcs 09 00554 g003
Figure 4. Experimental Shear Versus Predicted from Equation (9).
Jcs 09 00554 g004
Figure 5. Experimental Shear Versus Predicted from Equation (10).
Jcs 09 00554 g005
Figure 6. Experimental Shear Versus Predicted from Equation (11).
Jcs 09 00554 g006
Figure 7. Experimental Shear Versus Predicted from Equation (12).
Jcs 09 00554 g007
Figure 8. Experimental Shear Versus Predicted from Equation (13).
Jcs 09 00554 g008
Figure 9. Experimental Shear Versus Predicted from Equation (14).
Jcs 09 00554 g009
Figure 10. Experimental Shear Versus Predicted from Equation (15).
Jcs 09 00554 g010
Figure 11. Experimental Shear Versus Predicted from Equation (17).
Jcs 09 00554 g011
Figure 12. Experimental Shear Versus Predicted from Equation (18).
Jcs 09 00554 g012
Figure 13. Experimental shear versus predicted from (a) CSA-S806 (2002) [3], (b) JSCE 1997 [4], (c) Chewdhury & Islam [15], (d) Michaluk et al. [29], (e) Jumma & Yousif [59], (f) ACI 318-19 [60], (g) Deitz et al. [32], (h) ISIS—M03-01 [61], (i) CSA 2004 [62], (j) ISE 1999 [63], and (k) CSA/CAN3-A23.3-M94 [64].
Jcs 09 00554 g013aJcs 09 00554 g013bJcs 09 00554 g013c
Table 1. Experimental database compiled from the literature.
No.ReferenceNo. of Samplesd (mm)a/db (mm)ρf (%)f′c (MPa)Ef (GPa)Vu (kN)Failure Mode
1Tureyen and Frosch [5]63603.44570.96–1.9234.537.6–4794.8–177Diagonal Tension
2El-Sayed et al. [6]17154–3263.1–6.5250–10000.39–2.6340–6339–13460–190Shear Failure
3Razaqpur et al. [17]72251.82–4.52000.25–0.8840.5–4914536.11–96.18Shear Failure
4Alam and Hussein [16]29305–7442.52500.18–1.4734.5–88.346.358.6–155.2Shear Failure
5Matta et al. [20]13146–8833.11–3.13114–4570.59–1.1729.5–59.741–48.217.9–212.7Shear Failure
6El-Sayed et al. [18]8154.1–165.36–6.510000.39–2.634040–114113–190Diagonal Tension
7Yost et al. [21]202254.06–4.08121–2541.1–2.2736.340.313.9–51.1Diagonal Tension
8Razaqpur et al. [22]6200–5003.5–6.53000.28–0.3552.311454.1–71.2Shear Tension
9Abdul-Salam et al. [23]91406.210000.52–1.2541.3–86.2140–144118.5–192.3Diagonal Tension
10Kim and Jang [24]34214–2162.5–4.5150–2000.33–0.793048.2–147.916.9–35.4Shear Failure
11Ashour and Kara [25]6170–3702.7–5.92000.12–0.5222.14–28.7141.417.58–36.12Shear Failure
12Ashour [26]6168–2632.53–4.091500.45–1.328.9–50.232–3813.1–3.9Shear Tension
13Guadagnini et al. [27]3150–2231.1–3.35150–2241.28–2.2842.8–4345–4627.9–81Diagonal Tension
14Olivito and Zuccarello [28]41705.881501.33–2.2220–26.611319.3–27.7Shear Tension
15Michaluk et al. [29]2104–1548.44–12.510000.76–0.966641.337.03–79.05Shear compression
16Issa et al. [30]6165–1705.65–73000.803–4.12135.948–5329.3–51.5Diagonal Tension
17El Refai and Abed [31]8206–2202.5–3.31520.31–1.52495017–31.6Diagonal Tension
18Deitz et al. [32]5157.54.5–5.83050.7327–30.84028–30.8Shear Failure
19El-Sayed et al. [33]103263.072500.87–1.7243.6–5039–13460–124.5Shear Failure
20Zhao and Maruyama [12]325031501.51–3.0234.310540.5–46Shear Failure
21Alkhrdaji et al. [34]3279–2872.61–2.691780.77–2.324.14072.2–106.8Shear Tension
22Tariq and Newhook [35]12310–3462.8–3.7130–1600.72–1.5434.1–43.242–12042.7–63.7Diagonal Tension
23Mizukawa et al. [36]126032001.334.713062.2Shear Failure
24Alam [37]28296–7441.5–3.5250–3000.22–1.4334.5–88.346.3–14443.7–155.2Shear Failure
25Steiner et al. [38]2457–8893.09–3.1457–8890.6–1.1929.641159–187.5Shear Failure
26Duranovic et al. [39]22103.71501.3132.9–38.14522.8–27.3Shear Failure
27Bentz et al. [40]5188–8573.5–4.14500.55–2.54353774–232Shear Failure
28Matta et al. [41]7294–8833.1114–4570.5929.5–38.840.7–40.818.1–158.9Shear Failure
29Gross et al. [42]12141–1436.4–6.589–1590.33–0.7660.3–81.413911.7–23.1Shear Tension
30Jang et al. [43]54220–2251.5–4.5150–2000.3–0.83025.1–147.918–85.12Shear Failure
31Tottori and Wakui [44]63252.2–4.32000.7–0.944.6–46.958–19247.1–147.1Diagonal Tension
32Nagasaka et al. [45]22531.82501.922.9–34.156–9683.4–112.8Shear Failure
33Nakamura and Higai [46]215043001.3–1.822.7–27.82933.1–36.3Shear Failure
34Massam [47]7187–9383.3–4.14500.535–4626.5–29.439–231.4Shear compression
35Alkhrdaji et al. [48]3279–2872.61–2.691780.77–2.324.14036.1–53.4Shear Tension
36Gross et al. [49]12224–2254.06–4.08150–2031.25–2.5679.640.330.4–48.3Shear Failure
37Swamy and Aburawi [50]12223.151541.55393419.5Shear Failure
38 Maruyama and Zhao [51]425031500.55–2.227.5–34.99438.3–59.1Shear Failure
49Lubell et al. [52]19703.144500.464040136Shear Failure
40Alam and Hussain [53]6291–5942.5250–3000.42–1.3765.3–74.246.3–14471.6–155.2Shear Failure
41Kilpatrick and Easden [54]1278–833.61–6.414200.61–2.6161–9340–4220–55.6Shear compression
42Kilpatrick and Dawborn [55]973–756–6.164200.68–1.1648–924223.5–34.3Shear Failure
43Niewels [56]3404–4413.02–3.713003.25–3.984344–63118.4–154.3Shear Failure
44Elsayed et al. [57]22626.686000.77–1.53684891.2–118.2Shear compression
45Caporale and Luciano [58]41704.121500.92–1.5420–26.64612.7–15.4Shear Failure
RemarksTotal = 402Ranged from 73 to 970 mmRanged from 1.1 to 12.5Ranged from 89 to 1000 mmRanged from 0.12 to 122%Ranged from 20 to 93 MPaRanged from 25.1 to 192 GPaRanged from 8.8 to 232 kNShear Failure
b (mm): beam width (measured at the constant-depth test region). d (mm): effective depth to the centroid of longitudinal FRP tension bars (measured per specimen). a/d: shear span-to-depth ratio (load point to support centerline divided by d). ρf (%): longitudinal FRP reinforcement ratio = Af/(b d) × 100. Ef (GPa): elastic modulus of longitudinal FRP bars. Vu (kN): measured peak shear at failure. f′c (MPa): cylindrical concrete compressive strength.
Table 2. Benchmark Shear-Strength Models from Prior Studies.
No.ReferencesModels Form Literature
1CSA-S806 [2] Vc   =   0.035   λ   ϕ c f c . ρ f . E f . ( V u d ) M u 3 b w d(19)
where d ≤ 300 mm
For   normal   weight   concrete ;   λ   =   1   and   ϕ c = 0.75.
Vc   =   ( 130 / ( 1000   +   d ) )   λ   ϕ c f c b w d(20)
where d > 300
For   normal   weight   concrete ;   λ   =   1   and   ϕ c = 0.75.
2JSCE [4] Vc = β d β ρ β n f u v d γ b b w   d (21)
βd = 1000 d 4 1.5
β ρ   =   100 ρ f E f E s 3 1.5
β n   =   1 + 2 M C M d 2   f o r   N d ` 0 ,   o r   β n = 1 + 2 M c M d 0   f o r   N d ` < 0
fuvd   =   0.2   f c 3 ≤ 0.72
γ b = member safety factor = 1.3
N d ` = design axial compressive force
M c = decompression moment
M d = design bending moment
3Chewdhury and Islam [15] Vc = 0.223 + 0.19   b w + 9.433 f c + ( 1.63   ×   10 10 )   d 4 + 2.63 E f 37.571   a d 2 3 + 12.966   ρ f (22)
4Michaluk et al. [29] Vc   = 1 6 E f E s f c b w d(23)
5Jumma and Yousif [59] Vc = 0.32   1 d 3 ρ f E f a / d 2 5 f c 5 b w   d (24)
6ACI 318-19 [60] Vc   =   1 6 f c b w d(25)
7Deitz et al. [32] Vc   =   3   E f E s f c b w d(26)
8ISIS—M03-01 [61] For   d     300   mm ;   Vc   =   0.2   λ   ϕ c   E f E s f c b w d(27)
For   d   >   300   mm ;   Vc   =   260 1000 + d λ   ϕ c   E f E s f c b w d(28)
9CSA 2004 [62] For   d     300   mm ;   V c = 130 1000 + d λ ϕ c f c b w   d (29)
For   d   >   300   mm ;   V c = 260 1000 + d λ ϕ c E f E n f c b w   d (30)
10ISE 1999 [63] Vc = 0.79   100 P e f f 3 400 d 4 f c u 25 3 b w   d (31)
ρ e f f = ρ f E f E s
11CSA/CAN3-A23.3-M94 [43] Vc   =   0.2   λ   ϕ c   f c b w d(32)
Disclaimer/Publisher’s Note: The statements, opinions and data contained in all publications are solely those of the individual author(s) and contributor(s) and not of MDPI and/or the editor(s). MDPI and/or the editor(s) disclaim responsibility for any injury to people or property resulting from any ideas, methods, instructions or products referred to in the content.