Article

Micrographite (μG) and Polypropylene (PP) Composites: Preparation and Influence of Filler Content on Property Modifications

1
Department of Chemical Engineering, Jadavpur University, Kolkata 700032, India
2
Department of Chemical Engineering, Indira Gandhi Institute of Technology, Sarang 759146, India
*
Author to whom correspondence should be addressed.
J. Compos. Sci. 2024, 8(8), 298; https://doi.org/10.3390/jcs8080298
Submission received: 28 June 2024 / Revised: 27 July 2024 / Accepted: 30 July 2024 / Published: 1 August 2024
(This article belongs to the Special Issue Progress in Polymer Composites, Volume III)

Abstract

:
It is difficult to select low-cost filler materials. Specifically, carbon-based filling materials are a matter of concern, and developing a carbon-filled polymer composite with enhanced properties is necessary. In this study, the authors developed a polymer composite using virgin polypropylene (PP) as a matrix and affordable micrographite (µG) as a filler. The developed composite has many potential applications in the automotive, aerospace, and electronic industries. To prepare the test specimens, the composite was prepared using a twin-screw extruder containing 3, 6, 9, 12, or 15 wt.% µG powder (BET surface area ≈ 29 m2/g; particle size > 50 µm) followed by injection molding. Different mechanical properties like the tensile, flexural, and impact strengths were determined. The prepared composites were further characterized by means of XRD, TGA, DSC, FTIR, DMA, FESEM, and PLM tests. The results were analyzed and compared with those for PP. Improved tensile (up to ≈ 34 MPa) and flexural (up to ≈ 40 MPa) strength was observed with an increase in the µG content. However, the impact strength continuously decreased (maximum ≈ 32 J/m for PP) with fractures. These findings underscore that graphite plays a significant role in controlling the deformation behavior and ultimate strength of composites. An XRD analysis revealed that adding graphite restructured the crystalline arrangement of PP and altered the composite’s crystallographic properties. Nonetheless, no induction effect (β-phase formation) was observed. A moderate enhancement in the thermal stability was observed owing to a small increase in the melt (Tm), onset (Tonset), and residual (TR) temperatures. A microstructural analysis showed that the micrographite powder strongly prevented spherulite growth and modified the graphite powder’s rate of dispersion and agglomeration in a polymer matrix. The results show that graphite could be a viable low-cost alternative carbon-based filler material in polypropylene matrices.

1. Introduction

Elemental carbon naturally exists in different forms, and graphite is one of its crystalline forms [1]. Graphite is a multilayer state of graphene. It is typically available as natural graphite, synthetic graphite, or biographite. Naturally available graphite is highly stable in standard conditions [2]. Synthetic and natural graphite are used in pencils, lubricants, and electrodes. In 2022, graphite consumption was as high as 1.3 million metric tons globally. Although graphite has good electrical and heat conductivity and infrared absorption properties, these traits are not outstanding [1,2,3,4,5].
Polypropylene is a commodity polymer with acceptable physiochemical properties. PP is a thermoplastic polymer with a low density and high melting point [6]. It has good chemical resistance and high flexibility [7] but poor thermal connectivity, making it a good insulating material. To enhance the overall performance of PP, several researchers have used carbon-based materials as filler materials [8,9,10,11]. The performance of carbon-based polymer composites is affected by several factors, viz., the content, particle size and distribution, and type of carbon filler [12]. Thus, it is important to select a suitable filler. Carbon-based fillers are available in nature and significantly modify the polymer’s natural properties. The available carbon-based fillers are graphite, carbon black, graphene, carbon nanotubes (CNTs), carbon nanofibers (CNFs), and fullerene [13]. Fillers like graphene, CNT, CNF, and fullerene are expensive, and their tendency to display agglomeration during melt mixing puts a limit on their use [14]. Hence, it is necessary to use low-cost carbon-based fillers that display excellent performance without compromising on cost. Graphite has been added to different thermoplastic polymers to determine its applications in energy storage devices [15]. Polymers with carbon fillers are emerging materials and can replace metals in appliance manufacturing. The thermal conductivity of polymer composites is an important property and has been enhanced by several researchers by adding expandable graphite to polymers like polyamide-6 and polyethylene through the melt-mixing method [16]. Thermal conductivity continuously increases with the graphite content. A thermally conductive composite was prepared by Wu et al. [17] using PP and 20 µm and 2 µm graphite particles. The thermal conductivity values of the composites were 1.125 W/m/K and 2.897 W/m/K when filled with 40 wt.% 20 and 2 µm graphite particles, respectively. Notably, these findings were limited to the laboratory scale and are difficult to apply in actual practice. Carbon-based fillers have unique advantages over metal fillers [18]. Owing to their lamellar structure, they reduce friction force and help to generate composites with isotropic properties. Polymer composites made from graphite are corrosion-resistive and highly heat-conductive, have low permeability, and are widely used in heat-exchanger devices [19]. However, carbon-based fillers like graphene, CNT, CNF, and fullerene produce more effective polymer composites because of their large specific areas and eye aspect ratios. Carbon black has been added as a secondary filler to graphite-based polymer composites, improving their heat and electrical conductivity [20]. Extensive studies exist on graphene-based composites. Polymers filled with graphene have efficient engineering properties, and CNTs are a good choice for researchers as fillers [21]. However, since the discovery of graphene, circumstances have changed. CNTs have not been found to have significant applications in profit-oriented technologies.
Our previous studies have focused on characterizing graphene nanoplatelet (GNP)-filled PP composites [22,23]. We observed that both the size and thickness of GNPs significantly affect the composite’s behavior. GNPs with a lower thickness and size are always recommended for the best performance in polymer composites. Studies on graphite-filled polymer composites are limited in the literature. As graphite is a low-cost carbon material and abundantly available in nature [24], its use as a filler material must be broadly studied. To overcome this problem, the authors have investigated the feasibility of graphite as a filler material in a polypropylene matrix, making it suitable for a wide range of applications. We used raw micrographite to fill polypropylene polymer using the melt-mixing method. The selected weight percentages of the graphite were 3, 6, 9, 12, and 15. The effects of the graphite content on the polymer’s mechanical, chemical, thermal, and microstructural properties were investigated in detail and are reported below.

2. Materials and Characterization Methods

2.1. Preparation of Polymer Composites

The current research used virgin polypropylene as a polymer matrix and graphite micropowder as a reinforcing material. PP pellets were purchased from Haldia Petrochemicals Ltd., Haldia, West Bengal, India. Graphite powder was purchased from Otto Chemie Pvt Ltd., Mumbai, Maharashtra, India. The physical properties of the materials as reported by the supplier are tabulated in Table 1.
Both materials were separately agitated in ethyl alcohol. Agitating raw materials in ethyl alcohol enhanced the graphite powder distribution in the PP matrix during mixing. Following agitation, both materials were dried in a vacuum oven at 40 °C for one day. Vacuum drying removes the encapsulated moisture content in the material and makes the mixing process efficient. The graphite powder was then manually added to the PP in different wt.% values of 3, 6, 9, 12, and 15.
The composite batches were stored separately and then melt-mixed using a twin-screw extruder (model-PTW 16, Thermo Electron Corporation, Dreieich, Germany). The extruder was maintained at operating conditions of 180 °C at the feeder and 255 °C at the heating zone. The attached screws were the corotating type and operated at 40 rpm, enabling proper melting and providing the polymer phase with good flow behavior. Finally, the extruded mixture was granulated. The granules of each batch were separately collected and sent for injection molding (Endura-90 injection molding machine, Pune, India). The molding process was carried out at 190 °C to prepare the tensile and flexural test specimens. The prepared polymer composites were assigned codes separately for ease of recognition. The sample codes are tabulated in Table 2. A field emission scanning electron microscope (FESEM, Quanta FEG 250) was used to determine the microstructure of the graphite powder; the results are shown in Figure 1. FESEM images were captured at ×10,000, ×50,000, and ×100,000 magnifications, and EDX (energy dispersive X-ray spectroscopy) analysis was performed. The EDX analysis revealed that the raw graphite contained 97.4 wt.% carbon and minor elements like oxygen and silica.

2.2. Characterization

2.2.1. Mechanical Properties

Mechanical characterization was performed by measuring the tensile, flexural, and impact strengths of the fabricated composites following the ASTM D638-02a, ASTM D790, and ASTM D256-A standards, respectively [25,26,27]. The first two tests were conducted using a universal testing machine (UTM3382, Norwood, MA, USA). The impact test employed a pendulum impact Charpy meter (IT 504 Plastic impact, Tinius Olsen, Horsham, PA, USA). The tester was equipped with a falling pendulum hammer capable of breaking a sample carved in the middle and positioned on two supports with a single blow. The test measured the energy absorbed during the break caused by the pendulum impact, which is reported in J/m. The experiments were carried out under normal atmospheric conditions. For each reported datum, the tests were conducted five times, and the average value was considered the final result.

2.2.2. Thermal Properties

The thermal properties of the polymer composites were jointly studied via thermogravimetric analysis (TGA) and differential scanning calorimetry (DSC) (TA Universal V4 5A, TA Instruments, Newcastle, DE, USA). TGA experiments were conducted by heating roughly 10 mg samples in an aluminum crucible to 800 °C at a heating rate of 10 °C/min in a nitrogen environment. The mass loss of the samples was reviewed to understand their degradation behavior. The DSC analysis was conducted by heating the samples to 190 °C, followed by a cooling cycle. The other operating conditions of the DSC test were the same as those of the TGA test. To delete the previous thermal history, the samples were first heated to 200 °C and held for up to 5 min; then, the samples were cooled to room temperature. The results of the second heating cycle were considered for analysis.

2.2.3. XRD Analysis

The crystalline structure of the materials was examined with an X-ray diffraction (XRD) analyzer (Rigaku Smart Lab SE, Tokyo, Japan). The graphite, PP, and prepared composites were tested with the XRD instrument. The test samples were scanned at a speed of 5 °C/min and a diffraction angle of 0–60°. The instrument was equipped to generate X-rays with copper (Cu) Kα radiation at a 1.54 Å wavelength.

2.2.4. Microstructural and FTIR Analysis

The surface microstructures of the materials and the prepared composites were studied with a field emission scanning electron microscope (FESEM, Quanta FEG 250, FEI Company, Eindhoven, The Netherlands), as previously stated. The FESEM instrument operated at a 20 kV acceleration voltage and different magnifications. Before characterization, all the test samples were uniformly sputter-coated with a gold layer to increase conductivity. The morphology of the polymer samples was further studied using a polarized light microscope (PLM, model-Leica DM750P, Wetzlar, Germany). The samples were heated to melt, and a thin film was made between two microglass slides. The molten thin polymer film was cooled to observe the spherulite structure. Fourier-transform infrared spectroscopy (FTIR, Perkin-Emler Spectrum 100, PerkinElmer, Inc., 940 Winter Street, Waltham, MA 02451 USA) tests were conducted to check the compatibility of the graphite powder in the PP matrix, revealing the chemical structure of these PP–graphite composites. The samples were scanned at wavenumbers from 500 to 4000 cm−1 under atmospheric temperature and pressure.

2.2.5. Rheology of Polymer Composites

Rheological properties were studied with a dynamic mechanical analyzer (DMA Q 800, TA instruments, New Castle, DE, USA). This instrument reveals the viscoelastic behavior of polymers under continuous applications of stress. To perform the test, 35 × 12 × 3 mm3 polymer samples were created, and experiments were conducted following ASTM D 5026 standards. Tests were conducted from −100 °C to 150 °C. The loss modulus, storage modulus, and tanδ results were monitored and reported. The instrument was operated at a heating rate of 10 °C/min and a 1 Hz frequency under a nitrogen atmosphere.

3. Results and Discussion

3.1. Tensile Strength

The experiment yielded clear observations of the composite materials’ behavior under tensile stress. Tensile stress was applied at a strain rate of 50 mm/min. In our previous study [22,23], the same virgin PP extended up to 120% under identical operating conditions and fractured at a stress of 16.46 MPa. The composite containing 15% graphite (PP-15G composite) fractured after experiencing only 4% deformation or strain with a stress absorption of 33.50 MPa, leading to breakage. Thus, ductility (the polymer chain mobility) decreases after increasing the graphite content of the composite.
This outcome can be attributed to the maximum graphite content present in the composite, which contributed to a decrease in its tensile strength. By contrast, the PP-3G composite with a 3 wt.% graphite composition exhibited the highest deformation from its original length, reaching 11.2%. The stress at which this composite fractured was approximately 30 MPa. These findings underscore the significant impact of graphite concentrations on the mechanical properties of composites, particularly their deformation behavior and ultimate tensile strength. Figure 2 shows the stress–strain behavior of the composites under tensile load. The comprehensive extracted data from Figure 2 are reported in Table 3. All the reported data in Table 3 are presented with their standard deviations (SDs). A maximum stress of 33.50 MPa (almost twice that of the virgin PP) and a load of 1350.40 N were observed in the PP-15G composite at its break point. The graphite particles inhibited the mobility of the polymer chain molecules (because of the decreased tensile strain), making the polymer stiffer, but the graphite particles simultaneously increased the load-carrying capacity of the polymer. This may be due to strong interfacial adhesion between graphite particles and PP chain molecules. Hence, graphite particles could be good filling agents for polymers like PP.
Furthermore, the broken tensile specimens were examined via FESEM to understand their failure mechanisms; the microstructures are shown in Figure 3. The deformation mechanism of virgin PP may occur because of shear yielding and crazing [28,29,30]. When tensile stress is applied, the PP chains permanently change dimensions owing to translational motion. This sufficiently deforms the PP molecules, leading to breakage, an irreversible change governed by several factors as follows: (1) how the crystal molecules are oriented inside the PP, (2) morphological defects, and (3) the distribution of phases [31]. Based on these discussions, it can be noted that the failure of the PP matrix is due to brittle fractures. In these situations, microvoids and fibrils will coexist on the surface (see Figure 3a). Graphite fillers in the PP matrix make the polymer stiffer and heterogeneous, dramatically changing its properties. In general, the properties of particulate-filled PP composites are regulated by filler composition, structure, and interactions between the filler and PP molecules [32]. The fracture behavior of the graphite-filled PP composites mostly depends on the degree of heterogeneity. The breaking mechanism under tensile load depends on particle size distribution, interfacial adhesion, and stress concentration [33]. FESEM images reveal that the stress distribution is uniform in the composite carrying 6 wt.% graphite. The broken surface of the PP-6G sample is more uniform, and no cracks or voids can be seen. However, cracks and local necking can be observed on the PP-15G sample. The surface is rougher, with high heterogeneity. Thus, reinforcing graphite leads to crack propagation; the composite breaks owing to plastic deformation and ductile fractures.

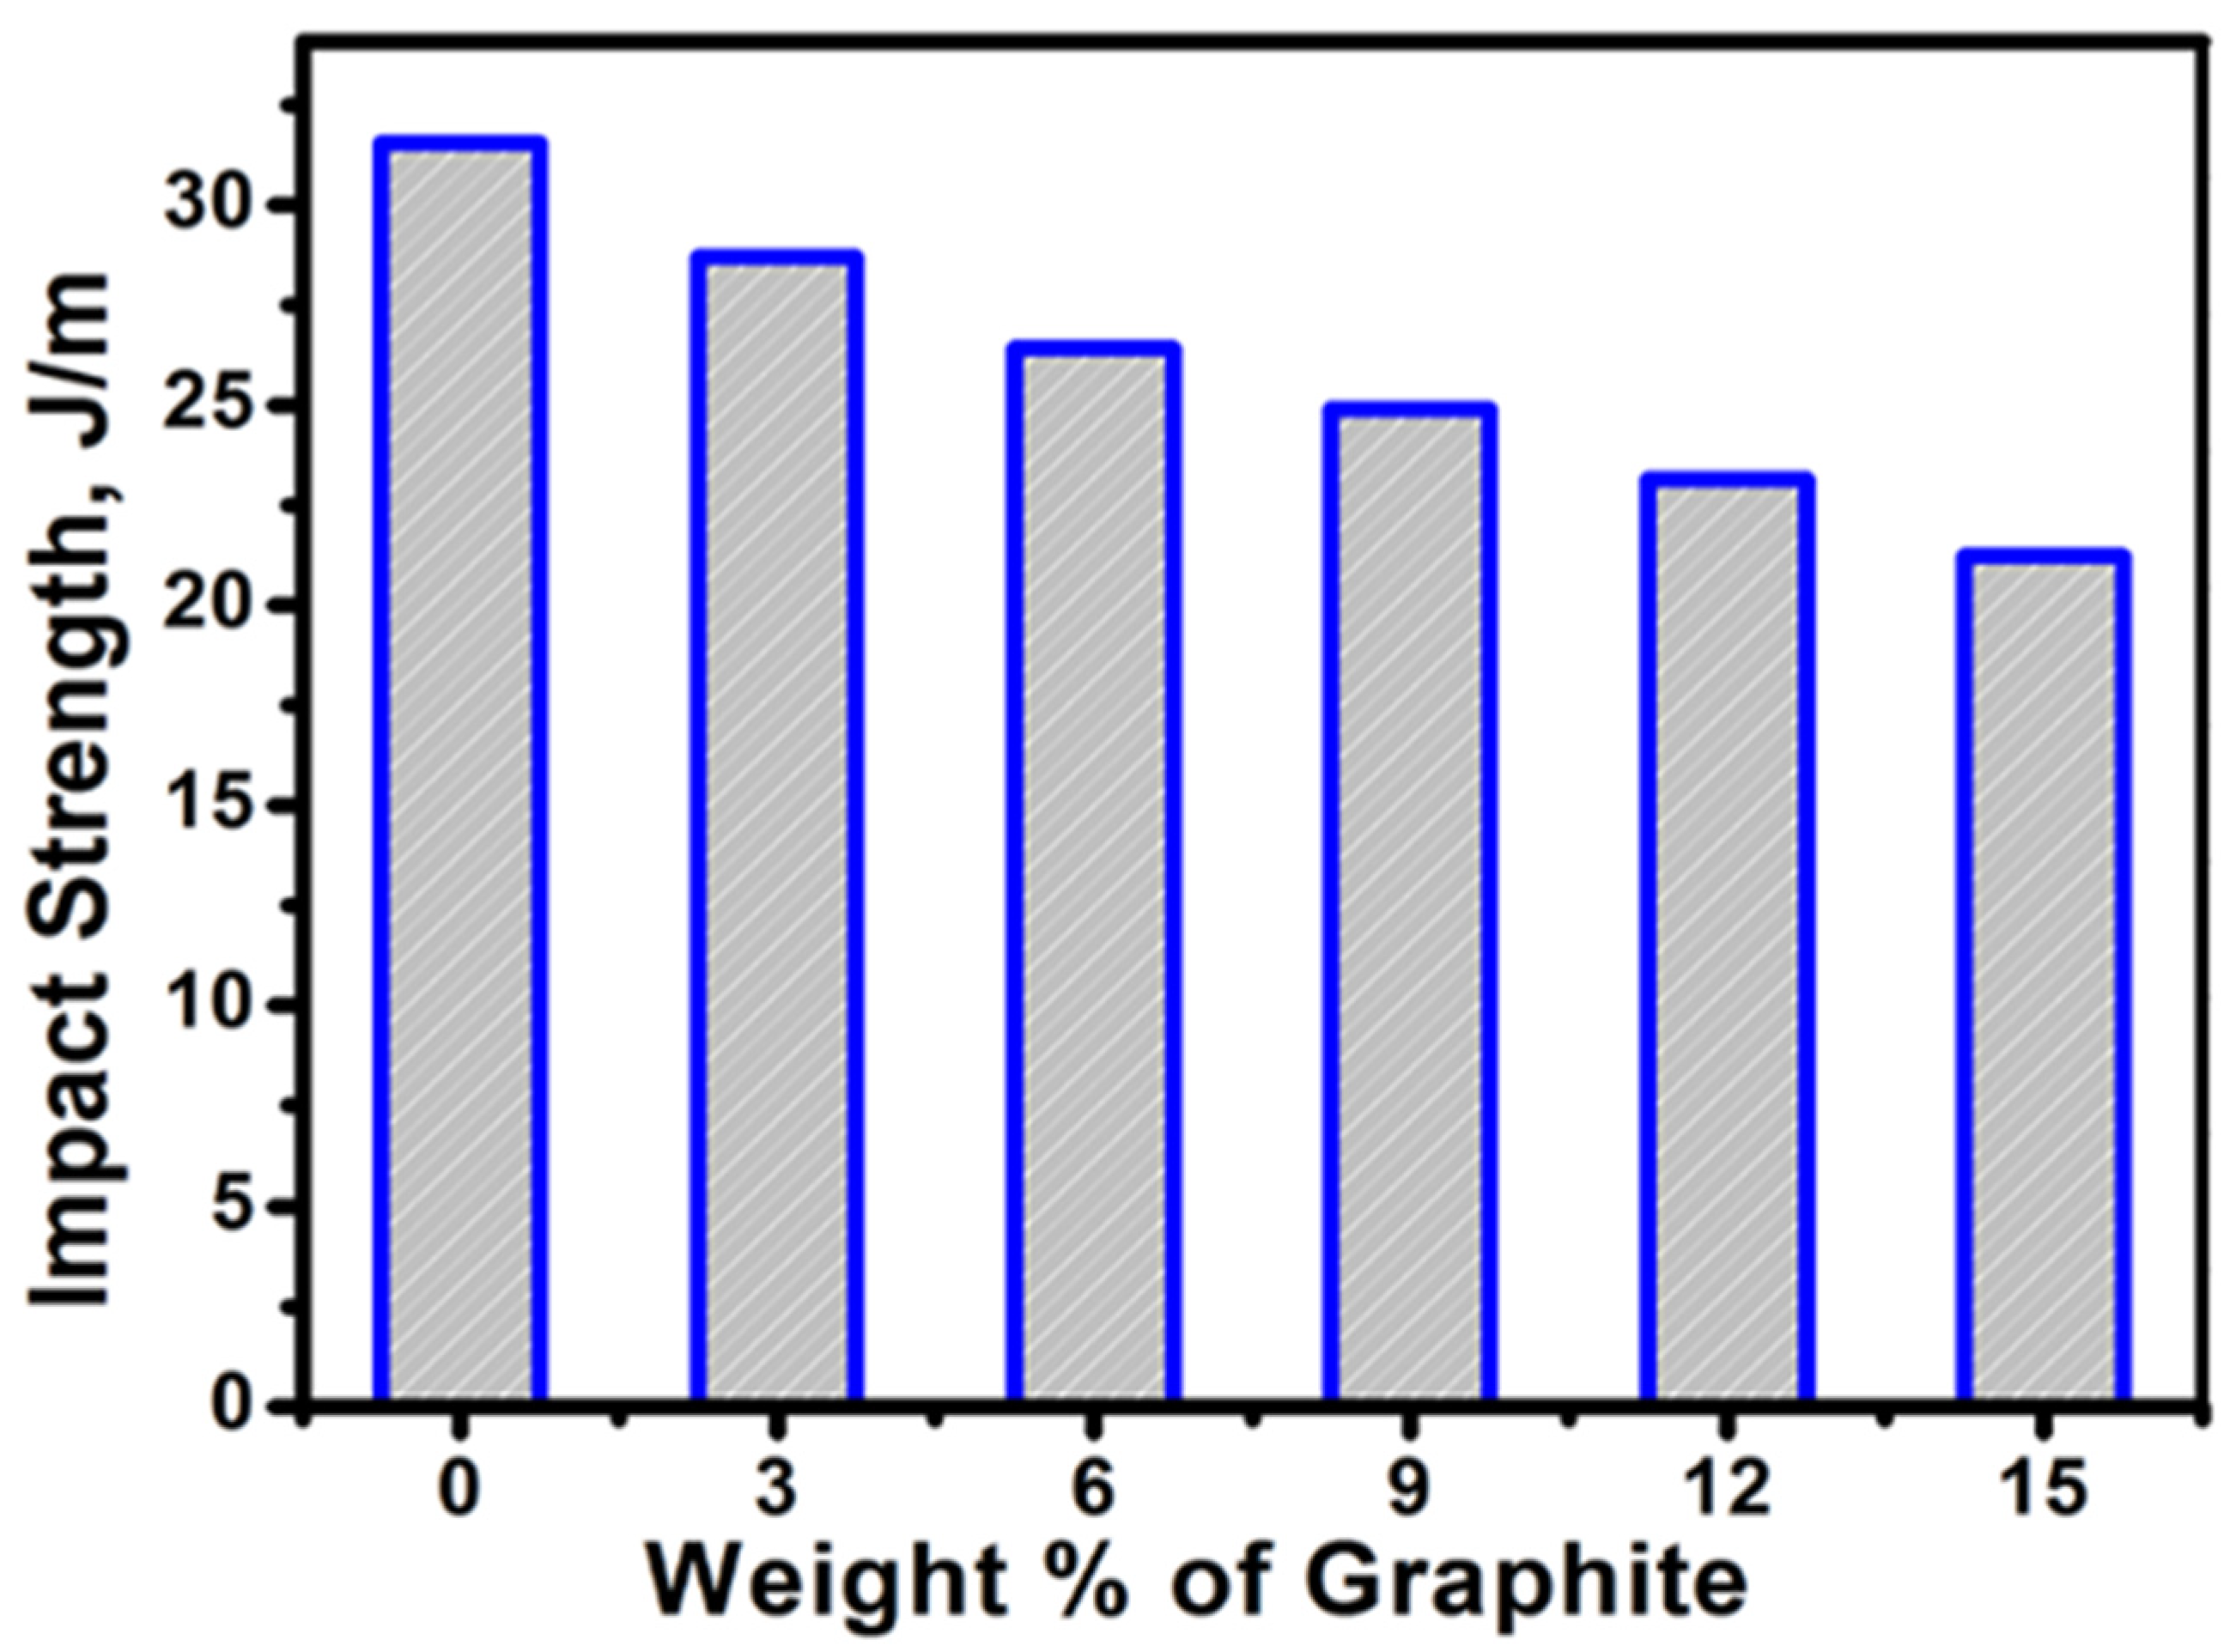
3.2. Flexural and Impact Strength

Notably, the samples did not rupture during the flexural tests. Thus, following the ASTM standard, the experiments were conducted up to 5% elongation. Analyzing the flexural testing data reveals a notable trend, wherein the composite’s ability to withstand flexural stress increases with higher graphite concentrations. For instance, at a 3 wt.% graphite concentration (PP-3G), the material demonstrates an approximately 37.24 MPa stress tolerance. However, with a modest increase to 6 wt.% graphite content, the stress tolerance rises to approximately 37.87 MPa. Subsequent graphite concentration increments further enhance stress tolerance. Notably, after consistent deformation from the original length (flexural strain of up to 2%), distinct stress tolerance levels can be observed. The virgin PP exhibits a stress tolerance of approximately 34 MPa, while the PP-15G composite displays a significantly higher stress tolerance of approximately 41 MPa. A stress–strain diagram for the flexural test is depicted in Figure 4. The increased stress tolerance resulting from higher graphite content underscores the composite’s improved resistance to bending, stretching, and deformation [34,35]. This phenomenon suggests that adding graphite reinforces the material’s structural integrity and mechanical properties.
Impact tests assessed the composites’ responses to sudden and high-intensity forces, revealing the following clear trend: as the graphite concentration increases in the composite material, its ability to withstand impacts decreases. Initially, the pure polypropylene displayed a significant impact resistance of 31.56 J/m. Upon adding 3 wt.% graphite (PP-3G sample), this resistance decreased to 28.70 J/m (see Figure 5). Further graphite content increments led to continuous reductions in impact resistance. This trend suggests that as more graphite is introduced into the composite, its rigidity increases (while elasticity diminishes), decreasing its fracture toughness [36,37]. Consequently, the material becomes less capable of sustaining impacts after bearing significant loads. Extracted data from Figure 4 and Figure 5 are disclosed in Table 4. The broken impact specimens were observed via FESEM to determine the microstructures of the ruptured surfaces.
FESEM images reveal that the broken surface of the PP matrix (Figure 6a) is smooth, and the brittle fracture mechanism prevails owing to the absence of graphite microparticles. The broken surfaces of the graphite-embedded polypropylene are relatively rough and have debonding cracks and voids. Increased graphite content leads to larger defects and subsequent crack growth. Reinforcing graphite in the PP matrix induces crazes in and around the surface of the polymer, leading to local stress concentration, cavitation, an increased bulk area, and decreased impact strength.

3.3. Crystallography, Polarized Light Microscopy, and FTIR

XRD analysis for PP–graphite composites involves using X-rays to examine their crystalline structures, revealing information about their arrangement, orientation, and crystallinity. This process identifies phases; assesses interlayer spacing and crystallite size; and detects any impurities, providing insights into structural properties and performance. The results are reported in Figure 7. The virgin PP shows four peaks at diffraction angles of 14.6, 16.95, 18.5, and 21.85. These peaks represent the (110), (040), (130), and (041) planes, respectively. Notably, the PP spectra reflect only the α-phase. The graphite powder reflects a major peak at 2θ = 26.5, validating the (002) plane. At 2θ = 54.8, a minor peak detected in pure graphite indicates impurities and validates the (004) plane. Interestingly, this same peak can be observed in the PP-12G and PP-15G composites, suggesting increased impurity levels with higher graphite content in the composite matrix.
The composites containing 3, 6, and 9 wt.% graphite reflect all the peaks present in the virgin PP and raw graphite but exclude the (004) plane, but in the PP-12G and PP-15G composites, crystallographic properties similar to pure graphite are evident. With an increased graphite percentage in the composite, there is a noticeable convergence in lattice arrangement toward that of pure graphite powder. This indicates a structural similarity between the composite and pure graphite at higher concentrations. The XRD analysis revealed that the intensity of peaks present in pure PP diminishes upon adding graphite. This implies a restructured crystalline arrangement, potentially due to incorporating graphite particles, altering the composite’s crystallographic properties. When the PP matrix contains 12 wt.% and 15 wt.% graphite, a nucleation effect is evident from the reflection of a new peak at 2θ = 25.6, validating the (060) plane of the α-crystals. Thus, adding or compounding graphite with PP significantly changes the arrangement of crystals, as evidenced by the XRD results. This alteration underscores the impact of composite formulation on the material’s structural characteristics.
The PP polymer crystallizes during solidification after the melt phase, and the crystal kinetics can be observed using a PLM. The PP matrix was observed under a microscope during the cooling stage to identify spherulite growth. The PLM was operated at ×50 magnification and a cooling rate of 5 °C/min for high-grade imaging. For virgin PP, the nucleation of crystals originated at 110 °C (see Figure 8a). At first, well-separated, tiny spherulite spots were observed, and they grew with time. A second image (see Figure 8b) was captured after 10 s. Notably, there was definite spherulite growth. The third and fourth images were similarly recorded. The spherulite growth rate was faster with time and became saturated. Large and distinguished spherulites could be seen in the virgin PP. The spherulites were spherical with curved boundaries, representing the α-crystal phase [38]. The spherulites were free from any defect or foreign materials, whereas the spherulite growth was significantly hindered by graphite particles. Graphite particles dispersed within the PP matrix were visualized, providing information about their size, shape, orientation, and distribution. Due to changes in crystallography (as evident from XRD analysis), many dark spots developed on the PP-12G and PP-15G composites. These dark spots constitute graphite particles in the matrix. This shows that there was no or little graphite filler agglomeration. A very wide graphite particle distribution could be observed on the PP-12G composite. The results show that the graphite particles sufficiently prevented crystallization but formed many nucleation sites with inadequate growth.
All the materials, including the prepared composites, passed through FTIR experiments to distinguish the interaction between the PP and graphite after compounding. This made it easy to find specific uses for these materials. Figure 9 illustrates the FTIR analysis results. The dominant feature in the FTIR spectrum of graphite is the absence of strong peaks in the fingerprint region (1500–500 cm−1). This region typically shows very weak or no peaks owing to strong covalent bonding between carbon atoms in the graphite lattice. However, a very weak peak can be observed at wavenumber ≈ 2360 cm−1 resulting from minor impurities like silicon dioxide [39]. The PP-G composites have peaks around 1440–1475 cm−1 corresponding to the asymmetric stretching vibrations in the methylene (CH2) groups. Broad peaks in the 3000–2850 cm−1 range correspond to the stretching vibrations of aliphatic (C-H) bonds in the PP backbone. The degree of crystallinity in PP can affect the intensity of certain peaks [40]. Higher crystallinity is often associated with increased peak intensity around 843 cm−1 (crystalline peaks) compared with peaks around.

3.4. Thermal Analysis

The thermal properties were studied by conducting both DSC and TGA. DSC tests evaluate the melt (Tm) and crystallization (Tc) temperatures and the melt (ΔHm) and crystallization (ΔHc) enthalpies of polymer samples. The results are plotted in Figure 10. The melting point temperature of the virgin PP was 162 °C. After graphite powder was added to the composite with 3 wt.%, the melting point increased by 2 °C (that is, to 164 °C). After adding 15 wt.% graphite powder to the composite, the melting point increased to 167 °C. The higher melting point of the composite indicates improved thermal stability compared with pure PP. This can be attributed to graphite filler, which may act as a nucleation site and increase the overall thermal resistance of the material. The higher melting point of the graphite–PP composite may make it suitable for applications where elevated temperatures are encountered, such as automotive components, electronic enclosures, and high-temperature packaging. The increased crystalline temperature could indicate an optimized composite formulation [41], suggesting that the 15 wt.% graphite content can enhance the crystallinity and thermal properties of the composite without significantly compromising other performance characteristics. The higher crystalline temperature of the PP-15G composite may make it suitable for applications requiring elevated thermal stability.
The thermal characteristics were further studied by conducting a TGA; the results are presented in Figure 11. The temperature at which the thermal decomposition or reaction begins is the onset temperature (Tonset). The temperature at which no further thermal decomposition takes place is the residual temperature (TR). First, the composite carries more volatile materials, which readily skip from the outer body of the material during heating at low to moderate temperatures. In the PP-15G composite, the mass decomposition percentage is lowest among all composites at 89% and highest among all PP at 99.26%, showing that the increased graphite composition in the PP matrix decreases the mass decomposition percentage. Tonset is highest in the composite carrying 15 wt.% graphite (~434 °C) and lowest in virgin PP (~385 °C). Thus, with a higher graphite composition, the thermal strength of the composite increases such that decomposition starts at high temperatures. The graphite particles act like mass transfer barrier agents and cause the volatile components to skip to the polymer’s outer surface [42,43,44,45]. Owing to the presence of graphite particles, the volatile gases generated during heating are trapped in the body of the polymer and have no space to fly. Thus, the filler-like graphite acts like a fire retardant in the polymer body, supporting its enhanced thermal capacity. Detailed data on the thermal study (both DSC and TGA) were extracted from Figure 10 and Figure 11 and are presented in Table 5.

3.5. Dynamic Mechanical Analysis (DMA)

DMA tests can determine the viscoelastic nature of polymers. Our analysis began with a subzero temperature of −100 °C to 150 °C, and the results are plotted in Figure 12. The storage modulus (E′), loss modulus (E″), and damping coefficient (tanδ) are reviewed against the temperature. At first, the storage modulus increases from −100 °C to about −80 °C. Then, a continuous decrease can be observed. The storage modulus is always high for graphite-embedded PP composites. Alternatively, the damping coefficient reflects the reverse phenomenon (i.e., the reinforcing graphite decreases tanδ). E’ reflects material stiffness and elasticity. Graphite enhances the rigidity of the polymer; it is a stiff material that can alter PP’s elasticity. The duration of the DMA experiment can be divided into five periods. In, the first period (pre-glassy stage), the storage modulus increases from −100 °C to −80 °C. The second period is from −80 °C to −20 °C and is known as the glassy stage. The glassy stage is characterized by a low storage modulus curve slope owing to the unreasonable flow of the material. The third period is the relaxation stage, which occurs from −20 °C to 35 °C, crossing the glass transition stage [46,47,48,49]. Here, the polymer molecules have local motion in and around the amorphous phase. In the fourth period, the polymer behaves like rubber, and this is called the rubbery stage. The rubbery state of the polymer continues up to 60 °C. This is an intermediate phase where the polymer molecules become soft and partially molten. The last and fifth period is the flow region, where the material moves with a fully developed flow and exists at the end of the test. Notably, in the flow region, the storage modulus curves for all the composites coincide. Thus, at high temperatures (above 100 °C), the amount of graphite content has fewer or negligible effects on viscoelastic behavior, indicating the same molecular mobility.

4. Conclusions

These research findings show that a low-cost carbon filler like graphite can successfully support melt mixing and injection molding with PP by building a fresh and advanced network in the polymer. Several experiments were conducted to determine the overall outlook of the composite. Although this investigation limited the graphite content to 15 wt.%, it may be extended to increase the graphite powder content so that the optimal composite performance can be observed. The electrical properties and thermal conductivity of the composite may be evaluated to determine its suitability for diverse applications. Many potential applications for the composite can be anticipated given its promising characteristics, including but not limited to the automotive, aerospace, and electronic industries. Reinforcing micrographite in PP significantly improves its tensile and flexural strength. However, its impact strength decreases. Thermal stability is not significantly enhanced when the graphite content is <10 wt.%, but reasonable thermal stability can be established at 15 wt.% graphite loading. A rheological analysis verified simultaneous improvements in the storage modulus and loss tangent with graphite incorporation. Thus, we conclude that “graphite is a performance booster.” Consequently, graphite can be used as a low-cost alternative carbon-based material to replace high-priced fillers.

Author Contributions

Conceptualization, R.D. and H.S.; methodology, R.D.; software, H.S. and R.M.; validation, D.R., R.D. and H.S.; formal analysis, R.D.; investigation, R.D.; resources, R.D.; data curation, R.D.; writing—original draft preparation, R.D.; writing—review and editing, R.D.; visualization, H.S.; supervision, D.R. and H.S.; project administration, H.S.; funding acquisition, R.D., H.S., R.M. and D.R. All authors have read and agreed to the published version of the manuscript.

Funding

This research received no external funding.

Data Availability Statement

The data presented in this study are available from the corresponding author with a reasonable request.

Conflicts of Interest

The authors declare no conflicts of interest.

References

  1. Sahu, D.; Sutar, H.; Senapati, P.; Murmu, R.; Roy, D. Graphene, Graphene-Derivatives and Composites: Fundamentals, Synthesis Approaches to Applications. J. Compos. Sci. 2021, 5, 181. [Google Scholar] [CrossRef]
  2. Fang, C.; Xiao, H.; Zheng, T.; Bai, H.; Liu, G. Organic Solvent Free Process to Fabricate High Performance Silicon/Graphite Composite Anode. J. Compos. Sci. 2021, 5, 188. [Google Scholar] [CrossRef]
  3. Tu, F.; Xie, J.; Cao, G.; Zhao, X. Self-Assembly of Bi2Te3-Nanoplate/Graphene-Nanosheet Hybrid by One-Pot Route and Its Improved Li-Storage Properties. Materials 2012, 5, 1275–1284. [Google Scholar] [CrossRef]
  4. Pan, J.; Zhang, D.; Wu, M.; Ruan, S.; Castro, J.M.; Lee, L.J.; Chen, F. Impacts of Carbonaceous Particulates on Extrudate Semicrystalline Polyethylene Terephthalate Foams: Nonisothermal Crystallization, Rheology, and Infrared Attenuation Studies. Ind. Eng. Chem. Res. 2020, 59, 15586–15597. [Google Scholar] [CrossRef]
  5. Lakatos, Á.; Csík, A. Multiscale Thermal Investigations of Graphite Doped Polystyrene Thermal Insulation. Polymers 2022, 14, 1606. [Google Scholar] [CrossRef]
  6. Naumova, L.; Minakova, T.; Gorlenko, N.; Kurzina, I.; Vasenina, I. Oxidative Destruction of Organic Pollutants on the Polypropylene Fiber Modified by Nanodispersed Iron. Environments 2018, 5, 82. [Google Scholar] [CrossRef]
  7. Kostic, S.; Kocovic, V.; Petrovic Savic, S.; Miljanic, D.; Miljojkovic, J.; Djordjevic, M.; Vukelic, D. The Influence of Friction and Twisting Angle on the Tensile Strength of Polypropylene Baling Twine. Appl. Sci. 2024, 14, 3046. [Google Scholar] [CrossRef]
  8. Sarı, A.; Karaipekli, A. Thermal conductivity and latent heat thermal energy storage characteristics of paraffin/expanded graphite composite as phase change material. Appl. Therm. Eng. 2007, 27, 1271–1277. [Google Scholar] [CrossRef]
  9. Karaipekli, A.; Sarı, A.; Kaygusuz, K. Thermal conductivity improvement of stearic acid using expanded graphite and carbon fiber for energy storage applications. Renew. Energ. 2007, 32, 2201–2210. [Google Scholar] [CrossRef]
  10. Krupa, I.; Novák, I.; Chodák, I. Electrically and thermally conductive polyethylene/graphite composites and their mechanical properties. Synth. Met. 2004, 145, 245–252. [Google Scholar] [CrossRef]
  11. Zhang, W.; Dehghani-Sanij, A.A.; Blackburn, R.S. Carbon based conductive polymer composites. J. Mater. Sci. 2007, 42, 3408–3418. [Google Scholar] [CrossRef]
  12. Sengupta, R.; Bhattacharya, M.; Bandyopadhyay, S.; Bhowmick, A.K. A review on the mechanical and electrical properties of graphite and modified graphite reinforced polymer composites. Prog. Polym. Sci. 2011, 36, 638–670. [Google Scholar] [CrossRef]
  13. Manawi, Y.M.; Ihsanullah; Samara, A.; Al-Ansari, T.; Atieh, M.A. A Review of Carbon Nanomaterials’ Synthesis via the Chemical Vapor Deposition (CVD) Method. Materials 2018, 11, 822. [Google Scholar] [CrossRef]
  14. Alshammari, B.A.; Wilkinson, A.N.; AlOtaibi, B.M.; Alotibi, M.F. Influence of Carbon Micro- and Nano-Fillers on the Viscoelastic Properties of Polyethylene Terephthalate. Polymers 2022, 14, 2440. [Google Scholar] [CrossRef] [PubMed]
  15. Kausar, A.; Ahmad, I.; Zhao, T.; Aldaghri, O.; Ibnaouf, K.H.; Eisa, M.H. Graphene Nanocomposites as Innovative Materials for Energy Storage and Conversion—Design and Headways. Int. J. Mol. Sci. 2023, 24, 11593. [Google Scholar] [CrossRef] [PubMed]
  16. Zhou, S.; Lei, Y.; Zou, H. High thermally conducting composites obtained via in situ exfoliation process of expandable graphite filled polyamide 6. Polym. Compos. 2013, 34, 1816–1823. [Google Scholar] [CrossRef]
  17. Wu, J.W.; Ji, X.Y.; Yang, J.D. Preparation and properties of polypropylene/graphite composites with high thermal conductivity. Eng. Plast. Appl. 2016, 44, 36–40. [Google Scholar]
  18. Myalski, J.; Godzierz, M.; Olesik, P. Effect of Carbon Fillers on the Wear Resistance of PA6 Thermoplastic Composites. Polymers 2020, 12, 2264. [Google Scholar] [CrossRef]
  19. Huang, Y.; Kormakov, S.; He, X.; Gao, X.; Zheng, X.; Liu, Y.; Sun, J.; Wu, D. Conductive Polymer Composites from Renewable Resources: An Overview of Preparation, Properties, and Applications. Polymers 2019, 11, 187. [Google Scholar] [CrossRef]
  20. Zambrzycki, M.; Sokolowski, K.; Gubernat, M.; Fraczek-Szczypta, A. Effect of Secondary Carbon Nanofillers on the Electrical, Thermal, and Mechanical Properties of Conductive Hybrid Composites Based on Epoxy Resin and Graphite. Materials 2021, 14, 4169. [Google Scholar] [CrossRef]
  21. Pączkowski, P.; Sigareva, N.V.; Gorelov, B.M.; Terets, M.I.; Sementsov, Y.I.; Kartel, M.T.; Gawdzik, B. The Influence of Carbon Nanotubes on the Physical and Chemical Properties of Nanocomposites Based on Unsaturated Polyester Resin. Nanomaterials 2023, 13, 2981. [Google Scholar] [CrossRef] [PubMed]
  22. Sutar, H.; Mishra, B.; Senapati, P.; Murmu, R.; Sahu, D. Mechanical, Thermal, and Morphological Properties of Graphene Nanoplatelet-Reinforced Polypropylene Nanocomposites: Effects of Nanofiller Thickness. J. Compos. Sci. 2021, 5, 24. [Google Scholar] [CrossRef]
  23. Patra, S.C.; Swain, S.; Senapati, P.; Sahu, H.; Murmu, R.; Sutar, H. Polypropylene and Graphene Nanocomposites: Effects of Selected 2D-Nanofiller’s Plate Sizes on Fundamental Physicochemical Properties. Inventions 2023, 8, 8. [Google Scholar] [CrossRef]
  24. Gautneb, H.; Rønning, J.S.; Engvik, A.K.; Henderson, I.H.C.; Larsen, B.E.; Solberg, J.K.; Ofstad, F.; Gellein, J.; Elvebakk, H.; Davidsen, B. The Graphite Occurrences of Northern Norway, a Review of Geology, Geophysics, and Resources. Minerals 2020, 10, 626. [Google Scholar] [CrossRef]
  25. ASTM D638-02a; Standard Test Method for Tensile Properties of Plastics. ASTM International: West Conshohocken, PA, USA, 2017.
  26. ASTM D790; Standard Test Methods for Flexural Properties of Unreinforced and Reinforced Plastics and Electrical Insulating Materials. ASTM International: West Conshohocken, PA, USA, 2017.
  27. ASTM D256-A; Standard Test Methods for Determining the Izod Pendulum Impact Resistance of Plastics. ASTM International: West Conshohocken, PA, USA, 2023.
  28. Kinloch, A.J.; Young, R.J. Fracture Behaviour of Polymers; Applied Science Publishers: Essex, UK, 1983. [Google Scholar]
  29. Oswald, T.A.; Menges, G. Materials Science of Polymers for Engineers, 2nd ed.; Hanser: Munich, Germany, 2003; p. 622. [Google Scholar]
  30. Arencón, D.; Velasco, J.I. Fracture Toughness of Polypropylene-Based Particulate Composites. Materials 2009, 2, 2046–2094. [Google Scholar] [CrossRef]
  31. Friedrich, K. Crazes and shear bands in semy-crystalline thermoplastics. In Crazing in Polymers; Hausch, H.H., Ed.; Springer: Berlin/Heidelberg, Germany, 1983; pp. 225–274. [Google Scholar]
  32. Mózczó, J.; Pukánszky, B. Polymer micro and nanocomposites: Structure, interactions, properties. J. Ind. Eng. Chem. 2008, 14, 535–563. [Google Scholar] [CrossRef]
  33. Zhuk, A.V.; Knunyants, N.N.; Oshmyan, V.G.; Topolkaraev, V.A.; Berlin, A.A. Debonding microprocesses and interfacial strength in particle-filled polymer materials. J. Mater. Sci. 1993, 28, 4995–5606. [Google Scholar] [CrossRef]
  34. Hutar, P.; Majer, Z.; Nahlik, L.; Shestakova, L.; Knesl, Z. Influence of particle size on the fracture toughness of a PP-based particulate composite. Mech. Compos. Mater. 2009, 45, 281–286. [Google Scholar] [CrossRef]
  35. Wang, K.; Wu, J.; Ye, L.; Zeng, H. Mechanical properties and toughening mechanisms of polypropylene/barium sulfate composites. Compos. Part A 2003, 34, 1192–1205. [Google Scholar] [CrossRef]
  36. Tsui, C.P.; Tang, C.Y.; Lee, T.C. Finite element analysis of polymer composites filled by interphase coated particles. J. Mater. Process. Technol. 2001, 117, 105–110. [Google Scholar] [CrossRef]
  37. Liang, J.Z.; Li, R.K.Y.; Tjong, S.C. Effects of filler content and size on drop-weight dart impact fracture behaviour of glass bead-filled polypropylene composites. J. Thermoplast. Compos. Mater. 2000, 13, 241–245. [Google Scholar] [CrossRef]
  38. Cui, L.; Wang, P.; Zhang, Y.; Zhang, L.; Chen, Y.; Wang, L.; Guo, X. Combined effect of α-nucleating agents and glass fiber reinforcement on a polypropylene composite: A balanced approach. RSC Adv. 2017, 7, 42783–42791. [Google Scholar] [CrossRef]
  39. Saravanan, S.; Dubey, R.S. Synthesis of SiO2 Nanoparticles by Sol-Gel Method and Their Optical and Structural Properties. Rom. J. Inf. Sci. Technol. 2020, 23, 105–112. [Google Scholar]
  40. Sutar, H.; Sahoo, P.C.; Sahu, P.S.; Sahoo, S.; Murmu, R.; Swain, S.; Mishra, S.C. Mechanical, Thermal and Crystallization Properties of Polypropylene (PP) Reinforced Composites with High Density Polyethylene (HDPE) as Matrix. Mater. Sci. Appl. 2018, 9, 502–515. [Google Scholar] [CrossRef]
  41. Xiao, W.; Wu, P.; Feng, J. Effect of β-nucleating agents on crystallization and melting behavior of isotactic polypropylene. J. Appl. Polym. Sci. 2008, 108, 3370–3379. [Google Scholar] [CrossRef]
  42. Um, J.G.; Jun, Y.-S.; Alhumade, H.; Krithivasan, H.; Lui, G.; Yu, A. Investigation of the size effect of graphene nano-platelets (GnPs) on the anti-corrosion performance of polyurethane/GnPcomposites. RSC Adv. 2018, 8, 17091–17100. [Google Scholar] [CrossRef]
  43. Saleem, A.; Zhang, Y.; Gong, H.; Majeed, M.K.; Jing, J.; Lin, X.; Ashfaq, M.Z. Enhanced thermal conductivity and mechanical properties of a GNP reinforced Si3N4 composite. RSC Adv. 2019, 9, 39986–39992. [Google Scholar] [CrossRef]
  44. Salavagione, H.J.; Gómez, M.A.; Martínez, G. Polymeric modification of graphene through esterification of graphite oxide and poly (vinyl alcohol). Macromolecules 2009, 42, 6331–6334. [Google Scholar] [CrossRef]
  45. Verdejo, R.; Barroso-Bujans, F.; Rodriguez-Perez, M.A.; Antonio de Saja, J.; Lopez-Manchado, M.A. Functionalized graphene sheet filled silicone foam nanocomposites. J. Mater. Chem. 2008, 18, 2221. [Google Scholar] [CrossRef]
  46. Lee, S.G.; Lee, J.; Choi, K.Y.; Rhee, J.M. Glass transition behavior of polypropylene/polystyrene/styrene-ethylene-propylene block copolymer blends. Polym. Bull. 1998, 40, 765–771. [Google Scholar] [CrossRef]
  47. Rahman, N.A.; Hassan, A.; Yahya, R.; Lafia-Araga, R.; Hornsby, P. Polypropylene/glass fiber/nanoclay hybrid composites: Morphological, thermal, dynamic mechanical and impact behaviors. J. Reinf. Plast. Compos. 2012, 31, 1247–1257. [Google Scholar] [CrossRef]
  48. Prolongo, S.G.; Jiménez-Suárez, A.; Moriche, R.; Ureña, A. Graphene nanoplatelets thickness and lateral size influence on the morphology and behavior of epoxy composites. Eur. Polym. J. 2014, 53, 292–301. [Google Scholar] [CrossRef]
  49. Mayoral, B.; Harkin-Jones, E.; Khanam, P.N.; AlMaadeed, M.A.; Ouederni, M.; Hamilton, A.R.; Sun, D. Melt processing and characterisation of polyamide 6/graphene nanoplatelet composites. RSC Adv. 2015, 5, 52395–52409. [Google Scholar] [CrossRef]
Figure 1. EDX-FESEM images of graphite powder: (a) EDX image; and FESEM images at (b) ×10,000, (c) ×50,000, and (d) ×100,000 magnifications.
Jcs 08 00298 g001
Figure 2. Tensile stress–strain diagram for the prepared composites.
Jcs 08 00298 g002
Figure 3. FESEM images of broken specimens obtained after tensile strength tests: (a) PP, (b) PP-3G, (c) PP-6G, (d) PP-9G, (e) PP-12G, and (f) PP-15G.
Jcs 08 00298 g003
Figure 4. Stress–strain curves for flexural tests on the prepared composites.
Jcs 08 00298 g004
Figure 5. Impact strength vs. weight % of graphite in the PP matrix.
Jcs 08 00298 g005
Figure 6. FESEM analysis of broken specimens obtained after impact tests: (a) PP, (b) PP-3G, (c) PP-6G, (d) PP-9G, (e) PP-12G, and (f) PP-15G.
Jcs 08 00298 g006
Figure 7. XRD spectra of PP, graphite, and the composites.
Jcs 08 00298 g007
Figure 8. Cross-polarized optical microscopy of (ad) PP, (e) PP-3G, (f) PP-6G, (g) PP-9G, (h) PP-12G, and (i) PP-15G.
Jcs 08 00298 g008
Figure 9. FTIR spectra of (a) graphite powder, (b) PP, (c) PP-3G, (d) PP-6G, (e) PP-9G, (f) PP-12G, and (g) PP-15G.
Jcs 08 00298 g009
Figure 10. DSC thermograms: (a) heating and (b) cooling cycles of the polymer samples.
Jcs 08 00298 g010
Figure 11. TGA graphs of the polymer samples: (a) mass loss at complete experimental range; (b) mass loss from 300 to 500 °C.
Jcs 08 00298 g011
Figure 12. Graphs showing DMA results for the (a) storage modulus (E′), (b) loss modulus (E″), and (c) tan delta (tanδ).
Jcs 08 00298 g012
Table 1. Physical properties of the consumable materials used.
MaterialPolypropyleneGraphite
PropertiesMelt Flow Index
(ASTM Standard)
11 g/10 minMolecular
Weight
12.01
Density0.900 g/cm3Particle Size>50 µm
Pellet Size3–5 mmBulk Density20–30 g/100 mL
GradeM110
Homopolymer
BET Surface Area28.35 m2/g
Table 2. Fabricated test specimen codes.
Graphite Content, wt.%Sample Code
0PP
3PP-3G
6PP-6G
9PP-9G
12PP-12G
15PP-15G
Table 3. Reported results for tensile tests of the polymer composites.
PropertiesType of Sample and Results
PPPP-3GPP-6GPP-9GPP-12GPP-15G
Tensile stress at maximum load, MPa (SD = 1)28.6835.0735.4934.1834.5333.65
Maximum load, N (SD = 52)1221.631395.191421.141369.531391.821356.11
Tensile stress at break, MPa (SD = 1)16.4629.9129.9430.2833.1433.50
Load at break, N (SD = 59)1109.381189.821198.831213.161335.721350.40
Tensile strain at maximum load, % (SD = 1)10.685.145.724.524.783.93
Tensile strain at break, % (SD = 3)120.3211.1210.979.136.414.09
Modulus, MPa (SD = 66)1412.131538.891460.581602.431558.001640.19
Table 4. Data from the flexural and impact strength test samples.
Type of SampleFlexural PropertiesImpact Strength, J/m
(SD = 3)
Maximum
Load, N
(SD = 2)
Maximum Stress, MPa (SD = 1)Modulus,
MPa
(SD = 123)
PP55.8233.431182.1331.56
PP-3G61.5837.241230.6028.70
PP-6G62.6337.871348.5026.43
PP-9G64.0538.731438.7824.91
PP-12G65.9239.961534.4523.16
PP-15G67.0440.671601.5921.24
Table 5. Data relevance of polymer sample DSC and TGA characteristics.
Test TypePropertiesSample Type
PPPP-3GPP-6GPP-9GPP-12GPP-15G
DSCTm, °C162.40164.76165.11165.66166.74167.18
ΔHm, J/g34.7235.8236.9437.8940.1242.68
Tc, °C111.45125.36124.26124.42124.89128.16
ΔHc, J/g51.1444.1937.0436.5633.6529.23
TGATotal weight loss, %99.2698.4297.0393.1892.6389.01
TR, °C474.12465.76464.22479.35479.85482.44
Tonset, °C385.12345.43411.12424.26335.81433.89
Disclaimer/Publisher’s Note: The statements, opinions and data contained in all publications are solely those of the individual author(s) and contributor(s) and not of MDPI and/or the editor(s). MDPI and/or the editor(s) disclaim responsibility for any injury to people or property resulting from any ideas, methods, instructions or products referred to in the content.

