Article

Resilience of Medium-to-High-Rise Ductile Coupled Shear Walls Located in Canadian Seismic Zones and Strengthened with Externally Bonded Fiber-Reinforced Polymer Composite: Nonlinear Time History Assessment

École de Technologie Supérieure, Montreal, QC H3C 1K3, Canada
*
Author to whom correspondence should be addressed.
J. Compos. Sci. 2023, 7(8), 317; https://doi.org/10.3390/jcs7080317
Submission received: 30 June 2023 / Revised: 27 July 2023 / Accepted: 28 July 2023 / Published: 31 July 2023
(This article belongs to the Special Issue Composites for Construction Industry)

Abstract

:
Coupled shear walls (CSWs) are structural elements used in reinforced concrete (RC) buildings to provide lateral stability and resistance against seismic and wind forces. When subjected to high levels of seismic loading, CSWs exhibit nonlinear deformation through cracking and crushing in concrete and yielding in reinforcements, thereby dissipating a significant amount of energy, leading to their permanent deformation. Externally bonded fiber-reinforced polymer (EB-FRP) sheets have proven to be effective in strengthening RC structures against various loading and environmental conditions. In addition, their high strength-to-weight ratio makes them an attractive solution as they can be easily applied without significantly increasing the structure’s weight. This study investigates the effectiveness of using EB-FRP sheets to reduce residual displacement in CSWs during severe earthquake loadings. Two series of 15-story and 20-story CSWs in Western and Eastern Canadian seismic zones, which serve as representative models for medium- and high-rise structures, were evaluated through nonlinear time history analysis. The numerical simulation of all CSWs and strengthened elements was carried out using the RUAUMOKO 2D software. The findings of this study provided evidence of the effectiveness of EB-FRP sheets in reducing residual deformation in CSWs. Additionally, significant reductions in the rotation of the coupling beams (CBs) and the inter-story drift ratio were observed. The results also revealed that bonding vertical FRP sheets to boundary elements and confining enhancement by wrapping CBs and wall piers is a very effective configuration in mitigating residual deformations.

1. Introduction

The use of coupled shear walls (CSW) in reinforced concrete (RC) buildings has proven to be a highly effective solution for resisting seismic forces. These walls offer increased lateral stiffness and strength, and provide efficient seismic energy dissipation. A typical CSW system is composed of two wall piers interconnected by coupling beams (CBs). The role of the coupling beam is to distribute lateral loads evenly between the two wall piers, thereby preventing excessive stress or deformation. In addition, the beam’s geometry ensures that shear forces generated by lateral loads are shared in a balanced manner between the two wall piers, enabling the walls to work synergically for an enhanced lateral resistance.
The seismic behavior of CSW systems is significantly impacted by the capacity of the CBs to undergo rotational and vertical deformation during earthquakes. Thus, ensuring adequate rotational ductility in the sections of the CBs is crucial for attaining a ductile performance of the shear walls and enhancing the overall seismic resilience of the system by the dissipation of seismic energy through inelastic deformations [1]. Conventionally reinforced CBs are prone to sliding shear failure at the beam–wall joints. The transverse reinforcements in these beams are typically incapable of resisting the shear forces generated during seismic excitations. Therefore, diagonally reinforced CBs have been developed as a solution [2]. These beams are designed to resist shear forces and moments, and consist of diagonal bars that run throughout the beam and intersect at its midpoint. Confining stirrups are often utilized to ensure the stability of the diagonal bars under large lateral loads. These stirrups confine the concrete, enhancing its compressive strength, and preventing buckling of the diagonal reinforcements.
RC structures are frequently rehabilitated or strengthened to withstand various factors, including aging, increased loads, design codes and standards changes, and seismic upgrading to ensure their continued safety, serviceability, and durability. In addition, seismic upgrading in areas susceptible to earthquakes is essential to reduce the detrimental impact of seismic activity on structures. The objective of seismic upgrading is to enhance the resistance of the structural system to seismic forces, reduce the possibility of damage through the loading and unloading process [3], and enhance the overall performance of the structure during an earthquake.
FRPs have become increasingly popular due to several key advantages, including their high strength-to-weight ratio, corrosion resistance, ease of installation in complex structures, and cost-effectiveness. The application of EB-FRP sheets has emerged as a promising retrofitting strategy for strengthening and enhancing the seismic performance of RC CSWs. The seismic behavior of CSWs can be improved: (i) by enhancing wall pier capacity via EB-FRP sheets in several ways, such as positioning the sheets parallel to the wall axis [4,5,6] or perpendicular to the wall axis [7], wrapping the wall sections along the height, especially in the potential plastic hinge zones [5,8], and implementing X-bracing on the wall surface [6,7,9]; (ii) by applying FRP sheets to CBs by bonding the sheets perpendicular to the CB axis [10], installing diagonal strips on both sides [11,12], and fully wrapping [6] or U-wrapping [13,14]. Note that the number of bonded FRP layers is a crucial factor in reaching the effectiveness of these strengthening schemes. In a study by Arabzadeh and Galal [6], the impact of FRP retrofitting of a 12-story coupled C-shaped RC core system was evaluated. The authors modified a previously proposed wide-column model to capture the inelastic torsional behavior. Additionally, the authors introduced a simplified spring model to reflect the effect of FRP retrofitting. The nonlinear incremental dynamic analysis results showed that using EB-FRP strengthening can significantly enhance the collapse resistance of RC core wall systems by more than 60%. Layssi et al. [8] evaluated the impact of fully wrapping the plastic hinge zone of shear walls having poorly lap-spliced details using FRP. The results showed that this technique led to a remarkable improvement in terms of both energy dissipation and displacement ductility, and prevented brittle failure by privileging yielding of the primary flexural reinforcements in the walls. Honarparast et al. [12] investigated a new method for strengthening CBs using EB-FRP sheets. They tested two CB specimens, one control and the other reinforced with FRP, designed according to the NBCC 1941 code. The specimens were subjected to cyclic loading and compared in terms of energy dissipation and hysteretic behavior. The control specimen showed the yielding of rebars and shear cracks at joint locations during loading, while the strengthened model exhibited improved load-carrying capacity before FRP debonding. In addition, the control specimen showed significant pinching, stiffness degradation, and loss of energy dissipation capacity. In contrast, the strengthened specimen showed limited pinching and stiffness degradation before the rapid load reduction at the final load cycle.
The ineffectiveness of equivalent elastic force methods of analysis and design in addressing the destructive consequences of earthquakes was revealed after several major earthquake events, such as the Northridge earthquake in 1994 and the Kobe earthquake in 1995 [15]. As a result, the need for more accurate methods for evaluating seismic demand on structures became evident, as these methods consider both geometrical and material nonlinearities. Currently, the nonlinear time history (NLTH) analysis method is widely used and recognized as the most accurate method for assessing the response of structures subjected to severe seismic excitation [16]. The seismic performance of CSWs has been evaluated through the conduct of several nonlinear analyses in recent years [11,13,17]. Some researchers have examined the improvement in nonlinear responses of structures retrofitted with EB-FRP. Honarparast et al. [11] evaluated the seismic performance of old-designed (NBCC 1941 [18]) and modern-designed (NBCC 2015 [19]) 20-story CSWs located in Vancouver. They assessed the effectiveness of EB-FRP retrofitting on the seismic response of old-designed CSWs. Nonlinear time history analyses were carried out using RUAUMOKO 2D and simulated earthquake records. The retrofitting scheme employed in this study consisted of applying vertical and horizontal EB-FRP sheets on the wall piers to enhance their flexural and shear capacities, respectively. Additionally, to improve the seismic performance of the conventionally reinforced CBs, diagonal EB-FRP sheets were attached to both faces of the CBs. The results illustrated that the application of the EB-CFRP retrofitting technique significantly improved the seismic performance of the old CSWs, as evidenced by the reduction in story displacement, inter-story drift, wall curvature, and improved CB rotation. El-Sokkary [13] conducted a nonlinear time history analysis to evaluate the effectiveness of U-wrap EB-FRP sheets as a retrofitting method for increasing the rotational ductility of concrete beams (CBs) in 10-story and 15-story buildings. CBs were modeled using the lumped plastic method, in which an elastic beam with two plastic springs at each end represents the CB. The results indicated that adding one, two, or three layers of U-wrap FRP improved the CBs’ ductility to limited, moderate, and ductile levels, respectively. Furthermore, the inter-story drift capacity of the 10- and 15-story buildings were improved by up to 277% and 203%, respectively, through the FRP retrofit of the CBs. Boivin and Paultre [20] evaluated the seismic performance of a 12-story ductile concrete core wall in an office building in Montreal, which consisted of a cantilever and a coupled wall system. The primary purpose of this study was to evaluate the shortcomings and underestimation of previous Canadian codes and standards concerning the seismic design of shear walls. The study confirmed the underestimation of the capacity design shear envelope, because of an underestimation of the NBCC spectral response acceleration and a deficiency in the capacity design method.
Despite the extensive research conducted in nonlinear analysis of retrofitted CSWs, a significant gap still exists in the literature regarding the reduction of residual displacement and improvement in the resilience and self-centering ability of CSWs. Residual displacement refers to a structure’s permanent deformation or displacement after a seismic event. In the case of CSWs, residual displacement occurs due to the formation of plastic hinges in the wall piers and CBs. The magnitude of residual displacement can significantly impact the safety and functionality of a structure, as well as the need for costly repairs, maintenance, or replacement [21]. Bruneau and Reinhorn [22] comprehensively discussed seismic resilience in structures and defined different concepts (social and physical) for resilience. They established limits for the inter-story drift in structures during nonlinear responses to measure seismic resilience. They showed that retrofitting structures can affect fragility and performance boundary levels, and neglecting seismic retrofitting can lead to structural failure and collapse. Accordingly, the notion of seismic resilience in structures is associated with the capacity of the structure to endure substantial lateral displacements with minor damage (plastic hinge formation) and residual deformation. This capability can be achieved either through the natural self-centering properties of the structure or through the use of attached self-centering systems. It is worth noting that improving the resilience and strength of structures is crucial, not only for direct costs like repairing damage or lives lost from seismic hazards but also for considering indirect costs. These additional costs include disruptions to the structure’s function, damages to the surrounding area, and impacts on other networks, like roads and utilities. It is essential to prevent a chain reaction of problems occurring when a structure fails due to a seismic event. More discussions in this regard can be found elsewhere [23,24,25]. Also, implementing seismic retrofitting reduces the necessity for demolishing and renovating buildings. This, in turn, leads to a decrease in cement consumption, which is beneficial for the environment as cement production generates a significant amount of greenhouse gas emissions, contributing to global warming [26].
The self-centering ability of structures refers to their capability to return to almost their original position after a seismic event without significant permanent deformation [27]. This advantage can be improved through two prevalent methods, namely: (i) rocking motion that enhances mechanical resistance by uplifting the whole structure or significant structural components, and (ii) the use of mechanical devices that incorporate energy dissipators and shape memory alloys (SMAs) [27]. A rocking motion is achieved through either post-tensioned (PT) tendons, which results in controlled rocking, or self-weight, which results in uncontrolled rocking [28]. Controlled rocking systems utilize pre-compressed PT elements at the surface of the structural components. When lateral forces negate the pre-compression forces, the joint section decompresses, creating a gap. The PT elements then regain the lost stiffness of the lateral resistance system through axial stiffness. Failure may occur if the strain at the joint surpasses the elastic strain limit of the PT element. The effectiveness of using PT elements in the self-centering improvement of structures has been investigated in previous research studies [27,29,30,31].
SMAs, on the other hand, reduce deformation after unloading due to their super-elasticity property. It has been demonstrated that the use of SMAs can decrease the strain by 10% in specific applications [32], and, due to their inherent capacity for energy dissipation, SMAs are considered a viable option for self-centering methods. Despite their potential benefits, SMA wires feature certain drawbacks, such as a reduced load-bearing capacity and difficulties in anchoring them properly due to their slippery surfaces. As a result, SMA-based devices are primarily designed for uniaxial tensile-loading situations, thereby limiting their widespread application [33]. The use of SMAs and energy dissipators for enhancing the self-centering capability of structures has been studied previously in several research investigations [34,35,36]. Moreover, some research studies have examined the feasibility of integrating mechanical equipment, such as friction and viscous dampers, disk springs, and energy-dissipating devices [28,37,38]. The outcomes of these investigations have confirmed the effectiveness of these devices in improving the self-centering capacity of steel and RC structures. However, the use of these devices is not widespread due to architectural limitations.
Furthermore, the literature has explored other methods to mitigate residual displacement in shear walls. Shen et al. [39] conducted a study to assess the effectiveness of CFRP grids in reducing residual deformation in shear walls with varying failure modes, taking into account the aspect ratio and reinforcement ratio. Song et al. [40] performed experiments to evaluate the cyclic behavior of a hybrid approach combining CFRP grids and steel in six large-scale shear walls. Zhao et al. [41] demonstrated that CFRP bars are an effective alternative to low-yield strain steel bars in reducing residual deformation in RC shear walls.
In the current literature on self-centering systems, research has focused primarily on improving the self-centering properties and reducing residual displacement in newly designed and detailed structures. Although some studies have explored the application of mechanical equipment such as dampers and disk springs to increase self-centering in existing steel and RC frames, research on reducing residual displacement in existing CSWs is limited. This has been the leading momentum to implementing a novel approach by focusing on reducing residual displacement in existing CSWs by applying EB-FRP sheets. This research fills a gap in the current understanding of self-centering systems, and offers a unique contribution to improving seismic performance in existing structures. Accordingly, this study aims to examine the efficiency and performance of various configurations of EB-FRP sheets in reducing residual displacement in existing CSWs and their impact on seismic parameters, including CB rotation, shear force and bending moment demand, and inter-story drift. To this end, a comprehensive evaluation of 20-story and 15-story CSWs in Montreal and Vancouver is conducted using advanced RUAUMOKO 2D software. The evaluation includes nonlinear time history analyses and a curated selection of 15 ground motions for Vancouver and 11 for Montreal. The CSWs are tested under various scenarios, including three strengthening configurations and non-strengthened conditions. The analysis results effectively visualize the impacts of the strengthening schemes on the parameters assessed.

2. Canadian Seismic Design Provisions for Ductile Walls

2.1. Force-Based Design Provisions

The force-based design technique is currently the prominent approach used in the seismic design provisions of Canada for RC shear walls. This method calculates the internal forces and stresses that develop within a structure due to applied loads, based on the elastic design spectrum. Nevertheless, these values are subsequently adjusted by reduction factors, which include those related to overstrength ( R o ) and ductility ( R d ), to account for the structure’s inelastic behavior [42]. According to the National Building Code of Canada (NBCC20) [43], the equivalent plastic seismic shear force at the base of building shall be calculated, as given in Equation (1).
V b a s e = S ( T a ) M v I E R d R o W
In Equation (1), T a represents the fundamental period of the structure, and S ( T a ) = the design spectral response acceleration corresponding to T a and is based on a 2% probability of exceedance in 50 years. The factor that accounts for higher mode effects is represented by M v , while the importance factor is denoted by I E . The weight of the structure, represented by W, can be calculated as the sum of the dead load and 25% of the snow load (W = DL + 0.25SL).
The precise classification of walls is crucial in determining the accurate value of the ductility-related force modification factor, R d , as CSWs are defined for a higher amount of it. When considering a wall with openings that are proportionately small compared with the height of the wall and are surrounded by upper and lower solid and rigid segments, the behavior of the wall can be classified as that of a cantilever single shear wall. Determining whether these segments possess sufficient stiffness to treat the wall as a single entity is a complex task. To address this issue, a concept known as the degree of coupling (DOC) should be computed, as given in Equation (2).
D O C = P l c g M 1 + M 2 + P l c g
where l c g = the span between two walls from center to center; M 1 a n d M 2 = the moments at the base of each wall; and P = axial force developing from the coupling action. DOC is a measure of the contribution of tension–compression forces in wall piers, originating from the shear in coupling beams, to the base overturning moment resistance. When this parameter approaches one, the CSW behaves more like a cantilever shear wall. The Canadian Standards Association (CSA) A23.3-19 [44] categorizes CSWs based on their DOC; those with a DOC greater than 66% are classified as coupled walls, and those with a DOC less than 66% are partially coupled. For ductile shear walls, NBCC20 defines the ductility-related factor ( R d ) and overstrength-based factor ( R o ), as given in Table 1.
Thereafter, V b a s e is to be distributed between the floors corresponding to their weight and height, as given in Equation (3).
F i = ( V b a s e F t ) W i h i i = 1 n W i h i
In Equation (3), F i = the force at floor i. If the period of a structure exceeds 0.7 s, it is necessary to consider the impact of higher modes. In such cases, a portion of the base shear, denoted by F t , should be allocated to the top floor of the building and should be computed, as given in Equation (4). W i = the weight given to the ith floor, and h i = the height of the ith floor over the base level.
F t = 0.07 T a V b a s e 0.25 V b a s e
To ensure the accuracy and reliability of the design of medium-to-high-rise buildings for seismic events, it is necessary to conduct equivalent static and dynamic analyses. Equivalent static analysis is a convenient method for the preliminary design and estimation of seismic loads. Nevertheless, it is unable to account for the dynamic behavior of structures. Instead, it allocates forces in an ascending manner along the structure’s height, relying on the first dynamic vibration mode. This may result in floors experiencing a more significant applied force due to other modes. Conversely, dynamic analysis offers a more precise depiction of buildings’ actual behavior during seismic events. However, the base shear calculated through dynamic analysis needs to be calibrated by equivalent static analysis.
In the linear analysis of RC structures, it should be noted that the concrete undergoes cracking as the lateral load increases, which reduces the initial stiffness and other sectional properties. On the other hand, the general response of concrete is nonlinear. Therefore, to account for the average cracking effect in various element types, CSA A23.3-19 suggests the reduction factors presented in Table 2.
In Table 2, I e and I g represent the effective and the gross section moment of inertia, respectively. A v e , A x e , and A g represent the effective shear cross section, the effective axial cross section, and the gross area of section, respectively. For ductile CSWs, the value of α w can be considered 0.5 at the initial stage of analysis [45].

2.2. Capacity Design Provisions

It has been widely recognized that it is not cost-effective for structures to resist seismic forces while remaining within the elastic domain. Therefore, the seismic-resistant design of structures relies on the ability to dissipate energy with minimal loss of strength during multiple cyclic loading [2]. To guarantee sufficient ductility, resistance, and stiffness in CSWs, the CSA A23.3-19 implements capacity design principles. This approach allows designers to control the plastic mechanism of the shear walls by incorporating overstrength in specific structural elements. The primary structural stability elements, wall piers, must be designed to have sufficient stiffness to ensure that the structure’s overall stability is not compromised by incoming loads. Conversely, coupling beams (CBs) must be designed to absorb and dissipate the seismic energy by forming plastic hinges at designated zones.
In order to achieve the aims of capacity design provisions for CSWs, it is essential to adhere to three fundamental principles: (i) wall piers need specific reinforcement detailing in the potential plastic hinge region (i.e., the base of wall piers) to ensure large plastic deformation without significant strength loss [45]; (ii) the CSWs should be designed and detailed so that flexural yielding occurs at the end of CBs prior to the base of the wall piers (e.g., weak beam–strong column in frames); and (iii) the inelastic rotational capacity of both CBs and wall piers (within the plastic hinge region) must exceed their corresponding rotational demand.
Inelastic rotational demand ( θ i d ) in wall piers shall be calculated using Equation (5).
θ i d = f R o R d h w
In Equation (5), based on the linear analysis, f is the factored displacement and h w denotes wall height.
Inelastic rotational capacity ( θ i c ) in wall piers can be calculated using Equation (6).
θ i c = ε c u l w 2 c 0.002
where ε c u = 0.0035 except for the compression zone of the wall with different confinement details, l w = length of CSW, and c = depth of neutral axis.
Also, (CSA) A23.3-19 recommends Equation (7) to calculate the height of the plastic hinge region, h p , in wall piers.
h p = 0.5 l w + 0.1 h w
Then, the inelastic rotational demand in CBs can be calculated using Equation (8).
θ i d = ( f R o R d h w ) l c g l u
In Equation (8), l u = the length of the beam clear span, and l c g = the length between the wall piers’ centroids. Furthermore, the inelastic rotational capacity of diagonally reinforced CBs shall be considered 0.04.
In compliance with capacity design provisions, it should be noted that the combined effects of gravity and seismic loads generate axial forces in CSWs. Seismic loads induce shears in the diagonal reinforcement of the CBs, which subsequently act as axial loads on the corresponding wall piers’ sections. Therefore, each section should be able to resist the sum of the shear forces required to yield the coupling beams above the section. Additionally, in designing each section of wall piers, it is imperative to ensure that the factored bending moment resistance exceeds the bending moment arising from both the nominal resistance of the coupling beams acting into the corresponding sections and the applied bending moment of the wall piers. Accordingly, the wall over-strength factor, γ, as given in Equation (9), should be applied to the factored wall moments at each level [11].
γ = V n V f
where V n = the sum of the nominal shear resistance of CBs, and V f = the total factored shear in CBs due to lateral loading above the corresponding level.
More details and design requirements of CSWs, including restriction in compressive strength of concrete, lap splice length, concentrated and distributed reinforcements, maximum span/depth ratio of CBs, the minimum number of diagonal reinforcements, length of diagonal reinforcement anchorage in wall piers, hoop spacing in diagonal reinforcements, and plastic hinge specific requirements, are discussed in [44].

3. Details and Geometry of the Case Study

This study evaluated two series of 20-story and 15-story buildings located in Montreal and Vancouver. The buildings under investigation feature RC structures with SFRS made of four CSWs in North–South (N–S) and two CSWs in West–East (W–E) directions. However, as the buildings may experience ground motion acceleration in both directions, this study primarily evaluates the seismic demand in the N–S direction. The shear walls of this structure are uninterrupted from the base to the top level, and they are relied upon to resist all lateral loads. Additionally, all floor plans are symmetrical, with no level variations. This creates regularity in both the plan and elevation of the structure. All four CSWs have CBs between floors level with a 2.0 m clear span, 400 mm width, and the same reinforcement layout in the corresponding level, connected at each end to a 3.25 m length wall pier with constant geometry along the building height. The floor dimension is 23 m by 35 m, and has a 200 mm thick concrete slab with compressive strength, f c , of 30 MPa, and steel reinforcement yield strength, f y , of 400 MPa. All floors have a 3.5 m height, resulting in a total height of 52.5 m and 70 m for 15-story and 20-story CSWs, respectively. Figure 1 presents the plan view and 2D layout of CSWs.
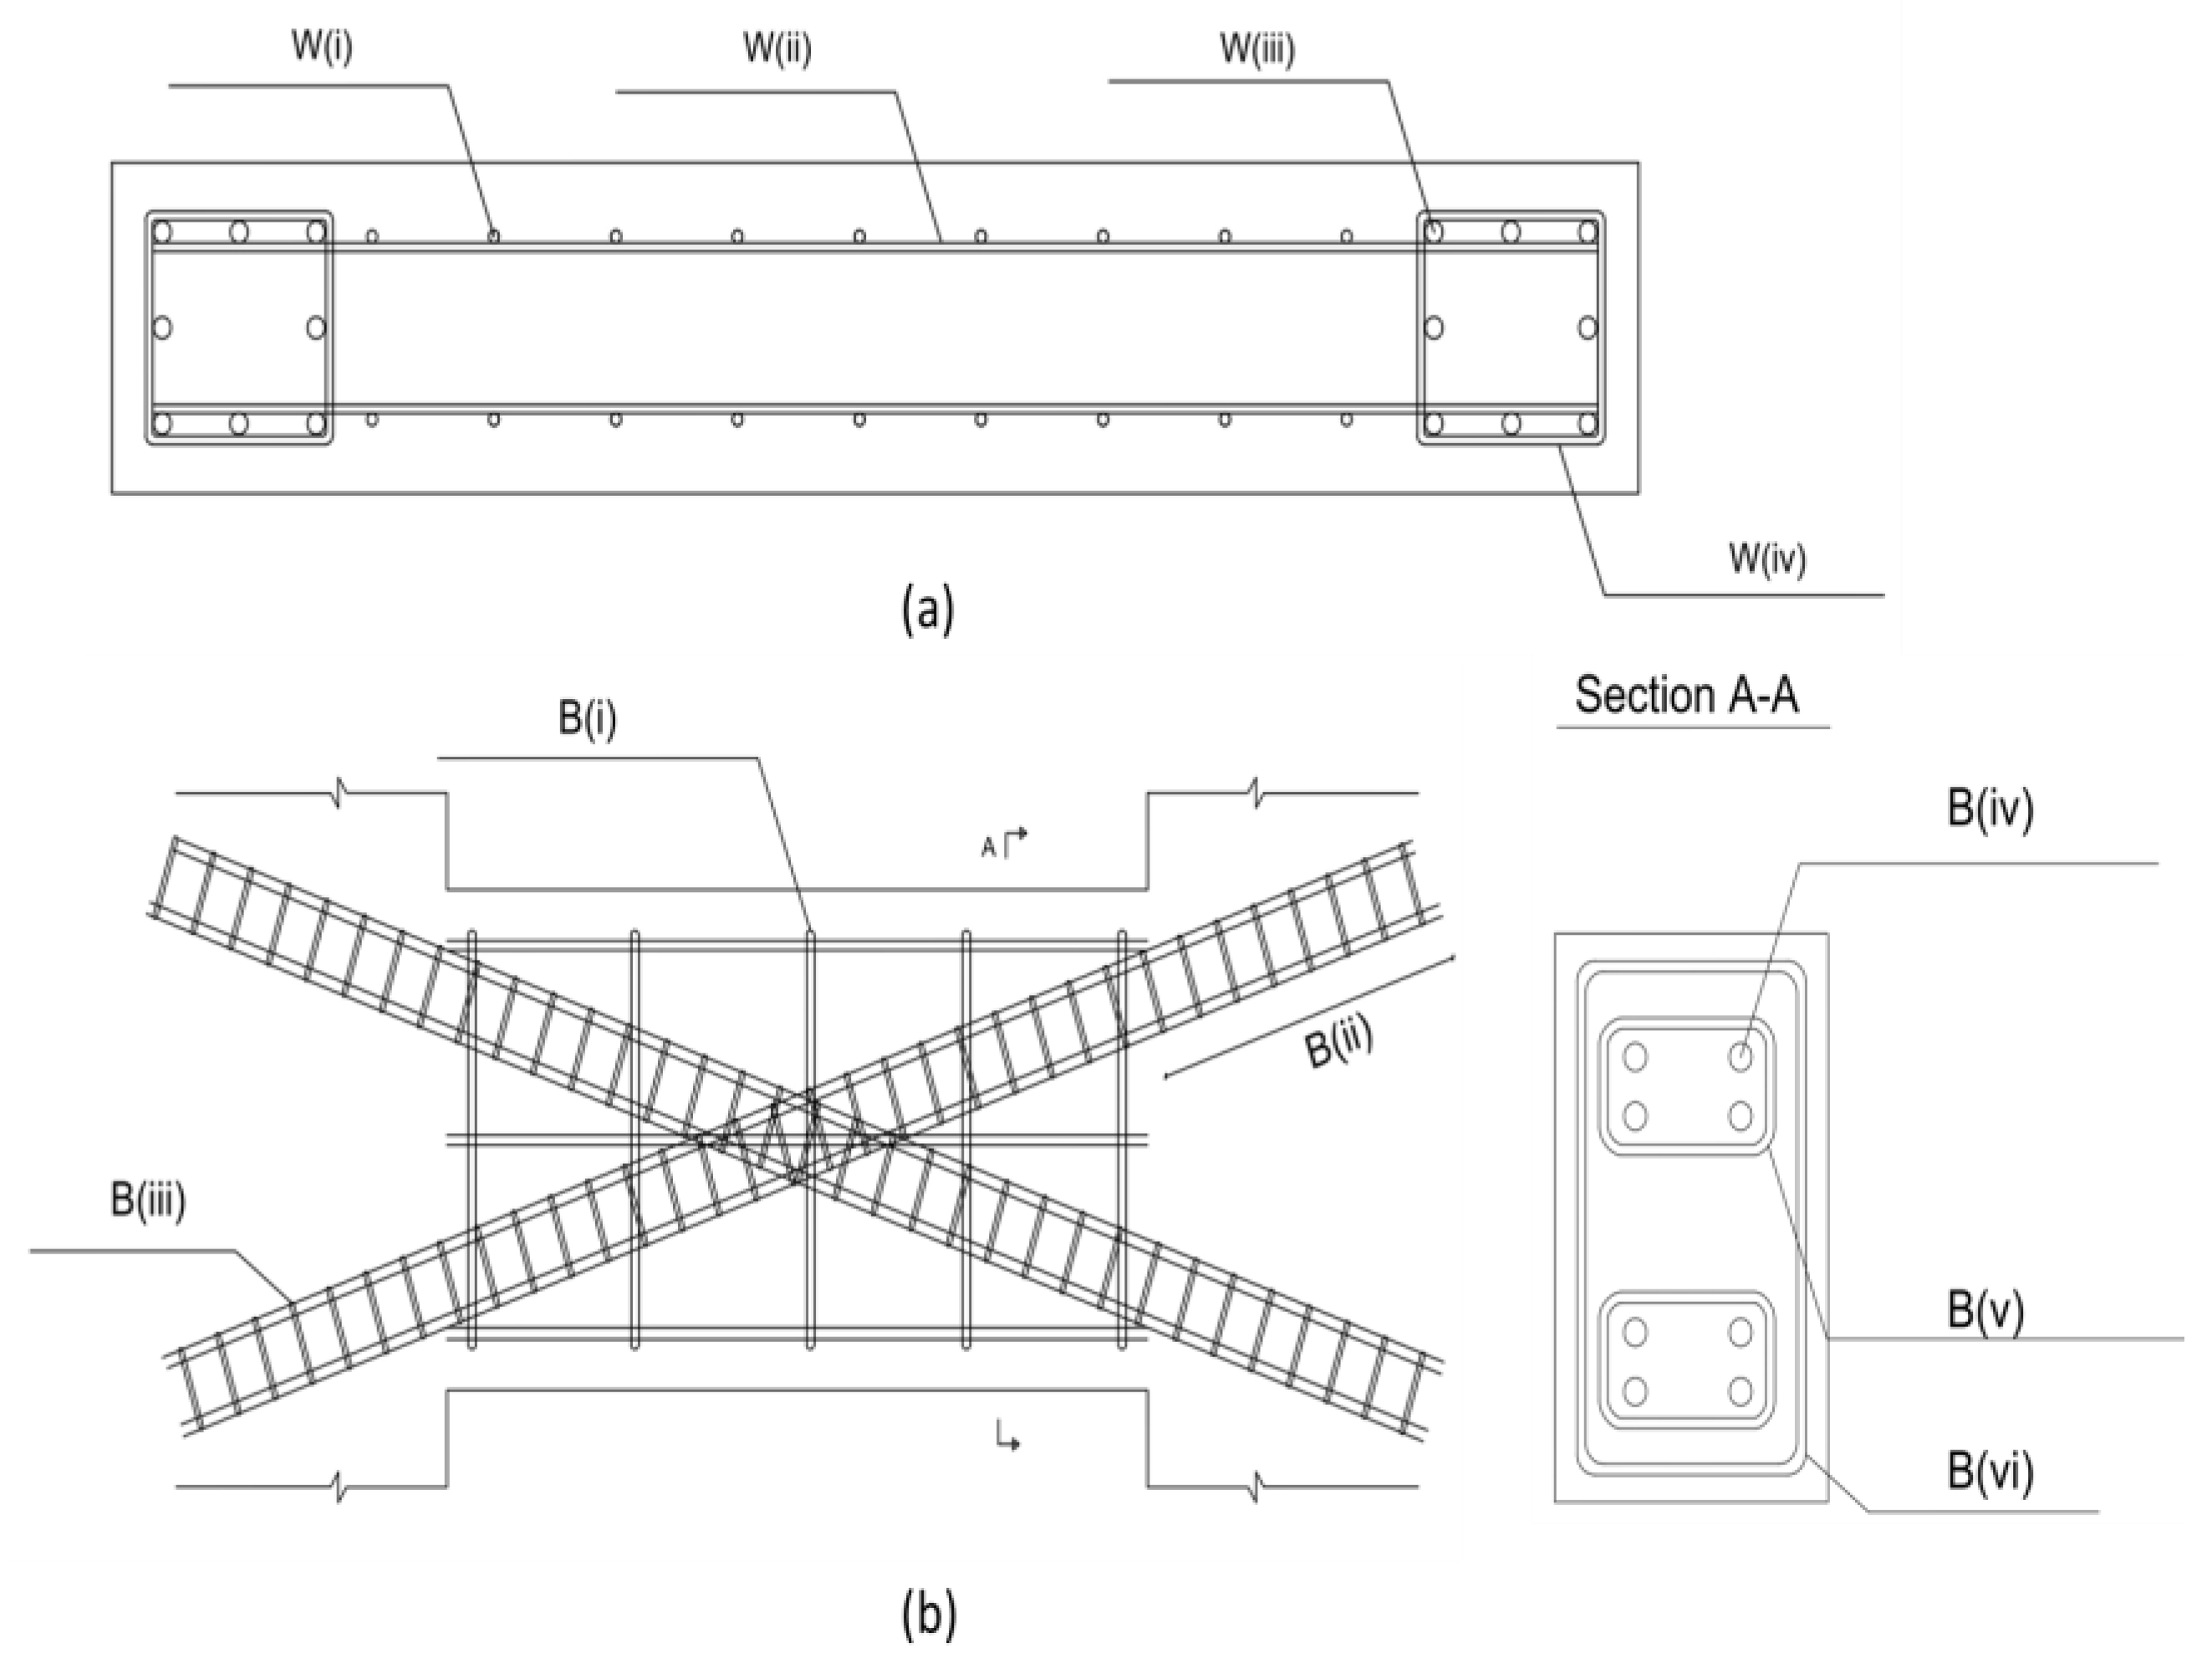
During the design phase, the first step involved the computation of lateral forces using Equations (1) and (3). Subsequently, a linear dynamic analysis was performed using SAP2000 software v19.0.0 [46] to obtain the design forces in the CBs and wall piers. Finally, the CSWs were designed following standard specifications, utilizing the internal forces that were previously calculated. A similar building is discussed in [47]. Also, a step-by-step guide for the design and detailing of shear walls can be found elsewhere [45]. Figure 2 illustrates the reinforcement layout in wall piers and CBs; specific details and quantities are provided in Table 3 and Table 4.

4. Seismic Strengthening of CSWs with EB-FRP Sheets

Severe cyclic loading and rotational demand in CSWs may cause considerable damage, followed by local or global residual displacements in SFRS. Three failure modes can be differentiated in diagonally reinforced CSWs, namely flexural, shear, and rigid action failure. The areas most susceptible to damage under these modes include the extreme tensile edges of the wall piers’ base and compressive corners of the wall piers’ base, as well as CBs and walls joints [1]. To ensure adequate seismic resistance of CSWs, CBs should exhibit sufficient strength and flexibility to absorb seismic energy over plastic action. The inevitable collapse of the CSWs occurs when there is a shear failure of the CBs, and, subsequently, the compression wall piers are crushed. However, it should be emphasized that excessive strength of CBs should be avoided since this can negatively affect the overall performance of CSWs [48]. Consequently, seismic strengthening of vulnerable areas of CSWs using EB-FRP sheets can effectively improve their seismic performance [49]. Nevertheless, the seismic retrofitting of shear walls should promote a flexural failure over a fragile shear failure [50].

4.1. Provisions for the Design of EB-FRP Sheets

The common failure mode in RC structures strengthened using EB-FRP strips is by debonding [51]. In seismic applications, physical testing is required to validate anchorage systems’ effectiveness in providing resistance against debonding failure. ACI 440.2 R-17 [50] recommends that flexural FRP strips be fully wrapped with FRP sheets, particularly in regions where plastic hinge formation is expected. This wrapping technique can significantly improve the seismic performance of FRP-strengthened structures by enhancing debonding failure resistance in flexural-strengthening FRP sheets and considering the stress reversal effect for shear-strengthening FRP sheets.
To prevent debonding failure, ACI 440.2 R-17 recommends a limitation on the effective strain, ε f d , of FRP sheets beyond which debonding may occur, as expressed in Equation (10).
ε f d = 0.41 f c n E f t f 0.9 ε f u
in which ε f u = FRP sheet design rupture strain; f c = compressive strength of concrete; n and E f represent number of FRP layers and modulus of elasticity of FRP sheets, respectively; and t f = thickness of FRP sheets. Also, FRP sheets’ contribution to the bending, M n f , in rectangular RC beams can be calculated using Equation (11).
M n f = ψ f A f f f e ( d f β 1 c 2 )
where ψ f is the FRP reduction factor (equal to 0.85 for flexure and 0.95 for shear fully wrapped sections); A f is the area of EB-FRP sheet; f f e and d f are effective stress and depth in the FRP, respectively; and β 1 and c are the ratio of depth of the equivalent rectangular stress block to depth of the neutral axis, and the distance from the extreme compression fiber to the neutral axis, respectively.
Using fully wrapped EB-FRP sheets when practically possible is the optimal method for the shear strengthening of RC beams [50]. In this study, the CBs are placed at the height between the floors, and all four sides are accessible. Thus, a fully wrapped configuration to enhance the shear capacity of CBs is employed. Additionally, FRP sheets’ contribution to the shear, V f , in rectangular RC beams can be calculated using Equation (12).
V f = A f v f f e sin α + cos α d f v S f
where A f v = area of EB-FRP sheets; α = angle between the main axis of the FRP strips and the horizontal axis of the beam (equal to 90 degrees); d f v = effective depth of EB-FRP sheets; and S f = axis-to-axis space between the EB-FRP sheets.

4.2. Strengthening Schemes

This study aims to increase the resilience and self-centering capabilities of the CSWs and minimize their residual displacement using EB-FRP sheets. To that end, strengthening configurations are proposed to improve the seismic behavior of CBs and wall piers by increasing their load-carrying capacity and strengthening regions susceptible to cracking caused by cyclic earthquake loading. Finally, the effectiveness of different configurations is compared to determine the most efficient strengthening scheme.
Three different strengthening schemes, in addition to the plain CSWs in Montreal and Vancouver, were evaluated, encompassing a total of eight CSWs (see Figure 3). In the first scheme, labelled S1-CSW, a vertical layer of FRP sheets was applied across the entire width of wall piers to improve their in-plane flexural capacity. Moreover, the wall piers and CBs were completely wrapped with a single layer of EB-FRP to promote shear strength, ductility, and rotational capacity. In the second scheme, labelled S2-CSW, vertical layers were applied in a structured manner. Two layers of vertical FRP were incorporated in the first 15% of the wall pier’s length from each edge, followed by one layer in the subsequent 15% of the wall length. Also, similarly to S1-CSW, CBs and wall piers were wholly wrapped with a single layer of EB-FRP. In the third configuration, labelled S3-CSW, three layers of vertical FRP within the first 15% of the wall pier’s length from each edge were applied, followed by a single layer of FRP sheets wrapping the entire wall pier and an additional layer within the plastic hinge region. To enhance the flexural resistance of the CBs, a single layer of EB-FRP sheets was applied on the top and bottom sides. Finally, complete wrapping of the CBs was carried out to improve their ductility and rotational capacity. The non-strengthened walls were considered control walls and labelled C-CSW. The manufacturer’s mechanical properties of CFRP sheets are summarized in Table 5.

5. Nonlinear Time History Analysis

The use of nonlinear time history (NLTH) analysis for the performance-based seismic design of RC buildings is gaining popularity in the United States [45].
The implementation of the NLTH method, as described in the User’s Guide—NBC 2015 [52], entails the utilization of a nonlinear model of the structure that incorporates its suitable and efficient cross-sectional characteristics, and subjecting it to a set of seismic records, whether they are synthetic or natural. In addition, these records should be scaled to fit the design spectrum.

5.1. CSWs Assumptions for Nonlinear Analysis

In the current study, the nonlinear time history analysis of CSWs was conducted using a finite element method (FEM)-based computer program RUAUMOKO 2D [53]. This software was developed at the University of Canterbury in New Zealand to evaluate properly the time history response of frame-like structures to ground motions.

5.1.1. Member Modeling

To model the complex behavior of CSWs, several analysis techniques are available in the literature, including the continuous medium, finite element, and equivalent frame methods [54]; the last was considered for this study. The equivalent frame method (EFM) is widely used for analyzing CSWs. It transforms the original CSW system into a simplified frame model with comparable properties. In the EFM, the CSW system is divided into interconnected frames consisting of vertical columns and horizontal beams. In this context, the wall piers are represented by the vertical columns with axial rigidity, AE, and flexural rigidity, EI, which correspond to the actual wall piers, whereas the horizontal beams represent the CBs with fitting structural properties and rigid arms at each end. These arms are utilized to ensure that the correct rotations and displacements are achieved, thereby fulfilling the requirement for plane wall sections to remain planar [55]. RUAUMOKO offers multiple members to model frame-type elements. Typically, beam or beam–column finite elements are used to model slender shear walls. Nonetheless, in the case of CSWs, the coupling action between walls results in significant shifts in the axial force in wall piers during cyclic loading. Therefore, modeling these elements as beam–column members is necessary to capture their behavior accurately. Thus, a quadratic beam–column member was chosen to model wall piers. Moreover, choosing a beam–column member to model the wall is logical as per the regulations stated in CSA A23.3-19. According to this standard, all the shear walls with h w l w   2 must be considered flexural shear walls, and these types of walls are designed to withstand in-plane lateral forces through flexural action and act practically like RC beams.
CBs were analyzed using a one-component (Giberson) beam model [56] comprising an elastic beam that incorporates two rigid links, with rotational springs at each end to concentrate all nonlinear deformations. It was considered that the span of the rigid end block was half the depth of the member [57]. A double curvature shape is formulated for the elastic beam, and thus a hysteretic model may determine the moment–rotation loading history of each hinge [58]. While the interaction between the axial yield and moment–curvature yield in beam members can be disregarded, the axial force affects the member’s yield moment in a beam–column member [59]. Therefore, the yielding surface of the moment–axial interaction diagram should be defined to account for the combined effects of bending and axial forces in wall piers. To overcome the computational complexities of nonlinear sectional analysis, the Xtract software v2.6.0 [60] was utilized for both FRP-strengthened and control members to obtain control points of the yielding surfaces. This software can accurately compute moment–axial interaction and moment–curvature diagrams for each section. To consider the materials’ nonlinearity, nonlinear stress–strain curves of materials were defined. The bilinear model with strain hardening was used for steel reinforcement, while the model introduced by Mander et al. [61] was used for reinforcement-confined and unconfined concrete. Lastly, the linear elastic behavior of EB-FRP sheets was defined using the manufacturing properties of the FRP materials. Moreover, FRP wrapping can increase concrete’s ultimate strain, improving curvature, and rotational and load-carrying capacity. Hence, for FRP-confined members, the Lam and Teng model [62] was utilized to account for capacity improvement of concrete. Both the quadratic beam–column and the one-component (Giberson) beam have been identified and used in previous studies to model CSWs [11,17,63]. Additionally, as all the diaphragms are considered to be rigid and have sufficient thickness to develop diaphragm effects, the lumped mass model was implemented for all buildings, and the relative horizontal movement of nodes on the same level was disregarded [20,64,65]. Vecchio and Collins [66] demonstrated that transverse cracking significantly impacts the compression behavior of cracked concrete, leading to substantial softening effects. Thus, the ductility-based model, proposed in RUAUMOKO using experimental test data presented by McNeice [17], was utilized to model strength degradation in CSWs during cyclic loading. Moreover, to consider geometric nonlinearity, the large displacement approach was employed. This approach updates the nodal coordinates and member stiffnesses at each time step to account for changes in axial forces and geometry, making analyzing structures undergoing large displacements possible [63]. Figure 4 depicts member modeling and node numbering of CSWs evaluated in this study.

5.1.2. Damping Modeling

Choosing an appropriate damping model in NLTH is paramount for achieving accurate results. In many studies, the Rayleigh damping model has been considered [6,20,64]. This model considers the linear proportional combination of the stiffness and mass matrices. As the stiffness matrix changes throughout the nonlinear analysis, the damping matrix is updated at each time step. Equation (13) expresses the Rayleigh damping matrix, denoted as C:
C = α M + β K
where M = mass matrix, K = stiffness matrix, and α and β are coefficients calculated using Equation (14).
α β = 2 ω i ω j w j 2 w i 2 ω j ω i 1 ω j 1 ω i ξ i ξ j
where ( ξ i , ξ j ) and ( ω i , ω j ) are the damping ratio (given damping/critical damping) and circular natural frequency (rad/s) for ith and jth modes, respectively. Once the damping ratio of the two modes is provided, the damping matrix can be computed using Equation (13). The damping ratio in the other vibration mode, ξ n , of the structure can be calculated using Equation (15).
ξ n = 1 2 ( α ω n + β ω n )
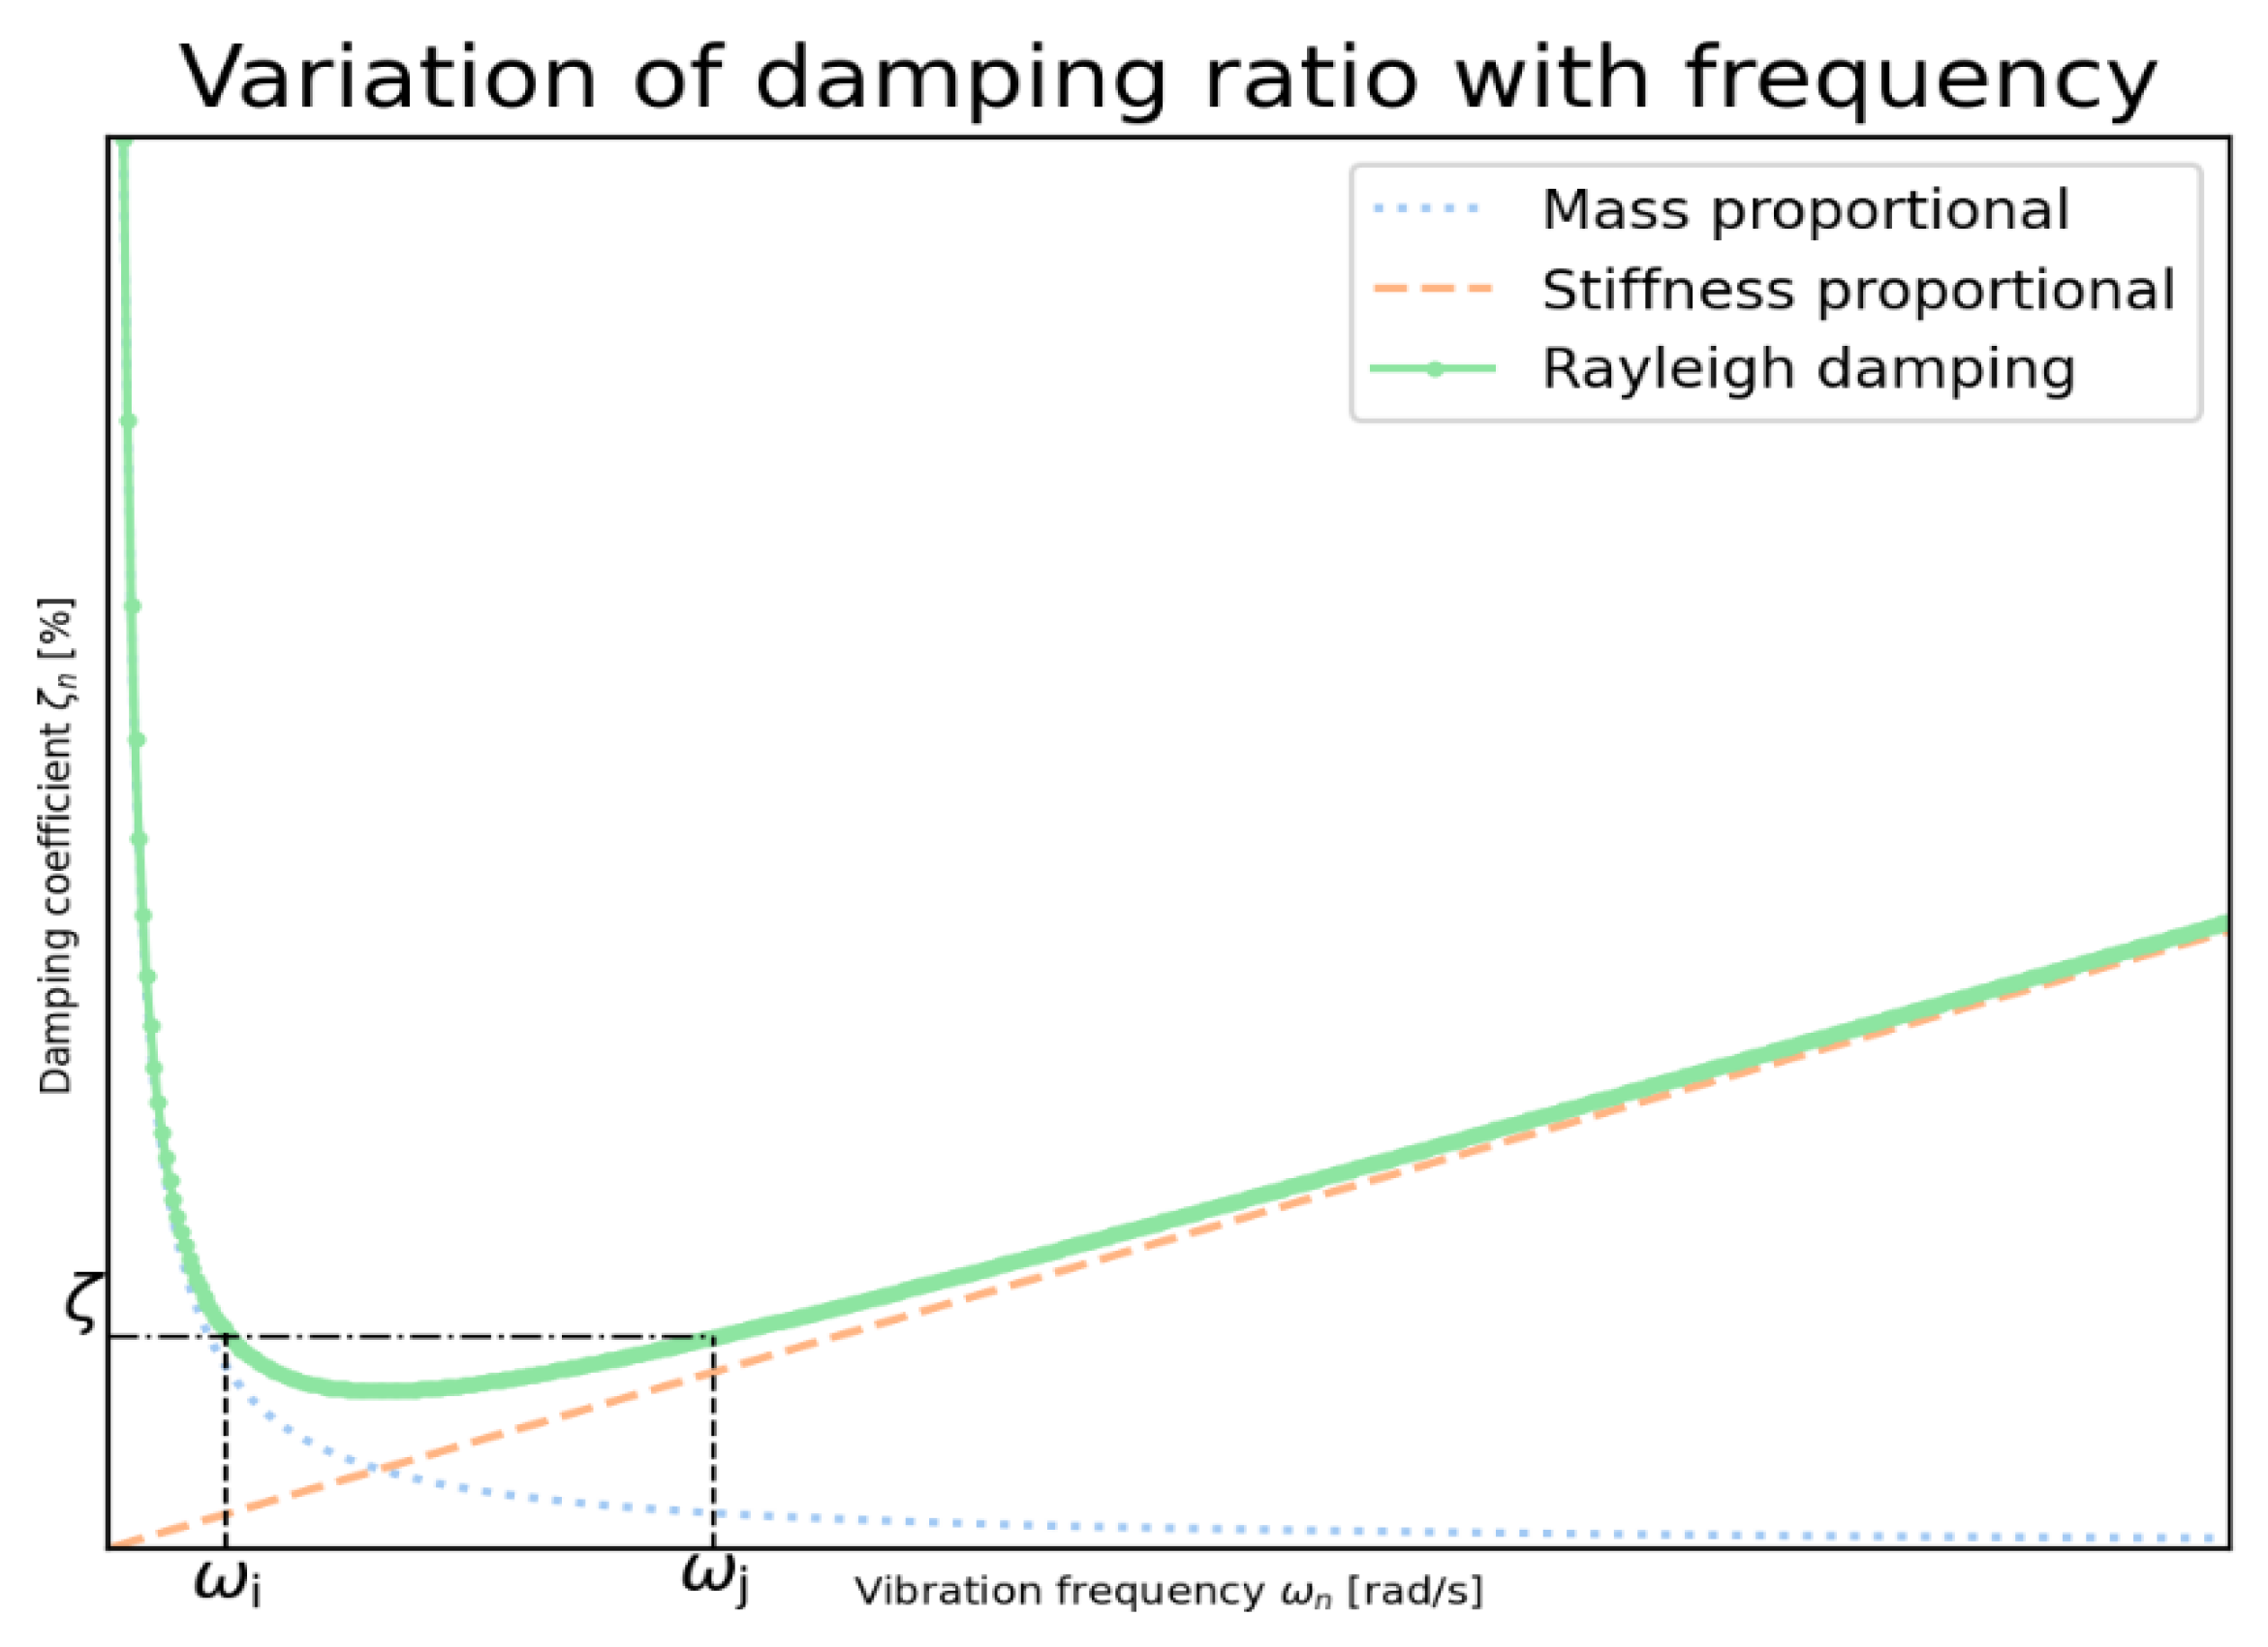
As demonstrated by Equation (15) and Figure 5, the damping ratio for modes with a frequency lower than ω i displays a significant increase and is proportional to the mass. Conversely, the damping ratio for modes with a frequency greater than ω j exhibits a consistently increasing trend, and, at higher frequencies, the threshold limit is solely proportional to the stiffness. It should be noted that the modes falling within the frequency ranges of ω i and ω j exhibit slightly lower damping ratios, consequently resulting in more conservative results. This highlights the importance of appropriate selection of damping ratio and two corresponding modes in Equation (14). It is suggested to choose the first mode (fundamental mode) of the structure and one of the higher modes corresponding to ω i and ω j , respectively. This approach ensures that most of the modes that significantly impact the structure’s response are within the same range of damping ratio [64,67,68]. It also satisfies the requirements of reducing the mass-portion damping term to avoid unrealistic high values of damping forces in nonlinear analysis using the initial stiffness damping model [68]. Thus, in this study, initial stiffness Rayleigh damping with 5% critical damping was utilized for modes 1 and 10. Similar assumptions can be found in the literature [6,11].

5.1.3. Hysteresis Modeling

Repeated cyclic loading beyond the yield point tends to reduce the stiffness of RC elements due to concrete cracking and steel reinforcement plastic behavior. Various hysteretic models replicate the response of RC structures to cyclic loading. However, few models can accurately simulate the feature deterioration and actual behavior of members exposed to significant loading reversal cycles. Hence, selecting a suitable hysteretic model for reproducing the inelastic response of structural members is a critical step in NLTH. To that end, RUAUMOKO 2D offers multiple hysteresis models to characterize the plastic response of RC elements under dynamic excitations.
The modified bilinear Takeda model [69] is considered in this study to replicate the stiffness degradation of control and strengthened CBs. The model is widely used because of its adaptability to a broad spectrum of hysteresis responses of RC members. The coefficients α and β control this model’s elastic–perfectly plastic loading and unloading response. Also, the Q-HYST stiffness degrading model [70] is used for the nonlinear flexural response of wall piers (see Figure 6). The general characteristic of this model is similar to the modified Takeda, in which β is equal to zero. Both hysteresis rules have been previously employed in other studies and have demonstrated their ability to model the inelastic behavior of RC members accurately under cyclic loading conditions [6,58,71]. Moreover, the values of α and β are obtained from experimental data presented by Li [63] and McNeice [17].

6. Ground Motion Selection and Scaling

The Geological Survey of Canada provides the probabilistic-based assessment of earthquake occurrence and intensity level as seismic hazard models for various cities, which are then utilized to develop Canada’s seismic design provisions. The last (6th) generation of seismic hazard models was recently provided for NBCC 2020 [43]. The seismic hazards are represented as a fraction of gravity by (i) the spectral acceleration, Sa, parameter corresponding to the period ranges of 0.2, 0.5, 1.0, 2.0, 5.0, and 10.0 s (contributing to form the uniform hazard spectrum (UHS) for each city), and (ii) peak ground acceleration, PGA, and velocity, PGV; all for the probability of 0.000404 per annum (2%/50 years) [72]. Therefore, when choosing ground motion time histories, they must align with the specific tectonic conditions, anticipated ground motion magnitudes, and distances at the building site to comply with the projected level of seismic hazard. Alternatively, as outlined by NBCC, the ground motion time histories should adhere to the UHS corresponding to the building site. Note that the seismic hazard level related to class C shows a significant increase in NBCC 2020 compared with NBCC 2015, as shown in Figure 7.
The de-aggregation of the seismic hazard analysis is necessary to determine primary magnitude–distance pairs that dominate the seismic hazard level of a given city [73]. In eastern Canada, Montreal in a region characterized by moderate-to-high seismicity levels resulting from crustal earthquakes, having anticipated earthquakes with high frequencies and short duration [74,75]. Two distinct M–R scenarios of earthquakes dominate the seismic hazard level in Montreal [72,76]. The first scenario comprises earthquakes with a magnitude of six (M6) occurring at fault distances (R) of 10–30 km, and is compatible with the short-period portion of the UHS, while the second, with a magnitude of seven (M7) occurring at R = 15–100 km, is compatible with the long-period portion of the UHS [77]. On the contrary, in western Canada, crustal and in-slab events (generating moderate-to-high earthquakes) contribute to hazards at low-to-intermediate periods [76]. Additionally, Cascadian subduction events (megathrust earthquakes), characterized by magnitudes greater than eight (M > 8), account for long-period motion hazards. Although Cascadian events are far from densely populated regions (typically more than 100 km), these events are usually of long duration, which may cause significant damage to structures that are loaded beyond their elastic capacity [77]. Accordingly, three scenarios of earthquakes with (i) M = 6.5 and 10 < R < 30; (ii) M = 7.5 and 15 < R < 100; and (iii) M = 9 and 100 < R < 200 were used for analysis of shear walls in western Canada.
Only a few time histories are available for earthquakes in eastern Canada, and the magnitudes and distance of these earthquakes are inconsistent with the abovementioned seismic hazard levels. Thus, simulated ground motion time histories for soil site class C, developed by Atkinson [77], are used in this study. As per the NBCC guidelines, it is imperative to have at least five time histories for each suite to conduct a dynamic analysis. Furthermore, a minimum of eleven earthquakes across all suites is required to perform the analysis. In this regard, NLTH is performed in eastern and western Canada, with the selection of 11 and 15 time histories, respectively. Figure 8 shows response spectra for scaled ground motions in both sites. The mean value of all analyses is then utilized as the nonlinear dynamic response of the structure. The earthquake selection and scaling was performed as requested by NBCC guidelines, using the method suggested by Tremblay et al. [78]. For each suite, 45 simulated accelerograms were created by Atkinson. The ideal records were selected by calculating the ratio of the target spectral amplitude to the spectral amplitude of the records in each suite. The chosen records must have mean values between 0.5 and 2 and the lowest standard deviation. Table 6 and Table 7 summarize selected ground motion characteristics, including peak ground acceleration (PGA), durations, M–R scenarios, period range, and event types.

7. Results and Discussion

This study evaluates the effectiveness of various configurations of EB-FRP sheets in reducing residual displacement and enhancing self-centering in two sets of medium- (15 stories) and high-rise (20 stories) CSWs, located in Montreal and Vancouver. Nonlinear time history analysis was employed, with the shear walls designed and detailed according to NBCC 2020 and CSA A23.3-19 requirements. Results of the study are presented and analyzed in terms of the following parameters: inter-story drift ratio (IDR), residual inter-story drift of shear walls (RIDR) rotation of CBs, and bending moment and shear force of wall piers.

7.1. Residual Inter-Story Drift Ratio

The inter-story drift ratio is the horizontal displacement between two adjacent floors divided by the story height, and is subject to a maximum limit of 2.5%, as prescribed by NBCC 2020. This parameter is the most significant factor contributing to structural damage in shear walls during earthquakes. On the other hand, the primary aim of the present study is to assess the effectiveness of using EB-FRP sheets to minimize the residual displacement and enhance the self-centering capacity of CSWs. However, establishing specific criteria for restricting residual displacement in RC structures remains a topic of ongoing discussion and debate within the engineering community. While ASCE 7-22 [79] does provide a guideline for limiting the maximum residual inter-story drift ratio (RIDR) in buildings exceeding 73 m in height to 1%, there are currently no other universally accepted standards in place. Accordingly, the RIDR will be deemed the focal point of this article, and the present section presents the outcomes of the NLTH for the given indicators. Moreover, the findings unveil a significant variation in the walls’ response between the eastern and the western regions of Canada, which can be attributed to the distinctive levels of seismicity and ground motion sources in these areas.

7.1.1. Western Canada

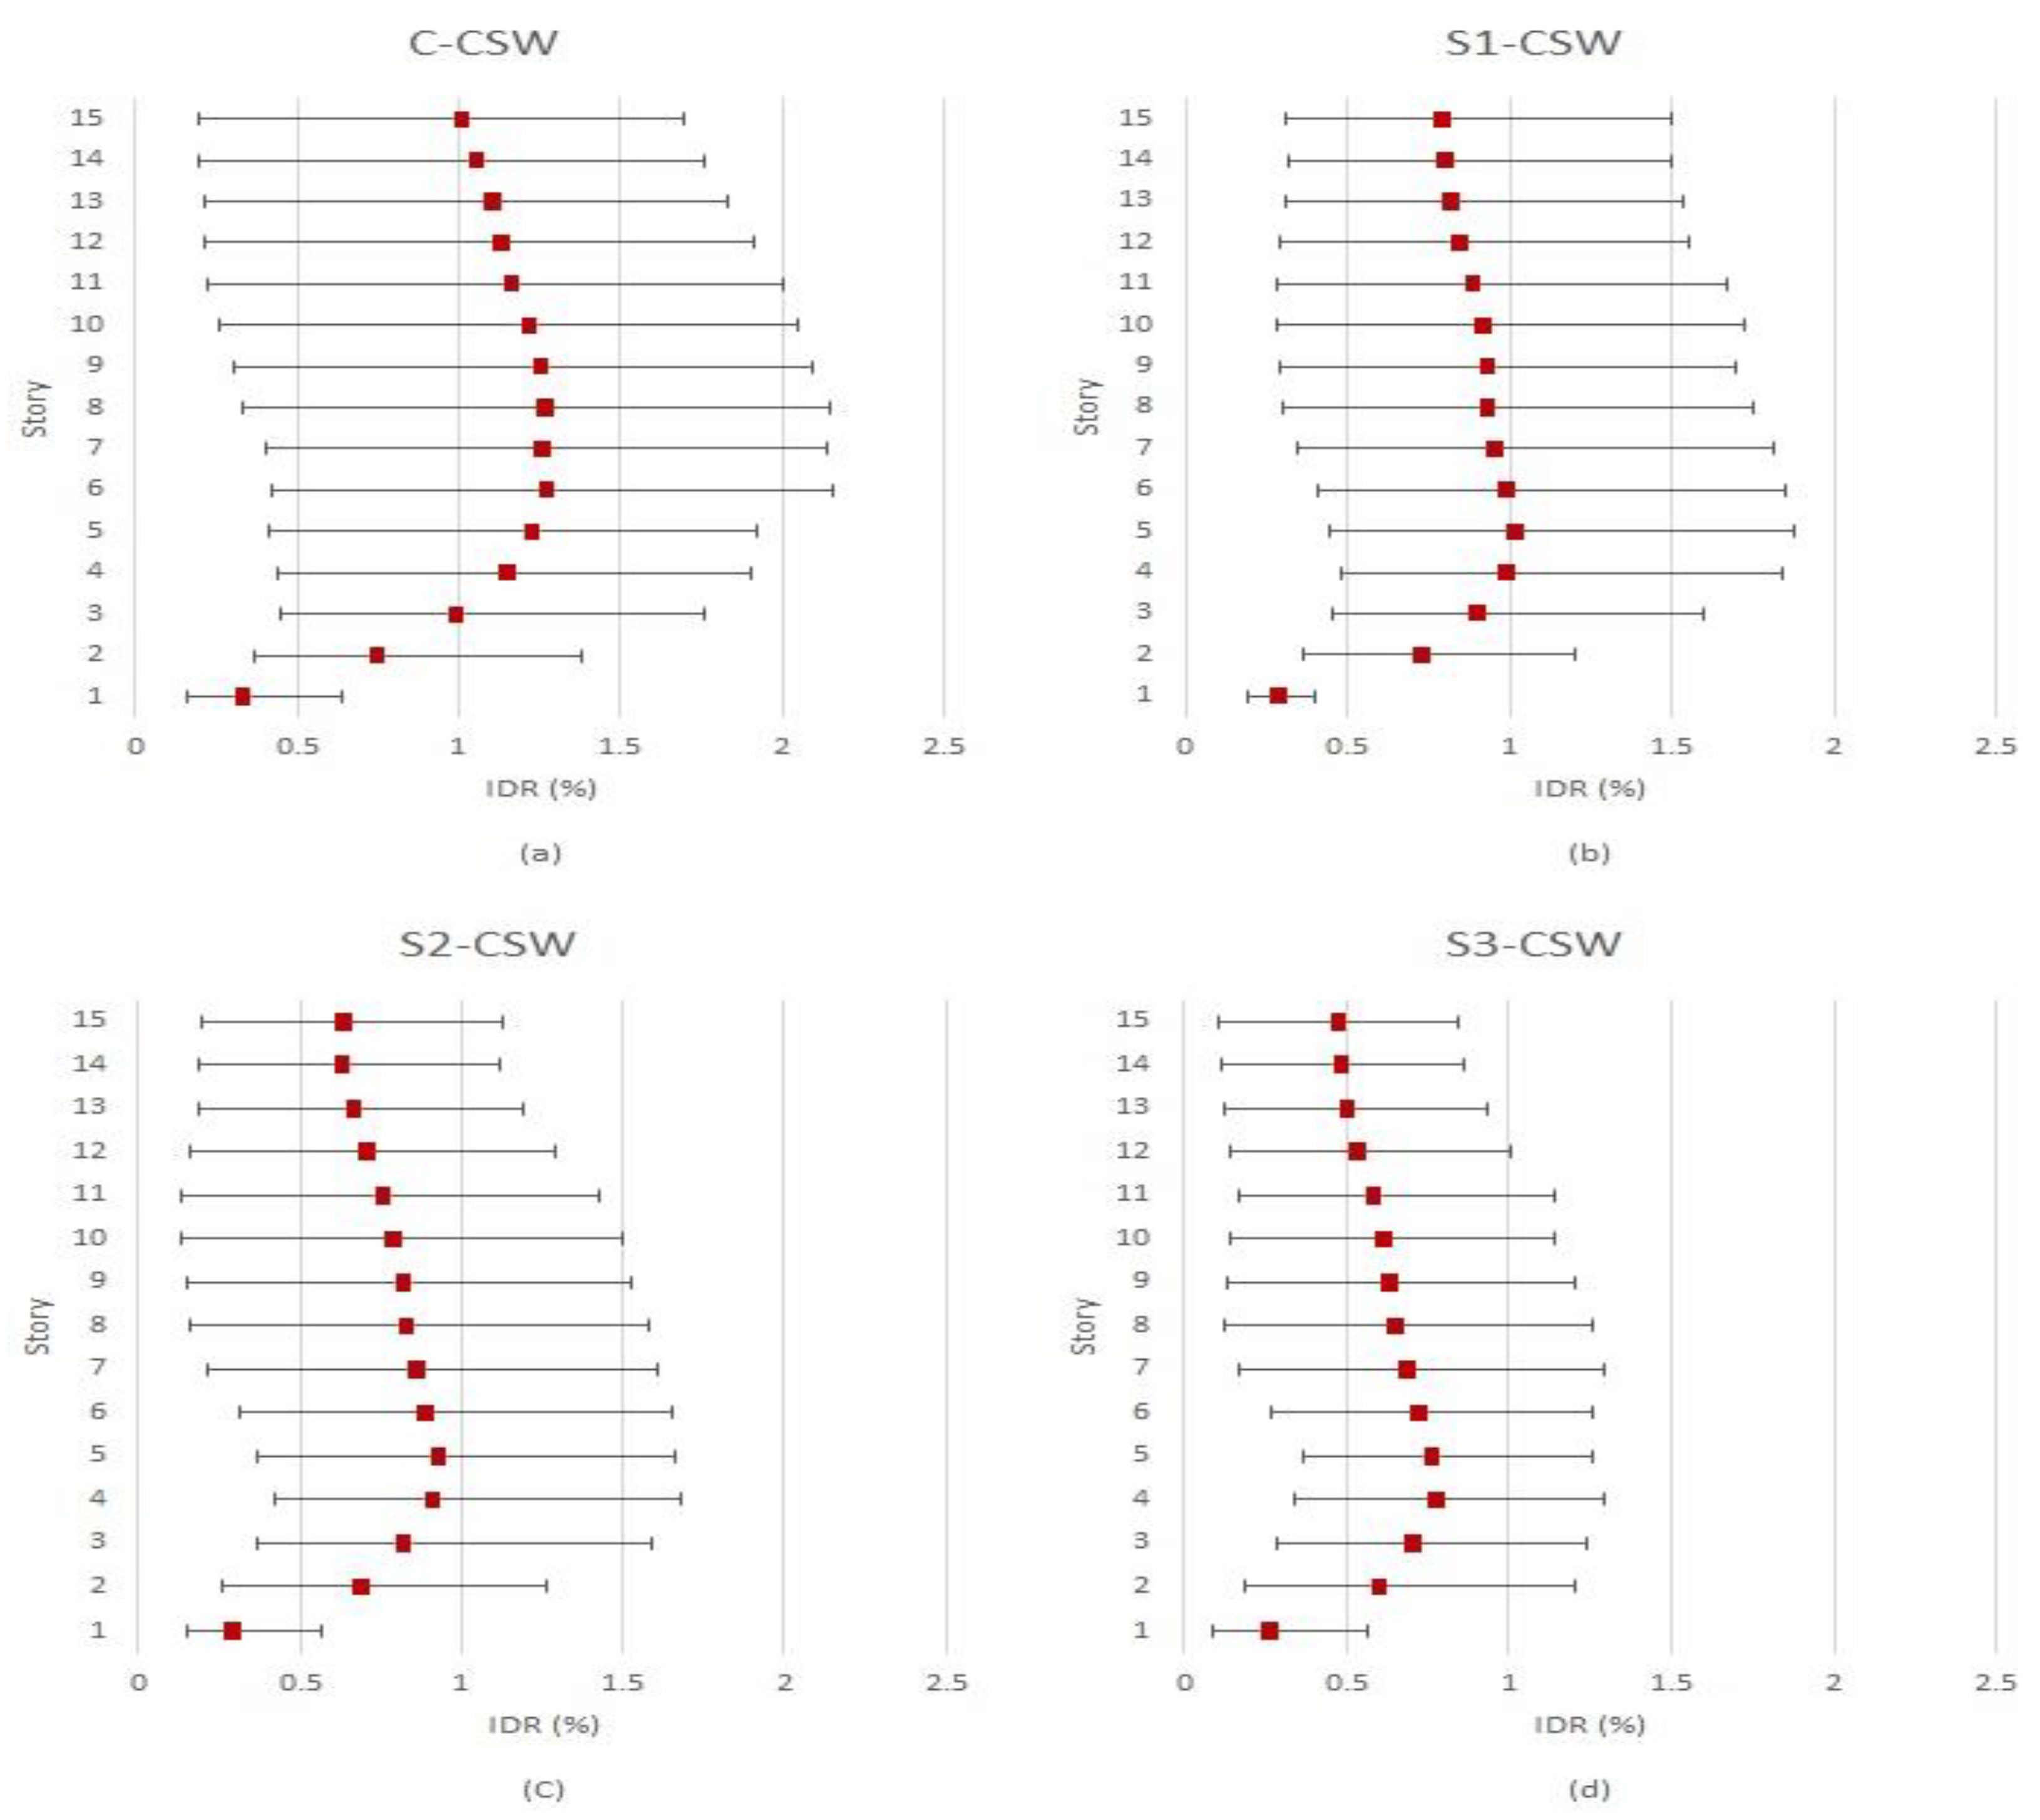
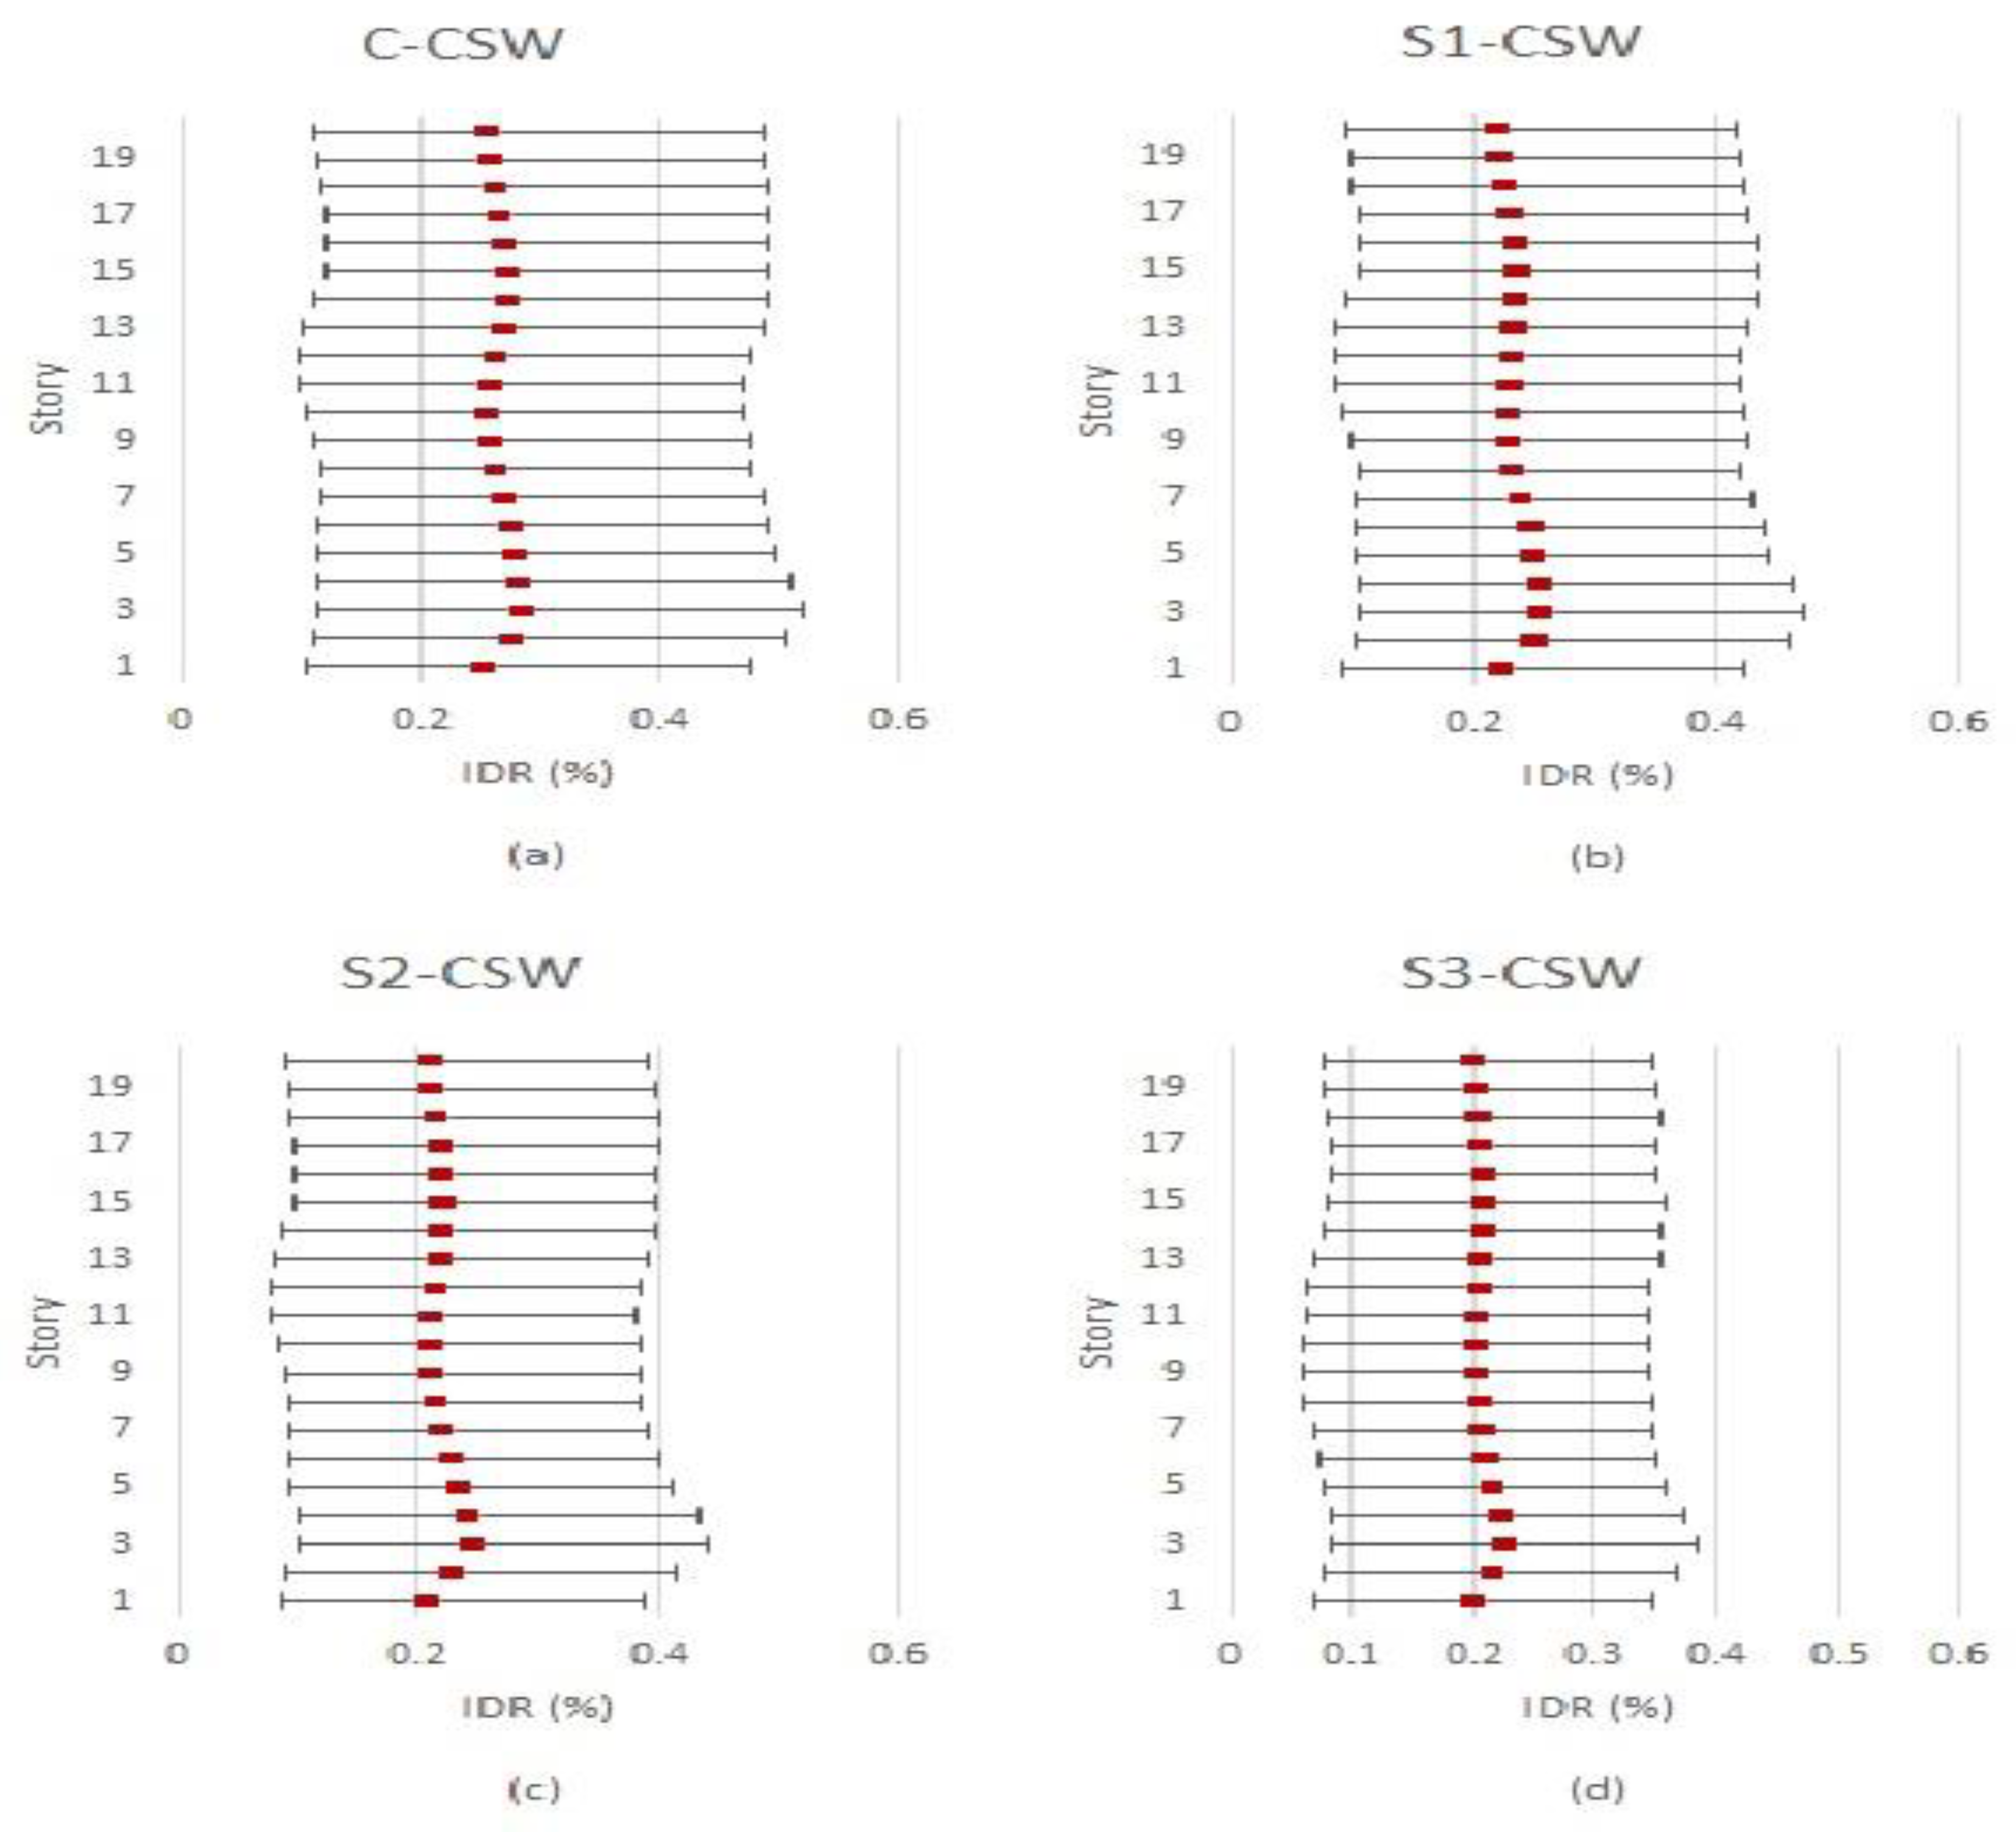
The graphical representation of Figure 9 illustrates the IDR domains of 20-story CSWs for fifteen different time histories. Each story is denoted by a pair of vertical solid lines, with the first representing the minimum IDR value obtained through NLTH analysis and the second representing the maximum. The red box indicates the mean value of all responses. The results indicate that the highest mean value of the C-CSW was observed in the 5th story, with a remarkable value of 1.31%, predominantly influenced by Cascadia events (M9). Notably, the impact of these events was more pronounced in the 20-story CSWs, as the dominant period in these ground motions is close to the natural period of high-rise structures. However, the application of EB-FRP resulted in a notable decrease in the peak IDR, specifically, a 13, 18, and 27% reduction in S1-CSW, S2-CSW, and S3-CSW, respectively. Moreover, it was found that strengthening schemes can mitigate the fluctuation of the mean IDR across the height of the wall. Additionally, the upper floors (60–70% of the wall height) may experience a second PH due to the higher mode effect, as shown in Figure 9.
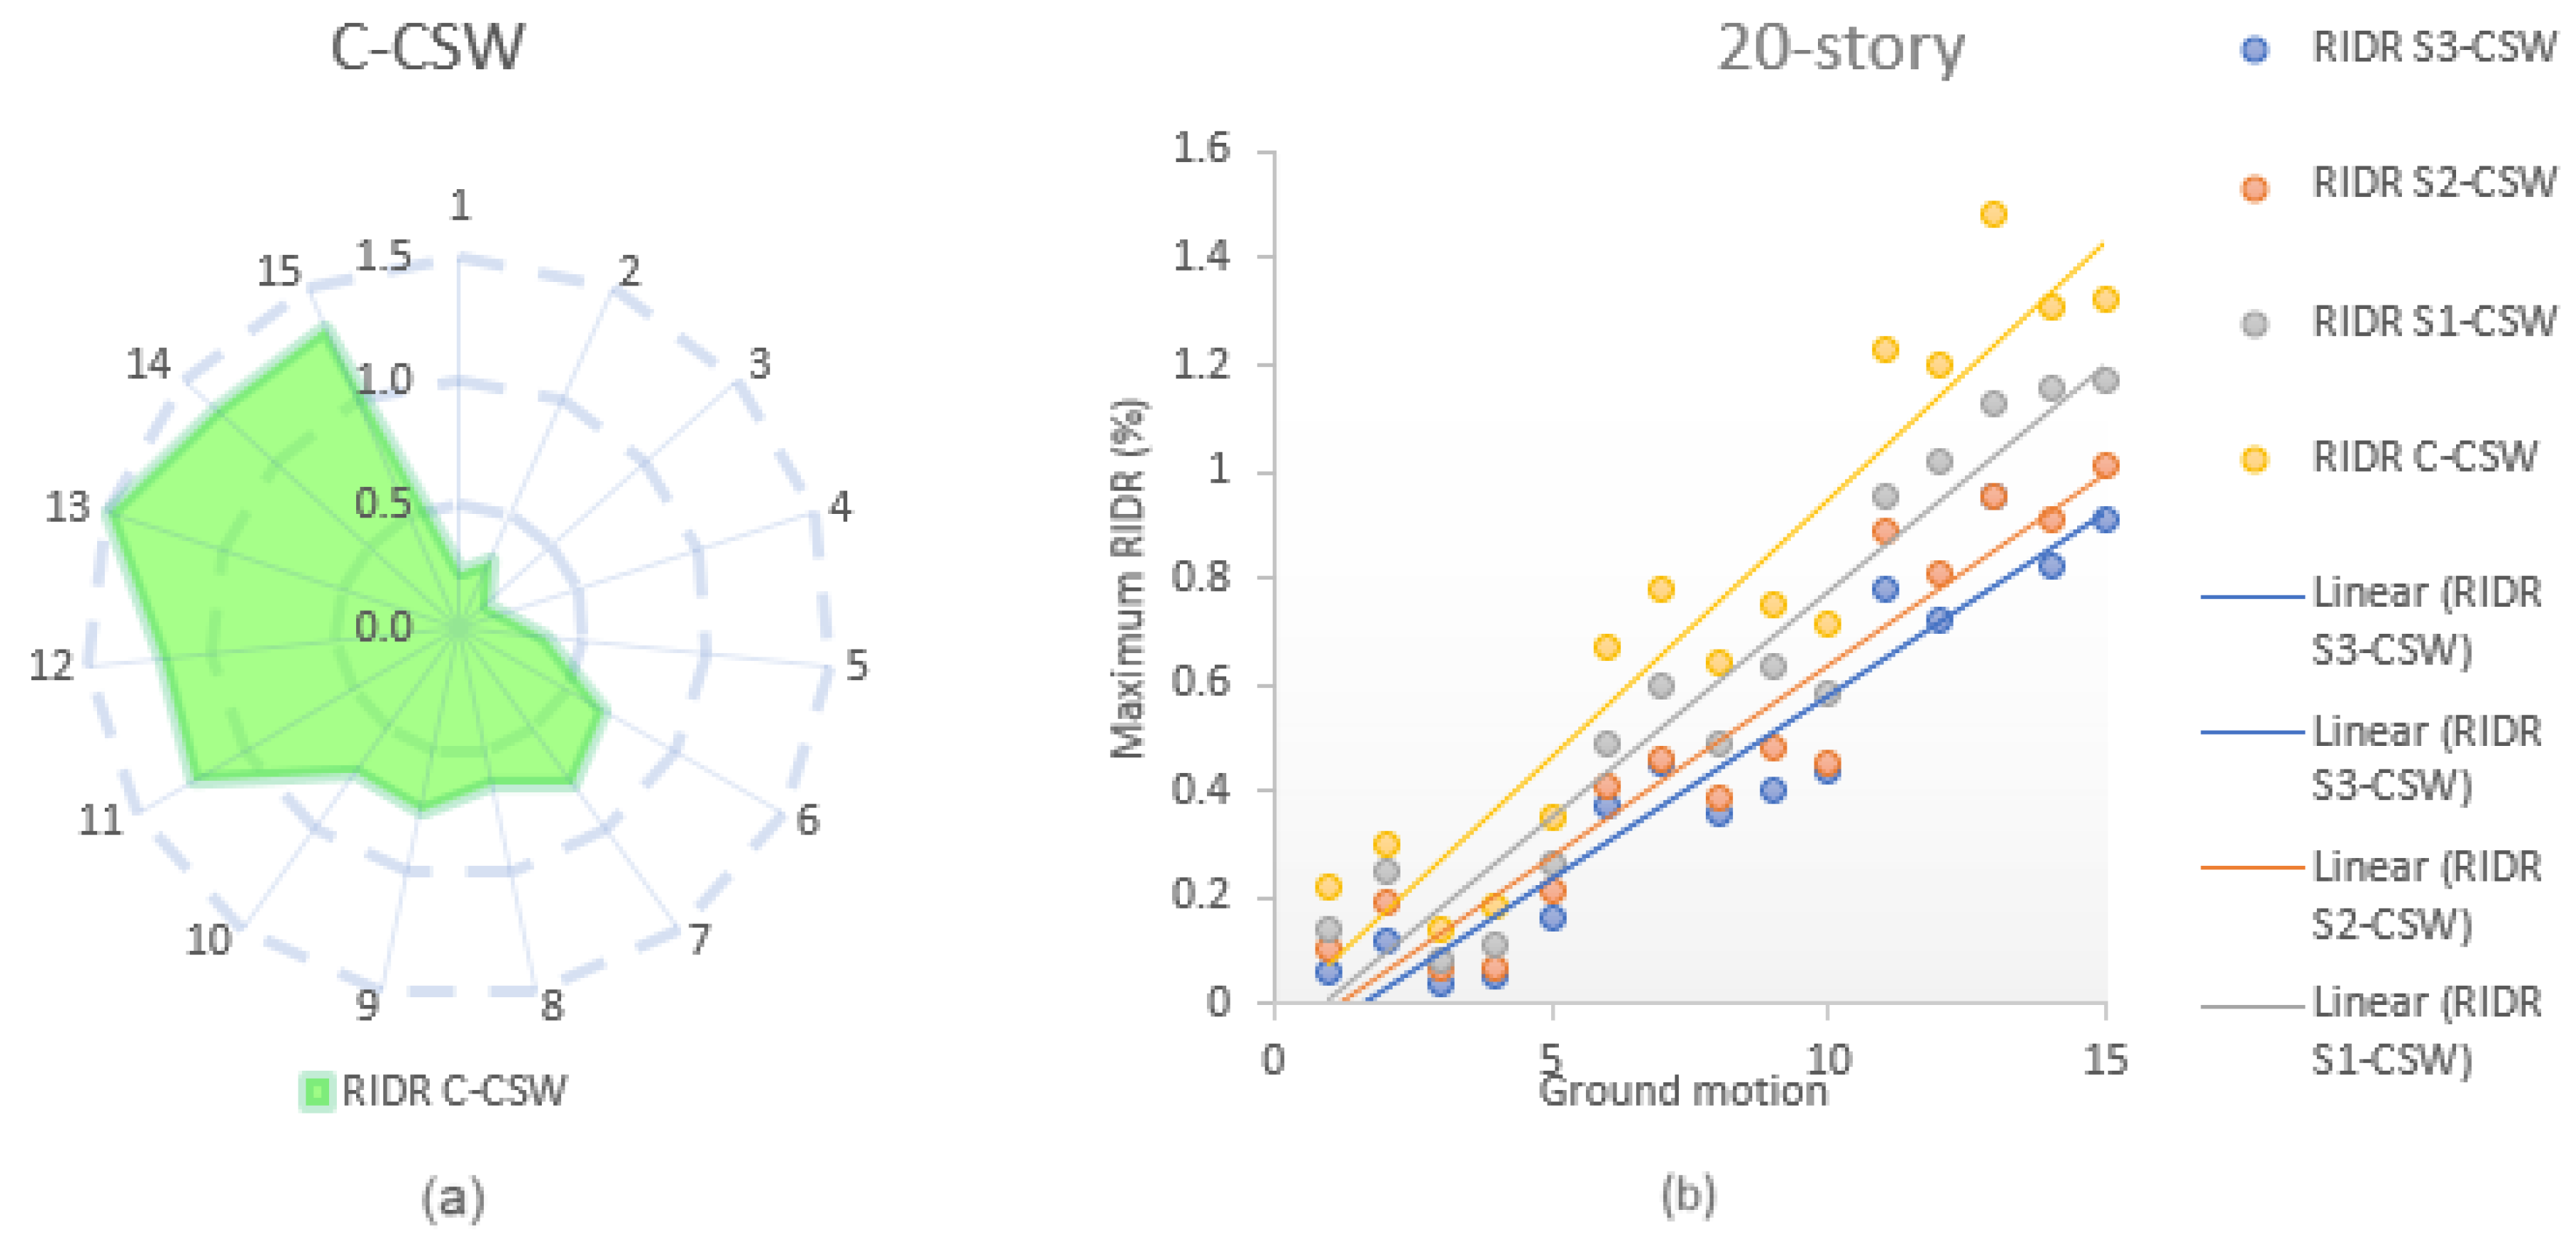
This reduction results in a significant decrease in the residual inter-story drift ratio (RIDR). The RIDR distribution in a 20-story C-CSW subjected to fifteen ground motions is depicted in Figure 10a. It is observed that, similarly to the IDR, scenario (iii) (M9) was dominant for the highest obtained values. In the C-CSW, among all ground motions, the maximum RIDR was found to be 1.48% for time history number 13, while the minimum value occurred in time history number 3, with a value of 0.04%. Such a finding highlights the impact of low-frequency ground motions on high-rise structures, leading to heightened stimulation of the first vibration mode of the wall and consequent escalation of the flexural demand at the lower levels. This escalation can lead to an expansion of more bending cracks along the wall, concrete crushing at the base of the wall piers, and, consequently, more residual deformation in the CSW. Nevertheless, Figure 10b indicates that implementing EB-FRP sheets results in a significant reduction of the RIDR in the C-CSW. The results revealed a 41%, 34%, and 20% reduction in the peak RIDR in S3-CSW, S2-CSW, and S1-CSW, respectively. The observed self-centering ability improvement can be attributed to the superior efficiency of vertical EB-FRP sheets in increasing the flexural strength and stiffness of wall piers, with the magnitude of impact positively correlated with the proximity to the edge. Additionally, confinement of CBs and walls with FRP wrapping can increase shear strength, load-carrying capacity, and ductility of the CSW to avoid shear failure due to flexural overstrength in the base of the wall. The significance of the aforementioned issue lies in the fact that the plastic hinge formation at the base of the wall, resulting from resonance in the first mode of vibration, leads to an increase in shear force in the wall due to the influence of higher modes. As such, it becomes imperative to enhance the shear strength of the wall to avoid any possibility of brittle shear failure. However, previous studies have shown that cantilever single shear walls are more sensitive to this issue [80].
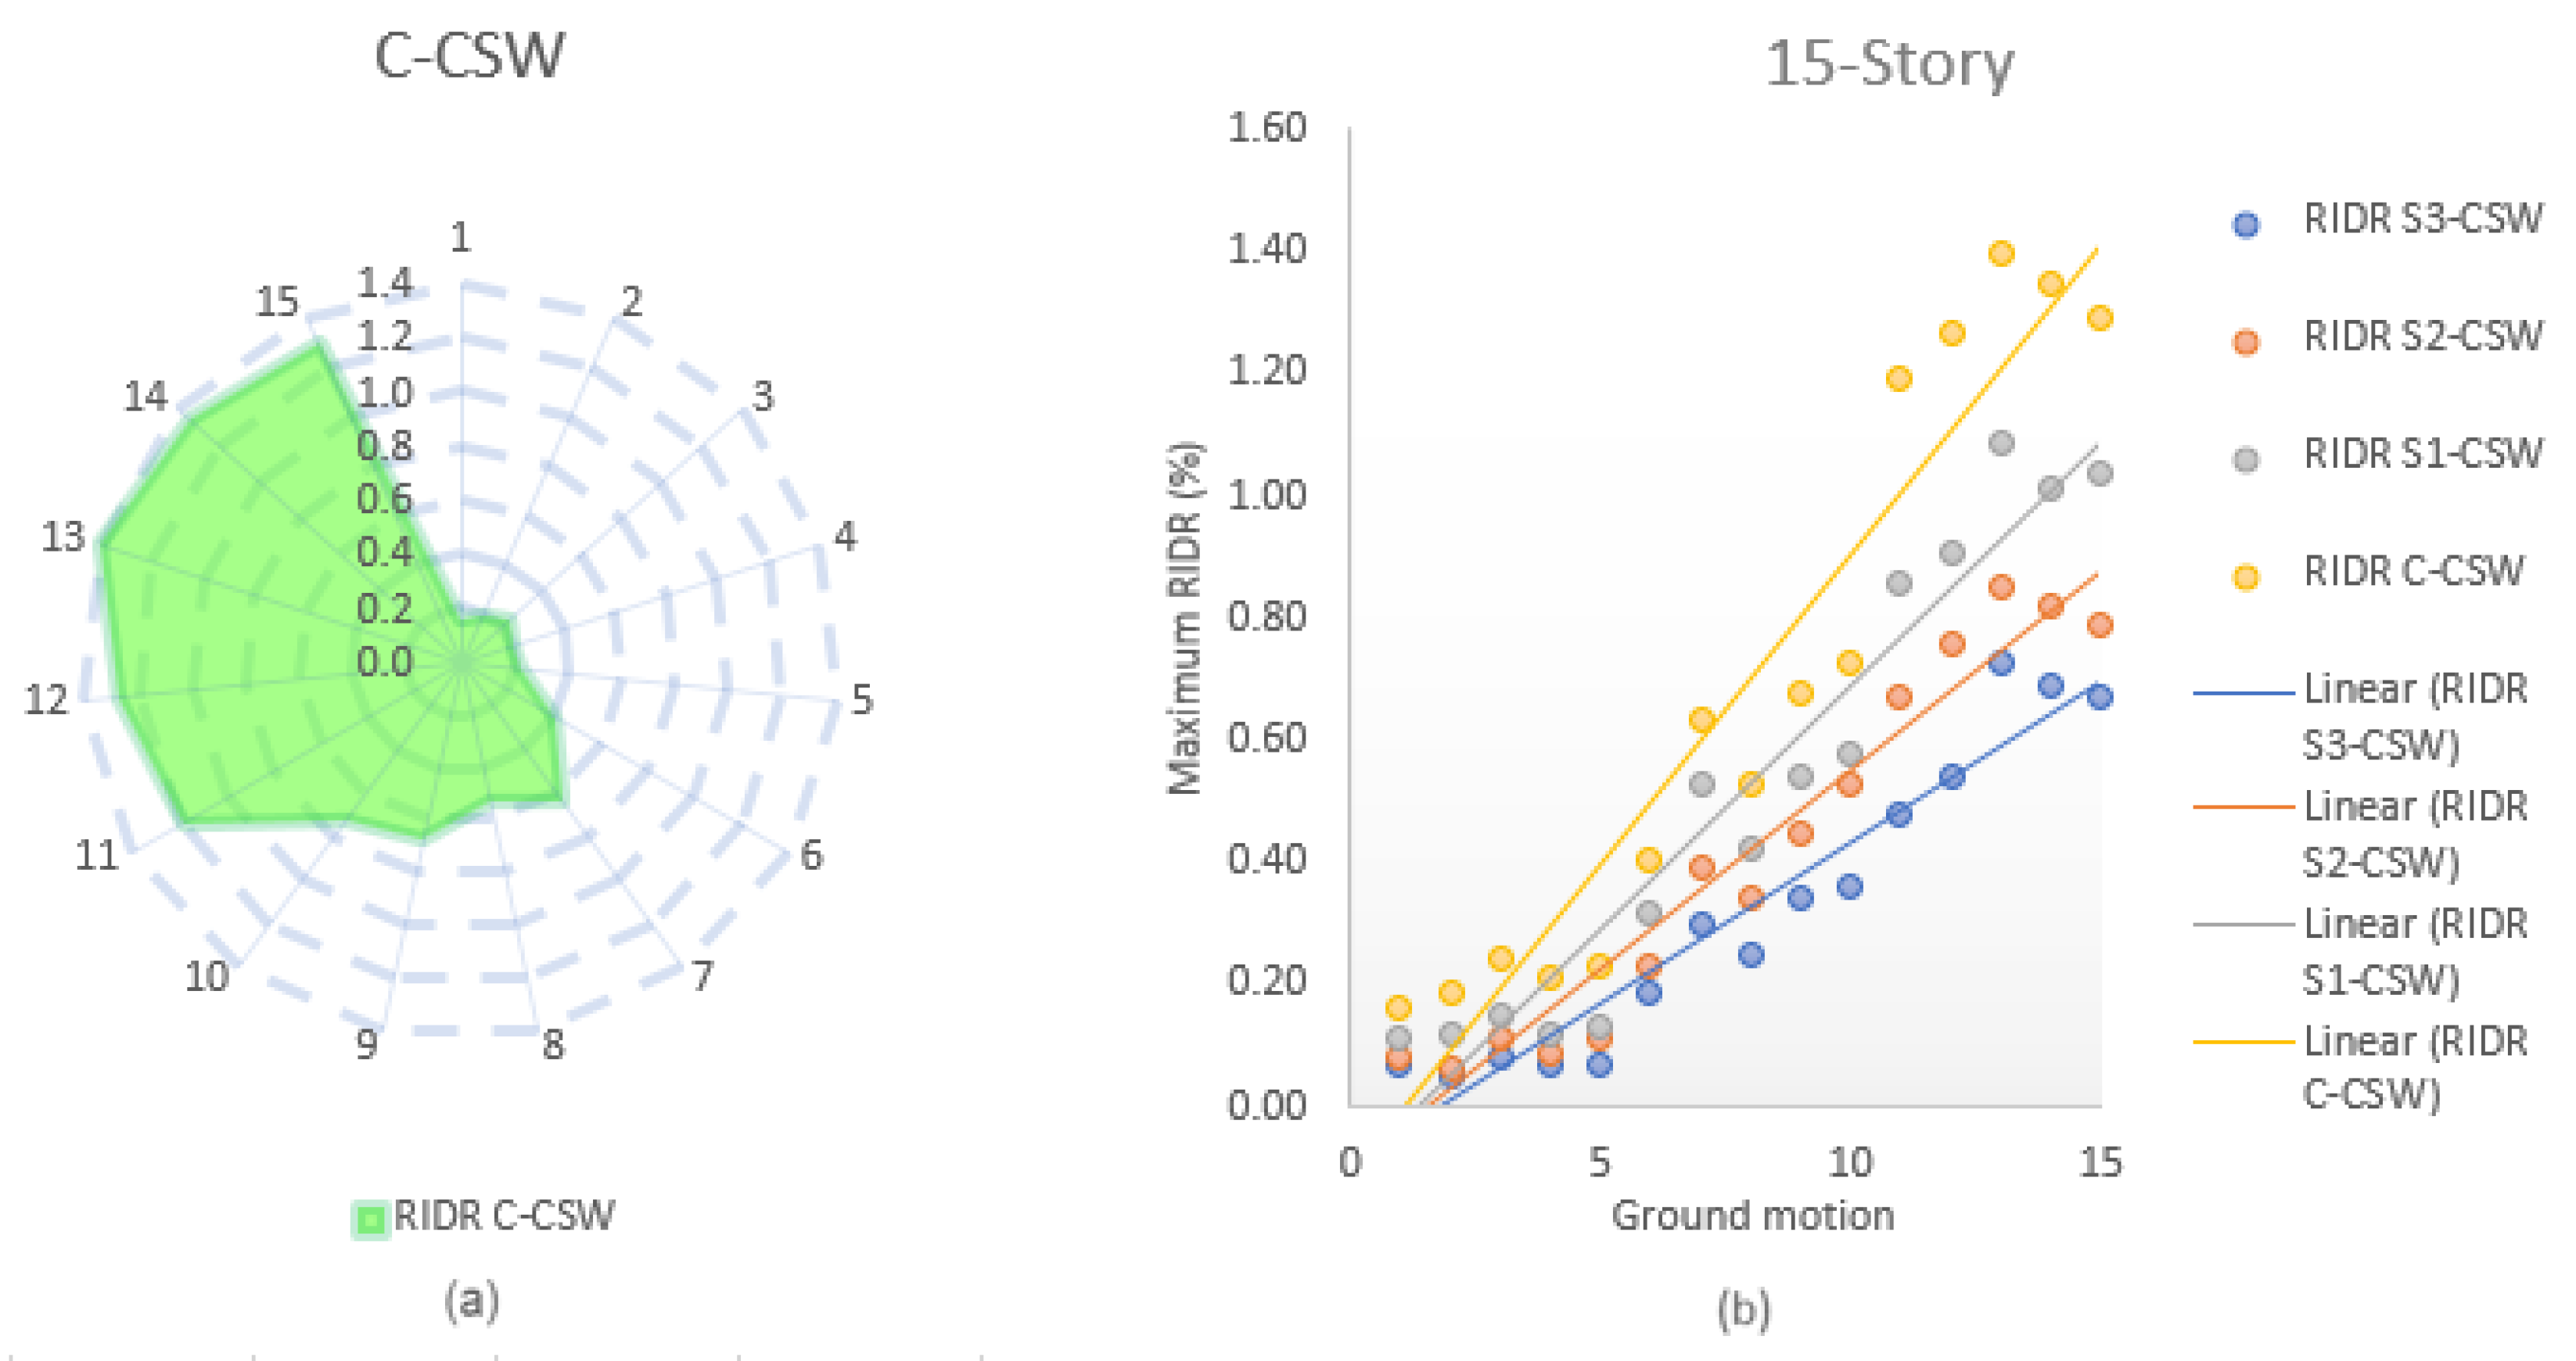
The effectiveness of strengthening configurations was notably more pronounced in the medium-rise CSW. In a 15-story CSW, the implementation of EB-FRP sheets reduced the peak IDR by 39, 26, and 19% in S3-CSW, S2-CSW, and S1-CSW, respectively. Additionally, the impact of higher modes was less pronounced on shorter CSWs. Furthermore, the effect of EB-FRP strengthening on the increase in shear wall stiffness was inversely proportional to the wall height, which is in agreement with previous research by Arabzadeh and Galal [5]. Notably, S3-CSW demonstrated the capacity to decrease the maximum RIDR by up to 53%, while S2-CSW and S1-CSW showed a decrease of 40% and 25%, respectively. Figure 11 and Figure 12 show the IDR domains of a 15-story CSW, and the maximum RIDR in a 15-story CSW, respectively.

7.1.2. Eastern Canada

Despite having less seismic activity compared with western Canada, the eastern region of Canada is abundant in high-frequency ground motions that can intensify the effect of higher modes. This observation was substantiated by the outcome of NLTH analysis for a 20-story CSW located in Montreal, where the probability of the formation of the second PH was noted to be significant in stories 14–16. However, the average IDR for these walls was significantly lower than for the corresponding walls in Vancouver, which are exposed to low-frequency Cascadia (M9) ground motions. The peak mean IDR value was dominated by (M7) events and occurred in stories 2–4 at approximately 0.29%, whereas the mean IDR was around 0.27% in stories 14–16. The proposed strengthening configurations reduced the peak mean IDR by 20, 14, and 10% in S3-CSW, S2-CSW, and S1-CSW, respectively. Additionally, similarly to the response experienced in western Canada, the strengthening measures led to a decline in the fluctuations of mean IDR values across the wall height. Figure 13 shows the IDR domains of a 20-story CSW in Montreal.
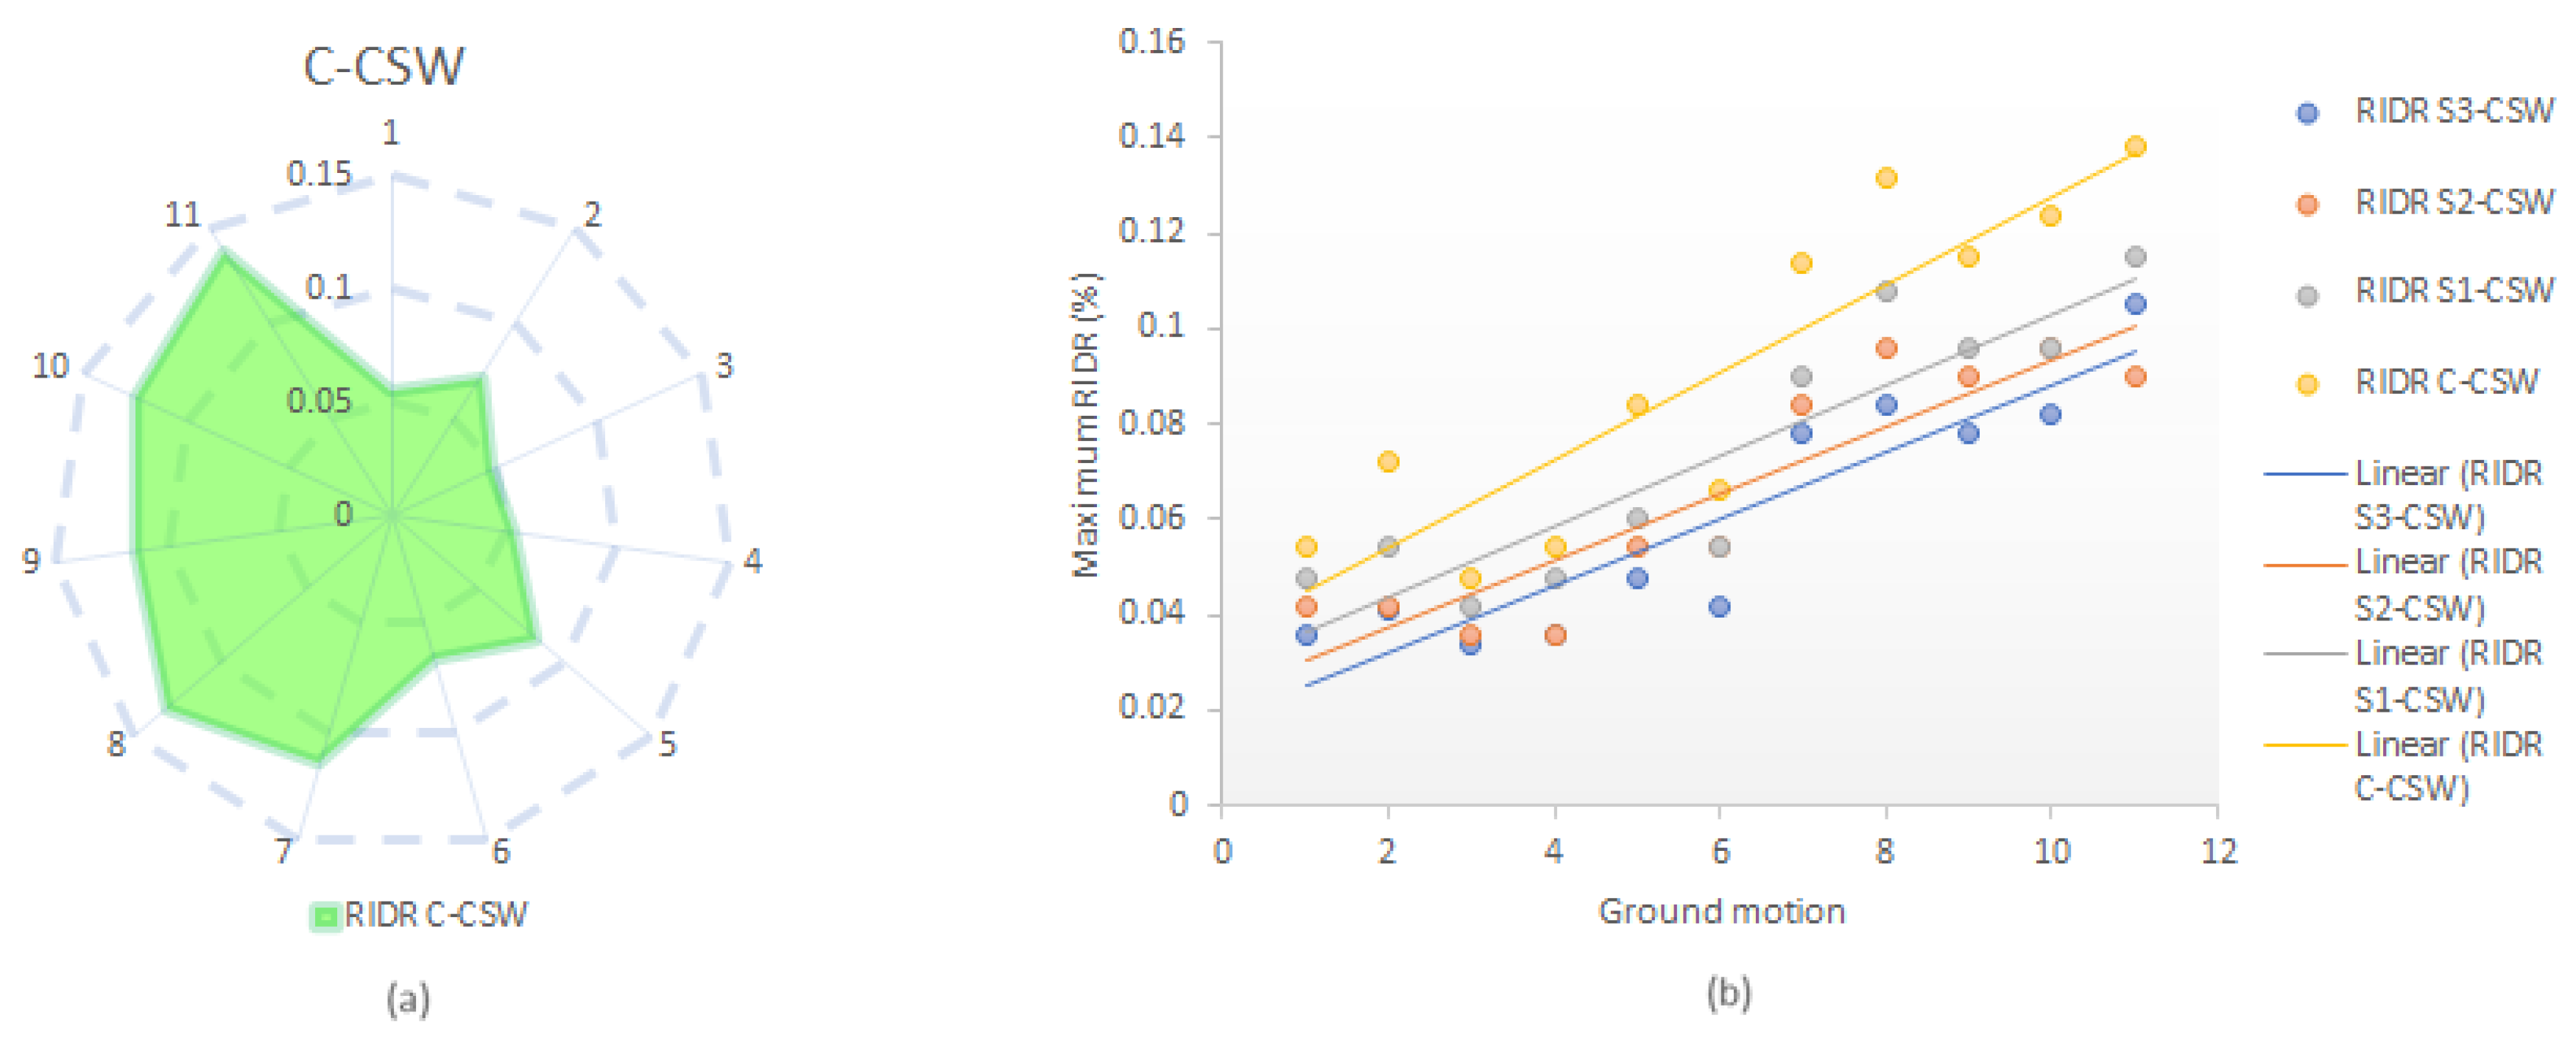
As a result of the shortage of low-frequency ground motions and a low seismicity level in the eastern region of Canada, flexural demand in the walls is much lower; thereby, residual displacement in CSWs in that area was significantly lower than that observed in the western zone. However, due to the geometric configuration of CSWs, the lateral displacement is primarily inelastic, as will be explained in the subsequent section. Consequently, even with significantly low movements, some residual displacement occurs in CSWs in eastern Canada, dominated mainly by (M7) events with lower frequency content. Figure 14a shows the RIDR distribution among all ground motions.
Figure 14b illustrates that the peak mean RIDR within the 20-story C-CSW structure was measured at 0.09%. S3-CSW could lower this value by 29%, compared with 26% and 14% for S2-CSW and S1-CSW, respectively. Nonetheless, given the minimal RIDR values exhibited by these walls, it is not deemed reasonable to use any strengthening technique to reduce residual displacement within the eastern Canadian region.
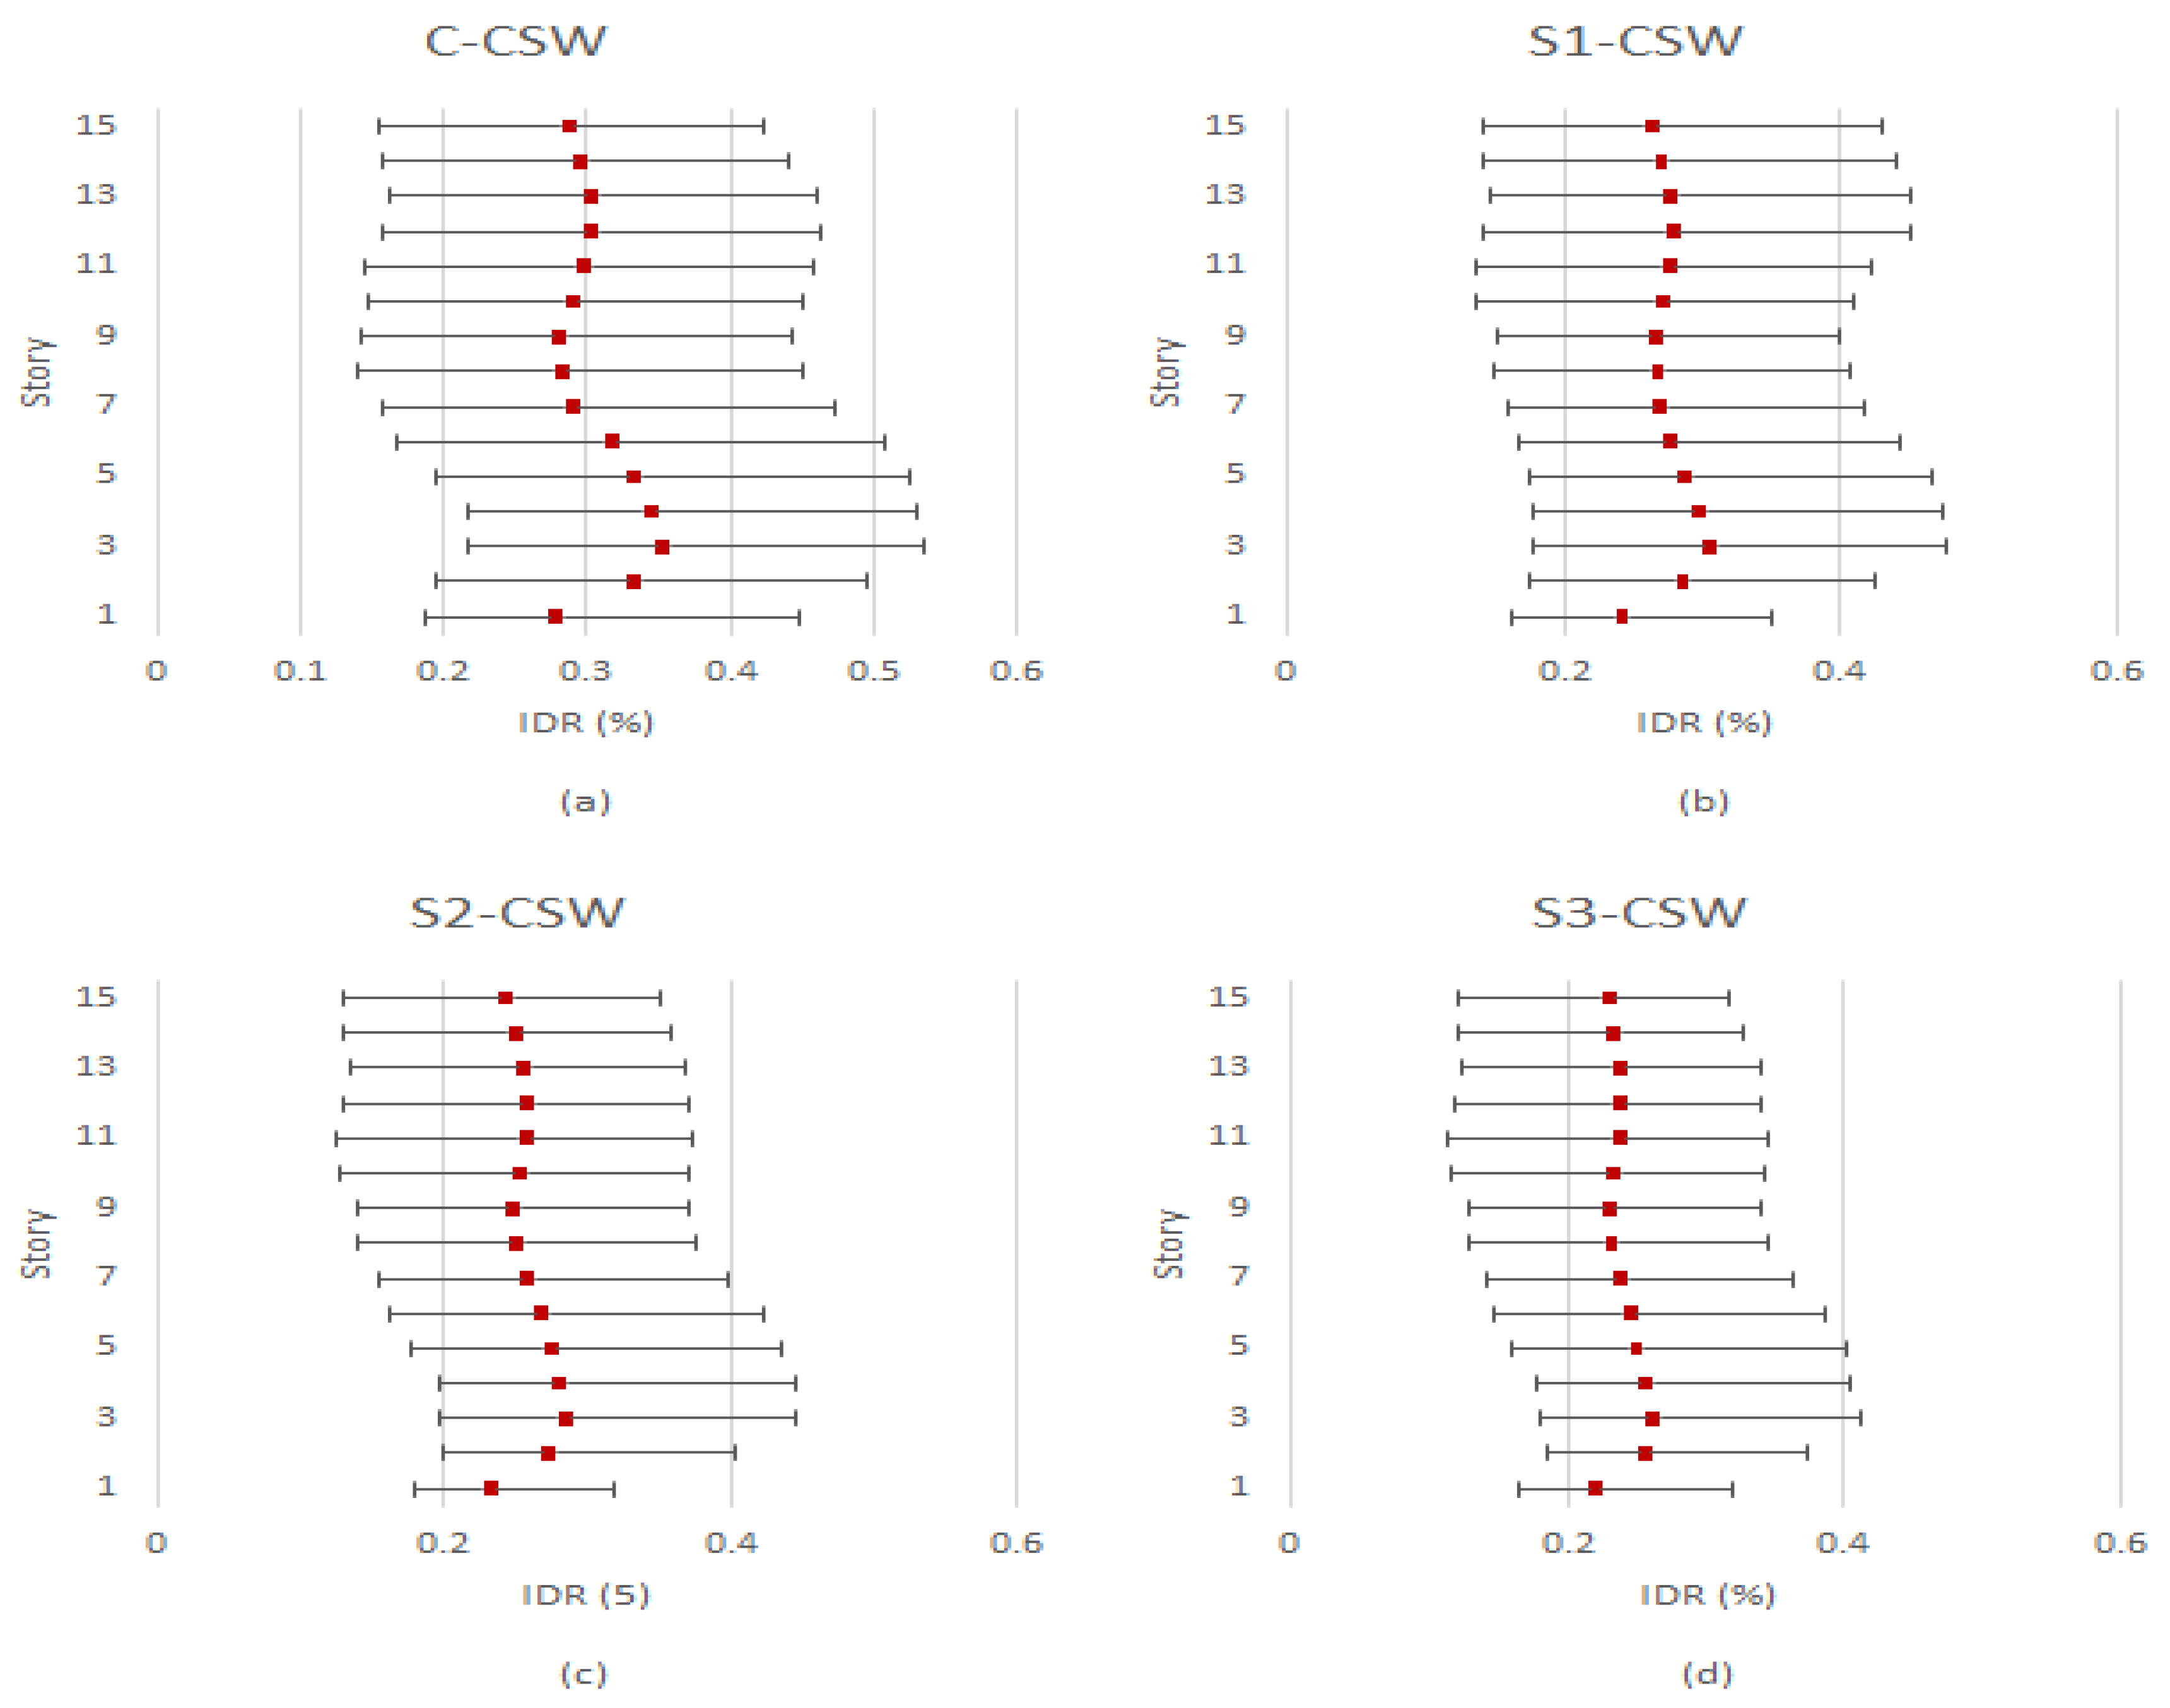
The findings of the present study indicate that the suggested strengthening configurations are more effective in reducing the IDR of a 15-story CSW than that of a 20-story CSW. Specifically, the maximum IDR reduction in S3-CSW was 26%, which is more effective than the corresponding configuration implemented in the 20-story CSW. The peak mean IDR reductions for S2-CSW and S1-CSW were 19% and 14%, respectively. Furthermore, the impact of higher modes was found to be less pronounced in the 15-story CSW.
It is worth noting that S3-CSW exhibited the highest level of effectiveness in reducing the maximum RIDR across all configurations, with a reduction of 34%. In comparison, the maximum RIDR reduction achieved by S2-CSW was 28%, while the least effective configuration was S1-CSW, which resulted in a 19% reduction in the peak RIDR. Figure 15 and Figure 16 show the IDR domains of a 15-story CSW, and the maximum RIDR in a 15-story CSW, respectively.

7.2. Beam Rotation

The total horizontal movement of CSWs includes both elastic and inelastic displacement. However, the elastic portion of displacement is deemed negligible due to the reverse bending in CBs, as suggested in CSA A23.3-19. On the other hand, a CB’s rotation is determined by the difference between the rotation of the wall piers and the floor. Additionally, the rotation of the wall piers in relation to the maximum rotation of CBs is much more effective than the floor rotation, leading White and Adebar [81] to suggest disregarding the floor rotation in the critical wall slope for simplification purposes. Consequently, a noteworthy similarity exists between the shape of the mean IDR envelope of CSWs and the mean maximum rotation of the CBs’ envelope.

7.2.1. Western Canada

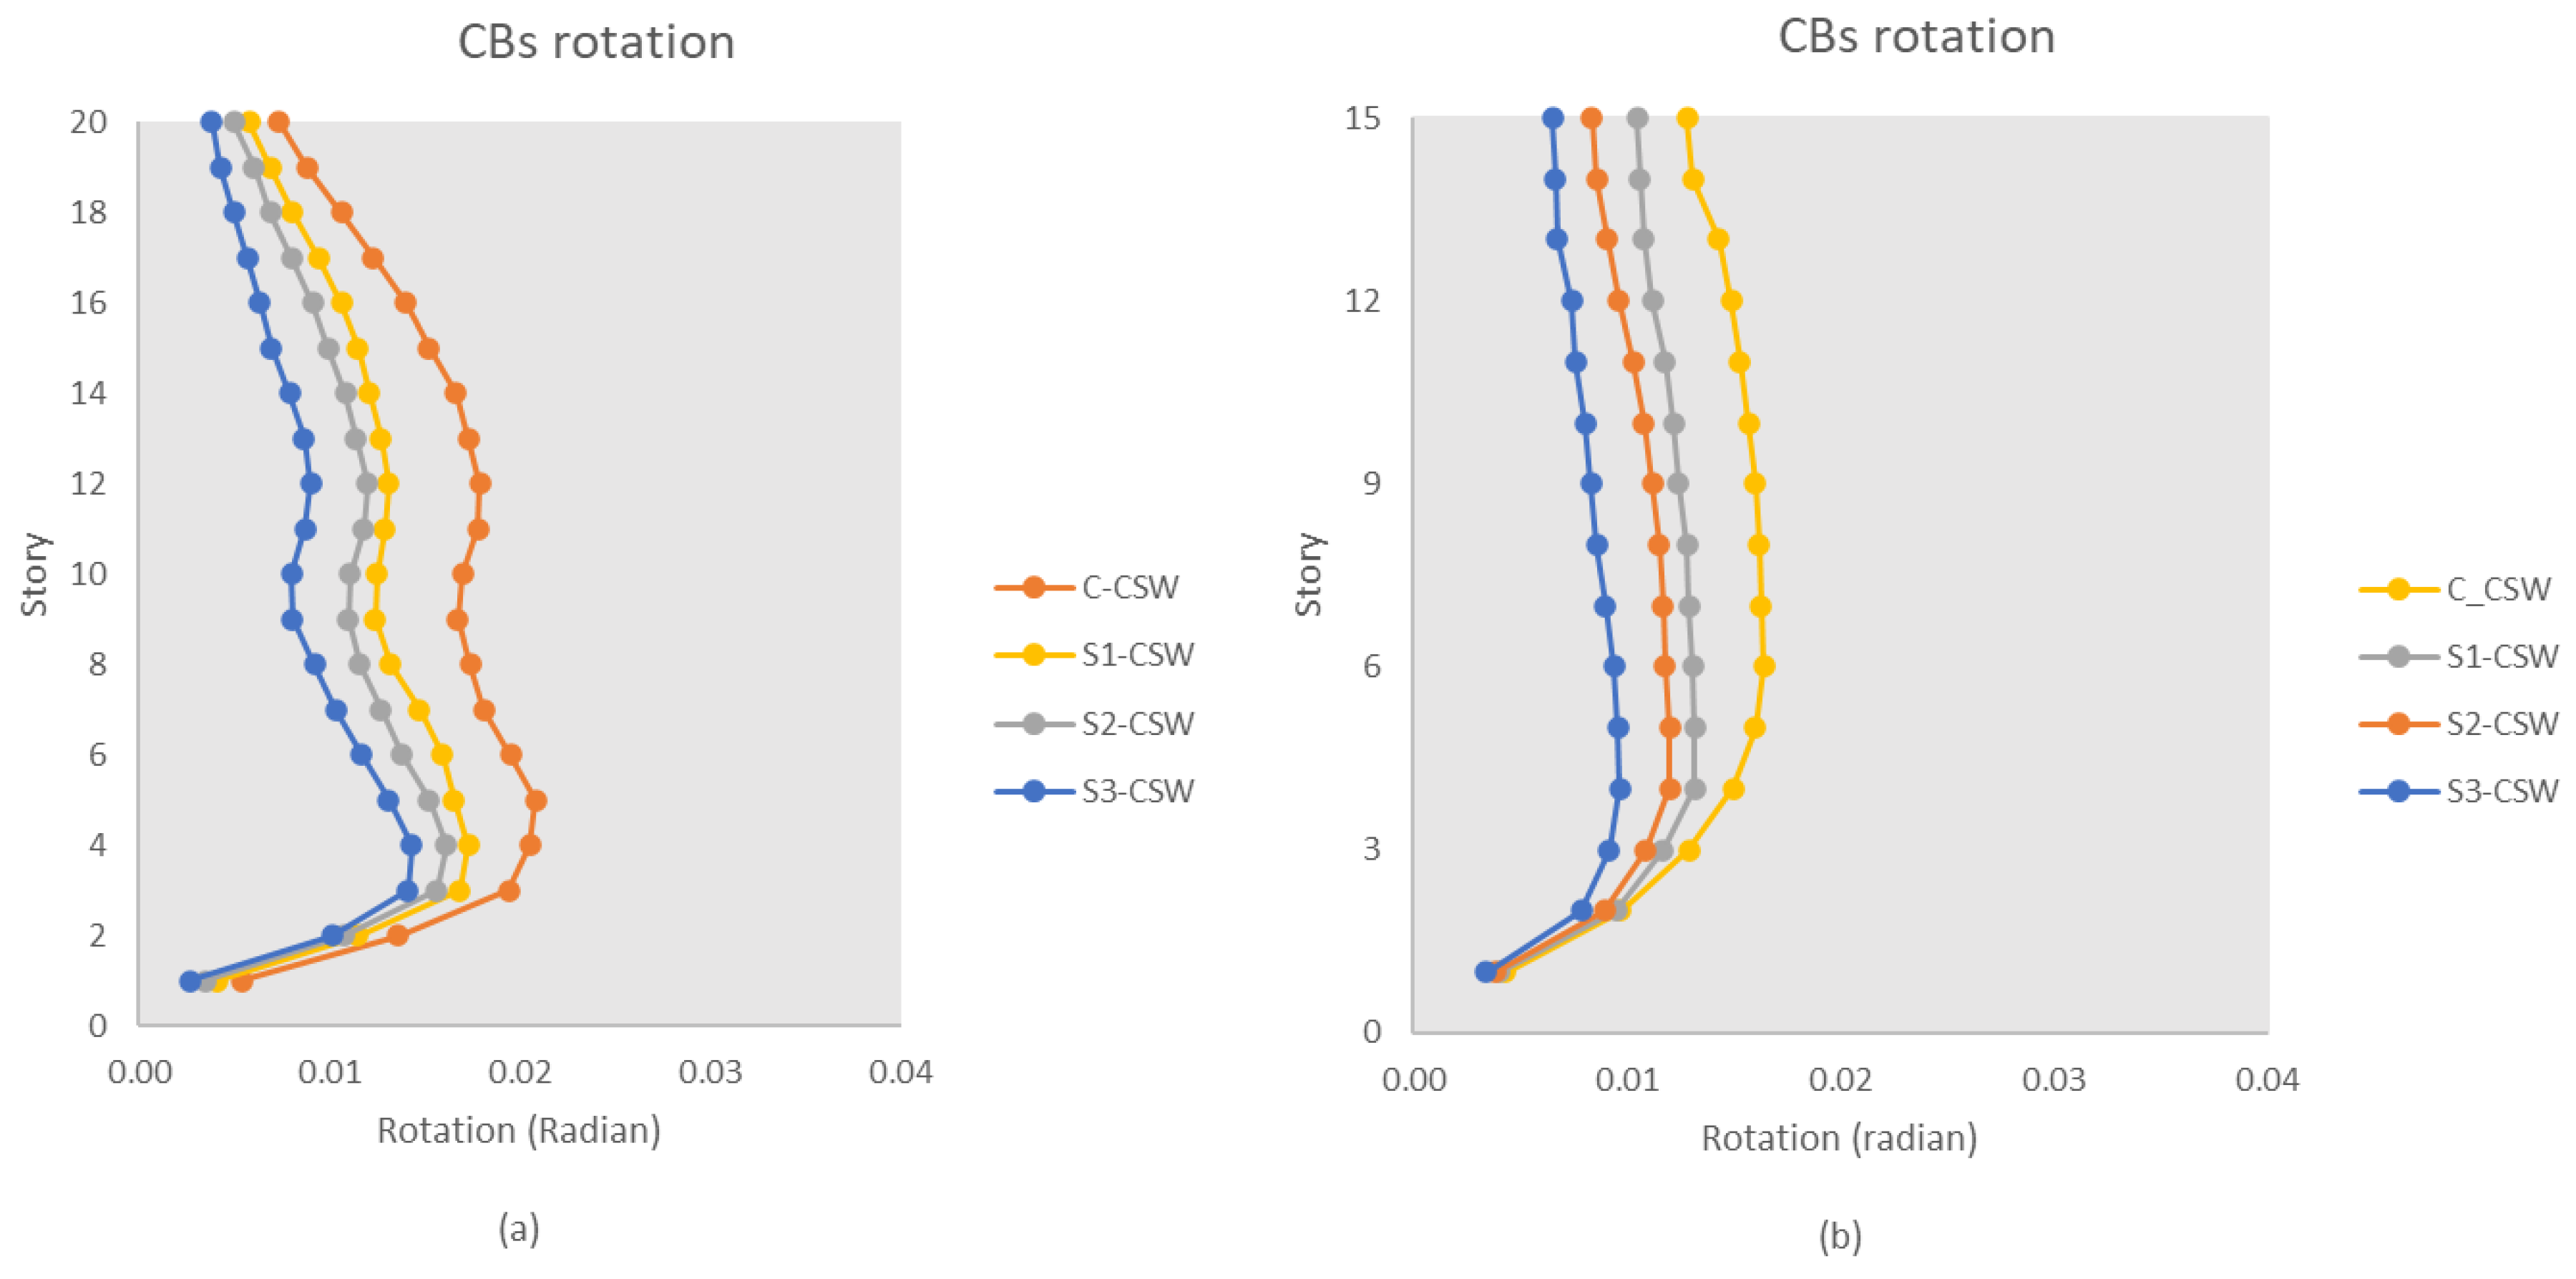
As clearly shown in Figure 17a, EB-FRP sheets have demonstrated a significant capacity to reduce the rotation of CBs in a 20-story CSW. While the maximum CB rotation in the C-CSW was measured as 0.02, falling below the capacity limit outlined before, it is noteworthy that S3-CSW displayed a 31% reduction in peak mean CB rotation. Similarly, S2-CSW and S1-CSW experienced a 23% and 17% decrease, respectively. These findings suggest that the proposed strengthening configurations are an efficient solution for limiting CB rotation in high-rise CSWs in western Canada. The data indicate that the effectiveness of strengthening configurations on a 15-story CSW was notably more pronounced. Specifically, the peak mean CB rotation was reduced by 41% in S3-CSW, while 27% and 20% reductions were observed in S2-CSW and S1-CSW, respectively. In addition, Figure 17b shows that the impact of higher modes on the rotation envelope of CBs is less significant in the 15-story CSW than in the 20-story CSW. Again, these findings prove that EB-FRP strengthening strategies are more effective in medium-rise buildings.

7.2.2. Eastern Canada

As previously explained, a strong correlation exists between the rotation of CBs and the IDR in CSWs. Also, the inherent high-frequency ground motions and lower seismic intensity in eastern Canada contribute to a lower IDR of CSWs in Montreal than their counterparts in Vancouver. Consequently, the study’s findings reveal that the rotation of CBs in CSWs located in Montreal is significantly lower than that in Vancouver’s corresponding CSWs.
In the C-CSW of Montreal, the peak value of the mean CB rotation envelope was 0.005, while in S1-CSW, S2-CSW, and S3-CSW, there was a reduction of 10%, 15%, and 20%, respectively. In addition, as depicted in Figure 18a, the impact of higher modes was more pronounced in a 20-story CSW, with the second peak being experienced in higher stories. In the case of a 15-story CSW, as shown in Figure 18b, the most effective strengthening configuration was S3-CSW, which led to a peak CB rotation reduction of 29%, compared with 22% and 16% for the S2-CSW and S1-CSW schemes, respectively.

7.3. Shear Demand in Wall Piers

The shear demand in wall piers was also evaluated as another critical factor. The findings of NLTH analysis revealed that, while the implementation of EB-FRP sheets can lead to a decrease in the IDR and rotation in CSWs, it may also result in an increase in the base shear demand of these walls in both eastern and western Canada.
Figure 19 illustrates the normalized mean story shear demand envelopes in all specimens, with the horizontal axis normalized by mean base shear demand in the C-CSW and the vertical axis normalized by building height. The NLTH analysis of a 20-story CSW located in Vancouver revealed that using EB-FRP sheets in S3-CSW increased the base shear demand by up to 16%. The mean base shear in S2-CSW and S1-CSW increased by 11% and 8%, respectively. Similarly, results for the 15-story CSW in this city showed a 22%, 15%, and 11% increase in S3-CSW, S2-CSW, and S1-CSW, respectively.
In the case of the 20-story CSW in Montreal, the use of EB-FRP sheets resulted in a 20%, 15%, and 12% increase in the base shear demand in S3-CSW, S2-CSW, and S1-CSW, respectively, while, in the 15-story CSW, the increase was 28%, 23%, and 19%, respectively. Table 8 shows the base shear demand in all specimens.
The frequency content of ground motions can significantly impact shear demand in buildings, mainly through higher modes’ excitation [42]. However, the rise in the base shear demand of CSWs due to the application of EB-FRP sheets can be attributed to two factors: (i) a decrease in the CSW vibration period due to an increase in stiffness; and (ii) an improvement in post-yield stiffness in strengthened members due to the confinement effect and flexural improvement caused by vertical and horizontal EB-FRP sheets. This effect has also been observed elsewhere [6,47,82].

7.4. Bending Moment Demand in Wall Piers

The use of vertical EB-FRP sheets enhanced the bending capacity of CSWs. However, the strengthening configurations could increase the bending demand in wall piers. This is illustrated in Figure 20, which shows the normalized mean bending moment demand across all specimens in the NLTH analysis. The 15-story CSW in Montreal exhibited the most significant influence, with an 18% increase in demand for S3-CSW, and a 13% and 9% increase for S2-CSW and S1-CSW, respectively. Similarly, the 20-story CSW in Montreal experienced a 13%, 11%, and 7% increase in demand for the same configurations. In contrast, the CSWs in Vancouver showed less influence, with the 20-story S3-CSW, S2-CSW, and S1-CSW experiencing increases of 11%, 7%, and 3%, respectively, and the 15-story CSW showing a 16%, 11%, and 8% increase in S3-CSW, S2-CSW and S1-CSW, respectively. Table 9 shows the base bending moment demand in all specimens.

8. Conclusions

The present study aimed to assess the effectiveness of EB-FRP sheets in reducing residual displacement of medium-to-high-rise CSWs in Vancouver and Montreal, representing western and eastern Canadian seismic zones, respectively. All CSWs were designed and detailed according to CSA A23.3-19 and NBCC20. Three distinct strengthening schemes were considered for each CSW, and 2D nonlinear time history analysis using RUAUMOKO software was conducted for all RC CSWs, strengthened and un-strengthened. Based on the seismic hazard de-aggregation results, fifteen and eleven ground motions were chosen and scaled to the target spectrum for Vancouver and Montreal, respectively. Consequently, a total of 208 nonlinear time history analyses were carried out to evaluate the impact of EB-FRP sheets on various parameters of CSWs. On the basis of the results, the following conclusions can be drawn:
  • EB-FRP sheets are a viable option for reducing the RIDR in existing modern CSWs (14–53%). The proposed strengthening schemes were evaluated, and it was found that S3-CSW was the most effective in decreasing the RIDR in CSWs. However, it was also observed that the efficiency of the proposed configurations decreased as the height of the shear walls increased. Notably, the RIDR in western Canada was significantly higher compared with eastern Canada.
  • The predominant cause of the RIDR among CSWs in western Canada can be attributed to Cascadia events, compared with other seismic sources. Apart from their long duration, which could induce structural fatigue, the low frequency of such events could result in resonance in high-rise buildings with longer vibration periods.
  • Based on the behavior of 15-story and 20-story CSWs in eastern Canada, it is not deemed reasonable nor cost-effective to apply EB-FRP sheets on the CSWs in this region due to their predominantly elastic behavior and absence of significant residual displacement. Nonetheless, it was observed that, for the eastern CSWs, higher modes had an impact, displaying the potential formation of a second plastic hinge in the upper stories (60–70% of the wall height).
  • The S3-CSW performed better in reducing the IDR and CB rotation. This can be attributed to the higher flexural strength resulting from the three layers of vertical EB-FRP sheets, coupled with the confinement caused by the FRP wrapping. Moreover, the horizontal FRP sheets enhanced the shear strength of CSWs, thereby preventing brittle shear failure. The fully wrapped FRP sheets also increased the debonding failure resistance of vertical FRP sheets, which further contributed to the system’s overall effectiveness. Also, the research findings indicate the effectiveness of using EB-FRP sheets in mitigating the fluctuation of the IDR cross height of CSWs.
  • Applying EB-FRP sheets to CSWs resulted in a slight increase in base shear and bending moment demand. Among the various strengthening schemes employed, it was observed that S3-CSW had the highest impact on increasing the shear force and bending moment demand in CSWs. This increase was found to be more pronounced in the CSWs located in eastern Canada, attributable to the relatively larger share of EB-FRP sheets in the overall stiffness of the reinforced walls compared with western Canada. However, the improvement in the shear and bending resistance of CSWs due to the EB-FRP sheets far outweighed the increase in demand.

Author Contributions

Conceptualization, A.A. and O.C.; methodology, A.A. and O.C.; Literature review, A.A.; investigation, A.A. and O.C.; resources, O.C.; writing—original draft preparation, A.A.; writing—review and editing, O.C.; supervision, O.C.; project administration, O.C.; funding acquisition, O.C. All authors have read and agreed to the published version of the manuscript.

Funding

O.C. is funded by the National Science and Engineering Council (NERC) of Canada and by the Fonds de Recheche du Quebec-Nature & Technologie (FRQ-NT).

Data Availability Statement

The data supporting the finding of this study are available within the article.

Conflicts of Interest

The authors declare no conflict of interest.

References

  1. Afefy, H.M. Seismic retrofitting of reinforced-concrete coupled shear walls: A review. Pract. Period. Struct. Des. Constr. 2020, 25, 03120001. [Google Scholar] [CrossRef]
  2. Paulay, T.; Santhakumar, A.R. Ductile behavior of coupled shear walls. J. Struct. Div. 1976, 102, 93–108. [Google Scholar] [CrossRef]
  3. Franchi, A.; Napoli, P.; Crespi, P.; Giordano, N.; Zucca, M. Unloading and reloading process for the earthquake damage repair of ancient Masonry columns: The case of the Basilica di Collemaggio. Int. J. Archit. Herit. 2022, 16, 1683–1698. [Google Scholar] [CrossRef]
  4. Elnady, M. Seismic Rehabilitation of RC Structural Walls. Ph.D. Thesis, McMaster University, Hamilton, ON, USA, 2008. [Google Scholar]
  5. Arabzadeh, H.; Galal, K. Effectiveness of FRP wraps for retrofitting of existing RC shear walls. In Proceedings of the 11th Canadian Conference on Earthquake Engineering, Victoria, BC, Canada, 21–24 July 2015; pp. 21–24. [Google Scholar]
  6. Arabzadeh, H.; Galal, K. Seismic collapse risk assessment and FRP retrofitting of RC coupled C-shaped core walls using the FEMA P695 methodology. J. Struct. Eng. 2017, 143, 04017096. [Google Scholar] [CrossRef]
  7. Sakr, M.A.; El-Khoriby, S.R.; Khalifa, T.M.; Nagib, M.T. Modeling of RC shear walls strengthened by FRP composites. Struct. Eng. Mech. 2017, 61, 407–417. [Google Scholar] [CrossRef]
  8. Layssi, H.; Cook, W.D.; Mitchell, D. Seismic response and CFRP retrofit of poorly detailed shear walls. J. Compos. Constr. 2012, 16, 332–339. [Google Scholar] [CrossRef]
  9. El-Sokkary, H.; Galal, K. Seismic behavior of RC shear walls strengthened with fiber-reinforced polymer. J. Compos. Constr. 2013, 17, 603–613. [Google Scholar] [CrossRef]
  10. Lavorato, D.; Bergami, A.V.; Fiorentino, G.; Fiore, A.; Santini, S.; Nuti, C. Experimental tests on existing RC beams strengthened in flexure and retrofitted for shear by C-FRP in presence of negative moments. Int. J. Adv. Struct. Eng. 2018, 10, 211–232. [Google Scholar] [CrossRef] [Green Version]
  11. Honarparast, S.; Chaallal, O. Non-linear time history analysis of reinforced concrete coupled shear walls: Comparison of old design, modern design and retrofitted with externally bonded CFRP composites. Eng. Struct. 2019, 185, 353–365. [Google Scholar] [CrossRef]
  12. Honarparast, S.; El-Saikaly, G.; Chaallal, O. Externally bonded carbon fiber–reinforced polymer composites for seismic retrofit of reinforced concrete coupling beams designed according to old codes. Adv. Struct. Eng. 2019, 22, 1412–1425. [Google Scholar] [CrossRef]
  13. El-Sokkary, H. Nonlinear behaviour of FRP-retrofitted RC coupled shear walls. In Structures; Elsevier: Amsterdam, The Netherlands, 2023; Volume 47, pp. 324–337. [Google Scholar]
  14. Fathalla, E.; Rajapakse, R.; Mihaylov, B.I. Modeling the shear behavior of deep beams strengthened with FRP sheets. Eng. Struct. 2022, 260, 114232. [Google Scholar] [CrossRef]
  15. Pecker, A. Advanced Earthquake Engineering Analysis; Springer Science & Business Media: Berlin, Germany, 2008. [Google Scholar]
  16. Wu, X. A Study of Nonlinear Time History Analysis vs. Current Codes Analysis Procedure of Comparing Linear Dynamic Demand with Nonlinear Static Capacity for Ordinary Standard Bridge. In Challenges and Advances in Sustainable Transportation Systems; ASCE: Reston, VA, USA, 2014; pp. 467–480. [Google Scholar]
  17. McNeice, D. Performance-Based Design of a 30-Storey Coupled wall Structure. Ph.D. Thesis, University of South Carolina, Columbia, SC, USA, 2004. [Google Scholar]
  18. National Building Code of Canada (NBCC). Institute for Research in Construction; National Research Council of Canada: Ottawa, ON, Canada, 1941. Available online: https://nrc-publications.canada.ca/eng/view/object/?id=cf6ad19a-6e99-438a-af92-3eee7561156b (accessed on 30 May 2023).
  19. National Building Code of Canada (NBCC). Institute for Research in Construction; National Research Council of Canada: Ottawa, ON, Canada, 2015. Available online: https://nrc.canada.ca/en/certifications-evaluations-standards/codes-canada/codes-canada-publications/national-building-code-canada-2015 (accessed on 30 May 2023).
  20. Boivin, Y.; Paultre, P. Seismic performance of a 12-storey ductile concrete shear wall system designed according to the 2005 National building code of Canada and the 2004 Canadian Standard Association standard A23.3. Can. J. Civ. Eng. 2010, 37, 1–16. [Google Scholar] [CrossRef] [Green Version]
  21. Ye, L.; Lu, X.; Zhao, S. Analysis on seismic damage of buildings in the Wenchuan earthquake. J. Build. Struct. 2008, 29, 1–9. [Google Scholar]
  22. Bruneau, M.; Reinhorn, A. Overview of the resilience concept. In Proceedings of the 8th US National Conference on Earthquake Engineering, San Francisco, CA, USA, 18–22 April 2006; Volume 2040, pp. 18–22. [Google Scholar]
  23. Adey, B.; Hajdin, R.; Brühwiler, E. Effect of common cause failures on indirect costs. J. Bridge Eng. 2004, 9, 200–208. [Google Scholar] [CrossRef]
  24. Brookshire, D.S.; Chang, S.E.; Cochrane, H.; Olson, R.A.; Rose, A.; Steenson, J. Direct and indirect economic losses from earthquake damage. Earthq. Spectra 1997, 13, 683–701. [Google Scholar] [CrossRef]
  25. Forcellini, D. A new methodology to assess indirect losses in bridges subjected to multiple hazards. Innov. Infrastruct. Solut. 2019, 4, 10. [Google Scholar] [CrossRef]
  26. de Oliveira, L.B.; de Azevedo, A.R.; Marvila, M.T.; Pereira, E.C.; Fediuk, R.; Vieira, C.M.F. Durability of geopolymers with industrial waste. Case Stud. Constr. Mater. 2022, 16, e00839. [Google Scholar] [CrossRef]
  27. Abbaszadeh, A.; Chaallal, O. Enhancing resilience and self-centering of existing RC coupled and single shear walls using EB-FRP: State-of-the-art review and research needs. J. Compos. Sci. 2022, 6, 301. [Google Scholar] [CrossRef]
  28. Chancellor, N.B.; Eatherton, M.R.; Roke, D.A.; Akbaş, T. Self-Centering seismic lateral force resisting systems: High performance structures for the city of tomorrow. Buildings 2014, 4, 520–548. [Google Scholar] [CrossRef] [Green Version]
  29. Bedriñana, L.A.; Tani, M.; Kono, S.; Nishiyama, M. Evaluation of the Seismic Performance of Unbonded Post-Tensioned Precast Concrete Walls with Internal and External Dampers. II: Design Criteria and Numerical Research. J. Struct. Eng. 2022, 148, 04022106. [Google Scholar] [CrossRef]
  30. Holden, T.; Restrepo, J.; Mander, J.B. Seismic performance of precast reinforced and prestressed concrete walls. J. Struct. Eng. 2003, 129, 286–296. [Google Scholar] [CrossRef]
  31. Marriott, D.; Pampanin, S.; Palermo, A. Quasi-static and pseudo-dynamic testing of unbonded post-tensioned rocking bridge piers with external replaceable dissipaters. Earthq. Eng. Struct. Dyn. 2009, 38, 331–354. [Google Scholar] [CrossRef]
  32. Lecce, L. Shape Memory Alloy Engineering: For Aerospace, Structural and Biomedical Applications; Elsevier: Amsterdam, The Netherlands, 2014. [Google Scholar]
  33. Wang, B.; Zhu, S.; Chen, K.; Huang, J. Development of superelastic SMA angles as seismic-resistant self-centering devices. Eng. Struct. 2020, 218, 110836. [Google Scholar] [CrossRef]
  34. Yang, C.-S.W.; DesRoches, R.; Leon, R.T. Design and analysis of braced frames with shape memory alloy and energy-absorbing hybrid devices. Eng. Struct. 2010, 32, 498–507. [Google Scholar] [CrossRef]
  35. Soares, M.M.; Palermo, D.; Cortes-Puentes, W.L. Modelling of mid-rise concrete shear walls reinforced with superelastic shape memory alloys: Nonlinear analysis. Eng. Struct. 2021, 247, 113049. [Google Scholar] [CrossRef]
  36. Qian, H.; Wang, X.; Li, Z.; Zhang, Y. Experimental study on re-centering behavior and energy dissipation capacity of prefabricated concrete frame joints with shape memory alloy bars and engineered cementitious composites. Eng. Struct. 2023, 277, 115394. [Google Scholar] [CrossRef]
  37. Noureldin, M.; Memon, S.A.; Gharagoz, M.; Kim, J. Performance-based seismic retrofit of RC structures using concentric braced frames equipped with friction dampers and disc springs. Eng. Struct. 2021, 243, 112555. [Google Scholar] [CrossRef]
  38. Naeem, A.; Kim, J. Seismic performance evaluation of a spring viscous damper cable system. Eng. Struct. 2018, 176, 455–467. [Google Scholar] [CrossRef]
  39. Shen, J.; Huang, Z.; Song, X.; Yao, Y. Deformation performance analysis of concrete shear wall with CFRP grids based on the modified uniaxial shear-flexural model. J. Build. Eng. 2022, 54, 104621. [Google Scholar] [CrossRef]
  40. Song, X.; Huang, Z.; Shen, J.; Yao, Y. Experimental study on cyclic behavior of hybrid CFRP grids-steel shear walls. In Structures; Elsevier: Amsterdam, The Netherlands, 2020; Volume 28, pp. 496–511. [Google Scholar]
  41. Zhao, Q.; Zhao, J.; Dang, J.-T.; Chen, J.-W.; Shen, F.-Q. Experimental investigation of shear walls using carbon fiber reinforced polymer bars under cyclic lateral loading. Eng. Struct. 2019, 191, 82–91. [Google Scholar] [CrossRef]
  42. Sadeghian, A. Seismic Deformations of Taller Reinforced Concrete Shear Walls Located in Eastern Canada; Ecole Polytechnique: Montreal, QC, Canada, 2018. [Google Scholar]
  43. National Building Code of Canada (NBCC). Institute for Research in Construction; National Research Council of Canada: Ottawa, ON, Canada, 2020. Available online: https://nrc-publications.canada.ca/eng/view/object/?id=515340b5-f4e0-4798-be69-692e4ec423e8 (accessed on 30 May 2023).
  44. CAN-A23.3-19; Design of Concrete Structures for Buildings. National Standard of Canada: Rexdale, ON, Canada, 2019.
  45. Canada, C.A.O.; Association, C.S. Concrete Design Handbook, 4th ed.; Cement Association of Canada: Ottawa, ON, Canada, 2016. [Google Scholar]
  46. Analysis Reference Manual for SAP2000 Ultimate v. 21.0.2; CSi: Berkeley, CA, USA, 2017.
  47. Honarparast, S.; Chaallal, O. Seismic performance of coupled shear walls designed according to old and new codes and retrofitted with Eb-CFRP composites. J. Earthq. Eng. 2022, 26, 1875–1898. [Google Scholar] [CrossRef]
  48. Manohar, S.; Madhekar, S. Seismic design of RC buildings. In Springer Transactions in Civil and Environmental Engineering; Springer: Berlin/Heidelberg, Germany, 2015. [Google Scholar]
  49. Mohammadi, H.; Esfahani, M.; Riyazi, M. Behavior of coupling beams strengthened with carbon fiber reinforced polymer sheets. Int. J. Eng. 2007, 20, 49–58. [Google Scholar]
  50. Committee, A. Guide for the Design and Construction of Externally Bonded FRP Systems for Strengthening Concrete Structures (ACI 440.2 R-17); American Concrete Institute: Farmington Hills, MI, USA, 2017. [Google Scholar]
  51. Teng, J.; Chen, J.-F.; Smith, S.T.; Lam, L. FRP: Strengthened RC Structures; Wiley: Hoboken, NJ, USA, 2002. [Google Scholar]
  52. NRCC. Structural Commentaries (User’s Guide—NBC 2015: Part 4 of Division B); NRCC: Ottawa, ON, Canada, 2015. [Google Scholar]
  53. Carr, A. RUAUMOKO, Computer Program Library; Department of Civil Engineering, University of Canterbury: Christchurch, New Zealand, 2004. [Google Scholar]
  54. Harries, K.A. Seismic Design and Retrofit of Coupled Walls Using Structural Steel. Ph.D. Thesis, McGill University, Montreal, QC, Canada, 1995. [Google Scholar]
  55. Smith, B.S.; Coull, A. Tall Building Structures: Analysis and Design; Wiley: Hoboken, NJ, USA, 1991. [Google Scholar]
  56. Giberson, M.F. Two nonlinear beams with definitions of ductility. J. Struct. Div. 1969, 95, 137–157. [Google Scholar] [CrossRef]
  57. Jury, R.D. Seismic Load Demands on Columns of Reinforced Concrete Multistorey Frames. Master’s Thesis, University of Canterbury, Christchurch, New Zealand, 1978. [Google Scholar]
  58. Boivin, Y. Assessment of the Seismic Performance of a 12-Storey Ductile Concrete Shear Wall System Designed according to the NBCC 2005 and the CSA A23. 3 2004 Standard; Université de Sherbrooke: Sherbrooke, QC, Canada, 2006. [Google Scholar]
  59. Carr, A.J. Ruaumoko Manual, Volume 2: User Manual for the 2-Dimensional Version Ruaumoko2D; University of Canterbury: Christchurch, New Zealand, 2008. [Google Scholar]
  60. Imbsen Software Systems. XTRACT—Cross-Sectional X sTRuctural Analysis of ComponenTs v2.6.0. Imbsen Software Systems. 2004.
  61. Mander, J.B.; Priestley, M.J.; Park, R. Theoretical stress-strain model for confined concrete. J. Struct. Eng. 1988, 114, 1804–1826. [Google Scholar] [CrossRef] [Green Version]
  62. Lam, L.; Teng, J.G. Design-oriented stress–strain model for FRP-confined concrete. Constr. Build. Mater. 2003, 17, 471–489. [Google Scholar] [CrossRef]
  63. Zhijun, L. Seismic Vulnerability of RC Frame and Shear Wall Structures in Singapore. Ph.D. Thesis, National University of Singapore, Singapore, 2006. [Google Scholar]
  64. Dong, P. Effect of Varying Hysteresis Models and Damage Models on Damage Assessment of r/c Structures under Standard Design Level Earthquakes Obtained Using a New Scaling Method. Ph.D. Thesis, University of Canterbury, Christchurch, New Zealand, 2003. [Google Scholar]
  65. Choi, K.-S.; Kim, H.-J. Strength demand of hysteretic energy dissipating devices alternative to coupling beams in high-rise buildings. Int. J. High-Rise Build. 2014, 3, 107–120. [Google Scholar]
  66. Vecchio, F.J.; Collins, M.P. The modified compression-field theory for reinforced concrete elements subjected to shear. ACI J. 1986, 83, 219–231. [Google Scholar]
  67. Petrini, L.; Maggi, C.; Priestley, M.N.; Calvi, G.M. Experimental verification of viscous damping modeling for inelastic time history analyzes. J. Earthq. Eng. 2008, 12, 125–145. [Google Scholar] [CrossRef]
  68. Hall, J.F. Problems encountered from the use (or misuse) of Rayleigh damping. Earthq. Eng. Struct. Dyn. 2006, 35, 525–545. [Google Scholar] [CrossRef]
  69. Otani, S. SAKE: A computer program for inelastic response of R/C frames to earthquakes. Civ. Eng. Stud. SRS-413 1974. [Google Scholar]
  70. Saiidi, M.; Sozen, M.A. Simple and complex models for nonlinear seismic response of reinforced concrete structures. Civ. Eng. Stud. SRS-465 1979. [Google Scholar]
  71. Benazza, T. Non-Linear Behavior of Coupled Shear Wall Systems under Seismic Events; University of Quebec Montreal: Montreal, QC, Canada, 2012. [Google Scholar]
  72. Adams, J.; Allen, T.; Halchuk, S.; Kolaj, M. Canada’s 6th Generation Seismic Hazard Model, as Prepared for the 2020 National Building Code of Canada. 12th Can. Conf. Earthq. Eng. 2019. [Google Scholar]
  73. McGuire, R.K. Probabilistic seismic hazard analysis and design earthquakes: Closing the loop. Bull. Seismol. Soc. Am. 1995, 85, 1275–1284. [Google Scholar] [CrossRef]
  74. Tremblay, R.; Atkinson, G.M. Comparative study of the inelastic seismic demand of eastern and western Canadian sites. Earthq. Spectra 2001, 17, 333–358. [Google Scholar] [CrossRef]
  75. Atkinson, G.M. The high-frequency shape of the source spectrum for earthquakes in eastern and western Canada. Bull. Seismol. Soc. Am. 1996, 86, 106–112. [Google Scholar] [CrossRef]
  76. Adams, J.; Atkinson, G. Development of seismic hazard maps for the proposed 2005 edition of the National Building Code of Canada. Can. J. Civ. Eng. 2003, 30, 255–271. [Google Scholar] [CrossRef] [Green Version]
  77. Atkinson, G.M. Earthquake time histories compatible with the 2005 National building code of Canada uniform hazard spectrum. Can. J. Civ. Eng. 2009, 36, 991–1000. [Google Scholar] [CrossRef]
  78. Tremblay, R.; Atkinson, G.M.; Bouaanani, N.; Daneshvar, P.; Léger, P.; Koboevic, S. Selection and scaling of ground motion time histories for seismic analysis using NBCC 2015. In Proceedings of the 11th Canadian Conference on Earthquake Engineering, Victoria, BC, Canada, 21–24 July 2015; Volume 99060. [Google Scholar]
  79. ASCE/SEI 7-22; Minimum Design Loads and Associated Criteria for Buildingsand Other Structures. ASCE: Reston, VA, USA, 2022.
  80. Adebar, P.; Dezhdar, E.; Yathon, J. Accounting for higher mode shear forces in concrete wall buildings: 2014 CSA A23.3. In Proceedings of the The 11th Canadian Conference on Earthquake Engineering, Victoria, BC, Canada, 21–24 July 2015. [Google Scholar]
  81. White, T.; Adebar, P. Estimating rotational demands in high-rise concrete wall buildings. In Proceedings of the 13th World Conference on Earthquake Engineering, Victoria, BC, Canada, 1–6 August 2004; pp. 1–6. [Google Scholar]
  82. El-Sokkary, H.; Galal, K.; Ghorbanirenani, I.; Léger, P.; Tremblay, R. Shake table tests on FRP-rehabilitated RC shear walls. J. Compos. Constr. 2013, 17, 79–90. [Google Scholar] [CrossRef]
Figure 1. Plan view and 2D layout of CSWs.
Jcs 07 00317 g001
Figure 2. Reinforcement layout in (a) wall piers, and (b) CBs.
Jcs 07 00317 g002
Figure 3. Strengthening schemes: (a) wall piers in S1-CSW; (b) wall piers in S2-CSW; (c) wall piers in S3-CSW; (d) FRP wrapping of wall piers and coupling beams in all schemes; and (e) coupling beams’ flexural strengthening in S3-CSW.
Jcs 07 00317 g003
Figure 4. Member modeling and node numbering of 20-story and 15-story CSWs in RUAUMOKO.
Jcs 07 00317 g004
Figure 5. Rayleigh damping model.
Jcs 07 00317 g005
Figure 6. Hysteresis rules used in RUAUMOKO: (a) modified bilinear Takeda model; and (b) Q-HYST model.
Jcs 07 00317 g006
Figure 7. Comparison of seismic hazard values of 2% probability in 50 years in site class C in Vancouver and Montreal.
Jcs 07 00317 g007
Figure 8. Response spectra for scaled ground motions: (a) Vancouver; and (b) Montreal.
Jcs 07 00317 g008
Figure 9. Inter-story drift ratio domains of 20-story CSWs in Vancouver: (a) original CSW (C-CSW); (b) first strengthening configuration (S1-CSW); (c) second strengthening configuration (S2-CSW); and (d) third strengthening configuration (S3-CSW).
Jcs 07 00317 g009
Figure 10. Maximum residual inter-story drift ratio in a 20-story CSW in Vancouver: (a) the RIDR distribution in the C-CSW subjected to all ground motions; and (b) reduction of the RIDR in the C-CSW using 3 strengthening configurations.
Jcs 07 00317 g010
Figure 11. Inter-story drift ratio domains of a 15-story CSW in Vancouver: (a) original CSW (C-CSW); (b) first strengthening configuration (S1-CSW); (c) second strengthening configuration (S2-CSW); and (d) third strengthening configuration (S3-CSW).
Jcs 07 00317 g011
Figure 12. Maximum residual inter-story drift ratio in a 15-story CSW in Vancouver: (a) the RIDR distribution in the C-CSW subjected to all ground motions; and (b) reduction of the RIDR in the C-CSW using 3 strengthening configurations.
Jcs 07 00317 g012
Figure 13. Inter-story drift ratio domains of a 20-story CSW in Montreal: (a) original CSW (C-CSW); (b) first strengthening configuration (S1-CSW); (c) second strengthening configuration (S2-CSW); and (d) third strengthening configuration (S3-CSW).
Jcs 07 00317 g013
Figure 14. Maximum residual inter-story drift ratio in a 20-story CSW in Montreal: (a) the RIDR distribution in the C-CSW subjected to all ground motions; and (b) reduction of RIDR in the C-CSW using 3 strengthening configurations.
Jcs 07 00317 g014
Figure 15. Inter-story drift ratio domains of a 15-story CSW in Montreal: (a) original CSW (C-CSW); (b) first strengthening configuration (S1-CSW); (c) second strengthening configuration (S2-CSW); and (d) third strengthening configuration (S3-CSW).
Jcs 07 00317 g015
Figure 16. Maximum residual inter-story drift ratio in a 15-story CSW in Montreal: (a) the RIDR distribution in the C-CSW subjected to all ground motions; and (b) reduction of the RIDR in the C-CSW using 3 strengthening configurations.
Jcs 07 00317 g016
Figure 17. Mean coupling beam rotation in: (a) a 20-story CSW in Vancouver; and (b) a 15-story CSW in Vancouver.
Jcs 07 00317 g017
Figure 18. Mean coupling beam rotation in: (a) a 20-story CSW in Montreal; and (b) a 15-story CSW in Montreal.
Jcs 07 00317 g018
Figure 19. Normalized shear demand in CSWs: (a) a 20-story located in Vancouver; (b) a 15-story located in Vancouver; (c) a 20-story located in Montreal; and (d) a 15-story located in Montreal.
Jcs 07 00317 g019
Figure 20. Normalized bending moment demand in CSWs: (a) a 20-story located in Vancouver; (b) a 15-story located in Vancouver; (c) a 20-story located in Montreal; and (d) a 15-story located in Montreal.
Jcs 07 00317 g020
Table 1. Ductility-related factors ( R d ) and overstrength-based factors ( R o ).
Type of Ductile WallForce Modification Factor
Coupled wall R d = 4 R o = 1.7
Partially coupled wall R d = 3.5 R o = 1.7
Shear wall R d = 3.5 R o = 1.6
Table 2. Section effective properties for linear dynamic analysis suggested by CSA A23.3-19.
ElementPropertyEffective Property
Diagonally reinforced CBMoment of inertia I e = 0.25 I g
Shear area A v e = 0.45 A g
WallFlexural stiffness E I e = α w E I g
Axial stiffness E A x e = α w E A g
Table 3. Reinforcement details of wall piers.
W (i)
(mm)
W (ii)
(mm)
W (iii)
(mm)
W (iv)
(mm)
Section
Dimension
(mm)
West20-story15M @20010M @2008M 30 in PH region
8M 25 out of PH region
10M @1508250 × 400
15-story10M @20010M @2504M 25 in PH region
4M 20 out of PH region
10M @2008250 × 400
East20-story15M @20010M @2506M 25 in PH region
6M 20 out of PH region
10M @1508250 × 400
15-story10M @20010M @2504M 20 in PH region
4M 15 out of PH region
10M @2008250 × 400
Table 4. Reinforcement details of coupling beams.
B (i)
(mm)
B (ii)
(mm)
B (iii)
(mm)
B (iv)
(mm)
B (v)
(mm)
B (vi)
(mm)
Section
Dimension
(mm)
West20-story10M
@250
1500 mm stories 1–7
1300 mm stories 8–16
850 mm stories 17–20
10M
@80
25M stories 1–7
20M stories 8–16
15M stories 17–20
10M
@100
10M
@200
750 × 400
15-story10M
@250
1300 mm stories 1–5
850 mm stories 6–10
700 mm stories 11–15
10M
@100
20M stories 1–5
15M stories 6–10
10M stories 11–15
10M
@150
10M
@250
750 × 400
East20-story10M
@250
1100 mm stories 1–5
950 mm stories 6–13
700 mm stories 14–20
10M
@100
25M stories 1–5
20M stories 6–3
15M stories 14–20
10M
@100
10M
@200
750 × 400
15-story10M
@250
900 mm stories 1–4
750 mm stories 5–10
700 mm stories 11–15
10M
@120
20M stories 1–4
15M stories 5–10
10M stories 11–15
10M
@150
10M
@250
750 × 400
Table 5. Manufacturer’s mechanical properties of CFRP sheets.
Ultimate tensile strength (MPa)1355
Tensile modulus, W f r p (MPa)115,700
Elongation at break (%)0.95
Thickness per ply (mm)1.3
Table 6. Selected ground motions’ description (Vancouver).
ScenarioRec. No.MR
(km)
PGA
(g)
Duration
(s)
Period Range
(s)
Event Type
1West 16.58.80.47549.300.2–0.8Crustal
West 26.511.20.48349.30
West 36.510.80.50349.30
West 46.512.30.49753.63
West 56.514.60.55953.63
2West 67.516.40.391102.020.3–1.5In-slab
West 77.518.10.430102.02
West 87.521.60.351102.02
West 97.535.70.28993.39
West 107.548.40.42393.39
3West 119112.40.137309.421–4Cascadia
subduction
West 129112.40.132309.42
West 139156.70.173309.42
West 149156.70.146309.42
West 1592000.167309.42
Table 7. Selected ground motions’ description (Montreal).
ScenarioRec. No.MR
(km)
PGA
(g)
Duration
(s)
Period Range
(s)
Event Type
1East 1610.70.32243.590.2–1Crustal
East 2612.80.64543.59
East 3620.80.42343.59
East 4621.60.45147.53
East 5626.30.30147.53
2East 6713.80.47851.120.5–2.42Crustal
East 7720.60.41051.12
East 8750.30.30851.12
East 9762.60.33157.35
East 10795.50.24857.35
East 11794.20.29957.35
Table 8. Base shear demand in all specimens.
Base Shear Demand (kN)
S3-CSWS2-CSWS1-CSWC-CSW
Vancouver20-story112610811048969
15-story736691670603
Montreal20-story115811101077963
15-story633606588494
Table 9. Base bending moment demand in all specimens.
Base Bending Moment (kN.m)
S3-CSWS2-CSWS1-CSWC-CSW
Vancouver20-story5346518149724843
15-story3729356434543212
Montreal20-story2806275426512486
15-story2134204619581804
Disclaimer/Publisher’s Note: The statements, opinions and data contained in all publications are solely those of the individual author(s) and contributor(s) and not of MDPI and/or the editor(s). MDPI and/or the editor(s) disclaim responsibility for any injury to people or property resulting from any ideas, methods, instructions or products referred to in the content.