Abstract
In this research, the numerical calculation for elastic and nonlinear strains of Fe metal and FeC alloy under different pressures has been performed by the statistical moment method SMM with Mie–-Lennard–Jones potential (MLJ) and Embedded-Jones potential Atom Method (EAM). The analysis reveals that an enhancement in the concentration (cC) from 0 to 5% causes a decrement in the Young’s modulus (E) at room temperature (T = 300 K) for FeC. These calculated results are consistent with the experimental results. In addition, the obtained stress-strain curves for Fe are in perfect agreement with the experimental curves. Besides, increasing the cC for a continuous strain decreases the stress, showing that adding C to Fe to form FeC steel will increase strength and hardness, but decrease elasticity and hardness. The results obtained will be very useful not only for experimental studies but also for theoretical studies of metals and their interstitial alloys.
1. Introduction
Today with the rapid development of science and technology, the role of computer science, combined with research methods, is crucial to the success of new materials research. Among the research methods, the Molecular Dynamics Simulation (MDS) method plays the leading role because of its simplicity. This research method has been used since the 1950s, but it was only developed in 1980 based on the first IBM computer system, and the theoretical models were perfected up to now thanks to the development of supercomputing systems combined with new innovative algorithms, to globally optimize the physical-chemical properties of materials, based on the theoretical models of solids [1]. Various studies based on MDS have been reported in the literature [2,3], and scientists are always interested in issues such as the stability of materials, or whether the selection of the proposed parameters in the model is consistent with the experimental data. Furthermore, the sensitive dependence of the model on the initial conditions, which can significantly affect the results, needs to be considered [4]. Scientists have successfully studied the phase transformation, electronic structure, and crystallization of Ni [5], Fe [6,7,8,9,10,11], Ni [12,13,14], Al [15,16], Cu [17], and alloy [18,19], NiFe nanoparticles [20,21], NiCu [22,23,24], AlNi nanoparticles [25], AgAu alloy [26], AuCu bulk [27,28], NiAu alloy [29], polymer [30], Fe2O3 [31,32], and FeCoNi [33] using experimental and MDS methods. It is well known that metals and their interstitial alloys have found various applications in a wide variety of technological and industrial areas. Special interest is directed to the assessment of the elastic properties of metals and their interstitial alloys determined experimentally, analytically, and numerically in various conditions [34,35,36,37,38,39,40]. The experimental stress-strain curves obtained for Fe were reported across different studies [19,38,39,40]. From this point of view, there are many studies concerning the dependence of the elastic properties of materials on factors such as pressure (P) and temperature (T). There are several theoretical methods, based on various mathematical models, used to investigate the thermodynamic and mechanical characteristics of materials in the literature [41,42,43].
For example, the Full-Potential linear response Linear-Muffin-Tin Orbital (FP-LMTO) method has been used to investigate the elastic deformation of a single metal Fe, where the elastic moduli of body-centered cubic (BCC) Fe under temperature and pressure were investigated by the First-Principles Quasiharmonic Lattice Dynamics (FP-QLD) method [8].
The elastic deformation of Fe and its alloys were evaluated in Resonance Ultrasound Spectroscopy (RUS) experiments over a range form 3 K to 500 K [9], using pulse-echo technique experiments in the range of components from zero to 10 at. pct. Elastic moduli E and G nonlinearly depend on temperature for alloys as well as Fe in the range from 77 K to 473 K [10].
In recent studies, scientists have successfully investigated the elastic deformation under pressure in BCC and face-centered cubic (FCC) interstitial alloys using the Statistical Moment Method (SMM) [36,37,44,45]. In this study, the SMM was applied to perform numerical calculations for nonlinear and elastic deformations of BCC-Fe and BCC-FeC under pressure.
2. Theoretical Background
In the approximation of three coordination spheres, the cohesive energy and the alloy parameters for the interstitial atom B (in the face centers of the cubic unit cell), the main metal atom A1 (in the body center of the cubic unit cell), and the main metal atom A2 (in the vertices of the cubic unit cell) in the BCC interstitial alloy AB can be expressed as [46,47]:
where corresponds to the interaction potential between the A and the B atoms. , and represents the Nearest Neighbor Distance (NND) between the atom X (X = A, A1, A2, B) and other atoms at T and T = 0 K, respectively. is calculated from the minimum condition of the cohesive energy and shows the displacement of atom X from equilibrium position at T, , m = 1, 2, 3, 4, α, β = represents the radii of the ith coordination sphere (i = 1, 2, 3), ni shows the number of particles on this sphere, are the corresponding quantities in the BCC pure metal A in the approximation of two coordination spheres [46].
The equations of state for the conditions (at T and P, and at 0 K and P, respectively) can be expressed as [46]:
Equation (17) allows us to determine the nearest neighbor distance (NND) , the parameters at P and 0 K, and the displacement of atom X from the equilibrium position at T and P [46]. This is the reason why we can calculate the NND and the mean NND between two atoms A in AB alloy at T and P, based on the following formulas [47]:
For the condition cA << cB, the Helmholtz Free Energy (HFE) of BCC interstitial alloy AB is defined by the following expressions [47]:
where gives the HFE of BCC materials consisting only atoms X and is the configurational entropy of the alloy AB.
The Young modulus, the bulk modulus, the shearing modulus and elastic constants for the alloy AB have the form [47]:
where is the strain of the alloy AB. The Poisson ratio of the alloy AB can be expressed as [47]:
where correspond to the Poisson ratios of materials A and B, respectively.
The NND in alloy at P and 0 K, at P and T after deformation, can be expressed as [44]:
The HFE of AB alloy after deformation can be expressed as [44]:
where is the HFE of materials consisting of only A atoms with the structure bcc after deformation.
The stress dependence on strain in non-linear deformation can be expressed as [44]:
where σoAB and αAB are constants depending on the nature of the alloy.
The density of deformation energy of alloy AB is defined by the following relation [44]:
or
Let us consider the relation between the density of deformation energy and the strain as follows [44]:
fAB(ε) = CAB·σAB·ε
The maximum stress σABmax and the maximum real stress σ1Abmax are defined by [44]:
CAB is calculated from the stress σ0.2AB in the alloy, which is determined experimentally [48] by the following expression [44]:
The limit of elastic deformation of the alloy is defined by the following expression [44]:
3. Numerical Calculations and Discussions for Fe and FeC
For FeC, we apply the Mie–Lennard–Jones (MLJ) potential [49]:
where D represents the depth of potential well corresponding to the equilibrium distance r0, m and n, is obtained empirically. Thus, the potential parameters for the Fe-C interaction are described by the following expression [50]:
mFe-C and nFe-C are found by fitting the theoretical result with the experimental data for the E of FeC0.2% interstitial alloy at T = 300 K. The obtained MLJ potential parameters for different interactions are listed in Table 1.

Table 1.
The MLJ potential parameters for interactions of Fe-Fe, C-C and Fe-C.
First, we assume the limit case when cC. Figure 1 illustrates the impact of the T on the E parameter at P = 0 for various methods and experimental studies. Note that the experimental samples in studies published in ref. [36,37,47] are monocrystalline ones, and the SMM calculations are applied to polycrystalline samples. Therefore, we use the Voigt–Reuss–Hill (VRH) conversion rule [49] as follows, based on the following expressions:
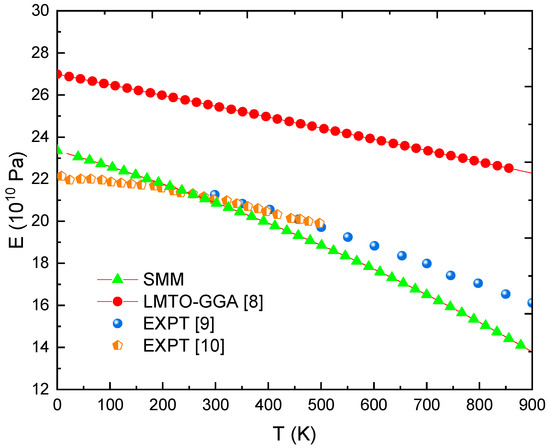
Figure 1.
E(T) for Fe at P = 0 was obtained using the SMM, LMTO-GGA [8], and from EXPT [9,10].
In this equation, the symbol * represents the elastic quantities of monocrystalline material. As clearly noticed in Figure 1, a significant decrease in the E value occurred as the T increased due to an increase in the NND and a decrease in the cohesive energy. The curve E(T) obtained from the LMTO-GGA [8] describes very well the relationship E-T, qualitatively. However, the estimated values of E are very high compared to the measured values [9,10]. In contrast, all errors between the SMM calculations and the experimental data [9,10] in the 0 K to 800 K range are below 10%. However, it can be concluded that the rate of decrease of the E value relative to the T value calculated by the SMM is faster than the normal one. At T = 900 K, the value of E determined using the SMM is up to 14.4% smaller than the experimental data [10]. Since the E values obtained using the SMM are consistent with the experiments (EXPT) and other calculations, the obtained results of the G, K, C11, C12, and C44 quantities are also in good agreement.
K, G, C11, C12 calculations for single Fe metal at different T and p values are illustrated in Table 2 in comparison with other theoretical and experimental studies.

Table 2.
C11(T,P), C12(T,P), K(T,P) and G(P) for Fe.
The results displayed in Figure 1 show that Fe deforms nonlinearly over the temperature (T) range of T = 3 K to T = 900 K and the K, G, C11, and C12 values are determined at T = 250 K, 300 K (Table 2). The results obtained at T = 250 K, 300 K show that there are differences in the values obtained for K, G, C11, and C12 compared with other research methods. Finally, these deviation values are very small compared with the results obtained by the experimental method [52,53,54], and the numerical calculation method [8], so they are acceptable.
In Figure 2 and Table 3, the dependence of E on the concentration (cC) at different T and p values is shown for FeC. An increment in the cC leads to a considerable decrease in the E parameter due to the strong deformation of the crystal lattice. For example, at T = 300 K, E decreases from 20.79 × 10¹⁰ to 18.67 × 10¹⁰ Pa with increases of cC from 0 to 5%. This result is in very good agreement with experimental studies [11] when all errors are below 2%. When T increases, the curve E(cC) for FeC has a smaller slope. The size correlation between interstices in crystalline lattice and the radii of interstitial atoms determines the lattice deformation. It can be concluded that a higher T value determines a stronger atomic vibration, wider interstice, and less lattice deformation. In fact, vacancies are formulated at high T values and interstitial carbon atoms can occupy positions in these vacancies.
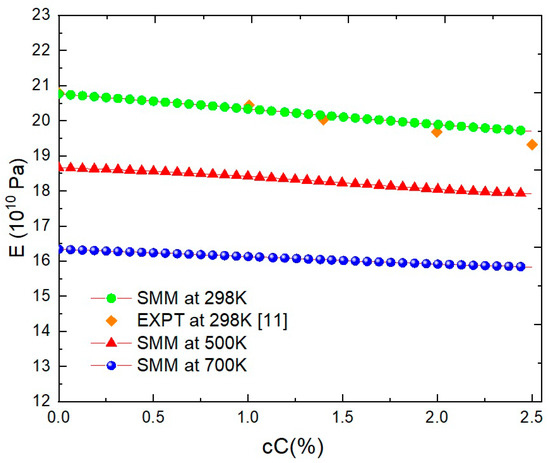
Figure 2.
E(cC) for FeC at P = 0, T = 298 K, 500 K, 700 K obtained using the SMM and at P = 0, T = 298 K from EXPT [11].

Table 3.
E(cC,P) [1010 Pa] for FeC at T = 300 K determined using the SMM.
Figure 3 and Figure 4, respectively show the relationship between E and T for FeC0.2% and FeC0.4% calculated by SMM with the MLJ potential proposed in this paper and with the Embedded-Atom Method (EAM) potential [47] and from experimental data [18]. Clearly, using the parameters of MLJ potential in Table 1 requires extremely low calculation cost but gives equally reliable results as the EAM potential [47]. Moreover, in the range of 73 to 700 K, all deviations between the SMM calculations and experiments [18] are below 5%. Especially in the range of 294 to 533 K, all errors are below 2%. At T = 866 K, the error only is 13%.
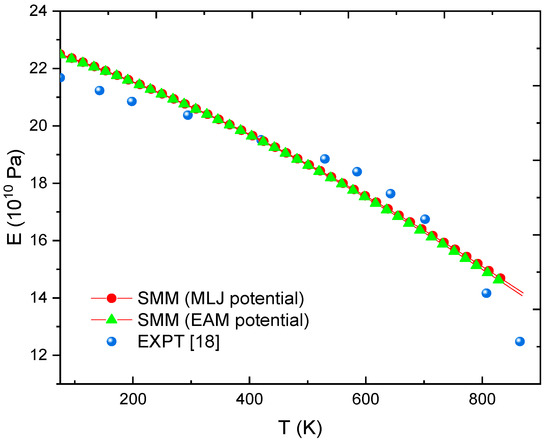
Figure 3.
E(T) at P = 0 determined using the SMM with MLJ potential, SMM with EAM potential [47] and from EXPT [18] with FeC0.2% alloy.
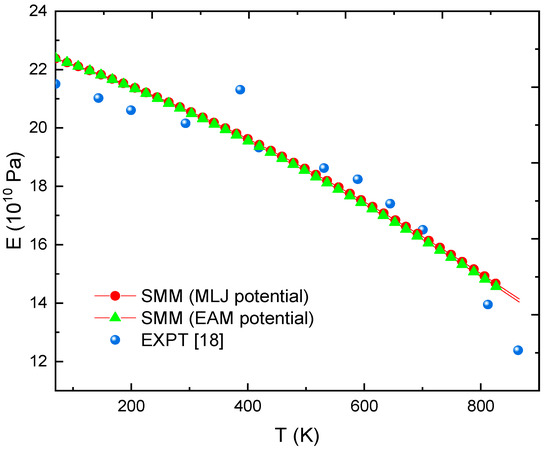
Figure 4.
E(T) at P = 0 calculated by SMM with MLJ potential, SMM with EAM potential [47] and from EXPT [18] with FeC0.4% alloy.
To determine the non-linear deformation of FeC, it is first necessary to consider the intensity of the deformation energy Figure 5 shows the dependence of on the deformation in the case. There is one maximum point (εp, fmax) in the graph f(ε). An increase in the T causes a decrease in both and fmax.
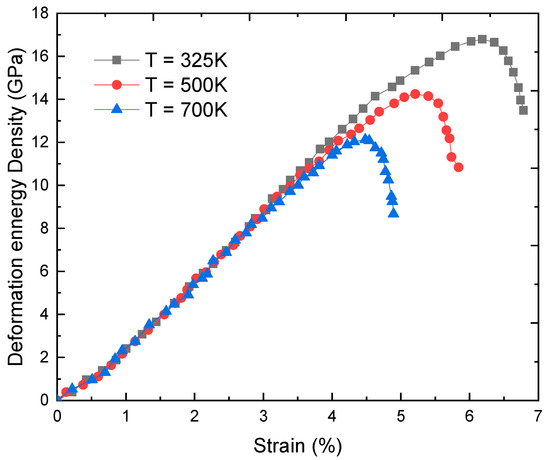
Figure 5.
Deformation and strain at T = 325, 500, and 700 K obtained using the SMM with Fe metal.
Concretely, at T = 325 K we have = 6.2% corresponding to fmax = 16.9 GPa; at T = 500 K we have = 5.2% corresponding to fmax = 14.33 GPa, and at T = 700 K we have = 4.4% corresponding to fmax = 12.16 GPa. Knowing and fmax, the maximum value of real stress can be determined when the non-linear deformation occurs. Note that in our calculation steps, it is proposed that varies slowly with T and cC of interstitial atoms, and (cC, T) ≈ (cC, 300 K), this is one of the reasons for deviations between SMM calculations and experiments. Numerical calculations will certainly have higher accuracy if experimental data of in different conditions are available.
Table 4 indicates the elastic deformation limit for single Fe metal and FeC interstitial alloy at T = 300 K, P = 0, and the maximum value of real stress.

Table 4.
E (cC, P) [1010 Pa] for FeC at T = 300 K determined using the SMM.
Figure 6 shows the stress-strain relationship used by the SMM calculations. The deformation process of FeC can be considered as two stages.
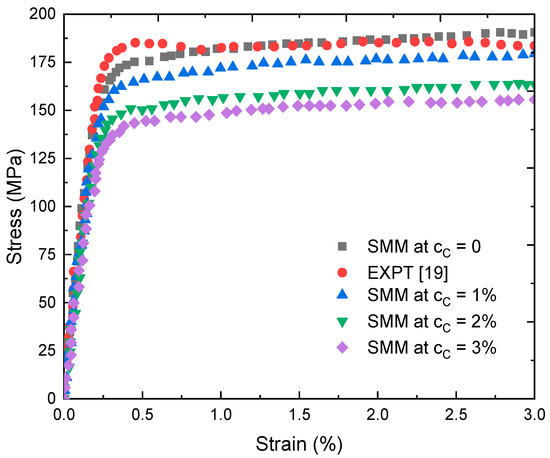
Figure 6.
Stress-strain relationship at T = 325 K obtained using the SMM with FeC alloy and from EXPT [19] with Fe.
Initially, the dependence is linear when the strain is within the range ( < 0.5%). In this case, FeC is in the elastic deformation stage, which is still a reversible process. However, when FeC is in the non-linear deformation stage, the dependence is defined as a complex curve. It is known that the non-linear deformation stage is an irreversible process. In the limit case, the stress-strain curve obtained for single metal Fe in the present study is quite consistent with the experimental curve reported in [19]. For a constant strain an increase of cC of interstitial atoms gives a rise to a decrease in stress . Thus, adding C to Fe to form the steel will cause an enhancement in the strength and hardness, but a decrement in the elasticity and toughness.
These results are in full agreement with the results in the joints of composites [55,56]. The results demonstrated in Figure 5 and Figure 6 give good results about applying SMM to study processes of non-linear deformation of metals and alloys. In order to enhance the reliability of calculated results, it is also necessary to consider some important factors such as the rate of deformation, the annealing time, etc. [39] in representing the stress—strain curve.
Based on the obtained results, there is a good agreement between our findings and previous findings reported in theoretical and experimental studies.
4. Conclusions
In this research, the elastic and non-linear deformations quantities of alloy FeC were calculated numerically from the obtained theoretical results by applying the MLJ potential parameters for interactions Fe-Fe, C-C and Fe-C. The obtained results of elastic moduli and constants for main metal Fe were in good accordance with the results derived in other theoretical and experimental studies. At T = 300 K for the FeC interstitial alloy, the results of the analysis revealed that an increase in the cC from 0 to 5% gives rise to a decrease in the E from 20.79 × 10¹⁰ to 18.67 × 10¹⁰ Pa. The dependence of E on T obtained for FeC alloy with cC = 0.2 and 0.4% (obtained using the SMM with MLJ potential and EAM potential) and the stress-strain curve obtained for single Fe were quite consistent with the experimental studies. For a constant strain, increasing cC led to a decrease in stress. From the results obtained, it can be also concluded that adding C to Fe to form the steel will cause an enhancement in the strength and hardness, but a decrement in the elasticity and toughness. The results obtained by using the SMM in this research are expected to be useful for not only experimental but also theoretical studies on metals and their interstitial alloys.
Author Contributions
N.Q.H.: Conceptualization, methodology, investigation, and validation. D.N.T.: Conceptualization, methodology, investigation, validation, writing—original draft-review and editing. N.C.C., B.D.T. and N.D.H.: Formal analysis, resources, software, and validation. V.C.L.: Writing—original draft, and formal analysis. U.S.: Writing—original draft, and formal analysis. Ş.Ţ.: Writing—original draft and editing, funding acquisition, and project administration. All authors have read and agreed to the published version of the manuscript.
Funding
This research received no external funding.
Data Availability Statement
The data that support the findings of this study are available from the corresponding author upon reasonable request.
Conflicts of Interest
The authors declare no conflict of interest.
References
- Satoh, A. Introduction to Practice of Molecular Simulation; Elsevier Inc.: Burlington, MA, USA, 2011. [Google Scholar]
- Mostowski, J.; Trippenbach, M.; Van, C.L. Phase Space Approach to Two-electron Atom Ionisation. In Proceedings of the Fourth International Conference on Multiphoton Processes, Boulder, Colorado, 13–17 July 1987. [Google Scholar]
- Trippenbach, M. Center of Theoretical Physics. Ph.D. Thesis, Polish Academy of Science, Warsaw, Poland, 1987; pp. 89–121. (In Polish). [Google Scholar]
- Long, V.C.; Goldstein, P. Concise Course in Nonlinear Partial Differential Equations; University of Zielona Góra Press: Zielona Góra, Poland, 2008; pp. 110–116. [Google Scholar]
- Dung, N.T.; Cuong, N.C.; Hung, T.V. Molecular dynamics study of microscopic structures, phase transitions and dynamic crystallization in Ni nanoparticles. RSC Adv. 2017, 7, 25406–25413. [Google Scholar]
- Dung, N.T.; Van, C.L. Effects of Number of Atoms, Shell Thickness, and Temperature on the Structure of Fe Nanoparticles Amorphous by Molecular Dynamics Method. Adv. Civ. Eng. 2021, 2021, 9976633. [Google Scholar]
- Kien, H.; Lan, M.T.; Dung, N.T.; Hung, P.K. Annealing study of amorphous bulk and nanoparticle iron using molecular dynamics simulation. Int. J. Mod. Phys. B 2014, 28, 1450155. [Google Scholar] [CrossRef]
- Sha, X.; Cohen, R.E. First-principles thermoelasticity of bcc iron under pressure. Phys. Rev. B 2006, 74, 214111. [Google Scholar] [CrossRef]
- Isaak, D.G.; Masuda, K. Elastic and viscoelastic properties of α iron at high temperatures. J. Geophys. Res. Solid Earth 1995, 100, 17689–17698. [Google Scholar] [CrossRef]
- Adams, J.J.; Agosta, D.S.; Leisure, R.G.; Ledbetter, H. Elastic constants of monocrystal iron from 3 to 500K. J. Appl. Phys. 2006, 100, 113530. [Google Scholar] [CrossRef]
- Speich, G.R.; Schwoeble, A.J.; Leslie, W.C. Elastic constants of binary iron-base alloys. Metall. Trans. 1972, 3, 2031–2037. [Google Scholar] [CrossRef]
- Minh, H.D.T.; Hoc, G.C.; Quang, N.; Dung, N.T. Influence of heating rate, temperature, pressure on the structure, and phase transition of amorphous Ni material: A molecular dynamics study. Heliyon 2020, 6, e05548. [Google Scholar] [CrossRef]
- Dung, N.T. Z-AXIS deformation method to investigate the influence of system size, structure phase transition on mechanical properties of bulk nickel. Mater. Chem. Phys. 2020, 252, 123275. [Google Scholar]
- Tuan, T.Q.; Dung, N.T. Molecular dynamics factors affecting on the structure, phase transition of Al bulk. Phys. B Condens. Matter. 2019, 570, 116–121. [Google Scholar]
- Quoc, T.T.; Trong, D.N.; Ţălu, Ş. Study on the Influence of Factors on the Structure and Mechanical Properties of Amorphous Aluminium by Molecular Dynamics Method. Adv. Mater. Sci. Eng. 2021, 2021, 5564644. [Google Scholar] [CrossRef]
- Nguyen-Trong, D.; Nguyen-Tri, P. Understanding the heterogeneous kinetics of Al nanoparticles by simulations method. J. Mol. Struct. 2020, 1218, 128498. [Google Scholar] [CrossRef]
- Trong, D.N.; Long, V.C.; Țălu, Ș. Molecular dynamics simulation of bulk Cu material under various factors. Appl. Sci. 2022, 12, 4437. [Google Scholar] [CrossRef]
- Young’s Modulus of Elasticity for Metals and Alloys. Available online: https://www.engineeringtoolbox.com/young-modulus-d_773.html (accessed on 31 July 2022).
- Singh, B.N.; Huang, X.; Tähtinen, S.; Moilanen, P.; Jacquet, P.; Dekeyser, J. Final Report on In-Reactor Uniaxial Tensile Deformation of Pure Iron and Fe-Cr Alloy; Risø National Laboratory Technical University of Denmark Roskilde: Roskilde, Denmark, 2007. [Google Scholar]
- Dung, N.T. Influence of impurity concentration, atomic number, temperature and tempering time on microstructure and phase transformation of Ni1−xFex (x = 0.1, 0.3, 0.5) nanoparticles. Mod. Phys. Lett. B 2018, 32, 1850204. [Google Scholar] [CrossRef]
- Dung, N.T.; Kien, P.H.; Phuong, N.T. Simulation on the Factors Affecting the Crystallization Process of FeNi Alloy by Molecular Dynamics. ACS Omega 2019, 4, 14605–14612. [Google Scholar]
- Tuan, T.Q.; Dung, N.T. Effect of heating rate, impurity concentration of Cu, atomic number, temperatures, time annealing temperature on the structure, crystallization temperature and crystallization process of Ni1−xCux bulk; x = 0.1, 0.3, 0.5, 0.7. Int. J. Mod. Phys. B 2018, 32, 1830009. [Google Scholar] [CrossRef]
- Dung, N.T.; Van, C.L. Factors affecting the depth of the Earth’s surface on the heterogeneous dynamics of Cu1− x Nix alloy, x= 0.1, 0.3, 0.5, 0.7, 0.9 by molecular dynamics simulation method. Mater. Today Commun. 2021, 29, 102812. [Google Scholar]
- Dung, N.T.; Phuong, N.T. Molecular dynamic study on factors influencing the structure, phase transition and crystallization process of NiCu6912 nanoparticle. Mater. Chem. Phys. 2020, 250, 123075. [Google Scholar]
- Dung, N.T.; Phuong, N.T. Factors affecting the structure, phase transition and crystallization process of AlNi nanoparticles. J. Alloys Compd. 2020, 812, 152133. [Google Scholar]
- Long, V.C.; Van, D.Q.; Dung, N.T. Ab Initio Calculations on the Structural and Electronic Properties of AgAu Alloys. ACS Omega 2020, 5, 31391–31397. [Google Scholar] [CrossRef]
- Dung, N.T.; Cuong, N.C.; Van, D.Q. Study on the Effect of Doping on Lattice Constant and Electronic Structure of Bulk AuCu by the Density Functional Theory. J. Multiscale Model. 2020, 11, 2030001. [Google Scholar]
- Quoc, T.T.; Long, V.C.; Țălu, Ș.; Nguyen Trong, D. Molecular Dynamics Study on the Crystallization Process of Cubic Cu–Au Alloy. Appl. Sci. 2022, 12, 946. [Google Scholar] [CrossRef]
- Dung, N.T.; Long, V.C.; Țălu, Ș. The The Structure and Crystallizing Process of NiAu Alloy: A Molecular Dynamics Simulation Method. J. Compos. Sci. 2021, 5, 18. [Google Scholar]
- Vu, Q.-T.; Tran, T.-T.-D.; Nguyen, T.-C.; Nguyen, T.V.; Nguyen, H.; Vinh, P.V.; Nguyen-Trong, D.; Dinh Duc, N.; Nguyen-Tri, P. DFT Prediction of Factors Affecting the Structural Characteristics, the Transition Temperature and the Electronic Density of Some New Conjugated Polymers. Polymers 2020, 12, 1207. [Google Scholar] [CrossRef] [PubMed]
- Trong, D.N.; Long, V.C.; Dang, P.N.; Ţălu, Ş. A molecular dynamics study concerning the effect of high-temperature and high-pressure on the structure and phase transition of Fe2O3 material. AIMS Mater. Sci. 2022, 9, 406–429. [Google Scholar] [CrossRef]
- Dung, N.T.; Van, C.L.; Ţălu, Ş. The Study of the Influence of Matrix, Size, Rotation Angle, and Magnetic Field on the Isothermal Entropy, and the Néel Phase Transition Temperature of Fe2O3 Nanocomposite Thin Films by the Monte-Carlo Simulation Method. Coatings 2021, 11, 1209. [Google Scholar]
- Van, C.L.; Saraç, U.; Baykul, M.C.; Luong, D.T.; Țălu, Ș.; Dung, N.T. Electrochemical Deposition of Fe–Co–Ni Samples with Different Co Contents and Characterization of Their Microstructural and Magnetic Properties. Coatings 2022, 12, 346. [Google Scholar]
- Hoc, N.Q.; Hoa, N.T.; Hien, N.D. Study on elastic deformation of substitution alloy AB with interstitrial atom C and BCC structure under pressure. Sci. J. Hanoi Metrop. Univ. Nat. Sci. Technol. 2017, 20, 55–66. [Google Scholar]
- Hoc, N.Q.; Tinh, B.D.; Hien, N.D. Elastic Moduli and Elastic Constants of Interstitial Alloy AuCuSi with FCC Structure under Pressure. High Temp. Mater. Process. 2019, 38, 264–272. [Google Scholar] [CrossRef]
- Hoc, N.Q.; Hien, N.D.; Thang, D.Q. Elastic Deformation of Alloy AuSi with BCC Structure under Pressure. HNUE J. Sci. Nat. Sci. 2018, 63, 74–83. [Google Scholar]
- Hoc, N.Q.; Cuong, T.D.; Hien, N.D. Study on Elastic Deformation of Interstitial Alloy FeC with BCC Structure under Pressure. J. Sci. Mat.-Phys. 2019, 35, 1–12. [Google Scholar]
- Kermouche, G.; Grange, F.; Langlade, C. Local identification of the stress–strain curves of metals at a high strain rate using repeated micro-impact testing. Mater. Sci. Eng. A 2013, 569, 71–77. [Google Scholar] [CrossRef]
- Al Baida, H.; Kermouche, G.; Langlade, C. Development of an improved method for identifying material stress–strain curve using repeated micro-impact testing. Mech. Mater. 2015, 86, 11–20. [Google Scholar] [CrossRef]
- Al Baida, H.; Langlade, C.; Kermouche, G.; Ambriz, R.R. Identifying the stress–strain curve of materials by microimpact testing. Application on pure copper, pure iron, and aluminum alloy 6061-T651. J. Mater. Res. 2015, 30, 2222–2230. [Google Scholar] [CrossRef]
- Xiong, W.; Selleby, M.; Chen, Q.; Odqvist, J.; Du, Y. Phase Equilibria and Thermodynamic Properties in the Fe-Cr System. Crit. Rev. Solid State Mater. 2010, 35, 125–152. [Google Scholar] [CrossRef]
- Zhao, K.M.; Jiang, G.; Wang, L. Electronic and thermodynamic properties of B2-FeSi from first principles. Phys. B Condens. Matter 2011, 406, 363–367. [Google Scholar] [CrossRef]
- Zhang, J.; Su, C.; Liu, Y. First-principles study of bcc Fe-Cr-Si binary and ternary random alloys from special quasi-random structure. Phys. B Condens. Matter 2020, 586, 412085. [Google Scholar] [CrossRef]
- Hoc, N.Q.; Tinh, B.D.; Hien, N.D.; Coman, G. Nonlinear deformation of BCC metal Fe and BCC interstitial alloy FeSi: Dependence on temperature, pressure and silicon concentration. Mater. Phys. Mech. 2021, 47, 501–513. [Google Scholar]
- Hoc, N.Q.; Tinh, B.D.; Hien, N.D.; Coman, G. Study on nonlinear deformation of FCC-AuCuSi under pressure by the statistical moment method. Adv. Mater. Sci. Eng. 2021, 6693326. [Google Scholar]
- Tang, N.; Hung, V.V. Investigation of the Thermodynamic Properties of Anharmonic Crystals by Momentum Method. IV. The Limiting of Absolute Stability and the Melting Temperature of Crystals. Phys. Status Solidi B 1990, 162, 379–385. [Google Scholar] [CrossRef]
- Tinh, B.D.; Hoc, N.Q.; Vinh, D.Q.; Cuong, T.D.; Hien, N.D. Thermodynamic and Elastic Properties of Interstitial Alloy FeC with BCC Structure at Zero Pressure. Adv. Mater. Sci. Eng. 2018, 2018, 5251741. [Google Scholar] [CrossRef]
- Hoc, N.Q.; Hoa, N.T.; Hien, N.D.; Thang, D.Q. Study on Nonlinear Deformation of Binary Interstitial Alloy with BCC Structure under Pressure. HNUE J. Sci. Nat. Sci. 2018, 63, 57–65. [Google Scholar]
- Magomedov, M.N. On calculating the Debye temperature and the Gruneisen parameter. Zhurnal Fiz. Khimii 1987, 61, 1003–1009. [Google Scholar]
- Good, R.J.; Hope, C.J. New Combining Rule for Intermolecular Distances in Intermolecular Potential Functions. J. Chem. Phys. 1970, 53, 540–543. [Google Scholar] [CrossRef]
- Magomedov, M.N. Activated-process parameters for diamond, silicon, and germanium crystals. Russ. Microelectron. 2011, 40, 567–573. [Google Scholar] [CrossRef]
- Leese, J.; Lord, A.E. Elastic Stiffness Coefficients of Single-Crystal Iron from Room Temperature to 500 °C. J. Appl. Phys. 1968, 39, 3986–3988. [Google Scholar] [CrossRef]
- Klotz, S.; Braden, M. Phonon Dispersion of bcc Iron to 10 GPa. Phys. Rev. Lett. 2000, 85, 3209–3212. [Google Scholar] [CrossRef]
- Singh, A.K.; Mao, H.K.; Shu, J.; Hemley, R.J. Estimation of Single-Crystal Elastic Moduli from Polycrystalline X-ray Diffraction at High Pressure: Application to FeO and Iron. Phys. Rev. Lett. 1998, 80, 2157–2160. [Google Scholar] [CrossRef]
- Mohammad, R.K.; Kerstin, W. Characterization of sandwich composite T-joints under different ageing conditions. Compos. Struct. 2018, 197, 80–88. [Google Scholar]
- Li, N.; Gu, J.F.; Chen, P.H. Fracture plane based failure criteria for fibre-reinforced composites under three dimensional stress state. Compos. Struct. 2018, 204, 466–474. [Google Scholar] [CrossRef]
Publisher’s Note: MDPI stays neutral with regard to jurisdictional claims in published maps and institutional affiliations. |
© 2022 by the authors. Licensee MDPI, Basel, Switzerland. This article is an open access article distributed under the terms and conditions of the Creative Commons Attribution (CC BY) license (https://creativecommons.org/licenses/by/4.0/).