Article

Electrically Conductive Biocomposites Based on Poly(3-hydroxybutyrate-co-3-hydroxyvalerate) and Wood-Derived Carbon Fillers

1
Wood K plus—Kompetenzzentrum Holz GmbH, Altenberger Strasse 69, 4040 Linz, Austria
2
FTPO—Faculty of Polymer Technology, Ozare 19, 2380 Slovenj Gradec, Slovenia
3
Center for Surface and Nanoanalytics (ZONA), Johannes Kepler University (JKU) Linz, Altenberger Strasse 69, 4040 Linz, Austria
4
Institute of Macromolecular Chemistry (IMC), Czech Academy of Sciences, Heyrovského nám. 2, 16206 Prague, Czech Republic
5
Faculty of Physical Chemistry, University of Belgrade, Studentski trg 12-16, 11158 Belgrade, Serbia
*
Author to whom correspondence should be addressed.
J. Compos. Sci. 2022, 6(8), 228; https://doi.org/10.3390/jcs6080228
Submission received: 23 June 2022 / Revised: 25 July 2022 / Accepted: 2 August 2022 / Published: 4 August 2022
(This article belongs to the Special Issue Feature Papers in Journal of Composites Science in 2022)

Abstract

:
In this paper, biobased carbons were used as fillers in poly(3-hydroxybutyrate-co-3-hydroxyvalerate) (PHBV). The mechanical and electrical properties of these 100% biocomposites were analyzed. First, biocarbons were prepared from wood dust and cellulose fibers using carbonization temperatures ranging 900–2300 °C. XRD revealed significant improvements of the graphitic structure with increasing temperatures for both precursors, with slightly higher ordering in wood-dust-based carbons. An increase of the carbon content with continuous removal of other elements was observed with increasing temperature. The carbonized cellulose fiber showed an accumulation of Na and O on the fiber surface at a carbonization temperature of 1500 °C. Significant degradation of PHBV was observed when mixed with this specific filler, which can, most probably, be attributed to this exceptional surface chemistry. With any other fillers, the preparation of injection-molded PHBV composites was possible without any difficulties. Small improvements in the mechanical performance were observed, with carbonized fibers being slightly superior to the wood dust analogues. Improvements at higher filler content were observed. These effects were even more pronounced in the electrical conductivity. In the range of 15–20 vol.% carbonized fibers, the percolation threshold could be reached, resulting in an electrical conductivity of 0.7 S/cm. For comparison, polypropylene composites were prepared using cellulose fibers carbonized at 2000 °C. Due to longer fibers retained in the composites, percolation could be reached in the range of 5–10 vol.%. The electrical conductivity was even higher compared to that of composites using commercial carbon fibers, showing a great potential for carbonized cellulose fibers in electrical applications.

1. Introduction

Due to increasing environmental concerns, but also economic reasons, mainly attributed to the volatile petroleum prices, the market for biopolymers has gained increased attraction at rapid growth rates over the last two decades [1,2]. While polylactic acid (PLA) is still the most commonly used biopolymer, polyhydroxyalkanoates (PHAs) offer a higher development potential and a wider range of applications [3]. In addition, PHAs are marine biodegradable not just compostable like PLA, making them suitable to combat plastic waste leaking into the environment [4]. One of the most important polymers from the PHA family is poly(3-hydroxybutyrate-co-3-hydroxyvalerate) (PHBV), which is available at industrial scale [1]. PHBV has very promising characteristics such as good biodegradability and mechanical properties similar to those of many conventional fossil-based polymers. However, it also presents some processing-related challenges due to its slow crystallization rate and a narrow processing window caused by the proximity of the thermal decomposition temperature to the melting temperature [2,5]. Nevertheless, PHBV could be successfully processed using standard techniques such as extrusion and injection molding or compression molding [1,5,6,7]. It is often blended with PLA [1,3,5,8,9] and/or mixed with fillers [1,2,3,5,6,7,8,9,10,11,12,13,14] in order to tune the properties for the desired application. PHBV composites are used in medical [11,15,16,17,18], packaging [19,20,21,22] or electrical applications [1,6,8,10,12,13]. Considering the decreasing life cycle of consumer electronics and the increasing demand for antistatic packaging and electromagnetic shielding, there is a demand for conductive biocomposites [8]. Many studies describe the preparation of such materials, such as combinations of carbon nanotubes (CNT) in natural rubber and lecithin [23], CNT in silk fibroin [24], carbon black, CNT or graphene in PLA [25,26] or carbon fibers (CF) fabric in biobased epoxy resins [27]. Arroyo and Ryan tried to use lignin-based carbons in PHBV/PLA blends but observed difficulties due to reaction of the biocarbons with the polymers and were thus not able to add the desired amount of filler [1]. Besides this study, mainly the use of fossil-based carbons such as CNT [10,12], graphene [13] or carbon black [1] in PHBV composites has been described. However, a large variety of biobased materials such as lignin, cellulose, wood, delignified wood or even waste biomass has been described as possible biobased carbon precursors [28,29,30], with various studies even stating the good electrical conductivity of biobased carbons [31,32,33,34,35]. To the best of our knowledge, the only studies on 100% biobased composites made of PHBV and biocarbons were focusing on thermal and mechanical but not electrical properties [9,36]. Therefore, the electrical conductivity and mechanical properties of biocomposites from PHBV filled with wood-based carbon particles and cellulose-based CF were investigated in the current study. At first, biocarbons were prepared at different temperatures in the range of 900–2300 °C. Then, composites were manufactured using melt mixing followed by injection molding. A filler content of 10 vol.% was used, as a percolation threshold in the range of 8–10 vol.% was reported for carbon-filled PP composites prepared using similar processing techniques [37]. Subsequently, a variation of the filler content ranging from 5 to 20 vol.% was performed. As no data for identical materials are available, the results were compared to PP composites, both filled with the prepared biocarbons and commercial CF.

2. Materials and Methods

2.1. Materials

As carbon precursors, dosable cellulose fibers, type lyocell, with an average fiber length of 300 µm (Lenzing AG, Lenzing, Austria) and wood dust Arbocel® C100 (J. Rettenmaier & Söhne GmbH + Co KG, Rosenberg, Germany) were used. PHBV type ENMATTM Y1000P (TianAn Biologic Material Co. Ltd., Ningbo, China) was used as the polymer matrix. For comparison, PP HJ120UB (Borealis AG, Vienna, Austria) with a maleic anhydride grafted PP grade Scona TPPP 8112 FA (BYK-Chemie GmbH, Wesel, Germany) as coupling agent was used. All materials were used without prior purification.

2.2. Preparation of Biobased Carbon Fillers

Carbonization was performed in two steps. First, 5 kg of each precursor, cellulose fibers or wood dust, was carbonized in a KS160Vac chamber furnace (Linn High Therm GmbH, Hirschbach, Germany) under argon atmosphere. The following temperature program was used: 10 °C/min to 200 °C → 10 min isothermal at 200 °C → 1 °C/min to 600 °C → 5 °C/min to 900 °C → 30 min isothermal at 900 °C. In a second thermal treatment step, 500 g of the already carbonized fillers was heated to higher temperatures using an HTK8 chamber furnace (Carbolite Gero GmbH & Co. KG, Neuhausen, Germany). The maximum heating rate (10 °C/min to 900 °C–5 °C/min to Tmax) was used and all samples were held isothermal at Tmax for 30 min. Temperatures of 1500, 2000 and 2300 °C were chosen as maximum temperatures, while an argon flow of 100 L/h was used. No tension was applied, so the fillers were free to shrink during both thermal treatment steps.

2.3. Carbon Filler Analysis

For the determination of the filler size, a FASEP 3E-ECO system (xyz high precision, Darmstadt, Germany) was used. A total of 40 mg of filler was suspended in 400 mL of water and poured into a Petri dish placed on the scanner. From each sample, at least two scans using the maximum resolution of 4800 dpi were taken and analyzed using the automated measurement software of the FASEP system. The count of measured fibers/particles was in the range of 5000–11,000 in each run. For carbonized wood, the length (L) and width (D) were obtained directly from the FASEP measurements, while for the carbonized cellulose fibers only the measured length was used. For better resolution, the diameter was analyzed via an optical microscope BX-RLA2 with a CAM-SC50 (Olympus Austria GmbH, Vienna, Austria) using a magnification of 200×. The diameter of 40 fibers was measured manually using Stream Motion software from the system producer. For the filler size analysis after processing, the polymer matrix was removed by pyrolysis in N2 atmosphere at 500 °C for 1 h in the HTK8 chamber furnace.
To determine the moisture uptake, 1 g of the carbonized fillers was first dried in a vacuum oven at 150 °C for 4 h. After drying, the samples were quickly weighed on an enclosed analytical scale. Afterwards, the samples were conditioned for 2 h at 23 °C, 50% relative humidity and atmospheric pressure, and quickly weighed again. The moisture uptake was determined as the ratio of mass gain and mass of the dried sample.
For pH measurements, 2 g of the carbonized fillers was dispersed in 50 mL of deionized water and stirred for 5 min at 20 °C. The pH was measured using a WTW SenTix® 61 pH electrode connected to a Universal Pocket Meter WTW Multiline P4 (Xylem Analytics Germany Sales GmbH & Co. KG, Weilheim, Germany).
The porosity of the carbonized fillers was investigated by physisorption using an Autosorb-iQ automatic volumetric sorption analyzer (Anton Paar QuantaTec Inc., Boynton Beach, FL, USA) with nitrogen at 77 K. Approximately 100 mg of the samples was outgassed in vacuum for 3 h at 300 °C. The adsorbed gas volume was measured at multiple points at relative pressures of 0.01 to 0.2 for the specific surface area by the BET method plus one point at 0.99 for calculating the total pore volume.
The carbon filler surface analysis was performed using a Theta Probe XPS system (Thermo Fisher Scientific, East Grinstead, UK). The obtained spectra were evaluated by the Avantage software package provided by the system manufacturer. The samples were irradiated with a monochromatic Al-Kα X-ray source (1486.6 eV) at a power of 100 W using a spot size of 400 μm. The high-resolution spectra were recorded at a pass energy of 20 eV using an energy step size of 0.05 eV. In order to neutralize charge build-up on the carbon surfaces, a dual flood gun providing a beam of low-energy Ar ions simultaneously with a beam of low-energy electrons (−2 eV) was used. A standard charge shift referencing using the adventitious carbon peak at 285.0 eV was applied. For the detailed qualitative and quantitative analysis, a linear or Shirley background subtraction and normalization using Scofield sensitivity factors were applied to the photoelectron peaks.
An Ultima IV diffractometer (Rigaku Corporation, Tokyo, Japan) with a Ni-filtered Cu Kα radiation source (λ = 1.5406 Å) was used for the XRD analysis. Crystallographic data were collected in Bragg–Brentano mode, in the 2θ range from 10 to 60° with a scan step size of 0.05°. The interlayer distance d002 was calculated, employing the Bragg’s law (2∙d∙sin(θ) = n∙λ) for the peak in the range of 24–26°.
EDX was done using a Phenom ProX Scanning Electron Microscope (Phenom World, Eindhoven, The Netherlands), with an acceleration voltage of 15 kV. The characterization was done without any deposition of a conductive layer over the samples. The elemental compositions were determined as average values from three measurement spots for each sample.

2.4. Compounding and Specimen Preparation

For preparation of the compounds, a 350E internal mixer (Brabender GmbH & Co. KG, Duisburg, Germany) with roller blades was used. The mixer was operated at 75 rpm and a temperature of 173 °C was chosen for all three heating zones. The polymer was fed into the mixer at first. After 2 min, the carbon fillers were added to the molten polymer and mixed for an additional 5 min after filling was completed. The unfilled PHBV was kneaded for 8 min. In order to assure a constant volume of material in the internal mixer for all samples, the mass was adjusted in accordance with the respective theoretical compound densities. An overview of the prepared mixtures can be found in Table 1. Five batches were prepared from each material. For the investigation of thermal degradation, one additional batch of PHBV kneaded at 190 °C for 8 min was prepared. For additional conductivity measurements and a comparison with literature values, PP composites were also prepared. A processing temperature of 230 °C was used, with all other parameters remaining unchanged.
The subsequent processing steps were identical for all samples. The compounds were ground using a 6 mm square perforation sieve in a Universal Cutting Mill PULVERISETTE 19 (Fritsch GmbH, Idar-Oberstein, Germany). The milled compounds were then processed to tensile test specimens according to EN ISO 3167 using a Smartpower 120 injection molding machine (Wittmann Battenfeld GmbH, Kottingbrunn, Austria). The nozzle temperature was set to 190 °C, while 60 °C was used for the mold. The injection speed was set to 50 cm3/s. Then, 80% of the resulting injection pressure was used as hold pressure being applied for the first 16 of the 30 s total cooling time.
A precision cut-off saw Diadisc 4200 (Mutronic Präzisionsgerätebau GmbH & Co.KG, Rieden am Forggensee, Germany) was used for cutting off the shoulders from the specimens for the impact and heat deflection temperature testing. For the introduction of a 2 mm V-notch in the specimens for the notched impact testing, the same saw with a respective saw blade was used.

2.5. Composite Analysis

The melt flow index (MFI) was determined using a 4105 melt flow tester (ZwickRoell GmbH & Co. KG, Ulm, Germany) equipped with a 2 mm nozzle. A quantity of 5 g of the samples was melted at 190 °C. MFI was determined after loading a mass of 2.16 kg.
The molecular mass distributions of PHBV before and after processing were determined by gel permeation chromatography (GPC). The number average molecular mass (Mn), weight average molecular mass (Mw) and the polydispersity index (PDI = Mw/Mn) were calculated. The measurements were performed with an Agilent 1100 system equipped with an Agilent PLgel 10 µm 50 × 7.5 precolumn followed by an Agilent PLgel Mixed-B 10 µm 300 × 7.5 (linear MW operating range: 500–10,000,000 g/mol) column and an Agilent PLgel Mixed-D 5 µm 300 × 7.5 (linear MW operating range: 200–400,000 g/mol) column (Agilent Technologies, Santa Clara, CA, USA). A refractive index detector was used. The system was calibrated using multiple polystyrene standards over a wide MW range from 1470 to 1,800,000 g/mol (PSS GmbH, Mainz, Germany). The samples were dissolved in chloroform for 48 h and filled samples were filtered using a 0.45 µm PTFE filter before 100 µL of the chloroform solution was injected. The temperature was set to 40 °C and a flow rate of 1 mL/min was used.
Tensile tests were performed according to EN ISO 527 using a parallel length of the test specimens of 80 mm and a gauge length of 175 mm. The used preload force was 3 N. The elastic modulus was measured between 0.05% and 0.25% of elongation at a test speed of 1 mm/min. After completion of the modulus measurement, the test speed was set to 5 mm/min for the determination of the tensile strength. The impact testing in Charpy mode was performed according to EN ISO 179/1eA and EN ISO 179/1eU. The heat deflection temperature (HDT) measurements were done in accordance with EN ISO 75 in HDT-A mode.
For electrical conductivity measurements, test samples were cut from the middle part of injection-molded dog-bone-shaped specimens. The distance between the electrodes was 10 mm with the effective section of the specimens having a geometry of 10 mm × 4 mm. A conductive silver paste was applied to improve the contact between the electrode surfaces and the sample. For the measurements, an Alpha-A Analyzer (Novocontrol Technologies GmbH & Co. KG, Montabaur, Germany) was used, applying a voltage of 1 V at a frequency range of 10−1–107 Hz. The tests were run at room temperature in the injection molding flow direction.

3. Results and Discussion

3.1. Filler Preparation and Analysis

Both wood dust and cellulose fibers could be successfully converted to carbon fillers. The yields after carbonization up to 900 °C were 27.2 wt.% for the wood dust and 21.4 wt.% for the cellulose fibers. Upon further thermal treatment at higher temperatures, only a slight mass loss occurred, reaching total yields of 25.5 wt.% for the wood dust and 20.5 wt.% for the cellulose fibers at 2300 °C. Similar to the mass loss, most of the shrinkage occurred in the first carbonization step up to 900 °C. For the wood dust, a reduction of 30% in length and 22% in width, leading to a reduction of L/D from 1.70 to 1.52 could be observed after carbonization at 900 °C. No significant changes occurred at higher treatment temperatures, thus, all used carbonized wood fillers had similar average dimensions of 66 µm length and 44 µm width. For the cellulose fibers, a shrinkage of 25% in diameter and 24% in length could be observed after the first carbonization step. Higher temperatures had no impact on the fiber diameter but led to a slight continuous decrease of the average fiber length from 259 to 241 µm. The used carbon fibers had a diameter of 7.9 µm and L/Ds in the range of 30.4–32.8.
The interlayer distances (d002) calculated by XRD were indicative of an improved order within the carbon structure at higher carbonization temperatures (Table 2). This effect was more pronounced in wood-dust-based carbons compared to the cellulose fiber analogues, which can be seen in a smaller interlayer spacing in the full temperature range, but especially for the sample carbonized at 1500 and 2000 °C. Based on the XRD data, a significant improvement in the electrical conductivity can be expected from both fillers when carbonized at a higher temperature.
Further analyses of the used fillers were performed (see Table 2), as one sample (CF1500) led to a significant degradation of the PHBV matrix during thermal processing (see Table 3). A water uptake higher than 1 wt.% could be found for both fillers carbonized at 900 °C, while a much lower uptake was observed for fillers carbonized at higher temperatures. Similar trends were found for the specific surface areas. While the fillers prepared at 900 °C had high BET surface areas, 309 m2/g for CW900 and 174 m2/g for CF900, all other samples had very small surface areas below 5 m2/g. The fillers prepared at 900 or 1500 °C led to an alkaline pH in the range of 10–12 when suspended in water, while after carbonization at 2000 or 2300 °C, the pH was almost neutral. Despite some significant differences among the used fillers, these results could not explain the extraordinary behavior of the filler CF1500. The elemental composition analysis by EDX revealed the expected increase in C and decrease in O content at higher temperatures for both precursor types, but with higher C contents for the cellulose fiber samples. However, different other elements were found. The wood dust samples contained small amounts of Ca (0.30 at.% at 900 °C) and traces of Al and K. The carbonized cellulose fibers contained Na (0.25 at.% at 900 °C) and traces of Si. Therefore, additional XPS analyses for the determination of surface composition and functional groups were performed, which revealed interesting differences among the prepared carbon fillers. The sample CF1500 showed very high Na and O contents of 11.1 and 12.8 at.%, respectively (see Figure 1). As EDX analysis revealed only small amounts of O (2.6 at.% for CF1500) and traces of other elements, it can be assumed that high amounts of Na and O are only present at the fiber surface, thus, most probably, originating from a treatment during fiber processing and accumulating at the surface during thermal treatment. For comparison, also at 900 °C, Na and O were present at the fiber surface, but with significantly lower contents of 5.9 and 9.6 at.%, respectively. For the sample CF2000, no detectable traces of other elements could be found at the fiber surface. This is in accordance with previous studies of biomass carbonized at similar temperatures [38,39] and our EDX measurements also revealed a significant decrease of the Na and O contents in the temperature range of 1500–2000 °C, which seems to cover the decomposition or boiling point of Na/O species found at lower carbonization temperatures. For comparison, an XPS analysis of CW1500 was performed, too, revealing an O content of 1.1 at.% with no other elements besides C. This further strengthened the assumption that the high Na and O contents of CF1500 originated from a treatment during the fiber production process which was not applied in the production of wood dust.
As no other significant differences compared to the other fillers were found, we assumed that the extraordinary surface composition of CF1500 might be the reason for the exceptional behavior of the PHBV_CF1500_10 compound.

3.2. Processing and Compound Properties

Compounding was possible for all mixtures mentioned in Table 1. Despite a set temperature of 173 °C for all compounds, the mass temperature ended up in the range of 182–185 °C for PHBV for all compounds containing 5 or 10 vol.% carbon. Even higher temperatures of 188 °C and 192 °C were reached when 15 or 20 vol.% carbon fillers were added. The only sample reaching lower mass temperatures was the before-mentioned compound PHBV_CF1500_10. Due to the polymer degradation leading to a lower viscosity, less shear force was induced, thus, reducing the additional heat release. In contrast to the other formulations, the maximum mass temperature varied among batches, in the range 175–180 °C. For comparison, one sample of unfilled PHBV was kneaded at 190 °C. Due to the lower viscosity and lesser shear forces, the temperature rise was smaller and a maximum of 195 °C was reached. Data in Table 3 show that there is some degree of polymer degradation during melt mixing as the MFI increased from 19 to 26. However, the results indicated that the set low temperature of 173 °C was chosen correctly as a higher mixing temperature of 190 °C led to a significantly increased degradation of the PHBV polymer and more than doubled MFI values. The MFI values of the carbon containing compounds were mostly in the range of 26–36, thus being just slightly higher compared to the MFI of the kneaded PHBV matrix. No clear trends could be observed, not even for the compounds containing higher amounts of filler. The expected increasing viscosity and decrease in MFI values [40] might be compensated by the polymer degradation due to the increased friction and higher mass temperature during mixing. The MFI of the compound PHBV_CF1500_10 could not be measured due to the very low viscosity. The preparation of injection-molded specimen was possible with all compounds, but it has to be mentioned that for the compound PHBV_CF1500_10, only the batches that reached a mass temperature of 180 °C during mixing could be further processed by injection molding. For the other batches, the degradation was more severe, and the viscosity was too low for the injection molding process. In order to prove the degradation of the PHBV matrix during mixing, GPC measurements were performed (details of the GPC results are shown in the Supplementary Materials in Figures S1–S7). The molecular mass of PHBV before processing was 207,000 g/mol (Mw) and 83,500 g/mol (Mn) giving a PDI of 2.48, which was close to the values reported for this grade [41]. As already seen in MFI values, PHBV significantly degraded when processed at a set kneader temperature of 190 °C, proven by a reduction of Mw by 33%. The polymer degradation was less pronounced when melt mixing was performed at a set temperature of 173 °C, resulting in Mw values in the range of 152,000–190,000 g/mol, with no clear impacts of the filler type or filler content visible. In addition to the slight reduction of the molecular mass during processing, the distribution became narrower as seen by a reduction of PDI values to 1.77–2.10. Special attention has to be paid to the sample PHBV_CF1500_10. The assumed severe polymer degradation during melt mixing was proven by a significant shift towards longer retention times (see Figure S2) and a calculated molecular mass Mw of 82.000 g/mol, being less than half of the average of the other samples (173,000 g/mol). Several studies have described thermal [42,43,44], biological/enzymatic [45,46,47] or hydrolytic [48,49] PHBV degradation, with even a catalytic effect of ammonium surfactants being observed [50]. However, none of these apply to the exceptional behavior of our sample PHBV_CF1500_10. Based on the collected data, the only explanation for the severe PHBV degradation in this specific sample, is the extraordinary surface composition of CF1500, even though no literature on Na or Na/O-species catalyzed thermal degradation is available. Only Arroyo and Ryan described a somehow similar effect of a decreasing melt viscosity when mixing PHBV/PLA with carbonized Kraft lignin. They concluded that this might potentially result from residual species from the Kraft lignin process [1], but with no further information available. Nevertheless, this is another hint that impurities in biobased carbons might have an effect on PHBV degradation. As the mechanism remains unclear, this definitely requires a more detailed investigation in another research setup.
The filler dimensions were measured for each compound before and after injection molding. In all compounds, a significant degradation of the carbon fillers occurred, which can be clearly connected to melt mixing in the kneader, as no significant changes after the subsequent injection molding process could be observed. Therefore, only the filler dimension values after injection molding, as given in Table 3, are used in the following discussion. For the carbonized cellulose fibers, severe fiber breakage was observed, as the average fiber length was reduced during processing from approximately 250 to 95 µm. No change in the fiber diameter could be observed. Thus, the L/D decreased in the same amount from 32 to 12 on average. For the compounds containing 10 vol.% carbon fibers, a slight trend related to the carbonization temperature could be observed as the average fiber length decreased from 95 µm for CF900 to 82 µm for CF2300. This is not surprising as carbons become more brittle at a higher degree of graphitization [51]. However, CF1500 did not follow this trend due to the before-mentioned polymer degradation and the significantly reduced viscosity of the compound PHBV_CF1500_10. For varying carbon fiber content, the results were in contradiction with the well-reported decrease of average fiber length with increasing fiber content [52,53]. Higher fiber content led to increased friction resulting in a more pronounced fiber breakage during mixing. This effect could be seen when comparing the resulting fiber length in PHBV_CF2000_5 (96 µm) to PHBV_CF2000_10 (89 µm). However, at higher fiber contents, the mass temperature was significantly increased, leading to a lower viscosity and less fiber breakage, thus, finally resulting in slightly longer fibers at a higher fiber content. For the carbonized wood dust, the breakage during processing was less pronounced, but still significant changes could be observed. The average length was reduced from 66 to 43 µm and, contrary to the carbonized fibers, a decreasing width was detected, too, though less pronounced than the reduction in length. The average L/D was reduced from 1.52 to 1.23 during processing. In contrast to the carbonized fibers, no clear effect of the carbonization temperature could be observed. Regarding the filler content, an increased length could be observed at 5 vol.% compared to 10 vol.%, while at 15 vol.%, the decreasing viscosity seemed to compensate for the expected higher filler breakage. Overall, it can be concluded that even after both processing steps, there was a significant difference between the dimensions of carbonized fibers and wood dust (factor 10 in L/D), while within the fibers and wood dust series, the differences were rather small.

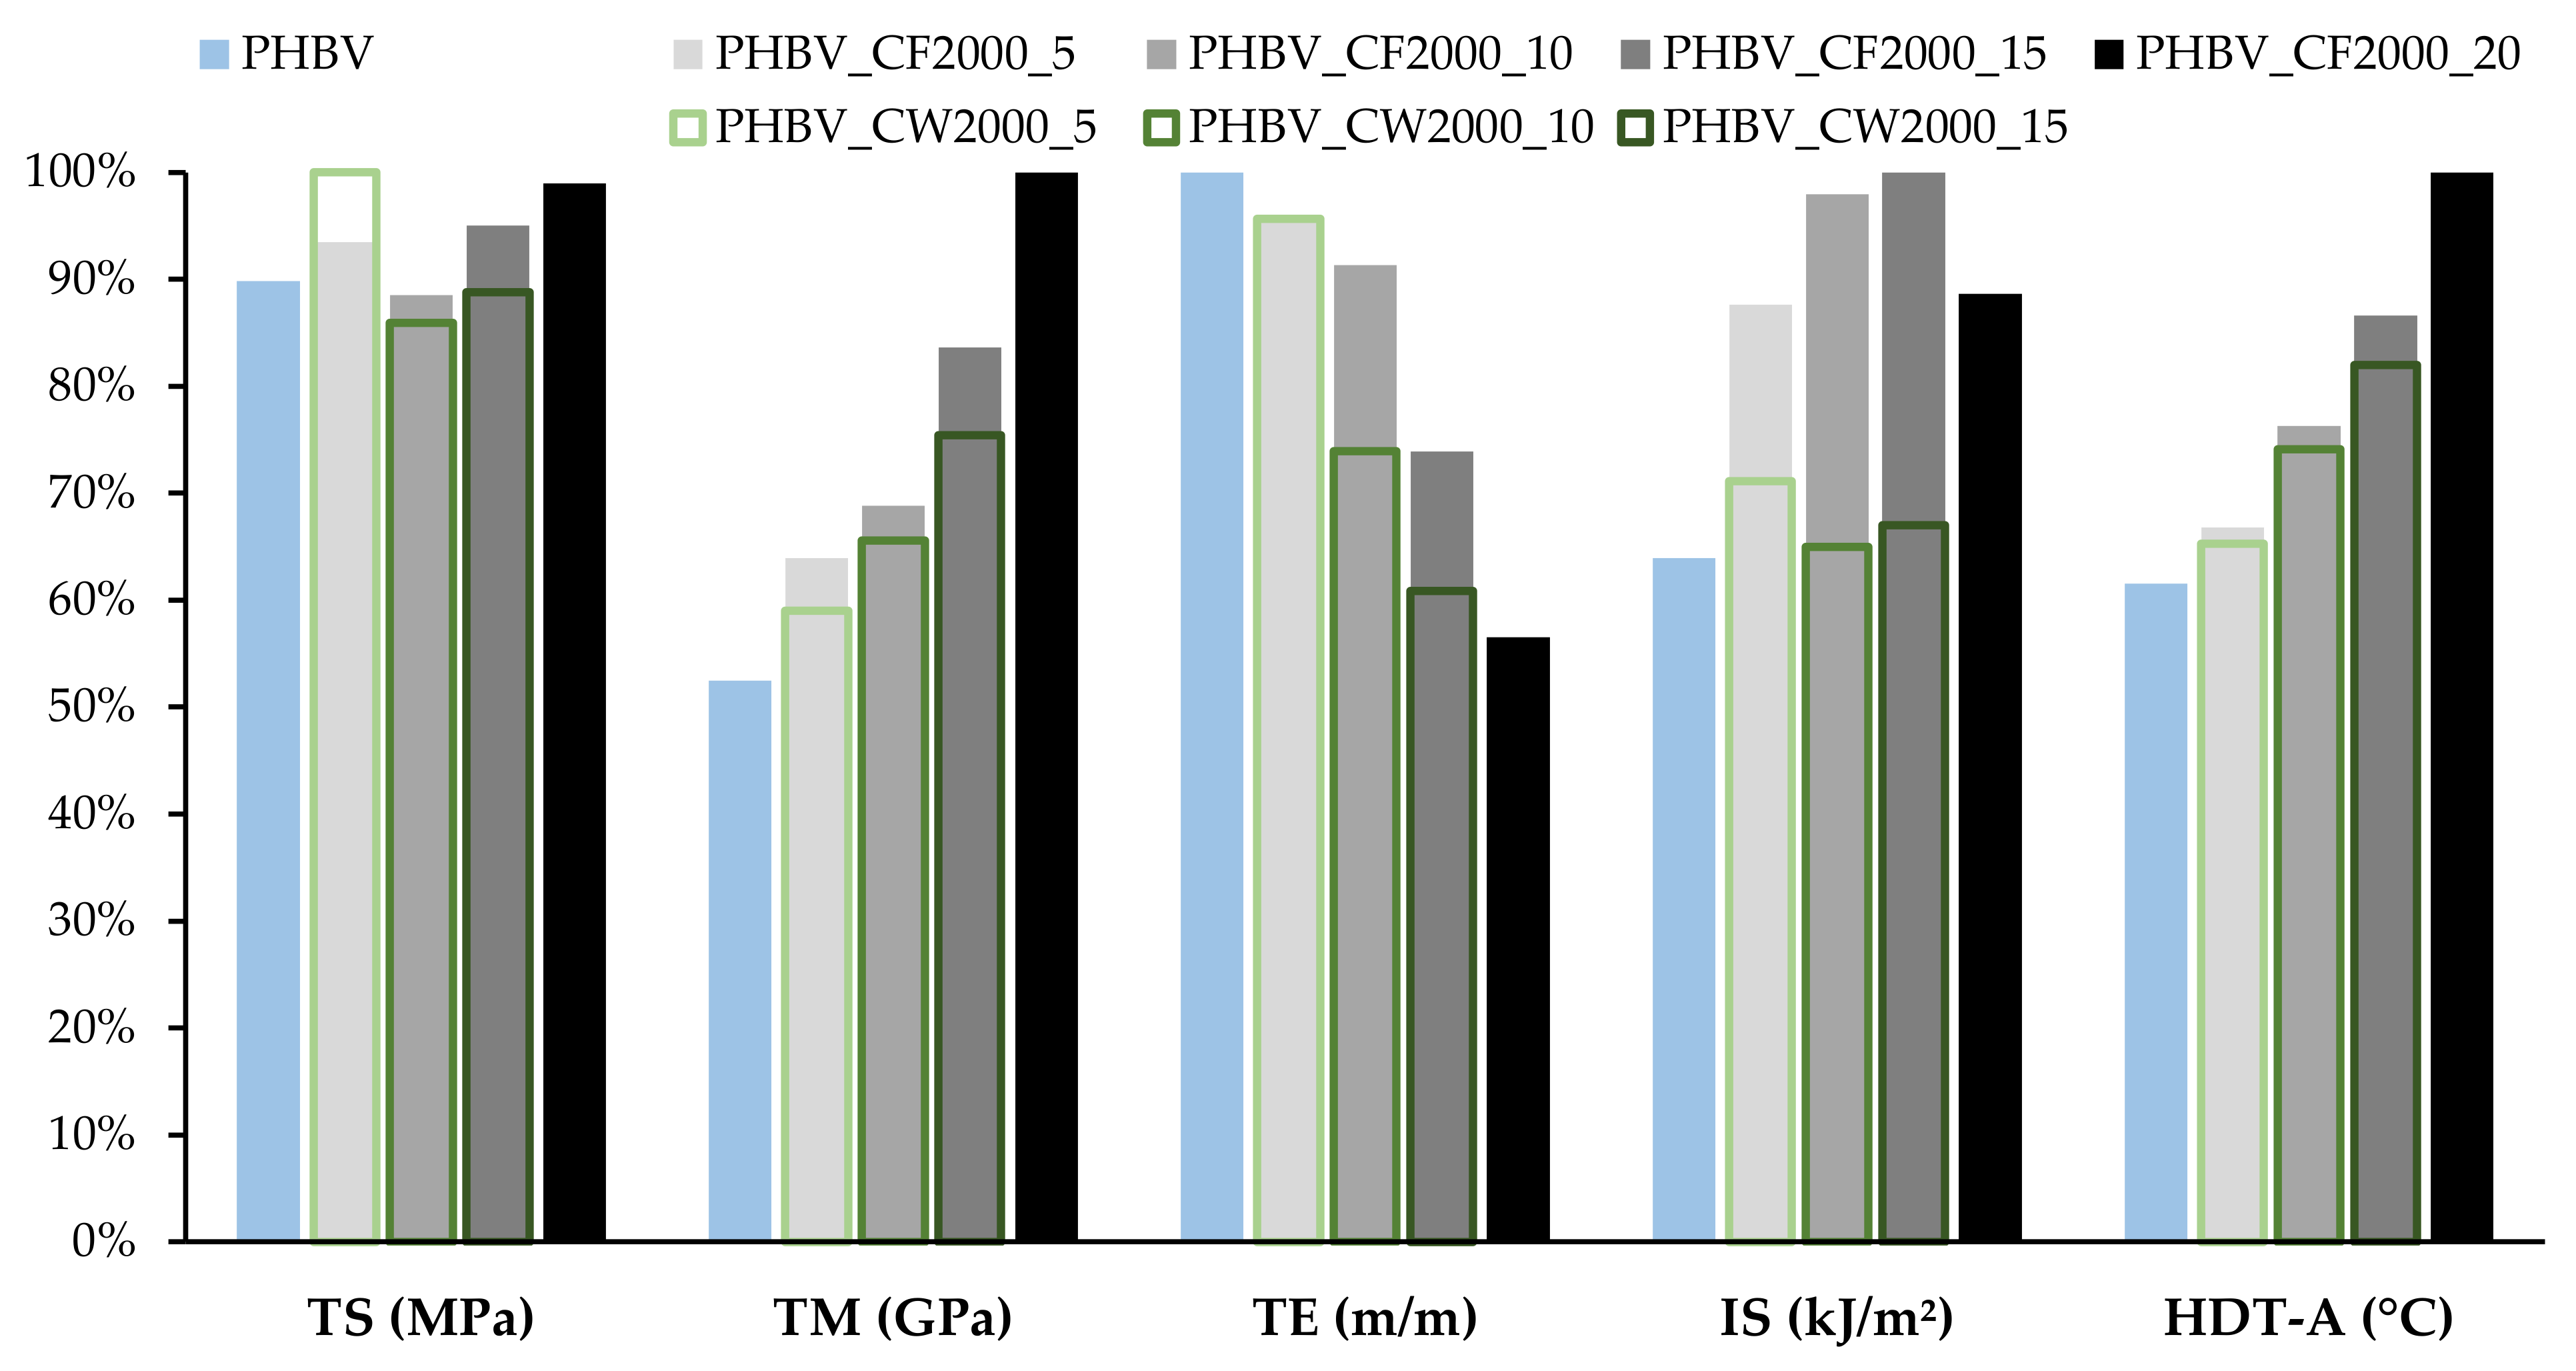
3.3. Composite Properties

Table 4 summarizes the properties of injection-molded composites. The measured densities were very close to the theoretical values based on the constituents’ densities and volume fractions. Thus, weighing errors in material preparation and the formation of voids during the processing could be excluded. As the differences in densities were quite small for all prepared composites, the absolute mechanical properties instead of specific ones were used in the further discussion. In addition, it has to be noted that the flexural properties are not included in Table 4 as they followed the same trends as the tensile ones, with the flexural strength being approximately 1.64× higher than the tensile strength while the modulus and elongation values being almost identical in both test setups. The only exception was again the degraded sample PHBV_CF1500_10, having a flexural strength of only 1.33× higher than the tensile strength.
Regarding the tensile strength, the values were quite similar for all samples ranging approximately 33–38 MPa. Only the composite PHBV_CF1500_10 showed a significantly lower tensile strength due to the increased polymer degradation. The small differences might be attributed to the low L/Ds, even for the fiber samples. In a previous study on PP/CF composites, a critical fiber length of 607 µm was found, corresponding to a critical L/D of approximately 90 [53]. In the present study, the share of fibers reaching a critical L/D of at least 50, corresponding to a length >395 µm, was below 0.05%. Thus, the stress transfer from the matrix to the fillers was insufficient in all samples, leading to almost no differences among the samples, even the unfilled PHBV sample. Just a very slight improvement could be seen when using fibers instead of wood dust, which might be attributed to the very small share of fibers longer than the critical fiber length or generally improved mechanical performance of carbonized cellulose fiber compared to their wood dust counterparts. Looking at the modulus values, the picture was clearer, with all reinforced samples outperforming the unfilled PHBV sample. No influence of the carbonization temperature could be seen, but the expected improvement with increasing filler content was clearly visible. Again, the fiber-based composites were superior to the wood dust ones. In accordance with previous findings [54], HDT showed identical trends as those of the modulus values. The elongation at break was reduced with increasing filler content, a trend which has been previously reported too [55,56]. The elongation at break seemed to be slightly higher for the CF samples compared to the wood dust ones. The same held true for the impact strength, which was higher for the fiber composites, while the wood dust samples did not even show an improvement compared to the unfilled PHBV sample. No significant differences could be observed within the fiber or wood dust series. The notched impact strength was generally very low with no significant differences among the full sample series, the only exception being the degraded sample PHBV_CF1500_10. Overall, it can be concluded that fiber-based composites slightly outperformed their wood dust counterparts, while no impact of carbonization temperature on mechanical performance could be observed for both filler types. The filler content was the main impact factor on the mechanical performance within this study. The observed effects are illustrated in Figure 2.
Regarding the electrical conductivity, it is visible in Figure 3 that the filler L/D is the key determining factor. The carbonized wood dust filler yields only a slight increase in the electrical conductivity compared to the unfilled PHBV polymer, with no differences among the wood dust samples. The fiber composites show higher conductivity values by 1–2 decades, but also no influence of the carbonization temperature can be observed. Only the sample PHBV_CF1500_10 shows improved conductivity, but, most probably, this can be attributed to the increased fiber length.
Figure 4 shows the impact of the filler content on the electrical conductivity. Only a slight improvement of the electrical conductivity can be observed for the wood dust samples when increasing the filler content. Even for the sample containing 15 vol.% carbonized wood dust, the electrical conductivity is less than one decade higher compared to the unfilled PHBV polymer. No further wood dust samples were prepared, as it seemed highly unlikely that the percolation threshold could be reached at a reasonable filler content, when the L/D was that low. A completely different behavior can be observed for the CF composites. While at a content of 5 vol.% carbonized cellulose fibers, the electrical conductivity is very low, close to that of the unfilled PHBV polymer and the wood dust samples, an increase of several decades can be achieved at higher fiber contents, reaching 0.7 S/cm at a 20 vol.% fiber content. This value is quite high, when compared to other conductive biocomposites; e.g., for a conductive paper containing 20 wt.% CNT, a resistivity of 85 Ω cm (0.012 S/cm) was given [23]. It seems that in the range of 15–20 vol.% CF content, the percolation threshold is reached. This value seems quite high compared to previous studies. For example, Kalaitzidou et al. [37] found a percolation threshold in PP composites in the range of 8–10 vol.% CF. However, the L/D was much higher, being close to 24. In our previous study using PP and commercial PAN-based CF [53], a percolation threshold slightly above 5 vol.% CF was found, but at a much higher L/D of 55. This study also concluded that the electrical conductivity was strongly dependent on the fiber length or L/D and that the percolation threshold was shifted to higher values when the fiber length or L/D was reduced. In addition, one sample in the mentioned study, denoted as “PP-10CF-vs”, had almost identical conductivity values over the full frequency range to the sample PHBV_CF2000_10 and a comparable L/D (15.8 vs. 12). Therefore, it seems reasonable to assume that the high percolation threshold (and low electrical conductivity at low fiber content) in the present study can be attributed to the low L/D and not to poor fiber conductivity. To further prove this assumption, we prepared PP_CF composites, thus allowing a better comparison with previous data as polymer-connected effects could be excluded. In addition, due to higher mixing temperatures possible without polymer degradation, longer fibers were retained in the PP composites, enabling a more detailed analysis of the impact of L/D on the electrical conductivity and the percolation threshold.
Figure 5 shows the electrical conductivity at 50 Hz in dependence of the fiber content for PHBV_CF and PP_CF as well as for PP composites with commercial CF from our before-mentioned previous study [53]. In the present study, the L/D could be increased from approximately 12 to 19 when PP was used instead of PHBV. The reason for the increased L/D was most probably the reduction in shear force during processing due to the high temperature of 230 °C used (65 °C above the melting point of PP). This increase in L/D led to an increased electrical conductivity of the PP composites compared to PHBV_CF despite almost identical electrical conductivities of the unfilled matrix polymers. The percolation threshold could be significantly reduced from 15–20 vol.% CF to the range of 5–10 vol.% CF. This range was identical to the one found for PP composites using commercial CF. As can be seen in Figure 5, even higher conductivity values can be achieved using CF2000 from the present study compared to PAN-based CF, even at a much lower L/D of 19 compared to almost 50 [53]. This is a strong indication that cellulose-based CF might be a promising alternative to fossil-based carbon in electrical applications. While in the present study, the electrical conductivities were even higher when using cellulose-based CF in PP composites, other studies have mentioned slightly lower conductivity values for single cellulose-based CF compared to their PAN-based counterparts [32,38]. This discrepancy might be attributed to differing carbonization temperatures of the compared CF. While 2000 °C was used for the cellulose-based CF, the carbonization temperature of the commercial CF is unknown but most likely lower, as high-tenacity CF are usually produced at temperatures around 1500 °C [57], which would lead to lower conductivity of the PAN-based CF. In addition, the different structures of the used CF might have an impact on the composite conductivities. While the PAN-based CF are completely straight, the cellulose-based CF are usually curved and tend to interlock quite easily, as it was visible after the matrix removal. Therefore, it could be assumed that the formation of a conducting network might occur more easily, i.e., at a lower fiber content or lower L/D.

4. Conclusions

Due to the variation in carbonization temperature and precursor type, different carbon fillers could be prepared. Both precursor types, cellulose fibers and wood dust showed significant shrinkage during the carbonization treatment. However, the overall shape was kept intact, resulting in CF with an L/D of approximately 30 and carbonized wood dust with an L/D of 1.5, with no significant differences within the fibers or wood dust series due to the different carbonization temperatures. Other properties were highly affected by heat treatment conditions. For example, a high BET surface area only occurred at 900 °C, connected with a significantly higher moisture uptake compared to fillers carbonized at higher temperatures. When suspended in water, a change of pH to alkaline values was only detected for fillers carbonized at 900 or 1500 °C. Significant improvements in the graphitic structure with increasing carbonization temperatures were detected for both fillers, with a slightly higher ordering in wood-dust-based carbons. The O contents continuously decreased with higher treatment temperature. Different chemical compositions were measured at the surfaces of the fibers at low carbonization temperatures. High amounts of Na and O, most probably connected to Na2CO3 or NaHCO3, were found on the surface of cellulose fibers carbonized at 1500 °C. The observed degradation of PHBV when mixed with this specific filler was most probably related to the special surface chemistry. This effect definitely requires a more detailed investigation.
No impact of the carbonization temperature on the mechanical performance was observed, but the higher filler content led to an increased modulus and HDT as well as a decreased elongation at break. The fiber-based samples slightly outperformed the corresponding wood dust samples. Generally, only slight differences were found, which we assume were connected to the low L/D, which was only approximately 12 for the fiber samples. Even for the electrical conductivity, no impact of the carbonization temperature could be observed, despite significant differences in the graphitic structure of the used carbon fillers. The filler content or the L/D was too low to reach a conducting network. The percolation threshold was found to be in the range of 15–20 vol.% CF. For comparison, PP composites using cellulose fibers carbonized at 2000 °C were prepared, reaching a higher L/D of 19 and achieving percolation already in the range of 5–10 vol.% CF. Compared to a previous study using commercial CF, an even higher electrical conductivity was achieved when using carbonized cellulose fibers.

Supplementary Materials

The following supporting information can be downloaded at: https://www.mdpi.com/article/10.3390/jcs6080228/s1, Figure S1: GPC curves of PHBV before processing (PHBV (virgin)), PHBV kneaded at 190 °C (PHBV190), PHBV kneaded at 173 °C (PHBV), PHBV mixed at 173 °C with 10 vol% of cellulose fibers carbonized at 2000 °C (PHBV_CF2000_10) and PHBV mixed at 173 °C with 10 vol% of cellulose fibers carbonized at 1500 °C (PHBV_CF1500_10); Figure S2: GPC curves after baseline correction and normalization. Zoom at analyzed peak; Figure S3: Peak of PHBV (virgin) analyzed by Agilent GPC-Addon; Figure S4: Peak of PHBV190 analyzed by Agilent GPC-Addon; Figure S5: Peak of PHBV analyzed by Agilent GPC-Addon; Figure S6: Peak of PHBV_CF2000_10 analyzed by Agilent GPC-Addon; Figure S7: Peak of PHBV_CF1500_10 analyzed by Agilent GPC-Addon.

Author Contributions

Conceptualization, C.U.; methodology, validation and formal analysis, C.U., D.S. and C.F.; investigation, resources and data curation M.R., J.D., F.P., I.P., S.B., F.Z. and C.U.; writing—original draft preparation, C.U.; writing—review and editing, all authors; visualization, C.U. and J.D.; supervision, C.U., D.S. and C.F.; project administration, D.S. and C.F. All authors have read and agreed to the published version of the manuscript.

Funding

Funding from the European Regional Development Fund (EFRE) and the province of Upper Austria through the program IWB 2014-2020/REACT-EU (project BIOCYCLE-UA) is gratefully acknowledged. Part of this work was conducted within the project BioCarb-K funded by the European Regional Development Fund (EFRE) and the province of Upper Austria through the program IWB 2014-2020. Further support by the Ministry of Education, Youth and Sports of the Czech Republic (grant no. LTAUSA19066) is gratefully acknowledged. I.A.P. acknowledges the support provided by the Ministry of Education, Science, and Technological Development of the Republic of Serbia (contract no. 451-03-68/2022-14/200146).

Conflicts of Interest

The authors declare no conflict of interest. The funders had no role in the design of the study; in the collection, analyses, or interpretation of data; in the writing of the manuscript, or in the decision to publish the results.

References

  1. Arroyo, J.; Ryan, C. Incorporation of Carbon Nanofillers Tunes Mechanical and Electrical Percolation in PHBV:PLA Blends. Polymers 2018, 10, 1371. [Google Scholar] [CrossRef] [PubMed] [Green Version]
  2. Mekonnen, T.; Mussone, P.; Khalil, H.; Bressler, D. Progress in bio-based plastics and plasticizing modifications. J. Mater. Chem. A 2013, 1, 13379. [Google Scholar] [CrossRef] [Green Version]
  3. Sun, J.; Shen, J.; Chen, S.; Cooper, M.A.; Fu, H.; Wu, D.; Yang, Z. Nanofiller Reinforced Biodegradable PLA/PHA Composites: Current Status and Future Trends. Polymers 2018, 10, 505. [Google Scholar] [CrossRef] [PubMed] [Green Version]
  4. Meereboer, K.W.; Misra, M.; Mohanty, A.K. Review of recent advances in the biodegradability of polyhydroxyalkanoate (PHA) bioplastics and their composites. Green Chem. 2020, 22, 5519–5558. [Google Scholar] [CrossRef]
  5. Bledzki, A.K.; Jaszkiewicz, A. Mechanical performance of biocomposites based on PLA and PHBV reinforced with natural fibres—A comparative study to PP. Compos. Sci. Technol. 2010, 70, 1687–1696. [Google Scholar] [CrossRef] [Green Version]
  6. Vieira, L.; Montagna, L.S.; Marini, J.; Passador, F.R. Influence of particle size and glassy carbon content on the thermal, mechanical, and electrical properties of PHBV/glassy carbon composites. J. Appl. Polym. Sci. 2021, 138, 49740. [Google Scholar] [CrossRef]
  7. Srubar, W.V.; Pilla, S.; Wright, Z.C.; Ryan, C.A.; Greene, J.P.; Frank, C.W.; Billington, S.L. Mechanisms and impact of fiber–matrix compatibilization techniques on the material characterization of PHBV/oak wood flour engineered biobased composites. Compos. Sci. Technol. 2012, 72, 708–715. [Google Scholar] [CrossRef]
  8. Silva, A.P.B.; Montagna, L.S.; Passador, F.R.; Rezende, M.C.; Lemes, A.P. Biodegradable nanocomposites based on PLA/PHBV blend reinforced with carbon nanotubes with potential for electrical and electromagnetic applications. Express Polym. Lett. 2021, 15, 987–1003. [Google Scholar] [CrossRef]
  9. Snowdon, M.R.; Mohanty, A.K.; Misra, M. Miscibility and Performance Evaluation of Biocomposites Made from Polypropylene/Poly(lactic acid)/Poly(hydroxybutyrate-co-hydroxyvalerate) with a Sustainable Biocarbon Filler. ACS Omega 2017, 2, 6446–6454. [Google Scholar] [CrossRef]
  10. Montanheiro, T.L.d.A.; Cristóvan, F.H.; Machado, J.P.B.; Tada, D.B.; Durán, N.; Lemes, A.P. Effect of MWCNT functionalization on thermal and electrical properties of PHBV/MWCNT nanocomposites. J. Mater. Res. 2015, 30, 55–65. [Google Scholar] [CrossRef]
  11. Paşcu, E.I.; Stokes, J.; McGuinness, G.B. Electrospun composites of PHBV, silk fibroin and nano-hydroxyapatite for bone tissue engineering. Mater. Sci. Eng. C Mater. Biol. Appl. 2013, 33, 4905–4916. [Google Scholar] [CrossRef]
  12. Fernández Armada, D.; González Rodríguez, V.; Costa, P.; Lanceros-Mendez, S.; Arias-Ferreiro, G.; Abad, M.-J.; Ares-Pernas, A. Polyethylene/poly(3-hydroxybutyrate-co-3-hydroxyvalerate/carbon nanotube composites for eco-friendly electronic applications. Polym. Test. 2022, 112, 107642. [Google Scholar] [CrossRef]
  13. Ambrosio-Martín, J.; Gorrasi, G.; Lopez-Rubio, A.; Fabra, M.J.; Mas, L.C.; López-Manchado, M.A.; Lagaron, J.M. On the use of ball milling to develop poly(3-hydroxybutyrate-co-3-hydroxyvalerate)-graphene nanocomposites (II)-Mechanical, barrier, and electrical properties. J. Appl. Polym. Sci. 2015, 132, 42217. [Google Scholar] [CrossRef] [Green Version]
  14. Jun, D.; Guomin, Z.; Mingzhu, P.; Leilei, Z.; Dagang, L.; Rui, Z. Crystallization and mechanical properties of reinforced PHBV composites using melt compounding: Effect of CNCs and CNFs. Carbohydr. Polym. 2017, 168, 255–262. [Google Scholar] [CrossRef]
  15. Kaniuk, Ł.; Stachewicz, U. Development and Advantages of Biodegradable PHA Polymers Based on Electrospun PHBV Fibers for Tissue Engineering and Other Biomedical Applications. ACS Biomater. Sci. Eng. 2021, 7, 5339–5362. [Google Scholar] [CrossRef]
  16. Wu, Q.; Wang, Y.; Chen, G.-Q. Medical application of microbial biopolyesters polyhydroxyalkanoates. Artif. Cells Blood Substit. Immobil. Biotechnol. 2009, 37, 1–12. [Google Scholar] [CrossRef]
  17. He, Y.; Hu, Z.; Ren, M.; Ding, C.; Chen, P.; Gu, Q.; Wu, Q. Evaluation of PHBHHx and PHBV/PLA fibers used as medical sutures. J. Mater. Sci. Mater. Med. 2014, 25, 561–571. [Google Scholar] [CrossRef]
  18. Tebaldi, M.L.; Maia, A.L.C.; Poletto, F.; de Andrade, F.V.; Soares, D.C.F. Poly(-3-hydroxybutyrate-co-3-hydroxyvalerate) (PHBV): Current advances in synthesis methodologies, antitumor applications and biocompatibility. J. Drug Deliv. Sci. Technol. 2019, 51, 115–126. [Google Scholar] [CrossRef]
  19. Cava, D.; Giménez, E.; Gavara, R.; Lagaron, J.M. Comparative Performance and Barrier Properties of Biodegradable Thermoplastics and Nanobiocomposites versus PET for Food Packaging Applications. J. Plast. Film. Sheeting 2006, 22, 265–274. [Google Scholar] [CrossRef] [Green Version]
  20. Rydz, J.; Musiol, M.; Zawidlak-Węgrzyńska, B.; Sikorska, W. Chapter 14—Present and Future of Biodegradable Polymers for Food Packaging Applications. Handb. Food Bioeng. 2018, 20, 431–467. [Google Scholar]
  21. Modi, S.; Koelling, K.; Vodovotz, Y. Assessment of PHB with varying hydroxyvalerate content for potential packaging applications. Eur. Polym. J. 2011, 47, 179–186. [Google Scholar] [CrossRef]
  22. Berthet, M.-A.; Angellier-Coussy, H.; Chea, V.; Guillard, V.; Gastaldi, E.; Gontard, N. Sustainable food packaging: Valorising wheat straw fibres for tuning PHBV-based composites properties. Compos. Part A Appl. Sci. Manuf. 2015, 72, 139–147. [Google Scholar] [CrossRef]
  23. Shayganpour, A.; Nazarizadeh, S.; Grasselli, S.; Malchiodi, A.; Bayer, I.S. Stacked-Cup Carbon Nanotube Flexible Paper Based on Soy Lecithin and Natural Rubber. Nanomaterials 2019, 9, 824. [Google Scholar] [CrossRef] [PubMed] [Green Version]
  24. Dionigi, C.; Posati, T.; Benfenati, V.; Sagnella, A.; Pistone, A.; Bonetti, S.; Ruani, G.; Dinelli, F.; Padeletti, G.; Zamboni, R.; et al. A nanostructured conductive bio-composite of silk fibroin-single walled carbon nanotubes. J. Mater. Chem. B 2014, 2, 1424–1431. [Google Scholar] [CrossRef] [PubMed]
  25. Tümer, E.H.; Erbil, H.Y. Extrusion-Based 3D Printing Applications of PLA Composites: A Review. Coatings 2021, 11, 390. [Google Scholar] [CrossRef]
  26. Sathies, T.; Senthil, P.; Prakash, C. Application of 3D printed PLA-carbon black conductive polymer composite in solvent sensing. Mater. Res. Express 2019, 6, 115349. [Google Scholar] [CrossRef]
  27. Tserpes, K.; Tzatzadakis, V.; Bachmann, J. Electrical Conductivity and Electromagnetic Shielding Effectiveness of Bio-Composites. J. Compos. Sci. 2020, 4, 28. [Google Scholar] [CrossRef] [Green Version]
  28. Abioye, A.M.; Ani, F.N. Recent development in the production of activated carbon electrodes from agricultural waste biomass for supercapacitors: A review. Renew. Sustain. Energy Rev. 2015, 52, 1282–1293. [Google Scholar] [CrossRef]
  29. Zheng, T.; Sabet, S.M.; Pilla, S. Polydopamine coating improves electromagnetic interference shielding of delignified wood-derived carbon scaffold. J. Mater. Sci. 2021, 56, 10915–10925. [Google Scholar] [CrossRef]
  30. Ogale, A.A.; Zhang, M.; Jin, J. Recent advances in carbon fibers derived from biobased precursors. J. Appl. Polym. Sci. 2016, 133, 7. [Google Scholar] [CrossRef] [Green Version]
  31. Köhnke, J.; Fürst, C.; Unterweger, C.; Rennhofer, H.; Lichtenegger, H.C.; Keckes, J.; Emsenhuber, G.; Mahendran, A.R.; Liebner, F.; Gindl-Altmutter, W. Carbon Microparticles from Organosolv Lignin as Filler for Conducting Poly(Lactic Acid). Polymers 2016, 8, 205. [Google Scholar] [CrossRef] [Green Version]
  32. Gindl-Altmutter, W.; Czabany, I.; Unterweger, C.; Gierlinger, N.; Xiao, N.; Bodner, S.C.; Keckes, J. Structure and electrical resistivity of individual carbonised natural and man-made cellulose fibres. J. Mater. Sci. 2020, 55, 10271–10280. [Google Scholar] [CrossRef]
  33. Shao, Y.; Guizani, C.; Grosseau, P.; Chaussy, D.; Beneventi, D. Biocarbons from microfibrillated cellulose/lignosulfonate precursors: A study of electrical conductivity development during slow pyrolysis. Carbon 2018, 129, 357–366. [Google Scholar] [CrossRef]
  34. Fingolo, A.C.; Bettini, J.; da Silva Cavalcante, M.; Pereira, M.P.; Bufon, C.C.B.; Santhiago, M.; Strauss, M. Boosting Electrical Conductivity of Sugarcane Cellulose and Lignin Biocarbons through Annealing under Isopropanol Vapor. ACS Sustain. Chem. Eng. 2020, 8, 7002–7010. [Google Scholar] [CrossRef]
  35. Bourke, J.; Manley-Harris, M.; Fushimi, C.; Dowaki, K.; Nunoura, T.; Antal, M.J. Do All Carbonized Charcoals Have the Same Chemical Structure?: 2. A Model of the Chemical Structure of Carbonized Charcoal. Ind. Eng. Chem. Res. 2007, 46, 5954–5967. [Google Scholar] [CrossRef]
  36. Li, Z.; Reimer, C.; Wang, T.; Mohanty, A.K.; Misra, M. Thermal and Mechanical Properties of the Biocomposites of Miscanthus Biocarbon and Poly(3-Hydroxybutyrate-co-3-Hydroxyvalerate) (PHBV). Polymers 2020, 12, 1300. [Google Scholar] [CrossRef]
  37. Kalaitzidou, K.; Fukushima, H.; Drzal, L. A Route for Polymer Nanocomposites with Engineered Electrical Conductivity and Percolation Threshold. Materials 2010, 3, 1089–1103. [Google Scholar] [CrossRef]
  38. Scholz, R.; Herbig, F.; Beck, D.; Spörl, J.; Hermanutz, F.; Unterweger, C.; Piana, F. Improvements in the carbonisation of viscose fibres. Reinf. Plast. 2019, 63, 146–150. [Google Scholar] [CrossRef]
  39. Köhnke, J.; Gierlinger, N.; Prats-Mateu, B.; Unterweger, C.; Solt, P.; Mahler, A.K.; Schwaiger, E.; Liebner, F.; Gindl-Altmutter, W. Comparison of four technical lignins as resource for electrically conductive carbon particle. BioResources 2019, 14, 1091–1109. [Google Scholar] [CrossRef]
  40. Liu, Y.; Kontopoulou, M. The structure and physical properties of polypropylene and thermoplastic olefin nanocomposites containing nanosilica. Polymer 2006, 47, 7731–7739. [Google Scholar] [CrossRef]
  41. Jost, V.; Kopitzky, R. Blending of Polyhydroxybutyrate-co-valerate with Polylactic Acid for Packaging Applications: Reflections on Miscibility and Effects on the Mechanical and Barrier Properties. Chem. Biochem. Eng. Q. 2015, 29, 221–246. [Google Scholar] [CrossRef]
  42. Chen, Y.; Chou, I.-N.; Tsai, Y.-H.; Wu, H.-S. Thermal degradation of poly(3-hydroxybutyrate) and poly(3-hydroxybutyrate-co-3-hydroxyvalerate) in drying treatment. J. Appl. Polym. Sci. 2013, 130, 3659–3667. [Google Scholar] [CrossRef]
  43. Mofokeng, J.P.; Luyt, A.S. Morphology and thermal degradation studies of melt-mixed PLA/PHBV biodegradable polymer blend nanocomposites with TiO2 as filler. J. Appl. Polym. Sci. 2015, 132. [Google Scholar] [CrossRef]
  44. Liu, Q.-S.; Zhu, M.-F.; Wu, W.-H.; Qin, Z.-Y. Reducing the formation of six-membered ring ester during thermal degradation of biodegradable PHBV to enhance its thermal stability. Polym. Degrad. Stab. 2009, 94, 18–24. [Google Scholar] [CrossRef]
  45. Weng, Y.-X.; Wang, Y.; Wang, X.-L.; Wang, Y.-Z. Biodegradation behavior of PHBV films in a pilot-scale composting condition. Polym. Test. 2010, 29, 579–587. [Google Scholar] [CrossRef]
  46. Li, Z.; Lin, H.; Ishii, N.; Chen, G.-Q.; Inoue, Y. Study of enzymatic degradation of microbial copolyesters consisting of 3-hydroxybutyrate and medium-chain-length 3-hydroxyalkanoates. Polym. Degrad. Stab. 2007, 92, 1708–1714. [Google Scholar] [CrossRef]
  47. Mueller, R.-J. Biological degradation of synthetic polyesters—Enzymes as potential catalysts for polyester recycling. Process Biochem. 2006, 41, 2124–2128. [Google Scholar] [CrossRef]
  48. Bonartsev, A.P.; Boskhomodgiev, A.P.; Iordanskii, A.L.; Bonartseva, G.A.; Rebrov, A.V.; Makhina, T.K.; Myshkina, V.L.; Yakovlev, S.A.; Filatova, E.A.; Ivanov, E.A.; et al. Hydrolytic Degradation of Poly(3-hydroxybutyrate), Polylactide and their Derivatives: Kinetics, Crystallinity, and Surface Morphology. Mol. Cryst. Liq. Cryst. 2012, 556, 288–300. [Google Scholar] [CrossRef]
  49. Patel, R.; Monticone, D.; Lu, M.; Grøndahl, L.; Huang, H. Hydrolytic degradation of porous poly(hydroxybutyrate-co-hydroxyvalerate) scaffolds manufactured using selective laser sintering. Polym. Degrad. Stab. 2021, 187, 109545. [Google Scholar] [CrossRef]
  50. Bordes, P.; Hablot, E.; Pollet, E.; Avérous, L. Effect of clay organomodifiers on degradation of polyhydroxyalkanoates. Polym. Degrad. Stab. 2009, 94, 789–796. [Google Scholar] [CrossRef]
  51. Johnson, D.J. Structure-property relationships in carbon fibres. J. Phys. D Appl. Phys. 1987, 20, 286–291. [Google Scholar] [CrossRef]
  52. Fu, S.-Y.; Lauke, B.; Mäder, E.; Yue, C.-Y.; Hu, X. Tensile properties of short-glass-fiber- and short-carbon-fiber-reinforced polypropylene composites. Compos. Part A 2000, 31, 1117–1125. [Google Scholar] [CrossRef]
  53. Unterweger, C.; Mayrhofer, T.; Piana, F.; Duchoslav, J.; Stifter, D.; Poitzsch, C.; Fürst, C. Impact of fiber length and fiber content on the mechanical properties and electrical conductivity of short carbon fiber reinforced polypropylene composites. Compos. Sci. Technol. 2020, 188, 107998. [Google Scholar] [CrossRef]
  54. Unterweger, C.; Duchoslav, J.; Stifter, D.; Fürst, C. Characterization of carbon fiber surfaces and their impact on the mechanical properties of short carbon fiber reinforced polypropylene composites. Compos. Sci. Technol. 2015, 108, 41–47. [Google Scholar] [CrossRef]
  55. Thomason, J.L. The influence of fibre length and concentration on the properties of glass fibre reinforced polypropylene: 5. Injection moulded long and short fibre PP. Compos. Part A 2002, 33, 1641–1652. [Google Scholar] [CrossRef]
  56. Karsli, N.G.; Aytac, A. Tensile and thermomechanical properties of short carbon fiber reinforced polyamide 6 composites. Compos. Part B Eng. 2013, 51, 270–275. [Google Scholar] [CrossRef]
  57. Newcomb, B.A. Processing, structure, and properties of carbon fibers. Compos. Part A Appl. Sci. Manuf. 2016, 91, 262–282. [Google Scholar] [CrossRef]
Figure 1. XPS survey spectra of carbon fillers carbonized at different temperatures.
Jcs 06 00228 g001
Figure 2. Relative mechanical performance in dependence of filler type and fill content. Tensile strength (TS), modulus (TM) and elongation at break (TE), impact strength (IS) and heat deflection temperature (HDT-A).
Jcs 06 00228 g002
Figure 3. Electrical conductivity of PHBV composites in the measured frequency range. Impact of filler type (carbonized cellulose fibers (CF) or wood dust (CW)) and carbonization temperature (900–2300 °C).
Jcs 06 00228 g003
Figure 4. Electrical conductivity of PHBV composites in the measured frequency range. Impact of filler content (5–20 vol.%) and filler type (carbonized cellulose fibers (CF) or wood dust (CW)).
Jcs 06 00228 g004
Figure 5. Electrical conductivity (at 50 Hz) of PHBV/CF and PP/CF composites. Determination of percolation threshold. L/D is approximately 12 for PHBV_CF2000, 19 for PP_CF2000 and 50 for PP_CF(PAN) [53].
Jcs 06 00228 g005
Table 1. Overview of the prepared composites.
SampleFiller TypeTcarb.
(°C)
Filler Content
(Vol.%)
PHBV--0
PHBV_CF900_10carb. cellulose90010
PHBV_CF1500_10carb. cellulose150010
PHBV_CF2000_10carb. cellulose200010
PHBV_CF2300_10carb. cellulose230010
PHBV_CF2000_5carb. cellulose20005
PHBV_CF2000_15carb. cellulose200015
PHBV_CF2000_20carb. cellulose200020
PHBV_CW900_10carb. wood90010
PHBV_CW1500_10carb. wood150010
PHBV_CW2000_10carb. wood200010
PHBV_CW2300_10carb. wood230010
PHBV_CW2000_5carb. wood20005
PHBV_CW2000_15carb. wood200015
PHBV190 *--0
PP_CF2000_5 **carb. cellulose20005
PP_CF2000_10 **carb. cellulose200010
PP_CF2000_15 **carb. cellulose200015
* MFI and GPC only, ** conductivity only.
Table 2. Properties of prepared carbon fillers. Interlayer distance by XRD (d002), specific surface area (S BET), moisture uptake, pH in aqueous suspension, bulk chemical composition by EDX and surface composition by XPS.
Sampled002S BETMoisturepHC EDXO EDXNa EDXCa EDXC XPSO XPSNa XPS
(nm)(m2/g)(g/g %)(-)(at.%)(at.%)(at.%)(at.%)(at.%)(at.%)(at.%)
CF9000.375174.01.0910.895.693.950.250.0084.59.65.9
CF15000.3702.20.2411.097.182.600.130.0076.112.811.1
CF20000.3521.30.036.398.091.760.020.00100.00.00.0
CF23000.3441.80.026.098.601.300.020.00---
CW9000.371309.31.2612.093.865.760.000.30---
CW15000.3594.70.1910.395.983.680.000.2098.91.10.0
CW20000.3433.50.156.697.481.930.000.35---
CW23000.3423.70.096.897.712.130.000.03---
Table 3. Maximum mass temperature during mixing, MFI (190 °C/2.16 kg) of prepared compounds, weight average molecular mass and polydispersity index of PHBV after mixing and filler dimensions after injection molding.
SampleTmax (°C)MFI
(g/10 min)
Mw
(105 g/mol)
PDIL
(µm)
L/D
(-)
PHBV (virgin)-19.0 ± 1.32.072.48--
PHBV (190 °C)19554.3 ± 2.31.382.05--
PHBV18226.0 ± 1.31.901.92--
PHBV_CF900_1018427.6 ± 2.71.752.1095 ± 712.0 ± 0.8
PHBV_CF1500_10175–180x0.822.01101 ± 312.8 ± 0.4
PHBV_CF2000_1018328.5 ± 1.01.642.0089 ± 1211.3 ± 0.2
PHBV_CF2300_1018428.2 ± 0.41.802.0382 ± 210.3 ± 0.2
PHBV_CF2000_518533.5 ± 1.41.732.0596 ± 212.2 ± 0.3
PHBV_CF2000_1518829.0 ± 0.91.661.9493 ± 211.7 ± 0.3
PHBV_CF2000_2019226.3 ± 0.31.691.87101 ± 412.8 ± 0.5
PHBV_CW900_1018428.7 ± 3.71.921.9539 ± 51.23 ± 0.01
PHBV_CW1500_1018331.7 ± 1.21.521.9740 ± 41.21 ± 0.01
PHBV_CW2000_1018432.4 ± 0.41.792.1039 ± 21.21 ± 0.01
PHBV_CW2300_1018334.5 ± 1.31.791.9745 ± 11.24 ± 0.02
PHBV_CW2000_518436.5 ± 0.61.631.8550 ± 31.27 ± 0.01
PHBV_CW2000_1518830.6 ± 0.81.741.7744 ± 21.24 ± 0.01
Table 4. Properties of PHBV/carbon composites including 95% confidence intervals. Tensile strength (TS), modulus (TM) and elongation at break (TE), impact strength (IS), notched impact strength (NIS), heat deflection temperature (HDT-A), density (ρ) and electrical conductivity at 50 Hz (σ).
SampleTS
(MPa)
TM
(GPa)
TE
(m/m %)
IS
(kJ/m2)
NIS
(kJ/m2)
HDT-A
(°C)
ρ
(g/cm3)
σ
(S/cm)
PHBV34.5 ± 0.73.2 ± 0.12.3 ± 0.26.2 ± 0.21.3 ± 0.178.5 ± 4.61.246 ± 0.0062.0 × 10−12
PHBV_CF900_1036.1 ± 0.14.1 ± 0.12.0 ± 0.29.9 ± 0.81.6 ± 0.2100.2 ± 4.91.265 ± 0.0088.0 × 10−11
PHBV_CF1500_10 *23.3 ± 3.85.1 ± 0.10.5 ± 0.13.6 ± 0.50.9 ± 0.1107.6 ± 3.61.264 ± 0.0053.0 × 10−10
PHBV_CF2000_1034.0 ± 0.14.2 ± 0.12.1 ± 0.19.5 ± 0.71.5 ± 0.197.3 ± 7.81.264 ± 0.0018.3 × 10−11
PHBV_CF2300_1035.5 ± 0.14.5 ± 0.11.7 ± 0.111.5 ± 0.71.6 ± 0.296.8 ± 3.81.264 ± 0.0011.0 × 10−10
PHBV_CF2000_535.9 ± 0.13.9 ± 0.12.2 ± 0.18.5 ± 0.61.9 ± 0.385.2 ± 1.91.253 ± 0.0034.0 × 10−12
PHBV_CF2000_1034.0 ± 0.14.2 ± 0.12.1 ± 0.19.5 ± 0.71.5 ± 0.197.3 ± 7.81.264 ± 0.0018.3 × 10−11
PHBV_CF2000_1536.5 ± 0.25.1 ± 0.11.7 ± 0.19.7 ± 0.41.7 ± 0.3110.4 ± 7.51.271 ± 0.0026.2 × 10−9
PHBV_CF2000_2038.0 ± 0.26.1 ± 0.11.3 ± 0.28.6 ± 0.91.6 ± 0.5127.5 ± 5.41.287 ± 0.0026.9 × 10−1
PHBV_CW900_1034.7 ± 0.14.1 ± 0.11.6 ± 0.16.1 ± 0.11.4 ± 0.191.4 ± 4.21.265 ± 0.0014.5 × 10−12
PHBV_CW1500_1034.0 ± 0.44.2 ± 0.11.6 ± 0.16.0 ± 0.31.4 ± 0.193.9 ± 4.41.264 ± 0.0017.2 × 10−12
PHBV_CW2000_1033.0 ± 0.14.0 ± 0.11.7 ± 0.16.3 ± 0.21.6 ± 0.294.5 ± 3.61.265 ± 0.0063.7 × 10−12
PHBV_CW2300_1032.7 ± 0.23.9 ± 0.11.7 ± 0.16.4 ± 0.31.9 ± 0.392.4 ± 3.81.269 ± 0.0013.6 × 10−12
PHBV_CW2000_538.4 ± 0.33.6 ± 0.12.2 ± 0.16.9 ± 0.41.6 ± 0.283.2 ± 2.41.255 ± 0.0025.0 × 10−12
PHBV_CW2000_1033.0 ± 0.14.0 ± 0.11.7 ± 0.16.3 ± 0.21.6 ± 0.294.5 ± 3.61.265 ± 0.0063.7 × 10−12
PHBV_CW2000_1534.1 ± 0.24.6 ± 0.11.4 ± 0.16.5 ± 0.41.6 ± 0.3104.5 ± 4.21.273 ± 0.0048.7 × 10−12
* This sample is out of line due to polymer degradation.
Publisher’s Note: MDPI stays neutral with regard to jurisdictional claims in published maps and institutional affiliations.

