
Study of a Bimodal α–β Ti Alloy Microstructure Using Multi-Resolution Spherical Indentation Stress-Strain Protocols


Abstract
:1. Introduction
2. Materials and Methods
2.1. Materials and Sample Preparation
2.2. Spherical Indentation
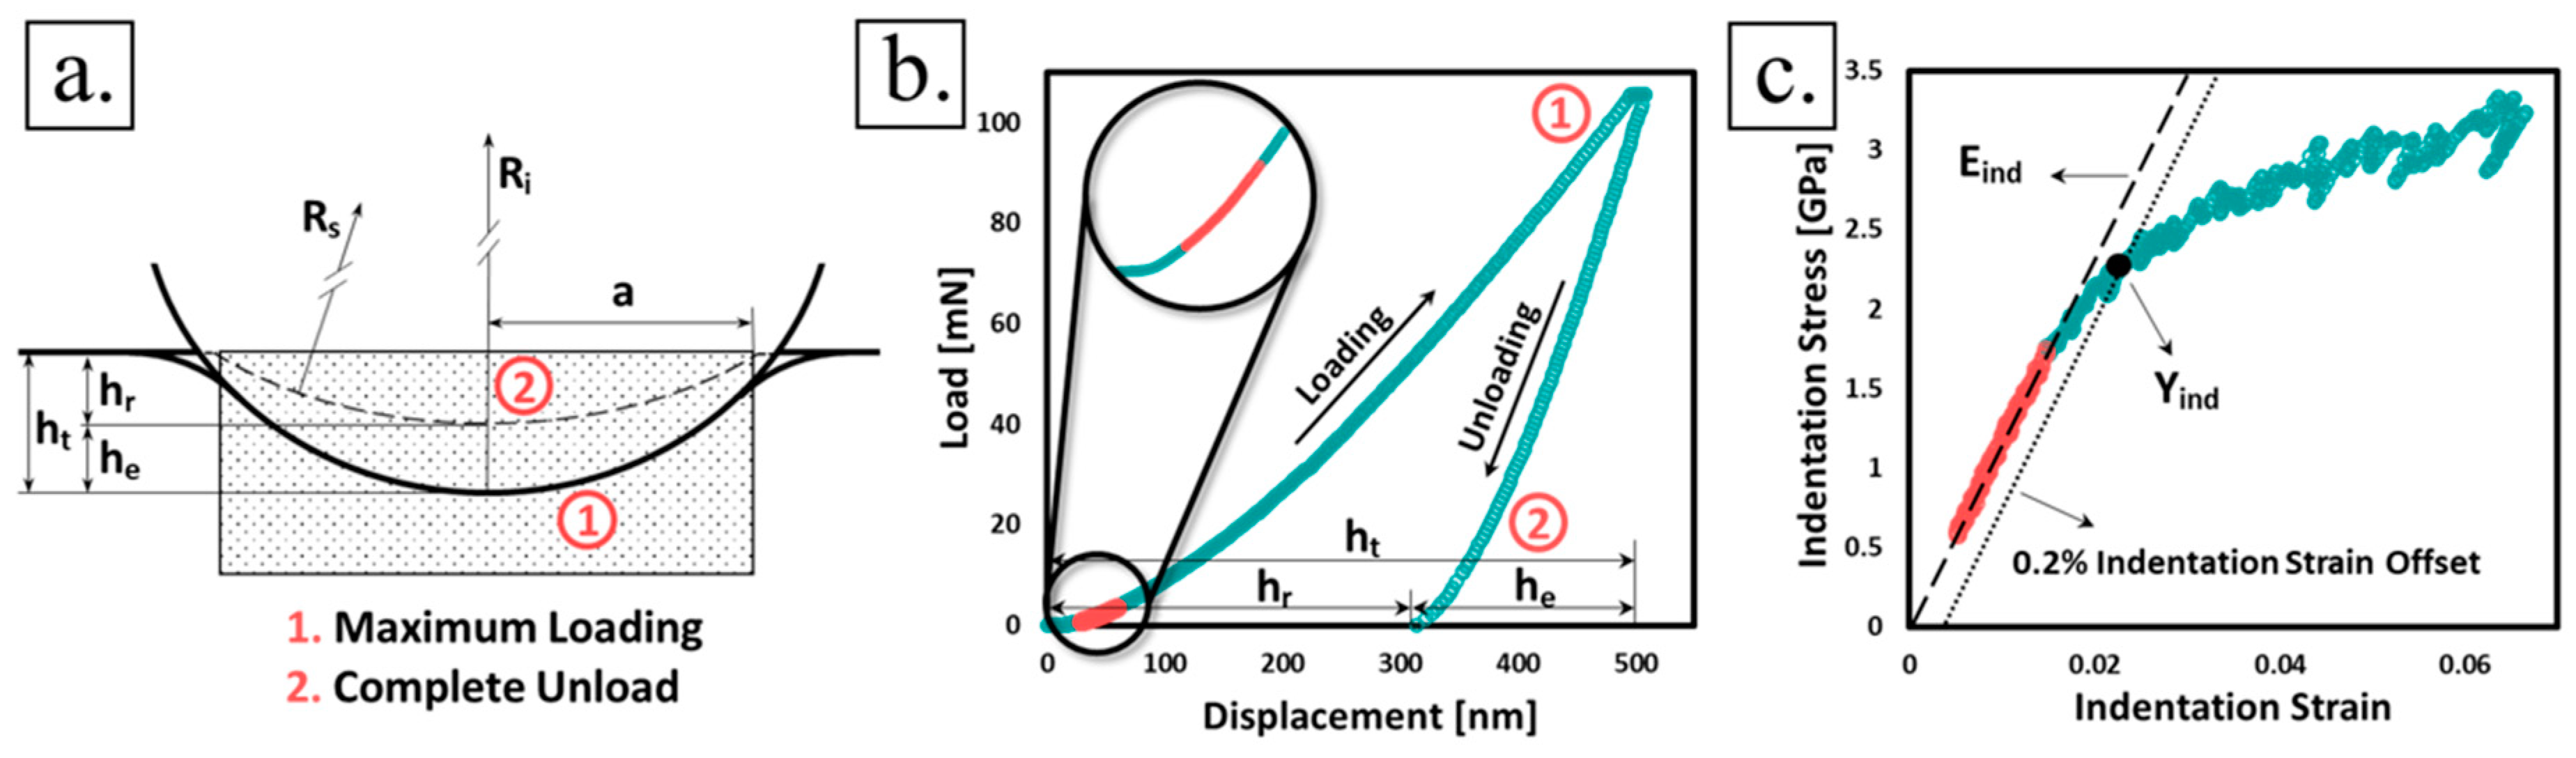
2.3. Spherical Nanoindentation Analysis
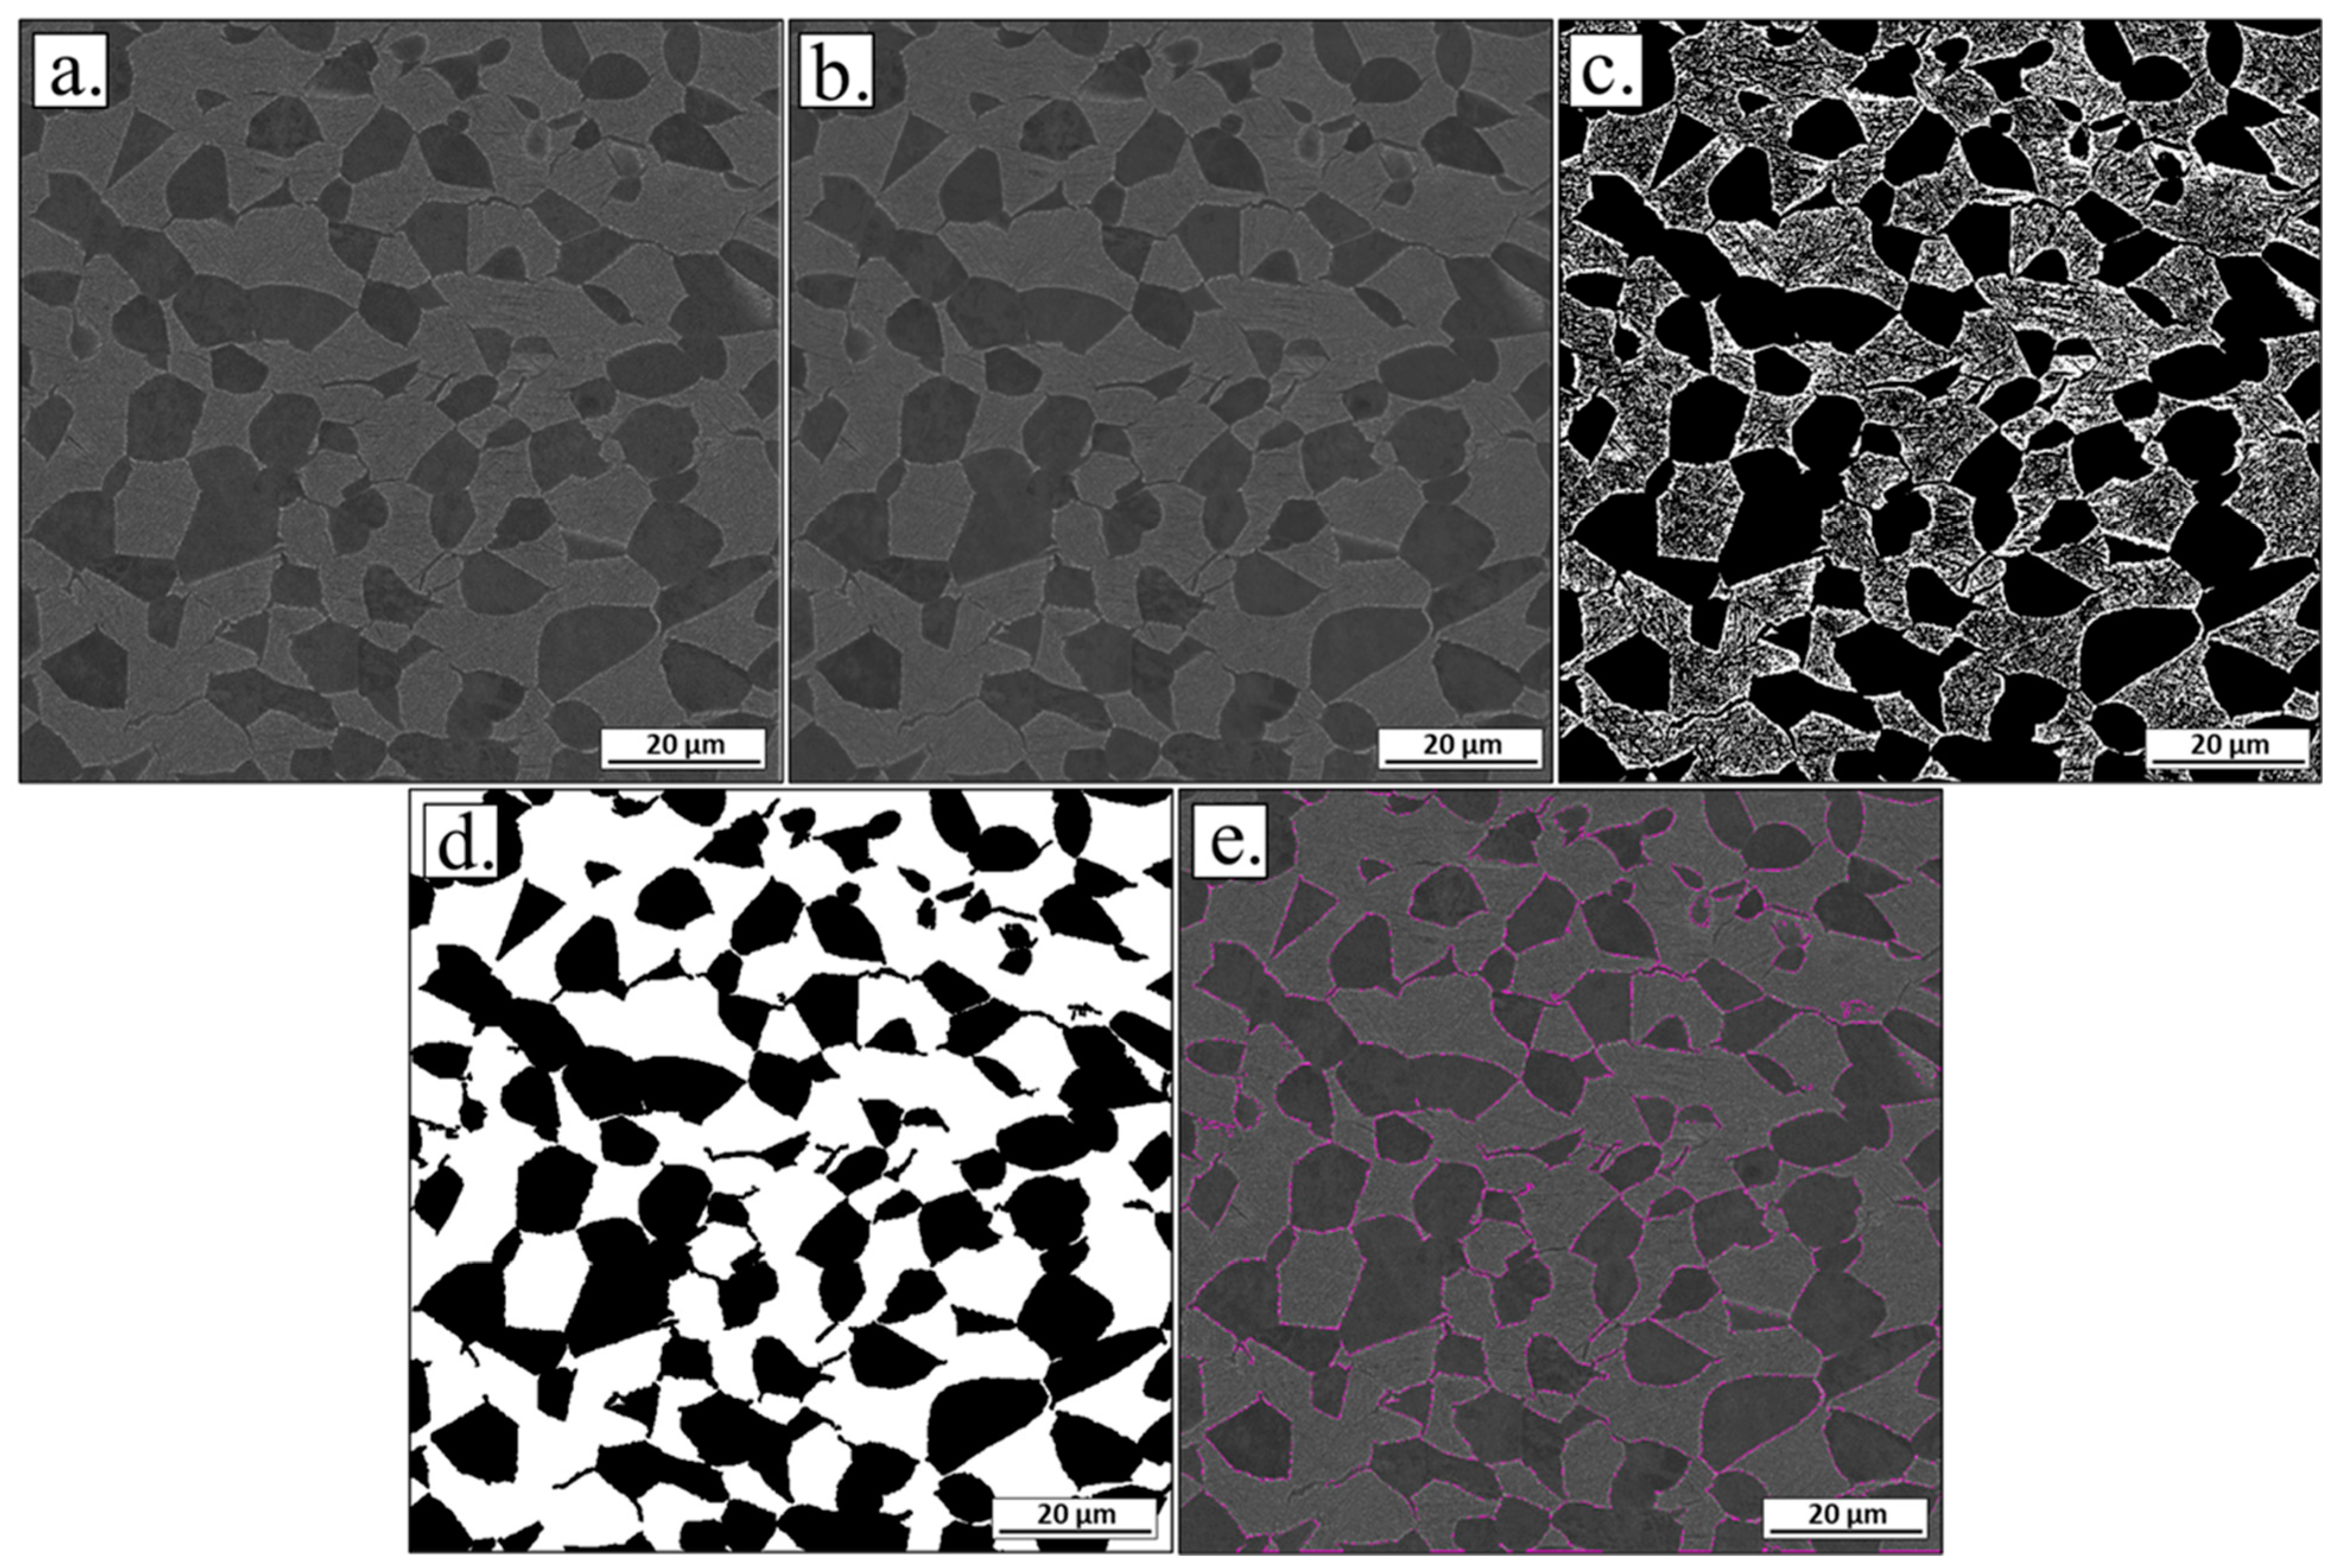
2.4. Microstructure Characterization and Quantification
2.5. Prediction of Effective Property
3. Results and Discussion
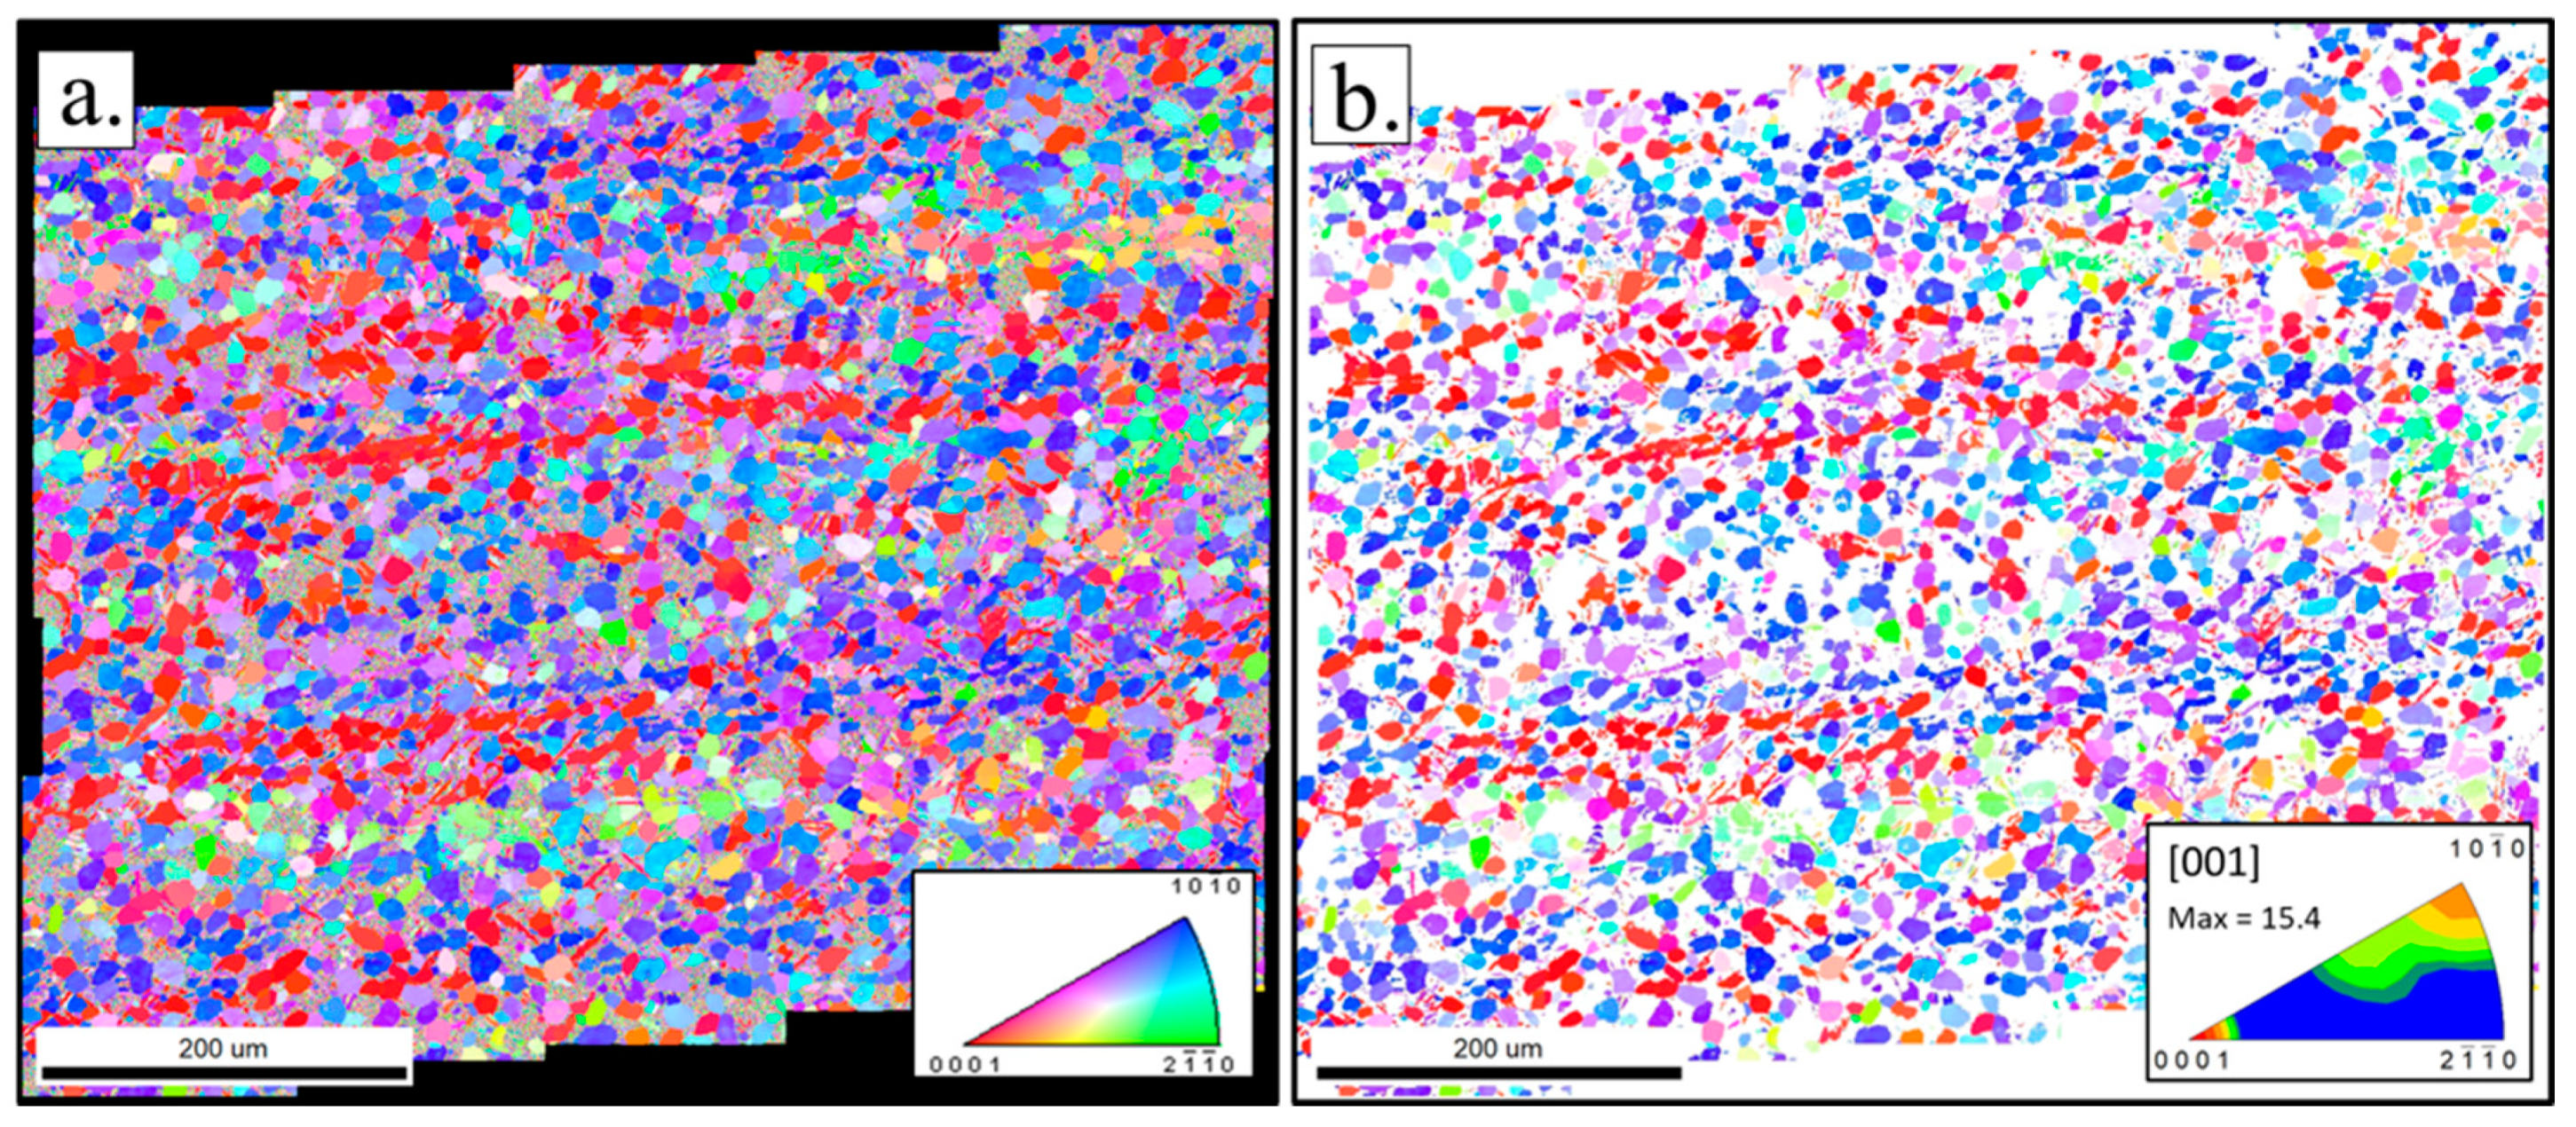
3.1. Microstructure Statistics
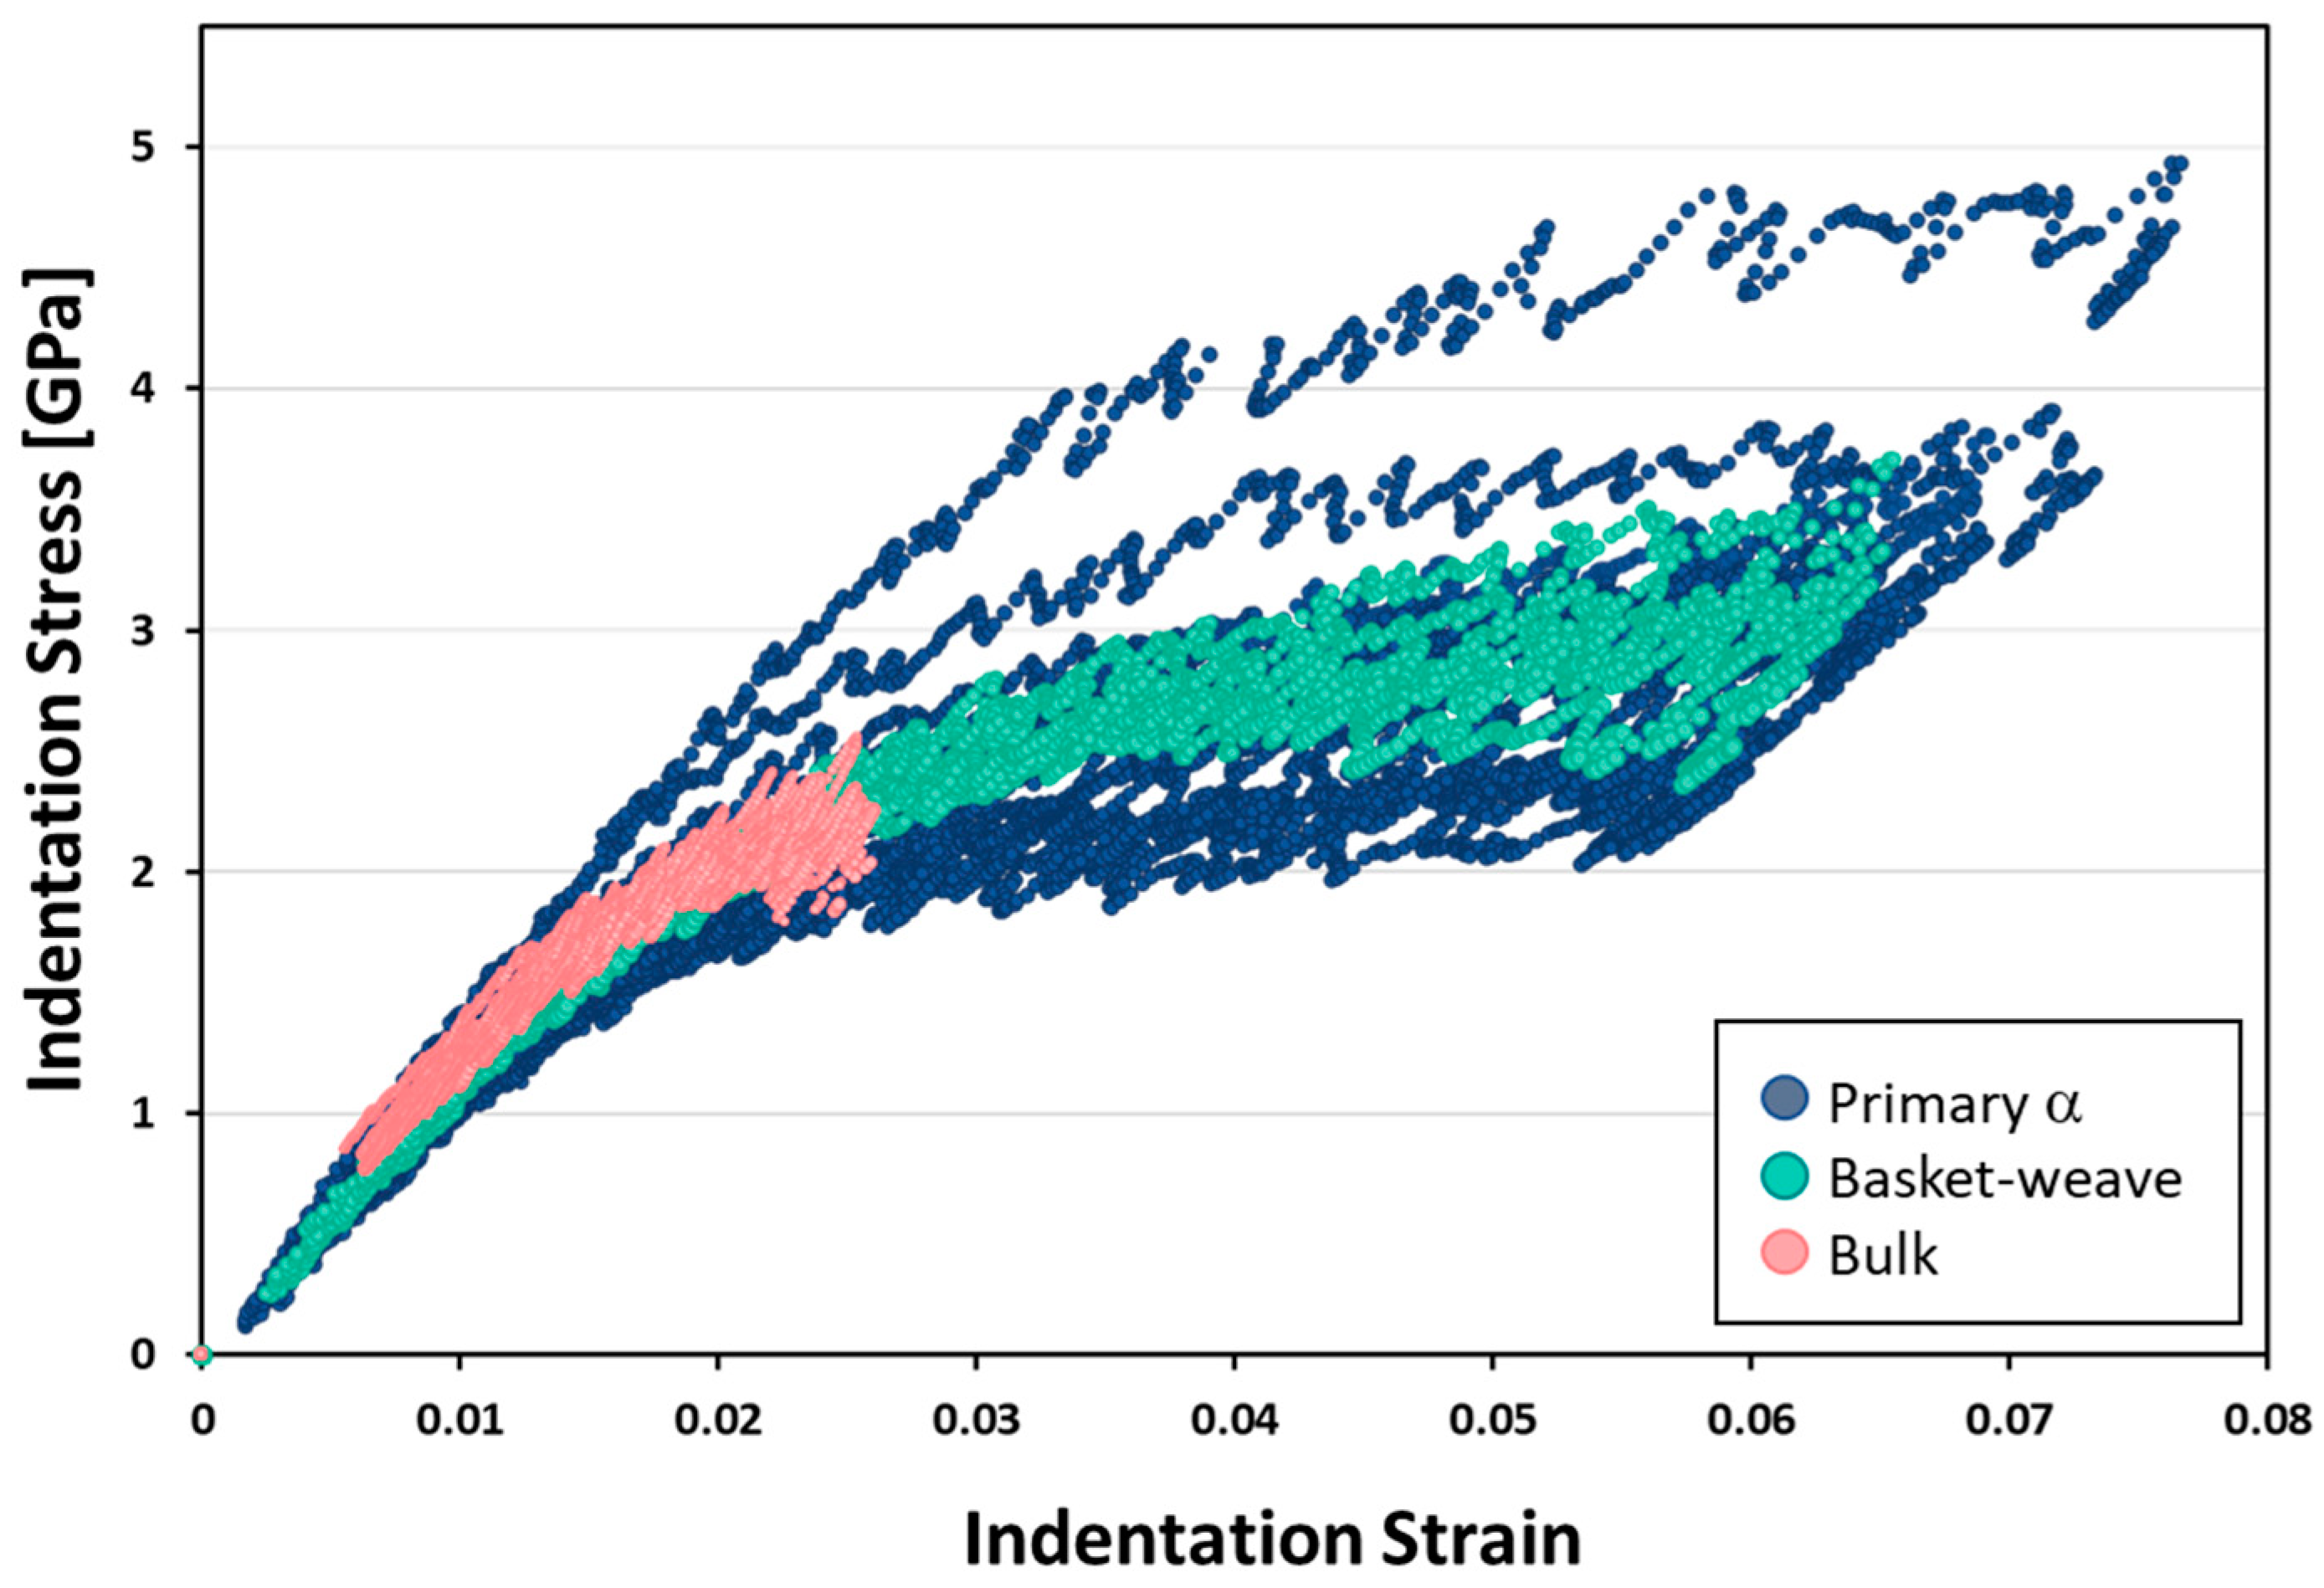
3.2. Spherical Nanoindentation Stress-Strain Measurements
3.3. Evaluation of the Composite Model
4. Conclusions
Author Contributions
Funding
Conflicts of Interest
References
- Lütjering, G. Influence of processing on microstructure and mechanical properties of (α + β) titanium alloys. Mater. Sci. Eng. A 1998, 243, 32–45. [Google Scholar] [CrossRef]
- Murayama, Y.; Hanada, S. High temperature strength, fracture toughness and oxidation resistance of Nb–Si–Al–Ti multiphase alloys. Sci. Technol. Adv. Mater. 2002, 3, 145–156. [Google Scholar] [CrossRef] [Green Version]
- Polmear, I.; StJohn, D.; Nie, J.F.; Qian, M. Light Alloys: Metallurgy of the Light Metals, 5th ed.; Elsevier Science: Amsterdam, The Netherlands; Butterworth-Heinemann: Oxford, UK, 2017. [Google Scholar]
- Banerjee, S.; Mukhopadhyay, P. Phase Transformations: Examples from Titanium and Zirconium Alloys; Elsevier: Amsterdam, The Netherlands, 2010. [Google Scholar]
- Millan-Espitia, N.; Mohan, S.; Pilchak, A.L.; Kalidindi, S.R. Mechanical Responses of Primary-α Ti Grains in Polycrystalline Samples: Part I—Measurements of Spherical Indentation Stress–Strain Curves. Integr. Mater. Manuf. Innov. 2021, 10, 82–98. [Google Scholar] [CrossRef]
- Britton, T.B.; Dunne, F.P.E.; Wilkinson, A.J. On the mechanistic basis of deformation at the microscale in hexagonal close-packed metals. Proc. R. Soc. A Math. Phys. Eng. Sci. 2015, 471, 20140881. [Google Scholar] [CrossRef] [Green Version]
- Weaver, J.S.; Priddy, M.W.; McDowell, D.L.; Kalidindi, S.R. On capturing the grain-scale elastic and plastic anisotropy of alpha-Ti with spherical nanoindentation and electron back-scattered diffraction. Acta Mater. 2016, 117, 23–34. [Google Scholar] [CrossRef] [Green Version]
- Perilla, J.M.; Gil Sevillano, J. Two-dimensional sections of the yield locus of a Ti-6%Al-4%V alloy with a strong transverse-type crystallographic a-texture. Mater. Sci. Eng. 1995, A201, 103–110. [Google Scholar] [CrossRef]
- Fundenberger, J.J.; Philippe, M.J.; Wagner, F.; Esling, C. Modeling and prediction of mechanical properties for materials with hexagonal symmetry (zinc, titanium and zirconium alloys). Acta Mater. 1997, 45, 4041–4055. [Google Scholar] [CrossRef]
- Churchman, A.T. Preparation of single crystals of titanium and their mode of deformation. Nature 1953, 171, 706. [Google Scholar] [CrossRef]
- Nemat-Nasser, S.; Hori, M. Micromechanics: Overall Properties of Heterogeneous Materials; Elsevier: Amsterdam, The Netherlands, 2013. [Google Scholar]
- González, C.; Vilatela, J.; Molina-Aldareguía, J.; Lopes, C.; Llorca, J. Structural composites for multifunctional applications: Current challenges and future trends. Prog. Mater. Sci. 2017, 89, 194–251. [Google Scholar] [CrossRef] [Green Version]
- Jinoch, J.; Ankem, S.; Margolin, H. Calculations of stress-strain curve and stress and strain distributions for an α-β Ti-8Mn alloy. Mater. Sci. Eng. 1978, 34, 203–211. [Google Scholar] [CrossRef]
- Ankem, S.; Margolin, H. Finite element method (FEM) calculations of stress-strain behavior of alpha-beta Ti-Mn alloys: Part I. Stress-strain relations. Metall. Trans. A 1982, 13, 595–601. [Google Scholar] [CrossRef]
- Ogden, H.; Holden, F.; Jaffee, R. Effect of Alpha Sohites on the Heat-Treatment Response of Ti-Mn Alloys. JOM 1955, 7, 105–112. [Google Scholar] [CrossRef]
- Holden, F.; Ogden, H.; Jaffee, R. Heat treatment and mechanical properties of Ti-Mo alloys. JOM 1956, 8, 1388–1393. [Google Scholar] [CrossRef]
- Hayden, H.; Floreen, S. The influence of martensite and ferrite on the properties of two-phase stainless steels having microduplex structures. Metall. Trans. 1970, 1, 1955–1959. [Google Scholar] [CrossRef]
- Yegneswaran, A.; Tangri, K. Investigation of the early stages of deformation of two phase copper-aluminum alloys. Metall. Trans. A 1983, 14, 2407–2413. [Google Scholar] [CrossRef]
- Yegneswaran, A.; Tangri, K. Deformation behaviour of two phase materials: Cu-Al system. Met. Sci. 1984, 18, 161–168. [Google Scholar] [CrossRef]
- Davies, R. The deformation behavior of a vanadium-strengthened dual phase steel. Metall. Trans. A 1978, 9, 41–52. [Google Scholar] [CrossRef]
- Davies, R. The mechanical properties of zero-carbon ferrite-plus-martensite structures. Metall. Trans. A 1978, 9, 451–455. [Google Scholar] [CrossRef]
- Davies, R. Influence of martensite composition and content on the properties of dual phase steels. Metall. Trans. A 1978, 9, 671–679. [Google Scholar] [CrossRef]
- Tseng, D.; Tangri, K. Deformation behavior of duplex Zircaloy-4-oxygen alloys. Metall. Trans. A 1982, 13, 1077–1082. [Google Scholar] [CrossRef]
- Yu, Q.; Shan, Z.-W.; Li, J.; Huang, X.; Xiao, L.; Sun, J.; Ma, E. Strong crystal size effect on deformation twinning. Nature 2010, 463, 335–338. [Google Scholar] [CrossRef] [PubMed]
- Xiao, L.I.N.; Yu, Q.; Sun, Q.; Sun, J.U.N. Size effect on deformation mode in micron-sized Ti-5Al single crystal loaded along [20] and [0001]. Int. J. Mod. Phys. 2012, 24, 2466–2471. [Google Scholar] [CrossRef]
- Jun, T.-S.; Sernicola, G.; Dunne, F.P.; Britton, T.B. Local deformation mechanisms of two-phase Ti alloy. Mater. Sci. Eng. A 2016, 649, 39–47. [Google Scholar] [CrossRef] [Green Version]
- Zhang, Z.; Jun, T.-S.; Britton, B.; Dunne, F.P. Intrinsic anisotropy of strain rate sensitivity in single crystal alpha titanium. Acta Mater. 2016, 118, 317–330. [Google Scholar] [CrossRef] [Green Version]
- Ghassemi-Armaki, H.; Maaß, R.; Bhat, S.; Sriram, S.; Greer, J.; Kumar, K. Deformation response of ferrite and martensite in a dual-phase steel. Acta Mater. 2014, 62, 197–211. [Google Scholar] [CrossRef]
- Gong, J.; Wilkinson, A.J. Micro-cantilever testing of ⟨a⟩ prismatic slip in commercially pure Ti. Philos. Mag. 2011, 91, 1137–1149. [Google Scholar] [CrossRef]
- Gong, J.; Wilkinson, A.J. Anisotropy in the plastic flow properties of single-crystal α titanium determined from micro-cantilever beams. Acta Mater. 2009, 57, 5693–5705. [Google Scholar] [CrossRef]
- Kumar, K.; Madhusoodanan, K.; Rupani, B. Miniature Specimen Technique as an NDT Tool for Estimation of Service Life of Operating Presurre Equipment. In Proceedings of the International Conference & Exhibition on Pressure Vessel and Piping, Chennai, India, 7–9 February 2006. [Google Scholar]
- Mante, F.K.; Baran, G.R.; Lucas, B. Nanoindentation studies of titanium single crystals. Biomaterials 1999, 20, 1051–1055. [Google Scholar] [CrossRef]
- Merson, E.; Brydson, R.; Brown, A. The effect of crystallographic orientation on the mechanical properties of titanium. J. Phys. Conf. Ser. 2008, 126, 012020. [Google Scholar] [CrossRef]
- Liu, Y.; Ngan, A. Depth dependence of hardness in copper single crystals measured by nanoindentation. Scr. Mater. 2001, 44, 237–241. [Google Scholar] [CrossRef]
- McElhaney, K.; Vlassak, J.J.; Nix, W.D. Determination of indenter tip geometry and indentation contact area for depth-sensing indentation experiments. J. Mater. Res. 1998, 13, 1300–1306. [Google Scholar] [CrossRef]
- Kiener, D.; Motz, C.; Rester, M.; Jenko, M.; Dehm, G. FIB Damage of Cu and possible consequences for miniaturized mechanical tests. Mater. Sci. Eng. A 2007, 459, 262–272. [Google Scholar] [CrossRef]
- Mohan, S.; Millan-Espitia, N.; Yao, M.; Steenberge, N.V.; Kalidindi, S.R. Critical Evaluation of Spherical Indentation Stress-Strain Protocols for the Estimation of the Yield Strengths of Steels. Exp. Mech. 2021, 61, 641–652. [Google Scholar] [CrossRef]
- Rodrıguez, R.; Gutierrez, I. Correlation between nanoindentation and tensile properties: Influence of the indentation size effect. Mater. Sci. Eng. A 2003, 361, 377–384. [Google Scholar] [CrossRef]
- Zhang, P.; Li, S.; Zhang, Z. General relationship between strength and hardness. Mater. Sci. Eng. A 2011, 529, 62–73. [Google Scholar] [CrossRef]
- O’Neill, H. Hardness Measurement of Metals and Alloys; Chapman & Hall: London, UK, 1967. [Google Scholar]
- Cahoon, J.; Broughton, W.; Kutzak, A. The determination of yield strength from hardness measurements. Metall. Trans. 1971, 2, 1979–1983. [Google Scholar] [CrossRef]
- E8/E8M−15a; Standard Test Methods for Tension Testing of Metallic Materials. ASTM International: West Conshohocken, PA, USA, 2015.
- ASTM International. Standard Test Methods of Compression Testing of Metallic Materials at Room Temperature. In 1990 Annual Book of ASTM Standards; ASTM International: West Conshohocken, PA, USA, 2000; p. 8. [Google Scholar]
- Pharr, G.M.; Herbert, E.G.; Gao, Y. The indentation size effect: A critical examination of experimental observations and mechanistic interpretations. Annu. Rev. Mater. Res. 2010, 40, 271–292. [Google Scholar] [CrossRef]
- Qian, L.; Li, M.; Zhou, Z.; Yang, H.; Shi, X. Comparison of nano-indentation hardness to microhardness. Surf. Coat. Technol. 2005, 195, 264–271. [Google Scholar] [CrossRef]
- Swadener, J.; George, E.; Pharr, G. The correlation of the indentation size effect measured with indenters of various shapes. J. Mech. Phys. Solids 2002, 50, 681–694. [Google Scholar] [CrossRef]
- Johnson, K. The correlation of indentation experiments. J. Mech. Phys. Solids 1970, 18, 115–126. [Google Scholar] [CrossRef]
- Gupta, A.; Khatirkar, R.K.; Kumar, A.; Parihar, M.S. Investigations on the effect of heating temperature and cooling rate on evolution of microstructure in an α + β titanium alloy. J. Mater. Res. 2018, 33, 946–957. [Google Scholar] [CrossRef]
- Sieniawski, J.; Ziaja, W.; Kubiak, K.; Motyk, M. Microstructure and Mechanical Properties of High Strength Two-Phase Titanium Alloys. In Titanium Alloys—Advances in Properties Control; Sieniawski, J., Ed.; InTech: London, UK, 2013. [Google Scholar]
- Jun, T.-S.; Armstrong, D.E.J.; Britton, T.B. A nanoindentation investigation of local strain rate sensitivity in dual-phase Ti alloys. J. Alloys Compd. 2016, 672, 282–291. [Google Scholar] [CrossRef] [Green Version]
- Zhang, Z.; Jun, T.-S.; Britton, B.; Dunne, F.P. Determination of Ti-6242 α and β slip properties using micro-pillar test and computational crystal plasticity. J. Mech. Phys. Solids 2016, 95, 393–410. [Google Scholar] [CrossRef] [Green Version]
- Pathak, S.; Kalidindi, S.R. Spherical nanoindentation stress–strain curves. Mater. Sci. Eng. R Rep. 2015, 91, 1–36. [Google Scholar] [CrossRef] [Green Version]
- Kalidindi, S.R.; Pathak, S. Determination of the effective zero-point and the extraction of spherical nanoindentation stress–strain curves. Acta Mater. 2008, 56, 3523–3532. [Google Scholar] [CrossRef]
- Pathak, S.; Shaffer, J.; Kalidindi, S. Determination of an effective zero-point and extraction of indentation stress–strain curves without the continuous stiffness measurement signal. Scr. Mater. 2009, 60, 439–442. [Google Scholar] [CrossRef]
- Hertz, H.; Jones, D.E.; Schott, G.A. Miscellaneous Papers; Macmillan and Company: London, UK, 1896. [Google Scholar]
- Weaver, J.S.; Kalidindi, S.R. Mechanical characterization of Ti-6Al-4V titanium alloy at multiple length scales using spherical indentation stress-strain measurements. Mater. Des. 2016, 111, 463–472. [Google Scholar] [CrossRef] [Green Version]
- Kalidindi, S.R.; Vachhani, S.J. Mechanical characterization of grain boundaries using nanoindentation. Curr. Opin. Solid State Mater. Sci. 2014, 18, 196–204. [Google Scholar] [CrossRef]
- Pathak, S.; Michler, J.; Wasmer, K.; Kalidindi, S.R. Studying grain boundary regions in polycrystalline materials using spherical nano-indentation and orientation imaging microscopy. J. Mater. Sci. 2011, 47, 815–823. [Google Scholar] [CrossRef]
- Vachhani, S.J.; Kalidindi, S.R. Grain-scale measurement of slip resistances in aluminum polycrystals using spherical nanoindentation. Acta Mater. 2015, 90, 27–36. [Google Scholar] [CrossRef] [Green Version]
- Pathak, S.; Kalidindi, S.R.; Mara, N.A. Investigations of orientation and length scale effects on micromechanical responses in polycrystalline zirconium using spherical nanoindentation. Scr. Mater. 2016, 113, 241–245. [Google Scholar] [CrossRef] [Green Version]
- Khosravani, A.; Morsdorf, L.; Tasan, C.C.; Kalidindi, S.R. Multiresolution mechanical characterization of hierarchical materials: Spherical nanoindentation on martensitic Fe-Ni-C steels. Acta Mater. 2018, 153, 257–269. [Google Scholar] [CrossRef]
- Khosravani, A.; Caliendo, C.M.; Kalidindi, S.R. New insights into the microstructural changes during the processing of dual-phase steels from multiresolution spherical indentation stress–strain protocols. Metals 2019, 10, 18. [Google Scholar] [CrossRef] [Green Version]
- Weaver, J.S.; Khosravani, A.; Castillo, A.; Kalidindi, S.R. High throughput exploration of process-property linkages in Al-6061 using instrumented spherical microindentation and microstructurally graded samples. Integr. Mater. Manuf. Innov. 2016, 5, 192–211. [Google Scholar] [CrossRef] [Green Version]
- Khosravani, A.; Cecen, A.; Kalidindi, S.R. Development of high throughput assays for establishing process-structure-property linkages in multiphase polycrystalline metals: Application to dual-phase steels. Acta Mater. 2017, 123, 55–69. [Google Scholar] [CrossRef] [Green Version]
- Iskakov, A.; Yabansu, Y.C.; Rajagopalan, S.; Kapustina, A.; Kalidindi, S.R. Application of spherical indentation and the materials knowledge system framework to establishing microstructure-yield strength linkages from carbon steel scoops excised from high-temperature exposed components. Acta Mater. 2018, 144, 758–767. [Google Scholar] [CrossRef]
- Bhat, A.; Neu, R. On the Constraint Factor Relating Uniaxial and Indentation Yield Strength of Polycrystalline Materials Using Spherical Microindentation. Mater. Perform. Charact. 2020, 9, 324–345. [Google Scholar] [CrossRef]
- Pilchak, A.; Porter, W.; John, R. Room temperature fracture processes of a near-α titanium alloy following elevated temperature exposure. J. Mater. Sci. 2012, 47, 7235–7253. [Google Scholar] [CrossRef]
- Pathak, S.; Stojakovic, D.; Doherty, R.; Kalidindi, S. Importance of surface preparation on the nano-indentation stress-strain curves measured in metals. Mater. Res. Soc. 2009, 24, 1142–1155. [Google Scholar] [CrossRef]
- Li, X.; Bhushan, B. A review of nanoindentation continuous stiffness measurement technique and its applications. Mater. Charact. 2001, 48, 11–36. [Google Scholar] [CrossRef]
- Vachhani, S.J.; Doherty, R.D.; Kalidindi, S.R. Effect of the continuous stiffness measurement on the mechanical properties extracted using spherical nanoindentation. Acta Mater. 2013, 61, 3744–3751. [Google Scholar] [CrossRef]
- Collins, P.C.; Welk, B.; Searles, T.; Tiley, J.; Russ, J.C.; Fraser, H.L. Development of methods for the quantification of microstructural features in α+β-processed α/β titanium alloys. Mater. Sci. Eng. A 2009, 508, 174–182. [Google Scholar] [CrossRef]
- Paredes-Orta, C.A.; Mendiola-Santibañez, J.D.; Manriquez-Guerrero, F.; Terol-Villalobos, I.R. Method for grain size determination in carbon steels based on the ultimate opening. Measurement 2019, 133, 193–207. [Google Scholar] [CrossRef]
- Smith, T.; Bonacuse, P.; Sosa, J.; Kulis, M.; Evans, L. A quantifiable and automated volume fraction characterization technique for secondary and tertiary γ′ precipitates in Ni-based superalloys. Mater. Charact. 2018, 140, 86–94. [Google Scholar] [CrossRef]
- Payton, E.J.; Phillips, P.J.; Mills, M.J. Semi-automated characterization of the γ′ phase in Ni-based superalloys via high-resolution backscatter imaging. Mater. Sci. Eng. A 2010, 527, 2684–2692. [Google Scholar] [CrossRef]
- Iskakov, A.; Kalidindi, S.R. A Framework for the Systematic Design of Segmentation Workflows. Integr. Mater. Manuf. Innov. 2020, 9, 70–88. [Google Scholar] [CrossRef]
- Higham, D.J.; Higham, N.J. MATLAB Guide; SIAM: Philadelphia, PA, USA, 2016; Volume 150. [Google Scholar]
- Serra, J. Image Analysis and Mathematical Morphology; Academic Press: New York, NY, USA, 1982. [Google Scholar]
- Diaz, A.; Patel, D.; Simmons, J.; Parthasarathy, T.A.; Kalidindi, S.R. Quantitative Assessment of Segmentation Workflows for 3D Serial Sectioned Microscopy Data Set. 2022; In preparation. [Google Scholar]
- Lecomte, J. Texture Analysis in Materials Science; Bunge, H.-J., Ed.; Elsevier: Amsterdam, The Netherlands, 2015. [Google Scholar]
- Patel, D.K.; Kalidindi, S.R. Correlation of spherical nanoindentation stress-strain curves to simple compression stress-strain curves for elastic-plastic isotropic materials using finite element models. Acta Mater. 2016, 112, 295–302. [Google Scholar] [CrossRef] [Green Version]
- Bertrand, M.A.X.; Alexis, J.; Larignon, C.; Perusin, S. Titanium alloy Ti-6242 for high temperature structural application. Static and dynamic mechanical properties and impact of ageing. In Proceedings of the MATEC Web of Conferences, 23 March 2020; EDP Sciences: Paris, France, 2020; Volume 321, p. 11089. [Google Scholar]


| Bimodal Microstructure Statistics | ||
|---|---|---|
| Local State | Fraction in α-Phase | Fraction in Bulk (f) |
| α=0°–10° | 16% | 6.8% |
| α = 10°–20° | 6.1% | 2.6% |
| α = 20°–30° | 1.6% | 0.7% |
| α = 30°–40° | 2.0% | 0.8% |
| α = 40°–50° | 3.0% | 1.3% |
| α = 50°–60° | 9.7% | 4.1% |
| α = 60°–70° | 17.7% | 7.5% |
| α = 70°–80° | 14.7% | 6.2% |
| α = 80°–90° | 29.1% | 12.3% |
| Basket-weave | 0% | 57.7% |
| Spherical Indentation Measurements | |||
|---|---|---|---|
| Length Scale | Morphology | Eind [GPa] | Yind [GPa] |
| Constituents | Basket-Weave | 121 ± 3.1 | 1.99 ± 0.12 |
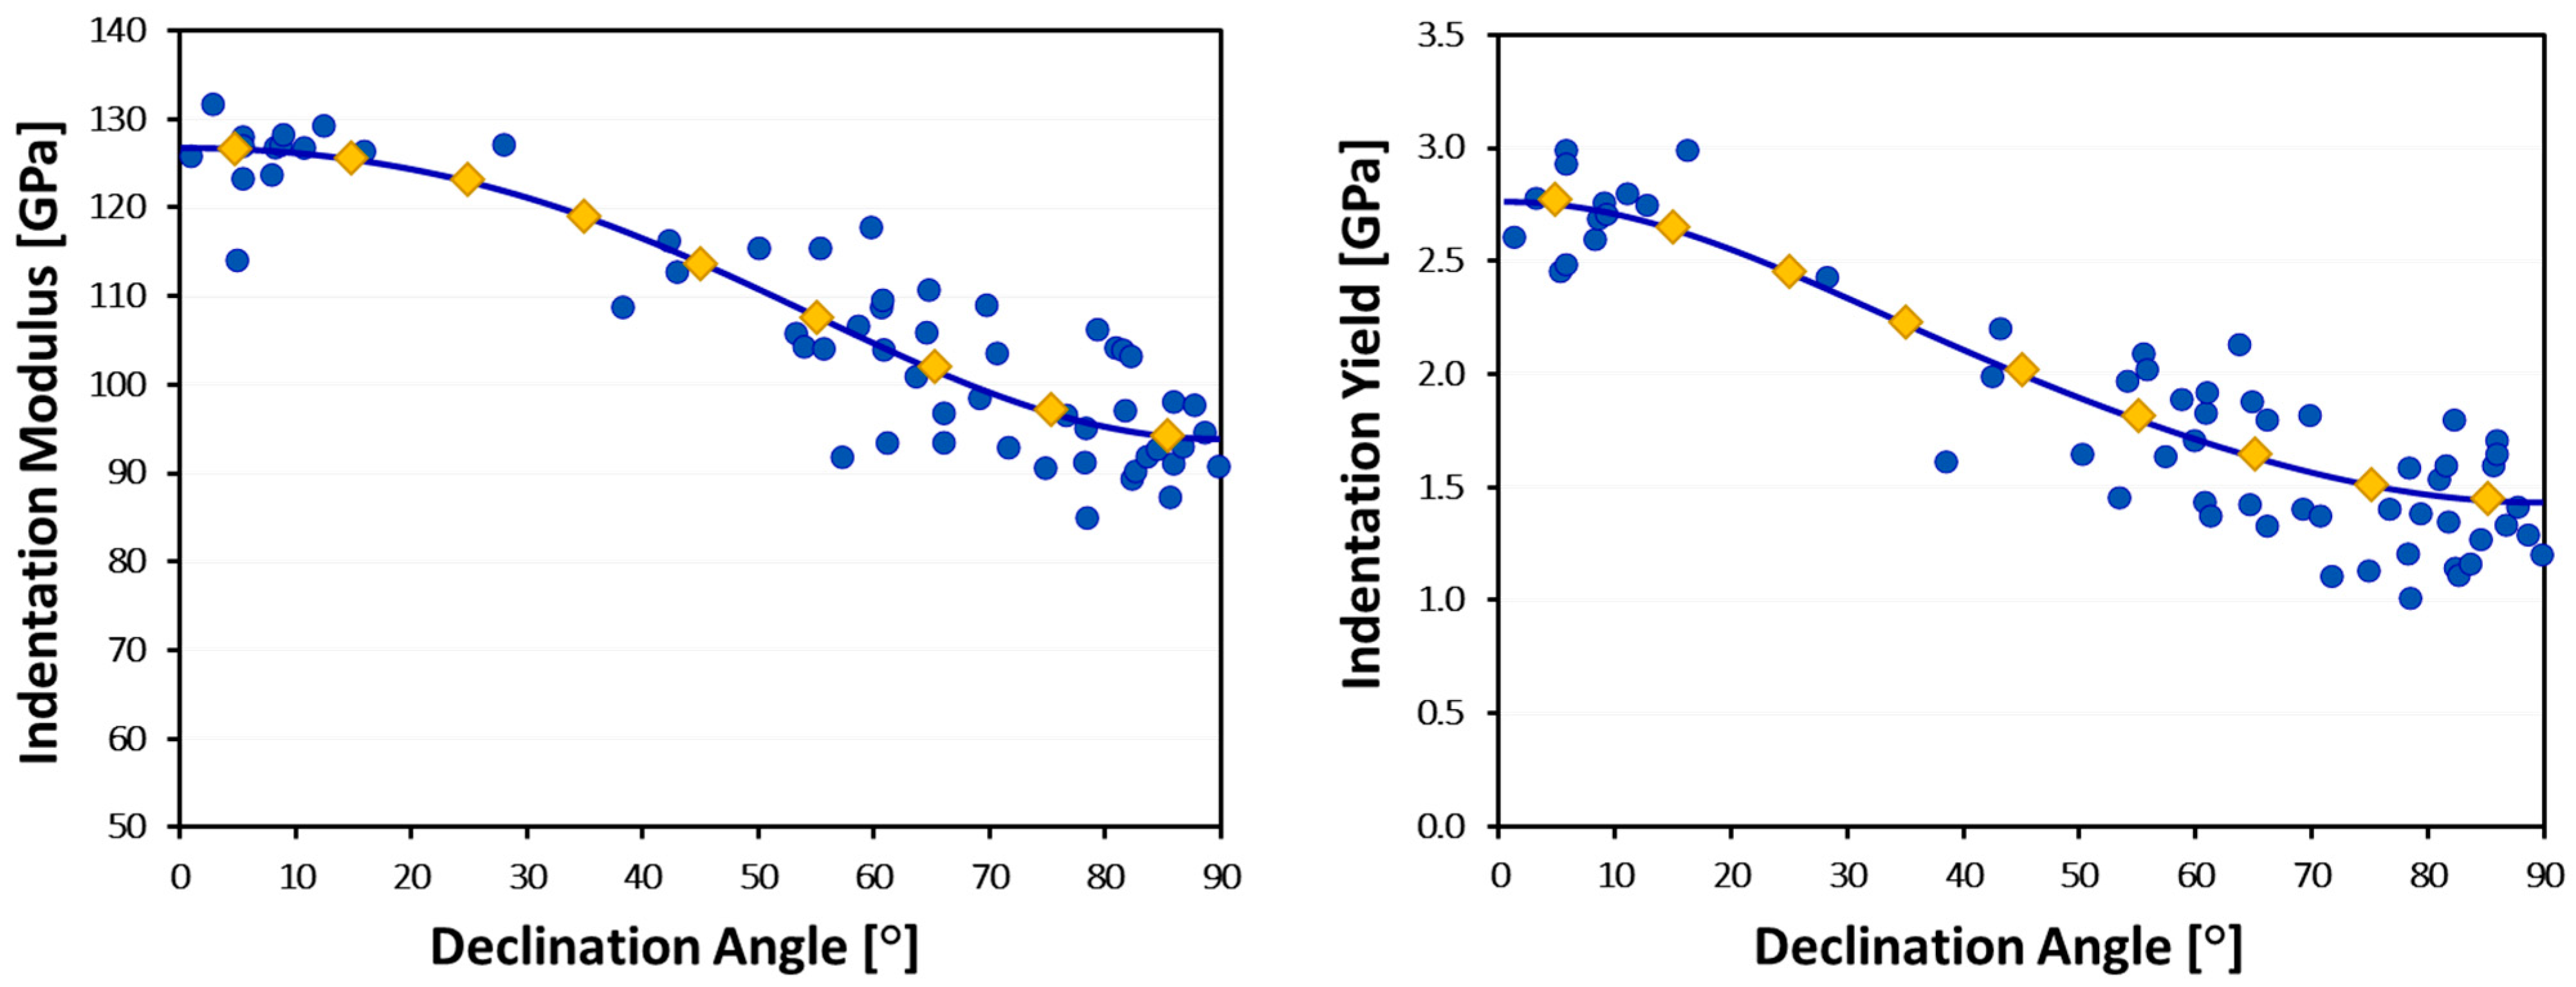
| Φα = 0°–10° | 125.2 | 2.73 | |
| Φα = 10°–20° | 124.1 | 2.65 | |
| Φα = 20°–30° | 121.7 | 2.47 | |
| Φα = 30°–40° | 118.4 | 2.25 | |
| Φα = 40°–50° | 111.9 | 2.03 | |
| Φα = 50°–60° | 106.6 | 1.79 | |
| Φα = 60°–70° | 100.9 | 1.60 | |
| Φα = 70°–80° | 96.3 | 1.44 | |
| Φα = 80°–90° | 93.7 | 1.37 | |
| Bulk | Bimodal | 118 ± 2.6 | 1.96 ± 0.10 |
| ROM Predictions | |||
| Bulk | Bimodal | 114 | 1.92 |
Publisher’s Note: MDPI stays neutral with regard to jurisdictional claims in published maps and institutional affiliations. |
© 2022 by the authors. Licensee MDPI, Basel, Switzerland. This article is an open access article distributed under the terms and conditions of the Creative Commons Attribution (CC BY) license (https://creativecommons.org/licenses/by/4.0/).
Share and Cite
Millan-Espitia, N.; Kalidindi, S.R. Study of a Bimodal α–β Ti Alloy Microstructure Using Multi-Resolution Spherical Indentation Stress-Strain Protocols. J. Compos. Sci. 2022, 6, 162. https://doi.org/10.3390/jcs6060162
Millan-Espitia N, Kalidindi SR. Study of a Bimodal α–β Ti Alloy Microstructure Using Multi-Resolution Spherical Indentation Stress-Strain Protocols. Journal of Composites Science. 2022; 6(6):162. https://doi.org/10.3390/jcs6060162
Chicago/Turabian StyleMillan-Espitia, Natalia, and Surya R. Kalidindi. 2022. "Study of a Bimodal α–β Ti Alloy Microstructure Using Multi-Resolution Spherical Indentation Stress-Strain Protocols" Journal of Composites Science 6, no. 6: 162. https://doi.org/10.3390/jcs6060162
APA StyleMillan-Espitia, N., & Kalidindi, S. R. (2022). Study of a Bimodal α–β Ti Alloy Microstructure Using Multi-Resolution Spherical Indentation Stress-Strain Protocols. Journal of Composites Science, 6(6), 162. https://doi.org/10.3390/jcs6060162